Mental well-being Report EN v3 - European...
93
Special Eurobarometer Mental Well-being Fieldwork: December 2005 – January 2006 Publication: May 2006 Special Eurobarometer 248 / Wave 64.4 – TNS Opinion & Social This survey was requested by Directorate General SANCO and coordinated by Directorate General Communication This document does not represent the point of view of the European Commission. The interpretations and opinions contained in it are solely those of the authors. European Commission
Transcript of Mental well-being Report EN v3 - European...

Special Eurobarometer
Mental Well-being
Fieldwork: December 2005 – January 2006
Publication: May 2006
Spe
cial
Eur
obar
omet
er 2
48 /
Wav
e 64
.4 –
TN
S O
pini
on &
Soc
ial
This survey was requested by Directorate General SANCO and coordinated by Directorate General Communication
This document does not represent the point of view of the European Commission. The interpretations and opinions contained in it are solely those of the authors.
European Commission

Special EUROBAROMETER 248 “MENTAL WELL-BEING”
- 1 -
PRESENTATION ............................................................................................... 2
1 THE PRESENT SITUATION.......................................................................... 4
1.1 Effects of the State of Health .........................................................4
1.2 Mental Well-being over the Last 4 Weeks ......................................8
2 PROBLEMS WITH WORK AND SOCIAL ACTIVITIES .................................. 13
2.1 The Effects of Physical Health ......................................................13
2.1.1 Level of Accomplishment ...........................................................13 2.1.2 The Effect of Pain......................................................................17
2.2 The Effects of Emotional Problems...............................................19
2.2.1 Level of Accomplishment ...........................................................19 2.2.2 Effects on Working Life or other Regular Activities .........................24
2.3 Problems with Social Activities ....................................................27
3 CARE AND TREATMENT SERVICES............................................................ 30
3.1 Source of Professional Help .........................................................30
3.2 Recipients of Treatment ...............................................................34
3.3 Sources of Support.......................................................................37
4 AVAILABILITY OF INFORMATION............................................................ 40
5 PERCEPTIONS ABOUT PEOPLE WITH PSYCHOLOGICAL AND EMOTIONAL HEALTH PROBLEMS ................................................................... 44
CONCLUSION................................................................................................. 48

Special EUROBAROMETER 248 “MENTAL WELL-BEING”
- 2 -
PRESENTATION Everybody encounters varying degrees of pressure, stress, disappointment and times of bereavement in their life. Most find ways to cope with these problems but a significant proportion of people need help to re-balance their lives. Every year over one in four European adults1 are affected by mental health problems. Annually, mental illnesses lead to 58 000 suicides in Europe. The estimated number of Europeans that have suffered from major depression is 18.4 millions and from specific phobias 18.5 million within the past 12 months2. Today, mental health problems constitute one of the major public health challenges. For years, the magnitude of problem has been overshadowed by other public health matters. The effects of mental ill health are manifold: a loss of quality of life, social exclusion and stigmatisation of those who have psychological or emotional problems, and significant losses and burdens to the economic, social, educational as well as criminal and justice systems. As a response to the framework for comprehensive action established by the WHO European Ministerial Conference on Mental Health in January 2005, , the European Commission adopted a Green Paper on Mental Health3 on the 17th of October 2005 to examine how to better tackle mental illness and promote mental well-being. The main aim is to open up a framework for exchange, coordination and cooperation and to develop a comprehensive EU strategy on mental health. With this in mind the Directorate-General of Health and Consumer Protection launched this Eurobarometer survey on Mental Well-being in the 25 Member States (including the Turkish Cypriot Community) as well as in the acceding and candidate countries. The questionnaire of this survey is based, among other instruments, on the Short-Form-12 Health Survey, the SF-36 Health Survey4. The SF-12 is designed for health care professionals to efficiently and reliably collect data. It measures general health status from the patient’s point of view and includes eight concepts commonly represented in health surveys: physical functioning, role functioning, physical bodily pain, general health, vitality, social functioning, role functioning emotional and mental health. The recall period of the SF-12 is 4 weeks which was adopted because the previous month is thought to capture a representative sample of recent health. The results are expressed in terms of two meta-scores: the Physical Component Summary and the Mental Component Summary. This report takes a somewhat different approach and examines issues raised by the Green Paper on Mental Health, such as the interconnection between physical and mental health, the effects of mental health on society and personal life, and the stigma posed on people having psychological or emotional 1 Hans-Ulrich Wittchen, Frank Jacobi (2005). Size and burden of mental disorders in Europe: a critical review and appraisal of 27 studies. European Neurospsychopharmacology, Volume 15, Number 4, pp. 357-376. 2 See the Green Paper on Mental Health, Annex 2 3http://europa.eu.int/comm/health/ph_determinants/life_style/mental/green_paper/mental_gp_en.pdf 4 See more in http://www.sf-36.org/

Special EUROBAROMETER 248 “MENTAL WELL-BEING”
- 3 -
problems. Following this, the questions dealing with general health and physical health are partly interpreted in the context of mental well-being. The chapters deal with the following themes:
• The present situation: how much health limits daily moderate physical activities and what is the state of mental well-being over the last 4 weeks;
• Problems with work and social activities: The effects of physical health and emotional problems on regular activities, such as work, and on social activities;
• Care and treatment services: How many Europeans are treated for mental illnesses, how often Europeans seek help for mental problems and where do they turn to get support;
• Availability of information: How many Europeans find acquiring information about mental health problems easy;
• Perceptions about people with psychological problems: how Europeans perceive people with a mental illness.
This report presents the principal results obtained. For each of these themes, the results are analysed in terms of the European average and then considered at the country by country level. Also, some brief comments are made on the socio-demographic variables of citizens of the European Union.5 Furthermore, the responses of three questions are systematically cross-tabulated with the results of each question. These questions are:
• QA7 In the last 12 months, did you seek help from a professional in respect of a psychological or emotional health problem?
• QA9 Please indicate which ones of the following statements possibly apply to your situation. In the last 12 months…
1) You have received psychotherapy due to psychological or emotional health problems
2) You have taken drugs due to psychological or emotional health problems
3) You have been admitted to hospital due to psychological or emotional health problems
• QA11 How easy or difficult do you find it is to find information on psychological or emotional health problems and how to deal with them?
The fieldwork of this survey was conducted between 7 December 2005 and 11 January 2006 and it covered the population aged 15 and over. Further details of the methodology of the survey can be found in the technical note in the annexes of this report.
5In some cases, due to the rounding of figures, displayed sums can show a difference of one point with the sum of the individual cells.
Special EUROBAROMETER 248 “MENTAL WELL-BEING”
- 4 -
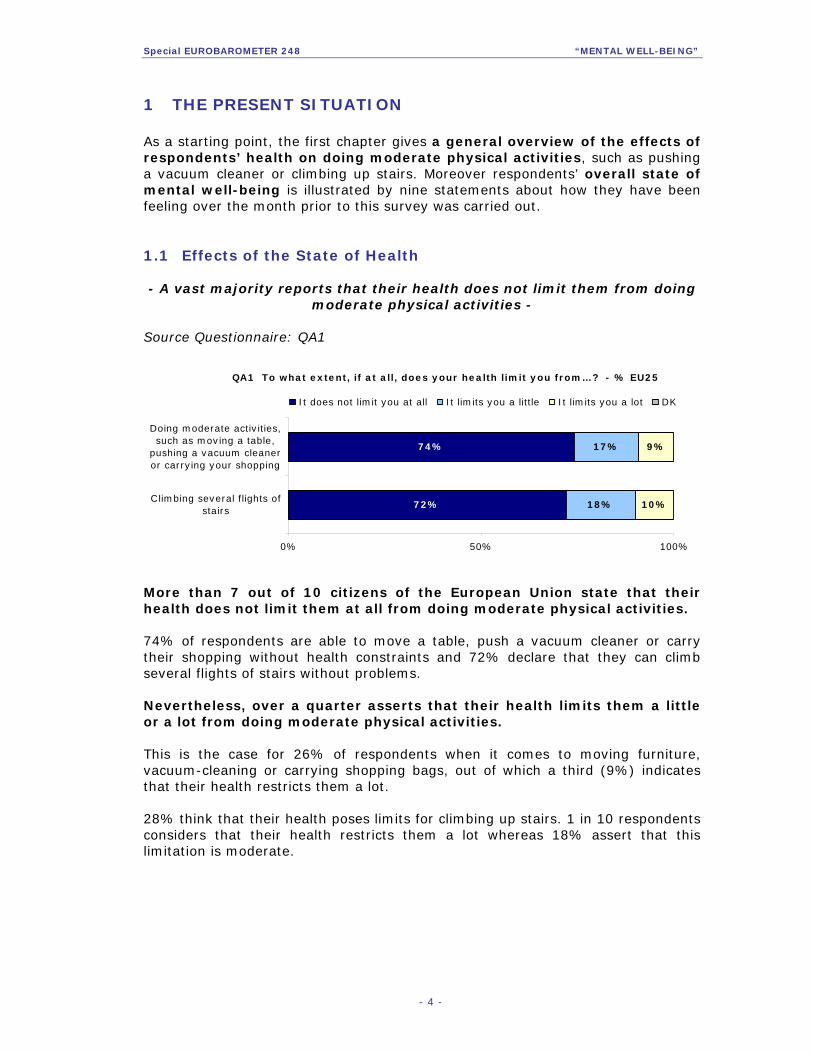
1 THE PRESENT SITUATION As a starting point, the first chapter gives a general overview of the effects of respondents’ health on doing moderate physical activities, such as pushing a vacuum cleaner or climbing up stairs. Moreover respondents’ overall state of mental well-being is illustrated by nine statements about how they have been feeling over the month prior to this survey was carried out. 1.1 Effects of the State of Health - A vast majority reports that their health does not limit them from doing
moderate physical activities -
Source Questionnaire: QA1
QA1 To what extent, if at all, does your health limit you from…? - % EU25
72%
74%
18%
17%
10%
9%
0% 50% 100%
Climbing several flights ofstairs
Doing moderate activities,such as moving a table,
pushing a vacuum cleaneror carrying your shopping
It does not limit you at all It limits you a little It limits you a lot DK
More than 7 out of 10 citizens of the European Union state that their health does not limit them at all from doing moderate physical activities. 74% of respondents are able to move a table, push a vacuum cleaner or carry their shopping without health constraints and 72% declare that they can climb several flights of stairs without problems. Nevertheless, over a quarter asserts that their health limits them a little or a lot from doing moderate physical activities. This is the case for 26% of respondents when it comes to moving furniture, vacuum-cleaning or carrying shopping bags, out of which a third (9%) indicates that their health restricts them a lot. 28% think that their health poses limits for climbing up stairs. 1 in 10 respondents considers that their health restricts them a lot whereas 18% assert that this limitation is moderate.

Special EUROBAROMETER 248 “MENTAL WELL-BEING”
- 5 -
QA1 To what extent, if at all, does your health limit you from doing moderate activities, such as moving a table, pushing a vacuum cleaner or
carrying your shopping ? - % country
73%
59%
65%
67%
68%
66%
66%
67%
68%
70%
70%
70%
70%
73%
73%
73%
74%
74%
75%
76%
76%
76%
77%
77%
79%
79%
79%
79%
80%
80%
18%
24%
21%
25%
19%
23%
24%
20%
19%
24%
21%
21%
21%
19%
19%
19%
14%
20%
15%
18%
15%
15%
15%
16%
13%
13%
15%
13%
14%
11%
9%
17%
13%
8%
13%
11%
10%
13%
13%
5%
10%
9%
9%
8%
8%
8%
11%
6%
9%
6%
9%
8%
8%
7%
8%
8%
6%
8%
4%
9%
0% 50% 100%
CY (tcc)
BG
HR
TR
RO
IT
LT
PL
HU
AT
PT
SI
SK
CZ
EE
LV
EL
MT
LU
DE
ES
CY
BE
NL
DK
FR
FI
SE
IE
UK
It does not limit you at all It limits you a little It limits you a lot DK
In every country polled, a vast majority does not experience health limits while doing moderate activities, such as moving a table, pushing a vacuum cleaner or carrying shopping bags. Within the EU, the share of those not suffering from health effects ranges from 80% in Ireland and the United Kingdom to 66% in Italy and Lithuania. In the acceding country Bulgaria, 59% of citizens announce that their health does not limit them from doing these activities. Consequently, 41% of Bulgarians and 34% of citizens in Lithuania and Italy state that their health restricts them a little or a lot from doing activities such as moving a table. The highest shares of respondents considering that their health limits them a lot are found in Hungary and Poland (13% each) as well as in Bulgaria (17%).

Special EUROBAROMETER 248 “MENTAL WELL-BEING”
- 6 -
The country-by-country results appear fairly similar when respondents evaluate the restrictions caused by their health to climbing up stairs. 82% of Swedes and 81% Finns indicate that they do not experience health limits whereas, on the bottom of the graph, Hungary (60%) and Italy (62%) have the fewest citizens stating the same. The lowest share (56%) of those not encountering limitations caused by their health occurs again in Bulgaria. 38% of citizens of Hungary and Italy evaluate that their health limits them at least a little while climbing up the stairs whereas this is the case for 43% of Bulgarians. The highest share, 19%, of those who experience a lot of restrictions caused by their state of health is found in Hungary and Bulgaria.
QA1 To what extent, if at all, does your health limit you from Climbing several flights of stairs?
- % country
71%
56%
64%
65%
67%
60%
62%
63%
64%
65%
66%
67%
70%
71%
71%
71%
72%
72%
74%
75%
76%
76%
76%
77%
77%
78%
78%
79%
81%
82%
20%
24%
20%
18%
25%
19%
26%
24%
21%
23%
22%
26%
19%
16%
20%
19%
19%
19%
18%
15%
17%
14%
15%
15%
16%
14%
11%
13%
12%
12%
8%
19%
15%
15%
8%
19%
12%
13%
14%
11%
12%
7%
11%
12%
10%
10%
8%
9%
8%
10%
8%
9%
8%
7%
7%
8%
11%
8%
6%
6%
0% 50% 100%
CY (tcc)
BG
HR
RO
TR
HU
IT
LT
PL
SK
CZ
AT
EL
CY
PT
SI
EE
MT
DE
ES
BE
FR
LV
IE
NL
LU
UK
DK
FI
SE
It does not limit you at all It limits you a little It limits you a lot DK

Special EUROBAROMETER 248 “MENTAL WELL-BEING”
- 7 -
The results of the socio-demographic analysis are to some degree foreseeable: the strongest divider here appears to be the age of respondent. The elderly (who could be presumed to have more often a low level of education and to be retired) encounter significantly more restrictions due to their state of health when carrying out moderate physical activities. Also, women and house persons, categories that also are likely to overlap, stand out from their counterparts for being more inclined to experience health limitations. Moreover, a link between mental well-being and physical health becomes visible. Those who have either sought psychological help or have been treated for psychological or emotional health problems, state notably more frequently that their health limits them a lot from doing moderate physical activities. Finally, a slight difference is perceived between those who think that finding information about psychological problems is easy and those who find it difficult, the latter group being somewhat more likely to experience health restrictions when doing moderate activities, such as vacuum-cleaning or climbing stairs.
QA1 To what extent, if at all, does your health limit you from…?
% - It limits you a lot Doing moderate activities, such as moving a table, pushing a vacuum cleaner or carrying your shopping
Climbing several flights of stairs
EU25 10% 9% GENDER Male 7% 8%
Female 11% 12% AGE 15 - 24 1% 1%
25 - 39 3% 2%
40 - 54 6% 6%
55 & + 19% 23%
EDUCATION 15 18% 22%
16-19 7% 7%
20+ 5% 4%
Still Studying 1% 1%
OCCUPATION Self-employed 4% 4%
Managers 3% 2%
Other white collars 2% 2%
Manual workers 3% 3%
House persons 11% 14%
Unemployed 5% 5%
Retired 24% 28%
Students 1% 1% Has sought psychological help Yes 20% 21%
No 7% 9% Has received psychological treatment Yes 26% 25%
No 7% 9% Finding info about psychological problems Easy 7% 8%
Difficult 11% 12%
Special EUROBAROMETER 248 “MENTAL WELL-BEING”
- 8 -
1.2 Mental Well-being over the Last 4 Weeks
- In general, Europeans experience their life in a positive light but a reasonable share feels tired -
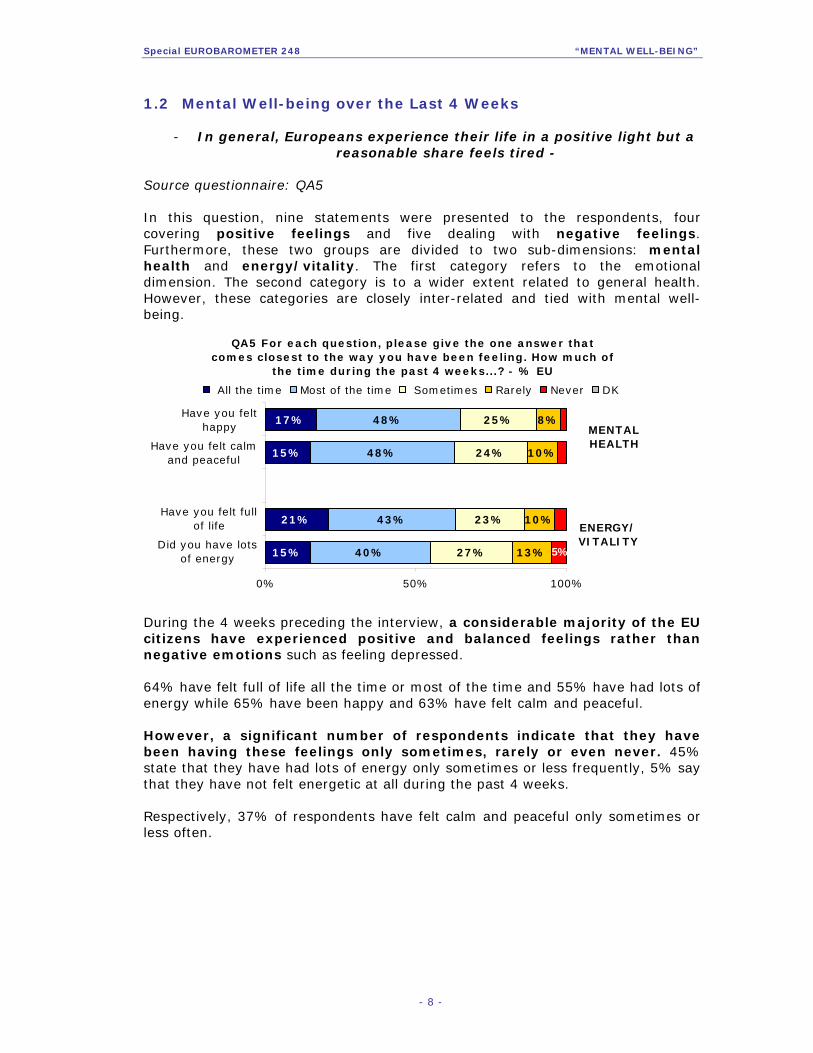
Source questionnaire: QA5 In this question, nine statements were presented to the respondents, four covering positive feelings and five dealing with negative feelings. Furthermore, these two groups are divided to two sub-dimensions: mental health and energy/vitality. The first category refers to the emotional dimension. The second category is to a wider extent related to general health. However, these categories are closely inter-related and tied with mental well-being.
During the 4 weeks preceding the interview, a considerable majority of the EU citizens have experienced positive and balanced feelings rather than negative emotions such as feeling depressed. 64% have felt full of life all the time or most of the time and 55% have had lots of energy while 65% have been happy and 63% have felt calm and peaceful. However, a significant number of respondents indicate that they have been having these feelings only sometimes, rarely or even never. 45% state that they have had lots of energy only sometimes or less frequently, 5% say that they have not felt energetic at all during the past 4 weeks. Respectively, 37% of respondents have felt calm and peaceful only sometimes or less often.
QA5 For each question, please give the one answer that comes closest to the way you have been feeling. How much of
the time during the past 4 weeks...? - % EU
15%
21%
15%
17%
40%
43%
48%
48%
27%
23%
24%
25%
13%
10%
10%
8%
5%
0% 50% 100%
Did you have lotsof energy
Have you felt fullof life
Have you felt calmand peaceful
Have you felthappy
All the time Most of the time Sometimes Rarely Never DK
MENTAL HEALTH
ENERGY/VITALITY

Special EUROBAROMETER 248 “MENTAL WELL-BEING”
- 9 -
QA5 For each question, please give the one answer that comes closest to the way you have been feeling. How much of the time during the past 4
weeks...? - % EU
27%
23%
43%
55%
23%
27%
27%
28%
23%
48%
34%
36%
21%
15%
14%11%
11%
10%
0% 50% 100%
Have you felt tired
Have you felt worn out
Have you felt particularly tense
Have you felt downhearted and depressed
Have you felt so down in the dumps thatnothing could cheer you up
Never Rarely Sometimes Most of the time All the time DK
MENTAL HEALTH
ENERGY/VITALITY
When analysing negative emotions experienced during the past month, it is perceived that Europeans are most likely to feel tired. 18% of respondents indicate that they have been tired all the time or most of the time, out of which 4% have been feeling like this all the time. On the contrary, 55% state that they have not at all felt so down in the dumps that nothing could cheer them up and 43% indicate the same when it comes to feeling downhearted and depressed. All in all, it can be said that Europeans appear to have had mainly positive feelings recently. However, a substantial share indicates that they do not have lots of energy and they feel tired, the feelings related to energy/vitality dimension, at least sometimes. Examining the results at the country level reveals significant discrepancies between countries. When it comes to the positive feelings related to mental health, the share of those who have felt happy all the time or most of the time varies between 83% in the Netherlands and 42% in Latvia and Bulgaria. Over a quarter of respondents in Belgium (27%), the Netherlands and Luxembourg (26% each) indicate that they have been happy all the time while 7% of Bulgarians and 6% of Latvians announce not having had this feeling at all. Finns (83%) top the table with the highest number of respondents having felt calm and peaceful almost all the time while less than half, 46%, of Italians state the same. Respondents in Finland and Sweden share the first place with the highest number of respondents, declaring that they have felt balanced all the time whereas 5% of Luxembourgish citizens indicate that they have not felt in this way at all. Regarding the energy/vitality dimension, 90% of Finnish respondents, again, have felt full of life all the time or most of the time whereas only 30% of Hungarians have experienced the same. Also, citizens of Finland most frequently announce that they have felt full of life all the time (45%), followed by Swedes with a 28% share. Instead, 16% of Hungarians and 14% of Estonians indicate that they have never felt this way in the past month before the survey.

Special EUROBAROMETER 248 “MENTAL WELL-BEING”
- 10 -
Finally, 72% of the Dutch indicate that they have had lots of energy all the time or most of the time during the past month and, in turn, only 37% of German respondents indicate the same. Greeks (25%), Cypriots (24%) and citizens of Luxembourg (24%) state that they have felt energetic all the time whereas 8% of Estonians and Hungarians indicate that they have not had energy at all during the past 4 weeks before the interview.
QA5 These questions are about how you feel and how things have been with you during the past 4 weeks. For each question, please give the one answer that comes closest to the way you have been feeling. How much of the time during the past 4 weeks...?
MENTAL HEALTH ENERGY/VITALITY
% All the time + Most of the time
Have you felt happy
% All the time + Most of the time
Have you felt calm and peaceful
% All the time + Most of the time
Have you felt full of life
% All the time + Most of the time
Did you have lots of energy
NL 83% FI 83% FI 90% NL 72%
IE 82% DK 80% DK 77% FI 70%
BE 80% NL 76% NL 76% CY 68%
FI 78% SE 75% LU 74% DK 67%
LU 75% SK 72% BE 72% FR 66%
UK 75% BE 71% DE 71% LU 66%
FR 74% CZ 71% SE 72% EL 65%
DK 71% LT 71% ES 70% AT 65%
ES 70% PL 69% FR 68% SK 63%
SE 70% HU 68% SK 68% BE 62%
CY 67% DE 67% AT 66% IE 61%
EU25 65% IE 67% IE 65% HU 60%
SK 63% FR 66% EU25 64% SE 60%
CZ 62% LU 66% CZ 64% ES 59%
EL 61% AT 66% UK 64% CZ 58%
MT 61% MT 64% PT 62% EU25 55%
SI 61% UK 64% SI 61% SI 55%
AT 60% EU25 63% LV 58% UK 55%
PL 60% EE 63% LT 58% PL 54%
DE 59% LV 62% CY 57% LT 53%
HU 57% ES 61% PL 57% IT 50%
PT 56% CY 61% EL 56% MT 49%
LT 52% EL 58% MT 56% LV 47%
EE 48% SI 52% IT 50% PT 46%
IT 48% PT 50% EE 34% EE 45%
LV 42% IT 46% HU 30% DE 37%
RO 56% RO 65% RO 63% RO 61%
HR 53% BG 61% BG 58% BG 55%
TR 52% HR 59% HR 51% HR 44%
BG 42% TR 49% TR 49% TR 44%
CY (tcc) 61% CY (tcc) 55% CY (tcc) 54% CY (tcc) 40%
No clear consistencies between the countries are observed. Nevertheless, it appears that citizens of the Netherlands and Finland have experienced more often positive feelings during the 4 weeks preceding the interview. Also, it can be said that Italians and respondents in the three Baltic States seem to indicate slightly less frequently positive emotions when the month before the interview is considered.
Special EUROBAROMETER 248 “MENTAL WELL-BEING”
- 11 -
QA5.1 These questions are about how you feel and how things have been with you during the past 4 weeks. For each question, please give the one answer that comes closest to the way you have been feeling. How much of the time during the past 4 weeks...?
MENTAL HEALTH ENERGY/VITALITY
% Never
+ Rarely
Have you felt so down in the
dumps that nothing could cheer you up
% Never
+ Rarely
Have you felt downhearted
and depressed
% Never
+ Rarely
Have you felt
particularly tense
% Never
+ Rarely
Have you felt worn
out
% Never
+ Rarely
Have you felt tired
SE 90% DK 83% FI 70% BE 43% UK 27%
DK 87% DE 80% DK 66% DK 40% SK 32%
LU 87% SE 80% SE 65% ES 40% SI 27%
FR 85% CZ 79% IE 61% CZ 38% SE 27%
DE 84% IE 78% ES 58% AT 38% PT 35%
FI 84% NL 78% LU 57% DE 36% PL 33%
BE 83% AT 78% UK 57% NL 36% NL 36%
IE 83% LU 77% CZ 56% PT 35% MT 28%
NL 83% FI 77% MT 56% FI 35% LV 31%
CZ 82% HU 76% AT 56% EU25 34% LU 33%
UK 81% BE 75% PT 56% FR 33% LT 31%
EE 79% SK 75% SI 54% LU 33% IT 30%
SI 79% UK 75% NL 53% PL 33% IE 30%
EU25 78% SI 74% SK 53% SK 32% HU 29%
SK 78% EE 73% EE 52% LV 31% FR 33%
CY 77% ES 72% LT 52% LT 31% FI 35%
MT 77% FR 72% BE 51% EL 30% EU25 34%
ES 76% EU25 71% HU 51% IE 30% ES 40%
AT 76% CY 70% PL 51% IT 30% EL 30%
LV 75% PT 67% EU25 50% HU 29% EE 26%
PL 75% EL 66% DE 48% MT 28% DK 40%
HU 73% MT 66% FR 47% CY 27% DE 36%
PT 73% LV 64% LV 46% SI 27% CZ 38%
EL 70% PL 61% EL 36% SE 27% CY 27%
IT 65% IT 55% IT 35% UK 27% BE 43%
LT 61% LT 54% CY 35% EE 26% AT 38%
BG 70% BG 70% BG 51% BG 40% BG 40%
HR 73% HR 64% HR 40% HR 26% HR 26%
RO 67% RO 66% RO 46% RO 37% RO 37%
TR 69% TR 49% TR 36% TR 35% TR 35%
CY (tcc)
50% CY (tcc)
59% CY (tcc)
38% CY (tcc)
30% CY (tcc)
30%
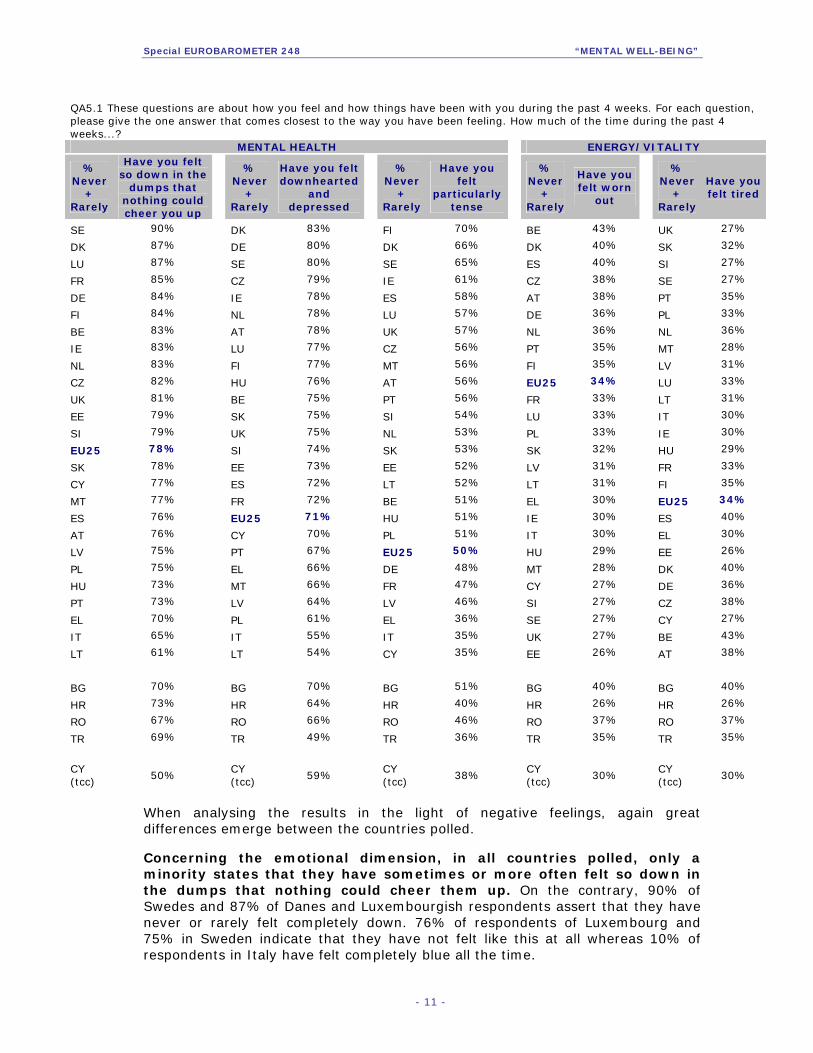
When analysing the results in the light of negative feelings, again great differences emerge between the countries polled. Concerning the emotional dimension, in all countries polled, only a minority states that they have sometimes or more often felt so down in the dumps that nothing could cheer them up. On the contrary, 90% of Swedes and 87% of Danes and Luxembourgish respondents assert that they have never or rarely felt completely down. 76% of respondents of Luxembourg and 75% in Sweden indicate that they have not felt like this at all whereas 10% of respondents in Italy have felt completely blue all the time.
Special EUROBAROMETER 248 “MENTAL WELL-BEING”
- 12 -
83% of Danes and 80% of German and Swedes say that they have never or rarely felt downhearted and depressed whereas this is the case for 49% of Turks and 54% of Latvians. Approximately 1 in 10 residents of Lithuania (10%) and Greece (10%) have felt depressed most of the time while 57% of Luxembourgish citizens claim not to have felt this way at all. The three Nordic Countries again appear on the top of the table when feeling tense is discussed. 70% of Finns, 66% of Danes and 65% of Swedes assert that they have felt tense only rarely while only 35% of Cypriots and Italians indicate the same. Respondents in Sweden and the United Kingdom most often state that they have not felt tense at all (35% each). In turn, about 1 in 5 Cypriots (20%) and Greeks (18%) admit that they have felt tense most of the time. In terms of the energy/vitality dimension, it can be clearly observed that Europeans are often feeling tired. Less than half of the respondents in each country state that they have been tired only rarely or never. The highest shares of those not feeling often tired are found in Belgium (43%), Denmark and Spain (40%) whereas about a quarter of Estonians and Croatians (26% each) indicate the same. This result reinforces the observation already made concerning positive feelings: EU citizens indicate more often having negative feelings related to the energy/vitality dimension than to the mental health dimension. The Danes (79%) also most often indicate that they have almost never felt worn out, followed by citizens of Finland (78%). On the contrary, only 35% of respondents in Croatia, 42% in the United Kingdom and 43% in Turkey express the same view. The highest number of Finns (54%) indicates that they have not felt worn out at all, followed by 49% of Danes. On the other hand, 15% of Hungarians and 14% of the Portuguese and Croatians admit that they have felt worn out most of the time. When it comes to the socio-demographic analysis, some consistent patterns are perceived in the group of those who are likely to have positive feelings and among those who appear to have negative perceptions of the past 4 weeks. Men, the young, those who have studied longer, students, managers and self-employed and those who have neither sought nor received help for mental problems are more likely to state that they have felt positive all the time or most of the time during the past 4 weeks. On the contrary, women, those aged 55 and more, those who have finished their education at 15, the retired, house persons and unemployed and those who have sought or received psychological help are more likely to describe their last 4 weeks in negative terms.
Special EUROBAROMETER 248 “MENTAL WELL-BEING”
- 13 -
2 PROBLEMS WITH WORK AND SOCIAL ACTIVITIES The second chapter examines the influence of physical and mental health on regular activities, mainly on working life and on social relations. The effects on the level of accomplishment, on efficiency at work and on activity in social interaction, such as meeting friends and relatives are portrayed. 2.1 The Effects of Physical Health 2.1.1 Level of Accomplishment
- Over half of Europeans assert that they have no problems caused by physical health that would limit their usual activities -
Source Questionnaire: QA2
QA2 During the past 4 weeks how much of the time have you had any of the following problems with your work or other regular activities as a result of
your physical health? - % EU25
58%
54%
18%
17%
14%
17%
6%
8% 5%
0% 50% 100%
You have accomplishedyour usual activities less
carefully
You have accomplishedless than you would like
Never Rarely Sometimes Most of the time All the time DK
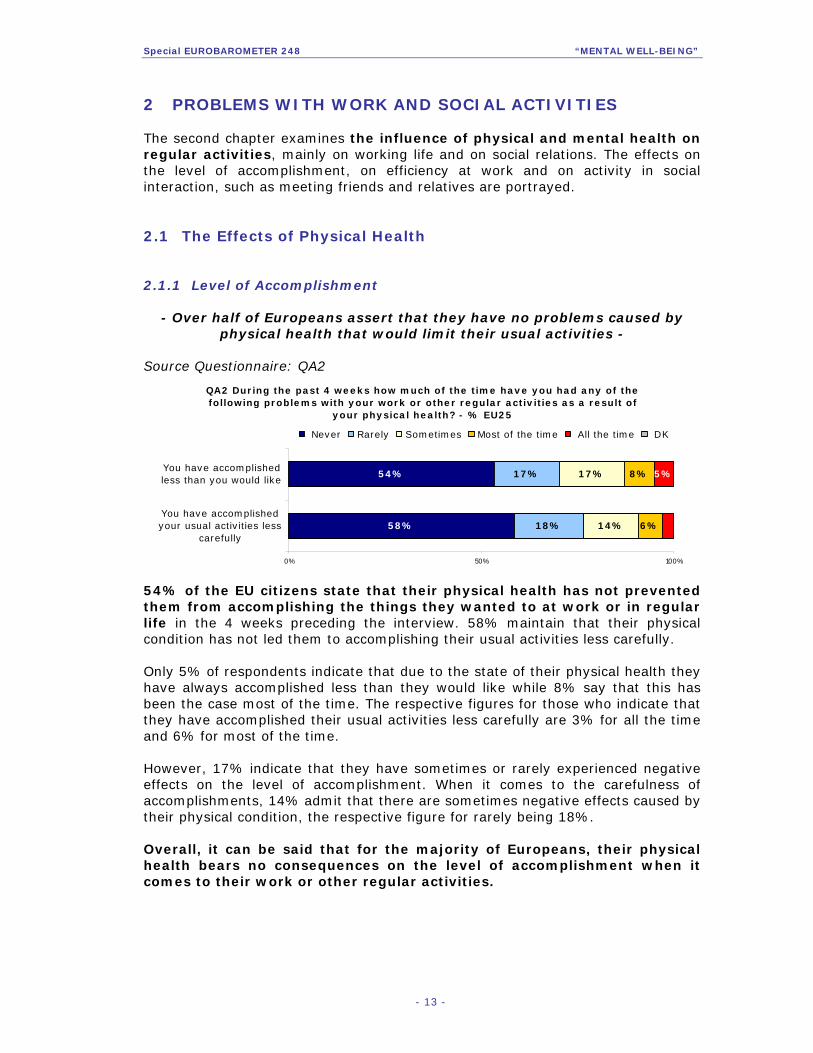
54% of the EU citizens state that their physical health has not prevented them from accomplishing the things they wanted to at work or in regular life in the 4 weeks preceding the interview. 58% maintain that their physical condition has not led them to accomplishing their usual activities less carefully. Only 5% of respondents indicate that due to the state of their physical health they have always accomplished less than they would like while 8% say that this has been the case most of the time. The respective figures for those who indicate that they have accomplished their usual activities less carefully are 3% for all the time and 6% for most of the time. However, 17% indicate that they have sometimes or rarely experienced negative effects on the level of accomplishment. When it comes to the carefulness of accomplishments, 14% admit that there are sometimes negative effects caused by their physical condition, the respective figure for rarely being 18%. Overall, it can be said that for the majority of Europeans, their physical health bears no consequences on the level of accomplishment when it comes to their work or other regular activities.
Special EUROBAROMETER 248 “MENTAL WELL-BEING”
- 14 -
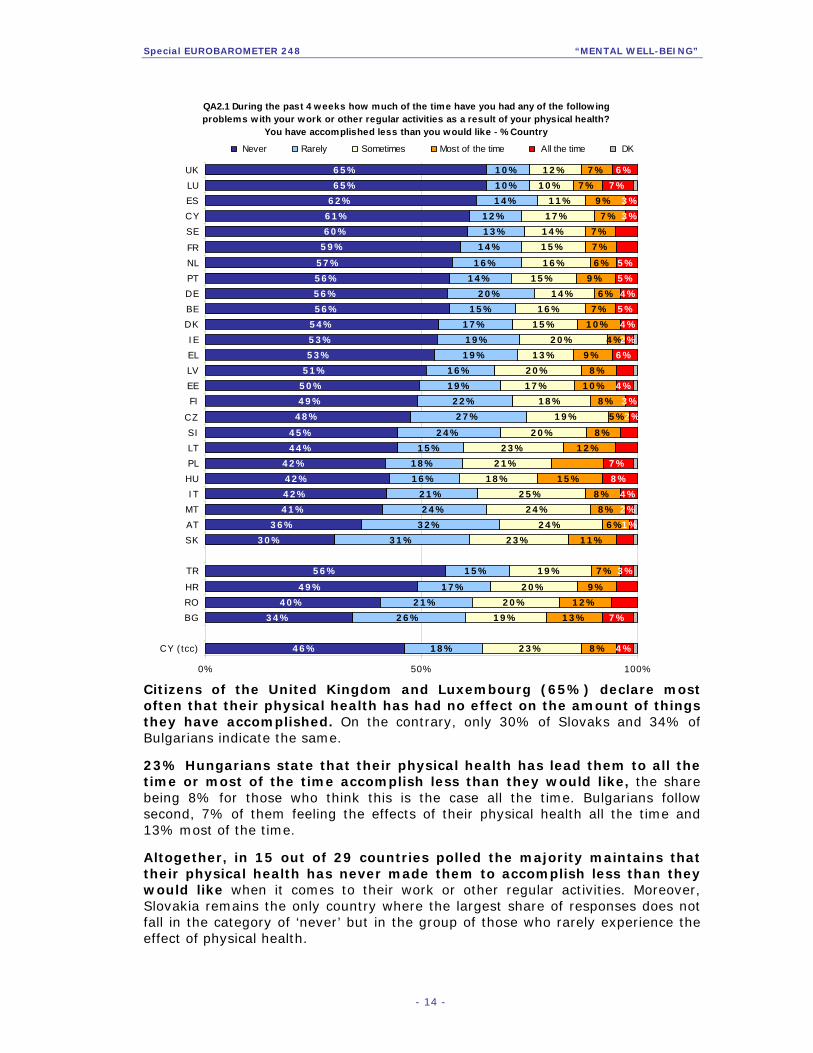
QA2.1 During the past 4 weeks how much of the time have you had any of the following problems w ith your work or other regular activities as a result of your physical health?
You have accomplished less than you would like - % Country
46%
34%
40%
49%
56%
30%
36%
41%
42%
42%
42%
44%
45%
48%
49%
50%
51%
53%
53%
54%
56%
56%
56%
57%
59%
60%
61%
62%
65%
65%
18%
26%
21%
17%
15%
31%
32%
24%
21%
16%
18%
15%
24%
27%
22%
19%
16%
19%
19%
17%
15%
20%
14%
16%
14%
13%
12%
14%
10%
10%
23%
19%
20%
20%
19%
23%
24%
24%
25%
18%
21%
23%
20%
19%
18%
17%
20%
13%
20%
15%
16%
14%
15%
16%
15%
14%
17%
11%
10%
12%
8%
13%
12%
9%
7%
11%
6%
8%
8%
15%
12%
8%
5%
8%
10%
8%
9%
4%
10%
7%
6%
9%
6%
7%
7%
7%
9%
7%
7%
4%
3%
6%
7%
2%
2%
4%
7%
8%
1%
3%
4%
6%
2%
4%
5%
4%
5%
5%
3%
3%
7%
0% 50% 100%
CY (tcc)
BG
RO
HR
TR
SK
AT
MT
IT
HU
PL
LT
SI
CZ
FI
EE
LV
EL
IE
DK
BE
DE
PT
NL
FR
SE
CY
ES
LU
UK
Never Rarely Sometimes Most of the time All the time DK
Citizens of the United Kingdom and Luxembourg (65%) declare most often that their physical health has had no effect on the amount of things they have accomplished. On the contrary, only 30% of Slovaks and 34% of Bulgarians indicate the same.
23% Hungarians state that their physical health has lead them to all the time or most of the time accomplish less than they would like, the share being 8% for those who think this is the case all the time. Bulgarians follow second, 7% of them feeling the effects of their physical health all the time and 13% most of the time.
Altogether, in 15 out of 29 countries polled the majority maintains that their physical health has never made them to accomplish less than they would like when it comes to their work or other regular activities. Moreover, Slovakia remains the only country where the largest share of responses does not fall in the category of ‘never’ but in the group of those who rarely experience the effect of physical health.
Special EUROBAROMETER 248 “MENTAL WELL-BEING”
- 15 -
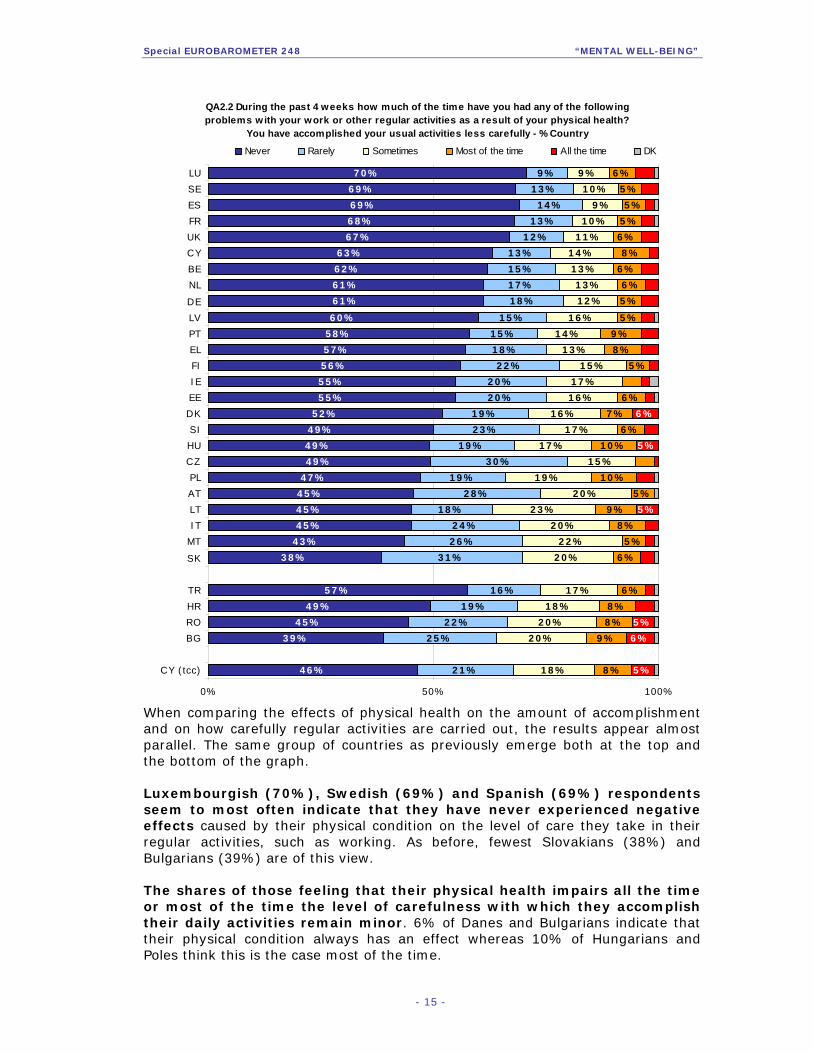
QA2.2 During the past 4 weeks how much of the time have you had any of the following problems with your work or other regular activities as a result of your physical health?
You have accomplished your usual activities less carefully - % Country
46%
39%
45%
49%
57%
38%
43%
45%
45%
45%
47%
49%
49%
49%
52%
55%
55%
56%
57%
58%
60%
61%
61%
62%
63%
67%
68%
69%
69%
70%
21%
25%
22%
19%
16%
31%
26%
24%
18%
28%
19%
30%
19%
23%
19%
20%
20%
22%
18%
15%
15%
18%
17%
15%
13%
12%
13%
14%
13%
9%
18%
20%
20%
18%
17%
20%
22%
20%
23%
20%
19%
15%
17%
17%
16%
16%
17%
15%
13%
14%
16%
12%
13%
13%
14%
11%
10%
9%
10%
9%
8%
9%
8%
8%
6%
6%
5%
8%
9%
5%
10%
6%
7%
6%
5%
8%
9%
5%
5%
6%
6%
8%
6%
5%
5%
5%
6%
5%
6%
10%
6%
5%
5%
5%
0% 50% 100%
CY (tcc)
BG
RO
HR
TR
SK
MT
IT
LT
AT
PL
CZ
HU
SI
DK
EE
IE
FI
EL
PT
LV
DE
NL
BE
CY
UK
FR
ES
SE
LU
Never Rarely Sometimes Most of the time All the time DK
When comparing the effects of physical health on the amount of accomplishment and on how carefully regular activities are carried out, the results appear almost parallel. The same group of countries as previously emerge both at the top and the bottom of the graph. Luxembourgish (70%), Swedish (69%) and Spanish (69%) respondents seem to most often indicate that they have never experienced negative effects caused by their physical condition on the level of care they take in their regular activities, such as working. As before, fewest Slovakians (38%) and Bulgarians (39%) are of this view. The shares of those feeling that their physical health impairs all the time or most of the time the level of carefulness with which they accomplish their daily activities remain minor. 6% of Danes and Bulgarians indicate that their physical condition always has an effect whereas 10% of Hungarians and Poles think this is the case most of the time.

Special EUROBAROMETER 248 “MENTAL WELL-BEING”
- 16 -
In general, in all countries polled a majority of respondents assert that their physical health never leads them to accomplish their regular activities less carefully.
Some interesting patterns emerge in the socio-demographic analysis. First, men are slightly more likely than women to indicate that their physical health has no effect on their level of accomplishment or on how carefully they carry out their regular activities. This is also the case the younger the respondent is and the longer the education he/she has. These observations correspond to the results that were already introduced in relation to the limits that respondents’ heath poses when carrying out moderate physical activities. Second, when comparing the occupational groups, it can be observed that students and managers most often indicate that their physical condition has never affected their level of accomplishment during the month preceding the survey whereas significantly fewer retired respondents are of this view. Finally, distinct discrepancies again occur when comparing the groups of those who have sought help or received treatment and those who have not. Those who have not sought help or received treatment are twice as likely to state that their physical health never led them to accomplish less or accomplish their usual activities less carefully. This result reinforces again an observation of a close connection between the state of physical health and mental well-being.
QA2 During the past 4 weeks how much of the time have you had any of the following problems with your work or other regular
activities as a result of your physical health?- % Never
61%30%
62%33%
53%72%
68%68%
35%63%
70%60%
70%66%
62%43%
40%61%
69%74%
55%63%
No
Yes
HAS RECEIVED TREATM ENT
No
Yes
HAS SOUGHT PSYCHOLOGICAL HELP
House persons
M anagers
M anual workers
Other white collars
Retired
Self - employed
Students
Unemployed
OCCUPATION
Still Studying
20+
16-19
15
EDUCATION (End of)
55 +
40-54
25-39
15-24
AGE
Female
M ale
GENDER
You have accomplished your usual activities less carefully
QA2 During the past 4 weeks how much of the time have you had any of the following problems with your work or other regular
activities as a result of your physical health?- % Never
56%26%
57%30%
28%47%
56%59%
63%64%
68%70%
70%61%
56%38%
34%56%
65%72%
50%58%
No
Yes
HAS RECEIVED TREATM ENT
No
Yes
HAS SOUGHT PSYCHOLOGICAL HELP
House persons
M anagers
M anual workers
Other white collars
Ret ired
Self- employed
Students
Unemployed
OCCUPATION
Still Studying
20+
16-19
15
EDUCATION (End of)
55 +
40-54
25-39
15-24
AGE
Female
M ale
GENDER
You have accomplished less than you would like

Special EUROBAROMETER 248 “MENTAL WELL-BEING”
- 17 -
2.1.2 The Effect of Pain Source Questionnaire: QA4
- For most of Europeans, pain does not interfere with their activities, or does so only a little -
The majority of EU citizens, 57%, state that pain has not at all interfered with their activities. 19% of respondents claim that pain disturbs them a little and 12% assess that the effect of pain is moderate. Only 4% of Europeans indicate that pain has interfered with their life to an extreme extent whereas 9% state that pain causes them problems quite a bit. When interpreting this question it should be borne in mind that the results do not indicate how many respondents report having pain but, instead, for how many it has caused problems in their activities.
QA4 During the past 4 weeks, how much, if at all, has pain interfered with your activities? - % country
56%
43%
49%
51%
56%
41%
43%
43%
46%
48%
48%
49%
49%
49%
51%
52%
54%
54%
54%
56%
57%
57%
62%
63%
63%
64%
65%
65%
66%
67%
71%
19%
21%
21%
18%
18%
38%
20%
26%
28%
24%
28%
28%
27%
23%
25%
25%
17%
14%
20%
17%
19%
20%
20%
14%
20%
14%
14%
12%
13%
15%
13%
13%
13%
12%
13%
13%
15%
18%
14%
13%
12%
13%
12%
9%
13%
14%
16%
13%
17%
12%
14%
12%
13%
9%
10%
8%
9%
8%
11%
9%
7%
7%
7%
9%
12%
12%
6%
5%
13%
13%
10%
8%
8%
7%
10%
10%
8%
6%
11%
11%
10%
9%
9%
8%
6%
9%
6%
9%
10%
8%
8%
7%
5%
5%
5%
7%
6%
6%
5%
5%
10%
0% 50% 100%
CY (tcc)
BG
RO
HR
TR
CZ
PL
SK
EE
SI
FI
IT
LV
LT
AT
MT
HU
PT
SE
DE
EU25
BE
DK
FR
NL
EL
ES
CY
LU
UK
IE
Not at all A little Moderately Quite a bit Extremely DK
Special EUROBAROMETER 248 “MENTAL WELL-BEING”
- 18 -
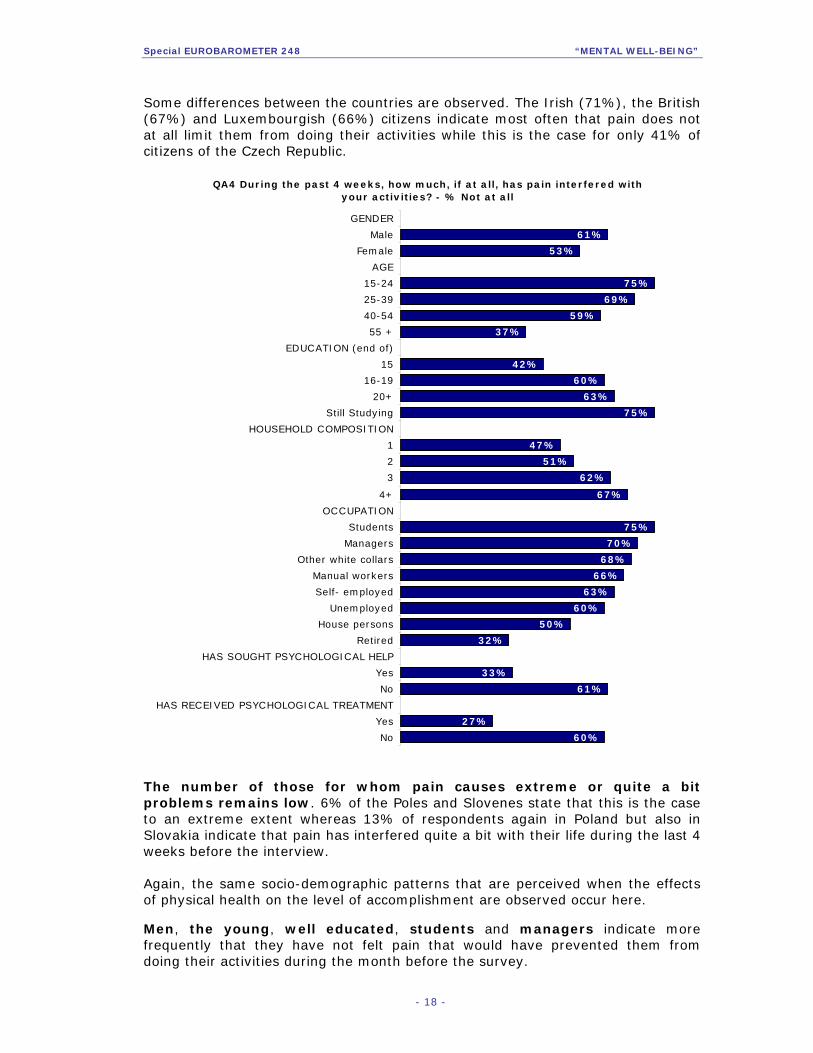
Some differences between the countries are observed. The Irish (71%), the British (67%) and Luxembourgish (66%) citizens indicate most often that pain does not at all limit them from doing their activities while this is the case for only 41% of citizens of the Czech Republic.
QA4 During the past 4 weeks, how much, if at all, has pain interfered with your activities? - % Not at all
60%
27%
61%
33%
32%
50%
60%
63%
66%
68%
70%
75%
67%
62%
51%
47%
75%
63%
60%
42%
37%
59%
69%
75%
53%
61%
0% 80%
No
Yes
HAS RECEIVED PSYCHOLOGICAL TREATMENT
No
Yes
HAS SOUGHT PSYCHOLOGICAL HELP
Retired
House persons
Unemployed
Self- employed
Manual workers
Other white collars
Managers
Students
OCCUPATION
4+
3
2
1
HOUSEHOLD COMPOSITION
Still Studying
20+
16-19
15
EDUCATION (end of)
55 +
40-54
25-39
15-24
AGE
Female
Male
GENDER
The number of those for whom pain causes extreme or quite a bit problems remains low. 6% of the Poles and Slovenes state that this is the case to an extreme extent whereas 13% of respondents again in Poland but also in Slovakia indicate that pain has interfered quite a bit with their life during the last 4 weeks before the interview. Again, the same socio-demographic patterns that are perceived when the effects of physical health on the level of accomplishment are observed occur here. Men, the young, well educated, students and managers indicate more frequently that they have not felt pain that would have prevented them from doing their activities during the month before the survey.

Special EUROBAROMETER 248 “MENTAL WELL-BEING”
- 19 -
In addition, the distinction between the groups of those who have sought psychological help or have been treated for psychological or emotional problems and those who have not reappears. The differences are striking since 61% of those who have not sought help and 60% of those who have not been treated announce that pain has never interfered with their life while the respective figures are 33% for those who have looked for help and 27% for those who have received treatment for psychological problems. 2.2 The Effects of Emotional Problems 2.2.1 Level of Accomplishment
- Over 3 in 5 respondents maintain that emotional problems do not deteriorate their level of accomplishment -
Source questionnaire: QA3
QA3 During the past 4 weeks how much of the time have you had any of the following problems with your work or other regular activities as a result of any
emotional problem? - % EU25
64%
61%
17%
16%
13%
14%
5%
6%
0% 50% 100%
You have accomplishedyour usual activities less
carefully
You have accomplishedless than you would like
Never Rarely Sometimes Most of the time All the time DK
Over 3 in 5 Europeans announce that emotional problems have never affected their level of accomplishment while carrying out regular activities when the 4 weeks before the interview are considered. 61% of respondents state that emotional problems have not led them to accomplish less than they would have liked and 64% indicate the same when it comes to the level of care they take with their usual activities. Only a minor share of respondents admits that emotional problems have had an effect on their level of accomplishment. 9% of EU citizens indicate that this has been the case all the time or most of the time when it comes to the amount of things accomplished. Only 7% of respondents state the same concerning how carefully they have carried out their usual activities, such as work. In comparison with the results about the effects of physical health on the level of accomplishment (sub-chapter 2.1.1), it is worth pointing out that respondents

Special EUROBAROMETER 248 “MENTAL WELL-BEING”
- 20 -
evaluate that their physical condition restricts the level of accomplishment more often than emotional problems. Again, at the country level clear differences are perceived. Luxembourg (77%) is where the highest number of citizens indicate that emotional problems have never lead them to accomplish less than they would have liked to, followed by 71% of the Spanish asserting the same. On the other hand, only 39% of Slovaks and 42% of Bulgarians agree with this opinion.
QA3.1 During the past 4 weeks, how much of the time have you had any of the following problems with your work or other regular activities as a result of any emotional problem? You have accomplished less than you
would like - % Country
42%
42%
49%
52%
56%
39%
43%
44%
46%
46%
47%
47%
48%
49%
54%
54%
55%
56%
58%
60%
62%
63%
64%
66%
67%
68%
68%
69%
71%
77%
20%
29%
20%
17%
18%
34%
21%
24%
20%
29%
22%
19%
21%
19%
24%
22%
18%
19%
15%
18%
22%
13%
12%
15%
10%
16%
11%
14%
13%
7%
23%
17%
19%
20%
16%
19%
21%
25%
25%
20%
20%
16%
21%
21%
15%
18%
16%
15%
14%
16%
11%
14%
15%
13%
13%
11%
12%
11%
8%
9%
7%
7%
9%
8%
6%
6%
10%
5%
6%
5%
12%
7%
8%
6%
5%
8%
3%
7%
3%
3%4%
7%
6%
4%
6%
5%
7%
5%
1%
2%
2%
0% 50% 100%
CY (tcc)
BG
RO
TR
HR
SK
PL
MT
LV
AT
IT
HU
EE
LT
SI
FI
EL
DK
PT
IE
CZ
BE
CY
SE
UK
DE
FR
NL
ES
LU
Never Rarely Sometimes Most of the time All the time DK
It can be observed that the share of those considering that emotional problems affect all the time or most of the time the amount of things they carry out remains minor. Hungarians (6%) announce most frequently that emotional problems have affected them all the time. This is also the case when the category of most of the time is considered, 12% of respondents in Hungary state that most of the time they have accomplished less because of emotional problems.

Special EUROBAROMETER 248 “MENTAL WELL-BEING”
- 21 -
QA3.2 During the past 4 weeks, how much of the time have you had any of the following problems with your work or other regular activities as a
result of any emotional problem? You have accomplished your usual activities less carefully - % Country
42%
44%
52%
53%
56%
44%
47%
48%
49%
51%
52%
53%
54%
54%
56%
57%
57%
58%
59%
61%
64%
65%
66%
70%
70%
71%
71%
71%
75%
78%
22%
28%
21%
17%
20%
34%
22%
25%
24%
20%
23%
19%
18%
26%
19%
19%
24%
16%
21%
19%
14%
21%
16%
16%
11%
11%
13%
14%
13%
7%
21%
16%
18%
19%
15%
16%
20%
20%
18%
19%
17%
16%
21%
15%
15%
15%
14%
15%
15%
14%
14%
10%
12%
9%
12%
10%
10%
11%
8%
8%
8%
7%
6%
7%
6%
8%
6%
8%
8%
6%
6%
7%
7%
0% 50% 100%
CY (tcc)
BG
RO
TR
HR
SK
PL
MT
IT
LT
EE
HU
LV
AT
DK
EL
SI
PT
FI
IE
CY
CZ
BE
DE
UK
FR
NL
SE
ES
LU
Never Rarely Sometimes Most of the time All the time DK
When these results are compared with those obtained when respondents are asked if they have accomplished less as a result of their physical health, it is perceived that in 25 out of 29 countries polled those who say that emotional problems have not at all lead them to achieve less outnumber the share of those who indicate that physical problems have not effected the amount of things they have carried out. In other words, in most countries physical health is seen to have more negative effects on the volume of accomplishment than emotional problems. Luxembourgish (78%) residents again top the ranks when the highest share of those saying that emotional problems have never caused them to accomplish their usual activities less carefully is considered. The Spanish follow next with a 75% share.

Special EUROBAROMETER 248 “MENTAL WELL-BEING”
- 22 -
Moreover, Slovakia (44%), Bulgaria (44%) and the Turkish Cypriot community (42%) are again found to have fewest respondents saying that emotional problems do not disturb their usual activities at all. The shares of those indicating that emotional problems have caused them to achieve things less carefully all the time or most of the time are low. Reflecting the results before, respondents appear to evaluate that physical health problems are more often a cause of accomplishing activities less carefully than emotional problems. This is the case in 23 out of 29 countries polled.
QA3 During the past 4 weeks, how much of the time have you had any of the following problems with your work or other regular activities as a result of any emotional problem (such as feeling depressed or being
anxious)? - % never
56%
67%
67%
27%
68%
33%
53%
63%
64%
24%
65%
30%
0% 10% 20% 30% 40% 50% 60% 70% 80%
Difficult
Easy
FINDING INFO
No
Yes
HAS RECEIVED TREATMENT
No
Yes
HAS SOUGHT PSYCHOLOGICAL HELP
You have accomplished less than you would likeYou have accomplished your usual activities less carefully
The already familiar socio-demographic characteristics emerge. Women, the elderly, those with a low education level, those who live in a one-person-household, and the retired are significantly more likely than their counterparts to assert that emotional problems have made them rarely accomplish less or carry out their activities with less care. The interesting co-variation between whether the respondent has sought psychological help/received treatment for psychological problems or not and whether they have accomplished less or achieved things less carefully becomes prominent here. 65% of respondents that have not searched psychological help indicate that emotional problems have never led them to accomplish less and 68% of them say the same for achieving things less carefully, the respective shares for those who have either sought help or received treatment are 30% and 33%. The same pattern appears when those who have received treatment are considered. Only 24% of them state that they have never achieved less and 27% indicate that they have not at all been less careful with their daily activities due to emotional problems, whereas for those who have not been treated these figures are 64% and 67%

Special EUROBAROMETER 248 “MENTAL WELL-BEING”
- 23 -
These results suggest that mental problems, when experienced, have a strong impact on the level of achievement when it comes to usual daily activities. The same pattern was already perceived with the effects of physical health but to a slightly lesser extent. Finally, it can be pointed out that those respondents who feel that information on psychological problems is easily found say somewhat more often that emotional problems have never caused them to accomplish less or to be more careless with normal activities than those who indicate that finding information is difficult.
Special EUROBAROMETER 248 “MENTAL WELL-BEING”
- 24 -
2.2.2 Effects on Working Life or other Regular Activities
- The effects of emotional problems in working life remain limited - Source questionnaire: QA8
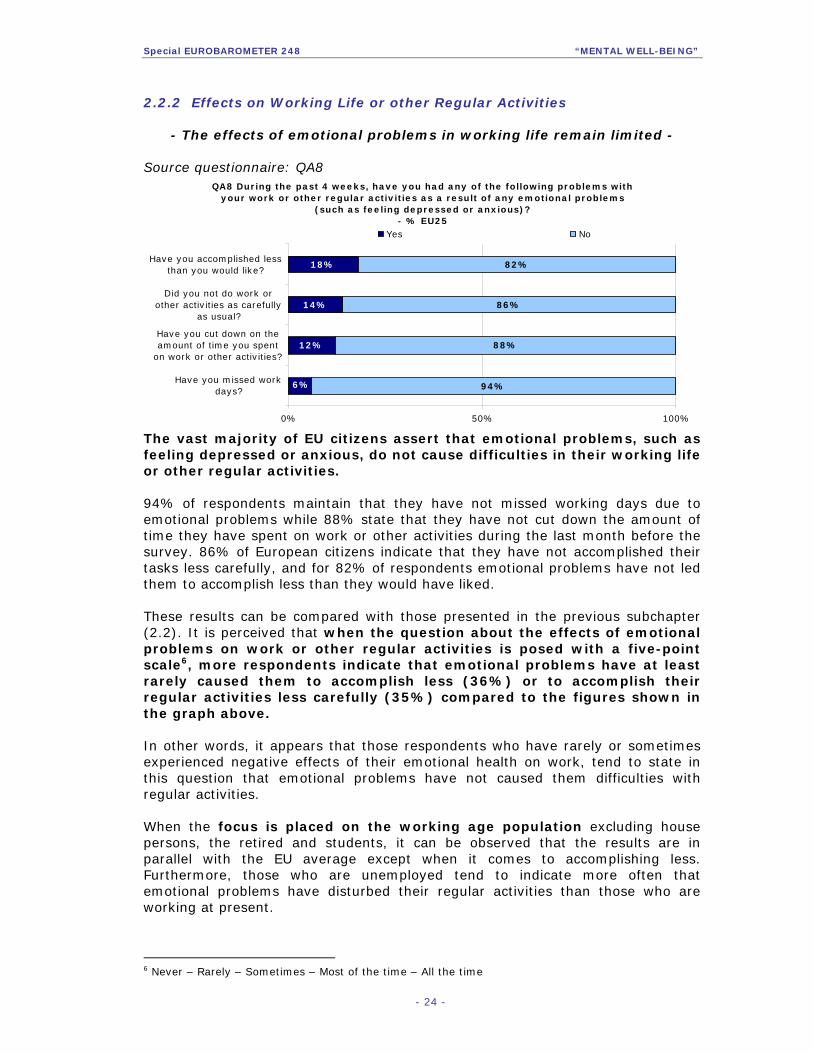
QA8 During the past 4 weeks, have you had any of the following problems with your work or other regular activities as a result of any emotional problems
(such as feeling depressed or anxious)? - % EU25
12%
14%
18%
94%
88%
86%
82%
6%
0% 50% 100%
Have you missed workdays?
Have you cut down on theamount of time you spent
on work or other activities?
Did you not do work orother activities as carefully
as usual?
Have you accomplished lessthan you would like?
Yes No
The vast majority of EU citizens assert that emotional problems, such as feeling depressed or anxious, do not cause difficulties in their working life or other regular activities. 94% of respondents maintain that they have not missed working days due to emotional problems while 88% state that they have not cut down the amount of time they have spent on work or other activities during the last month before the survey. 86% of European citizens indicate that they have not accomplished their tasks less carefully, and for 82% of respondents emotional problems have not led them to accomplish less than they would have liked. These results can be compared with those presented in the previous subchapter (2.2). It is perceived that when the question about the effects of emotional problems on work or other regular activities is posed with a five-point scale6, more respondents indicate that emotional problems have at least rarely caused them to accomplish less (36%) or to accomplish their regular activities less carefully (35%) compared to the figures shown in the graph above. In other words, it appears that those respondents who have rarely or sometimes experienced negative effects of their emotional health on work, tend to state in this question that emotional problems have not caused them difficulties with regular activities. When the focus is placed on the working age population excluding house persons, the retired and students, it can be observed that the results are in parallel with the EU average except when it comes to accomplishing less. Furthermore, those who are unemployed tend to indicate more often that emotional problems have disturbed their regular activities than those who are working at present.
6 Never – Rarely – Sometimes – Most of the time – All the time
Special EUROBAROMETER 248 “MENTAL WELL-BEING”
- 25 -
Whether this implies that the unemployed have more emotional problems or whether emotional problems cause more often disturbance in daily activities for them, cannot be said. However, it might be presumed that emotional problems might complicate to some extent the process of finding a work for the unemployed.
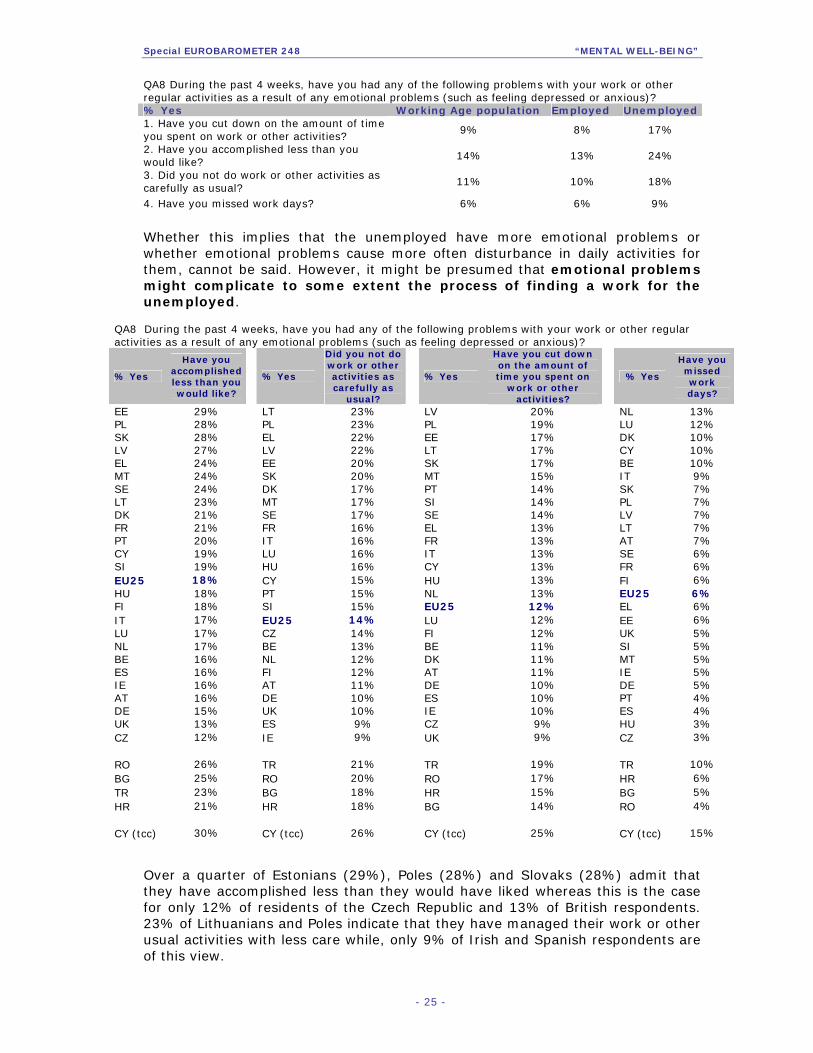
QA8 During the past 4 weeks, have you had any of the following problems with your work or other regular activities as a result of any emotional problems (such as feeling depressed or anxious)?
% Yes
Have you accomplished less than you would like?
% Yes
Did you not do work or other activities as carefully as
usual?
% Yes
Have you cut down on the amount of time you spent on
work or other activities?
% Yes
Have you missed work days?
EE 29% LT 23% LV 20% NL 13% PL 28% PL 23% PL 19% LU 12% SK 28% EL 22% EE 17% DK 10% LV 27% LV 22% LT 17% CY 10% EL 24% EE 20% SK 17% BE 10% MT 24% SK 20% MT 15% IT 9% SE 24% DK 17% PT 14% SK 7% LT 23% MT 17% SI 14% PL 7% DK 21% SE 17% SE 14% LV 7% FR 21% FR 16% EL 13% LT 7% PT 20% IT 16% FR 13% AT 7% CY 19% LU 16% IT 13% SE 6% SI 19% HU 16% CY 13% FR 6% EU25 18% CY 15% HU 13% FI 6% HU 18% PT 15% NL 13% EU25 6% FI 18% SI 15% EU25 12% EL 6% IT 17% EU25 14% LU 12% EE 6% LU 17% CZ 14% FI 12% UK 5% NL 17% BE 13% BE 11% SI 5% BE 16% NL 12% DK 11% MT 5% ES 16% FI 12% AT 11% IE 5% IE 16% AT 11% DE 10% DE 5% AT 16% DE 10% ES 10% PT 4% DE 15% UK 10% IE 10% ES 4% UK 13% ES 9% CZ 9% HU 3% CZ 12% IE 9% UK 9% CZ 3% RO 26% TR 21% TR 19% TR 10% BG 25% RO 20% RO 17% HR 6% TR 23% BG 18% HR 15% BG 5% HR 21% HR 18% BG 14% RO 4% CY (tcc) 30% CY (tcc) 26% CY (tcc) 25% CY (tcc) 15%
Over a quarter of Estonians (29%), Poles (28%) and Slovaks (28%) admit that they have accomplished less than they would have liked whereas this is the case for only 12% of residents of the Czech Republic and 13% of British respondents. 23% of Lithuanians and Poles indicate that they have managed their work or other usual activities with less care while, only 9% of Irish and Spanish respondents are of this view.
QA8 During the past 4 weeks, have you had any of the following problems with your work or other regular activities as a result of any emotional problems (such as feeling depressed or anxious)? % Yes Working Age population Employed Unemployed 1. Have you cut down on the amount of time you spent on work or other activities?
9% 8% 17%
2. Have you accomplished less than you would like?
14% 13% 24%
3. Did you not do work or other activities as carefully as usual?
11% 10% 18%
4. Have you missed work days? 6% 6% 9%
Special EUROBAROMETER 248 “MENTAL WELL-BEING”
- 26 -
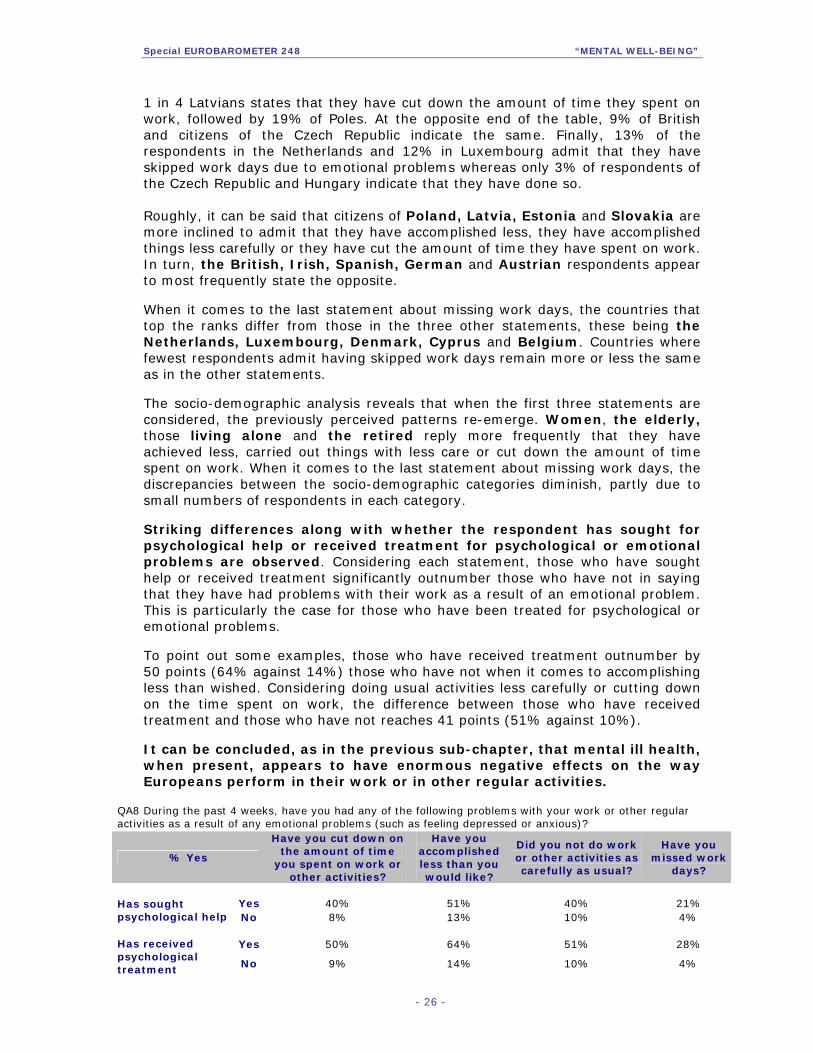
1 in 4 Latvians states that they have cut down the amount of time they spent on work, followed by 19% of Poles. At the opposite end of the table, 9% of British and citizens of the Czech Republic indicate the same. Finally, 13% of the respondents in the Netherlands and 12% in Luxembourg admit that they have skipped work days due to emotional problems whereas only 3% of respondents of the Czech Republic and Hungary indicate that they have done so. Roughly, it can be said that citizens of Poland, Latvia, Estonia and Slovakia are more inclined to admit that they have accomplished less, they have accomplished things less carefully or they have cut the amount of time they have spent on work. In turn, the British, Irish, Spanish, German and Austrian respondents appear to most frequently state the opposite. When it comes to the last statement about missing work days, the countries that top the ranks differ from those in the three other statements, these being the Netherlands, Luxembourg, Denmark, Cyprus and Belgium. Countries where fewest respondents admit having skipped work days remain more or less the same as in the other statements. The socio-demographic analysis reveals that when the first three statements are considered, the previously perceived patterns re-emerge. Women, the elderly, those living alone and the retired reply more frequently that they have achieved less, carried out things with less care or cut down the amount of time spent on work. When it comes to the last statement about missing work days, the discrepancies between the socio-demographic categories diminish, partly due to small numbers of respondents in each category. Striking differences along with whether the respondent has sought for psychological help or received treatment for psychological or emotional problems are observed. Considering each statement, those who have sought help or received treatment significantly outnumber those who have not in saying that they have had problems with their work as a result of an emotional problem. This is particularly the case for those who have been treated for psychological or emotional problems. To point out some examples, those who have received treatment outnumber by 50 points (64% against 14%) those who have not when it comes to accomplishing less than wished. Considering doing usual activities less carefully or cutting down on the time spent on work, the difference between those who have received treatment and those who have not reaches 41 points (51% against 10%). It can be concluded, as in the previous sub-chapter, that mental ill health, when present, appears to have enormous negative effects on the way Europeans perform in their work or in other regular activities.
QA8 During the past 4 weeks, have you had any of the following problems with your work or other regular activities as a result of any emotional problems (such as feeling depressed or anxious)?
% Yes
Have you cut down on the amount of time
you spent on work or other activities?
Have you accomplished less than you would like?
Did you not do work or other activities as carefully as usual?
Have you missed work
days?
Yes 40% 51% 40% 21% Has sought
psychological help No 8% 13% 10% 4%
Yes 50% 64% 51% 28% Has received psychological treatment No 9% 14% 10% 4%
Special EUROBAROMETER 248 “MENTAL WELL-BEING”
- 27 -
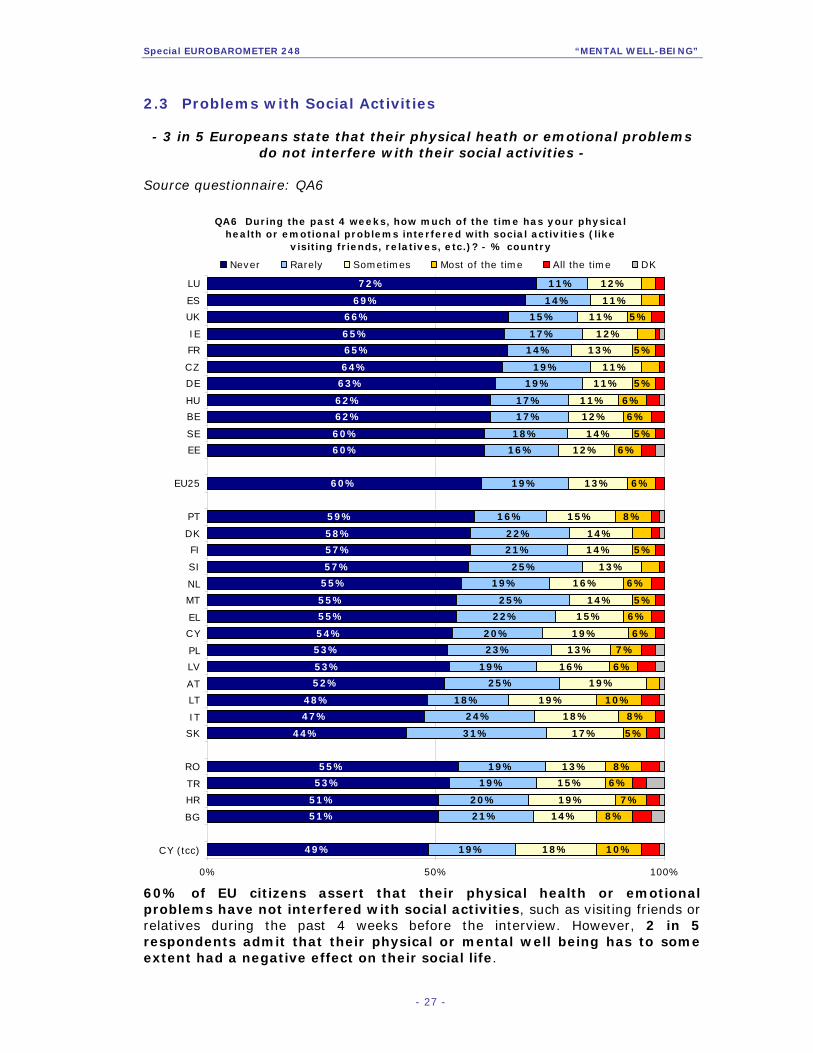
2.3 Problems with Social Activities - 3 in 5 Europeans state that their physical heath or emotional problems
do not interfere with their social activities - Source questionnaire: QA6
QA6 During the past 4 weeks, how much of the time has your physical health or emotional problems interfered with social activities (like
visiting friends, relatives, etc.)? - % country
49%
51%
51%
53%
55%
44%
47%
48%
52%
53%
53%
54%
55%
55%
55%
57%
57%
58%
59%
60%
60%
60%
62%
62%
63%
64%
65%
65%
66%
69%
72%
19%
21%
20%
19%
19%
31%
24%
18%
25%
19%
23%
20%
22%
25%
19%
25%
21%
22%
16%
19%
16%
18%
17%
17%
19%
19%
14%
17%
15%
14%
11%
18%
14%
19%
15%
13%
17%
18%
19%
19%
16%
13%
19%
15%
14%
16%
13%
14%
14%
15%
13%
12%
14%
12%
11%
11%
11%
13%
12%
11%
11%
12%
10%
8%
7%
6%
8%
5%
8%
10%
6%
7%
6%
6%
5%
6%
5%
8%
6%
6%
5%
6%
6%
5%
5%
5%
0% 50% 100%
CY (tcc)
BG
HR
TR
RO
SK
IT
LT
AT
LV
PL
CY
EL
MT
NL
SI
FI
DK
PT
EU25
EE
SE
BE
HU
DE
CZ
FR
IE
UK
ES
LU
Never Rarely Sometimes Most of the time All the time DK
60% of EU citizens assert that their physical health or emotional problems have not interfered with social activities, such as visiting friends or relatives during the past 4 weeks before the interview. However, 2 in 5 respondents admit that their physical or mental well being has to some extent had a negative effect on their social life.

Special EUROBAROMETER 248 “MENTAL WELL-BEING”
- 28 -
Out of those who have experienced negative effects caused by their physiological health or emotional problems, the largest share assesses that these effects have taken place only rarely (19%) while 13% consider that these negative effects have occurred sometimes. At the country level, residents of Luxembourg (72%), Spain (69%) and the United Kingdom (66%) indicate most frequently that their physical or psychological health has had no effect on their social activities during the last month before this survey. In turn, in four countries, the share of those who have at least rarely recognised negative effects on social activities caused by their physical or psychological health outnumbers those who have never experienced these effects. This is the case in Slovakia (56% experienced effects), Italy (52%) and Lithuania (51%). The largest number of those who have all the time or most of the time felt the negative effects of their physical or mental health are found in Lithuania, the share reaching 14%. Once again the familiar socio-demographic conformities become visible. Women are more likely than men to experience some negative effects on social activities caused by their physical or mental health. This is also the case the older the respondent is, the lower the education he or she has, as well as for those living alone and for the retired. Also, the effects of mental well-being on social activities are visible. Notably fewer respondents that have sought for psychological help (29%) indicate that their physical or mental health has had no effect on social activities than those who have not looked for help (65%). The results are parallel when the group of those who have been treated is compared with those who have not received treatment. 22% of those who have been treated indicate that their physical or emotional health has not caused problems with social interaction whereas 63% of those who have not received treatment are of this view.

Special EUROBAROMETER 248 “MENTAL WELL-BEING”
- 29 -
QA6 During the past 4 weeks, how much of the time has your physical health or emotional problems interfered with social activities (like
visiting friends, relatives, etc.)?- % Never
52%
63%
63%
22%
65%
29%
45%
54%
60%
61%
64%
67%
70%
71%
67%
64%
58%
48%
71%
64%
62%
49%
49%
61%
65%
73%
56%
64%
0% 80%
Difficult
Easy
FIND INFO ABOUT PSYCHOLOGICAL PROBLEMS
No
Yes
HAS RECEIVED TREATMENT
No
Yes
HAS RECEIVED A TREATMENT
Retired
House persons
Unemployed
Self- employed
Other white collars
Manual workers
Managers
Students
RESPONDENTENTS OCCUPATION SCALE
4+
3
2
1
HOUSEHOLD COMPOSITION
Still Studying
20+
16-19
15
EDUCATION
55 +
40-54
25-39
15-24
AGE
Female
Male
SEX
Finally, a difference is also perceived between those who find that information about psychological problems is easily available and those who think that finding information is difficult. 63% of those who find gaining information to be easy indicate that they have never experienced negative effects on social activities caused by mental or physical health problems whereas this is the case for 52% of those who have difficulties in finding information about psychological problems.
Special EUROBAROMETER 248 “MENTAL WELL-BEING”
- 30 -
3 CARE AND TREATMENT SERVICES The third chapter describes first the extent to which respondents have sought help for psychological problems and in which professional groups they have trusted. Secondly, the extent to which Europeans say that they have received treatment for psychological or mental health problems over the previous year in the form of drugs, psychotherapy or hospital treatment is examined. Finally, the sources on which respondents are inclined to rely when they need support are portrayed. 3.1 Source of Professional Help
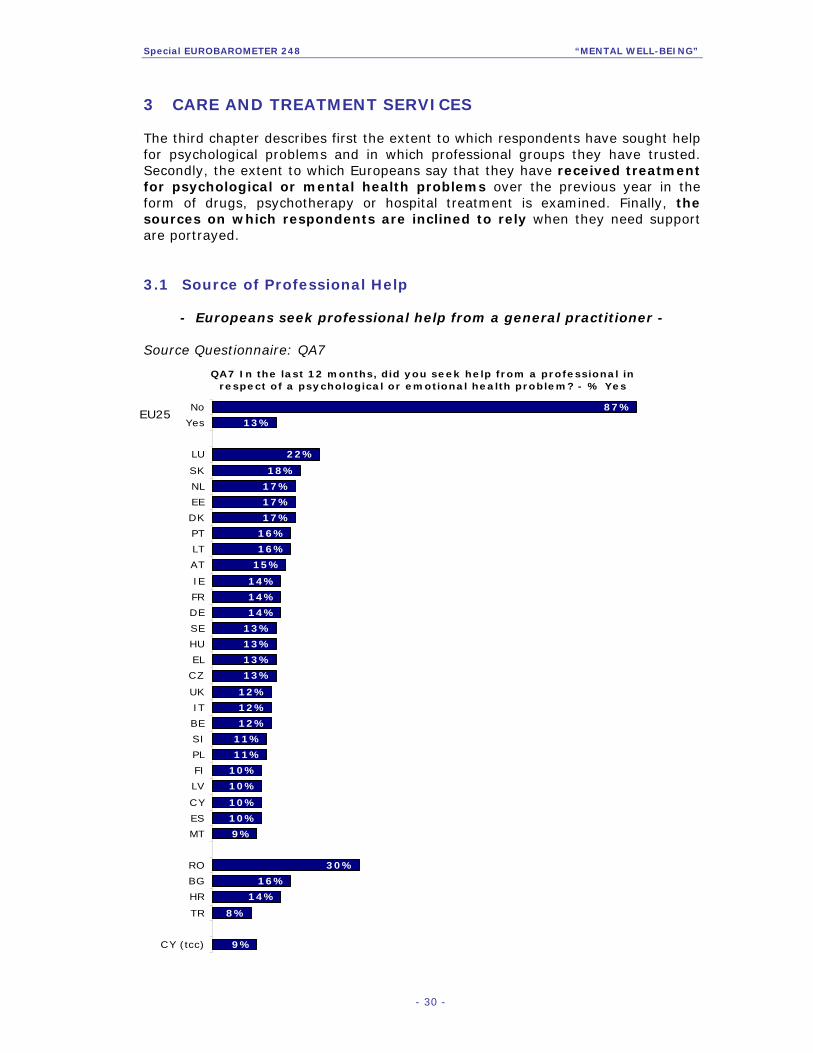
- Europeans seek professional help from a general practitioner - Source Questionnaire: QA7
QA7 In the last 12 months, did you seek help from a professional in respect of a psychological or emotional health problem? - % Yes
9%
8%
14%
16%
30%
9%
10%
10%
10%
10%
11%
11%
12%
12%
12%
13%
13%
13%
13%
14%
14%
14%
15%
16%
16%
17%
17%
17%
18%
22%
13%
87%
CY (tcc)
TR
HR
BG
RO
MT
ES
CY
LV
FI
PL
SI
BE
IT
UK
CZ
EL
HU
SE
DE
FR
IE
AT
LT
PT
DK
EE
NL
SK
LU
Yes
NoEU25

Special EUROBAROMETER 248 “MENTAL WELL-BEING”
- 31 -
In the 12 months prior the interview, 13% of EU citizens have sought help from a professional in respect of a psychological or emotional health problem. The vast majority, 87%, indicate that they have not looked for professional help over the last year. 30% of respondents in Romania state that they have sought professional help, followed by 22% of citizens of Luxembourg and 18% of Slovaks. In turn, 8% of Turks and 9% of the Maltese indicate that they have turned to a professional in respect of a psychological or emotional health problem.
QA7 In the last 12 months, did you seek help from a professional in respect of a psychological or emotional health problem? (IF YES)
Indicate who in the following list. - % EU25
2%
2%
4%
14%
13%
13%
12%
4%
4%
70%
DK
Yes, a psychoanalyst
Yes, a nurse
Yes, a social worker
Yes, a psychotherapist not mentioned previously
Yes, a pharmacist
Yes, a psychiatrist
Yes, another health professional
Yes, a psychologist
Yes, a general practitioner
N.B. The figures in this graph are based on 3205 (13% of the total population) respondents that have sought help from a professional in the last 12 months.
Out of the 13% of respondents who have sought professional help, the vast majority, 70%, has discussed their psychological or emotional health problems with a general practitioner. 14% of respondents indicate that they have sought help from a psychologist and 13% from another health professional or from a psychiatrist. Only a minor share has turned to another psychotherapist (4%), a social worker (4%), a nurse (4%) or a psychoanalyst (2%).

Special EUROBAROMETER 248 “MENTAL WELL-BEING”
- 32 -
QA7 In the last 12 months, did you seek help from a professional in respect of a psychological or emotional health problem? (IF YES)
Indicate who in the following list. - % Yes, general practioner
35%
48%
71%
75%
87%
38%
45%
48%
56%
57%
59%
64%
64%
66%
66%
68%
68%
69%
71%
71%
74%
76%
76%
77%
77%
80%
80%
82%
87%
91%
0% 50% 100%
CY (tcc)
TR
RO
HR
BG
CY
NL
FI
SE
ES
EL
CZ
HU
BE
FR
PL
PT
MT
IT
LT
LV
DK
EE
LU
SK
DE
AT
UK
SI
IE
N.B. Figures in this graph are based on the share of respondents in each country that have soughthelp from a professional in the last 12 months.
At the country level, it can be noted that in each country a large share of those who have sought psychological help from a professional has turned to a general practitioner. This is especially the case in Ireland (91%), Slovenia (87%) and the United Kingdom (82%). On the other hand, less than half the citizens of Cyprus (38%), the Netherlands (45%), Finland (48%) and Turkey (48%) have sought help from this source.
Special EUROBAROMETER 248 “MENTAL WELL-BEING”
- 33 -
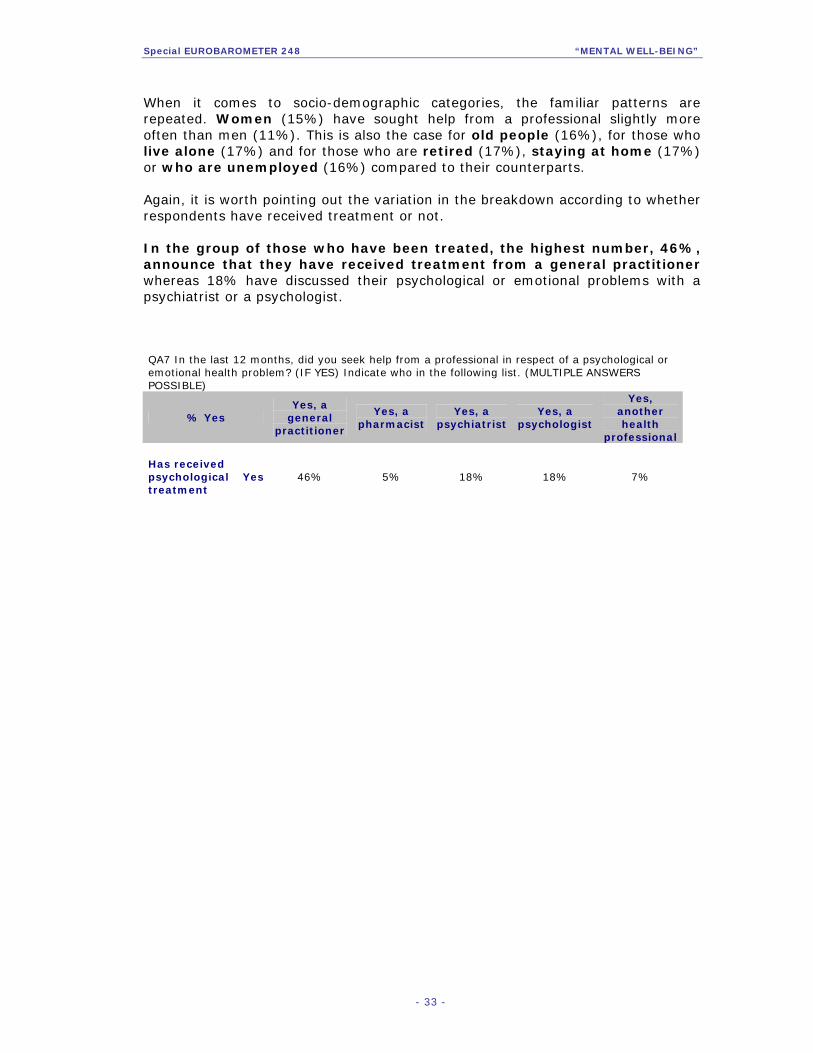
When it comes to socio-demographic categories, the familiar patterns are repeated. Women (15%) have sought help from a professional slightly more often than men (11%). This is also the case for old people (16%), for those who live alone (17%) and for those who are retired (17%), staying at home (17%) or who are unemployed (16%) compared to their counterparts. Again, it is worth pointing out the variation in the breakdown according to whether respondents have received treatment or not. In the group of those who have been treated, the highest number, 46%, announce that they have received treatment from a general practitioner whereas 18% have discussed their psychological or emotional problems with a psychiatrist or a psychologist. QA7 In the last 12 months, did you seek help from a professional in respect of a psychological or emotional health problem? (IF YES) Indicate who in the following list. (MULTIPLE ANSWERS POSSIBLE)
% Yes Yes, a
general practitioner
Yes, a pharmacist
Yes, a psychiatrist
Yes, a psychologist
Yes, another health
professional Has received psychological treatment
Yes 46% 5% 18% 18% 7%
Special EUROBAROMETER 248 “MENTAL WELL-BEING”
- 34 -
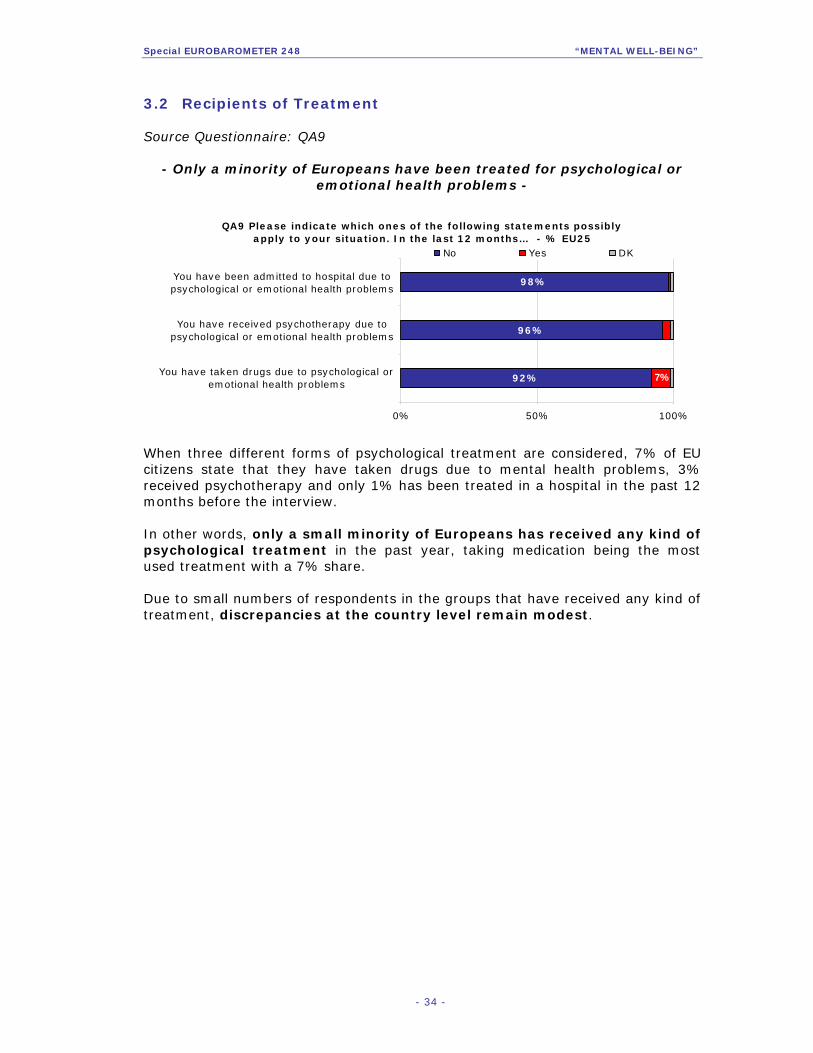
3.2 Recipients of Treatment Source Questionnaire: QA9
- Only a minority of Europeans have been treated for psychological or emotional health problems -
QA9 Please indicate which ones of the following statements possibly apply to your situation. In the last 12 months… - % EU25
92%
96%
98%
7%
0% 50% 100%
You have taken drugs due to psychological oremotional health problems
You have received psychotherapy due topsychological or emotional health problems
You have been admitted to hospital due topsychological or emotional health problems
No Yes DK
When three different forms of psychological treatment are considered, 7% of EU citizens state that they have taken drugs due to mental health problems, 3% received psychotherapy and only 1% has been treated in a hospital in the past 12 months before the interview. In other words, only a small minority of Europeans has received any kind of psychological treatment in the past year, taking medication being the most used treatment with a 7% share. Due to small numbers of respondents in the groups that have received any kind of treatment, discrepancies at the country level remain modest.

Special EUROBAROMETER 248 “MENTAL WELL-BEING”
- 35 -
QA9 Please indicate which ones of the following statements possibly apply to your situation. In the last 12 months…
% Yes
You have taken drugs due to
psychological or emotional health
problems
% Yes
You have received psychotherapy due to psychological or emotional health
problems
% Yes
You have been admitted to
hospital due to psychological or emotional health
problems
LT 11% NL 7% BE 5%
EE 10% ES 5% ES 2%
LU 10% FR 5% FR 2%
AT 10% PT 5% LV 2%
PT 10% FI 5% LT 2%
FR 9% SE 5% LU 2%
LV 9% BE 4% HU 2%
HU 9% DK 4% AT 2%
BE 8% HU 4% UK 2%
NL 8% PL 4% EU25 1%
PL 8% EU25 3% CZ 1%
UK 8% IE 3% DK 1%
EU25 7% CY 3% DE 1%
DK 7% LV 3% EE 1%
DE 7% LT 3% EL 1%
FI 7% LU 3% IE 1%
SE 7% MT 3% IT 1%
CZ 6% AT 3% CY 1%
ES 6% SI 3% MT 1%
IE 6% SK 3% NL 1%
SI 6% UK 3% PL 1%
SK 6% CZ 2% PT 1%
IT 5% DE 2% SK 1%
MT 5% EE 2% FI 1%
EL 4% EL 2% SI 0%
CY 2% IT 2% SE 0%
HR 9% TR 5% TR 3%
TR 9% HR 4% HR 2%
BG 6% BG 2% BG 1%
RO 5% RO 1% RO 1%
CY (tcc) 6% CY (tcc) 5% CY (tcc) 2%
Lithuanians (11%) indicate most often that they have used medication for psychological or emotional health problems, followed by 10% of Estonian, Luxembourgish, Austrian and Portuguese respondents. Only 2% of Cypriots state that they have taken drugs in the past 12 months. 7% of respondents in the Netherlands declare that they have received psychotherapy over the last 12 months, while this is the case for only 1% of Romanian citizens. Finally, 5% of Belgians have been admitted to hospital because of mental health problems.
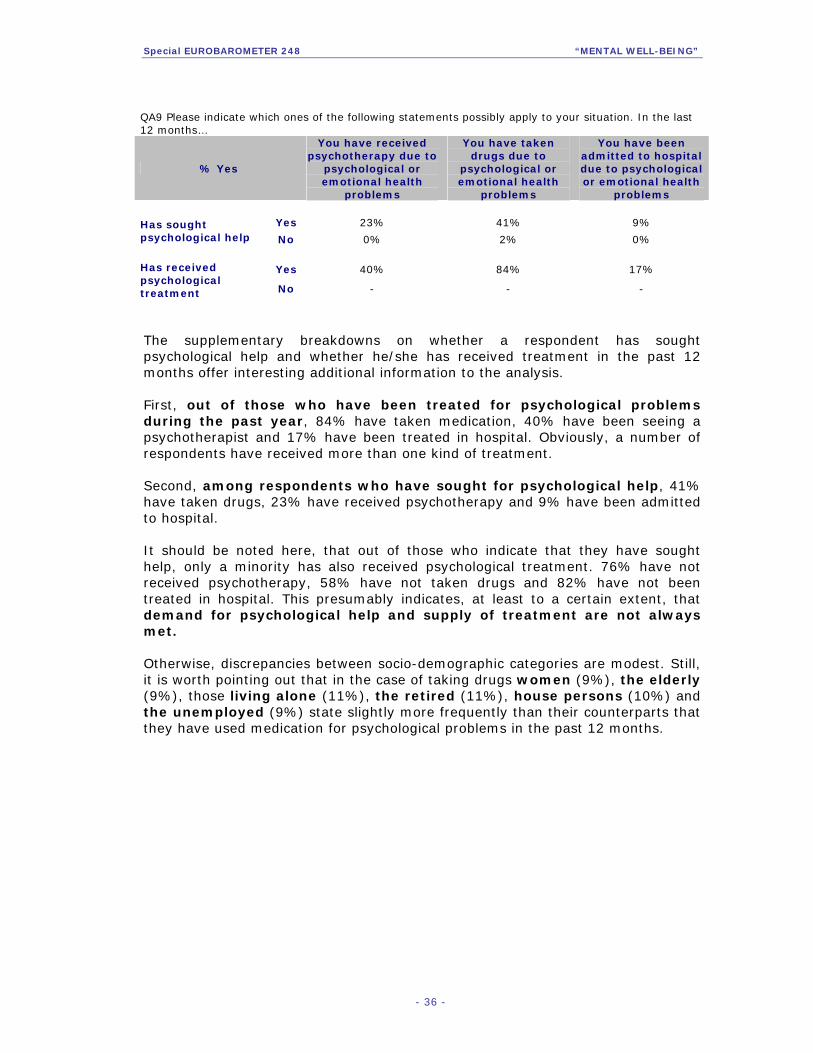
Special EUROBAROMETER 248 “MENTAL WELL-BEING”
- 36 -
QA9 Please indicate which ones of the following statements possibly apply to your situation. In the last 12 months…
% Yes
You have received psychotherapy due to
psychological or emotional health
problems
You have taken drugs due to
psychological or emotional health
problems
You have been admitted to hospital due to psychological or emotional health
problems
Yes 23% 41% 9% Has sought psychological help No 0% 2% 0%
Yes 40% 84% 17% Has received psychological treatment No - - -
The supplementary breakdowns on whether a respondent has sought psychological help and whether he/she has received treatment in the past 12 months offer interesting additional information to the analysis. First, out of those who have been treated for psychological problems during the past year, 84% have taken medication, 40% have been seeing a psychotherapist and 17% have been treated in hospital. Obviously, a number of respondents have received more than one kind of treatment. Second, among respondents who have sought for psychological help, 41% have taken drugs, 23% have received psychotherapy and 9% have been admitted to hospital. It should be noted here, that out of those who indicate that they have sought help, only a minority has also received psychological treatment. 76% have not received psychotherapy, 58% have not taken drugs and 82% have not been treated in hospital. This presumably indicates, at least to a certain extent, that demand for psychological help and supply of treatment are not always met. Otherwise, discrepancies between socio-demographic categories are modest. Still, it is worth pointing out that in the case of taking drugs women (9%), the elderly (9%), those living alone (11%), the retired (11%), house persons (10%) and the unemployed (9%) state slightly more frequently than their counterparts that they have used medication for psychological problems in the past 12 months.
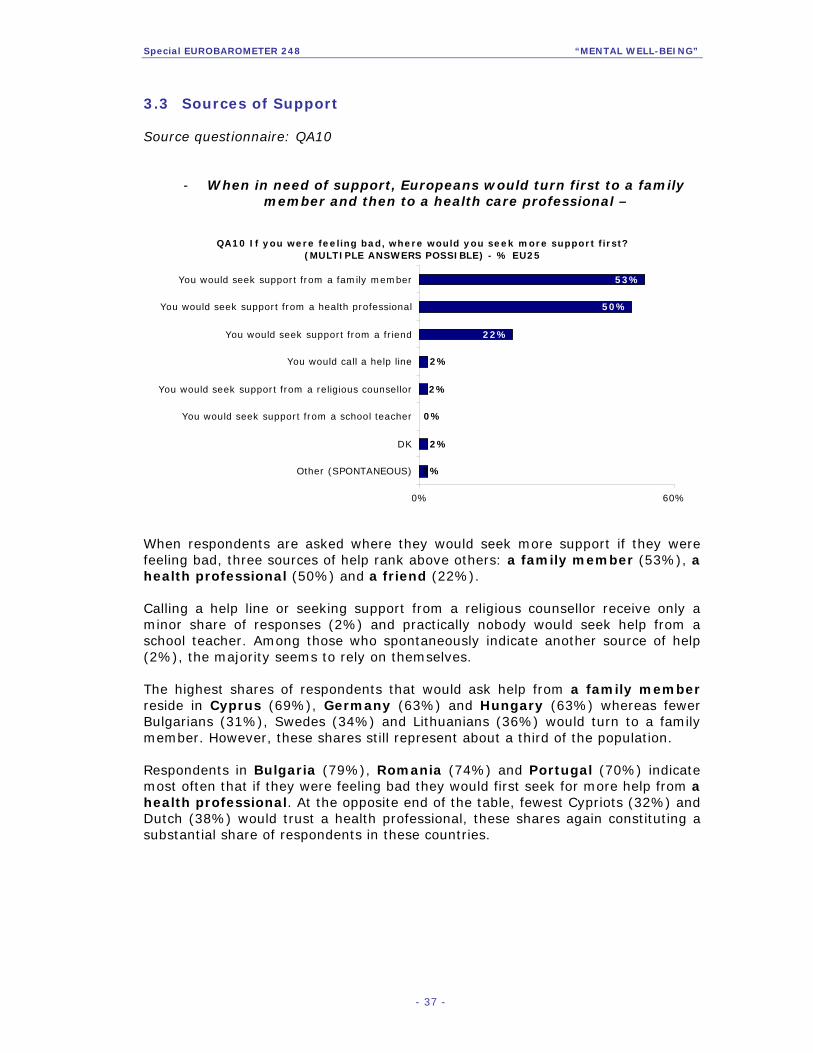
Special EUROBAROMETER 248 “MENTAL WELL-BEING”
- 37 -
3.3 Sources of Support Source questionnaire: QA10
- When in need of support, Europeans would turn first to a family member and then to a health care professional –
QA10 If you were feeling bad, where would you seek more support first? (MULTIPLE ANSWERS POSSIBLE) - % EU25
22%
50%
53%
2%
2%
0%
2%
2%
0% 60%
Other (SPONTANEOUS)
DK
You would seek support from a school teacher
You would seek support from a religious counsellor
You would call a help line
You would seek support from a friend
You would seek support from a health professional
You would seek support from a family member
When respondents are asked where they would seek more support if they were feeling bad, three sources of help rank above others: a family member (53%), a health professional (50%) and a friend (22%). Calling a help line or seeking support from a religious counsellor receive only a minor share of responses (2%) and practically nobody would seek help from a school teacher. Among those who spontaneously indicate another source of help (2%), the majority seems to rely on themselves. The highest shares of respondents that would ask help from a family member reside in Cyprus (69%), Germany (63%) and Hungary (63%) whereas fewer Bulgarians (31%), Swedes (34%) and Lithuanians (36%) would turn to a family member. However, these shares still represent about a third of the population. Respondents in Bulgaria (79%), Romania (74%) and Portugal (70%) indicate most often that if they were feeling bad they would first seek for more help from a health professional. At the opposite end of the table, fewest Cypriots (32%) and Dutch (38%) would trust a health professional, these shares again constituting a substantial share of respondents in these countries.
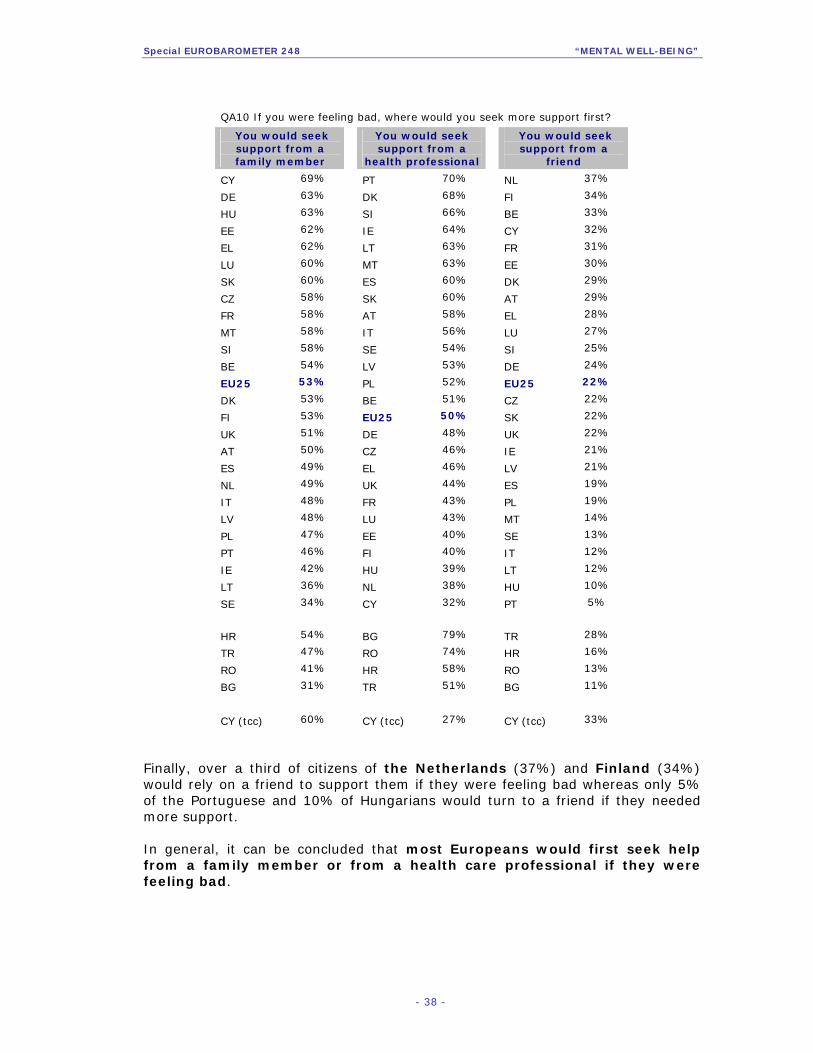
Special EUROBAROMETER 248 “MENTAL WELL-BEING”
- 38 -
QA10 If you were feeling bad, where would you seek more support first?
You would seek support from a family member
You would seek support from a
health professional
You would seek support from a
friend
CY 69% PT 70% NL 37%
DE 63% DK 68% FI 34%
HU 63% SI 66% BE 33%
EE 62% IE 64% CY 32%
EL 62% LT 63% FR 31%
LU 60% MT 63% EE 30%
SK 60% ES 60% DK 29%
CZ 58% SK 60% AT 29%
FR 58% AT 58% EL 28%
MT 58% IT 56% LU 27%
SI 58% SE 54% SI 25%
BE 54% LV 53% DE 24%
EU25 53% PL 52% EU25 22%
DK 53% BE 51% CZ 22%
FI 53% EU25 50% SK 22%
UK 51% DE 48% UK 22%
AT 50% CZ 46% IE 21%
ES 49% EL 46% LV 21%
NL 49% UK 44% ES 19%
IT 48% FR 43% PL 19%
LV 48% LU 43% MT 14%
PL 47% EE 40% SE 13%
PT 46% FI 40% IT 12%
IE 42% HU 39% LT 12%
LT 36% NL 38% HU 10%
SE 34% CY 32% PT 5%
HR 54% BG 79% TR 28%
TR 47% RO 74% HR 16%
RO 41% HR 58% RO 13%
BG 31% TR 51% BG 11%
CY (tcc) 60% CY (tcc) 27% CY (tcc) 33%
Finally, over a third of citizens of the Netherlands (37%) and Finland (34%) would rely on a friend to support them if they were feeling bad whereas only 5% of the Portuguese and 10% of Hungarians would turn to a friend if they needed more support. In general, it can be concluded that most Europeans would first seek help from a family member or from a health care professional if they were feeling bad.
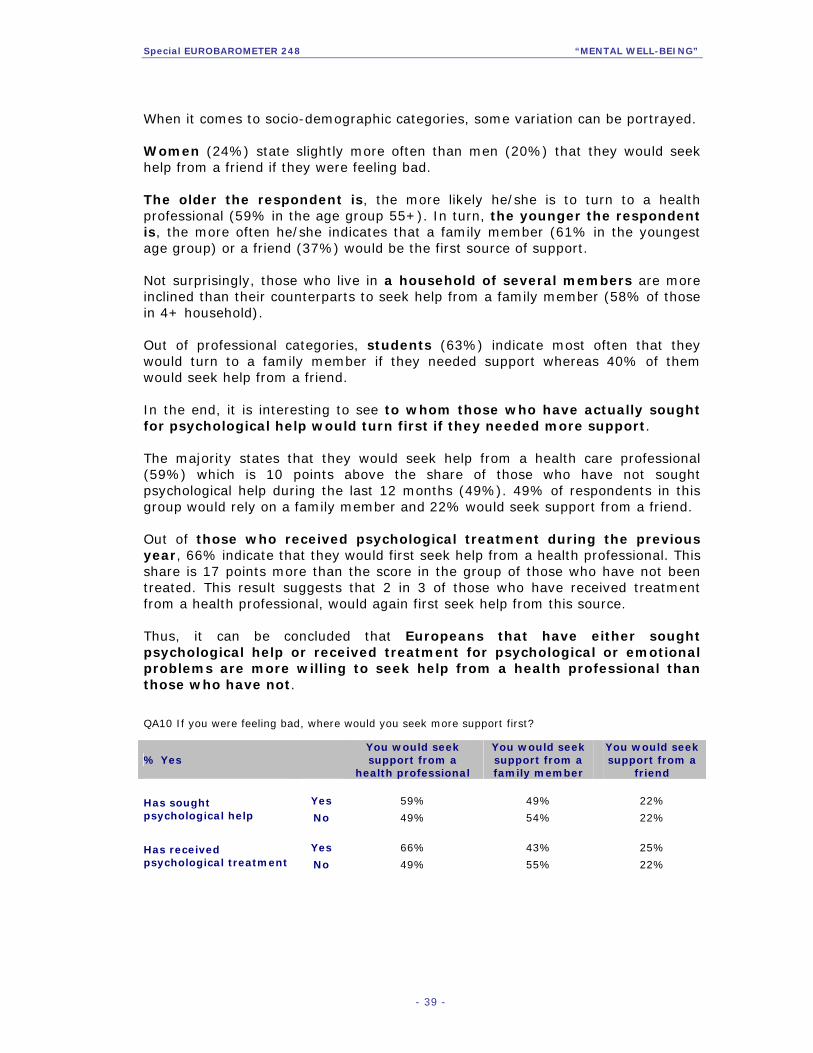
Special EUROBAROMETER 248 “MENTAL WELL-BEING”
- 39 -
When it comes to socio-demographic categories, some variation can be portrayed. Women (24%) state slightly more often than men (20%) that they would seek help from a friend if they were feeling bad. The older the respondent is, the more likely he/she is to turn to a health professional (59% in the age group 55+). In turn, the younger the respondent is, the more often he/she indicates that a family member (61% in the youngest age group) or a friend (37%) would be the first source of support. Not surprisingly, those who live in a household of several members are more inclined than their counterparts to seek help from a family member (58% of those in 4+ household). Out of professional categories, students (63%) indicate most often that they would turn to a family member if they needed support whereas 40% of them would seek help from a friend. In the end, it is interesting to see to whom those who have actually sought for psychological help would turn first if they needed more support. The majority states that they would seek help from a health care professional (59%) which is 10 points above the share of those who have not sought psychological help during the last 12 months (49%). 49% of respondents in this group would rely on a family member and 22% would seek support from a friend. Out of those who received psychological treatment during the previous year, 66% indicate that they would first seek help from a health professional. This share is 17 points more than the score in the group of those who have not been treated. This result suggests that 2 in 3 of those who have received treatment from a health professional, would again first seek help from this source. Thus, it can be concluded that Europeans that have either sought psychological help or received treatment for psychological or emotional problems are more willing to seek help from a health professional than those who have not.
QA10 If you were feeling bad, where would you seek more support first?
% Yes You would seek support from a
health professional
You would seek support from a family member
You would seek support from a
friend
Yes 59% 49% 22% Has sought psychological help No 49% 54% 22%
Yes 66% 43% 25% Has received psychological treatment No 49% 55% 22%

Special EUROBAROMETER 248 “MENTAL WELL-BEING”
- 40 -
4 AVAILABILITY OF INFORMATION
- Just about half of Europeans think it is easy to find information about psychological or emotional health problems –
Source Questionnaire: QA11
QA11 How easy or difficult do you find it is to find information on psychological or emotional health problems and how to deal
with them?
19%
27%
30%
40%
44%
10%
12%
15%
15%
16%
19%
21%
22%
24%
24%
24%
27%
29%
28%
29%
29%
29%
30%
31%
32%
32%
35%
35%
39%
41%
46%
57%
34%
33%
46%
43%
66%
54%
75%
63%
61%
58%
44%
47%
53%
49%
66%
58%
55%
55%
64%
57%
57%
64%
38%
56%
50%
43%
37%
50%
40%
46%
25%
39%
37%
15%
13%
23%
34%
10%
22%
23%
24%
35%
31%
23%
27%
10%
15%
17%
17%
6%
14%
15%
6%
31%
13%
19%
22%
28%
11%
19%
8%
0% 50% 100%
CY (tcc)
RO
BG
HR
TR
NL
DK
CY
UK
IE
M T
SE
EE
LV
LT
FI
ES
EU25
PL
BE
CZ
SI
EL
HU
DE
FR
LU
AT
IT
PT
SK
Difficult Easy DK

Special EUROBAROMETER 248 “MENTAL WELL-BEING”
- 41 -
55% of EU citizens maintain that finding information on psychological or emotional health problems and how to deal with them is easy. 14% evaluate that finding information is very easy whereas 41% think it is fairly easy. Nevertheless, a substantial share of Europeans, 29%, consider that finding information on psychological health problems is difficult, 6% rating this as very difficult. It should be noted here, that the share of non-responses reaches 17%. This result could imply that a bit less than 1 in 5 Europeans has never considered finding information on mental health issues. Slovakians (46%), Turks (44%) and the Portuguese (41%) indicate most often that finding information about mental problems is difficult. In addition, in these countries the group of respondents who consider finding information to be difficult outnumbers those who find acquiring information to be easy. Citizens of Cyprus (75%), Finland (66%), the Netherlands (66%) and Greece (64%) are most confident in finding information about psychological or emotional problems and how to deal with them. As was already observed at the EU level, high shares of non-responses are perceived in several countries, this being especially the case in Romania (39%), Bulgaria (37%), Sweden (35%) and Denmark (34%). This could imply that in many countries respondents do not feel that this question is applicable to their situation.
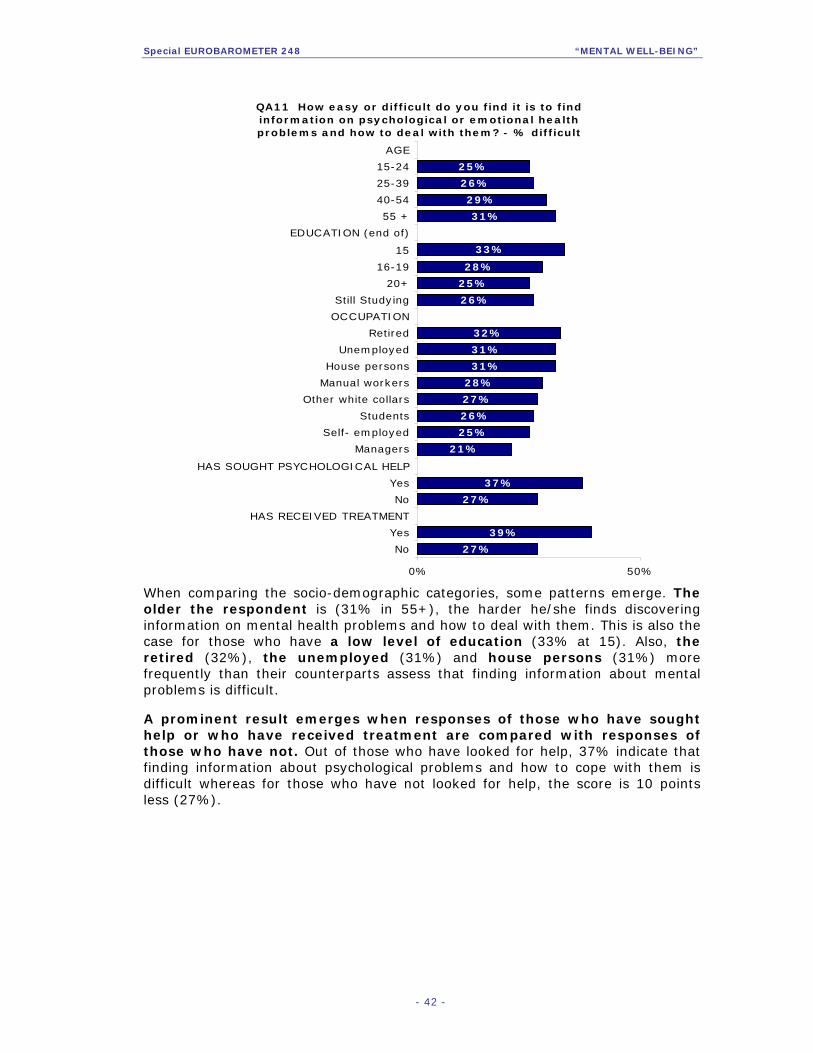
Special EUROBAROMETER 248 “MENTAL WELL-BEING”
- 42 -
QA11 How easy or difficult do you find it is to find information on psychological or emotional health problems and how to deal with them? - % difficult
27%
39%
27%
37%
21%
25%
26%
27%
28%
31%
31%
32%
26%
25%
28%
33%
31%
29%
26%
25%
0% 50%
No
Yes
HAS RECEIVED TREATMENT
No
Yes
HAS SOUGHT PSYCHOLOGICAL HELP
Managers
Self- employed
Students
Other white collars
Manual workers
House persons
Unemployed
Retired
OCCUPATION
Still Studying
20+
16-19
15
EDUCATION (end of)
55 +
40-54
25-39
15-24
AGE
When comparing the socio-demographic categories, some patterns emerge. The older the respondent is (31% in 55+), the harder he/she finds discovering information on mental health problems and how to deal with them. This is also the case for those who have a low level of education (33% at 15). Also, the retired (32%), the unemployed (31%) and house persons (31%) more frequently than their counterparts assess that finding information about mental problems is difficult. A prominent result emerges when responses of those who have sought help or who have received treatment are compared with responses of those who have not. Out of those who have looked for help, 37% indicate that finding information about psychological problems and how to cope with them is difficult whereas for those who have not looked for help, the score is 10 points less (27%).
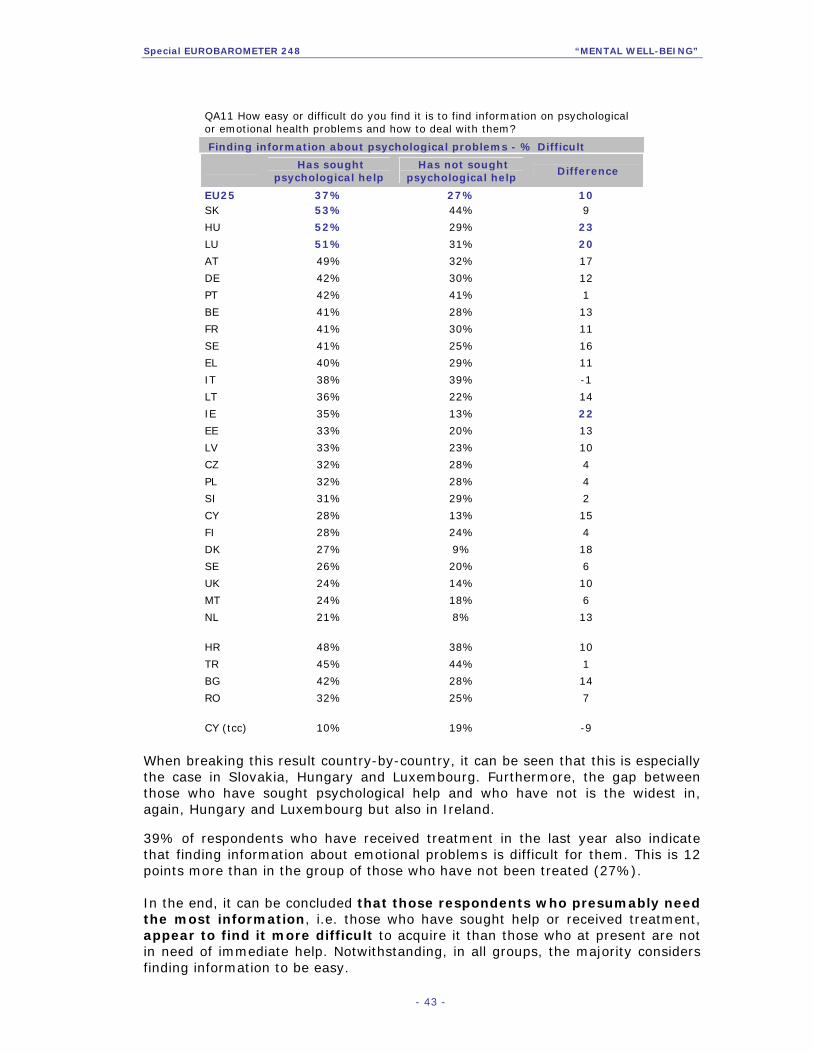
Special EUROBAROMETER 248 “MENTAL WELL-BEING”
- 43 -
QA11 How easy or difficult do you find it is to find information on psychological or emotional health problems and how to deal with them?
Finding information about psychological problems - % Difficult
Has sought psychological help
Has not sought psychological help
Difference
EU25 37% 27% 10 SK 53% 44% 9
HU 52% 29% 23
LU 51% 31% 20
AT 49% 32% 17
DE 42% 30% 12
PT 42% 41% 1
BE 41% 28% 13
FR 41% 30% 11
SE 41% 25% 16
EL 40% 29% 11
IT 38% 39% -1
LT 36% 22% 14
IE 35% 13% 22
EE 33% 20% 13
LV 33% 23% 10
CZ 32% 28% 4
PL 32% 28% 4
SI 31% 29% 2
CY 28% 13% 15
FI 28% 24% 4
DK 27% 9% 18
SE 26% 20% 6
UK 24% 14% 10
MT 24% 18% 6
NL 21% 8% 13 HR 48% 38% 10
TR 45% 44% 1
BG 42% 28% 14
RO 32% 25% 7 CY (tcc) 10% 19% -9
When breaking this result country-by-country, it can be seen that this is especially the case in Slovakia, Hungary and Luxembourg. Furthermore, the gap between those who have sought psychological help and who have not is the widest in, again, Hungary and Luxembourg but also in Ireland. 39% of respondents who have received treatment in the last year also indicate that finding information about emotional problems is difficult for them. This is 12 points more than in the group of those who have not been treated (27%). In the end, it can be concluded that those respondents who presumably need the most information, i.e. those who have sought help or received treatment, appear to find it more difficult to acquire it than those who at present are not in need of immediate help. Notwithstanding, in all groups, the majority considers finding information to be easy.
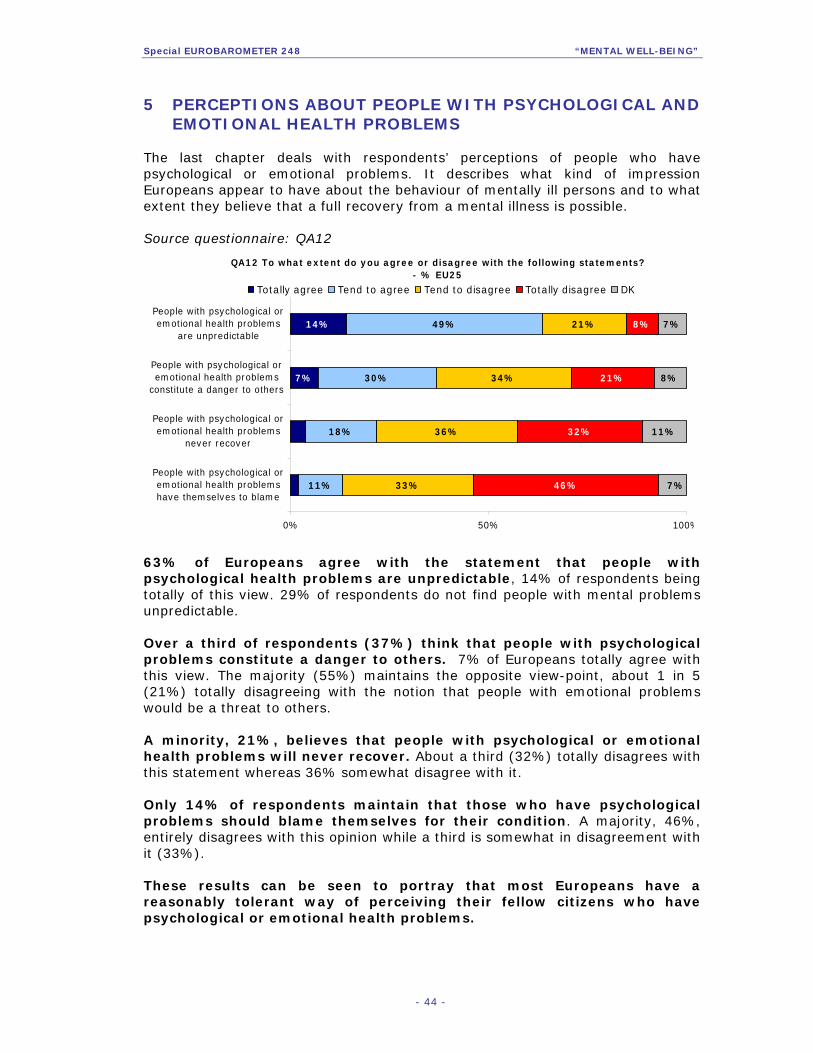
Special EUROBAROMETER 248 “MENTAL WELL-BEING”
- 44 -
5 PERCEPTIONS ABOUT PEOPLE WITH PSYCHOLOGICAL AND EMOTIONAL HEALTH PROBLEMS
The last chapter deals with respondents’ perceptions of people who have psychological or emotional problems. It describes what kind of impression Europeans appear to have about the behaviour of mentally ill persons and to what extent they believe that a full recovery from a mental illness is possible. Source questionnaire: QA12
63% of Europeans agree with the statement that people with psychological health problems are unpredictable, 14% of respondents being totally of this view. 29% of respondents do not find people with mental problems unpredictable. Over a third of respondents (37%) think that people with psychological problems constitute a danger to others. 7% of Europeans totally agree with this view. The majority (55%) maintains the opposite view-point, about 1 in 5 (21%) totally disagreeing with the notion that people with emotional problems would be a threat to others. A minority, 21%, believes that people with psychological or emotional health problems will never recover. About a third (32%) totally disagrees with this statement whereas 36% somewhat disagree with it. Only 14% of respondents maintain that those who have psychological problems should blame themselves for their condition. A majority, 46%, entirely disagrees with this opinion while a third is somewhat in disagreement with it (33%). These results can be seen to portray that most Europeans have a reasonably tolerant way of perceiving their fellow citizens who have psychological or emotional health problems.
QA12 To what extent do you agree or disagree with the following statements? - % EU25
14%
18%
30%
49%
33%
36%
34%
21%
46%
32%
21%7%
11%
8%
7%
11%
8%
7%
0% 50% 100%
People with psychological oremotional health problemshave themselves to blame
People with psychological oremotional health problems
never recover
People with psychological oremotional health problems
constitute a danger to others
People with psychological oremotional health problems
are unpredictable
Totally agree Tend to agree Tend to disagree Totally disagree DK

Special EUROBAROMETER 248 “MENTAL WELL-BEING”
- 45 -
QA12 To what extent do you agree or disagree with the following statements?
% Agree
People with psychological or emotional health problems are unpredictable
% Agree
People with psychological or
emotional health problems
constitute a danger to
others
% Agree
People with psychological or emotional
health problems
never recover
% Agree
People with psychological or emotional
health problems have themselves to
blame
EL 77% LT 68% IT 31% IT 28%
CZ 76% LV 63% DE 29% LV 28%
EE 76% EE 60% LV 27% EE 24%
CY 76% SE 55% CZ 25% CY 24%
LV 76% MT 50% LT 25% LT 24%
LT 76% PL 50% EL 24% PL 22%
IT 75% IT 49% SI 24% CZ 21%
PL 74% CZ 48% CY 23% EL 21%
FR 73% DK 44% BE 22% SI 16%
SE 72% EL 42% EE 22% LU 15%
SK 70% SK 41% SK 22% EU25 14%
PT 69% PT 38% EU25 21% HU 14%
SI 68% UK 38% AT 21% SK 14%
UK 68% EU25 37% PL 21% AT 12%
BE 67% CY 37% PT 21% BE 11%
EU25 63% SI 35% DK 18% DE 11%
NL 59% FR 33% ES 17% FI 11%
IE 58% BE 32% FR 17% PT 10%
ES 55% FI 31% SE 17% UK 10%
FI 55% AT 29% HU 16% FR 9%
DK 54% LU 28% LU 15% MT 9%
LU 52% DE 27% MT 13% ES 7%
MT 48% ES 27% NL 13% DK 6%
HU 47% HU 27% UK 12% IE 6%
DE 42% IE 25% IE 10% NL 6%
AT 39% NL 25% FI 10% SE 6%
HR 72% BG 49% HR 37% TR 29%
RO 65% HR 45% BG 21% HR 23%
BG 64% TR 45% RO 20% RO 14%
TR 53% RO 43% TR 12% BG 10%
CY (tcc) 47% CY (tcc) 39% CY (tcc) 7% CY (tcc) 23%
Out of the 29 countries polled, in 27 those who believe that people with psychological problems are unpredictable outnumber those who think the opposite. This is especially the case in Greece (77%), the Czech Republic, Estonia, Cyprus, Latvia and Lithuania (76% each). The two exceptions where the majority disagrees with this view are Austria and Germany (51% disagreeing in each). When it comes to whether people with mental difficulties constitute a danger to others, the majority of respondents in 7 countries believe this is the case. Lithuanians (68%), Latvians (68%) and Estonians (60%) indicate most frequently that in their opinion people with psychological problems pose a threat to others. Fewest respondents agreeing with this view are found in Ireland (25%), the Netherlands (25%) and Hungary (27%).
Special EUROBAROMETER 248 “MENTAL WELL-BEING”
- 46 -
In every country polled, a vast majority disagrees with the view that people with psychological or emotional health problems never recover. The highest share of citizens opposing this view is found in Finland (88% disagreeing), followed by the Turks (82%), the British (79%) and Swedes (78%). On the other hand, Italians (31% agreeing), Germans (29%) and Latvians (27%) are more often pessimistic about the idea of full recovery. Finally, only a slight minority in each country believes that people with psychological problems have only themselves to blame. The highest shares of respondents who are of this view reside in Italy (28%), Latvia (28%), Estonia, Cyprus and Lithuania (24%). On the contrary, 92% of Swedes, 91% of Dutch and 90% of Danes disagree with the idea that those who have problems with their mental heath should blame themselves. It can be observed that the same groups of countries appear both at the top and the bottom of the table. Generally speaking, it appears that Lithuanians, Latvians, Estonians and Italians are somewhat more likely to agree with the statements whereas respondents in Ireland, the Netherlands, Spain and Finland seem to rank lowest when it comes to each statement. When the socio-demographic characteristics are considered, the following remarks can be made despite moderate variation between the categories: Men, the young, those on the right of the political spectrum, self-employed and managers somewhat more often agree with the view that people with psychological or emotional health problems are unpredictable. When it comes to the statement that people with mental problems constitute a danger to others, men, the elderly, those who have a low level of education, those on the right of the political spectrum, the self-employed and the retired more frequently indicate that they agree with this view. Considering the view that people with psychological problems health never recover, the elderly, those who have a low education level and those on the right of the political spectrum slightly more often agree with this notion. The elderly, those with a low level of education, the retired and the self-employed state somewhat more often than their counterparts that people with psychological or emotional health problems will never recover.
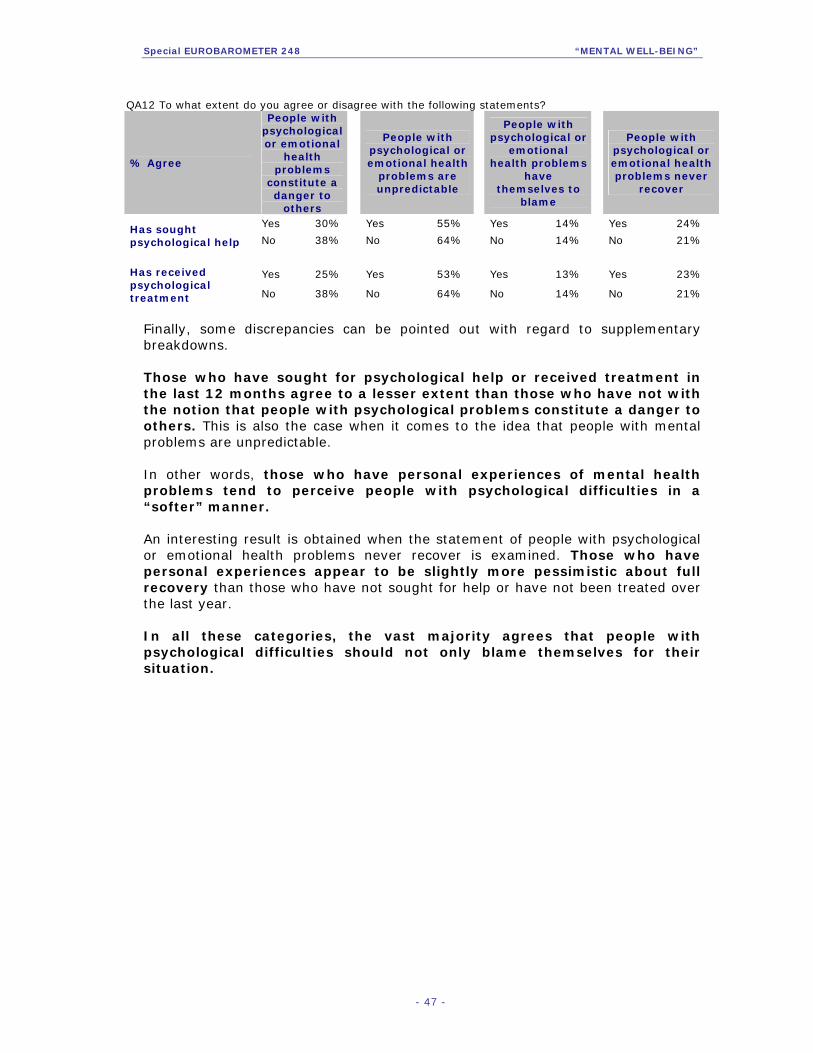
Special EUROBAROMETER 248 “MENTAL WELL-BEING”
- 47 -
QA12 To what extent do you agree or disagree with the following statements?
% Agree
People with psychological or emotional
health problems
constitute a danger to
others
People with psychological or emotional health
problems are unpredictable
People with psychological or
emotional health problems
have themselves to
blame
People with psychological or emotional health problems never
recover
Yes 30% Yes 55% Yes 14% Yes 24% Has sought psychological help No 38% No 64% No 14% No 21%
Yes 25% Yes 53% Yes 13% Yes 23% Has received psychological treatment No 38% No 64% No 14% No 21%
Finally, some discrepancies can be pointed out with regard to supplementary breakdowns. Those who have sought for psychological help or received treatment in the last 12 months agree to a lesser extent than those who have not with the notion that people with psychological problems constitute a danger to others. This is also the case when it comes to the idea that people with mental problems are unpredictable. In other words, those who have personal experiences of mental health problems tend to perceive people with psychological difficulties in a “softer” manner. An interesting result is obtained when the statement of people with psychological or emotional health problems never recover is examined. Those who have personal experiences appear to be slightly more pessimistic about full recovery than those who have not sought for help or have not been treated over the last year. In all these categories, the vast majority agrees that people with psychological difficulties should not only blame themselves for their situation.

Special EUROBAROMETER 248 “MENTAL WELL-BEING”
- 48 -
CONCLUSION THE PRESENT SITUATION Generally speaking, the state of health of Europeans appears to be good. Most Europeans (over 70%) indicate that their health does not limit them from doing moderate physical activities such as carrying shopping bags or climbing several flights of stairs. These results are in parallel, even if not directly comparable, with those obtained in the previous Eurobarometer survey “The Health of Adults in the European Union” carried out in autumn 2002, in which 73% of EU citizens indicated that they have not been restricted in doing certain activities because of health problems for the past 6 months7. When it comes to mental well-being, a significant majority of Europeans have experienced positive and balanced feelings rather than negative feelings in the 4 weeks prior to the survey. 64% have felt full of life all the time or most of the time and 55% have had a lot of energy, the feelings related to the energy/vitality dimension. Regarding the mental health dimension, 65% have been happy and 63% have felt calm and peaceful. However, a substantial share indicates that they do not have lots of energy and they feel tired, the feelings related to energy/vitality dimension, at least sometimes.
No clear consistencies between the countries are observed. Nevertheless, it appears that citizens of the Netherlands and Finland have experienced more often positive feelings during the 4 weeks preceding the interview. Also, it can be said that Italians and respondents in the three Baltic States seem to indicate slightly less frequently positive emotions when the month before the interview is considered. A link between experienced physical and psychological health is observed here. Those who have not sought psychological help or received treatment for psychological problems state notably more often that their physical health does not limit them from doing moderate activities and they more frequently express positive feelings in the month prior to the interview. Moreover, the socio-demographic characteristics appear to be in parallel when it comes to both the limits of physical health and mental well-being over the month before the interview. Women, the elderly, the retired and house persons (the categories that are to some extent likely to overlap) more often evaluate the limitations of their physical health to be considerable as well as express negative sentiments about their mental well-being. This socio-demographic pattern seems to apply throughout the results of this survey.
7 Special Eurobarometer 183-7 The Health of Adults in the European Union http://ec.europa.eu/public_opinion/archives/ebs/ebs_183.7_en.pdf

Special EUROBAROMETER 248 “MENTAL WELL-BEING”
- 49 -
PROBLEMS WITH WORK AND SOCIAL ACTIVITIES A strong connection appears between the state of mental health and the extent to which physical and psychological difficulties cause problems with working life or social activities even if respondents appear to evaluate that physical health problems are more often a cause of accomplishing less or problems with work than emotional problems. Over one in two of Europeans declares that their physical health has never led them to accomplish less (54%) or to do their usual activities less carefully (58%). 57% indicate that pain never interferes with their life. Men, the young, the well educated, students and mangers indicate more often these views than their counterparts. A higher number of respondents consider compared to physical health that emotional problems are never a cause of not completing as many things as they would like (61%) or achieving them with less care (64%). 12% state that they have not cut down on the amount of time spent at work as a result of emotional problems while 6% state the same when it comes to missing work days. 3 in 5 Europeans (60%) have never had problems with social activities such as visiting friends or relatives due to emotional problems. Nevertheless, those respondents who have either looked for psychological help or received psychological treatment significantly more often declare that they have difficulties with work and social activities as a result of either physical or psychological health problems. For example, a third of those who have experiences of seeking help or have been treated in the year prior to the interview, state that they never have a lower level of accomplishment due to their physical health where as this is the case for approximately 3 in 5 of those Europeans who have neither sought help or received treatment. Moreover, those who have received treatment during the last year outnumber by 50 points (64% against 14%) those who have not when it comes to accomplishing less than that wished due to emotional health problems. With regard to carrying out of usual activities less carefully or cutting down on the time spent on work, the difference between those who have received treatment and those who have not reaches 41 points (51% against 10%). In conclusion, mental ill health, when present, appears to have enormous negative effects on working life and social relations. CARE AND TREATMENT SERVICES 13% of respondents have sought psychological help over the last 12 months. This is especially the case in Romania (30%) and Luxembourg (22%). Out of those who have turned to a professional in need of psychological help, 70% have discussed their problems with a general practitioner. In the group of those who have been treated, the highest number, 46%, announce that they have received treatment from a general practitioner

Special EUROBAROMETER 248 “MENTAL WELL-BEING”
- 50 -
whereas 18% have discussed their psychological or emotional problems with a psychiatrist or a psychologist. Only a minority of EU citizens has been treated for psychological or emotional problems by medication (7%), in psychotherapy (3%) or in hospital (1%). Out of those who have been treated for psychological problems during the past year, 84% have taken medication, 40% have been seeing a psychotherapist and 17% have been treated in hospital. Among respondents who have sought psychological help, 41% have taken drugs, 23% have received psychotherapy and 9% have been admitted to hospital. It should be noted here, that out of those who indicate that they have sought help, only a minority has also received psychological treatment. 76% have not received psychotherapy, 58% have not taken drugs and 82% have not been treated in hospital. This presumably indicates, at least to a certain extent, that demand for psychological help and supply of treatment do not always go together. When Europeans are feeling bad they would turn to a family member (53%) or a health professional (50%). About a quarter seek more support from a friend (22%). AVAILABILITY OF INFORMATION 55% of EU citizens maintain that finding information on psychological or emotional health problems and how to deal with them is easy. Nevertheless, a substantial share of Europeans, 29%, consider that finding information on psychological health problems is difficult. 17% of respondents do not give an answer to this question which may indicate that about 1 in 5 Europeans has never considered finding information on mental health issues. Slovakians (46%), Turks (44%) and the Portuguese (41%) indicate most often that finding information about mental problems is difficult while citizens of Cyprus (75%), Finland (66%), the Netherlands (66%) and Greece (64%) are most confident in finding information about psychological or emotional problems and how to deal with them. It can be noted that those respondents who presumably need the most information, i.e. those who have sought help, appear to find it more difficult to acquire it than those who at present are not in need of immediate help. This is especially the case in Slovakia, Hungary and Luxembourg. Notwithstanding, in every country and all socio-demographic groups, the majority considers finding information to be easy.
Special EUROBAROMETER 248 “MENTAL WELL-BEING”
- 51 -
PERCEPTIONS ABOUT PEOPLE WITH MENTAL HEALTH PROBLEMS In general, Europeans appear to have a reasonably tolerant way of perceiving their fellow citizens who have psychological or emotional health problems. However, the majority (63%) believes that people with mental health problems are unpredictable. Over a third of respondents (37%) think that people with psychological problems constitute a danger to others. A minority, 21%, believes that people with psychological or emotional health problems will never recover and only 14% of respondents maintain that those who have psychological problems should blame themselves for their condition. Those who have personal experiences of mental health problems tend to perceive people with psychological difficulties in a more empathetic way.

ANNEXES

Technical specifications
SPECIAL EUROBAROMETER N°248 “Mental Well-being”
TECHNICAL SPECIFICATIONS
Between the 7th of December 2005 and the 11st of January 2006, TNS Opinion & Social, a consortium created between Taylor Nelson Sofres and EOS Gallup Europe, carried out wave 64.4 of the EUROBAROMETER, on request of the EUROPEAN COMMISSION, Directorate-General Press and Communication, Opinion Polls. The SPECIAL EUROBAROMETER N°248 is part of wave 64.4 and covers the population of the respective nationalities of the European Union Member States, resident in each of the Member States and aged 15 years and over. The EUROBAROMETER 64.4 has also been conducted in the two acceding countries (Bulgaria and Romania) and in the two candidate countries (Croatia and Turkey) and in the Turkish Cypriot Community. In these countries, the survey covers the national population of citizens of the respective nationalities and the population of citizens of all the European Union Member States that are residents in those countries and have a sufficient command of one of the respective national language(s) to answer the questionnaire. The basic sample design applied in all states is a multi-stage, random (probability) one. In each country, a number of sampling points was drawn with probability proportional to population size (for a total coverage of the country) and to population density. In order to do so, the sampling points were drawn systematically from each of the "administrative regional units", after stratification by individual unit and type of area. They thus represent the whole territory of the countries surveyed according to the EUROSTAT NUTS II (or equivalent) and according to the distribution of the resident population of the respective nationalities in terms of metropolitan, urban and rural areas. In each of the selected sampling points, a starting address was drawn, at random. Further addresses (every Nth address) were selected by standard "random route" procedures, from the initial address. In each household, the respondent was drawn, at random (following the "closest birthday rule"). All interviews were conducted face-to-face in people's homes and in the appropriate national language. As far as the data capture is concerned, CAPI (Computer Assisted Personal Interview) was used in those countries where this technique was available.

For each country a comparison between the sample and the universe was carried out. The Universe description was derived from Eurostat population data or from national statistics offices. For all countries surveyed, a national weighting procedure, using marginal and intercellular weighting, was carried out based on this Universe description. In all countries, gender, age, region and size of locality were introduced in the iteration procedure. For international weighting (i.e. EU averages), TNS Opinion & Social applies the official population figures as provided by EUROSTAT or national statistic offices. The total population figures for input in this post-weighting procedure are listed above. Readers are reminded that survey results are estimations, the accuracy of which, everything being equal, rests upon the sample size and upon the observed percentage. With samples of about 1,000 interviews, the real percentages vary within the following confidence limits:
Observed percentages
10% or 90% 20% or 80% 30% or 70% 40% or 60% 50%
Confidence limits ± 1.9 points ± 2.5 points ± 2.7 points ± 3.0 points ± 3.1 points
ABREVIATIONS COUNTRIES INSTITUTES N°
INTERVIEWS FIELDWORK
DATES POPULATION15+
BE Belgium TNS Dimarso 1.011 13/12/2005 08/01/2006 8.598.982
CZ Czech Rep. TNS Aisa 1.012 09/12/2005 07/01/2006 8.571.710
DK Denmark TNS Gallup DK 1.039 09/12/2005 10/01/2006 4.380.063
DE Germany TNS Infratest 1.515 09/12/2005 23/12/2006 64.174.295
EE Estonia Emor 1.000 08/12/2005 07/01/2006 887.094
EL Greece TNS ICAP 999 09/12/2005 31/12/2005 8.674.230
ES Spain TNS Demoscopia 1.000 10/12/2005 07/01/2006 35.882.820
FR France TNS Sofres 1.031 09/12/2005 09/01/2006 44.010.619
IE Ireland TNS MRBI 1.000 07/12/2005 11/01/2006 3.089.775
IT Italy TNS Abacus 1.011 15/12/2005 11/01/2006 49.208.000
CY Rep. of Cyprus Synovate 507 08/12/2005 04/01/2006 552.213
LV Latvia TNS Latvia 1.046 10/12/2005 08/01/2006 1.394.351
LT Lithuania TNS Gallup Lithuania 1.022 15/12/2005 06/01/2006 2.803.661
LU Luxembourg TNS ILReS 500 08/12/2005 06/01/2006 367.199
HU Hungary TNS Hungary 1.010 16/12/2005 07/01/2006 8.503.379
MT Malta MISCO 500 07/12/2005 05/01/2006 322.917
NL Netherlands TNS NIPO 1.127 13/12/2005 09/01/2006 13.242.328
AT Austria Österreichisches Gallup-Institute 1.019 09/12/2005 04/01/2006 6.679.444
PL Poland TNS OBOP 1.000 11/12/2005 08/01/2006 31.610.437
PT Portugal TNS EUROTESTE 1.004 13/12/2005 06/01/2006 8.080.915
SI Slovenia RM PLUS 1.028 09/12/2005 08/01/2006 1.663.869
SK Slovakia TNS AISA SK 1.015 08/12/2005 22/12/2005 4.316.438
FI Finland TNS Gallup Oy 1.023 09/12/2005 09/01/2006 4.279.286
SE Sweden TNS GALLUP 1.009 08/12/2005 07/01/2006 7.376.680
UK United Kingdom TNS UK 1.310 08/12/2005 07/01/2006 47.685.578
BG Bulgaria TNS BBSS 1.002 16/12/2005 28/12/2005 6.695.512
HR Croatia Puls 1.000 09/12/2005 30/12/2005 3.682.826
RO Romania TNS CSOP 1.003 10/12/2005 07/01/2006 18.145.036
TR Turkey TNS PIAR 1.005 10/12/2005 04/01/2006 47.583.830
CY(tcc) Turkish Cypriot Comm. KADEM 500 13/12/2005 02/01/2006 157.101
TOTAL 29.248 07/12/2005 11/01/2006 442.620.588

Questionnaire
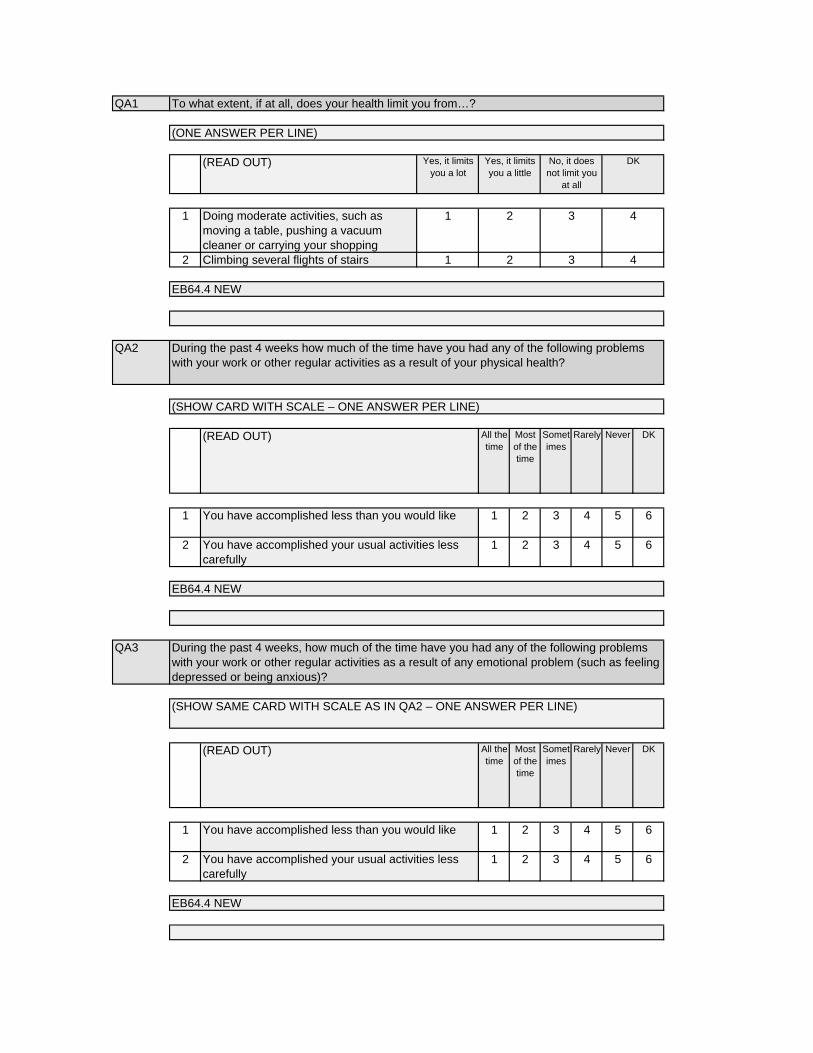
QA1
1
2
QA2
All the time
Most of the time
Sometimes
Rarely Never DK
1 1 2 3 4 5 6
2 1 2 3 4 5 6
QA3
All the time
Most of the time
Sometimes
Rarely Never DK
1 1 2 3 4 5 6
2 1 2 3 4 5 6
To what extent, if at all, does your health limit you from…?
(ONE ANSWER PER LINE)
(READ OUT) Yes, it limits you a lot
Yes, it limits you a little
No, it does not limit you
at all
DK
4
Climbing several flights of stairs 1 2 3 4
Doing moderate activities, such as moving a table, pushing a vacuum cleaner or carrying your shopping
1 2 3
EB64.4 NEW
You have accomplished less than you would like
You have accomplished your usual activities less carefully
During the past 4 weeks how much of the time have you had any of the following problems with your work or other regular activities as a result of your physical health?
EB64.4 NEW
(SHOW CARD WITH SCALE – ONE ANSWER PER LINE)
(READ OUT)
During the past 4 weeks, how much of the time have you had any of the following problems with your work or other regular activities as a result of any emotional problem (such as feeling depressed or being anxious)?
(SHOW SAME CARD WITH SCALE AS IN QA2 – ONE ANSWER PER LINE)
(READ OUT)
You have accomplished less than you would like
You have accomplished your usual activities less carefully
EB64.4 NEW

QA4
123456
QA5
All the time
Most of the time
Sometimes
Rarely Never DK
1 1 2 3 4 5 6
2 1 2 3 4 5 6
3 1 2 3 4 5 6
4 1 2 3 4 5 65 1 2 3 4 5 66 1 2 3 4 5 6
7 1 2 3 4 5 68 1 2 3 4 5 69 1 2 3 4 5 6
During the past 4 weeks, how much, if at all, has pain interfered with your activities?
(READ OUT – ONE ANSWER ONLY)
ExtremelyQuite a bitModeratelyA little
DKNot at all
EB64.4 NEW
These questions are about how you feel and how things have been with you during the past 4 weeks. For each question, please give the one answer that comes closest to the way you have been feeling. How much of the time during the past 4 weeks?
(SHOW SAME CARD WITH SCALE AS IN QA2 – ONE ANSWER PER LINE)
(READ OUT)
Have you felt full of life
Have you felt particularly tense
Have you felt so down in the dumps that nothing could cheer you up
You felt calm and peacefulDid you have lots of energyHave you felt downhearted and depressed
Have you felt worn outHave you felt happyDid you feel tired
EB64.4 NEW

QA6
123456
QA7
1,2,3,4,5,6,7,8,9,
10,11,
QA8
1
2
3
4
During the past 4 weeks, how much of the time has your physical health or emotional problems interfered with social activities (like visiting friends, relatives, etc.)?
(SHOW SAME CARD WITH SCALE AS IN QA2 – ONE ANSWER ONLY)
All the timeMost of the timeSometimesRarelyNeverDK
EB64.4 NEW
In the last 12 months, did you seek help from a professional in respect of a psychological or emotional health problem? (IF YES) Indicate who in the following list. (M)
(SHOW CARD – READ OUT – MULTIPLE ANSWERS POSSIBLE)
NoYes, a general practitionerYes, a pharmacist (M)Yes, a psychiatristYes, a psychologistYes, a psychoanalyst (N)Yes, a nurseYes, a social workerYes, a psychotherapist not mentioned previously (N)Yes, another health professional (M)DK
EB58.2 Q46 TREND MODIFIED
During the past 4 weeks, have you had any of the following problems with your work or other regular activities as a result of any emotional problems (such as feeling depressed or anxious)?
(SHOW ITEM LIST – ONE ANSWER PER LINE)
(READ OUT) Yes No
Cut down on the amount of time you spent on work or other activities?
1 2
Accomplished less than you would like? 1 2
Did not do work or other activities as carefully as usual?
1 2
Missed work days? 1 2
EB64.4 NEW

QA9
1
2
3
QA10
1,2,3,4,5,6,7,8,
QA11
12345
Please indicate which ones of the following statements possibly apply to your situation. In the last 12 months…
(SHOW ITEM LIST – ONE ANSWER PER LINE)
(READ OUT) Yes No DK
You have received psychotherapy due to psychological or emotional health problems
1 2 3
You have taken drugs due to psychological or emotional health problems
1 2 3
You have been admitted to hospital due to psychological or emotional health problems
1 2 3
If you were feeling bad, where would you seek more support first?
(SHOW CARD – READ OUT – MULTIPLE ANSWERS POSSIBLE)
EB64.4 NEW
I would seek support from a school teacherI would call a help lineOther (SPONTANEOUS)
I would seek support from a health professionalI would seek support from a family memberI would seek support from a friendI would seek support from a religious counsellor
EB64.4 NEW
DK
How easy or difficult do you find it is to find information on psychological or emotional health problems and how to deal with them?
(READ OUT – ONE ANSWER ONLY)
Very easyFairly easyFairly difficultVery difficultDK
EB64.4 NEW

QA12
1
2
3
4
To what extent do you agree or disagree with the following statements?
(SHOW CARD WITH SCALE – ONE ANSWER PER LINE)
(READ OUT) Totally agree Tend to agree
Tend to disagree
Totally disagree
DK
People with psychological or emotional health problems constitute a danger to others
1 2 3
4 5
People with psychological or emotional health problems are unpredictable
1 2 3
4 5
4 5
4 5
People with psychological or emotional health problems have themselves to blame
1
People with psychological or emotional health problems never recover
1 2 3
2 3
EB64.4 NEW

Tables

EUROBAROMETER 64.4VOLUME A Pondéré Weighted Terrain/Fieldwork : 12/2005
TOTAL
Elle vous limite
beaucoup / It limits you
a lot
Elle vous limite un peu / It limits you a
little
Elle ne vous limite pas du tout / It
does not limit you atall
NSP / DK
UE25�EU25 24738 9% 17% 74% 0%BE 1011 8% 15% 77% - CZ 1012 8% 19% 73% 0%DK 1039 8% 13% 79% 0%D-W 1015 6% 17% 76% 0%DE 1515 6% 18% 76% 0%D-E 500 5% 18% 77% - EE 1000 8% 19% 73% 0%EL 999 11% 14% 74% 0%ES 1000 9% 15% 76% 1%FR 1031 8% 13% 79% 1%IE 1000 4% 14% 80% 1%IT 1011 11% 23% 66% 1%CY 507 8% 15% 76% 1%LV 1046 8% 19% 73% 0%LT 1022 10% 24% 66% - LU 500 9% 15% 75% 1%HU 1010 13% 19% 68% 0%MT 500 6% 20% 74% - NL 1127 7% 16% 77% - AT 1019 5% 24% 70% 1%PL 1000 13% 20% 67% 0%PT 1004 10% 21% 70% - SI 1028 9% 21% 70% - SK 1015 9% 21% 70% 0%FI 1023 6% 15% 79% 0%SE 1009 8% 13% 79% - UK 1310 9% 11% 80% 0%BG 1002 17% 24% 59% 0%HR 1000 13% 21% 65% 1%RO 1003 13% 19% 68% 1%TR 1005 8% 25% 67% 0%CY (tcc) 500 9% 18% 73% 0%
Doing moderate activities, such as moving a table, pushing a vacuum cleaner or carrying your shopping
QA1.1 Dans quelle mesure votre santé vous limite-t-elle pour … ?
Pratiquer des activités modérées, comme déplacer une table, passer l’aspirateur ou ramener vos courses
QA1.1 To what extent, if at all, does your health limit you from…?
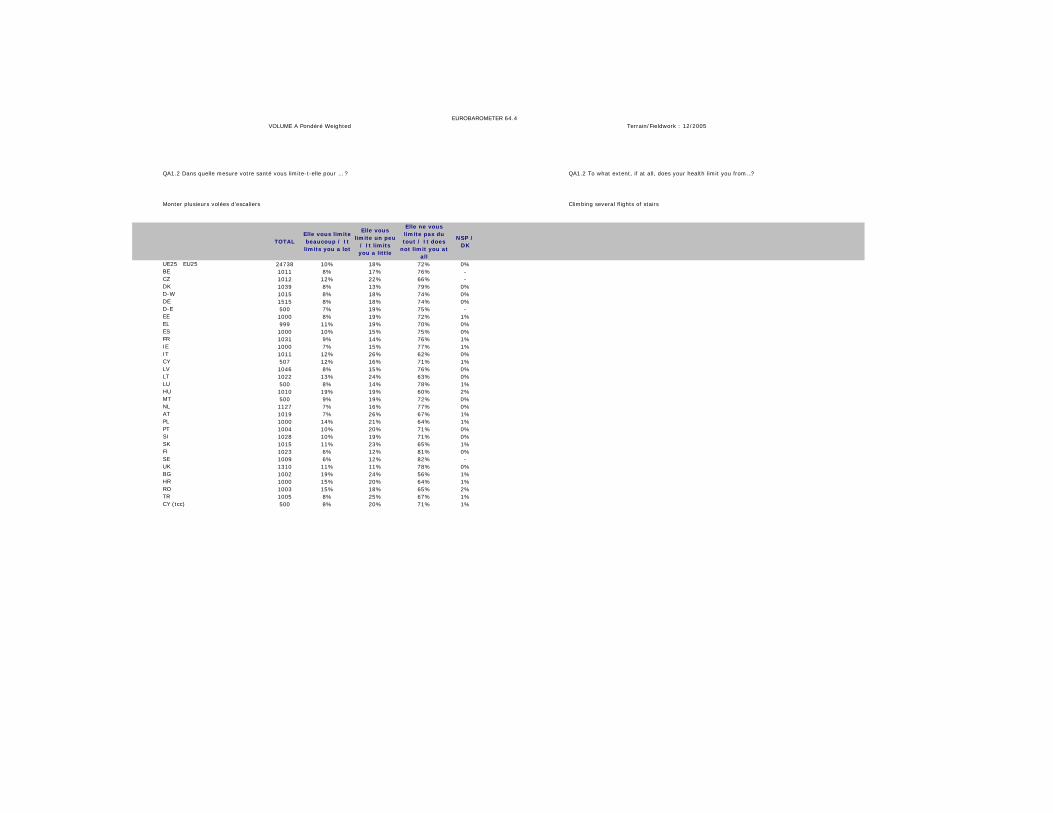
EUROBAROMETER 64.4VOLUME A Pondéré Weighted Terrain/Fieldwork : 12/2005
TOTALElle vous limite beaucoup / It limits you a lot
Elle vous limite un peu
/ It limits you a little
Elle ne vous limite pas du tout / It does
not limit you at all
NSP / DK
UE25�EU25 24738 10% 18% 72% 0%BE 1011 8% 17% 76% - CZ 1012 12% 22% 66% - DK 1039 8% 13% 79% 0%D-W 1015 8% 18% 74% 0%DE 1515 8% 18% 74% 0%D-E 500 7% 19% 75% - EE 1000 8% 19% 72% 1%EL 999 11% 19% 70% 0%ES 1000 10% 15% 75% 0%FR 1031 9% 14% 76% 1%IE 1000 7% 15% 77% 1%IT 1011 12% 26% 62% 0%CY 507 12% 16% 71% 1%LV 1046 8% 15% 76% 0%LT 1022 13% 24% 63% 0%LU 500 8% 14% 78% 1%HU 1010 19% 19% 60% 2%MT 500 9% 19% 72% 0%NL 1127 7% 16% 77% 0%AT 1019 7% 26% 67% 1%PL 1000 14% 21% 64% 1%PT 1004 10% 20% 71% 0%SI 1028 10% 19% 71% 0%SK 1015 11% 23% 65% 1%FI 1023 6% 12% 81% 0%SE 1009 6% 12% 82% - UK 1310 11% 11% 78% 0%BG 1002 19% 24% 56% 1%HR 1000 15% 20% 64% 1%RO 1003 15% 18% 65% 2%TR 1005 8% 25% 67% 1%CY (tcc) 500 8% 20% 71% 1%
Climbing several flights of stairs
QA1.2 Dans quelle mesure votre santé vous limite-t-elle pour … ?
Monter plusieurs volées d’escaliers
QA1.2 To what extent, if at all, does your health limit you from…?

EUROBAROMETER 64.4VOLUME A Pondéré Weighted Terrain/Fieldwork : 12/2005
TOTAL
Tout le temps / All the time
La plupart du temps / Most
of the time
Quelquefois / Sometimes
Rarement / Rarely
Jamais / Never
NSP / DK
UE25�EU25 24738 5% 8% 17% 17% 54% 0%BE 1011 5% 7% 16% 15% 56% 0%CZ 1012 2% 5% 19% 27% 48% 0%DK 1039 4% 10% 15% 17% 54% 0%D-W 1015 4% 6% 14% 20% 56% 0%DE 1515 4% 6% 14% 20% 56% 0%D-E 500 5% 7% 14% 19% 55% - EE 1000 4% 10% 17% 19% 50% 1%EL 999 6% 9% 13% 19% 53% - ES 1000 3% 9% 11% 14% 62% 0%FR 1031 5% 7% 15% 14% 59% 0%IE 1000 2% 4% 20% 19% 53% 1%IT 1011 4% 8% 25% 21% 42% 0%CY 507 3% 7% 17% 12% 61% - LV 1046 4% 8% 20% 16% 51% 1%LT 1022 5% 12% 23% 15% 44% 0%LU 500 7% 7% 10% 10% 65% 1%HU 1010 8% 15% 18% 16% 42% - MT 500 2% 8% 24% 24% 41% 1%NL 1127 5% 6% 16% 16% 57% 0%AT 1019 1% 6% 24% 32% 36% 1%PL 1000 7% 12% 21% 18% 42% 1%PT 1004 5% 9% 15% 14% 56% 0%SI 1028 4% 8% 20% 24% 45% - SK 1015 4% 11% 23% 31% 30% 1%FI 1023 3% 8% 18% 22% 49% 0%SE 1009 5% 7% 14% 13% 60% - UK 1310 6% 7% 12% 10% 65% 0%BG 1002 7% 13% 19% 26% 34% 1%HR 1000 5% 9% 20% 17% 49% 0%RO 1003 6% 12% 20% 21% 40% 0%TR 1005 3% 7% 19% 15% 56% 1%CY (tcc) 500 4% 8% 23% 18% 46% 1%
You have accomplished less than you would like
QA2.1 Au cours des 4 dernières semaines, à quelle fréquence avez-vous rencontré l’un des problèmes suivants dansl’exercice de votre travail ou de toute autre activité habituelle, en raison de votre état de santé physique ?
Vous avez fait moins de choses que ce que vous souhaitiez
QA2.1 During the past 4 weeks how much of the time have you had any of the following problems withyour work or other regular activities as a result of your physical health?

EUROBAROMETER 64.4VOLUME A Pondéré Weighted Terrain/Fieldwork : 12/2005
TOTAL
Tout le temps / All the time
La plupart
du temps / Most of the time
Quelquefois / Sometimes
Rarement / Rarely
Jamais / Never
NSP / DK
UE25�EU25 24738 3% 6% 14% 18% 58% 0%BE 1011 4% 6% 13% 15% 62% 0%CZ 1012 1% 4% 15% 30% 49% 0%DK 1039 6% 7% 16% 19% 52% 0%D-W 1015 4% 4% 12% 19% 60% 0%DE 1515 4% 5% 12% 18% 61% 0%D-E 500 4% 6% 11% 17% 62% 0%EE 1000 2% 6% 16% 20% 55% 1%EL 999 4% 8% 13% 18% 57% - ES 1000 2% 5% 9% 14% 69% 1%FR 1031 3% 5% 10% 13% 68% 1%IE 1000 2% 4% 17% 20% 55% 2%IT 1011 3% 8% 20% 24% 45% 0%CY 507 2% 8% 14% 13% 63% - LV 1046 3% 5% 16% 15% 60% 1%LT 1022 5% 9% 23% 18% 45% 0%LU 500 4% 6% 9% 9% 70% 1%HU 1010 5% 10% 17% 19% 49% 0%MT 500 2% 5% 22% 26% 43% 1%NL 1127 3% 6% 13% 17% 61% 0%AT 1019 0% 5% 20% 28% 45% 1%PL 1000 4% 10% 19% 19% 47% 1%PT 1004 4% 9% 14% 15% 58% 0%SI 1028 3% 6% 17% 23% 49% 0%SK 1015 3% 6% 20% 31% 38% 1%FI 1023 2% 5% 15% 22% 56% 0%SE 1009 4% 5% 10% 13% 69% 0%UK 1310 4% 6% 11% 12% 67% 0%BG 1002 6% 9% 20% 25% 39% 1%HR 1000 4% 8% 18% 19% 49% 1%RO 1003 5% 8% 20% 22% 45% 1%TR 1005 2% 6% 17% 16% 57% 1%CY (tcc) 500 5% 8% 18% 21% 46% 1%
You have accomplished your usual activities less carefully
QA2.2 Au cours des 4 dernières semaines, à quelle fréquence avez-vous rencontré l’un des problèmessuivants dans l’exercice de votre travail ou de toute autre activité habituelle, en raison de votre état desanté physique ?
Vous avez accompli vos activités habituelles avec moins d’attention que d’habitude
QA2.2 During the past 4 weeks how much of the time have you had any of the following problems withyour work or other regular activities as a result of your physical health?

EUROBAROMETER 64.4VOLUME A Pondéré Weighted Terrain/Fieldwork : 12/2005
TOTAL
Tout le temps / All the time
La plupart
du temps / Most of the time
Quelquefois / Sometimes
Rarement / Rarely
Jamais / Never
NSP / DK
UE25�EU25 24738 3% 6% 14% 16% 61% 0%BE 1011 3% 6% 14% 13% 63% 0%CZ 1012 1% 3% 11% 22% 62% 0%DK 1039 3% 7% 15% 19% 56% 0%D-W 1015 2% 3% 11% 16% 67% 0%DE 1515 2% 3% 11% 16% 68% 0%D-E 500 2% 3% 10% 13% 71% - EE 1000 2% 7% 21% 21% 48% 0%EL 999 3% 8% 16% 18% 55% - ES 1000 2% 5% 8% 13% 71% 0%FR 1031 2% 6% 12% 11% 68% 1%IE 1000 1% 4% 16% 18% 60% 1%IT 1011 3% 7% 20% 22% 47% 0%CY 507 2% 7% 15% 12% 64% - LV 1046 2% 6% 25% 20% 46% 1%LT 1022 2% 8% 21% 19% 49% 0%LU 500 4% 3% 9% 7% 77% 1%HU 1010 6% 12% 16% 19% 47% 0%MT 500 1% 5% 25% 24% 44% 1%NL 1127 2% 4% 11% 14% 69% - AT 1019 1% 5% 20% 29% 46% 1%PL 1000 4% 10% 21% 21% 43% 1%PT 1004 3% 9% 14% 15% 58% 0%SI 1028 1% 6% 15% 24% 54% 0%SK 1015 2% 6% 19% 34% 39% 1%FI 1023 1% 5% 18% 22% 54% 0%SE 1009 2% 4% 13% 15% 66% 0%UK 1310 4% 5% 13% 10% 67% 0%BG 1002 4% 7% 17% 29% 42% 2%HR 1000 3% 6% 16% 18% 56% 0%RO 1003 3% 9% 19% 20% 49% 1%TR 1005 2% 8% 20% 17% 52% 1%CY (tcc) 500 5% 7% 23% 20% 42% 2%
You have accomplished less than you would like
QA3.1 Au cours des 4 dernières semaines, à quelle fréquence avez-vous rencontré l’un des problèmessuivants dans le cadre de votre travail ou d’autres activités quotidiennes habituelles suite à un problèmeémotionnel (par exemple, un sentiment de déprime ou d’anxiété) ?
Vous avez fait moins de choses que ce que vous souhaitiez
QA3.1 During the past 4 weeks, how much of the time have you had any of the following problems withyour work or other regular activities as a result of any emotional problem (such as feeling depressed orbeing anxious)?
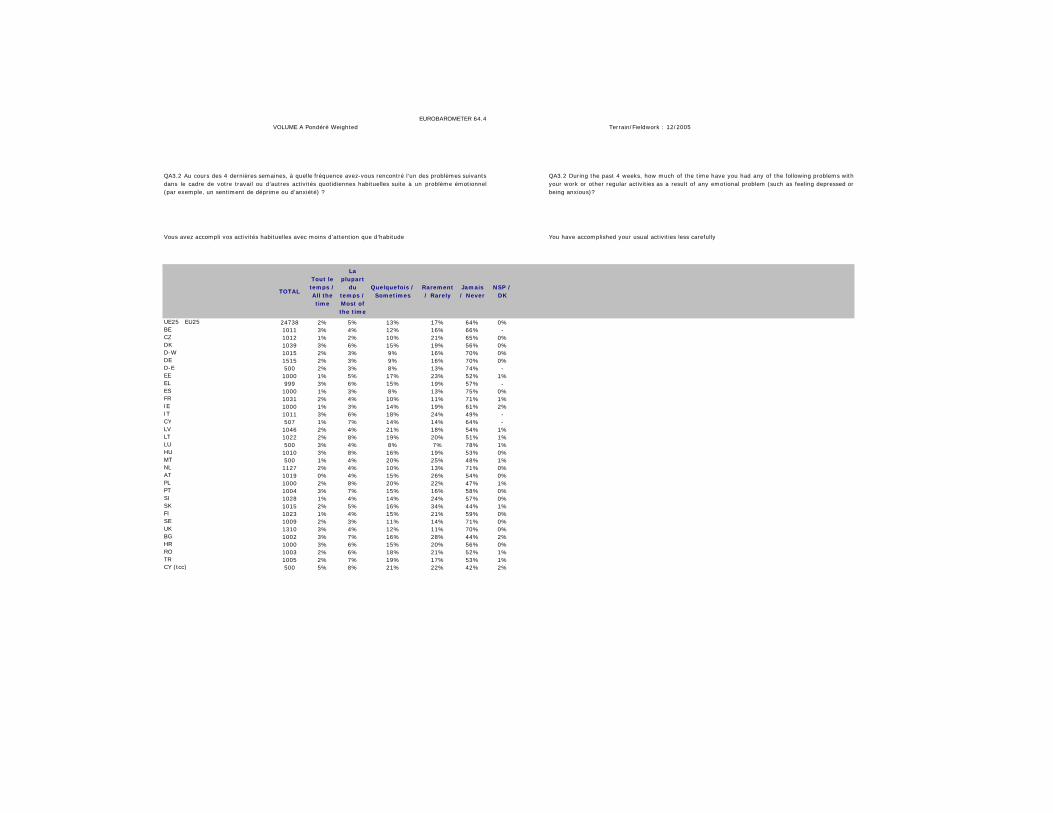
EUROBAROMETER 64.4VOLUME A Pondéré Weighted Terrain/Fieldwork : 12/2005
TOTAL
Tout le temps / All the time
La plupart
du temps / Most of the time
Quelquefois / Sometimes
Rarement / Rarely
Jamais / Never
NSP / DK
UE25�EU25 24738 2% 5% 13% 17% 64% 0%BE 1011 3% 4% 12% 16% 66% - CZ 1012 1% 2% 10% 21% 65% 0%DK 1039 3% 6% 15% 19% 56% 0%D-W 1015 2% 3% 9% 16% 70% 0%DE 1515 2% 3% 9% 16% 70% 0%D-E 500 2% 3% 8% 13% 74% - EE 1000 1% 5% 17% 23% 52% 1%EL 999 3% 6% 15% 19% 57% - ES 1000 1% 3% 8% 13% 75% 0%FR 1031 2% 4% 10% 11% 71% 1%IE 1000 1% 3% 14% 19% 61% 2%IT 1011 3% 6% 18% 24% 49% - CY 507 1% 7% 14% 14% 64% - LV 1046 2% 4% 21% 18% 54% 1%LT 1022 2% 8% 19% 20% 51% 1%LU 500 3% 4% 8% 7% 78% 1%HU 1010 3% 8% 16% 19% 53% 0%MT 500 1% 4% 20% 25% 48% 1%NL 1127 2% 4% 10% 13% 71% 0%AT 1019 0% 4% 15% 26% 54% 0%PL 1000 2% 8% 20% 22% 47% 1%PT 1004 3% 7% 15% 16% 58% 0%SI 1028 1% 4% 14% 24% 57% 0%SK 1015 2% 5% 16% 34% 44% 1%FI 1023 1% 4% 15% 21% 59% 0%SE 1009 2% 3% 11% 14% 71% 0%UK 1310 3% 4% 12% 11% 70% 0%BG 1002 3% 7% 16% 28% 44% 2%HR 1000 3% 6% 15% 20% 56% 0%RO 1003 2% 6% 18% 21% 52% 1%TR 1005 2% 7% 19% 17% 53% 1%CY (tcc) 500 5% 8% 21% 22% 42% 2%
You have accomplished your usual activities less carefully
QA3.2 Au cours des 4 dernières semaines, à quelle fréquence avez-vous rencontré l’un des problèmes suivantsdans le cadre de votre travail ou d’autres activités quotidiennes habituelles suite à un problème émotionnel(par exemple, un sentiment de déprime ou d’anxiété) ?
Vous avez accompli vos activités habituelles avec moins d’attention que d’habitude
QA3.2 During the past 4 weeks, how much of the time have you had any of the following problems withyour work or other regular activities as a result of any emotional problem (such as feeling depressed orbeing anxious)?

EUROBAROMETER 64.4VOLUME A Pondéré Weighted Terrain/Fieldwork : 12/2005
TOTALExtrêmement / Extremely
Sérieusement / Quite a bit
Modérément / Moderately
Un peu / Alittle
Pas du tout / Not at
all
NSP / DK
UE25�EU25 24738 4% 9% 12% 19% 57% 0%BE 1011 1% 8% 13% 20% 57% 0%CZ 1012 1% 5% 15% 38% 41% - DK 1039 2% 6% 9% 20% 62% 0%D-W 1015 4% 9% 13% 18% 56% 0%DE 1515 4% 9% 14% 17% 56% 0%D-E 500 3% 10% 15% 15% 58% - EE 1000 3% 10% 13% 28% 46% 0%EL 999 4% 9% 9% 14% 64% - ES 1000 3% 10% 8% 14% 65% - FR 1031 3% 9% 10% 14% 63% 0%IE 1000 2% 5% 7% 13% 71% 1%IT 1011 2% 7% 12% 28% 49% 1%CY 507 3% 8% 11% 12% 65% 0%LV 1046 4% 10% 9% 27% 49% 0%LT 1022 5% 10% 13% 23% 49% 1%LU 500 2% 8% 9% 13% 66% 1%HU 1010 5% 11% 13% 17% 54% - MT 500 1% 6% 16% 25% 52% 0%NL 1127 3% 6% 8% 20% 63% - AT 1019 2% 8% 14% 25% 51% 0%PL 1000 6% 13% 18% 20% 43% 0%PT 1004 3% 11% 17% 14% 54% 1%SI 1028 6% 8% 12% 24% 48% 0%SK 1015 3% 13% 14% 26% 43% 0%FI 1023 3% 8% 13% 28% 48% 0%SE 1009 4% 10% 12% 20% 54% - UK 1310 4% 7% 7% 15% 67% - BG 1002 3% 9% 13% 21% 43% 10%HR 1000 7% 12% 13% 18% 51% 0%RO 1003 5% 12% 12% 21% 49% 1%TR 1005 4% 6% 13% 18% 56% 3%CY (tcc) 500 5% 7% 13% 19% 56% 0%
QA4 Au cours des 4 dernières semaines, à quel point la douleur a-t-elle gêné vos activités ? QA4 During the past 4 weeks, how much, if at all, has pain interfered with your activities?

EUROBAROMETER 64.4VOLUME A Pondéré Weighted Terrain/Fieldwork : 12/2005
TOTAL
Tout le temps / All the time
La plupart
du temps / Most of the time
Quelquefois / Sometimes
Rarement / Rarely
Jamais / Never
NSP / DK
UE25�EU25 24738 21% 43% 23% 10% 4% 0%BE 1011 25% 47% 15% 8% 5% 0%CZ 1012 18% 46% 22% 11% 2% 1%DK 1039 25% 52% 17% 5% 1% 0%D-W 1015 24% 43% 20% 10% 3% 0%DE 1515 23% 44% 19% 10% 3% 0%D-E 500 20% 49% 17% 11% 3% - EE 1000 7% 27% 33% 18% 14% 2%EL 999 25% 42% 21% 9% 3% - ES 1000 22% 48% 22% 6% 2% - FR 1031 20% 48% 22% 8% 2% 0%IE 1000 16% 49% 25% 8% 1% 0%IT 1011 12% 38% 32% 12% 5% 0%CY 507 27% 38% 22% 10% 2% 1%LV 1046 10% 48% 26% 11% 4% 1%LT 1022 19% 39% 25% 13% 5% 0%LU 500 26% 48% 17% 6% 2% 1%HU 1010 6% 24% 31% 23% 16% 1%MT 500 18% 38% 32% 9% 2% 0%NL 1127 27% 49% 15% 6% 3% 0%AT 1019 17% 49% 22% 9% 2% 0%PL 1000 21% 36% 24% 14% 4% 1%PT 1004 19% 43% 28% 8% 2% 0%SI 1028 14% 47% 29% 9% 1% 1%SK 1015 18% 50% 19% 12% 1% 0%FI 1023 45% 45% 7% 2% 1% 0%SE 1009 28% 44% 20% 5% 2% 0%UK 1310 23% 41% 22% 9% 5% - BG 1002 21% 37% 22% 14% 4% 2%HR 1000 15% 36% 30% 14% 4% 1%RO 1003 18% 45% 22% 10% 3% 1%TR 1005 16% 33% 32% 13% 6% 1%CY (tcc) 500 21% 33% 30% 10% 6% 1%
Have you felt full of life
QA5.1 Les questions suivantes portent sur comment vous vous sentez et sur la façon dont vous vous êtes portéau cours des 4 dernières semaines. Pour chaque question, veuillez indiquer la réponse qui se rapproche le plus dece que vous avez ressenti. A quelle fréquence au cours de ces 4 dernières semaines … ?
Vous êtes-vous senti(e) en pleine joie de vivre
QA5.1 These questions are about how you feel and how things have been with you during the past 4weeks. For each question, please give the one answer that comes closest to the way you have beenfeeling. How much of the time during the past 4 weeks...?
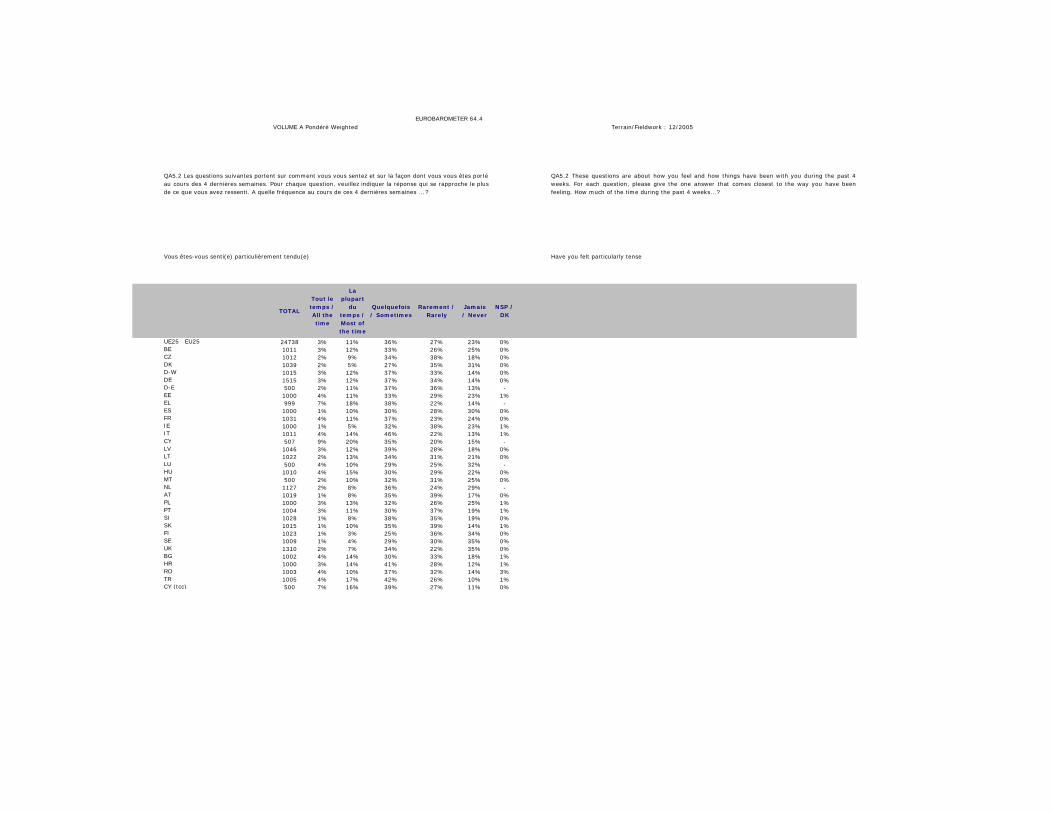
EUROBAROMETER 64.4VOLUME A Pondéré Weighted Terrain/Fieldwork : 12/2005
TOTAL
Tout le temps / All the time
La plupart
du temps / Most of the time
Quelquefois / Sometimes
Rarement / Rarely
Jamais / Never
NSP / DK
UE25�EU25 24738 3% 11% 36% 27% 23% 0%BE 1011 3% 12% 33% 26% 25% 0%CZ 1012 2% 9% 34% 38% 18% 0%DK 1039 2% 5% 27% 35% 31% 0%D-W 1015 3% 12% 37% 33% 14% 0%DE 1515 3% 12% 37% 34% 14% 0%D-E 500 2% 11% 37% 36% 13% - EE 1000 4% 11% 33% 29% 23% 1%EL 999 7% 18% 38% 22% 14% - ES 1000 1% 10% 30% 28% 30% 0%FR 1031 4% 11% 37% 23% 24% 0%IE 1000 1% 5% 32% 38% 23% 1%IT 1011 4% 14% 46% 22% 13% 1%CY 507 9% 20% 35% 20% 15% - LV 1046 3% 12% 39% 28% 18% 0%LT 1022 2% 13% 34% 31% 21% 0%LU 500 4% 10% 29% 25% 32% - HU 1010 4% 15% 30% 29% 22% 0%MT 500 2% 10% 32% 31% 25% 0%NL 1127 2% 8% 36% 24% 29% - AT 1019 1% 8% 35% 39% 17% 0%PL 1000 3% 13% 32% 26% 25% 1%PT 1004 3% 11% 30% 37% 19% 1%SI 1028 1% 8% 38% 35% 19% 0%SK 1015 1% 10% 35% 39% 14% 1%FI 1023 1% 3% 25% 36% 34% 0%SE 1009 1% 4% 29% 30% 35% 0%UK 1310 2% 7% 34% 22% 35% 0%BG 1002 4% 14% 30% 33% 18% 1%HR 1000 3% 14% 41% 28% 12% 1%RO 1003 4% 10% 37% 32% 14% 3%TR 1005 4% 17% 42% 26% 10% 1%CY (tcc) 500 7% 16% 39% 27% 11% 0%
Have you felt particularly tense
QA5.2 Les questions suivantes portent sur comment vous vous sentez et sur la façon dont vous vous êtes porté au cours des 4 dernières semaines. Pour chaque question, veuillez indiquer la réponse qui se rapproche le plusde ce que vous avez ressenti. A quelle fréquence au cours de ces 4 dernières semaines … ?
Vous êtes-vous senti(e) particulièrement tendu(e)
QA5.2 These questions are about how you feel and how things have been with you during the past 4weeks. For each question, please give the one answer that comes closest to the way you have beenfeeling. How much of the time during the past 4 weeks...?
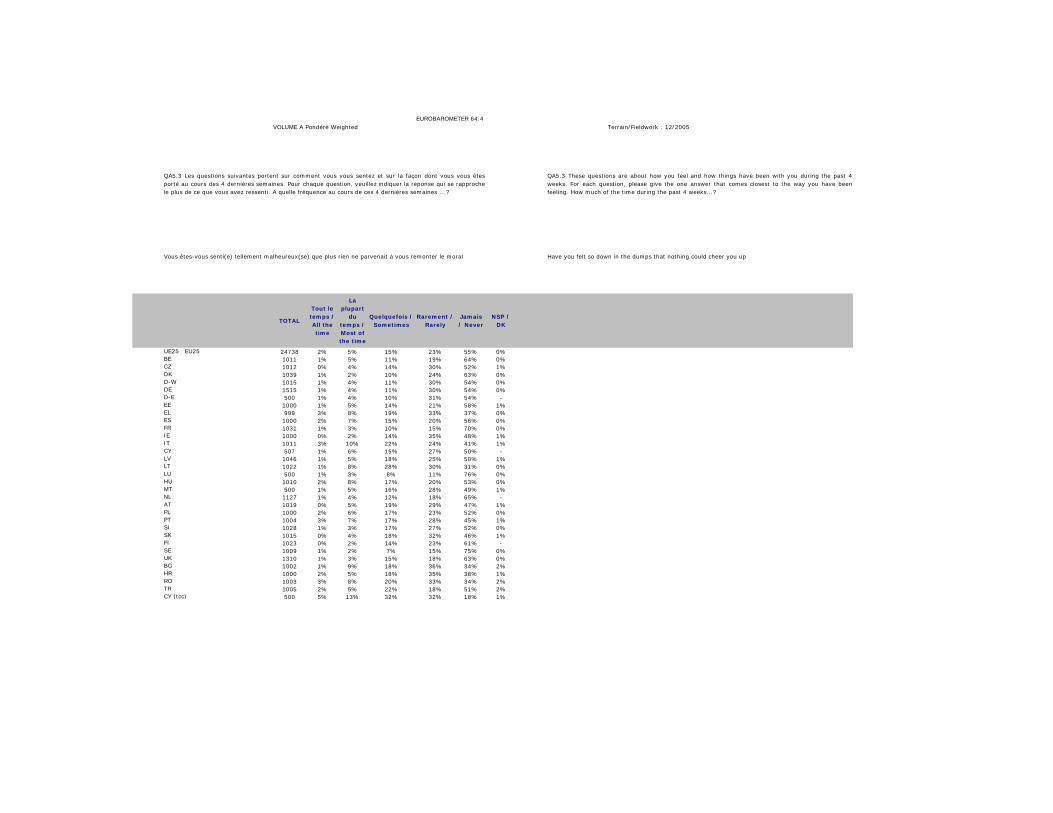
EUROBAROMETER 64.4VOLUME A Pondéré Weighted Terrain/Fieldwork : 12/2005
TOTAL
Tout le temps / All the time
La plupart
du temps / Most of the time
Quelquefois / Sometimes
Rarement / Rarely
Jamais / Never
NSP / DK
UE25�EU25 24738 2% 5% 15% 23% 55% 0%BE 1011 1% 5% 11% 19% 64% 0%CZ 1012 0% 4% 14% 30% 52% 1%DK 1039 1% 2% 10% 24% 63% 0%D-W 1015 1% 4% 11% 30% 54% 0%DE 1515 1% 4% 11% 30% 54% 0%D-E 500 1% 4% 10% 31% 54% - EE 1000 1% 5% 14% 21% 58% 1%EL 999 3% 8% 19% 33% 37% 0%ES 1000 2% 7% 15% 20% 56% 0%FR 1031 1% 3% 10% 15% 70% 0%IE 1000 0% 2% 14% 35% 48% 1%IT 1011 3% 10% 22% 24% 41% 1%CY 507 1% 6% 15% 27% 50% - LV 1046 1% 5% 18% 25% 50% 1%LT 1022 1% 8% 28% 30% 31% 0%LU 500 1% 3% 8% 11% 76% 0%HU 1010 2% 8% 17% 20% 53% 0%MT 500 1% 5% 16% 28% 49% 1%NL 1127 1% 4% 12% 18% 65% - AT 1019 0% 5% 19% 29% 47% 1%PL 1000 2% 6% 17% 23% 52% 0%PT 1004 3% 7% 17% 28% 45% 1%SI 1028 1% 3% 17% 27% 52% 0%SK 1015 0% 4% 18% 32% 46% 1%FI 1023 0% 2% 14% 23% 61% - SE 1009 1% 2% 7% 15% 75% 0%UK 1310 1% 3% 15% 18% 63% 0%BG 1002 1% 9% 18% 36% 34% 2%HR 1000 2% 5% 18% 35% 38% 1%RO 1003 3% 8% 20% 33% 34% 2%TR 1005 2% 5% 22% 18% 51% 2%CY (tcc) 500 5% 13% 32% 32% 18% 1%
Have you felt so down in the dumps that nothing could cheer you up
QA5.3 Les questions suivantes portent sur comment vous vous sentez et sur la façon dont vous vous êtesporté au cours des 4 dernières semaines. Pour chaque question, veuillez indiquer la réponse qui se rapprochele plus de ce que vous avez ressenti. A quelle fréquence au cours de ces 4 dernières semaines … ?
Vous êtes-vous senti(e) tellement malheureux(se) que plus rien ne parvenait à vous remonter le moral
QA5.3 These questions are about how you feel and how things have been with you during the past 4weeks. For each question, please give the one answer that comes closest to the way you have beenfeeling. How much of the time during the past 4 weeks...?

EUROBAROMETER 64.4VOLUME A Pondéré Weighted Terrain/Fieldwork : 12/2005
TOTAL
Tout le temps / All the time
La plupart
du temps / Most of the time
Quelquefois / Sometimes
Rarement / Rarely
Jamais / Never
NSP / DK
UE25�EU25 24738 15% 48% 24% 10% 3% 0%BE 1011 20% 51% 17% 9% 3% - CZ 1012 14% 57% 20% 8% 1% 0%DK 1039 25% 55% 13% 5% 2% 0%D-W 1015 14% 52% 21% 11% 2% 0%DE 1515 15% 52% 21% 11% 2% 0%D-E 500 16% 52% 19% 10% 3% - EE 1000 11% 52% 21% 11% 4% 1%EL 999 9% 49% 29% 11% 2% - ES 1000 15% 46% 29% 8% 2% 0%FR 1031 17% 49% 20% 10% 4% 0%IE 1000 11% 56% 26% 5% 1% 1%IT 1011 7% 39% 35% 15% 4% 1%CY 507 16% 45% 24% 11% 3% - LV 1046 9% 53% 23% 13% 3% 0%LT 1022 24% 47% 19% 7% 2% 0%LU 500 22% 44% 19% 9% 5% 1%HU 1010 16% 52% 17% 12% 3% 0%MT 500 11% 53% 27% 6% 3% 0%NL 1127 19% 57% 15% 6% 2% - AT 1019 11% 55% 23% 9% 1% 1%PL 1000 23% 46% 19% 10% 2% 0%PT 1004 11% 39% 33% 13% 3% 0%SI 1028 8% 44% 35% 11% 2% 0%SK 1015 14% 58% 18% 8% 0% 1%FI 1023 26% 57% 12% 4% 1% 0%SE 1009 26% 49% 16% 7% 1% 0%UK 1310 17% 47% 25% 7% 3% 0%BG 1002 14% 47% 20% 13% 3% 2%HR 1000 11% 48% 26% 11% 2% 1%RO 1003 14% 51% 23% 8% 2% 2%TR 1005 11% 38% 37% 9% 4% 1%CY (tcc) 500 13% 42% 27% 14% 3% 1%
Have you felt calm and peaceful
QA5.4 Les questions suivantes portent sur comment vous vous sentez et sur la façon dont vous vous êtes portéau cours des 4 dernières semaines. Pour chaque question, veuillez indiquer la réponse qui se rapproche le plus dece que vous avez ressenti. A quelle fréquence au cours de ces 4 dernières semaines … ?
Vous êtes-vous senti(e) calme et serein(e)
QA5.4 These questions are about how you feel and how things have been with you during the past 4weeks. For each question, please give the one answer that comes closest to the way you have beenfeeling. How much of the time during the past 4 weeks...?
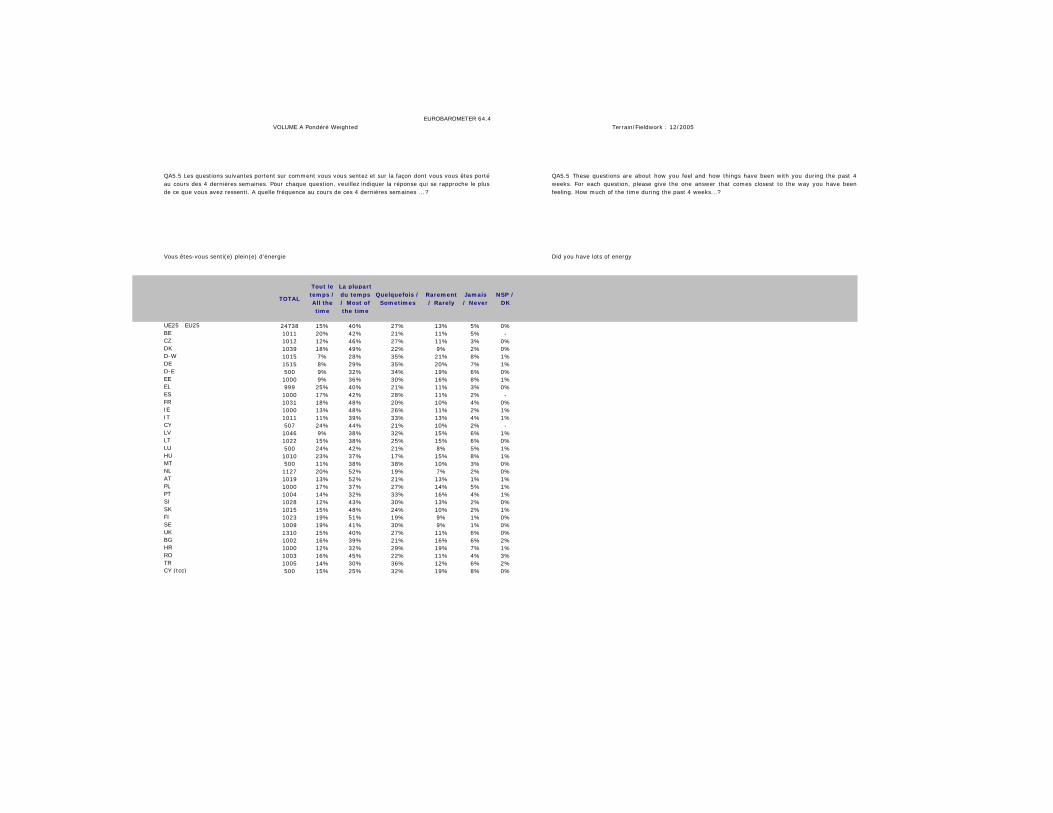
EUROBAROMETER 64.4VOLUME A Pondéré Weighted Terrain/Fieldwork : 12/2005
TOTAL
Tout le temps / All the time
La plupartdu temps / Most of the time
Quelquefois / Sometimes
Rarement / Rarely
Jamais / Never
NSP / DK
UE25�EU25 24738 15% 40% 27% 13% 5% 0%BE 1011 20% 42% 21% 11% 5% - CZ 1012 12% 46% 27% 11% 3% 0%DK 1039 18% 49% 22% 9% 2% 0%D-W 1015 7% 28% 35% 21% 8% 1%DE 1515 8% 29% 35% 20% 7% 1%D-E 500 9% 32% 34% 19% 6% 0%EE 1000 9% 36% 30% 16% 8% 1%EL 999 25% 40% 21% 11% 3% 0%ES 1000 17% 42% 28% 11% 2% - FR 1031 18% 48% 20% 10% 4% 0%IE 1000 13% 48% 26% 11% 2% 1%IT 1011 11% 39% 33% 13% 4% 1%CY 507 24% 44% 21% 10% 2% - LV 1046 9% 38% 32% 15% 6% 1%LT 1022 15% 38% 25% 15% 6% 0%LU 500 24% 42% 21% 8% 5% 1%HU 1010 23% 37% 17% 15% 8% 1%MT 500 11% 38% 38% 10% 3% 0%NL 1127 20% 52% 19% 7% 2% 0%AT 1019 13% 52% 21% 13% 1% 1%PL 1000 17% 37% 27% 14% 5% 1%PT 1004 14% 32% 33% 16% 4% 1%SI 1028 12% 43% 30% 13% 2% 0%SK 1015 15% 48% 24% 10% 2% 1%FI 1023 19% 51% 19% 9% 1% 0%SE 1009 19% 41% 30% 9% 1% 0%UK 1310 15% 40% 27% 11% 6% 0%BG 1002 16% 39% 21% 16% 6% 2%HR 1000 12% 32% 29% 19% 7% 1%RO 1003 16% 45% 22% 11% 4% 3%TR 1005 14% 30% 36% 12% 6% 2%CY (tcc) 500 15% 25% 32% 19% 8% 0%
Did you have lots of energy
QA5.5 Les questions suivantes portent sur comment vous vous sentez et sur la façon dont vous vous êtes portéau cours des 4 dernières semaines. Pour chaque question, veuillez indiquer la réponse qui se rapproche le plusde ce que vous avez ressenti. A quelle fréquence au cours de ces 4 dernières semaines … ?
Vous êtes-vous senti(e) plein(e) d’énergie
QA5.5 These questions are about how you feel and how things have been with you during the past 4weeks. For each question, please give the one answer that comes closest to the way you have beenfeeling. How much of the time during the past 4 weeks...?

EUROBAROMETER 64.4VOLUME A Pondéré Weighted Terrain/Fieldwork : 12/2005
TOTAL
Tout le temps / All the time
La plupart
du temps / Most of the time
Quelquefois / Sometimes
Rarement / Rarely
Jamais / Never
NSP / DK
UE25�EU25 24738 2% 6% 21% 28% 43% 0%BE 1011 1% 7% 17% 27% 48% - CZ 1012 1% 5% 15% 33% 46% 0%DK 1039 1% 2% 14% 32% 51% 0%D-W 1015 1% 4% 15% 29% 50% 0%DE 1515 1% 4% 15% 29% 51% 0%D-E 500 2% 4% 13% 26% 54% 1%EE 1000 2% 6% 18% 28% 45% 1%EL 999 2% 10% 23% 35% 31% - ES 1000 2% 8% 18% 29% 43% 0%FR 1031 2% 5% 20% 21% 51% 0%IE 1000 0% 2% 18% 34% 44% 1%IT 1011 3% 9% 32% 33% 22% 0%CY 507 1% 9% 19% 26% 44% 0%LV 1046 1% 8% 27% 37% 27% 0%LT 1022 2% 10% 33% 35% 19% 1%LU 500 2% 4% 16% 20% 57% 0%HU 1010 3% 8% 14% 21% 55% 1%MT 500 2% 4% 28% 34% 32% 0%NL 1127 1% 4% 17% 23% 55% 0%AT 1019 1% 4% 17% 26% 52% 1%PL 1000 3% 9% 27% 30% 31% 0%PT 1004 2% 7% 21% 32% 35% 2%SI 1028 0% 4% 22% 37% 37% 0%SK 1015 1% 4% 19% 36% 39% 1%FI 1023 0% 3% 19% 34% 43% 0%SE 1009 1% 4% 16% 27% 53% 0%UK 1310 1% 4% 21% 22% 53% 0%BG 1002 2% 8% 18% 28% 42% 2%HR 1000 3% 7% 25% 37% 27% 1%RO 1003 3% 7% 23% 32% 34% 2%TR 1005 3% 9% 38% 34% 15% 2%CY (tcc) 500 4% 11% 25% 31% 28% 2%
Have you felt downhearted and depressed
QA5.6 Les questions suivantes portent sur comment vous vous sentez et sur la façon dont vous vous êtesporté au cours des 4 dernières semaines. Pour chaque question, veuillez indiquer la réponse qui se rapprochele plus de ce que vous avez ressenti. A quelle fréquence au cours de ces 4 dernières semaines … ?
Vous êtes-vous senti(e) démoralisé(e) et déprimé(e)
QA5.6 These questions are about how you feel and how things have been with you during the past 4weeks. For each question, please give the one answer that comes closest to the way you have beenfeeling. How much of the time during the past 4 weeks...?

Index
EUROBAROMETER 64.4VOLUME A Pondéré Weighted Terrain/Fieldwork : 12/2005
TOTAL
Tout le temps / All the time
La plupart
du temps / Most of the time
Quelquefois / Sometimes
Rarement / Rarely
Jamais / Never
NSP / DK
UE25�EU25 24738 2% 10% 34% 27% 27% 0%BE 1011 2% 10% 25% 26% 38% - CZ 1012 3% 10% 24% 31% 32% 0%DK 1039 1% 3% 16% 30% 49% 0%D-W 1015 2% 8% 37% 32% 20% 0%DE 1515 2% 8% 37% 33% 20% 0%D-E 500 0% 8% 36% 36% 20% - EE 1000 2% 9% 30% 32% 26% 0%EL 999 2% 14% 33% 31% 21% - ES 1000 1% 8% 26% 25% 39% 0%FR 1031 4% 7% 30% 23% 35% 0%IE 1000 0% 6% 44% 31% 18% 0%IT 1011 2% 14% 36% 26% 21% 1%CY 507 3% 13% 32% 26% 25% 0%LV 1046 1% 11% 40% 29% 18% 0%LT 1022 2% 11% 32% 30% 24% 1%LU 500 3% 12% 28% 20% 37% 0%HU 1010 4% 15% 31% 29% 21% - MT 500 0% 6% 27% 26% 38% 3%NL 1127 2% 11% 29% 28% 31% 0%AT 1019 1% 8% 40% 35% 16% 0%PL 1000 3% 11% 35% 27% 23% 0%PT 1004 2% 14% 32% 33% 17% 1%SI 1028 1% 9% 42% 28% 19% 0%SK 1015 2% 8% 21% 36% 33% 1%FI 1023 1% 4% 17% 24% 54% 0%SE 1009 3% 10% 40% 27% 21% 0%UK 1310 3% 11% 43% 18% 24% 0%BG 1002 3% 11% 23% 27% 33% 2%HR 1000 3% 14% 47% 23% 12% 1%RO 1003 4% 12% 33% 33% 16% 2%TR 1005 3% 12% 41% 31% 12% 1%CY (tcc) 500 4% 8% 22% 21% 44% 1%
Have you felt worn out
QA5.7 Les questions suivantes portent sur comment vous vous sentez et sur la façon dont vous vous êtes portéau cours des 4 dernières semaines. Pour chaque question, veuillez indiquer la réponse qui se rapproche le plus dece que vous avez ressenti. A quelle fréquence au cours de ces 4 dernières semaines … ?
Vous êtes-vous senti(e) épuisé(e)
QA5.7 These questions are about how you feel and how things have been with yweeks. For each question, please give the one answer that comes closest to thefeeling. How much of the time during the past 4 weeks...?

EUROBAROMETER 64.4VOLUME A Pondéré Weighted Terrain/Fieldwork : 12/2005
TOTAL
Tout le temps / All the time
La plupart du temps / Most of
the time
Quelquefois / Sometimes
Rarement / Rarely
Jamais / Never
NSP / DK
UE25�EU25 24738 17% 48% 25% 8% 2% 0%BE 1011 27% 53% 13% 5% 2% 0%CZ 1012 13% 49% 29% 8% 1% 1%DK 1039 22% 49% 24% 4% 1% 0%D-W 1015 13% 46% 29% 10% 2% 1%DE 1515 12% 47% 28% 10% 2% 1%D-E 500 11% 47% 28% 11% 3% 0%EE 1000 9% 39% 33% 12% 5% 2%EL 999 14% 47% 27% 10% 2% - ES 1000 17% 53% 22% 6% 1% 0%FR 1031 23% 51% 19% 4% 1% 0%IE 1000 16% 66% 14% 3% 1% 0%IT 1011 9% 39% 35% 13% 3% 1%CY 507 24% 43% 23% 7% 3% - LV 1046 8% 34% 34% 16% 6% 2%LT 1022 15% 37% 30% 12% 4% 1%LU 500 26% 49% 18% 5% 2% 0%HU 1010 13% 44% 24% 14% 5% 1%MT 500 10% 51% 33% 5% 0% 0%NL 1127 26% 57% 13% 4% 1% 0%AT 1019 12% 48% 31% 7% 1% 1%PL 1000 20% 40% 24% 13% 3% 1%PT 1004 18% 38% 32% 8% 3% 1%SI 1028 15% 46% 32% 7% 1% 0%SK 1015 13% 50% 28% 8% 1% 1%FI 1023 23% 55% 16% 5% 1% 0%SE 1009 24% 46% 23% 6% 1% 1%UK 1310 20% 55% 20% 3% 1% 0%BG 1002 11% 31% 30% 19% 7% 2%HR 1000 13% 40% 35% 9% 2% 1%RO 1003 11% 45% 32% 9% 2% 2%TR 1005 15% 37% 34% 10% 3% 1%CY (tcc) 500 18% 43% 27% 10% 2% 1%
Have you felt happy
QA5.8 Les questions suivantes portent sur comment vous vous sentez et sur la façon dont vous vous êtes porté au coursdes 4 dernières semaines. Pour chaque question, veuillez indiquer la réponse qui se rapproche le plus de ce que vousavez ressenti. A quelle fréquence au cours de ces 4 dernières semaines … ?
Avez-vous été heureux(se)
QA5.8 These questions are about how you feel and how things have been with you during the past 4weeks. For each question, please give the one answer that comes closest to the way you have beenfeeling. How much of the time during the past 4 weeks...?

EUROBAROMETER 64.4VOLUME A Pondéré Weighted Terrain/Fieldwork : 12/2005
TOTAL
Tout le temps / All the time
La plupart du temps / Most of
the time
Quelquefois / Sometimes
Rarement / Rarely
Jamais / Never
NSP / DK
UE25�EU25 24738 4% 14% 48% 23% 11% 0%BE 1011 4% 13% 39% 28% 15% - CZ 1012 3% 11% 48% 33% 5% 0%DK 1039 3% 12% 45% 26% 14% 0%D-W 1015 2% 13% 49% 27% 9% 0%DE 1515 3% 13% 49% 27% 9% 0%D-E 500 3% 11% 48% 28% 10% - EE 1000 5% 14% 54% 20% 6% 0%EL 999 5% 20% 45% 21% 9% 0%ES 1000 3% 15% 42% 26% 14% 0%FR 1031 5% 13% 49% 17% 16% 0%IE 1000 2% 10% 58% 24% 6% 0%IT 1011 4% 17% 49% 21% 9% 0%CY 507 6% 21% 46% 14% 13% - LV 1046 2% 14% 52% 22% 9% 0%LT 1022 4% 19% 46% 24% 7% 1%LU 500 3% 15% 49% 15% 18% 0%HU 1010 7% 21% 42% 23% 6% - MT 500 2% 11% 59% 23% 5% 0%NL 1127 4% 15% 45% 20% 16% 0%AT 1019 0% 10% 52% 31% 7% 0%PL 1000 4% 15% 48% 24% 9% 0%PT 1004 4% 16% 44% 25% 10% 1%SI 1028 3% 11% 59% 22% 5% 0%SK 1015 3% 15% 49% 28% 4% 1%FI 1023 3% 11% 51% 24% 11% 0%SE 1009 5% 15% 53% 18% 9% 0%UK 1310 5% 15% 53% 17% 10% 0%BG 1002 5% 16% 38% 32% 8% 1%HR 1000 5% 16% 52% 20% 6% 1%RO 1003 5% 14% 43% 30% 7% 1%TR 1005 5% 15% 44% 28% 7% 2%CY (tcc) 500 8% 19% 42% 20% 10% 1%
Have you felt tired
QA5.9 Les questions suivantes portent sur comment vous vous sentez et sur la façon dont vous vous êtes porté au cours des 4dernières semaines. Pour chaque question, veuillez indiquer la réponse qui se rapproche le plus de ce que vous avez ressenti. Aquelle fréquence au cours de ces 4 dernières semaines … ?
Vous êtes-vous senti(e) fatigué(e)
QA5.9 These questions are about how you feel and how things have been with you during the past 4weeks. For each question, please give the one answer that comes closest to the way you have beenfeeling. How much of the time during the past 4 weeks...?

EUROBAROMETER 64.4VOLUME A Pondéré Weighted Terrain/Fieldwork : 12/2005
TOTAL
Tout le temps / All the time
La plupart du temps / Most
of the time
Quelquefois / Sometimes
Rarement / Rarely
Jamais / Never
NSP / DK
UE25�EU25 24738 2% 6% 13% 19% 60% 0%BE 1011 3% 6% 12% 17% 62% - CZ 1012 1% 4% 11% 19% 64% 0%DK 1039 2% 4% 14% 22% 58% 1%D-W 1015 2% 5% 10% 19% 64% 0%DE 1515 2% 5% 11% 19% 63% 0%D-E 500 2% 4% 11% 21% 62% - EE 1000 3% 6% 12% 16% 60% 2%EL 999 3% 6% 15% 22% 55% - ES 1000 1% 4% 11% 14% 69% 0%FR 1031 2% 5% 13% 14% 65% 0%IE 1000 1% 4% 12% 17% 65% 1%IT 1011 2% 8% 18% 24% 47% 0%CY 507 2% 6% 19% 20% 54% - LV 1046 4% 6% 16% 19% 53% 2%LT 1022 4% 10% 19% 18% 48% 1%LU 500 2% 3% 12% 11% 72% 0%HU 1010 3% 6% 11% 17% 62% 1%MT 500 2% 5% 14% 25% 55% 0%NL 1127 3% 6% 16% 19% 55% 0%AT 1019 0% 3% 19% 25% 52% 1%PL 1000 3% 7% 13% 23% 53% 2%PT 1004 2% 8% 15% 16% 59% 1%SI 1028 1% 4% 13% 25% 57% 0%SK 1015 3% 5% 17% 31% 44% 1%FI 1023 2% 5% 14% 21% 57% 0%SE 1009 2% 5% 14% 18% 60% 0%UK 1310 3% 5% 11% 15% 66% 0%BG 1002 4% 8% 14% 21% 51% 3%HR 1000 3% 7% 19% 20% 51% 1%RO 1003 4% 8% 13% 19% 55% 1%TR 1005 3% 6% 15% 19% 53% 4%CY (tcc) 500 4% 10% 18% 19% 49% 1%
QA6 Au cours des 4 dernières semaines, à quelle fréquence votre santé physique ou des problèmes émotionnels vousont-ils gêné(e) dans vos activités sociales (par exemple, rendre visite à des amis, la famille, etc.) ?
QA6 During the past 4 weeks, how much of the time has your physical health or emotional problemsinterfered with social activities (like visiting friends, relatives, etc.)?

EUROBAROMETER 64.4VOLUME A Pondéré Weighted Terrain/Fieldwork : 12/2005
TOTALNon /
No
Oui, un(e) médecin
généraliste / Yes, a general practitioner
Oui, un(e) pharmacien(ne) / Yes, a pharmacist
Oui, un(e) psychiatre /
Yes, a psychiatrist
Oui, un(e) psychologue /
Yes, a psychologist
Oui, un(e) psychanalyste /
Yes, a psychoanalyst
Oui, un(e) infirmier\
infirmière / Yes, a nurse
Oui, un(e) assistant(e)
social(e) / Yes, a social worker
Oui, un(e) psychothérapeute non mentionné(e) précédemment /
Yes, a psychotherapist not
mentioned previously
Oui, un(e) autre professionnel(le) de la santé / Yes,
another health professional
NSP / DK
Oui / Yes
UE25�EU25 24738 87% 9% 2% 2% 2% 0% 0% 0% 1% 2% 0% 13%BE 1011 88% 8% 1% 2% 1% 0% 1% 1% 1% 1% 0% 12%CZ 1012 86% 8% 2% 2% 1% 0% 1% 1% 1% 2% 1% 13%DK 1039 83% 13% 1% 1% 4% - 1% 1% 1% 2% 1% 17%D-W 1015 85% 12% 3% 1% 2% 0% 0% 1% 1% 1% 0% 14%DE 1515 85% 11% 3% 1% 2% 0% 0% 1% 1% 1% 0% 14%D-E 500 86% 11% 1% 1% 2% 0% 0% 0% 2% 2% 0% 14%EE 1000 83% 13% 2% 3% 1% 0% 0% 1% 0% 2% 0% 17%EL 999 87% 7% 3% 2% 1% 0% 0% 0% 0% 2% - 13%ES 1000 90% 6% 1% 2% 4% - 0% 0% 0% 1% 0% 10%FR 1031 86% 9% 1% 3% 2% 0% 1% 1% 1% 2% 0% 14%IE 1000 86% 13% 2% 0% 1% 0% 1% 1% 0% 1% 0% 14%IT 1011 88% 8% 2% 1% 1% 0% - - 0% 1% 0% 12%CY 507 90% 4% 1% 1% 2% - 0% 0% - 4% 0% 10%LV 1046 89% 8% 1% 1% 1% - 1% 0% 1% 0% 1% 10%LT 1022 83% 12% 4% 3% 1% - 0% 0% 0% 1% 0% 16%LU 500 78% 17% 6% 3% 1% 0% 1% 1% 0% 6% - 22%HU 1010 86% 8% 1% 3% 1% - 0% 0% 0% 1% 1% 13%MT 500 91% 6% 1% 2% 1% - 0% 0% - 2% - 9%NL 1127 82% 8% 3% 3% 5% 0% 1% 2% 2% 3% 0% 17%AT 1019 84% 12% 1% 1% 1% 0% 0% 0% 1% 1% 0% 15%PL 1000 89% 7% 1% 2% 2% 0% - 0% 0% 1% 0% 11%PT 1004 83% 11% 0% 4% 2% 0% 0% 0% 0% 2% 0% 16%SI 1028 89% 9% 2% 2% 1% 0% 0% 0% 0% 1% 0% 11%SK 1015 82% 14% 4% 1% 1% - 1% 0% 0% 6% 0% 18%FI 1023 90% 5% 0% 3% 2% 0% 1% 1% 0% 1% 0% 10%SE 1009 86% 8% 1% 1% 3% 0% 2% 0% 0% 4% 0% 13%UK 1310 87% 10% 1% 1% 1% 0% 1% 1% 0% 2% 0% 12%BG 1002 83% 14% 2% 1% 0% - 0% 1% - 2% 2% 16%HR 1000 85% 11% 3% 3% 1% 0% 1% 0% 0% 1% 1% 14%RO 1003 69% 22% 8% 1% 0% - 0% 0% 0% 7% 1% 30%TR 1005 92% 4% - 2% 2% 0% - 0% 0% 0% 0% 8%CY (tcc) 500 89% 3% 0% 2% 4% 0% - 1% - 1% 3% 9%
QA7 Au cours des 12 derniers mois, avez-vous cherché de l’aide auprès d’un(e) professionnel(le) suite à un problème psychique oupsychologique ? (SI OUI) Indiquez de quelle personne il s’agissait dans la liste suivante. (PLUSIEURS REPONSES POSSIBLES)
QA7 In the last 12 months, did you seek help from a professional in respect of a psychological or emotional health problem? (IF YES)Indicate who in the following list. (MULTIPLE ANSWERS POSSIBLE)
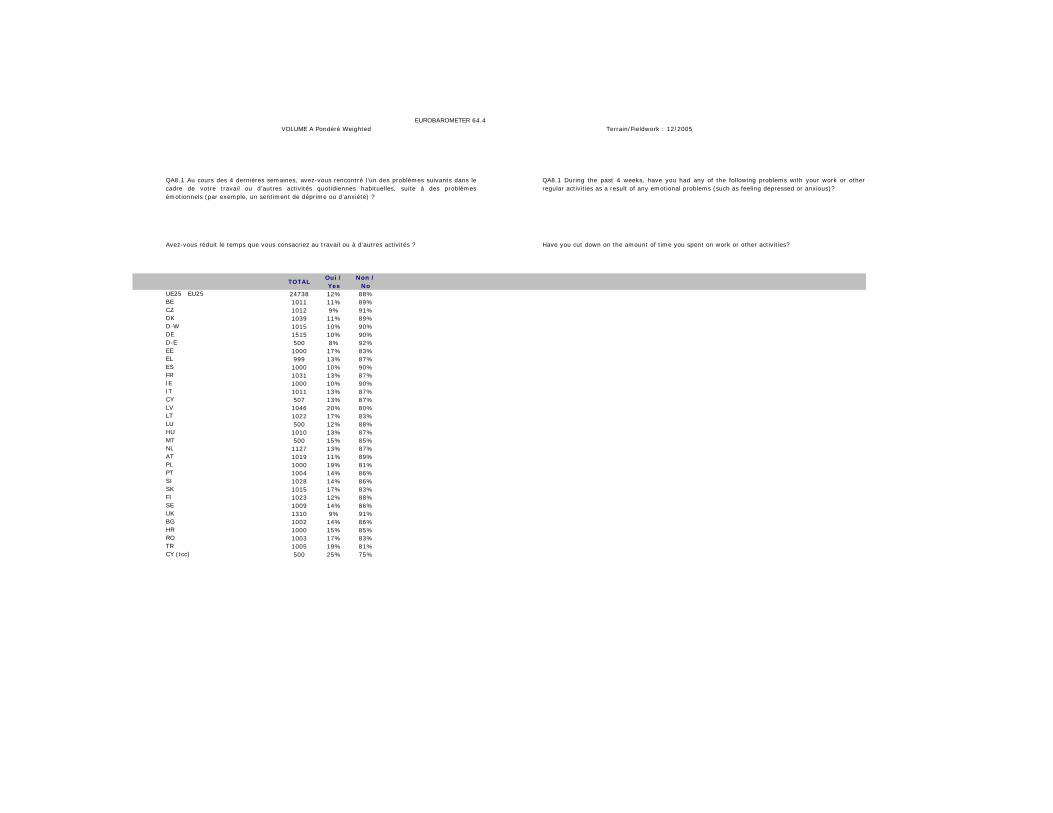
EUROBAROMETER 64.4VOLUME A Pondéré Weighted Terrain/Fieldwork : 12/2005
TOTALOui / Yes
Non / No
UE25�EU25 24738 12% 88%BE 1011 11% 89%CZ 1012 9% 91%DK 1039 11% 89%D-W 1015 10% 90%DE 1515 10% 90%D-E 500 8% 92%EE 1000 17% 83%EL 999 13% 87%ES 1000 10% 90%FR 1031 13% 87%IE 1000 10% 90%IT 1011 13% 87%CY 507 13% 87%LV 1046 20% 80%LT 1022 17% 83%LU 500 12% 88%HU 1010 13% 87%MT 500 15% 85%NL 1127 13% 87%AT 1019 11% 89%PL 1000 19% 81%PT 1004 14% 86%SI 1028 14% 86%SK 1015 17% 83%FI 1023 12% 88%SE 1009 14% 86%UK 1310 9% 91%BG 1002 14% 86%HR 1000 15% 85%RO 1003 17% 83%TR 1005 19% 81%CY (tcc) 500 25% 75%
Have you cut down on the amount of time you spent on work or other activities?
QA8.1 Au cours des 4 dernières semaines, avez-vous rencontré l’un des problèmes suivants dans lecadre de votre travail ou d’autres activités quotidiennes habituelles, suite à des problèmesémotionnels (par exemple, un sentiment de déprime ou d’anxiété) ?
Avez-vous réduit le temps que vous consacriez au travail ou à d’autres activités ?
QA8.1 During the past 4 weeks, have you had any of the following problems with your work or otherregular activities as a result of any emotional problems (such as feeling depressed or anxious)?
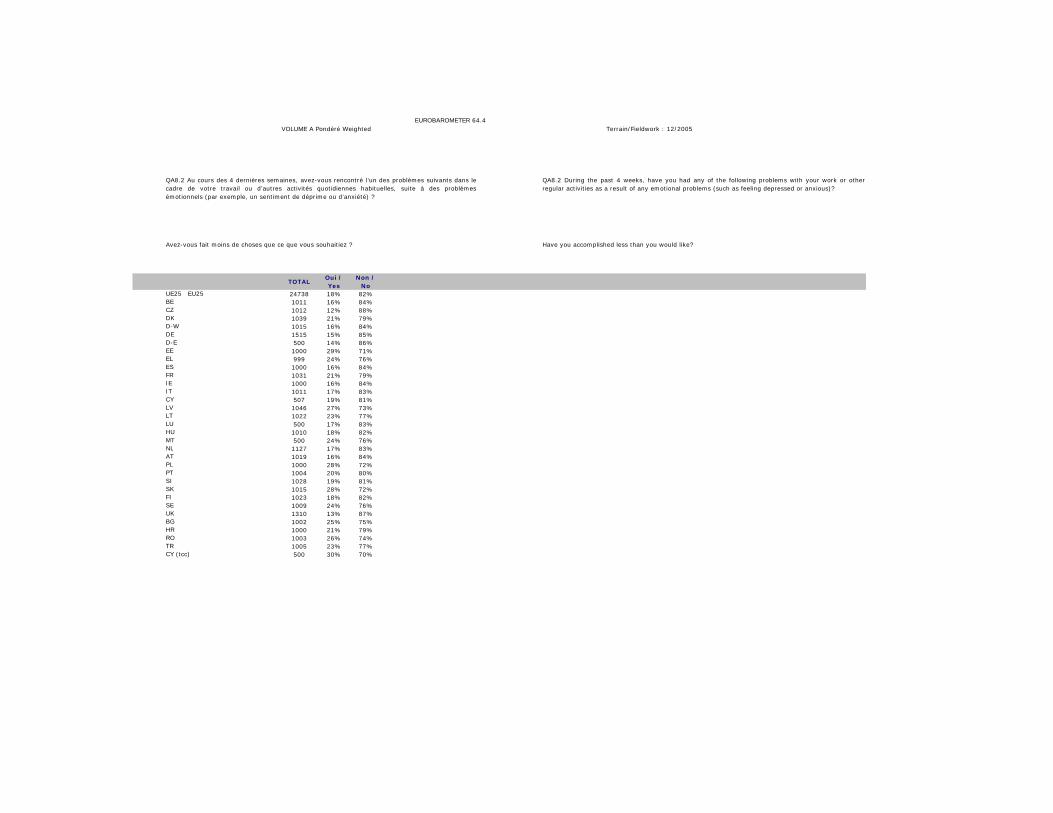
EUROBAROMETER 64.4VOLUME A Pondéré Weighted Terrain/Fieldwork : 12/2005
TOTALOui / Yes
Non / No
UE25�EU25 24738 18% 82%BE 1011 16% 84%CZ 1012 12% 88%DK 1039 21% 79%D-W 1015 16% 84%DE 1515 15% 85%D-E 500 14% 86%EE 1000 29% 71%EL 999 24% 76%ES 1000 16% 84%FR 1031 21% 79%IE 1000 16% 84%IT 1011 17% 83%CY 507 19% 81%LV 1046 27% 73%LT 1022 23% 77%LU 500 17% 83%HU 1010 18% 82%MT 500 24% 76%NL 1127 17% 83%AT 1019 16% 84%PL 1000 28% 72%PT 1004 20% 80%SI 1028 19% 81%SK 1015 28% 72%FI 1023 18% 82%SE 1009 24% 76%UK 1310 13% 87%BG 1002 25% 75%HR 1000 21% 79%RO 1003 26% 74%TR 1005 23% 77%CY (tcc) 500 30% 70%
Have you accomplished less than you would like?
QA8.2 Au cours des 4 dernières semaines, avez-vous rencontré l’un des problèmes suivants dans lecadre de votre travail ou d’autres activités quotidiennes habituelles, suite à des problèmesémotionnels (par exemple, un sentiment de déprime ou d’anxiété) ?
Avez-vous fait moins de choses que ce que vous souhaitiez ?
QA8.2 During the past 4 weeks, have you had any of the following problems with your work or otherregular activities as a result of any emotional problems (such as feeling depressed or anxious)?
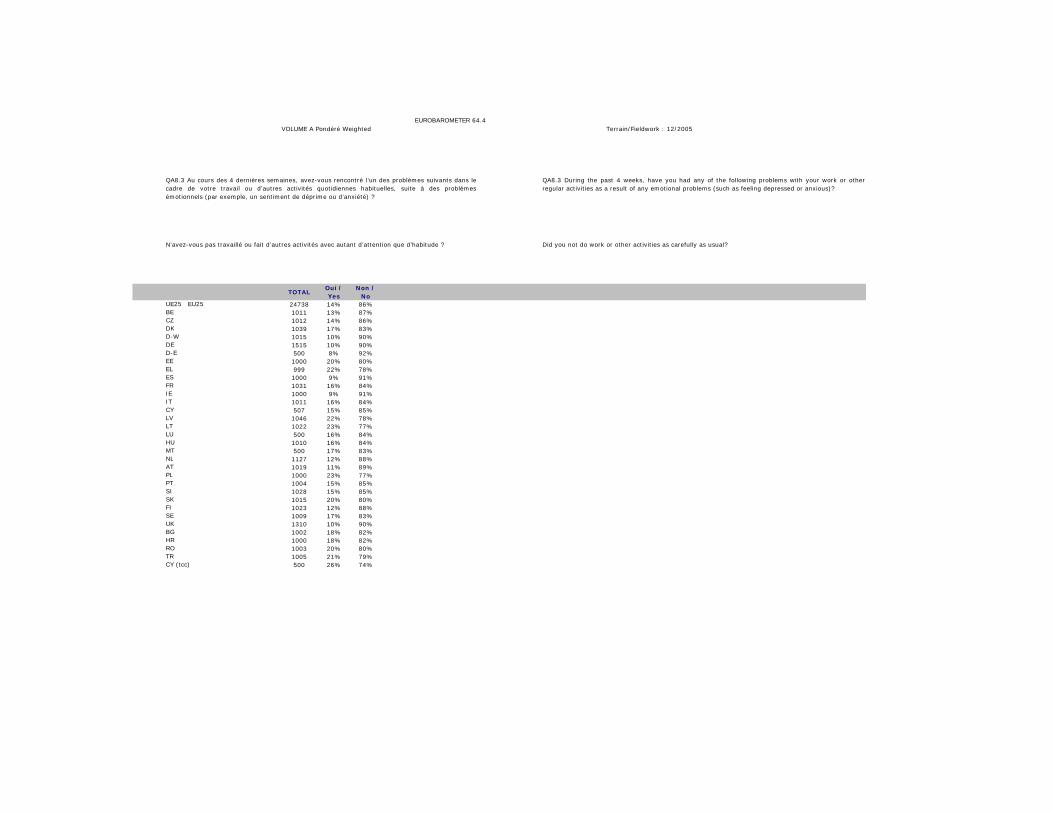
EUROBAROMETER 64.4VOLUME A Pondéré Weighted Terrain/Fieldwork : 12/2005
TOTALOui / Yes
Non / No
UE25�EU25 24738 14% 86%BE 1011 13% 87%CZ 1012 14% 86%DK 1039 17% 83%D-W 1015 10% 90%DE 1515 10% 90%D-E 500 8% 92%EE 1000 20% 80%EL 999 22% 78%ES 1000 9% 91%FR 1031 16% 84%IE 1000 9% 91%IT 1011 16% 84%CY 507 15% 85%LV 1046 22% 78%LT 1022 23% 77%LU 500 16% 84%HU 1010 16% 84%MT 500 17% 83%NL 1127 12% 88%AT 1019 11% 89%PL 1000 23% 77%PT 1004 15% 85%SI 1028 15% 85%SK 1015 20% 80%FI 1023 12% 88%SE 1009 17% 83%UK 1310 10% 90%BG 1002 18% 82%HR 1000 18% 82%RO 1003 20% 80%TR 1005 21% 79%CY (tcc) 500 26% 74%
Did you not do work or other activities as carefully as usual?
QA8.3 Au cours des 4 dernières semaines, avez-vous rencontré l’un des problèmes suivants dans lecadre de votre travail ou d’autres activités quotidiennes habituelles, suite à des problèmesémotionnels (par exemple, un sentiment de déprime ou d’anxiété) ?
N’avez-vous pas travaillé ou fait d’autres activités avec autant d’attention que d’habitude ?
QA8.3 During the past 4 weeks, have you had any of the following problems with your work or otherregular activities as a result of any emotional problems (such as feeling depressed or anxious)?

EUROBAROMETER 64.4VOLUME A Pondéré Weighted Terrain/Fieldwork : 12/2005
TOTALOui / Yes
Non / No
UE25�EU25 24738 6% 94%BE 1011 10% 90%CZ 1012 3% 97%DK 1039 10% 90%D-W 1015 5% 95%DE 1515 5% 95%D-E 500 6% 94%EE 1000 6% 94%EL 999 6% 94%ES 1000 4% 96%FR 1031 6% 94%IE 1000 5% 95%IT 1011 9% 91%CY 507 10% 90%LV 1046 7% 93%LT 1022 7% 93%LU 500 12% 88%HU 1010 3% 97%MT 500 5% 95%NL 1127 13% 87%AT 1019 7% 93%PL 1000 7% 93%PT 1004 4% 96%SI 1028 5% 95%SK 1015 7% 93%FI 1023 6% 94%SE 1009 6% 94%UK 1310 5% 95%BG 1002 5% 95%HR 1000 6% 94%RO 1003 4% 96%TR 1005 10% 90%CY (tcc) 500 15% 85%
Have you missed work days?
QA8.4 Au cours des 4 dernières semaines, avez-vous rencontré l’un des problèmes suivants dans lecadre de votre travail ou d’autres activités quotidiennes habituelles, suite à des problèmesémotionnels (par exemple, un sentiment de déprime ou d’anxiété) ?
Avez-vous manqué des jours de travail ?
QA8.4 During the past 4 weeks, have you had any of the following problems with your work or otherregular activities as a result of any emotional problems (such as feeling depressed or anxious)?

EUROBAROMETER 64.4VOLUME A Pondéré Weighted Terrain/Fieldwork : 12/2005
TOTALOui / Yes
Non / No
NSP / DK
UE25�EU25 24738 3% 96% 1%BE 1011 4% 96% - CZ 1012 2% 98% - DK 1039 4% 96% 0%D-W 1015 2% 97% 0%DE 1515 2% 97% 0%D-E 500 3% 97% 1%EE 1000 2% 97% 0%EL 999 2% 98% 0%ES 1000 5% 92% 3%FR 1031 5% 95% 1%IE 1000 3% 95% 2%IT 1011 2% 97% 0%CY 507 3% 96% 1%LV 1046 3% 97% 0%LT 1022 3% 96% 0%LU 500 3% 97% 0%HU 1010 4% 95% 1%MT 500 3% 97% 0%NL 1127 7% 93% 0%AT 1019 3% 95% 2%PL 1000 4% 96% 0%PT 1004 5% 95% 0%SI 1028 3% 94% 3%SK 1015 3% 97% 1%FI 1023 5% 94% 0%SE 1009 5% 94% 1%UK 1310 3% 97% 0%BG 1002 2% 95% 3%HR 1000 4% 94% 1%RO 1003 1% 97% 3%TR 1005 5% 92% 2%CY (tcc) 500 5% 94% 2%
You have received psychotherapy due to psychological or emotional health problems
QA9.1 Veuillez indiquer lesquelles des affirmations suivantes s’appliquent éventuellement à votresituation. Au cours des 12 derniers mois …
Vous avez suivi une psychothérapie suite à des problèmes psychiques ou psychologiques
QA9.1 Please indicate which ones of the following statements possibly apply to your situation. In the last12 months…

EUROBAROMETER 64.4VOLUME A Pondéré Weighted Terrain/Fieldwork : 12/2005
TOTALOui / Yes
Non / No
NSP / DK
UE25�EU25 24738 7% 92% 1%BE 1011 8% 92% - CZ 1012 6% 94% 0%DK 1039 7% 93% 0%D-W 1015 7% 93% 0%DE 1515 7% 93% 0%D-E 500 7% 92% 0%EE 1000 10% 90% 0%EL 999 4% 96% - ES 1000 6% 90% 3%FR 1031 9% 90% 1%IE 1000 6% 92% 2%IT 1011 5% 95% 1%CY 507 2% 97% 1%LV 1046 9% 91% 0%LT 1022 11% 89% 0%LU 500 10% 90% 0%HU 1010 9% 91% 0%MT 500 5% 95% 0%NL 1127 8% 92% 0%AT 1019 10% 89% 1%PL 1000 8% 92% 0%PT 1004 10% 89% 1%SI 1028 6% 92% 3%SK 1015 6% 93% 1%FI 1023 7% 93% 0%SE 1009 7% 92% 1%UK 1310 8% 92% 0%BG 1002 6% 91% 3%HR 1000 9% 90% 1%RO 1003 5% 93% 2%TR 1005 9% 89% 2%CY (tcc) 500 6% 92% 2%
You have taken drugs due to psychological or emotional health problems
QA9.2 Veuillez indiquer lesquelles des affirmations suivantes s’appliquent éventuellement à votresituation. Au cours des 12 derniers mois …
Vous avez pris des médicaments suite à des problèmes psychiques ou psychologiques
QA9.2 Please indicate which ones of the following statements possibly apply to your situation. In the last12 months…

EUROBAROMETER 64.4VOLUME A Pondéré Weighted Terrain/Fieldwork : 12/2005
TOTALOui / Yes
Non / No
NSP / DK
UE25�EU25 24738 1% 98% 1%BE 1011 5% 95% - CZ 1012 1% 99% - DK 1039 1% 99% 0%D-W 1015 1% 99% 0%DE 1515 1% 98% 0%D-E 500 2% 97% 0%EE 1000 1% 99% 0%EL 999 1% 99% - ES 1000 2% 95% 3%FR 1031 2% 98% 1%IE 1000 1% 97% 2%IT 1011 1% 98% 1%CY 507 1% 98% 1%LV 1046 2% 98% 0%LT 1022 2% 98% - LU 500 2% 98% 0%HU 1010 2% 98% 0%MT 500 1% 99% 0%NL 1127 1% 99% 0%AT 1019 2% 97% 0%PL 1000 1% 99% 0%PT 1004 1% 99% 0%SI 1028 0% 97% 3%SK 1015 1% 98% 1%FI 1023 1% 99% 0%SE 1009 0% 98% 1%UK 1310 2% 98% 0%BG 1002 1% 96% 3%HR 1000 2% 97% 1%RO 1003 1% 97% 2%TR 1005 3% 95% 3%CY (tcc) 500 2% 97% 2%
You have been admitted to hospital due to psychological or emotional health problems
QA9.3 Veuillez indiquer lesquelles des affirmations suivantes s’appliquent éventuellement à votresituation. Au cours des 12 derniers mois …
Vous avez été admis(e) à l’hôpital suite à des problèmes psychiques ou psychologiques
QA9.3 Please indicate which ones of the following statements possibly apply to your situation. In the last12 months…

EUROBAROMETER 64.4VOLUME A Pondéré Weighted
TOTAL
Vous chercheriez l’aide d’un(e) professionnel(le) de la santé / You would
seek support from a health professional
Vous chercheriez l’aide d’un
membre de votre famille / You would seek
support from a family member
Vous chercheriez l’aide d’un(e) ami(e)
/ You would seek support from a friend
Vous chercheriez l’aide d’un(e)
conseiller(ère) religieux(se) / You
would seek support from a
religious counsellor
Vous chercheriez l’aide d’un(e)
enseignant(e) / You would seek support from a school teacher
Vous appelleriez un service d’aide
téléphonique / You would call a help line
Autre (SPONTANE) /Other
(SPONTANEOUS)
NSP / DK
UE25�EU25 24738 50% 53% 22% 2% 0% 2% 2% 2%BE 1011 51% 54% 33% 2% 0% 1% 3% 1%CZ 1012 46% 58% 22% 1% 0% 5% 1% 2%DK 1039 68% 53% 29% 2% 1% 1% 1% 1%D-W 1015 46% 64% 24% 2% 0% 1% 1% 1%DE 1515 48% 63% 24% 2% 0% 1% 1% 1%D-E 500 59% 60% 21% 1% - 1% 1% 1%EE 1000 40% 62% 30% 2% 0% 1% 5% 3%EL 999 46% 62% 28% 4% 0% 3% 2% - ES 1000 60% 49% 19% 0% 1% 0% 1% 2%FR 1031 43% 58% 31% 1% 0% 1% 1% 3%IE 1000 64% 42% 21% 2% 0% 2% 0% 3%IT 1011 56% 48% 12% 2% 0% 6% 1% 1%CY 507 32% 69% 32% 5% 0% 1% 4% 1%LV 1046 53% 48% 21% 2% 1% 1% 3% 1%LT 1022 63% 36% 12% 2% 0% 1% 2% 3%LU 500 43% 60% 27% 1% 0% 0% 4% 2%HU 1010 39% 63% 10% 1% 0% 0% 4% 3%MT 500 63% 58% 14% 3% 0% 2% 2% 1%NL 1127 38% 49% 37% 2% 0% 1% 5% 1%AT 1019 58% 50% 29% 4% 0% 5% 1% 5%PL 1000 52% 47% 19% 3% - 1% 2% 3%PT 1004 70% 46% 5% - - 1% 2% 1%SI 1028 66% 58% 25% 3% 0% 1% 1% 1%SK 1015 60% 60% 22% 5% 0% 5% 1% 2%FI 1023 40% 53% 34% 2% 0% 1% 2% 1%SE 1009 54% 34% 13% 1% 1% 1% 2% 2%UK 1310 44% 51% 22% 2% 0% 1% 2% 1%BG 1002 79% 31% 11% 2% 0% 1% 1% 3%HR 1000 58% 54% 16% 1% 0% 0% 2% 1%RO 1003 74% 41% 13% 3% 0% 2% 1% 2%TR 1005 51% 47% 28% 1% 0% 1% 1% 3%CY (tcc) 500 27% 60% 33% 1% 1% 1% 8% 3%
QA10 Si vous vous sentiez mal, auprès de qui chercheriez-vous un soutien en premier ? (PLUSIEURS REPONSES POSSIBLES) QA10 If you were feeling bad, where would you seek moresupport first? (MULTIPLE ANSWERS POSSIBLE)

EUROBAROMETER 64.4VOLUME A Pondéré Weighted Terrain/Fieldwork : 12/2005
TOTAL
Très facile /
Very easy
Plutôt facile / Fairly easy
Plutôt difficile /
Fairly difficult
Très difficile / Very difficult
NSP / DK
Facile / Easy
Difficile / Difficult
UE25�EU25 24738 14% 41% 23% 6% 17% 55% 28%BE 1011 16% 48% 23% 7% 6% 64% 29%CZ 1012 16% 42% 23% 5% 14% 57% 29%DK 1039 18% 36% 9% 3% 34% 54% 12%D-W 1015 16% 39% 24% 8% 12% 55% 33%DE 1515 17% 39% 24% 8% 13% 56% 32%D-E 500 18% 40% 24% 4% 14% 58% 28%EE 1000 9% 38% 18% 4% 31% 47% 22%EL 999 30% 34% 21% 9% 6% 64% 30%ES 1000 15% 43% 21% 6% 15% 58% 27%FR 1031 8% 41% 28% 4% 19% 50% 32%IE 1000 20% 41% 12% 4% 23% 61% 16%IT 1011 7% 43% 32% 7% 11% 50% 39%CY 507 38% 38% 12% 2% 10% 75% 15%LV 1046 13% 40% 19% 6% 23% 53% 24%LT 1022 11% 37% 20% 4% 27% 49% 24%LU 500 12% 30% 26% 10% 22% 43% 35%HU 1010 8% 30% 24% 7% 31% 38% 31%MT 500 11% 46% 14% 5% 24% 58% 19%NL 1127 33% 34% 7% 3% 23% 66% 10%AT 1019 7% 30% 28% 7% 28% 37% 35%PL 1000 11% 44% 24% 4% 17% 55% 28%PT 1004 6% 34% 28% 13% 19% 40% 41%SI 1028 11% 45% 23% 6% 15% 57% 29%SK 1015 10% 36% 36% 10% 8% 46% 46%FI 1023 20% 47% 20% 4% 10% 66% 24%SE 1009 12% 32% 15% 5% 35% 44% 21%UK 1310 15% 48% 12% 3% 22% 63% 15%BG 1002 9% 24% 20% 10% 37% 33% 30%HR 1000 14% 32% 29% 11% 15% 46% 40%RO 1003 7% 26% 20% 8% 39% 34% 27%TR 1005 15% 28% 29% 15% 13% 43% 44%CY (tcc) 500 26% 31% 12% 7% 25% 57% 19%
QA11 Dans quelle mesure estimez-vous qu’il est facile ou difficile de trouver des informations sur lesproblèmes psychiques ou psychologiques et sur les méthodes permettant d’y faire face ?
QA11 How easy or difficult do you find it is to find information on psychological or emotional healthproblems and how to deal with them?

EUROBAROMETER 64.4VOLUME A Pondéré Weighted Terrain/Fieldwork : 12/2005
TOTAL
Tout à fait d'accord /
Totally agree
Plutôt d'accord /
Tend to agree
Plutôt pas d'accord / Tend
to disagree
Pas du tout d'accord /
Totally disagree
NSP / DK
D'accord / Agree
Pas d'accord / Disagree
UE25�EU25 24738 7% 30% 34% 21% 8% 37% 56%BE 1011 4% 28% 40% 27% 2% 32% 67%CZ 1012 10% 37% 35% 13% 5% 48% 48%DK 1039 6% 38% 32% 18% 5% 44% 50%D-W 1015 5% 23% 40% 26% 6% 28% 66%DE 1515 5% 22% 41% 27% 6% 27% 67%D-E 500 3% 21% 43% 28% 5% 24% 71%EE 1000 13% 47% 20% 11% 9% 60% 31%EL 999 15% 28% 32% 24% 2% 42% 56%ES 1000 4% 23% 28% 36% 10% 27% 63%FR 1031 4% 29% 36% 23% 8% 33% 60%IE 1000 3% 22% 34% 29% 12% 25% 63%IT 1011 10% 39% 28% 15% 8% 49% 43%CY 507 9% 28% 35% 24% 4% 37% 59%LV 1046 19% 44% 24% 8% 5% 63% 31%LT 1022 16% 52% 21% 5% 6% 68% 26%LU 500 4% 24% 28% 39% 6% 28% 67%HU 1010 4% 23% 37% 26% 10% 27% 64%MT 500 7% 43% 24% 15% 11% 50% 38%NL 1127 3% 22% 40% 31% 4% 25% 71%AT 1019 7% 23% 41% 20% 9% 29% 61%PL 1000 13% 38% 34% 7% 8% 50% 42%PT 1004 4% 34% 30% 22% 9% 38% 53%SI 1028 7% 28% 39% 23% 4% 35% 61%SK 1015 7% 34% 37% 17% 5% 41% 54%FI 1023 5% 26% 44% 22% 3% 31% 66%SE 1009 6% 49% 25% 16% 4% 55% 41%UK 1310 6% 32% 35% 16% 11% 38% 51%BG 1002 13% 36% 26% 13% 12% 49% 39%HR 1000 12% 33% 32% 16% 6% 45% 49%RO 1003 11% 32% 27% 16% 14% 43% 43%TR 1005 20% 25% 15% 35% 5% 45% 50%CY (tcc) 500 16% 23% 13% 41% 7% 39% 54%
People with psychological or emotional health problems constitute a danger to others
QA12.1 Dans quelle mesure êtes-vous d’accord ou pas d’accord avec les affirmations suivantes ?
Les personnes qui souffrent de problèmes psychiques ou psychologiques sont un danger pour les autres
QA12.1 To what extent do you agree or disagree with the following statements?
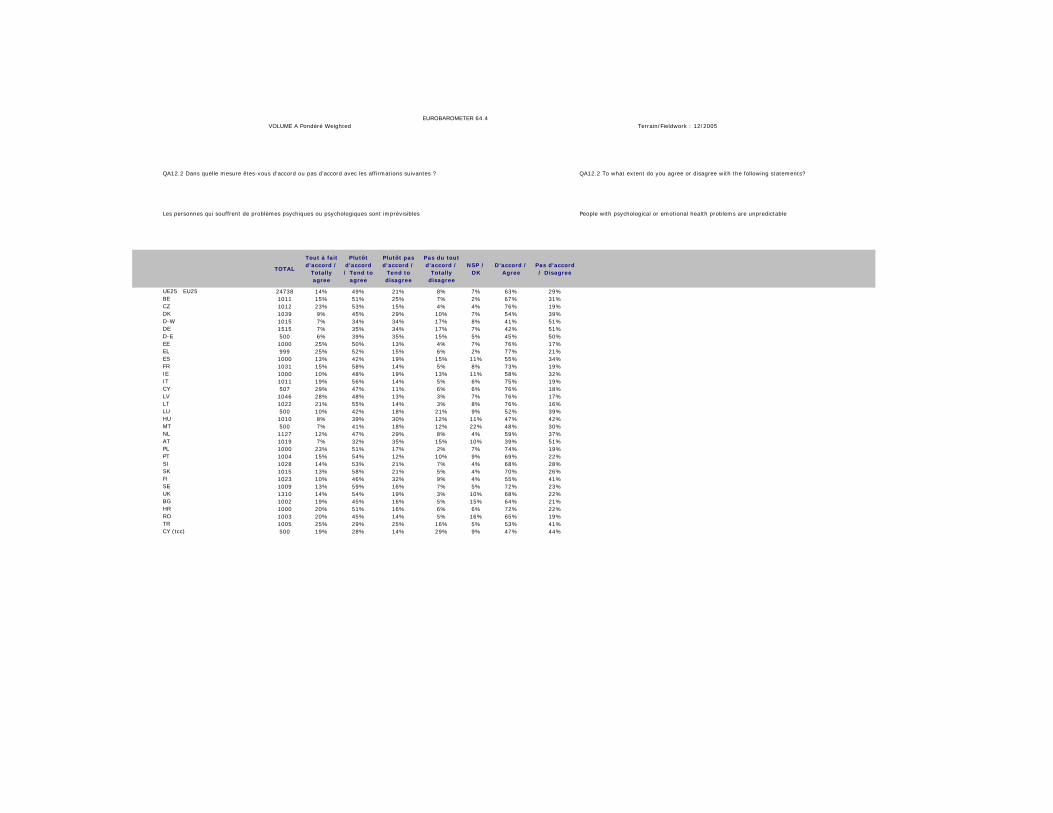
EUROBAROMETER 64.4VOLUME A Pondéré Weighted Terrain/Fieldwork : 12/2005
TOTAL
Tout à fait d'accord /
Totally agree
Plutôt d'accord / Tend to
agree
Plutôt pas d'accord /
Tend to disagree
Pas du tout d'accord /
Totally disagree
NSP / DK
D'accord / Agree
Pas d'accord / Disagree
UE25�EU25 24738 14% 49% 21% 8% 7% 63% 29%BE 1011 15% 51% 25% 7% 2% 67% 31%CZ 1012 23% 53% 15% 4% 4% 76% 19%DK 1039 9% 45% 29% 10% 7% 54% 39%D-W 1015 7% 34% 34% 17% 8% 41% 51%DE 1515 7% 35% 34% 17% 7% 42% 51%D-E 500 6% 39% 35% 15% 5% 45% 50%EE 1000 25% 50% 13% 4% 7% 76% 17%EL 999 25% 52% 15% 6% 2% 77% 21%ES 1000 13% 42% 19% 15% 11% 55% 34%FR 1031 15% 58% 14% 5% 8% 73% 19%IE 1000 10% 48% 19% 13% 11% 58% 32%IT 1011 19% 56% 14% 5% 6% 75% 19%CY 507 29% 47% 11% 6% 6% 76% 18%LV 1046 28% 48% 13% 3% 7% 76% 17%LT 1022 21% 55% 14% 3% 8% 76% 16%LU 500 10% 42% 18% 21% 9% 52% 39%HU 1010 8% 39% 30% 12% 11% 47% 42%MT 500 7% 41% 18% 12% 22% 48% 30%NL 1127 12% 47% 29% 8% 4% 59% 37%AT 1019 7% 32% 35% 15% 10% 39% 51%PL 1000 23% 51% 17% 2% 7% 74% 19%PT 1004 15% 54% 12% 10% 9% 69% 22%SI 1028 14% 53% 21% 7% 4% 68% 28%SK 1015 13% 58% 21% 5% 4% 70% 26%FI 1023 10% 46% 32% 9% 4% 55% 41%SE 1009 13% 59% 16% 7% 5% 72% 23%UK 1310 14% 54% 19% 3% 10% 68% 22%BG 1002 19% 45% 16% 5% 15% 64% 21%HR 1000 20% 51% 16% 6% 6% 72% 22%RO 1003 20% 45% 14% 5% 16% 65% 19%TR 1005 25% 29% 25% 16% 5% 53% 41%CY (tcc) 500 19% 28% 14% 29% 9% 47% 44%
People with psychological or emotional health problems are unpredictable
QA12.2 Dans quelle mesure êtes-vous d’accord ou pas d’accord avec les affirmations suivantes ?
Les personnes qui souffrent de problèmes psychiques ou psychologiques sont imprévisibles
QA12.2 To what extent do you agree or disagree with the following statements?
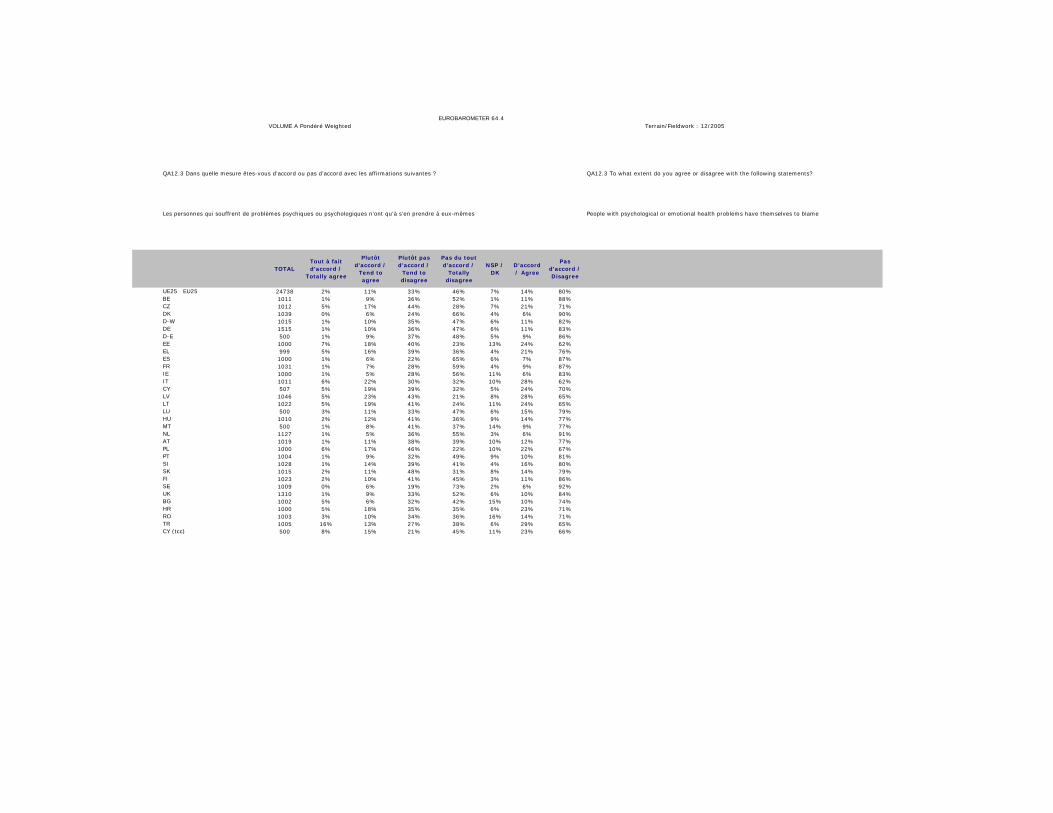
EUROBAROMETER 64.4VOLUME A Pondéré Weighted Terrain/Fieldwork : 12/2005
TOTALTout à fait d'accord /
Totally agree
Plutôt d'accord /
Tend to agree
Plutôt pas d'accord /
Tend to disagree
Pas du tout d'accord /
Totally disagree
NSP / DK
D'accord / Agree
Pas d'accord / Disagree
UE25�EU25 24738 2% 11% 33% 46% 7% 14% 80%BE 1011 1% 9% 36% 52% 1% 11% 88%CZ 1012 5% 17% 44% 28% 7% 21% 71%DK 1039 0% 6% 24% 66% 4% 6% 90%D-W 1015 1% 10% 35% 47% 6% 11% 82%DE 1515 1% 10% 36% 47% 6% 11% 83%D-E 500 1% 9% 37% 48% 5% 9% 86%EE 1000 7% 18% 40% 23% 13% 24% 62%EL 999 5% 16% 39% 36% 4% 21% 76%ES 1000 1% 6% 22% 65% 6% 7% 87%FR 1031 1% 7% 28% 59% 4% 9% 87%IE 1000 1% 5% 28% 56% 11% 6% 83%IT 1011 6% 22% 30% 32% 10% 28% 62%CY 507 5% 19% 39% 32% 5% 24% 70%LV 1046 5% 23% 43% 21% 8% 28% 65%LT 1022 5% 19% 41% 24% 11% 24% 65%LU 500 3% 11% 33% 47% 6% 15% 79%HU 1010 2% 12% 41% 36% 9% 14% 77%MT 500 1% 8% 41% 37% 14% 9% 77%NL 1127 1% 5% 36% 55% 3% 6% 91%AT 1019 1% 11% 38% 39% 10% 12% 77%PL 1000 6% 17% 46% 22% 10% 22% 67%PT 1004 1% 9% 32% 49% 9% 10% 81%SI 1028 1% 14% 39% 41% 4% 16% 80%SK 1015 2% 11% 48% 31% 8% 14% 79%FI 1023 2% 10% 41% 45% 3% 11% 86%SE 1009 0% 6% 19% 73% 2% 6% 92%UK 1310 1% 9% 33% 52% 6% 10% 84%BG 1002 5% 6% 32% 42% 15% 10% 74%HR 1000 5% 18% 35% 35% 6% 23% 71%RO 1003 3% 10% 34% 36% 16% 14% 71%TR 1005 16% 13% 27% 38% 6% 29% 65%CY (tcc) 500 8% 15% 21% 45% 11% 23% 66%
People with psychological or emotional health problems have themselves to blame
QA12.3 Dans quelle mesure êtes-vous d’accord ou pas d’accord avec les affirmations suivantes ?
Les personnes qui souffrent de problèmes psychiques ou psychologiques n’ont qu’à s’en prendre à eux-mêmes
QA12.3 To what extent do you agree or disagree with the following statements?