MEng Report Merged - FINAL
351
MEng Team Project UAS Challenge - 2015 Written By: Alfred Dzadey, Jonathan Ebhota, Zuber Khan, Tarek Kherbouche, Amit Ramji, Mozammel, Mohammed Mohinuddin, Micky Ngouani, Malwenna Malwenna , Hassan Turabi, Osman Sibanda, Mohammed Rayad Ullah Project Supervisor: Ray Wilkinson, Joanna Rawska, Kate Williams, Steve lines
-
Upload
amit-ramji- -
Category
Documents
-
view
16 -
download
1
Transcript of MEng Report Merged - FINAL

MEng Team Project UAS Challenge - 2015
Written By:
Alfred Dzadey, Jonathan Ebhota, Zuber Khan, Tarek Kherbouche, Amit Ramji, Mozammel, Mohammed Mohinuddin, Micky Ngouani, Malwenna Malwenna , Hassan Turabi, Osman Sibanda, Mohammed Rayad
Ullah
Project Supervisor:
Ray Wilkinson, Joanna Rawska, Kate Williams, Steve lines

UAS CHALLENGE 2015
i ACKNOWLEDGEMENTS MEng Team Project Report (7ENT1024) School of Engineering and Technology
ACKNOWLEDGEMENTS We (UAS Challenge MEng Group) would like to thank the supervisors who gave us their support and unconditional attention throughout the course of the project with weekly group meetings and off the clock advice. Their expertise in the subject helped in the successful delivery of this project. Other notable mentions are to the technicians; Chris Childs and Andrew Curl whose expertise, skill and experience were invaluable in the manufacture of the components of the UAS. We would also like to thank Gordon Banks from Ensinger for supplying the materials use for the project at a discounted prize and very swiftly too; Howard Ash for his assistance in the procurement of materials and components; Yigeng Xu for giving the MEng group permission to use E131B for assembly and testing purposes; Clive Borhem for giving technical assistance to the Propulsion Engineer and also everyone who supported the group directly and indirectly.

UAS CHALLENGE 2015
ii TABLE OF CONTENTS MEng Team Project Report (7ENT1024) School of Engineering and Technology
TABLE OF CONTENTS ACKNOWLEDGEMENTS ............................................................................................... i TABLE OF CONTENTS ................................................................................................ ii LIST OF FIGURES ...................................................................................................... vii GLOSSARY ................................................................................................................ xii 1 Introduction ........................................................................................................... 1
1.1 Competition Overview ..................................................................................... 1 1.2 Project Aims .................................................................................................... 1 1.3 The Project Objectives .................................................................................... 2
2 Design Rationale .................................................................................................. 2 2.1 Design Convergence ....................................................................................... 2
2.1.1 Stage 1 Convergence ............................................................................... 2 2.1.2 Stage 2 Convergence ............................................................................... 3
2.2 Further analysis ............................................................................................... 3 3 Project Management ............................................................................................ 4
3.1 Role of the Project Manager ............................................................................ 4 3.2 The Team Structure ......................................................................................... 4 3.3 Project Planning .............................................................................................. 5
3.3.1 Milestones ................................................................................................. 7 3.4 Leadership ...................................................................................................... 7 3.5 Team Communication ..................................................................................... 9 3.6 Project Budgeting ............................................................................................ 9
3.6.1 Summary of Project Budget .....................................................................10 3.6.2 Source of Funding ....................................................................................10
3.7 Risk Management ..........................................................................................11 3.8 Conflict management ......................................................................................11 3.9 Performance Review ......................................................................................12 3.10 Evaluation ...................................................................................................13
4 Quad-Rotor Design ..............................................................................................14 4.1 Design Rationale - Quad-Rotor ......................................................................15 4.2 Payload Box Design and Mechanism .............................................................16
5 UAV Mass Breakdown .........................................................................................17 6 UAV Cost Breakdown ..........................................................................................17 7 Structural Analysis ...............................................................................................18
7.1 Load Case Definition and Free Body Diagrams ..............................................18 8 UAV Stress Analysis ............................................................................................20
8.1 Stress Reduction Techniques .........................................................................20 8.2 Fatigue Awareness .........................................................................................20 8.3 Fatigue due to induced vibration .....................................................................21 8.4 Pressure Loading on Plates ............................................................................21 8.5 Load Transfer .................................................................................................22 8.6 Fixed and Movable Arm Stress Maximum ......................................................22 8.7 Simplified Plate Deflection ..............................................................................24
8.7.1 Simply Supported Plate Representation ...................................................24 8.7.2 Analytical Method .....................................................................................25 8.7.3 FEA – Simplified Rectangular Approximation ...........................................26
8.8 Plate Deflection - Assembly Contact Model as Built........................................27 8.9 Undercarriage Buckling Calculation ................................................................27 8.10 Undercarriage Bending ...............................................................................27 8.11 Undercarriage Bending - Assembly Contact Model .....................................28 8.12 Undercarriage Torsion .................................................................................29 8.13 Undercarriage Combined Loading - Torsion and Bending ...........................29 8.14 Undercarriage Combined Loading - Assembly Contact Model .....................30

UAS CHALLENGE 2015
iii TABLE OF CONTENTS MEng Team Project Report (7ENT1024) School of Engineering and Technology
8.15 FEM Verification – Summary of Undercarriage Results ...............................30 8.16 Modal Analysis of Fixed-arm – Simplified Case ...........................................31
8.16.1 Analytical Modal Analysis – Simplified ..................................................31 8.16.2 Finite Element Modal Analysis – Simplified ...........................................33
8.17 Modal Analysis of Fixed-arm – Actual Parts (As Built) .................................34 8.18 Summary of Modal Frequency Results ........................................................35 8.19 Summarised Margin of Safety Table ...........................................................36
9 Performance, Propulsion & Systems Engineer ....................................................37 9.1 Propeller Diameter Selection ..........................................................................38 9.2 RC Motor Selection Maximum RPM ...............................................................40 9.3 Propeller Pitch Selection ................................................................................41 9.4 Power Supply Voltage Selection .....................................................................43 9.5 Power Supply Capacity Selection ...................................................................44 9.6 RC Motor Selection Power .............................................................................44 9.7 Electronic Speed Controller Selection.............................................................45
10 Unmanned Aircraft System - Subsystems ............................................................46 10.1 Introduction .................................................................................................46 10.2 Navigation Systems.....................................................................................46
10.2.1 Potential Issues with the Navigation systems ........................................47 10.2.2 Solutions ...............................................................................................47
10.3 Mission Control System ...............................................................................47 10.4 Flight Control System ..................................................................................48 10.5 Communication System ..............................................................................50
10.5.1 Serial Connection .................................................................................51 10.5.2 Telemetry Kit Connection ......................................................................51 10.5.3 Radio Connection .................................................................................52
10.6 Systems Integration.....................................................................................52 10.6.1 Communications Systems Test .............................................................52 10.6.2 Interference test ....................................................................................52 10.6.3 Range Test and Altitude Test ................................................................53 10.6.4 Post Manufacture and Assembly Design Checks ..................................53 10.6.5 Post Assembly Control System Calibration ...........................................54
11 Stability and Control I...........................................................................................55 11.1 PID Tuning ..................................................................................................56
11.1.1 Loiter mode ...........................................................................................56 11.1.2 Altitude Hold Mode (AltHold) .................................................................57
11.2 Verifying the performance of PID values .....................................................58 12 Safety Case .........................................................................................................59
12.1 Overview .....................................................................................................59 12.2 Flight Controller Safety Mechanism .............................................................59
12.2.1 Safety Measurements for Flight Testing ................................................59 12.3 Hazardous Components ..............................................................................60 12.4 Battery Fail Safe ..........................................................................................60 12.5 Radio Fail Safe ............................................................................................61
13 Environmental Impact ..........................................................................................62 13.1 Hazardous Material .....................................................................................62 13.2 Air Quality ...................................................................................................62
13.2.1 Emissions .............................................................................................62 13.2.2 Noise ....................................................................................................62
13.3 Infrastructure ...............................................................................................63 13.4 Disposal of Material .....................................................................................63
14 Stability and Control II..........................................................................................65 14.1 Ideal CG location .........................................................................................65
15 Flight modes and tuning .....................................................................................66 15.1 Simulink model ............................................................................................66

UAS CHALLENGE 2015
iv TABLE OF CONTENTS MEng Team Project Report (7ENT1024) School of Engineering and Technology
15.2 Test rig PID Testing.....................................................................................68 15.2.1 Pitch and Roll tuning .............................................................................69 15.2.2 Yaw tuning ............................................................................................71 15.2.3 Waypoint navigation tuning ...................................................................71
15.3 Tuning during flight ......................................................................................72 15.4 Future Work ................................................................................................72
16 Flight Termination Case .......................................................................................73 16.1 GPS Loss ....................................................................................................73 16.2 Communication loss from Ground Station ...................................................73 16.3 Geofence Breach ........................................................................................74 16.4 Maximum Pressure Altitude Breach ............................................................74
17 Systems Layout ...................................................................................................75 17.1 System block diagram .................................................................................75
17.1.1 Hardware Systems................................................................................75 17.1.2 Software Systems .................................................................................76
17.2 Communication ...........................................................................................78 18 Image Processing ................................................................................................79
18.1 Image Recognition ......................................................................................79 18.1.1 The Requirements ................................................................................79 18.1.2 Testing ..................................................................................................79 18.1.3 Results..................................................................................................80 18.1.4 Analysis ................................................................................................80 18.1.5 Shape recognation ................................................................................80
18.2 Video ...........................................................................................................81 18.3 On Screen Display Board (OSD) .................................................................82 18.4 Video transmitter .........................................................................................82 18.5 Video Receiver ............................................................................................82
19 Verification and Validation ...................................................................................83 19.1 Verification Matrix ........................................................................................83 19.2 Validation test..............................................................................................83
20 Future work .........................................................................................................84 20.1 Partial control of Quad-rotor positioning ......................................................84 20.2 Full Autonomy .............................................................................................84
21 Preliminary Payload Box Concept & Servo Integration ........................................85 21.1 Initial designs ..............................................................................................85
21.1.1 The Hinge-clamp Method ......................................................................85 21.1.2 The electro-magnet method ..................................................................85 21.1.3 The Hinge-pin method ..........................................................................86 21.1.4 Others ...................................................................................................86 21.1.5 Payload box mechanism integration .....................................................87
21.2 Servo ..........................................................................................................89 21.2.1 Specifications........................................................................................89 21.2.2 Rational ................................................................................................89
21.3 BEC ............................................................................................................90 21.3.1 Specification .........................................................................................90 21.3.2 Rational ................................................................................................90
21.4 Schematics of connections from battery to servo through pixhawk ..............91 21.5 Controlling the servo as a servo ..................................................................92 21.6 Testing with the Mission Planner .................................................................93
22 Other Involvements .............................................................................................94 22.1 Telemetry Kit ...............................................................................................94 22.2 Design Convergence ...................................................................................94 22.3 Challenges ..................................................................................................94
23 Manufacturing ......................................................................................................95 23.1 Machining Selection ....................................................................................95

UAS CHALLENGE 2015
v TABLE OF CONTENTS MEng Team Project Report (7ENT1024) School of Engineering and Technology
23.1.1 Machines ..............................................................................................95 23.1.2 Tools .....................................................................................................95
23.2 Manufacturing process of Quad-rotors components ....................................96 23.2.1 Fixed Bracket ........................................................................................96 23.2.2 Motor arm end bracket ..........................................................................96 23.2.3 Movable arm vertical fixed bracket /support bracket ..............................96 23.2.4 Landing gear top/bottom support bracket ..............................................97 23.2.5 Top/Bottom half T-joints ........................................................................97 23.2.6 Landing Gear Lug Bracket/ Pivot ..........................................................97 23.2.7 Arm pivot ..............................................................................................97 23.2.8 Main Body Plate ....................................................................................98 23.2.9 PVCs tubes ...........................................................................................98 23.2.10 Motor mount plate ..............................................................................98 23.2.11 Overview of Machining ......................................................................99
23.3 Challenges ................................................................................................ 100 23.4 Manufacturing Plan ................................................................................... 100 23.5 Machining Cost ......................................................................................... 100 23.6 Other involvements in the project .............................................................. 100
24 Test Rig ............................................................................................................. 101 24.1 Initial Conceptual Design of Gimbal Test Rig ............................................ 101 24.2 Octagonal Gimbal Test Rig ....................................................................... 102
24.2.1 Octagonal Model Mount Frame ........................................................... 103 24.2.2 Octagonal Mid Frame ......................................................................... 104 24.2.3 Octagonal Outer Frame ...................................................................... 105
24.3 Weight Estimation for Octagonal Test Rig ................................................. 105 24.4 Cost Breakdown for Octagonal Test Rig .................................................... 105 24.5 Manufacturing Stage of the Octagonal Test Rig ........................................ 106
25 Structural Testing ............................................................................................. 107 25.1 Material Testing ......................................................................................... 107 25.2 Component Testing ................................................................................... 107 25.3 Payload Drop Testing ................................................................................ 108 25.4 Initial Ball socket test rig ............................................................................ 108 25.5 Manufacturing assistance .......................................................................... 109
26 Business Case................................................................................................... 109 26.1 Executive Summary .................................................................................. 109 26.2 Business overview .................................................................................... 110 26.3 Mission statement ..................................................................................... 110 26.4 UAS key design features ........................................................................... 111 26.5 Market Assessment ................................................................................... 111
26.5.1 Potential market – Emergency Service ............................................... 111 26.5.2 Market size and growth ....................................................................... 112 26.5.3 Regulation restriction .......................................................................... 113 26.5.4 Challenges for market entry ................................................................ 113 26.5.5 Competition ........................................................................................ 114
26.6 Financial Forecasts ................................................................................... 115 26.7 Key assumptions ....................................................................................... 115 26.8 Costs ......................................................................................................... 115
26.8.1 Financial statements ........................................................................... 117 26.8.2 Profitability .......................................................................................... 118
Conclusion ................................................................................................................ 119 REFERENCES .......................................................................................................... 121 Appendix. A ............................................................................................................... 125 Appendix. B UAV Design ..................................................................................... 141 Appendix. C UAV Detailed Mass Breakdown ....................................................... 171 Appendix. D UAV Detailed Cost Breakdown ........................................................ 177

UAS CHALLENGE 2015
vi TABLE OF CONTENTS MEng Team Project Report (7ENT1024) School of Engineering and Technology
Appendix. E Material Properties .......................................................................... 179 Appendix. F Load Cases and Load Transfer ........................................................... 181 Appendix. G Stress Analysis ................................................................................ 182 Appendix. H Performance & Propulsion ............................................................... 219 Appendix. I UAS System Set Up ............................................................................ 261 Appendix. J Systems .............................................................................................. 269 Appendix. K Altitude control ................................................................................. 281 Appendix. L Verification and validation ................................................................... 289 Appendix. M Telemetry kit Specification ............................................................... 302 M.1. Servo calculation .......................................................................................... 307 Appendix. N Manufacturing .................................................................................. 308
N.1. Machining by milling machine .................................................................... 309 N.2. Machining by XYZ 1330 Lathe .................................................................. 309 N.3. Laser Cutting by Tortec Laser cutter ......................................................... 310 N.4. Cutting blocks by vertical bandsaws machine............................................ 310
Appendix. O Test Rig ........................................................................................... 311 O.1. Initial Gimbal Test Rig Conceptual Design ................................................ 312 O.2. Updated Octagonal Gimbal Test Rig Assembly ......................................... 314 O.3. Octagonal Model Mount Frame Technical Drawing ................................... 316 O.4. Octagonal Mid Frame Technical Drawing .................................................. 318 O.5. Octagonal Outer Frame Technical Drawing ............................................... 320 O.6. Octagonal Gimbal Test Rig Stand Technical Drawing ............................... 322 O.7. Gimbal Test Rig Weight Estimation ........................................................... 324 O.8. Gimbal Test Rig Manufacturing Cost ......................................................... 326 O.9. Qualification test plan ................................................................................ 326 Electrical Performance Tests (Initial, In-Process, Final) ......................................... 326 Storage Temperature Cycling ................................................................................ 326 Thermal Shock ...................................................................................................... 326 Random/Sine Vibration .......................................................................................... 327 Operational Temperature Cycling .......................................................................... 327 O.10. Initial Involvement in the MEng Team Project ............................................ 327 O.11. Tri Angular Bracket Technical Drawing...................................................... 328 O.12. T-Bracket Technical Drawing .................................................................... 330
Appendix. O Design features for business case ................................................... 332

UAS CHALLENGE 2015
vii LIST OF FIGURES MEng Team Project Report (7ENT1024) School of Engineering and Technology
LIST OF FIGURES Figure 1 - Initial Concepts for Stage 1 convergence ..................................................... 2 Figure 2 - Concepts considered in the stage-2 convergence ........................................ 3 Figure 3 - Project Organization Chart ........................................................................... 5 Figure 4 - Progress (to date) of the project ................................................................... 7 Figure 5 - Leadership area of priority – Semester A (Left), Semester B (Right) ............ 8 Figure 6 – Performance Charts for Jonathan (a) and Zuber (b) ...................................12 Figure 7 - Quad-rotor design .......................................................................................14 Figure 8 - Stowage Instructions ...................................................................................15 Figure 9 - Quad-rotor in Stowed Configuration ............................................................15 Figure 10 – Removable Lightweight Payload Box .......................................................16 Figure 11 - Removable Lightweight Payload Box ........................................................16 Figure 12 - Payload Box with simple construction and failsafe mechanism .................16 Figure 13 – Payload Box with Payload Clearance .......................................................16 Figure 14 – Free Body Diagram - Flight and Landing Cases .......................................18 Figure 15 - Free Body Diagram - Landing Cases ........................................................18 Figure 16 - Free Body Diagram - Flight and Gust Load Cases ....................................19 Figure 17 – Fixed Arm Cross Section – See also Appendix G.7 ..................................22 Figure 18 – Mesh for Fixed-arm Assembly – Values as per Appendix G.6 ..................23 Figure 19 - Deflection of Fixed-arm Assembly (Flight Loads) with 7.6mm Deflection ...23 Figure 20 - Stress of Fixed-arm Assembly (Flight Loads) with Stress 15.8MPa (Contact) and 20MPa (Peak) .......................................................................................23 Figure 21 – Stress (Close-up) of Fixed-arm Assembly (Flight Loads) with Stress 15.8MPa (Contact) and 20MPa (Peak) ........................................................................24 Figure 22 - Simplified Plate Representations ...............................................................25 Figure 23 - Simple Plate Deflection Carried out on CATIA showing 4.54mm deflection ....................................................................................................................................26 Figure 24 - Flight and Gust condition of Main Body with 0.13mm Deflection................27 Figure 25 - Lateral Impact Case on Single Leg - 60.6MPa Stress ...............................28 Figure 26 – Stress Element A with Principal Stress for - Analytical – Undercarriage Combined Loading – Bending, Buckling and Torsion (G.13) .......................................29 Figure 27 - Arm and Mass for Rayleigh Method ..........................................................31 Figure 28 – Mass Representation of Motors, Blocks, Plates, Fasteners and ESC .......33 Figure 29 – Simplified FE analysis with 1st Nat freq as 19.64Hz – 69.3mm Deflection (Left) and 164MPa Stress (Right) ................................................................................33 Figure 30 – Simplified FE with 2nd Nat freq as 20.06 Hz (Left) and 3rd Nat freq as 134.6 Hz (Right) ....................................................................................................................33 Figure 31 – Simplified FE with 4th Nat freq as 224.1 Hz (Left) and 5th Nat freq as 411.9 Hz (Right) ....................................................................................................................33 Figure 32 – As Built FE Analysis - Mass Representation of Motors, Fasteners, Cables and ESC ......................................................................................................................34 Figure 33 – As Built FE analysis with 1st Nat freq as 451 Hz – 69.0mm Deflection (Left) and Stress (Right) .......................................................................................................34 Figure 34 - As Built FE analysis with 2nd Nat freq as 736 Hz (Left) and 3rd Nat freq as 1707 Hz (Right) ...........................................................................................................34 Figure 35 - As Built FE analysis with 4th Nat freq as 2 KHz (Left) and 5th Nat freq as 4.1 KHz (Right) .................................................................................................................34 Figure 36 - Prototype Quad Rotor ...............................................................................44 Figure 37: Waypoint Command File ............................................................................47 Figure 38: Telemetry Information transmitted to ground control station .......................50 Figure 39: Transmission Link Statistics (Serial Connection) ........................................51 Figure 40: Transmission Link Statistics (Telemetry Kit) ...............................................51 Figure 41 – PID System (Oscar, 2013) ........................................................................55

UAS CHALLENGE 2015
viii LIST OF FIGURES MEng Team Project Report (7ENT1024) School of Engineering and Technology
Figure 42 Loiter PID values .........................................................................................56 Figure 43 AltHold mode PID values .............................................................................57 Figure 44 Dataflash log in Stabalized mode opened in Mission planner ......................58 Figure 45 Battery fail safe settings chosen in Mission Planner ....................................60 Figure 46 Battery monitor settings chosen in Mission Planner .....................................61 Figure 47 Side view of the Quad-rotor .........................................................................65 Figure 48 Simulink model used ...................................................................................66 Figure 49 Quad-rotor oscillating with only the P gain (left), with P and D gain (right) ...67 Figure 50 PID values on Simulink ................................................................................68 Figure 51 Values that require change (3DR Robotics, 2015) .......................................69 Figure 52 Quad-rotor on the test rig ............................................................................70 Figure 53 Results of what Pixhawk should output (Copter.Ardupilot, 2015) .................70 Figure 54 Geofence configuration on Mission Planner ................................................74 Figure 55 Overall System Hardware Block Diagram ....................................................75 Figure 56 Overall Software Block Diagram ..................................................................77 Figure 57 Matlab alphanumeric code processing letter at 22.98cm .............................80 Figure 58 Shape recognition .......................................................................................81 Figure 59 Circuit Diagram of Ardunio ..........................................................................84 Figure 60: Hinge clamp ...............................................................................................85 Figure 61: electro-magnet ...........................................................................................85 Figure 62: Hinge-pin ....................................................................................................86 Figure 63: Other concept .............................................................................................86 Figure 64: CAD ...........................................................................................................87 Figure 65: Overall payload box ....................................................................................87 Figure 66: Horn and door connection ..........................................................................88 Figure 67: Start up release ..........................................................................................88 Figure 68: Fully Unlocked door ....................................................................................88 Figure 69: Complete release .......................................................................................89 Figure 70 - MG90S servo ............................................................................................89 Figure 71 - SBEC26 Turnigy .......................................................................................90 Figure 72: Schematics of connections .........................................................................91 Figure 73: Configuration of the servo on Pixhawk .......................................................92 Figure 74: Mission with GPS dropping points ..............................................................93 Figure 75: Verification of the performance of the Servo ...............................................93 Figure 76: Machined fixed bracket ...............................................................................96 Figure 77: Machined end bracket ................................................................................96 Figure 78: Machined Fixed bracket .............................................................................96 Figure 79: Machined bottom support bracket...............................................................97 Figure 80:T-joint on foam ............................................................................................97 Figure 81: Lug bracket ................................................................................................97 Figure 82: Landing gear pivot ......................................................................................97 Figure 83: Arm pivot for movable arm..........................................................................97 Figure 84: Cutting nylon plate in Laser machine ..........................................................98 Figure 85: Melted edges ..............................................................................................98 Figure 86: Plate after cutting .......................................................................................98 Figure 87: Assembled motor mount .............................................................................98 Figure 88: Motor mount plate ......................................................................................98 Figure 89.1-3: CNC practice sessions .........................................................................99 Figure 90.1-3: Failed attempts ................................................................................... 100 Figure 91 - Gyroscope Test Rigs ............................................................................... 102 Figure 92 - CAD Drawing of the Quad-rotor .............................................................. 104 Figure 93 - Test Rig Components .............................................................................. 106 Figure 94 - Test Rig Assembly .................................................................................. 106 Figure 95 - Nylon Material and Main Body Plate ........................................................ 107 Figure 96 - Compression Test conducted on Hounsfield Tensometer ....................... 107

UAS CHALLENGE 2015
ix LIST OF FIGURES MEng Team Project Report (7ENT1024) School of Engineering and Technology
Figure 97 - Initial ball socket test rig .......................................................................... 108 Figure 98 - Autoquads Inspection Ltd Logo ............................................................... 109 Figure 99 - Permissions required for different UAS sizes ........................................... 113 Figure 100 - Break Even Graph ................................................................................. 118 Figure 101 - Overall View of Quad-Rotor ................................................................... 142 Figure 102 - Motor Mount Design (Left) & Undercarriage T-Joint (Right) ................... 142 Figure 103 - Undercarriage Pivot Design (Left) & Main Body Sandwich Design (Right) .................................................................................................................................. 142 Figure 104 - Movable Arm Pivot Design .................................................................... 143 Figure 105 - Project Main Body Area ........................................................................ 181 Figure 106 – SOLID187 Element (Ansys, November 2013c) ..................................... 185 Figure 107 – PLANE182 Element (Ansys, November 2013c) .................................... 185 Figure 108 - Arm Cross-section for Stress Calculation .............................................. 190 Figure 109 - Tension & Compression Stress in Arm .................................................. 190 Figure 110 – Mesh for Fixed-arm Assembly – Values as per Appendix G.6 .............. 191 Figure 111 - Deflection of Fixed-arm Assembly (Flight Loads) with 7.6mm Deflection .................................................................................................................................. 191 Figure 112 - Stress of Fixed-arm Assembly (Flight Loads) with Stress 15.8MPa (Contact) and 20MPa (Peak) ..................................................................................... 192 Figure 113 – Stress (Close-up) of Fixed-arm Assembly (Flight Loads) with Stress 15.8MPa (Contact) and 20MPa (Peak) ...................................................................... 192 Figure 114 – Mesh for Arm Assembly (With additional Tab) – Mesh Values as per G.6 .................................................................................................................................. 193 Figure 115 - Modified FB-002 for reduction in point contact stress concentration ...... 194 Figure 116 - Stress Concentration at Arm (without addition) Contact (a) & Close-up (b) .................................................................................................................................. 194 Figure 117 - Deflection of Modified Movable Motor Arm of 7.88mm for flight loads with SF ............................................................................................................................. 195 Figure 118 - Stress of Modified Movable Motor Arm of 20.8MPa for flight loads with SF .................................................................................................................................. 195 Figure 119 - Modified Movable Motor Arm with Stress of 20.8MPa for flight loads with SF (a) & Close-up (b) ................................................................................................ 195 Figure 120 - Load on the Lug (Niu, 1988) .................................................................. 196 Figure 121 - Components of the Load (Niu, 1988) ..................................................... 196 Figure 122 - Areas on the Lug ................................................................................... 196 Figure 123 - Lug Bracket Without Flange (Left) & with additional Flange (Right) ....... 197 Figure 124 – Lateral Unit Load Deflection (Left) & Stress (Right) of Lug Bracket Without Flange ....................................................................................................................... 198 Figure 125 – Lateral Unit Load Deflection (Left) & Stress (Right) of Lug Bracket With Flange ....................................................................................................................... 198 Figure 126 - Mesh for MP-001 (Appendix B.7) with values as per Appendix G.6 ....... 199 Figure 127 – Motor Plate Deflection (0.038 mm) and Stress (41.7 MPa) for flight case with SF at start-up ..................................................................................................... 199 Figure 128 - Error Elements in Model - Due to Separation at FB-001 and EB-001 .... 199 Figure 129 - Simplified Plate Representations ........................................................... 200 Figure 130 - Simple Plate Deflection Carried out on CATIA structural analysis ......... 201 Figure 131 - Mesh of Main Body Plate - Values as per Appendix G.6 ....................... 202 Figure 132 – Single Main Body Plate Analysis – with 17.8MPa Stress at contact holes for flight case with pressure load ............................................................................... 202 Figure 133 – Mass Representation of components and payloads as per Appendix. C .................................................................................................................................. 203 Figure 134 - Mesh of Main body assembly with Values as per Appendix G.6 ............ 203 Figure 135 – Contact model Flight Case for Main body assembly Deflection (left) and Equivalent Stress (right) ............................................................................................ 203

UAS CHALLENGE 2015
x LIST OF FIGURES MEng Team Project Report (7ENT1024) School of Engineering and Technology
Figure 136 - Contact model Flight Case for Main body assembly - Equivalent Stress with predicted locations ............................................................................................. 204 Figure 137 - Resolving Component to Determine Vertical Load ................................ 205 Figure 138 - Undercarriage Leg Under Pure Bending ................................................ 205 Figure 139 - Undercarriage Leg Under Pure Torsion ................................................. 206 Figure 140 - Stress Element A (Warren C. Young) .................................................... 207 Figure 141 - Plan View of Stress Element A .............................................................. 207 Figure 142 - Stress Element A with Principle Stresses .............................................. 208 Figure 143 - Undercarriage Mesh for Contact Model with values as per G.6 ............. 209 Figure 144 – Lateral Landing on Single Undercarriage Leg with 53.6mm Deflection . 209 Figure 145 - Lateral Landing on Single Undercarriage Leg with 60MPa Bending Stress .................................................................................................................................. 210 Figure 146 - Lateral Landing on Single Undercarriage Leg with 60MPa Bending Stress (Close-up) ................................................................................................................. 210 Figure 147 - Tip Landing on Single Undercarriage Leg with 60MPa Bending Stress . 211 Figure 148 -Tip Landing on Single Undercarriage Leg with 66mm Combined bending and torsion deflection ................................................................................................ 211 Figure 149 - Tip Landing on Single Undercarriage Leg with 71MPa Combined bending and torsion stress ...................................................................................................... 212 Figure 150 – Entire Quad-Rotor Flight Deflection of 7.9mm at Motor Arm Tips ......... 213 Figure 151 - Entire Quad-Rotor Flight Deflection of 7.9mm at Motor Arm Tips (Close-up) ............................................................................................................................. 213 Figure 152 - Entire Quad-Rotor Flight Stress of 28.8 MPa at Motor mount plates ..... 213 Figure 153 - Entire Quad-Rotor Flight Stress with Plate Stress peak at 14.42Mpa .... 214 Figure 154 – Downward Load - 1kg Payload and 10N Additional Load onto PB-005 Plate .......................................................................................................................... 215 Figure 155 - Side Load - 1kg Payload and 10N Additional Load onto Hinge Plate at 45deg to horizontal .................................................................................................... 215 Figure 156 - Side Load - 1kg Payload and 10N Additional Load onto short edge 45deg to horizontal............................................................................................................... 216 Figure 157 - Side Load as per Figure 156 - Showing Pre-mature Release due to global deflection ................................................................................................................... 216 Figure 158 – Downward Load as per Figure 154 - new design showing 0.73mm Deflection .................................................................................................................. 217 Figure 159 - Side Load as per Figure 155 –new rigid design and Deflection of 1.56mm .................................................................................................................................. 217 Figure 160 – Side Load as per Figure 156 and Figure 157 – with new design and deflection of 0.41mm* ................................................................................................ 217 Figure 161: Proof of Connection ................................................................................ 261 Figure 162: Mission Planner top menu ...................................................................... 262 Figure 163: Initial Setup for all components ............................................................... 262 Figure 164: Mission Planner Waypoint Entry Point .................................................... 262 Figure 165: Secondary Commands ........................................................................... 263 Figure 166: Area for writing flight plans into Pixhawk's Memory ................................ 263 Figure 167: Stability Tuning for Quad-rotor Control ................................................... 264 Figure 168: Mission Plannner environment for changing parameters ........................ 264 Figure 169: Fail Safe parameters .............................................................................. 265 Figure 170: Typical Set Fail Safe Values ................................................................... 266 Figure 171: Monitoring System Values ...................................................................... 267 Figure 172: Flight ready monitoring system ............................................................... 267 Figure 173: Quad-rotor Acceleration and Velocity parameters .................................. 268 Figure 174 Minim OSD V2.1 (unmannedtechshop, 2015).......................................... 276 Figure 175: 3DR uBlox GPS with Compass Kit (unmannedtechshop, 2015) ............. 278 Figure 176 CG calculations for the x and y-axis ........................................................ 281 Figure 177 CG calculations for z-axis ........................................................................ 281
UAS CHALLENGE 2015
xi LIST OF FIGURES MEng Team Project Report (7ENT1024) School of Engineering and Technology
Figure 178 Overview of the Simulink model .............................................................. 286 Figure 179 Section to change PID values .................................................................. 287 Figure 180 Quad-rotor control mixing ........................................................................ 287 Figure 181 Quad-rotor dynamics ............................................................................... 288 Figure 182 GUI of the Quad-rotor general parameters .............................................. 288 Figure 183: Other CAD views .................................................................................... 306 Figure 184: schematics for the force calculations ...................................................... 307 Figure 185: Machined fixed bracket is CNC Router Pro 2600 .................................... 308 Figure 186: Dry assemble of landing gear lug, pivot and the vertical landing strut ..... 308 Figure 187: Slot bracket Figure 188: Turn button for servo motor ....................... 308 Figure 189: Support corners machined in CNC Figure 190: Triangle payload support glued with hinges 308 Figure 191: Drilling centre hole in fixed bracket Figure 192: Milling arm Pivot ........ 309 Figure 193: Chamfering of movable arm support Figure 194: Smoothing surface by fly cutter 309 Figure 195.1-2: Drilling using slot drills ...................................................................... 309 Figure 196: High speed steel tool .............................................................................. 309 Figure 197.1-2: Machining arm pivot on lathe ............................................................ 310 Figure 198.1-2 Laser Cutting of Nylon 6 sheet for main body plate ........................... 310 Figure 199: Cutting Nylon 6.6 cast block in vertical band saw machine ..................... 310 Figure 200 -OXV in storage configuration .................................................................. 332 Figure 201 - Electro-optic camera on the OXV .......................................................... 332 Figure 202- Main body of the OXV ............................................................................ 332

UAS CHALLENGE 2015
xii GLOSSARY MEng Team Project Report (7ENT1024) School of Engineering and Technology
GLOSSARY
3D Three Dimensional
AFS Advanced Failsafe
Atl Altitude
BEC Battery Eliminator Circuit
BOM Bill of Material
CAA Civil Aviation Authority
CAD Computer Aided Design
CCW Counter-Clockwise
CG Cenre of Gravity
CNC Computerised Numerical Control
COTS Commercial of the Shelf
CPR Cardiopulmonary Resuscitation
CW Clockwise
D Derivative
EMI Electro-Magnetic Inteference
ESC Electronic Speed Controller
EU European Union
FBD Free Body Diagrams
FE Finite Element
FEA Finite Element Analysis
FEM Finite Element Method
FPV First Person View
ft Feet
GPS Global Positioning System
Hz Hertz
I Integral
IAS Indicated Airspeed
IMechE Institution of Mechanical Engineers
km kilometer
knots Nautical Miles
KV kilo-volts
Li-PO Lithium Polymer
m metres
MEng Masters of Engineering
mm Millimeter
MPa Mega Pascals
MTOM Maximum Take-Off Mass
N Newtons
OSD On Screen Display
P Proportional
PA Polyamide (Nylon)
PDR Preliminary Design Review
PVC Polyvinyl Chloride
PWM Pulse Width Modulator

UAS CHALLENGE 2015
xiii GLOSSARY MEng Team Project Report (7ENT1024) School of Engineering and Technology
Quad Quadcopter
RC Radio Controller
RC Receiving (Radio)
RPM Revolutions Per Minute
RTL Return to Launch
SCA Sudden Cardiac Arrest
SUA Small Unmanned Aircraft
TX Transmission (Radio)
UAS Unmanned Aircraft System
UAV Unmanned Aerial Vehicle
VAT Value Added Tax
VLOS Visual line of Sight
W Watts
WBS Work Breakdown Structure
WP Waypoint

UAS CHALLENGE 2015
1 Introduction MEng Team Project Report (7ENT1024) School of Engineering and Technology
1 Introduction
The Unmanned Aircraft system (UAS) challenge is being introduced by the Institution of
Mechanical Engineers (ImechE) for the first time. Teams entered by universities will only constitute
of members from the undergraduates cohort. The competition will provide students from different
universities to develop and demonstrate leadership, teamwork and technical competencies. It’s
being held during the academic year 2014 till 2015. During this period the universities participating
in the competition will follow a structure of designing, developing and demonstrating. It will also
include design reviews, presentations and flight demonstration that will contribute to point scoring.
1.1 Competition Overview
The competition this year is built around a scenario of a natural disaster occurring with a large
areas distressed by an earthquake or tsunami. The scenario could involve many thousands of
people being cut off from supplies and in need for humanitarian aid. The job at hand is to supply
these areas with humanitarian aid food and first aid supplies. Time is critical and the UAS launch
site is some distance away from the affected areas. The UAS operates autonomously via pre-
determined waypoints to areas affected with the capability of image recognition to identify the
supply drop zone. The UAS can be programmed to carry out circuit trips and return to base and
repeating the mission.
For the competition, the UAS can have a maximum take-off mass of 7kg with Commercial Off The
Shelf (COTS) products not exceeding £1000. The UAS will need to perform a series of tasks such
as take-off, climb to an altitude between 100-400ft, cruise, follow a predefined route, drop two
payloads (Bag(s) of flour) weighing 1kg each at any reachable location and land back completely
autonomously.
1.2 Project Aims
The aims intended at the initial stage of this project were to;
Develop and demonstrate leadership, teamwork, technical competence, as well as
commercial skills.
Develop a complex system that will require design, development and demonstration with
regards to a demanding mission requirement.
Apply the knowledge learnt from previous academic years during the course of the
undergraduate engineering degree.
Represent the university in the UAS challenge, successfully compete and win.
Section by Alfred Dzadey
UAS CHALLENGE 2015
2 Design Rationale MEng Team Project Report (7ENT1024) School of Engineering and Technology
1.3 The Project Objectives
The main objectives set, in order to be successful are;
To design and develop a UAS with a MTOM less than 7kg and achieve autonomy in all
phases of flight and tasks.
Expenditure on COTS must not exceed £1000
To be able to switch between manual and autonomous flight.
To develop a UAS that can accommodate and deliver a 1 kg bag of flour.
To create an image recognition system to identify the drop zone and read alphanumerical
characters.
To complete the task in the fastest time possible.
2 Design Rationale
This section begins to discuss the solutions to the mission requirement outlined in the previous
chapter. It assesses various design options and converges to an ultimate solution. Upon evaluation
of various design concepts, it was conclusive that the best approach to tackle the problem was by
going forwards with a Quad-rotor and ground control station.
2.1 Design Convergence
A 2-stage design convergence approach was used to conclude which concept best meets the
requirements. The design concepts selected were compared against set criteria as discussed in
2.1.1 and 2.1.2.
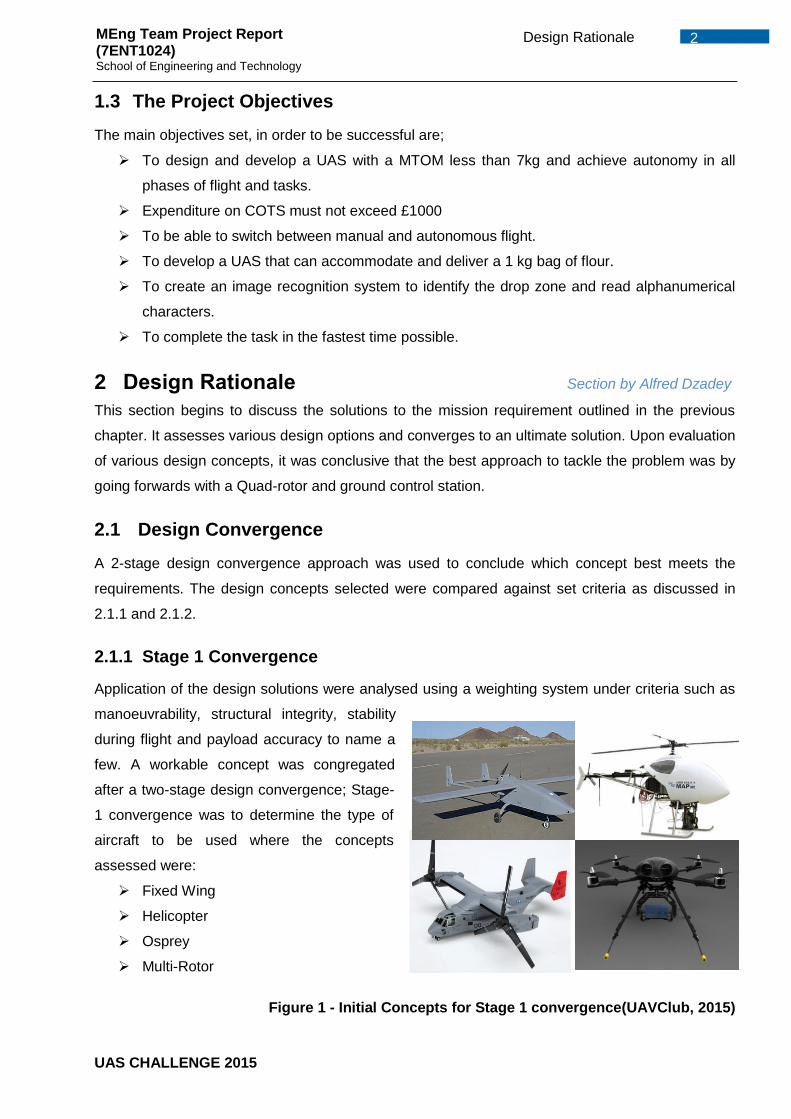
2.1.1 Stage 1 Convergence
Application of the design solutions were analysed using a weighting system under criteria such as
manoeuvrability, structural integrity, stability
during flight and payload accuracy to name a
few. A workable concept was congregated
after a two-stage design convergence; Stage-
1 convergence was to determine the type of
aircraft to be used where the concepts
assessed were:
Fixed Wing
Helicopter
Osprey
Multi-Rotor
Figure 1 - Initial Concepts for Stage 1 convergence(UAVClub, 2015)
Section by Alfred Dzadey

UAS CHALLENGE 2015
3 Design Rationale MEng Team Project Report (7ENT1024) School of Engineering and Technology
The results from the Stage-1 convergence demonstrated that a multi-rotor would be the best option
to meet the product design specification.
2.1.2 Stage 2 Convergence
Stage-2 design convergence was to determine which multi-rotor system would best meet the UAS
requirements. Criteria used in stage-2 included redundancy (motor failure), manufacturing
complexity, power consumption, noise, payload capacity, structural integrity and costs to name a
few. The concepts considered during the stage-2 design convergence were:
Quad-Copter
Hex-rotor
Octacopter
3 arm – 6 rotors
Figure 2 - Concepts considered in the stage-2 convergence (UAVClub, 2015)
Upon comparison between the multi rotors under the above criteria, the Hex-rotor was found to be
the best concept that would meet the set criteria. Appendix C details the rationale and justification
for this selection.
2.2 Further analysis
Upon initiation of the design, a mass breakdown of all components for this proposed system was
established, it was found that the Hex-rotor would be overweight. The only solution forward was to
lose two arms to reduce it’s weight hence reducing from a Hex-rotor to a Quad-rotor design. This
allows the design to be approximately 6kg with all possible components and a single payload
accounted. The quad rotor design is 1 kg under the constrained maximum weight of 7 kg, providing
contingency for any miscalculations or any unplanned additional weight.

UAS CHALLENGE 2015
4 Project Management MEng Team Project Report (7ENT1024) School of Engineering and Technology
3 Project Management
To achieve the project objectives, effective organisation, planning, budgeting and management
styles were adopted. This section describes the organisational structure and the key management
tasks undertaken to deliver the project successfully. It describes the leadership, organisation
structure and role selection, project planning, budgeting, people and conflict management, finally a
review on both team leads is discussed.
3.1 Role of the Project Manager
The project management role comes with responsibilities involving the following;
Progress –ensuring the deliverables are being completed within the set timescale.
Budgeting – control the money being spent to ensure the deliverables are being completed
within the baseline cost.
Performance – ensuring the team is performing enough to achieve the goals set out.
Reporting – scheduling regular meetings with team members and supervisors to report
progress and resolve issues.
Planning/Change – handling and resolving any unexpected changes to project without
hugely affecting the outcome of the project or delivery.
Risk – to implement any contingencies into the time plan and budget to manage any
unforeseen risks affecting the project delivery.
Leadership and motivation – Motivating and maintaining morale during the duration of the
project.
Purchasing – dealing with orders being placed, tracking and informing the group of the
delivery progress of the order.
Welfare – taking into account the commitment of individuals while setting actions without
jeopardising the progress of the group.
Conflict – resolving any disrupt between team members and allowing a good working
environment.
Presenting – handling the compilation of all group reports and presentations in terms of
collating, proof reading individual reports and structuring.
3.2 The Team Structure
Project organisation structure needs to be one that facilitates the coordination and implementation
of project activities. The project organisation needs to create an environment in which there are
interactions among team members with minimal conflict, disruption or overlapping. The team
comprises of twelve students; nine studying aerospace, two studying aerospace with space
technology and one studying aerospace systems. With the project being systems related, the team
lacked expertise in that area meaning more work needed to be carried out. Figure 3 shows an
organisational structure to highlight each person’s responsibility and tasks carried out.
Section by Alfred Dzadey

UAS CHALLENGE 2015
5 Project Management MEng Team Project Report (7ENT1024) School of Engineering and Technology
Figure 3 - Project Organization Chart
As with any large project it is advisable to split project team into sub teams to enable the project to
be manageable. This allows deliverables to be split into smaller tasks with clear objectives within
sub teams. It enables the team members in the sub teams to know exactly what actions are
required for an effective contribution. Another advantage of this set up is that there is a clear line of
authority and also team members will become familiar with each other since they work together in
the same area. Effective communication channels allow for the project manager and team leaders
to effortlessly interact and report back any difficulties or progress updates. Zuber and Jonathan
were appointed sub team leader due to both of them being extraverts and possession leadership
qualities as assessed using MBTI results. The structural team handles tasks relating to the design,
quality control, compliance, manufacture, assembly, test and certification of the UAS. The systems
team handles tasks relating to performance and propulsion, stability, control systems, flight and
navigation, imaging system, mission control, safety and payload deployment system.
3.3 Project Planning
The key to a successful project is in the planning, hence continual involvement and forward
planning must be carried out prior to project initiation. It involves the use of schedules such as
Gantt charts for planning and subsequently to report project progress. Initially, the project scope
was defined and the suitable method of successful delivery of this project was determined. The
following step was working out the durations and having contingency for all the various tasked
Alfred Dzadey
Project Manager
Zuber Khan (Chief Signatory - Quality)
Structural Team Leader
Structural / Stress / Cost / Weights / Assembly Engineer
Osman Sibanda
Marketing/Bussiness Specialist
Mozammel
Manufacturing Engineer
Amit Ramji (Chief Engineer)
Structural / Stress / Design / Hardware & Electrics
Integration and Assembly Engineer
Mohammed Mohinuddin
Structural and Testing Engineer
Jonathan Ebhota
Systems Team Leader
System Engineer
Micky Ngouani
Servo Selection Engineer
Kasun Malwenna
Safety / Stability and Control engineer
Tarek Kherbouche
Camera / Imaging Systems Engineer
Reyad Mohammed Ullah
Stability and Control Engineer
Hassan Turabi
Performance and Propulsion engineer

UAS CHALLENGE 2015
6 Project Management MEng Team Project Report (7ENT1024) School of Engineering and Technology
needed to complete the project. Major objectives were subsequently listed and implemented into a
Work Breakdown Structure (WBS) as shown in Table 1 below.
The WBS details the main steps that are required to complete this project. Stages involving design,
manufacture, purchasing and delivery of products may involve several delays that creates
difficulties and hence prevents the scheduled delivery. Strict time management and contingencies
such as overestimating time frames for completion of such tasks have been implemented into the
project plan to account for these delays.
Work Breakdown Structure
1 Scope 4.3 Structural material and sizing ready for purchase
1.1 Determine project scope 4.4 Design purchase readiness
1.2 Define resources 5 Order parts
1.3 Scope complete 5.1 Send out order list for components and delivery
2 Design Specification/System Requirements 6 Manufacturing & Assembly
2.1 Create Design specification for a UAV 6.1 Machine structural frame
2.2 Review system specifications 6.2 Integrate systems components
2.3 Create system requirements 6.3 Integrate structural frame, system and propulsion components
2.4 Obtain approvals to proceed (concept, timeline, budget)
7 Testing and Validation
2.5 Analysis complete 7.1 Develop unit test plans using design specifications
3 Preliminary Design 7.2 Develop integration test plans using design specifications
3.1 Review specifications 8 Integration Testing
3.2 Payload Delivery System 8.1 Test system integration
3.3 Propulsion System design 8.2 Integration testing complete
3.4 Systems design 9 Critical Design Review (CDR) and Flight Readiness Review (FRR)
3.5 Concept Structural design 9.1 Draft CDR report
3.6 Preliminary Safety Case consideration 9.2 Deliver CDR report
3.7 Preliminary Weights estimation 9.3 Draft FRR report
3.8 Obtain approval to proceed 9.4 Deliver FRR report
3.9 Preliminary Design complete 10 Competition
3.10 Deliver PDR to IMeche 10.1 Design Presentation
4 Final Design ready for purchase 10.2 Flight Readiness Review
4.1 System components finalised ready for purchase
10.3 Competition day
4.2 Propulsion components ready for purchase 10.5 UAS CHALLENGE FINISH
Table 1- Work Breakdown Outline Once the work breakdown structure was established, the project schedule was created and is used
as a baseline schedule for the whole duration of the project life. Using the project plan, a graph
representation of the current progress has been created and is shown in Figure 4. This is a
simplified overview of the progress made so far which is detailed in the project plan shown in
Appendix A.2. The progress made so far and completion of tasks can be seen in more detail in the
project plan.

UAS CHALLENGE 2015
7 Project Management MEng Team Project Report (7ENT1024) School of Engineering and Technology
Figure 4 - Progress (to date) of the project
3.3.1 Milestones
The major milestones set for this project are as follows:
30 October - Defining scope of project
16 November - Complete Design Analysis
05 December – Deliver PDR to IMechE
16 December – Design ready for purchase
1 April – Deliver CDR report
30 May - Integration testing complete
12 June – Deliver FRR report
1 July Design presentation
July – Competition Day and End of UAS Challenge
3.4 Leadership
Leadership involves creating an inspiring vision and managing the delivery of the vision.
Leadership brings together the skills needed to achieve this vision. Therefore, it is vital that the
style of leadership is rightly chosen for team performance and effective quality. The style of
leadership may vary during the duration of the project. ‘The three circle model’ is a concept that is
used to represent the dynamics of a group displaying the percentage of effort in terms of team,
task and individual. (Adair, 2012) It is critical for the leader to monitor these areas to ensure that
one area doesn’t needlessly become dominant. An example is where the group may take long to
make decisions due to the size of the group and differences of opinions. This is mitigated by
creating a cut of point whereby the group is no longer being effective in the decision making
process.
0 10 20 30 40 50 60 70 80 90 100
Scope
Design Specification/System Requirements
Preliminary Design
Final Design ready for purchase
Critical Design Review (CDR)
Order parts
Manufacturing & Assembly
Testing and Validation
Integration Testing
Flight Readiness Review (FRR)
Competition
Progress (%)
Project Progress to date

UAS CHALLENGE 2015
8 Project Management MEng Team Project Report (7ENT1024) School of Engineering and Technology
Consequently, the leader will conclude what has been discussed and make the final decision. In
Figure 5 the three circle diagrams depicts in which area leadership was stressed during the
academic year.
Figure 5 - Leadership area of priority – Semester A (Left), Semester B (Right) During the academic year the leadership style varied between a democratic and an authoritarian
style. Semester A involved initial stages of the project whereby there were a lot of group
discussions. It involved the development of the design concept hence a democratic style was
chosen to allow everyone’s input in decision making. This method allows members to feel free to
express their opinion. For people who were intrinsic it was encouraged for them to voice their
opinion in all decision making by actually asking what their thoughts were. This allowed team
members to grow in confidence and voice their opinion, which was good for the group dynamics. At
times, it made decision making problematic but it’s the responsibility of the leader to step in and
make the final decision based on the majority vote.
In semester B, the approach of leadership changed. It required a leader of a more authoritarian
style. This is due the fact that the project had shifted from a design phase to a development and
manufacturing stage. This stage is on a critical path hence an authoritarian style of leadership was
needed to help mitigate any delays. This involved a lot of communication on a daily basis to
establish what was set out to achieve and what was actually accomplished at the end of the day.
Furthermore, constant checking up on individuals was needed to ensure progress and also to deal
with unforeseen circumstances. For example, a time came when there was an issue with the
machining of the main plates for the airframe. The team required more material but there was none
left. As the leader, it was essential to step in and resolve the solution. This circumstance was
handled immediately by contacting the supplier and explaining the situation at hand and how
urgent the material was needed. As a result, the supplier ‘Ensinger’ was able to send out an order
as a free sample for next day delivery.
TEAM
TASK
INDIVIDUAL
TEAM
TASK
INDIVIDUAL

UAS CHALLENGE 2015
9 Project Management MEng Team Project Report (7ENT1024) School of Engineering and Technology
3.5 Team Communication
Throughout the project, weekly meetings with team members were undertaken to discuss any
updates, complications and actions required. Also during semester A, we had weekly meetings on
Tuesday noon with our supervisors to discuss the updates, complications and new actions set for
the week coming and where a register of attendance is taken. Ours meetings are made effective,
by using agendas and minutes. Minutes are used to record the discussions, conclusions and
actions set whereas the agenda was used to structure our meetings by having a schedule stating
exactly what topics are to be discussed and who is presenting the topic of discussion. An example
of the minutes, agenda can be seen in Appendix A.3 and A.4. Communication is essential for the
progression and success of a group. Without effective means of communication the group
production comes to a standstill. Communication methods used in the project are as follows. A
breakdown of the various group communications methods are presented in Table 2
Communication Aids
Types/Techniques Description Email Agendas are always sent out 24 hours before our official meetings
with our supervisors and also minutes are also sent out 24 hours after the meeting as a follow up of what was discussed and agreed in the meeting.
It is used a form communication where all group members can discuss about findings or issues
Google drive An account was made for sharing files between members in the group. Each individual in the group has a folder with their name and hence can share their work to the group
Text messages and phone calls
For contacting individuals in the group privately for any needs regarding the project
Group meetings It’s used as a way to meet up face to face to discuss and updates or issues and to check progress of work and make decision.
Table 2 - Forms of communication used in project
3.6 Project Budgeting
For this project, there was a need for managing the funds to stay within the financial range of
£1390. A budget was used to project the costs and also to track the funds. A comparison of the
actual funds and the budget estimation has been made to see how much has been spent. Table 3
shows the operational budget. On the left are the projections for the budget as of November 2014.
On the right hand side we have the actual unit prices and quantities purchased. The final column
presents the difference between the two. The budget also includes a contingency factor of 1.2 to
anticipate any failures crashes or even unforeseen costs. A more detailed representation of the
product cost can be found in Appendix. D.

UAS CHALLENGE 2015
10 Project Management MEng Team Project Report (7ENT1024) School of Engineering and Technology
Budget Estimation as of
01/11/2014 Actual as of 23/04/2015
Part Unit Price Quantity Unit Price Quantity Difference
Flight controller £150.00 1 £159.98 1 -£9.98
Telemetry kit £40.00 1 £35.80 1 £4.20
GPS Module £50.00 1 £53.94 1 -£3.94
ESC £30.00 5 £27.16 5 -£2.84
Propellers £5.00 6 £3.95 6 £6.30
Brushless Motors £20.00 5 £19.16 5 £0.84
Camera £50.00 1 £56.41 1 -£6.41
OSD £30 1 £29.99 1 £0.01
Batteries £90.00 2 £60.40 3 -£1.20
RC Transmitter £30.00 1 £14.99 1 £15.01
Air frame including landing gear and payload box
£150.00 1 £146.30 1 £3.70
Extra cable and connectors £50.00 1 £20.95 1 £29.05
Test Rig* £150.00 1 £132.08 1 £17.92
Unplanned Quad Parts £0.00 0 £21.02 1 -£21.02
Delivery Costs* £100.00 1 £125.06 1 -£25.06
Total: £1,157.63
C. Factor (x1.2) 1389.16
Current Total: £1,100.94
Remaining: £231.53
*Not Part of COTS Percentage: 79.252438 Table 3 - UAS Challenge 2015 Budget
3.6.1 Summary of Project Budget
The main outcome of the budget that can be identified is that the project is £231.53 (21%) within
budget. This includes the majority of the UAS components, materials and also a test rig with
minimal additional items left to purchase. The flight controller is the team’s most expensive COTS
due to aspiring for a flight controller that was widely used. This will allow us access to open-source
information about autonomous control of the UAS. A complex alternative was to make use of an
Arduino board costing approximately £60 and to program the flight plan manually, hence potentially
saving £100. The team has had to spend some money for items that were not considered initially.
This has accumulated to a total of £210.03 which has been put that as unplanned Quad parts. We
have also gone over budget slightly on delivery cost which was unplanned. A detailed expenditure
of the project to date can be seen in Appendix. D
3.6.2 Source of Funding
There were two main sources funding this project. One was the funding from the university and the
other was from the team members. The university provided the team with £1000 to cover
everything from designing manufacturing, testing and the development of the product. Later, it was
found that this budget was insufficient and that it would only cover the purchase of materials and all
the components required for a Quad rotor design that would achieved good results for the
UAS CHALLENGE 2015
11 Project Management MEng Team Project Report (7ENT1024) School of Engineering and Technology
competition. The team decided to invest in the project extending the budget to £1500 with the aims
of winning an award and being reimbursed.
3.7 Risk Management
Due to a team member previously dealing with the safety case, the task of risk management was
delegated to that member. The rationale behind this decision was that the safety case and risk
management interlink so it was logical to delegate these tasks to an individual. The risk
management can be found in Appendix J.3.
3.8 Conflict management
Conflict is a common phenomenon in group projects. It’s inevitable and hence important as a
leader to understand the various conflict resolution techniques. Conflict isn’t always a bad thing
because it can present opportunities for improvement. Teams usually try to avoid or ignore
conflicts rather than addressing it. It can also have an effect on the team performance, as a leader
it is my duty to prepare for conflicts by creating an atmosphere that allows for dealing with conflicts
without relationship and emotional problems, for instance forming an atmosphere that supports
constructive criticism so that discrepancies can be expressed. Conflicts in the group were resolved
mostly using the following steps: Firstly, the people were separated from the problem by
diagnosing what was causing the issue and then various options were developed in order to
resolve the problem at hand. Secondly, the options were evaluated and the unimportant issues
were distinguished from the vital problems. Additionally, a common ground between each side was
found and a solution for both sides was mutually agreed upon. Finally, the agreement was
monitored to ensure that it was kept.
An example whereby this process was exercised was a situation involving to members in the team.
The issue sparked during a previous report submission where Micky had made a copied CAD
version of the payload box design. Amit had previously made a design for the payload housing due
to severe schedule delays in the project and was not happy about Micky’s contribution and
informed me that for the MEng report he doesn’t want Micky to present that design because he did
not design the payload box and was not involved during the decision making. To resolve this, a
conference call was made between the leader and the two team members. Both sides of the
argument was requested, Micky said that the only reason he had made a new CAD file was to
show how the servo mechanism was going to be applied to the box. It was clear that it was a lack
of communication between the group and absentee Micky had led to this confusion. It was
concluded that Amit would discuss the payload box design itself and its structural analysis whereas
Micky would discuss the servo mechanism and how it interacts with Pixhawk. The conversation
was concluded by further asking if both team members were happy with the decision made and
they were both were pleased with the outcome.

UAS CHALLENGE 2015
12 Project Management MEng Team Project Report (7ENT1024) School of Engineering and Technology
0
1
2
3
4
5
Jonathon Ebhota
0
1
2
3
4
5
Zuber Khan
3.9 Performance Review Performance management allows a business, or in this case, allows the project manager to
determine the strengths and weaknesses of each member in the team. It provides feedback back
to the person being performance managed in areas where they need to develop their skills and
knowledge which they can apply to improve the project in either project delivery or team dynamics.
A performance review of each team member was made to see their strengths and weaknesses
which are broken down into seven different categories; Enthusiasm, Team value, Planning,
Execution, Delivery, and Contribution. As the team itself is quite large, two members were
appointed as team leaders to overlook specific sections; structural and systems. For these two,
three further criteria’s were included; Coaching, Managerial skills and Motivational skill. The
breakdowns of each criterion are as follows:
Enthusiasm: passion and interest for the role and subject
Coaching: training and guiding other team members through their work performance and
subject knowledge
Managerial skills: ability to plan and delegate workload, communicate between team
members, and solving issues between members fairly and objectively
Motivational skills: being able to understand what motivates each member and keeping
them motivated
Team value: quality and information being passed on, insight in topics, availability for help
when asked and general team sportsmanship
Planning: time management, planning for delays and possibly additional workload
Execution: method of execution, holding up other members
Delivery: quality of final work produced for individual role
Contribution: overall workload taken, experience and insight provided and contribution to
the team
Figure 6 – Performance Charts for Jonathan (a) and Zuber (b)

UAS CHALLENGE 2015
13 Project Management MEng Team Project Report (7ENT1024) School of Engineering and Technology
Figure 6 presents the performance chart of the two sub team leaders. It describes on a scale from
0 to 5 how they are rated against each category, where 5 is classed as the best and 0 is classed
as the worst. On average it can be seen that Zuber was excellent in most of these categories
whereas Jonathan mostly was good all round and both lacked in motivating team members. A
more detailed individual performance review of each team members can be seen in Appendix A.5.
3.10 Evaluation
Self-evaluation allows one to reflect on how effective their performance was during the project.
During this process, the performance of the leader can be assessed to see how effective it was,
noting areas that need improvement. It should also list the skills developed and what skills need to
be worked on in order to be a better leader if they were to do the project the second time round.
Using the Project manager evaluation form in the Appendix A.6, it was possible for me to evaluate
my performance. It was found that the team scored me 5 in regards to management of the
team/project, having the ability to work with others, ability to present options and reach decisions
and the ability to locate and utilize resources effectively. As a leader of the team and project these
were my strongest areas. An area in which I was marked to be average was the ability to anticipate
and analyse problems. It seems like this is an area in which I need to focus on if I were to manage
a project again. Moreover, as part of the evaluation there were phrases regarding the likelihood to
work again with the project manager on another project. It was reported back that they would be
willing to work with me again on another project with some changes applied.
Further points were asked for regarding any specific strong points/ weak points about my
performance. The positives were: Firstly, I had good form of communication skills and
persuasiveness. Secondly, I was always going the extra mile and continuously standing up for the
team in front of supervisors and I was very supportive. Evidently, it is clear that I possess essential
skills such as good communication, persuasiveness and I’m very supportive of the team member
because I believe as the leader of the team it is my duty to be the voice of the team and the person
held accountable for the team. The negatives were: primarily, I need to keep within deadlines and
secondly, I am far too lenient. These are areas that need to be worked if I’m to manage another
project. I’m apparently too lenient when it comes to deadlines. During the period of the project, we
have had team members that have had personal issues outside the academic work. It meant that if
I had set deadlines for work to be completed and a team member said they couldn’t complete the
task due to personal problems, I would be reluctant to give them more time. This could potentially
cause delays in the initial time plan and hence maybe keeping to a strict deadline regardless of the
personal background situation might be necessary and something I could consider next time.
Overall, I would say I have done a good job in managing this group so far and I have learnt some
vital lessons regarding what to do and what not to do as a project manager.

UAS CHALLENGE 2015
14 Quad-Rotor Design MEng Team Project Report (7ENT1024) School of Engineering and Technology
Section by Amit Ramji 4 Quad-Rotor Design A Hex-Rotor had been considered during the early stage of the design convergence process,
however during the detail design stage this had been changed to a Quad-rotor design. The reason
for such a dramatic design change is due to mass and cost constraints and is detailed in Appendix.
C and Appendix. D respectively.
Upon detailed consideration of the mass and materials involved with the Hex-rotor, it had been
decided to significantly modify the design and produce a Quad-rotor. As detailed in Appendix. C,
the reduction in mass by alterations in geometry, reduction of parts and optimising the use of
materials results in a very lightweight structure as shown in Figure 7 below. The use of extruded
Nylon 6 main body plates (Appendix B.7) allows for a lightweight structure that is fastened together
into a sandwich design to provide a significantly rigid structure. The use of Carbon Fibre has been
entirely eliminated due to financial constraints; hence a suitable strengthened alternative is
selected. The use of M3 bolts and Nylon 66 blocks (Appendix B.7) allows for a rigid main structure
with multiple load paths. Using the machined Nylon 66 blocks in compression allows for the
majority of the loads to remain in-plane of the main body plates and allows the fasteners to take up
most of the load.
Details of the design architecture and in-depth features are found in Figure 7 through Figure 9 and
Appendix B.7.
Figure 7 - Quad-rotor design

UAS CHALLENGE 2015
15 Quad-Rotor Design MEng Team Project Report (7ENT1024) School of Engineering and Technology
4.1 Design Rationale - Quad-Rotor
Figure 8 - Stowage Instructions
Figure 9 - Quad-rotor in Stowed Configuration
Fixed Nylon bracket in compression
Moving Nylon tube position support bracket
Rotating Nylon
Mount with
Spacers and
Through Bolt
Sandwich Design to minimise bending effect with rigid links (M3 bolts)
In-Plane Shear for plates
Remove Quick Release pins (2-Off) for compact stowage.

UAS CHALLENGE 2015
16 Quad-Rotor Design MEng Team Project Report (7ENT1024) School of Engineering and Technology
Section by Amit Ramji 4.2 Payload Box Design and Mechanism Figure 10 through Figure 13 show the design of the payload housing with a simple trap-door type
design activated by gravity with release of a servo. The design can be adapted to use either rotary
servo motors or linear actuators. The structural analysis of the payload compartment and its
development is carried out in Appendix G.15 and G.16. Dimensions of the payload compartment,
component parts and BOM can be found in Appendix B.7.
Figure 10 – Removable Lightweight Payload Box
Figure 11 - Removable Lightweight Payload Box
Figure 12 - Payload Box with simple construction and failsafe mechanism
Figure 13 – Payload Box with Payload Clearance

UAS CHALLENGE 2015
17 UAV Mass Breakdown MEng Team Project Report (7ENT1024) School of Engineering and Technology
5 UAV Mass Breakdown Initially a Hex-rotor was considered with a structure mass of 1777.5g, an all-up mass of 7371.9g
with a single payload. The mass of the UAV must not exceed 7kg, hence a complete redesign as a
Quad-rotor has been fulfilled.
A detailed Quad-rotor mass calculation (Appendix. C) has been carried out to ensure the UAV is
within CAA certifiable weights limits to enable flight and to ensure the requirements are met
(IMechE, Jan 2015). The total mass of the Quad-rotor is 6026.2g with single payload. An itemised
breakdown shown in Appendix. C.
UAV Structural Mass
The total mass of the structure is calculated to be 1012.5g including all the materials and fixings
depicted in Appendix B.7. The structure mass is well below the target mass of 1.5 Kg, due to the
extensive and detailed stress analysis carried during the detailed design stage. The entire itemised
breakdown can be observed in Appendix. C.
UAV Electrical / Miscellaneous Components Mass
The total mass of the Electrical / Misc. components is calculated to be 5013.7g including all the
motors, batteries and additional wiring and soldered joints. The itemised breakdown can once
again be observed in Appendix. C.
6 UAV Cost Breakdown Initially a Hex-rotor was considered, which would inherently have increased cost compared to a
Quad-rotor due to increased structural, electronic and propulsion components. It was therefore
unequivocal that a Quad-rotor was the tactic forward to achieving a solution within budget
requirements.
A detailed cost calculation for the Quad-rotor (Appendix. D) has been carried out to ensure the
UAV is within IMechE budget limits (IMechE, Jan 2015). The total cost of COTS items within the
Quad-rotor is £824.84, structure cost of £81.34, hence a total cost of £906.18 with an itemised
breakdown provided in Appendix. D. The above cost summary is inclusive of VAT, less delivery
and is accurate to retail prices at the time of purchase.
Section by Zuber Khan
Section by Zuber Khan

UAS CHALLENGE 2015
18 Structural Analysis MEng Team Project Report (7ENT1024) School of Engineering and Technology
7 Structural Analysis
7.1 Load Case Definition and Free Body Diagrams
Figure 14 – Free Body Diagram - Flight and Landing Cases
Figure 15 - Free Body Diagram - Landing Cases
Section by Zuber Khan

UAS CHALLENGE 2015
19 Structural Analysis MEng Team Project Report (7ENT1024) School of Engineering and Technology
Figure 16 - Free Body Diagram - Flight and Gust Load Cases

UAS CHALLENGE 2015
20 UAV Stress Analysis MEng Team Project Report (7ENT1024) School of Engineering and Technology
Section by Amit Ramji
Section by Amit Ramji
8 UAV Stress Analysis
8.1 Stress Reduction Techniques The following design techniques have been adopted to maximise efficiency of the material and
ensure a lightweight and stress reduced structure at local discontinuities and overall load paths.
Further comprehensive methods of stress reduction and material optimisation can be found in
Appendix G.1, below is a summarised list of methods.
Align known material properties with major load direction where possible. Hence the use of
Nylon 66 Blocks being used in compression (FB-001 & 002) and fasteners being used in
shear and tension (M3’s & M5’s).
Stiffen or reinforce unsymmetrical features to minimize flexure. An example of this
consideration is the use of the Nylon 66 Fixed Blocks (FB-001 & 002) used in the main
body alongside the M3 Brass spacers which act as rigid links between the main body plates
(BP-001 and 002) to reduce total body deflection.
Encourage smooth transitions in cross section and stress levels, avoiding hard points in the
primary load path. In some cases this could not be avoided (MA-001 contacting FB-002 –
See Figure 115 through Figure 119), therefore an additional local support (MB-001 –
Appendix B.7) is incorporated.
Where appropriate, distribute the load pathways between multiple components to avoid
bulky structure and concentrated stress distributions on single components. An example of
such situation is the multiple load paths in the main body, where a sandwich type design is
achieved. The stiffness of the main body structure is greatly increased with rigid links (M3
Fasteners, FB-001, FB-002, MB-001 and M3 spacers).
8.2 Fatigue Awareness A gain in fatigue life can in most situations be achieved without an increase in cost, simply by
attention to design detail. Further comprehensive methods of fatigue resistance with material
optimisation can be found in Appendix G.1, below is a summarised list of methods considered. The
following should be taken into account when considering the Quad-Rotor structure:
Avoiding sharp edges, corners and sudden changes in cross-section can reduce stress
concentrations. Fillet and intersection radii should be as large as possible as such used in
the Lug Bracket (LB-003) and Pivots (AP-001 & LP-001).
The majority of fatigue cracks will start at stress concentrations such as holes, notches, etc.
Any design features or processes that can be applied to reduce the severity of such stress
concentrations should be used.
Ensuring design of joints are such as not to give rise to built-in stresses on assembly, or
load some portions of the joint unduly. The use of M3 and M5 from the same supplier to
avoid mixing fasteners of dissimilar material/strength and those that require differing

UAS CHALLENGE 2015
21 UAV Stress Analysis MEng Team Project Report (7ENT1024) School of Engineering and Technology
tolerances of fit. Fasteners with tighter tolerances will load the local structure during
repeated flexure more than a loose tolerance fastener due to the miniscule freedom of
movement of the joint.
In fatigue critical areas, interference fit fasteners shall be used whenever possible in
preference to clearance fit. A close tolerance for clearance/transition fit fasteners will
improve the fatigue performance of the joint, as this will minimize the risk of individual holes
being over-loaded. For the current Quad-Rotor design, fasteners are loaded axially hence
introducing a bolt pre-load and reducing the miniscule movement if any existed.
8.3 Fatigue due to induced vibration A gain in fatigue life due to induced vibration can also be achieved simply by attention to design
detail, material selection, edge distances and overall geometry. Further comprehensive methods of
optimisation can be found in Appendix G.1, below is a summarised list of methods considered. The
following should be taken into account when considering the Quad-Rotor structure and rotating
components:
Fatigue damage can often arise from induced vibration from the motors as compared with
fatigue damage arising from directly applied structural stresses. Often this vibration is not
sustained for long periods of time, a modal analysis case has been considered for the
Fixed-arm assembly as shown in section 8.17 and compared to analytical methods as
shown in section 8.16. Such calculated modal frequencies should be avoided or swiftly
passed through the first 3 natural frequencies when powering up the motors to idle and can
be programmed into the ESC’s as “soft, medium, hard” starts.
Avoiding the use of long cantilevered members, as these will experience high inertia forces
in vibration. The modal analysis of the Arm has been the main concentration for the
purpose of frequency response analysis, as the cantilever of the Arms are more susceptible
to vibration than any other components.
8.4 Pressure Loading on Plates A complete structural analysis was carried out on the UAV with the main stresses and loads
summarised below. The first scenario to be analysed was the UAV in flight, flying at maximum
speed allowable with maximum head on gusts off 25knots. The distributed load calculated in
Appendix F.2 approaches to 5.27Kg, which has a 1.5 global load safety applied to it. This was then
used to determine the deflection and stress of a simplified UAV model.
Section by Amit Ramji
Section by Zuber Khan

UAS CHALLENGE 2015
22 UAV Stress Analysis MEng Team Project Report (7ENT1024) School of Engineering and Technology
8.5 Load Transfer Loads are transferred from the arms to the Nylon clamps using a moment balance shown in Figure
108. Reaction loads passing through the clamps could then be calculated, the Fixed-arm clamp
having 65.18N passing through it and the Movable-arm having 63.29N.
Figure 17 – Fixed Arm Cross Section – See also Appendix G.7
8.6 Fixed and Movable Arm Stress Maximum The maximum bending stress experienced on the Fixed-arm is 14.42MPa as shown in Appendix
G.7 and the maximum bending stress experienced by the Movable-arm is 15.26MPa as shown in
Appendix G.8. Refer to Appendix B.7 for parts list, Appendix. E for material properties, G.4 for
boundary conditions, G.5 for Finite Element solver method, G.6 for mesh types and properties and
G.7 - G.8 for results of the contact model for bending case of the UAV Arms. A Sample calculation
for the Fixed-arm is shown below:
𝜎 =𝑀𝑦
𝐼=
25 × 0.17 ×0.016
2𝜋
64(0.0164 − 0.01154)
= 14.42𝑀𝑝𝑎
D1 F1
F2
D2
Section by Zuber Khan
FEA by Amit Ramji Analytical by Zuber Khan

UAS CHALLENGE 2015
23 UAV Stress Analysis MEng Team Project Report (7ENT1024) School of Engineering and Technology
Stress analysis at Fixed-arm – FEA Method
Mesh: Values as per section G.6
Figure 18 – Mesh for Fixed-arm Assembly – Values as per Appendix G.6 Results:
Figure 19 - Deflection of Fixed-arm Assembly (Flight Loads) with 7.6mm Deflection
Figure 20 - Stress of Fixed-arm Assembly (Flight Loads) with Stress 15.8MPa (Contact) and 20MPa (Peak)
Section by Amit Ramji

UAS CHALLENGE 2015
24 UAV Stress Analysis MEng Team Project Report (7ENT1024) School of Engineering and Technology
Figure 21 – Stress (Close-up) of Fixed-arm Assembly (Flight Loads) with Stress 15.8MPa (Contact) and 20MPa (Peak)
FEM Verification: Tube Stress Comparison
One can observe the results from the above analytical stress calculation being 14.42MPa and the
stress level as seen in the far field stress contour of the tube in Figure 21 (15.8MPa) being very
close. Substantiation of the numerical modelling and contact constraints can be deemed as
accurate as a very small difference is observed between the methods.
8.7 Simplified Plate Deflection Plate deflection has also been calculated analytically to enable comparison to an FEA model,
ensuring the modelling techniques are correct and establishing meshing and connection properties
to be used on the entire UAV FEA model. The analytical method calculated a deflection of
4.555mm, whereas the FEA package calculated 4.54mm (Appendix G.11). These results are in the
same order of magnitude and are marginally different; therefore the modelling technique is deemed
correct and usable throughout.
8.7.1 Simply Supported Plate Representation
A simple plate deflection was determined of a 2mm thick Nylon plate with dimensions of 315mm by
280mm. This was the largest the plate would go to on the UAV if necessary therefore was used for
the purpose of this analysis. The reason for this was to compare the analytical results with the
results produced by the FEA model. If the results were similar or close to the analytical method, the
modelling method could be applied to the whole UAV model where the plates are used.
Section by Zuber Khan
Section by Zuber Khan

UAS CHALLENGE 2015
25 UAV Stress Analysis MEng Team Project Report (7ENT1024) School of Engineering and Technology
Figure 22 - Simplified Plate Representations
All edges simply supported for this analysis.
8.7.2 Analytical Method
Below are the Navier stokes equations used to work out the plate deflection at the centre, where
the maximum deflection will take place.
𝐷 = 𝐸𝑡3
12(1 − 𝑣2)
Equation 1 - Flexural Rigidity of the Plate (Ventsel and Krauthammer, 2001)
𝑤(𝑥, 𝑦) = ∑ ∑ 𝑤𝑚𝑛 sin𝑚𝜋𝑥
𝑎sin
𝑛𝜋𝑦
𝑏
∞
𝑛=1
∞
𝑚=1
= 𝑤11 sin𝜋𝑥
𝑎sin
𝜋𝑦
𝑏+ 𝑤12 sin
𝜋𝑥
𝑎sin
2𝜋𝑦
𝑏+ 𝑤21 sin
2𝜋𝑥
𝑎sin
𝜋𝑦
𝑏+ …
Equation 2 – Navier solution (Ventsel and Krauthammer, 2001)
𝑎𝑚𝑛 =16𝑞0
𝑚𝑛𝜋2
Equation 3 - Navier stokes coefficient 1 (Ventsel and Krauthammer, 2001)
𝑤𝑚𝑛 =1
𝜋4𝐷
𝑎𝑚𝑛
[(𝑚2
𝑎2 ) + (𝑛2
𝑏2)]2
Equation 4 - Navier Stokes coefficient 2(Ventsel and Krauthammer, 2001)
First the pressure distributed on the whole plate surface was calculated.
𝐹𝑜𝑟𝑐𝑒
𝐴𝑟𝑒𝑎=
33.8445
88200 × 10−6= 383.72
𝑁
𝑚2
Followed by calculating the flexural rigidity
𝐷 = 3300 × 106 × 0.0023
12(1 − 0.42)= 2.61905
The Navier coefficients 1 and 2 could be calculated for when mn = 1 1, 1 3, 3 1, 3 3
𝑎11 =16×383.72
1×1×𝜋2 = 622.063 𝑎13 = 207.35 𝑎31 = 207.35 𝑎33 = 69.12
X = a = 315mm
Y =
b =
280m
m Youngs Modulus, E = 3300MPa
Thickness, t = 0.002m
Poisson’s Ratio, v =0.3
Distributed Force = 33.8445N
Area = 88200 x 10e-6 m2

UAS CHALLENGE 2015
26 UAV Stress Analysis MEng Team Project Report (7ENT1024) School of Engineering and Technology
w11 =1
π4 × 2.61905
622.063
[(12
0.3152) + (12
0.282)]2 = 4.67689 × 10⁻³
w13 =1
π4 × 2.61905
207.35
[(12
0.3152) + (32
0.282)]2 = 5.21215 × 10⁻⁵
w31 =1
π4 × 2.61905
207.35
[(32
0.3152) + (12
0.282)]2 = 7.59333 × 10⁻⁵
𝑤33 =1
𝜋4 × 2.61905
69.12
[(32
0.3152) + (32
0.282)]2 = 6.41566 × 10⁻⁶
The coefficients were then input into the Navier solution equation to calculate the deflection at the
centre.
𝑤(𝑥, 𝑦) = 4.67689 × 10⁻³ × sin (𝜋 × 0.1575
0.315) × sin (
𝜋 × 0.14
0.28) + 5.21215 × 10⁻⁵ × sin (
π × 0.1575
0.315)
× sin (3π × 0.14
0.28) + 7.59333 × 10⁻⁵ × sin (
3π × 0.1575
0.315)
× sin (π × 0.14
0.28) + 6.41566 × 10⁻⁶ × sin (
3π × 0.1575
0.315) × sin (
3π × 0.14
0.28)
w(x, y) = 4.67689 × 10⁻³ − 5.21215 × 10⁻⁵ − 7.59333 × 10⁻⁵ + 6.41566 × 10⁻⁶
w(x, y) = 4.555 × 10⁻³m = 4.555mm
8.7.3 FEA – Simplified Rectangular Approximation
Using Catia the same plate was modelled with the same constraints and loads to see the deflection
it would cause.
Figure 23 - Simple Plate Deflection Carried out on CATIA showing 4.54mm deflection From the FEA model (Figure 23) it was found that the deflection has been calculated to be
4.54mm.

UAS CHALLENGE 2015
27 UAV Stress Analysis MEng Team Project Report (7ENT1024) School of Engineering and Technology
Section by Amit Ramji
Section by Zuber Khan
Section by Zuber Khan
The mesh used was set to a size of 2mm with absolute sag of 1.5mm. Therefore any further plate
bending analysis carried out on CATIA, should be set to the same mesh size and constraints as it
has been substantiated to provide accurate answers.
Method Deflection
Analytical (Rectangular Plate) 4.555mm
FEA CATIA (Rectangular Plate) 4.54mm
Table 4 – Comparison of Simplified Plate Deflection for Model Substantiation
8.8 Plate Deflection - Assembly Contact Model as Built
To enable an accurate understanding of plate deflection as an assembly, a non-linear contact
model has been modelled in Ansys and shows a very small deflection of ≈0.13mm. The reason for
such a reduction in deflection compared to the simplified substantiation is due to the presence of
rigid bodies (Fasteners and FB/MB
series blocks). Refer to Appendix B.7
for parts list, Appendix. E for material
properties, G.4 for boundary
conditions, G.5 for Finite Element
solver method, G.6 for mesh types
and properties and G.12 for results of
the contact model for in-flight case of
the Quad-rotor.
Figure 24 - Flight and Gust condition of Main Body with 0.13mm Deflection
8.9 Undercarriage Buckling Calculation The undercarriage is also analysed to check whether it is suitable for heavy landings and repeated
loadings. The critical load was calculated in Appendix G.13 which was 393.7N = 40.13Kg. Meaning
the UAV could land on a single undercarriage and be able to withstand a load of ≈40Kg before
buckling. A sample calculation from G.13 is shown below:
𝑃𝐶𝑅
𝜋2 × 𝐸𝐼
(2𝑛𝐿
𝜌 )2 =
𝜋2 × 3100 × 106 × 9.7193 × 10−5
(2 × 0.18
4.926 × 10⁻³)2 = 556.78𝑁
8.10 Undercarriage Bending Analysis on pure bending has also been carried out in Appendix G.13, to represent a pivot jam or
lateral sideward landing on a single undercarriage leg. With the applied 1.5 global load safety
factor the stress experienced by the undercarriage leg was in the region of 62.2MPa, being higher
than the yielding properties of the PVC material (Appendix. E). However this analysis has assumed

UAS CHALLENGE 2015
28 UAV Stress Analysis MEng Team Project Report (7ENT1024) School of Engineering and Technology
Section by Amit Ramji
a worst-case scenario with the UAV landing on a single leg, which can now be avoided. The UAV
would also share multiple load paths if a misbalanced landing were experienced therefore reducing
the stress. Additionally, the entire Quad-rotor structure would deflect as a result of such bending
impact, highlighting that a parent non-linearity has not been considered. To further analyse such
parent non-linearity on a single undercarriage leg, spring constraints at the Lug bracket (LB-003)
bolt holes with the stiffness of the main body structure can be modelled
8.11 Undercarriage Bending - Assembly Contact Model In order to obtain an accurate understanding of landing conditions, a 1-second impact case has
been created on Ansys to highlight potential failure points. It is worth noting the analytical
technique described above in section 8.10 with a stress of 62.2 MPa is very close to that shown in
Figure 25 (60.63MPa). From this similarity in analytical and numerical methods, it is conclusive that
the analytical modelling techniques are substantiated and can be relied upon for further analysis if
required. Refer to Appendix B.7 for parts list, Appendix. E for material properties, G.4 for boundary
conditions, G.5 for Finite Element solver method, G.6 for mesh types and properties and G.13 for
results of the contact model for bending case of the undercarriage.
Figure 25 - Lateral Impact Case on Single Leg - 60.6MPa Stress

UAS CHALLENGE 2015
29 UAV Stress Analysis MEng Team Project Report (7ENT1024) School of Engineering and Technology
Section by Zuber Khan
Section by Zuber Khan
8.12 Undercarriage Torsion Torsional analysis has also been carried out to determine the twist the undercarriage would
experience if the UAV landed on the tip of one horizontal leg (UH-001 - Appendix B.7). Appendix
G.13 calculates a pure torsion case to be used for a combined loading effect in section 8.13 and
8.14. The calculated twist angle is 0.6257rad or 35.85°, the twist angle being of such high
magnitude indicates a high stiffness constraint at the boundary condition or a significantly high load
due to single leg impact assumptions. However the assumption of a single leg impact is a rare
occasion and can now be avoided. The shear experienced by the undercarriage due to the twist is
calculated to be 30.57MPa which is significantly low compared to the PVC yielding properties in
shear being 1099.3MPa (Appendix. E).
8.13 Undercarriage Combined Loading - Torsion and Bending
A combined loading analytical method is also carried out on the undercarriage leg representing 3
loads being applied at the same time including a torsion, buckling and bending loads as shown in
“Analytical – Undercarriage Combined Loading – Bending, Buckling and Torsion” of Appendix
G.13. The principle stress is calculated as 27.1MPa and -34.5MPa, which is acceptable due to the
yielding strength of the PVC being 55MPa (Appendix. E). The loads were calculated with an
applied 1.5 global load safety factor and the over engineered assumption of a single leg impact.
The principle angle of the stresses were -41.55° and 48.45° respectively and a sample calculation
is shown below:
𝜎1 =−1.059798 − 6.34
2+
1
2√(−1.059798 − 6.34)2 + 4 × 30.5722 = 27.1 𝑀𝑃𝑎
The maximum shear caused by the
combined loading is calculated to be
30.795MPa, which is also well within
the capabilities of the material.
Figure 26 – Stress Element A with Principal Stress for - Analytical – Undercarriage Combined Loading – Bending, Buckling and Torsion (G.13)
𝜏𝑥𝑦
𝜎𝑥
𝜎𝑦
𝜏𝑥𝑦
𝜏𝑦𝑥 𝜎𝑦
𝜎𝑥
𝜏𝑦𝑥
A 𝜃1
𝜃2
27.095
-34.495
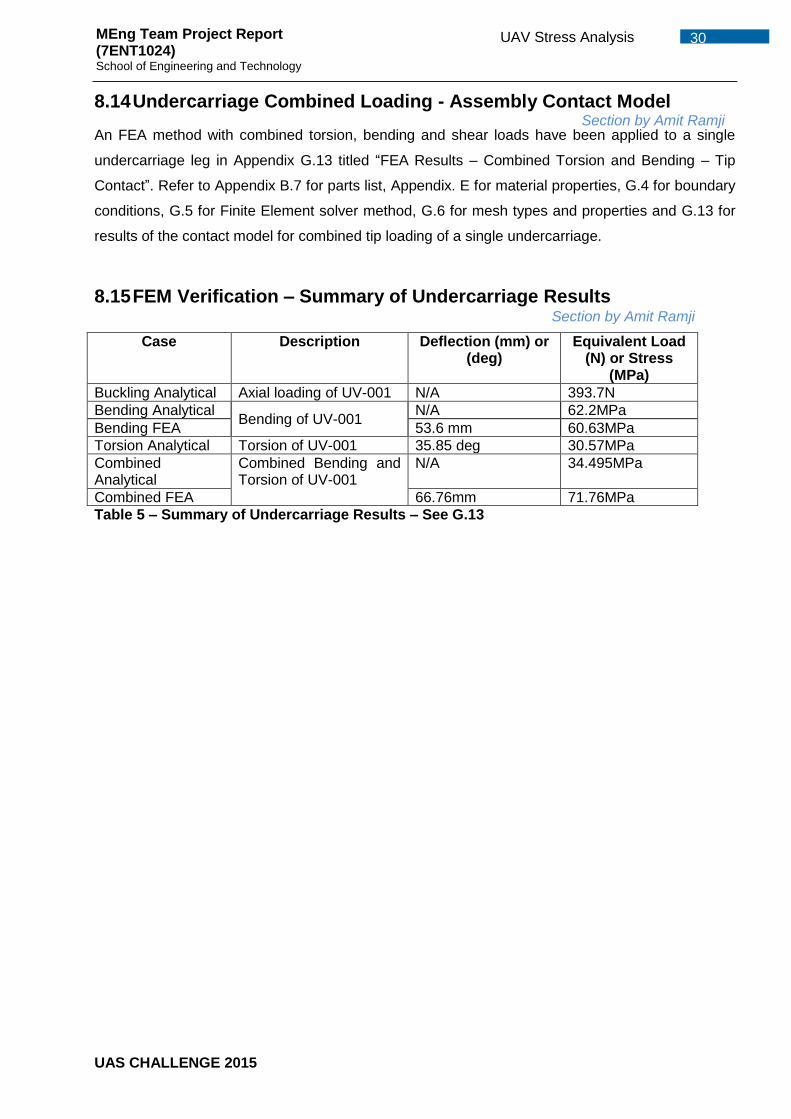
UAS CHALLENGE 2015
30 UAV Stress Analysis MEng Team Project Report (7ENT1024) School of Engineering and Technology
Section by Amit Ramji
Section by Amit Ramji
8.14 Undercarriage Combined Loading - Assembly Contact Model
An FEA method with combined torsion, bending and shear loads have been applied to a single
undercarriage leg in Appendix G.13 titled “FEA Results – Combined Torsion and Bending – Tip
Contact”. Refer to Appendix B.7 for parts list, Appendix. E for material properties, G.4 for boundary
conditions, G.5 for Finite Element solver method, G.6 for mesh types and properties and G.13 for
results of the contact model for combined tip loading of a single undercarriage.
8.15 FEM Verification – Summary of Undercarriage Results
Case Description Deflection (mm) or (deg)
Equivalent Load (N) or Stress
(MPa)
Buckling Analytical Axial loading of UV-001 N/A 393.7N
Bending Analytical Bending of UV-001
N/A 62.2MPa
Bending FEA 53.6 mm 60.63MPa
Torsion Analytical Torsion of UV-001 35.85 deg 30.57MPa
Combined Analytical
Combined Bending and Torsion of UV-001
N/A 34.495MPa
Combined FEA 66.76mm 71.76MPa
Table 5 – Summary of Undercarriage Results – See G.13

UAS CHALLENGE 2015
31 UAV Stress Analysis MEng Team Project Report (7ENT1024) School of Engineering and Technology
Section by Zuber Khan
8.16 Modal Analysis of Fixed-arm – Simplified Case Parts: As per Appendix B.7
Materials: As per Appendix. E
8.16.1 Analytical Modal Analysis – Simplified
Modal analysis was carried out to determine the natural frequency of the UAV arm with the full
assembly of parts with their corresponding weights. Once the natural frequency is known, one can
program the autopilot system (Pixhawk) and ESC’s to ramp through the primary natural
frequencies to ensure excessive vibration is not encountered. The ESC’s can control the motors to
have a “soft/ medium/hard” start to idle for this reason and the modal frequencies can be avoided
to protect the structure (loosening fasteners, fatigue and instability during flight).
Figure 27 - Arm and Mass for Rayleigh Method To determine the natural frequency of the arm with the weight of all attached components, the
following equations were used.
∅1(𝑥) = 𝑎1(3𝐿𝑥2 − 𝑥3)
Equation 5 -Static Deflection Curve (MEGSON, 1999)
𝜔2 =∫ 𝐸𝐼 (
𝑑2∅𝑑𝑥2)
2
𝑑𝑥 + ∑ 𝑘𝑗∅2(𝑥𝑗)𝑁𝑗=1
𝐿
0
∫ 𝜌𝐴∅2𝑑𝑥 + ∑ 𝑚𝑗∅2(𝑥𝑗)𝐽𝑗=1
𝐿
0
Equation 6 - Rayleigh's Natural Frequency Equation (MEGSON, 1999)
To be able to calculate the natural frequency using Equation 6, the static deflection equation
requires to be differentiated twice.
𝑑∅1(𝑥)
𝑑𝑥= 𝑎1(6𝐿𝑥 − 3𝑥2) ∴
𝑑2∅1(𝑥)
𝑑𝑥2= 6𝑎1(𝐿 − 𝑥)
The deflection where the concentrated mass is attached:
∅1(𝑥 = 0.231) = 𝑎1(3𝐿𝑥2 − 𝑥3) = 0.025625808
Using that and inputting some of the values the equation becomes:
𝜔2 =12𝐸𝐼𝐿3
𝜌𝐴 [9𝐿2𝑥2
5−
6𝐿𝑥6
6 +𝑥7
7 ]0
𝐿
+25𝑚𝐿6
64
𝜔2
=12 × 3100 × 106 × 2.35845 × 10−9 × 0.2343
1.4 × 9.7 × 10−5 × [9 × 0.2342 × 0.2342
5−
6 × 0.234 × 0.2346
6 +0.2347
7 ] +25 × 0.36846 × 0.2346
64
L = X = 0.234m
m = 0.36846Kg

UAS CHALLENGE 2015
32 UAV Stress Analysis MEng Team Project Report (7ENT1024) School of Engineering and Technology
𝜔2 =1.124131676
(1.4 × 9.7 × 10−5 × 5.361854627 × 10−3) + 2.362901004 × 10−5 =
1.124131676
2.43571499 × 10⁻⁵
𝜔 = √1.124131676
2.43571499 × 10−5= 214.83𝑟𝑎𝑑/𝑠 = 34.19𝐻𝑧 = 2041.93𝑅𝑃𝑀
From this it can be concluded that the natural frequency of the simplified arm is 34.19Hz.
Rayleigh’s method usually always over predicts, therefore in reality the natural frequency will be
slightly lower.

UAS CHALLENGE 2015
33 UAV Stress Analysis MEng Team Project Report (7ENT1024) School of Engineering and Technology
Section by Amit Ramji 8.16.2 Finite Element Modal Analysis – Simplified
Parts: As per Appendix B.7
Materials: As per Appendix. E
Mesh: Values as per section G.6
Results:
Figure 28 – Mass Representation of Motors, Blocks, Plates, Fasteners and ESC
Figure 29 – Simplified FE analysis with 1st Nat freq as 19.64Hz – 69.3mm Deflection (Left) and 164MPa Stress (Right)
Figure 30 – Simplified FE with 2nd Nat freq as 20.06 Hz (Left) and 3rd Nat freq as 134.6 Hz (Right)
Figure 31 – Simplified FE with 4th Nat freq as 224.1 Hz (Left) and 5th Nat freq as 411.9 Hz (Right)

UAS CHALLENGE 2015
34 UAV Stress Analysis MEng Team Project Report (7ENT1024) School of Engineering and Technology
Section by Amit Ramji
8.17 Modal Analysis of Fixed-arm – Actual Parts (As Built) Parts: As per Appendix B.7 Materials: As per Appendix. E Mesh: Values as per section G.6 Results:
Figure 32 – As Built FE Analysis - Mass Representation of Motors, Fasteners, Cables and ESC
Figure 33 – As Built FE analysis with 1st Nat freq as 451 Hz – 69.0mm Deflection (Left) and Stress (Right)
Figure 34 - As Built FE analysis with 2nd Nat freq as 736 Hz (Left) and 3rd Nat freq as 1707 Hz (Right)
Figure 35 - As Built FE analysis with 4th Nat freq as 2 KHz (Left) and 5th Nat freq as 4.1 KHz (Right)

UAS CHALLENGE 2015
35 UAV Stress Analysis MEng Team Project Report (7ENT1024) School of Engineering and Technology
Section by Amit Ramji 8.18 Summary of Modal Frequency Results
1st Nat Freq (Hz)
2nd Nat Freq (Hz)
3rd Nat Freq (Hz)
4th Nat Freq (Hz)
5th Nat Freq (Hz)
Simplified Analytical (8.16)
34.19 N/A N/A N/A N/A
Simplified FEA (8.16)
19.64 20.06 134.6 224.1 411.9
As-built FEA (8.17)
451 736 1707 2000 4100
Table 6 – Summary of Modal Frequencies for Fixed Motor Arm As predicted from the Rayleigh method in Section 8.16, the actual natural frequency will be slightly
lower between the 34.19 Hz Vs the 19.64 Hz. From this simplified analysis, one can substantiate
the modelling techniques used in the FEA for more complex assemblies. The As-built cases have
significantly higher modal frequencies and was also predicted due to the increased stiffness when
considering fastened motor plates and blocks. Additionally it is worth noting that the higher less
important frequencies have modal excitation closer to the motor mount plates, hence the reason
for selecting Aluminium Alloy plate as a mounting material for the motors (Appendix B.7 and
Appendix. E). Aluminium Alloy compared to the cast mild-steel motor brackets which are supplied
with the motors are less susceptible to fatigue damage due to repetitive vibration.

UAS CHALLENGE 2015
36 UAV Stress Analysis MEng Team Project Report (7ENT1024) School of Engineering and Technology
Section by Zuber Khan 8.19 Summarised Margin of Safety Table Below is a margin of safety table which has maximum loads and stresses which could be applied
onto the Quad-rotor and also the maximum allowable loads and stresses. Using the maximum and
allowable loads and stresses, safety factors were obtained.
Part No. (Appendix B.7)
Case / Calculation / Section
Loading Description
Maximum Applied Load/Stress
Maximum Allowable Load/Stress Appendix. E
Safety Factor, SF= Allowable /Applied
FA-001 Case 1 (G.7)
Maximum Thrust from Motors
14.42MPa 55MPa 3.81
MA-001 Case 1 (G.8)
Maximum Thrust from Motors
15.26MPa 55MPa 3.60
UV-001 Case 2 (G.13)
Undercarriage Pipe Under Buckling
10.5Kg 56.76Kg 5.41
Case 4 (G.13)
Undercarriage Pipe Under Torsion
30.57MPa 1099.3MPa 35.96
LB-003 (G.9) Undercarriage Lug Under Maximum Loading
72.84N 1765.15N 24.23
UV-001 Analytical – Undercarriage Combined Loading – Bending, Buckling and Torsion (G.13)
Combined Loading 𝜎1 on Undercarriage Vertical Leg
27.09MPa 55MPa 2.03
Combined Loading
𝜎2 on Undercarriage Vertical Leg
34.5MPa 55MPa 1.59
BP-001 & BP-002 Assembly.
Appendix G.12 Main Body Deflection due to Maximum Thrust and Gusts
5.83MPa 55MPa 9.43
Table 7 - Summarised Margin of Safety Table

UAS CHALLENGE 2015
37 Performance, Propulsion & Systems Engineer
MEng Team Project Report (7ENT1024) School of Engineering and Technology
Section by Hassan Dzadey 9 Performance, Propulsion & Systems Engineer
As a practicing performance and propulsion engineer the key parameters that were vital within this
report was to investigate and identify possible propeller, motor, esc (electronic speed controllers)
and power supply combinations that are efficient and also cost effective with the ability to achieve
the mission objectives set by the IMechE UAS challenge. It is also within the interest of this report
to point out the work that has been conducted as a systems engineer to improve the navigation of
the UAS (Unmanned Aircraft Systems) and target tracking.
At the start of the MEng project IMechE had set specific limitations to which partly involved the
performance of the UAS along with mission details. These specifications are identified below which
were strictly followed:
Maximum Take-Off Mass (MTOM) must be equal to, or less than 7kg
Must have the capability to fly under 20knots wind and 25knots gust conditions
Maximum airspeed of 60knots (IAS) must not be exceeded
Must be capable of operating within altitude range of 100ft-400ft
Must have the ability to complete 2km round mission
On top of the IMechE specification there were specifications set by the MEng group, which are
listed below and also strictly adhered to.
Initial cost limitation of £550 after taking into account structural other electrical components
Initial propulsion and power supply weight limitation of 3.7kg was set after taking into
account structural, payload and electrical components weights
At the start of the MEng project various design concepts such as aeroplane, helicopter, Quad-rotor,
Hex-rotor, octocopter and osprey tilt rotor were put forward and analysed and after careful
alliteration the Hex-rotor was chosen as the design that the group would like to construct and put
thought to the IMechE UAS Challenge. Hence for the PDR the performance and propulsion
calculations were based on Hex-rotor as shown in appendix A. During mid-January it was identified
that while the cost would be under the £1000 limit set by the IMechE, the maximum take-off mass
of 7kg would be exceeded by 500g. From this point it was decided to change the design to Quad-
rotor, hence from Appendix H.2 onwards the calculations will be based on and around the Quad-
rotor design.
Most of components that are investigated in this report involves two unknown variables that are
required e.g. a propellers two variables involves its diameter and pitch, the RC motor has KV and
power, and the power supply requires voltage and capacity calculations. For this reason this report
has been split into sections which address one variable per component at a time by process of
elimination.

UAS CHALLENGE 2015
38 Performance, Propulsion & Systems Engineer
MEng Team Project Report (7ENT1024) School of Engineering and Technology
9.1 Propeller Diameter Selection To perform any type of performance and propulsion calculations the MTOM is vital, for this initially
7kg is used which was the estimated mass and also the maximum permissible mass from IMechE
specifications. Also 7kg is used as it would be easier to down grade the performance at a later
stage in the project if it is required than to do it the other way around. Having initialised the MTOM,
the lift required to hover per motor can be calculated using Equation 7.
(MTOM ∗ 9.81
Number of motors) = 17.18N/motor
Equation 7 - Lift Required Using the same principle as helicopter the Quad-rotor must sustain lift and also move forward by
changing pitch, therefore the propellers must have the capability to sustain lift required and also
thrust for forward movement which results in Equation 7 being insufficient and it has to be
modified. The modification can be seen in Equation 8 to account for lift and thrust. Equation 8 has
been obtained and validated of its use from different Quad-rotor builders and hobbyists alike.
(MTOM ∗ 2 ∗ 9.81
Number of motors) = 34.34N/motor
Equation 8 - Modified Lift Equation Although propellers are the one of the cheapest components that will be integrated onto the Quad-
rotor they are single handily the most vital components to achieving efficient performance. There
are 11 different companies that produce propellers from different material properties for the RC
enthusiasts, but there is only 5 companies (Aeronaut, APC, DJI, EMax and Graupner) that
manufacture multicopter props which are in the orientation of CCW (Counter Clock Wise) and CW
(Clock Wise-normally referred to as ‘pusher’). Using Equation 7, (Staples, 2014) the lift that each
propeller can produce at different RPM (Revolutions Per Minute), in this case between 0 –
20,000RPM will be analysed and a plot of Lift Vs RPM will be produced. A sample of this equation
at work can be seen in Appendix H.2 figure: 1.1. Other investigated propellers are documented in
appendix B
L = 4.392399*10-8*RPM*𝐷𝑖𝑎𝑚𝑒𝑡𝑒𝑟 3.5(𝑖𝑛)
√𝑃𝑖𝑡𝑐ℎ (𝑖𝑛)*(4.23333 ∗ 10−4 ∗ 𝑅𝑃𝑀 ∗ 𝑃𝑖𝑡𝑐ℎ (𝑖𝑛))
Equation 9 - Length of Propeller From figure 1.2, in Appendix H.2 shows that as the propeller diameter increases the lift required
which in this case is 34.34N can be achieved at a lower RPM value of 6,200RPM therefore making
the system more efficient as the current draw will be lower but although having a larger propeller
would be more efficient the velocity will be effected as higher RPM results in faster flying. In this
case the ideal propeller will be in the top right hand corner of the black box below which
corresponds to propeller dimensions of 9*4.7 at 20,000RPM that can also achieve lift required.

UAS CHALLENGE 2015
39 Performance, Propulsion & Systems Engineer
MEng Team Project Report (7ENT1024) School of Engineering and Technology
Now that a RPM range 6,200 to 20,000 is identified in Appendix H.2 1.2, the power versus RPM
graph can be produced to identify the power required from a specific RC brushless motor. Equation
10 (S, 2014) is used to establish the power vs RPM graph:
𝑃𝑜𝑤𝑒𝑟 (𝑊) = 𝐾𝑝 ∗ 𝑃𝑟𝑜𝑝𝑒𝑙𝑙𝑒𝑟 𝐷𝑖𝑎𝑚𝑒𝑡𝑒𝑟4(𝑓𝑡) ∗ 𝑃𝑟𝑜𝑝𝑒𝑙𝑙𝑒𝑟 𝑃𝑖𝑡𝑐ℎ(𝑓𝑡) ∗ 𝑅𝑃𝑀3 ∗ (1 ∗ 10−9)
Equation 10 - Power Produced by Propeller
Where Kp = Propeller constant listed in 221 H.2table 1.1 as each propeller manufacturer has its
own propeller constant.
From figure: 1.3 in Appendix H.2 it identifies that a propeller with dimensions 7*6 rotating at
20,000RPM is an appropriate match for having the lowest power consumption of 473W for
efficiency coupled with highest RPM value for high speed. But now looking at figure 1.2 lift vs RPM
it can be seen that a propeller with dimensions of 7*6 will not produce the required lift of 34.34N
but only attain 17.34N. Although this propeller would be great for speed and efficiency it would not
have the required lifting capability to sustain flight. This process is repeated for every propeller and
the results are shown in Appendix H.2 table 1.2 shows the results for different propeller dimensions
together with RPM, power consumed and lift produced which is obtained from figures 1.2 and 1.3.
The maximum RPM used for each propeller to calculate its lift capability is 20,000RPM as
mentioned earlier, but even though the propeller is spinning at 20,000RPM there are still certain
propellers that cannot achieve the minimum lift required per motor of 34.34N and therefore
assigned with the letter N in the acceptability section of the table. This represents that the propeller
performance is not acceptable, this range falls from propellers 7*6 to 9*3.8.in Appendix H.2 Table
1.2 also shows the some propellers at 20,000RPM can produce in excess of 34.34N of lift and
therefore it was required to reduce the RPM to obtain the required lift, one example of this would
be propeller 9*6 at 20,000RPM produced 39.84N of lift and required 1265W to achieve this. As
there this no need to have the excess 4.82N of thrust the RPM can be reduced down to 18,750
which in turn makes the whole system run more efficiently and the power consumption reduces
down to 1042W which in turn results in reduced current draw. The results can be seen on table 1.3
in Appendix H.2
This type of analysis can be seen in larger propeller dimensions such as 17*10, table 1.4 in
Appendix H.2 has the results for this propeller size and it can be seen that a propeller of this size
would achieve well in excess of the 34.34N lift required, 476.45N with 20,000RPM while requiring
2685.2W. This would results in excess thrust of 442.11N which is not required, therefore the RPM
can be reduced down to 5,450 which in turn produces the lift required of just over 34.34N, hence
less current draw making the whole system more efficient.

UAS CHALLENGE 2015
40 Performance, Propulsion & Systems Engineer
MEng Team Project Report (7ENT1024) School of Engineering and Technology
Looking at the two propellers sizes in tables 1.3 and 1.4 in Appendix H.2 it can be clearly seen that
having a larger propeller definitely increases the endurance time of the Quad-rotor because the
power consumption required is reduced by half from 1042W to 543W which in turn means lower
current draw for the same amount of lift produced. Lower current draw results in longer flight time.
One of the disadvantages of increased propeller diameter is the fact that the RPM is reduced
therefore effecting the velocity of the Quad-rotor. Finding the best propeller combination between
these two propellers that would give the lowest current draw with the highest velocity while
maintaining the lift required of 34.34N was the key engineering challenge that was faced though
out this project.
9.2 RC Motor Selection Maximum RPM
Now that a range of different propeller dimensions are identified in 9.1 we will now look into the
motors that are available for use that can be matched to the identified propellers to achieve the
best combination in terms of performance.
Looking back at table 1.2 in Appendix H.2 it can be identified that the investigated motors must
have an RPM range between 5,450RPM to 20,000RPM and also capable of supplying power
between the range of 543W to 1195W so that the Quad-rotors performance abilities can be
achieved. To achieve the best performing RC motor for this project different motors are researched
and investigated from different manufactures, the results are shown in Appendix H.3, table 1.5
Table 1.5 shows the performance details of each motor stated by the manufacturers at the time of
build. One of the details that is not give is the maximum RPM of the motor once a propeller is
attached to it. To calculate this Equation 11 (Bernhard, 2009) is used.
RPM= KV*maximum cell voltage*reducing factor
Equation 11 - Determining RPM
The KV of a motor is specified by the manufacturer and it represents revs per minute per voltage
e.g. taking the details specified in table 1.6 located in Appendix H.3. It show that this specific motor
EMax GT2820/07 has an RPM rating of 850 per voltage supplied. And again from table 1.6 in
Appendix H.3 it can be seen that the manufacturer has stated that a cell range of between 3s and
4s is permissible where 1s is the equivalent of 3.7V therefore 4s (4*3.7V = 14.8V). The reducing
factor in Equation 11 represents the drop in motor maximum RPM capability when a propeller is
attached which is in the region of 0.83. An example of how the maximum RPM is calculation can
be seen below.
850*(4*3.7)*0.83 = 10064RPM

UAS CHALLENGE 2015
41 Performance, Propulsion & Systems Engineer
MEng Team Project Report (7ENT1024) School of Engineering and Technology
By analysing the data obtained from table 1.5 in Appendix H.3 the maximum RPM that these RC
motors can achieve is identified, therefore any propeller that requires higher RPM than what the
motors can achieve is eliminated, this is certainly true for propellers have small diameters and
require high RPM to attain the lift required. From table 1.5 in Appendix H.3 it can also be seen that
the maximum RPM that can be achieved is 14,800, therefore by looking at Appendix H.3 in table
1.2 it can be seen that propellers that are in dimension range of 7*6 to 10*7 and 11*3 can be
eliminated as they require higher than 14800 RPM. Therefore table 1.2 can be reduced down to
1.2.1 in Appendix H.3
9.3 Propeller Pitch Selection To eliminate more propellers from table 1.2.1 in Appendix H.3 we now look at the velocity that the
Quad-rotor will be designed for. At the start of the project a specification was written that stated,
“Maximum airspeed of 60knots (IAS) must not be exceeded” and also “Must have the capability to
fly under 20knots wind and 25knots gust conditions”. In this analysis the decision to assume that
the Quad-rotor would be traveling under the most extreme case scenario was taken throughout the
2km course.
Initial calculation can be performed to evaluate the velocity required to complete the course in the 2
minute time frame using speed equation stated in Equation 12 (Anon, 2014). (Although 2 minutes
is stated here the Quad-rotor will have the capacity to fly for 5 minutes as a contingency)
𝑆𝑝𝑒𝑒𝑑 (𝑚
𝑠) =
𝐷𝑖𝑠𝑡𝑎𝑛𝑐𝑒 (𝑚)
𝑇𝑖𝑚𝑒 (𝑠)=
2000 (𝑚)
120 (𝑠)= 16.6𝑚/𝑠
Equation 12 - Determining Speed From Equation 12 - Determining Speed it can been seen that under ideal conditions (zero wind)
the Quad-rotor is required to fly at a velocity of 16.6m/s to achieve the 2km in 2 minutes, but the
above equation has not considered wind speeds and gust conditions of up to 25 knots and
therefore will be considered below.
20knots wind speed = 10.28m/s
25knots gust speed = 12.86m/s
To complete the course within the time frame stated of 2 minutes the Quad-rotor must be capable
of travelling at velocity of between 26.88m/s (52.25knots) under maximum wind speed and at
29.46m/s (57.27knots) under maximum gust conditions.
To calculate the maximum velocity that can be obtained requires the maximum tilt angle, this can
be achieved by using Equation 13 (Anon, 2014).
F*cos(𝜃) = Weight
Equation 13 - Force Produced at Maximum Tilt Where:
F = Force (N)
W = Quad-rotor weight (N)

UAS CHALLENGE 2015
42 Performance, Propulsion & Systems Engineer
MEng Team Project Report (7ENT1024) School of Engineering and Technology
𝜃𝑚𝑎𝑥 = Maximum tilt angle (degrees)
The total force that the Quad-rotor will produce is obtained by the propellers lifting capabilities in
this case each of the four propeller chosen produces 34.34N, 137N in total. By rearranging
Equation 13, the force required at a particular angle can be calculated, and by trial and error (as
long as it doesn’t exceed 137N *0.7 = 95.9N because we need excess thrust for sudden gusts) we
can find the maximum tilt angle.
𝐹𝑜𝑟𝑐𝑒 (𝑁) =𝑊𝑒𝑖𝑔ℎ𝑡 (𝑁)
cos (𝜃)
Using trial and error When 𝜃 = 10; F= 69.7N 𝜃 = 20; F=73.0N 𝜃 = 30; F=79.29N 𝜃= 40; F=89.6N 𝜃=
44; F=95.4N
From this trial and error section it can be seen that a maximum angle of 44 degrees can be
achieved, but if this angle is exceed than there is the possibility that the Quad-rotor will stall
therefore it is advisable to use an angle setting of less than 44 degrees, in this case 32 degrees is
used.
Now that the maximum flight angle is obtained Quad-rotor maximum speed in straight flight can be
calculated using Equation 14 (Andy, 2014).
𝑉max 𝑆&𝐿𝐹 = 𝑅𝑃𝑀𝑚𝑎𝑥 ∗ 𝑃𝑟𝑜𝑝𝑒𝑙𝑙𝑒𝑟 𝑃𝑖𝑡𝑐ℎ ∗ 0.000954 ∗ 0.44704
Equation 14 - Quad Rotor Maximum Speed Equation 14 assumes that the Quad-rotor will be travelling parallel with the x-axis like an aircraft,
but for a Quad-rotor Equation 14 has to be modified to take into account the angle setting that the
Quad-rotor will be travelling at. Equation 15 shows this modification.
𝑉𝑚𝑎𝑥=𝑉max 𝑆&𝐿𝐹 * Cos(𝜃𝑚𝑎𝑥)
𝑉𝑚𝑎𝑥=(𝑅𝑃𝑀𝑚𝑎𝑥 ∗ 𝑃𝑟𝑜𝑝𝑒𝑙𝑙𝑒𝑟 𝑃𝑖𝑡𝑐ℎ ∗ 0.000954*0.44704) * Cos(𝜃𝑚𝑎𝑥)
Equation 15 - Quad Rotor Maximum Speed at Angle Setting Where
𝑉𝑚𝑎𝑥 (𝑚
𝑠) = 𝑀𝑎𝑥𝑖𝑚𝑢𝑚 𝑉𝑒𝑙𝑜𝑐𝑖𝑡𝑦, 𝑖𝑛 𝑡ℎ𝑖𝑠 𝑐𝑎𝑠𝑒 29.46𝑚/𝑠
𝑅𝑃𝑀𝑚𝑎𝑥 = 𝑀𝑎𝑥𝑖𝑚𝑢𝑚 𝑅𝑃𝑀 𝑤ℎ𝑖𝑐ℎ 𝑖𝑠 𝑢𝑛𝑘𝑛𝑜𝑤𝑛 𝑎𝑡 𝑡ℎ𝑖𝑠 𝑠𝑡𝑎𝑔𝑒
𝑃𝑟𝑜𝑝𝑒𝑙𝑙𝑒𝑟 𝑃𝑖𝑡𝑐ℎ 𝑅𝑎𝑛𝑔𝑒 (𝑖𝑛) = 3.8 − 13 𝑖𝑛𝑐ℎ𝑒𝑠 𝑢𝑠𝑖𝑛𝑔 𝑎𝑝𝑝𝑒𝑛𝑑𝑖𝑥 𝐶
Equation 15 must be rearranged to calculate the maximum RPM required at different pitch to
achieve 20.46m/s
𝑅𝑃𝑀𝑚𝑎𝑥 =(
𝑉𝑚𝑎𝑥𝑃𝑟𝑜𝑝𝑒𝑙𝑙𝑒𝑟 𝑃𝑖𝑡𝑐ℎ ∗ 0.000954 ∗ 0.44704
)
Cos(𝜃𝑚𝑎𝑥)
From table 2.0 in Appendix H.4 it can be seen that as propeller pitch increases, RPM required
reduces to obtain 29.46m/s. As calculated earlier the maximum RPM that can be obtained from the
brushless motors is 14,800RPM, this shows that any propeller that has a propeller pitch setting that
is under 6 inches can be eliminated. Table 1.2.1 in Appendix H.4 can now be modified to table
1.2.2 in Appendix H.4

UAS CHALLENGE 2015
43 Performance, Propulsion & Systems Engineer
MEng Team Project Report (7ENT1024) School of Engineering and Technology
9.4 Power Supply Voltage Selection From Appendix H.3 table 1.5 it can be seen that each brushless motor has an operating power
supply cell range generally the higher the cell count the more efficient the system will be and also
the higher the RPM will be. In this section different power supplies will be investigated to determine
the ideal power source that can be used in this project. From table 1.5 it can be seen that the
power supply cells range from 2s to 9s, but 2s cells will not provide the RPM required and it will not
be considered in this analysis, therefore 3s to 9s will be the main point of the research. The
investigation will give importance to cost, weight and coulomb rating, the full range of power
supplies analysis can be seen in table 1.7 in Appendix H.5
From table 1.8 in Appendix H.5it can be concluded that as the number of cells increases so does
the cost and the weight. Although a 3s cell is desirable because of its low cost and weight the
system will be inefficient due to Equation 16 (Anon, 2015).
𝐶𝑢𝑟𝑟𝑒𝑛𝑡 (𝐼) = 𝑃𝑜𝑤𝑒𝑟 (𝑊)
𝑉𝑜𝑙𝑡𝑎𝑔𝑒 (𝑉)
Equation 16 - Current Draw Detailed analysis can be obtained from table 2.1 in Appendix H.5which shows the RPM required to
sustain lift and RPM required to achieve forward velocity of 29.46m/s coupled with current draw
using different lithium ion cells. Using a propeller that requires 1000W a sample calculation can be
conducted, the results are shown in table 1.9, Appendix H.5. This table also represents power
consumption required by propeller dimension of 10*8 to achieve the RPM required for lift of 35N
which is obtained from table 1.2.2 in Appendix H.4 also the RPM to obtain the forward velocity of
29.46m/s that was obtained from table 2.0 in Appendix H.4. There are propellers that cannot
acquire the RPM required for forward velocity but has sufficient RPM to sustain lift a case of this
can be seen in table 2.2, Appendix H.5 this case the RPM to sustain lift of 35N has to be increased
to match the same RPM to achieve forward velocity. The result of increasing RPM means that
power consumption and current draw required is increased as it can be seen in table 2.3, Appendix
H.5. Table 2.1 in Appendix H.5 can now be updated to take into account the increase in RPM on
certain propellers, the new data in presented in table 3.9, Appendix H.5. From table 3.9 certain low
current propellers can be identified, these propellers are also seen in table 2.4, Appendix H.5
The propellers identified in table 2.4 are bought from a local hobby store and tested on the test rig
that was build. From testing it was identified that propeller dimensions of 12*6 is the most efficient
propeller, the justification for this is shown in Appendix H.10

UAS CHALLENGE 2015
44 Performance, Propulsion & Systems Engineer
MEng Team Project Report (7ENT1024) School of Engineering and Technology
9.5 Power Supply Capacity Selection The current draw, flight time and weight will be the deciding factor in choosing the battery. But
firstly the current draw is discussed, because RC wiring that are available for sale are from turnigy
where each cable has its own rating based on maximum current that is permissible the listing is
provided in table 2.5 Appendix H.6. From this it can be identified when all the motors are working
at its full capability that the current draw per motor cannot exceed 50Amps at any point as it could
cause the cables to burn up and this would result in catastrophic failure. Figure 1.4 identifies the
locations were 200Amp cannot be exceeded. Therefore by this method it can be identified from
table 2.4 in appendix H.5 that lithium-ion cells 3s and 4s cannot be used.
Figure 36 - Prototype Quad Rotor
Using the 50A current limit per motor battery capacity required can be calculated using flight time
of 5 minutes. Equation 17 can be used to calculate battery capacity required.
𝐵𝑎𝑡𝑡𝑒𝑟𝑦 𝐶𝑎𝑝𝑎𝑐𝑖𝑡𝑦 (𝐴ℎ)
𝑇𝑜𝑡𝑎𝑙 𝐶𝑢𝑟𝑟𝑒𝑛𝑡 𝐷𝑟𝑎𝑤 (𝐴)∗ 60 = 𝑇𝑜𝑡𝑎𝑙 𝑓𝑙𝑖𝑔ℎ𝑡 𝑡𝑖𝑚𝑒 (𝑚𝑖𝑛𝑢𝑡𝑒𝑠)
Equation 17 - Battery Capacity Required
𝐵𝑎𝑡𝑡𝑒𝑟𝑦 𝐶𝑎𝑝𝑎𝑐𝑖𝑡𝑦 (𝐴ℎ) = 𝑇𝑜𝑡𝑎𝑙 𝑓𝑙𝑖𝑔ℎ𝑡 𝑡𝑖𝑚𝑒 (𝑚𝑖𝑛𝑢𝑡𝑒𝑠) ∗ 𝑇𝑜𝑡𝑎𝑙 𝐶𝑢𝑟𝑟𝑒𝑛𝑡 𝐷𝑟𝑎𝑤 (𝐴)
60
𝐵𝑎𝑡𝑡𝑒𝑟𝑦 𝐶𝑎𝑝𝑎𝑐𝑖𝑡𝑦 (𝐴ℎ) = 5𝑚𝑖𝑛𝑢𝑡𝑒𝑠 ∗ 200𝐴
60
Battery capacity required = 16.6Ah
Table 1.7 in appendix H.5 has been updated and documented as table 1.7.1 in appendix H.6 to
show addition information such as total cost and total weight that the battery capacity required is
known. Also as mention earlier 3s and 4s lithium-ion cells has been disregard due to high current
draw. From table 2.6 in appendix H.6 it can be seen that 5s lithium-ion power supply will be ideal
for this project were its lowest is weight and also the cost is one of the lowest.
9.6 RC Motor Selection Power When selecting the motor all the analysis that has been conducted up to now has to be
considered. Information to consider involves power consumption has to be greater than 811W,
RPM has to be greater than 11,270, must be capable of working with 5s, and also must able to
work with the propellers identified in table 2.4, appendix H.5 Other important data to be considered
will be weight and cost. The required criteria is applied to table 1.5 in Appendix H.3 which reduces
the number of RC motors that can be used for this project, these available motors are identified in

UAS CHALLENGE 2015
45 Performance, Propulsion & Systems Engineer
MEng Team Project Report (7ENT1024) School of Engineering and Technology
table 2.7, appendix H.7. Table 2.7 can be further reduced to table 2.8 in appendix H.7 when only
5s lithium-ion power supplies are considered.
From table 2.8 it can be seen that there are three closely matched motors that can be used for this
project, power 46, Quantum MT 3510 V2 and EMax GT2826-06. Power 46 although has some of
the specs that are required it cannot be considered for this project because the maximum RPM
while using 5s lithium-ion power supply is too lower to consider. Quantum MT 3510 V2 has very
attractive specs such as lowest cost out of the three and also the lowest weight but one of the main
issues any the reason for why it cannot be considered for this project is the fact that the power
consumption value if very low. EMax GT2826-06 is a motor that has most of the specs that are
required for this project, power consumption is perfect, 5s lithium-ion cell and propeller range from
10-14 can be used without a problem, cost and weight are ideal when compared to others that
weigh 200-290g. The only issue with this motor is that the maximum RPM cannot be used when
flying and the thrust setting will be based on 83% therefore the RPM will drop from 12987RPM to
11168RPM. Which in this case a shortage of RPM will occur (12,901RPM-11,168RPM =
1,733RPM) therefore recalculating based on 11,168RPM new maximum thrust and velocity
obtained. Results are presented in table 2.9, appendix H.7by using equation 1.3 maximum thrust is
calculated as 34N per motor As the maximum thrust has changed so does the maximum angle
using equation 1.7, 43°. Using equation 1.9 maximum velocity can be calculated 20.9 m/s. Power
consumption using equation 1.4 696W, with power consumption 15% extra has to be added 800W.
Using equation 1.6 current draw can be calculated 43A. Finally by using equation 1.7 flight time
can also be calculated 5.6 minutes which more than the expected 5 minutes.
9.7 Electronic Speed Controller Selection ESC (Electronic Speed Controller) is the next component to be selected for this project. Esc’s are
used to vary the RPM of the motors, as seen in earlier stages that vary RPM would mean that
thrust, velocity and pitch angle can all change just by varying the RPM. Esc’s are the only way in
which the Quad-rotor can be controlled autonomously as they will be connected up into pixhawk
directly which is the autopilot chosen for this project by other team members.
When it comes to selecting esc’s the general rule used by hobbies is to know the maximum current
draw that the motor can handle, in this case 52A then to add 15% to obtain the esc current
required. In this case its 59.8A, therefore esc’s that are rated at 60A will suffice for this project. As
with everything in this project there are other factors such as weight and cost that needs to be
taken into account, an analysis of this is shown in table 4.0, appendix H.8
From table 4.0 two esc’s are identified and presented in table 3.0, appendix H.8, one which is
lowest in weight and another that is lowest in cost. Both of the esc’s would have been ideal for this
project but as the motors were being bought from the same company that sells the robotbirds pro it
was decided that to save further cost on postage and packaging the 3g difference in weight will not
affect the project, therefore robotbirds pro 60A esc’s were ordered.

UAS CHALLENGE 2015
46 Unmanned Aircraft System - Subsystems
MEng Team Project Report (7ENT1024) School of Engineering and Technology
Section by Jonathan 10 Unmanned Aircraft System - Subsystems
10.1 Introduction
This chapter would discuss the different systems on board the UAS such as navigation and
communication systems as well as schematics showing detailed information on how the system
components are integrated with each and with other systems. A detailed specification sheet is also
provided in the chapter below. A list of systems aboard the UAS is shown below:
Navigation control system
Mission control system
Image recognition system
Flight control system
Communication system
Details on how to configure and operate all systems on-board the UAS through the autopilot
system are shown in Appendix. J.
10.2 Navigation Systems
The navigation system comprises of the following components:
Global Positioning System
Telemetry Kit
Radio Controller
Autopilot flight control system
Ground Control Station
Camera
On Screen Display
The function of the navigation system of the UAS is to provide the information need for the flight
controller to control the UAS to its mission destination. In this case, the mission is to deliver a
payload at a particular spot at pre-specified GPS coordinates. The GPS unit on board is used to
get the GPS lock on the co-ordinates, the on board compass gets the direction of the co-ordinates
and the gyro on board the flight controller determines motion on the relevant axis and then this
information is fed to the motors through the ESCs which regulate the voltage supply to the motors
to control the attitude of the UAS by either reducing or increasing the RPM of the motor. The GPS
coordinates are programmed into the navigation system with the use of waypoint files. The
navigation commands can be entered into the notepad and then loaded to the autopilot system as
shown in Figure 37: Waypoint Command File.

UAS CHALLENGE 2015
47 Unmanned Aircraft System - Subsystems
MEng Team Project Report (7ENT1024) School of Engineering and Technology
Figure 37: Waypoint Command File The ground control station is used to input the commands GPS coordinates and payload release
mechanism in the form of a mission plan. This mission plan can be saved and edited if there is a
need to change the mission parameters for the UAS. The ground station is also used to monitor
the data generated by the sensors on board the UAS and it is transmitted back via the telemetry
kit. The ground control station consists of a laptop, telemetry transmission antenna and mission
planner software.
10.2.1 Potential Issues with the Navigation systems
An issue with the GPS unit is the HDOP (Horizontal Dilution of Precision) which
reduces the accuracy of the horizontal position of the UAS and this poses a problem for
mission deployment. The HDOP continuously varies depending on a number of factors
such as number of satellite count picked up by the GPS unit and weather conditions.
Another issue that can affect the performance of the navigation system is the
transmission rate and range of the telemetry kit as there may be a lag in the
transmission of data between the UAS and the ground control station.
Electromagnetic interference (EMI) from electrical components affecting the
performance of the compass on board the flight controller.
10.2.2 Solutions
To correct the flight condition for the HDOP accuracy of the UAS, the UAS flight control
can be switched from automatic flight control to manual flight control and the UAS can
be flown to the exact position where the payload is to be deployed.
The compass and the GPS unit that would be affected by EMI would be placed away
from components that generated magnetic fields.
10.3 Mission Control System
The mission control system comprises of the following components:
Autopilot flight controller
Payload Release mechanism
Ground control Station
Camera
The function of the mission control system is to deliver the payload at a particular position. The
payload is delivered when the autopilot control system determines the UAV is at the correct
position (correct altitude, correct GPS coordinates). A command inputted into the mission plan

UAS CHALLENGE 2015
48 Unmanned Aircraft System - Subsystems
MEng Team Project Report (7ENT1024) School of Engineering and Technology
would then be sent to the servo and the payload release mechanism would then be activated and
the payload released.
The main issue with the mission control system is the accuracy of the navigation control system
and also the autopilot where the command to deploy is stored. If any problem is encountered, the
UAS can be flown manually and the payload can also be deployed manually with the use of a radio
controller.
10.4 Flight Control System
The flight control system consists of the following components:
Autopilot control systems
Electronic Speed Controller
Batteries (Avionics and propulsion)
Motors and propellers
The flight control system is used to control the UAS attitude and altitude. It comprises of the
propulsion system and the autopilot system working in conjunction from the data received from the
navigation system. To control the altitude or attitude of the UAS, a command is sent from the
ground control station to the autopilot. The autopilot then calculates the voltage output from the
battery that would be required to carry the command. The autopilot then regulates the voltage
supply from the battery to the motors with the use of ESCs. Yaw, pitch and roll are carried out due
to differential RPM of the motors on the Quad-rotor.
The flight control system also carries out the stability and control function for the UAV. The
autopilot system has an in built controller which has been reprogrammed to correct errors and
make adjustments in flight control. The controller is the PID (Proportional Integral and Derivative)
variant and this is done using the auto tune function when flying the UAV with the use of the radio
controller. The PID values have to be calculated before being inputted into the UAV before its initial
flight and the methods used to get the PID are:
Matlab Model to simulate flight conditions of the Quad-rotor
Selecting the right PID values for the different flight conditions.
When the simulation is run, the Matlab model is then put through a series of different
flight conditions and data is collected from these simulations.
The PID gain values are changed constantly in order get the control system to respond
the right way to disturbances in flight conditions, Table 8 shows the guiding principles for
choosing PID Values.
The simulations are monitored in forms of graphs and hence the values can be changed
when they are needed to be.
Testing the UAV system using a test rig

UAS CHALLENGE 2015
49 Unmanned Aircraft System - Subsystems
MEng Team Project Report (7ENT1024) School of Engineering and Technology
Set the Quad-rotor inside the test rig and make sure everything is correctly bolted and
connected for safety and all the propellers are fixed and not within the reach of the test rig
arms
Input the PID values gotten from simulations using MATLAB
Test the Quad-rotor under multiple conditions
Use a high airflow fan to replicate strong gusts to see how well the Quad-rotor responds
to extreme flight conditions.
Test fly the Quad-rotor
Take the Quad-rotor to an open area for test flying
Start with simply manoeuvres before moving onto more extreme manoeuvres
The autopilot control system on board the Quad-rotor is capable of learning and during
the first flight test which would also be used for auto-tuning the control board, the Quad-
rotor would learn the appropriate response time and record it.
This method is used to program in the PID values for flight readiness.
Controller
Response
Rise time Overshoot Settling time S-S error
Kp Decreases increases No change decreases
Ki Decreases Increases Increases Eliminates
Kd No change Decreases decreases No change
Table 8 Effects on the close loop response from PID (University of Michigan, 1996)
To create the MATLAB model, the physics behind Quad-rotor behaviour is modelled such as the
torque and forces produced by the motors, the Quad-rotor’s inertial frame in relation to non-linear
dynamics. With the above information equations of motion can be generated by using a rotation
matrix to simulate the motion of the Quad-rotor. An appropriate controller can then be designed to
reduce any error produced by the Quad-rotor system. The model is not a 100 percent accurate
representation of the Quad-rotor due to different assumptions made in the course of modelling the
Quad-rotor. For this reason, a test rig will be used to improve the PID gain values as a simulation
on MATLAB will only take us so far without. The test rig will be used to fine-tune our close-to-final
PID values before we can actually test the Quad-rotor in actual flight.
An integral part of the flight control system is the autopilot system. The autopilot system comprises
of three layers of ware:
Firmware
Software
Hardware
To fully utilise the capability of the autopilot system, the firmware and software aspects are edited
to make the application flexible in terms of navigation and mission control. The autopilot system
used is Pixhawk which is built on the open source px4 platform. The autopilot system is capable of
carrying out functions such as autonomous flight, computer vision operations and robotic functions.

UAS CHALLENGE 2015
50 Unmanned Aircraft System - Subsystems
MEng Team Project Report (7ENT1024) School of Engineering and Technology
The autopilot system has enough processing power to carry out the above mentioned functions at
the same time.
The autopilot systems also has on board sensors which generate and provide information about
different systems on board the UAV and also data about flight performance, this information
(Figure 37) is transmitted to the ground station for observation and control with a telemetry kit
operating at 433Hz. To improve flight conditions of future flights, telemetry data is logged by the
autopilot system and the data gathered can be analysed to make adjustments to any system to
raise the performance of the UAS.
Figure 38: Telemetry Information transmitted to ground control station
10.5 Communication System
The communication system for the UAS consists of:
Radio Controller
Telemetry Kit
Minim OSD
Autopilot System
The communication system is used to transmit telemetry data from all components on the UAS to
the ground station for observation and control. There are three methods of connecting the UAS to
the ground control station:
Serial Connection
Telemetry Kit Connection
Radio Connection
The different connection methods have different transmission rate and therefore different functions.
The UAV and the ground control station communicate using a protocol called MAVLINK. This
communication protocol is the main protocol for the Pixhawk unit and this determines the
transmission rate for different types of transmission methods and format of data transmitted.

UAS CHALLENGE 2015
51 Unmanned Aircraft System - Subsystems
MEng Team Project Report (7ENT1024) School of Engineering and Technology
10.5.1 Serial Connection
The serial connection is used to connect the Pixhawk autopilot to a ground control station through
a Universal Serial Bus connection. The baud rate for the transmission is 115200 bits per second
and this connection is used to configure the autopilot system for the first time. The extremely fast
connection is used to load the firmware and software needed to run the autopilot system and also
to calibrate all on board sensors for the first time. Other components of the UAV can be connected
and also configured through the serial connection. The serial connection is also useful when
running diagnostics on the autopilot or any connected component as the transmission rate and
quality would prevent loss of data or useful information through data packet loss in transmission.
The transmission rate can be monitored by the link statistics as shown in Figure 39.
Figure 39: Transmission Link Statistics (Serial Connection)
10.5.2 Telemetry Kit Connection
The telemetry kit is used to connect the Pixhawk autopilot to a ground control station through a
radio connection over a frequency of 433Hz. The baud rate for the transmission is 57600 bits per
second. This is the primary method of connecting to the autopilot for flight purposes and any other
secondary purpose of the UAV. The connection can also be used to configure the autopilot system
to calibrate on board sensors but due to the connection speed, it is advisable to use the serial
connection for that. For autonomous flight, the flight plan is uploaded to the autopilot through this
connection and with the use of a ground control station. During flight, any secondary mission plans
for the UAV are also sent through the telemetry kit connection; this can range from servo activation
to camera functions. The strength in telemetry connection would decrease as the UAV moves
further away from the ground control station. During flight, all the telemetry generated from all
components is sent to the ground control station through the telemetry kit. The transmission rate
can be monitored by the link statistics as shown in Figure 40.
Figure 40: Transmission Link Statistics (Telemetry Kit)

UAS CHALLENGE 2015
52 Unmanned Aircraft System - Subsystems
MEng Team Project Report (7ENT1024) School of Engineering and Technology
10.5.3 Radio Connection
The radio controller is used to connect to the Pixhawk autopilot and the UAV through a frequency
of 2.4 GHz. The radio controller is used to fly the UAV manually without the need for a ground
control station or GPS based command input to the autopilot system. The radio controller is also
used to configure some stability and control criteria such as PID through a method known as auto-
tune. The radio controller has a number of channels that are used to carry a number of secondary
UAV functions such as servo control, camera control etc. The radio controller also acts as a
backup flight controller when the autonomous flight system fails or acts as a safety flight measure
when the UAV flies out of range of telemetry range of the ground control station.
10.6 Systems Integration
To make sure that all the systems to be used on the UAV can work together and can also
accomplish the primary and secondary objectives of the UAS and that the components to be used
are also compatible, a series of tests are carried out on the each system and its respective
components. Some examples of the tests are:
Communication systems test
Servo test
Propulsion system test
Image recognition system test
Post Assembly Design Checks
Post Assembly Systems calibration
Some of the tests listed above are discussed in different chapters such as the propulsion test in the
chapter dealing with propulsion and performance and the servo test in the chapter dealing with
UAS mission delivery. Every other test is explained below:
10.6.1 Communications Systems Test
The tests carried out on the communication systems are of the following types:
Interference tests
Range tests
Altitude Tests
10.6.2 Interference test
To carry out the interference test, the UAS communication systems are operated near areas or
devices of high magnetic interference, near devices that give off radio waves such as Wi-Fi
devices and TV antennas. The UAS communication systems also tested indoors and outdoors but
in close proximity to a building. The result of these tests is shown below:

UAS CHALLENGE 2015
53 Unmanned Aircraft System - Subsystems
MEng Team Project Report (7ENT1024) School of Engineering and Technology
Test System Component Result
Magnetic
Interference
Telemetry kit
Radio Controller
The rate of transmission is reduced and also
the number of bits (information transmitted)
lost is increased.
Near
Buildings
Telemetry kit
Radio Controller
Operation in a building has little or no effect
on the radio controller. The telemetry loses
range and quality of transmission especially
when there is a wall between the transmitter
and receiver.
Radio Waves Telemetry kit
Radio Controller
There are severe consequences due to the
difference in the transmitting frequencies
telemetry kit and the radio controller.
Table 9 - UAS Interference Tests
The UAS is designed for open field flight and as such the tests carried out above do not affect the
objectives of the UAS mission, the reason for the test is for future use of similar UAVs used for
different purposes as stated in the business case. These tests were done to show the durability of
the UAS control systems and its adaptability to different operating environments.
10.6.3 Range Test and Altitude Test
The telemetry kit to be used on the UAS is designed to be used at ranges of about 1.5 kilometres;
the farthest point on the UAS is approximately 500 metres from the ground control station. The
range of the UAS telemetry was tested in an open field as well as during the interference tests. The
largest open field used for the test was 600m at its farthest point and the UAS remained in contact
with the ground control station during the test. The antennas for the telemetry kit are Omni-
directional and thereby transmit data in all directions and also upwards.
The altitude test for the UAS was carried out by taking the UAS receiver to the fourth floor of a
multi-storey building of approximately 60 feet. The communication system worked well even with
interference with the Wi-Fi in the building. The radio controller was also tested for both range and
altitude and the tests results show that the radio controller is capable at operating distances of the
UAS mission.
10.6.4 Post Manufacture and Assembly Design Checks
The post assembly design checks were carried out after the UAV had been built, assembled and
the electronic components are connected and ready for testing. The post assembly design checks
include the following:
Inspect structure of UAV to make sure that there is adequate space and protection for
electronic components.
Inspect assembly to make sure components are assembled neatly and safely.
Inspect assembly to make sure electronic components are connected to their proper ports
or power sources.

UAS CHALLENGE 2015
54 Unmanned Aircraft System - Subsystems
MEng Team Project Report (7ENT1024) School of Engineering and Technology
Inspect health of all propulsion system components (motors, propellers, Escs, batteries).
Inspect wiring and make sure that wiring on the assembly match the wiring diagrams.
Inspect Assembly to make sure that the design specifications were met by comparing the
UAV to the design specification sheet.
Inspect assembly to make sure that all safety precautions were taken into consideration
during the assembly and manufacture of the UAV
10.6.5 Post Assembly Control System Calibration
The electronic components were configured when they were bought in order to carry out various
tests but after assembly the memories of the autopilot system and all other components are
deleted. The main reason for reconfiguring the control system equipment is that sensor error as a
result of being calibrated before the component is assembled on the frame. When the assembly is
done and all the components and their sensors recalibrated, such error is reduced. The UAS
recalibration was done with the use of the 3 axis test rig and the following sensors were calibrated.
Accelerometer
Compass
Radio Controller
Joystick
Gyroscope
Fail-safe systems
Arming Checks
After all the calibration was done and all other system integration checks carried out, the UAV was
then set-up to tune its PID values for flight.

UAS CHALLENGE 2015
55 Stability and Control I MEng Team Project Report (7ENT1024) School of Engineering and Technology
Section by Malwenna 11 Stability and Control I
Quad-rotors can be regarded naturally stable compared to fixed wing aircraft by the nature of their
design. That is mainly due to the thrust being generated by all four corners where the resultant will
act on the meeting point of three main axes. However, natural stability is only achieved if the CG of
the quad is designed to be on above mentioned intersecting point, so that the vertical forces on the
quad will originate from the same point with no moments about the CG when it's stable. Even if the
CG is not at the intersecting point, quad can be stabilized by simply changing the RPM of the
motors so the moments will be balanced. Therefore, the first step of making a Quad-rotor stable is
the placement of CG. Stability about yaw is achieved by having counter rotating propellers to zero
the resultant torque created by rotating propellers.
Controllability on the other hand did require more attention. There are four rotating parts indicating
more control is needed. Only control input will be the thrust change by changing the RPM of the
motors. But the problem lies within the accuracy of the input due to various factors such as human
error, mechanical error and disturbances by outside forces. This is where the control board
(Pixhawk) takes over to minimize the errors and aid the copters controllability in achieving the
desired output. This is done by a system of three independent Proportional Integral Derivatives
also referred to as PID controllers. As shown in Figure 41, it is a closed loop system where the
error is corrected by subtracting the output from input to identify the error and running the error
through three PID gains. This is a very quick process which will be repeated until the error is
corrected.
Figure 41 – PID System (Oscar, 2013)
P (Proportional gain coefficient) –This controls the sensitivity of the quad to the angular
change being input and therefor, most important controller.

UAS CHALLENGE 2015
56 Stability and Control I MEng Team Project Report (7ENT1024) School of Engineering and Technology
I (Integral gain coefficient) – controls the precision of the angular input, especially when
outside disturbances are present such as gust. This controller will identify the disturbance
and minimize the effect caused by it.
D (Derivative Gain coefficient) – By having an input on the quad, there can be accelerations
towards the desired output and this gain will dampen if they are unwanted or amplified if
they helps in achieving the output. Therefore, it helps in predicting errors and mitigates
them (Hove, 2013).
Although PID controllers seem simple, the mathematics behind these is complex to grasp. PID
gains will depend on the weight, size and purpose of the Quad-rotor. Therefore, the main
responsibility of Stability and Control role is to obtain correct PID values for particular quad using
mathematical models, MATLAB simulation or PID tuning. Later is regarded as the most reliable
method.
As stability was a joint role between Mohammed and Malwenna, the work was split between these
two and so was the report. Please refer to 14 “Stability and Control II” for CG placement and
MATLAB model.
11.1 PID Tuning Refer to section 15 “ Flight modes and tuning” for information on test rig.
11.1.1 Loiter mode
The main purpose of tuning for loiter mode is for Pixhawk to automatically keep the current
heading and altitude, especially at payload deployment until character recognition identifies the
target. During loiter tuning, the pilot would fly the quad manually as in stabilize mode, but releasing
the stick would keep the Quad-rotor in the same position. However, in order to achieve good loiter
characteristics, there are three main requirements to be fulfilled
GPS positioning – GPS is normally positioned elevated from the Pixhawk and other electrical
components. This is to lower the magnetic interference caused by
other components so that GPS positioning hold will be accurate.
Ideal position for the GPS will be decided when the GPS protective
case and the mast have arrived.
Magnetic interference on the compass – Original GPS unit
decided for the quad was ‘3DR uBlox GPS’ which also includes the
‘LEA-6H compass’. Since it will be mounted high, magnetic
interference will be minimized. However, given the availability,
timeliness and budget restraints, GPS Crius CN-06 v2 was
purchased which does not have a compass and Pixhawk inbuilt
compass will be used instead which will have magnetic
interferences. Figure 42 Loiter PID values
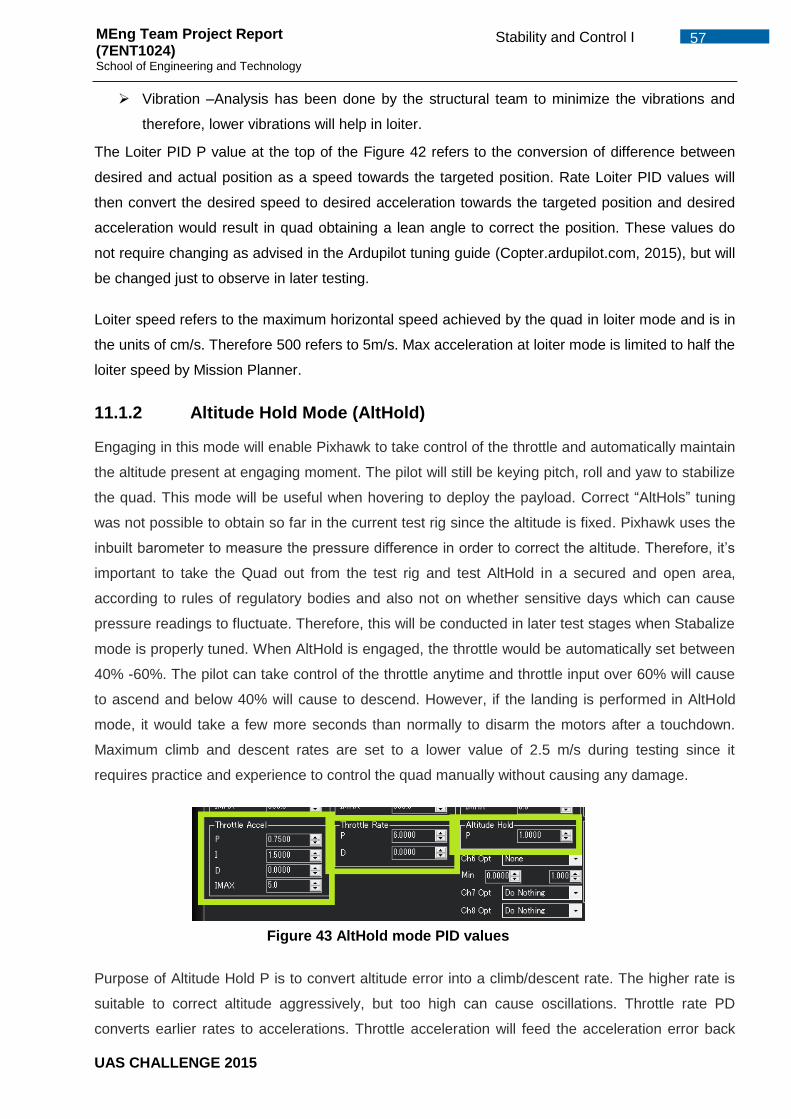
UAS CHALLENGE 2015
57 Stability and Control I MEng Team Project Report (7ENT1024) School of Engineering and Technology
Vibration –Analysis has been done by the structural team to minimize the vibrations and
therefore, lower vibrations will help in loiter.
The Loiter PID P value at the top of the Figure 42 refers to the conversion of difference between
desired and actual position as a speed towards the targeted position. Rate Loiter PID values will
then convert the desired speed to desired acceleration towards the targeted position and desired
acceleration would result in quad obtaining a lean angle to correct the position. These values do
not require changing as advised in the Ardupilot tuning guide (Copter.ardupilot.com, 2015), but will
be changed just to observe in later testing.
Loiter speed refers to the maximum horizontal speed achieved by the quad in loiter mode and is in
the units of cm/s. Therefore 500 refers to 5m/s. Max acceleration at loiter mode is limited to half the
loiter speed by Mission Planner.
11.1.2 Altitude Hold Mode (AltHold)
Engaging in this mode will enable Pixhawk to take control of the throttle and automatically maintain
the altitude present at engaging moment. The pilot will still be keying pitch, roll and yaw to stabilize
the quad. This mode will be useful when hovering to deploy the payload. Correct “AltHols” tuning
was not possible to obtain so far in the current test rig since the altitude is fixed. Pixhawk uses the
inbuilt barometer to measure the pressure difference in order to correct the altitude. Therefore, it’s
important to take the Quad out from the test rig and test AltHold in a secured and open area,
according to rules of regulatory bodies and also not on whether sensitive days which can cause
pressure readings to fluctuate. Therefore, this will be conducted in later test stages when Stabalize
mode is properly tuned. When AltHold is engaged, the throttle would be automatically set between
40% -60%. The pilot can take control of the throttle anytime and throttle input over 60% will cause
to ascend and below 40% will cause to descend. However, if the landing is performed in AltHold
mode, it would take a few more seconds than normally to disarm the motors after a touchdown.
Maximum climb and descent rates are set to a lower value of 2.5 m/s during testing since it
requires practice and experience to control the quad manually without causing any damage.
Purpose of Altitude Hold P is to convert altitude error into a climb/descent rate. The higher rate is
suitable to correct altitude aggressively, but too high can cause oscillations. Throttle rate PD
converts earlier rates to accelerations. Throttle acceleration will feed the acceleration error back
Figure 43 AltHold mode PID values

UAS CHALLENGE 2015
58 Stability and Control I MEng Team Project Report (7ENT1024) School of Engineering and Technology
into system to further reduce the altitude error. It is notable that in this setting, D value is kept at
zero. D gain dampens the unwanted acceleration toward desired variable and in this particular
case, acceleration is required. Therefore, it will be kept at zero. Further P to I will have a 1:2 ratio
(3DRobotics, Altitude Hold Mode, 2015), which will be maintained during testing. Built quad is more
powerful than a normal therefore, reducing PI values by 50% will be a good starting point to initiate
testing. Hence, better performance is expected at P = 0.5000 and I = 1.0000. See sections 15.2.1
Pitch and Roll tuning, 15.2.2 Yaw tuning and 15.2.3 Waypoint navigation tuning for other flight
modes.
11.2 Verifying the performance of PID values
Primarily this would be done by observation and there are two stability engineers to confirm the
result. Since there is still a human element involved, preferable method would be to use flight
record.
In Mission Planner, there are two ways to record the flight data. Through Dataflash logs which
uses on-board flash memory and can be downloaded using MAVLink and through telemetry logs
which is recorded in the mission planners since we are using the 3DR Radio telemetry. Dataflash
logs will be used to verify the performance of the PIDs by opening log in the mission planner which
will open value graph as shown in Figure 44 depending on the flight mode.
Figure 44 Dataflash log in Stabalized mode opened in Mission planner
(3DRobotics, Verifying performance with dataflash logs, 2015)
Figure 44 is the graph from the stabilizer mode where major concern is to achieve good roll and
pitch. So in order to evaluate performance, we need a comparison between desired role and actual
roll, desired pitch and obtained Pitch. It is clear that the units of X and Y axes are the same and the
shape of the two lines are similar and track well. It is obvious that if PIDs are not good, the shapes
of the graphs would not be similar. Therefore, achieved PID values are good. A similar process will
be used in other flight modes as well. For an example, in Alt Hold mode, Barometric altitude (Baro
ALT), Waypoint altitude (desired altitude) and the GPS altitude (inertial nav at estimate) will be
compared see if they track well.

UAS CHALLENGE 2015
59 Safety Case MEng Team Project Report (7ENT1024) School of Engineering and Technology
Section by Malwenna 12 Safety Case
12.1 Overview The UAS can possibly cause property and individual damage to its Pilots, spectators and parts of
the overall population and surroundings. The harm may be brought on by the UAS's contact with
the ground or due to equipment falling out. Therefore, UAS is only allowed to fly in UK airspace if
they are considered safe in operation. UAS in this particular competition being less than 7Kg
MTOM, they will fall under SUA (Small Unmanned Aircraft) category and should comply with UK
Air Navigation Order 2009 articles 138, 166, 167 and CAA CAP 722, and CAP 393. (UK CAA
Safety and Airspace Regulation Group, 2014) (Civil Aviation Authority, 2012)
The main requirements extracted from those articles are as bellow;
The UAS should not operate above 400 feet (122 m)
The UAS should always be in Visual Line of Sight (VLOS) since collision avoidance is
primarily based on this
Maintain a "pilot in control", which is to take control and fly the UAS in case of failure of
autonomy
Operate 150m away from congested areas
Should not operate within 50m of person, vehicle or structure except 30m at takeoff and
landing
Apart from this, it is made sure that team is referring to the University UAS Challenge 2015
competition rule book while designing, manufacturing, testing and demonstration of UAS.
12.2 Flight Controller Safety Mechanism The Pixhawk’s flight controller we have chosen has a number of safety mechanisms; It includes a
motor arming safety feature when manually controlling the copter. At take-off, throttle stick should
be held up for several seconds to safely arm the motors and vice-versa at landing. It also includes
safety modes such as RTL (Return to Launch), Failsafe and GeoFence. In the event of a signal
lose to the UAS, it can be programmed to return to launch location using RTL while Failsafe will
ensure its safety and GeoFence will transmit its current location. Stabilize or Stabilize plus modes
can be triggered to land the Quad-rotor safely in case of a motor failure.
Please see section 16 “Flight Termination Case” for more information.
12.2.1 Safety Measurements for Flight Testing
Ensuring no personnel are near propellers when they are powered, especially when
performing PID tests.
Terminating the flight before battery’s safety capacity is reached.
After landing, ensure battery power to the components has been stopped either by
removing cables or using a switch before handling the UAV.
Prior testing, ensuring the home location shown in the mission planner software is correct.

UAS CHALLENGE 2015
60 Safety Case MEng Team Project Report (7ENT1024) School of Engineering and Technology
Using a staggered flight test approach, increasing speed and height with each test.
Use of checklists for mechanical and electrical components, systems and assembly before
every flight test to ensure they are connected correctly and working.
12.3 Hazardous Components 1) High speed propellers – detachment of propellers in flight can cause serious injuries to
people and animals. Therefor it is suited to avoid composite made props and use breakable
and flexible props. The downside to this is it will reduce the performance of the propeller.
However, given the reliability and safety, plastic props were ultimately chosen which will
break in an event of a crash without serious damage to personnel or structures
2) Batteries – lithium polymer batteries are often seen exploding due to misuse, which can
cause serious structural damage to the aircraft. Use of high build quality batteries and
monitoring their charging and temperature regularly can avoid such failure
(Rogershobbycenter.com, n.d.). Purchased batteries will be made brighter in colour to
identify them in a crash and they are mounted using Velcro Straps for easy removal.
12.4 Battery Fail Safe Battery Fail Safe mode in
Mission Planner is to land
the Quad-rotor or return to
launch if battery voltages
drop down a certain
percentage. But the
requirement for this fail safe
to activate is that the battery
should be connected to
Pixhawk power module.
Three 5s batteries are being
used to power the motors and ESCs which are not connected to Pixhawk since Pixhawk can only
support up to 4s batteries. Therefore, this fail safe is used only for the system battery which is a
2200MAH 4s Lipo.
Fail safe will trigger at two occasions
1) If the 4s battery voltages goosed below 12volts – Minimum safe voltage for a 4s battery to
operate is assumed to be 3 volts per cell.
2) If the 4s battery remaining capacity goes below 440MAH – This is 20% of the capacity of
the battery which is 2200MAH and 440MAH is being set as the configurable Reserved MAH
(reserved for land or RTL)
Figure 45 Battery fail safe settings chosen in Mission Planner

UAS CHALLENGE 2015
61 Safety Case MEng Team Project Report (7ENT1024) School of Engineering and Technology
Battery Fail safe can be
disabled anytime,
however, there is a
separate low battery
warning option being set
up. Low battery massege
will appear on the
ground control station
following a loud beep if
the battery percentage
goes below 23%. Having 23% will give sufficient time for ground control to prepare for the fail safe
method selected since failsafe will initiate at 20%
12.5 Radio Fail Safe
This fail safe is used if communication between RC transmitter and receiver is broken. Given the
nature of the mission to be fully autonomous, it is highly unlikely that this will be in use. The RC will
only be used if autonomy fails and if decided to continue with the mission without triggering other
Fail safes. However, this can be very useful in testing stages especially in AltHold and auto tuning
if quad becomes unresponsive or uncontrollable.
There are four occasions where Radio Fail Safe is possible
If the RC transmitter is switched off accidentally
If quad exceeds the maximum RC range
Malfunction in RC receiver wiring or PPM encoder
If the RC transmitter runs out of power (Turnigy 9x RC is powered by eight AA batteries)
When the Fail safe is triggered, motors will automatically disarm if Quad-rotor is on the ground. It
will return to launch (RTL) if it has a GPS fix and more than 2m away from launch location or if has
no GPS fix and within 2m, it will land. Even if the communication link is restored prior to landing, it
will still continue with the fail safe unless the flight mode is changed using Mission Planner or RC
switches. It will continue with the mission if the mode is on Auto.
Figure 46 Battery monitor settings chosen in Mission Planner

UAS CHALLENGE 2015
62 Environmental Impact MEng Team Project Report (7ENT1024) School of Engineering and Technology
Section by Malwenna 13 Environmental Impact In order to UAS design to be a success, it is important to assess the environmental impact it has
from the initial concept of the design. One of the aims in the design process was to have minimum
impact on the environment without compromising the performance. This report covers the main
Environmental factors affected by the use of UAS and proposes action taken and will be taken to
lessen them.
13.1 Hazardous Material 1) High speed propellers
2) Batteries
3) Plastic material – most of the Quad-rotor structure will be built using plastics such as Nylon
6.6, Nylon 6 and PVC. Reason for choosing these were presented in the section. The
environmental impact of using these materials is high and there are three conceivable
ecological issues to be considered. Plastics are generally produced using natural resources
which must be conserved, such as oil, gas or coal and increasing the use will drain the
natural resources. As a by-product of the manufacture of plastics, various pollutants will be
created which have to be dealt with properly by manufacturing companies.
13.2 Air Quality
13.2.1 Emissions
Air pollution due to UAV usage is primarily from gas emissions during flight. Therefore, Reduction
in emissions was considered in the initial planning of the power plant. The end result was to
discard the use of any fuel and use battery powered motors which will not only minimize air
pollution, but eliminate it. Therefore, this Quad-rotor design will have zero air pollution due to
emissions.
13.2.2 Noise
There are two types of noise originating from a UAS. Aerodynamic noise is the noise due to
vortices at the blade tips. Higher blade loading and speed will result in a higher noise. But the most
significant noise is the noise from the power plant. Specially noise from a fuel engine airplane
where noise arouses due to combustion and exhaust compared with a similar set up electrical
engine, is higher. However, in this case we are using four motors powered by 5s batteries and
provides a lift to carry 2kg payload. Therefore, power requirement and work done is higher, so is
the noise than in a normal Quad-rotor. However the noise is being minimized by proper weight
distribution and propeller balancing to reduce the vibrations causing the noise. In this particular
competition, high noise can be advantageous as well since UAS has to remain at VLOS always
and noise will aid in locating the vehicle. However UAV would be under the permitted noise level of
Elvington Airfield area and would not significantly affect the air quality.

UAS CHALLENGE 2015
63 Environmental Impact MEng Team Project Report (7ENT1024) School of Engineering and Technology
13.3 Infrastructure Quad-rotor is a small UAS system and therefore, does not require major infrastructure changes.
But upon impact, it can cause serious damage to infrastructures. Also, uncontrolled radio
frequencies can cause interferences for civil operations. To prevent such incidents, the quad will
be operated 50m away from structure, personnel and 150m away from congested areas as
required by the CAA regulations.
13.4 Disposal of Material Plastic material - The most common method of disposing these materials is by burying in landfill
sites, but since they have a low decay rate, increasing use of plastics will create a build-up in
landfills. The materials that have been used in the design are high quality materials manufactured
using the correct method which means they are not degraded. Therefore, burying them in landfill
sites will not produce harmful gasses such as methane, which are normally produced by low
quality materials. Alternative way of disposal is to incinerate it. Burning plastic can reverse the
process to obtain raw materials such as crude oil, gasses and coal. These gassed can also be
recycled separately after. However, this process will also generate some harmful gasses.
Incinerating Nylon will produce carbon monoxide, ammonia, aliphatic amines, ketones, nitriles and
hydrogen cyanide and later in exceeding room temperature is a highly poisonous gas
(schoolworkhelper.net, 2014)Therefore, this process should be carried out in a controlled
environment. Another way of recycling them is by reprocessing, which will produce materials which
are inferior from previous quality, but can be used for products such as bags and dust bin bags
where quality is not that important. At the end of the lifetime, Quad-rotor can be disassembled and
plastic material can be taken to the numerous plastic recycling companies available in the UK for
them to be properly reprocessed.
Lithium Polymer batteries – Since Lipos are the most hazardous equipment used, they have to be
disposed in a responsible manner. Earlier method of disposal was dumping the Lipos in a salt-
water bucket and letting it to degrade and disposal though drainage system. This started causing
problems to Water Authorities since they use lithium to trace the water leaks and degrading Lipo in
salt-water will add lithium salts to the drainage system (Smith, n.d.)Therefore the best ways to
dispose Lipos are the procedures via local authority Environment Waste Department where they
have a special used battery collection system on going. But prior to handing over the Lipos,
following steps should be carried out.
Lipos should be discharged to a minimum voltage – Suitable resistance should be used to
avoid overheating of both the battery and resistor and battery should be drained as closes
to zero volts.
Discharging the battery using shorting the leads should not be attempted.

UAS CHALLENGE 2015
64 Environmental Impact MEng Team Project Report (7ENT1024) School of Engineering and Technology
Once discharging is completed, they should be secured in a stout cardboard box or similar
and clearly labelled with "SPENT LITHIUM BATTERIES FOR RECYCLING" (Smith, n.d.).
Also batteries can be returned to the battery retailers whom are obligated to accept spent batteries
under the National Battery Back Scheme.
Table 10 Impact of Quad-rotor on environment
Environmental
Factor
No Impact No Significant Impact Significant
Impact
Hazardous Materials X
Emissions X
Noise X
Infrastructure X
Waste X

UAS CHALLENGE 2015
65 Stability and Control II MEng Team Project Report (7ENT1024) School of Engineering and Technology
Section by Reyad 14 Stability and Control II Due to the complexity of the Quad-rotor stability, joint roles were required in order to carry out the
complex tasks. The stability testing sections are split, along with the reporting.
Refer to Section 11 “Stability and Control” and 11.1 “PID Tuning” for more information on the
introduction of Quad-rotor stability.
14.1 Ideal CG location The Centre of Gravity (CG) placement on a Quad-rotor needs to be taken into consideration early
on as it affects the flight performance, speed and stability. Ideally, the CG should be at the centre
point of the multi-copter, at 0 on the x and y axis. As this may not be feasible depending on the
size and weight of the systems and batteries, the CG may be off centre by up to 1-2cm. If the CG
is at the aft of the Quad-rotor then it will naturally try to pitch back, increasing the time it takes for
the quad to pitch forward, therefore sacrificing forward speed and forward acceleration, although it
will be very effective at reducing forward speed. The same principle also applies if the CG
placement is closer to the front of the Quad-rotor. However, unlike an aft CG, a fore CG placement
can be beneficial as unless the Quad-rotor is hovering, it will be always at forward flight during the
main event of the IMechE competition, which will allow the Quad-rotor to accelerate faster, improve
forward speed and reduce the thrust required from the motors to remain at the desired pitch which
will help increase the flight time. If, however, the CG is too far in front the motors will require
additional thrust from stopping the Quad-rotor from pitching too much. These same rules apply to
roll, if the CG is on the left or right side, it would allow the Quad-rotor to roll to that specific side
faster but react slower if it was to roll to the other side. On top of this, the Quad-rotor will need to
provide additional thrust so that it does not roll to one side continuously.
As previously mentioned, the Quad-rotor might be able to get away if the CG placement is no
greater than 1-2cm away from the centre, any more and the additional thrust required to
compensate for the stability will reduce the flight performance by a large amount. Unless major
changes are made to the Quad-rotor, from here on, which is highly unlikely, for each cm the CG is
off by; the motors will need to provide an additional 155g of thrust to compensate.
Figure 47 Side view of the Quad-rotor

UAS CHALLENGE 2015
66 Flight modes and tuning MEng Team Project Report (7ENT1024) School of Engineering and Technology
Section by Reyad
The z-axis is far less black and white, compared to the x and y-axis. The lower the CG on the z-
axis the more stable the Quad-rotor becomes, on the other hand, the more stable the Quad-rotor
becomes, the more thrust will be required to manoeuvre the Quad-rotor. Assuming that the top
plate is the datum (see Figure 47), the CG is at 0.9 cm with one payload and two batteries and -1.7
cm after payload has been deployed. As these points are below the propeller, they should allow for
some level of stability with very little compromise to the manoeuvrability.
15 Flight modes and tuning
15.1 Simulink model Initially there was a plan to create a mathematical model on Simulink to simulate the behaviour of
the Quad-rotor while it’s flying, or at the least; hovering. The reason for this is that it allows for safe
testing without any crashes since the test can simply be restarted. However, later on it was
decided that this may not be needed as a simply test rig will allow for tuning of the Quad-rotor
without the requirement of a mathematical model and certain changes to the Quad-rotor will allow
the group to test the Quad-rotor in relative safety. Nevertheless, a ready made Simulink model
(Figure 48), (full model in Appendix. J) was found which was previously made by the winning
students at Drexel University for the Mathworks ‘MATLAB and Simulink Student Design Challenge
2014’ (Mathworks, 2014). While the model the group has created has the possibility of not being
perfectly accurate, they have verified it with Mathworks using a real Quad-rotor, making this small
model somewhat credible. Still, the purpose of the model was to check the changes in PID values
and their effect on stability, before the Quad-rotor and test rig was built, and get their ratio of PID
numbers for testing on the test rig once it has been made.
Figure 48 Simulink model used
To get started on MATLAB, an m-file of all size and weight of the main components will be required
as well as the thrust and torque coefficients of the motor. These will be used to create a transfer

UAS CHALLENGE 2015
67 Flight modes and tuning MEng Team Project Report (7ENT1024) School of Engineering and Technology
function for the PID values (full model in Appendix. J). Another m-file will be required for the initial
starting conditions.
Once the Quad-rotor parameter and initial conditions file have been created, the files will be loaded
onto the altitude control file on Simulink. At first the PID values will all be set to zero before being
adjusted one at a time, first for the throttle command and then followed by the Roll and Pitch on the
‘Position Control’ Simulink file. The test was done in the same fashion as one would do for the
physical test, by pushing the P value (in throttle command) until the throttle response is deemed
acceptable. Without an I or D value this would cause the Quad-rotor to oscillate with little to no
damping, as seen in Figure 49. To introduce damping, the D gain must be increased, and as
Figure 49 once again indicates, after multiple iterations, the D gain allows the Quad-rotor to
stabilise at 100ft, the minimum height for the UAS Challenge, at a reasonable amount of time.
Figure 49 Quad-rotor oscillating with only the P gain (left), with P and D gain (right)
Pitch and Roll should be theoretically be the same as a Quad-rotor in a ‘+’ or ‘x’ shape, so should
ideally be symmetrical and therefore the PID values for one mode should be very same for the
other. However, at the time of Simulink testing the Quad-rotor had not been manufactured for
validation but for the test it was assumed that the CG was at the centre for the x, y and z-axis and
all moments were the same for all the arms. For the roll and pitch the P value were increased until
there were oscillations before the D and I values were increased one at a time for the Quad-rotor to
fly with a good response. Full test data can be found in full model in full model in Appendix. J and
also for Throttle/altitude and for pitch and roll .
When it was time to do the yaw tuning, it appeared that regardless of what value the PID were,
even 0, the Quad-rotor would still yaw on the Simulink model and therefore no further attempt was
made on yaw. Fortunately, yaw is less of a concern on a Quad-rotor as it can be manually
controlled without any issues to the Quad-rotor’s flight path.
After extensive testing on Simulink, the final values for Throttle, Pitch and Roll are shown on the
figure below, Figure 50.

UAS CHALLENGE 2015
68 Flight modes and tuning MEng Team Project Report (7ENT1024) School of Engineering and Technology
Figure 50 PID values on Simulink
15.2 Test rig PID Testing To test all the PID values from the test rig, the test rig itself must be able to move freely in all axes.
However, to achieve the values for only the pitch, roll and yaw, each axis must be tied down, so
not to interfere. Having said this, the placement of the test rig may be of an issue, as the Quad-
rotor flies through the air, it should pivot around its CG, but while it is on the test rig, the CG will be
slightly above the pivot point which means that PID values we get from the test rig would be great
while the Quad-rotor is on the test rig, their effectivity will be greatly reduced once the Quad-rotor is
removed from the test rig. What this means is that once the Quad-rotor is removed from the test
rig, the must be further fine-tuned to make it suitable for the UAS challenge.
The test rig was not made in time for comprehensive testing, a plan was created which involved
the PID values on Pixhawk being slowing increased, same as with the MATLAB model, one at a
time until satisfactory results. While Pixhawk comes with their own values for PID, they’re designed
for 3DR’s own Quad-rotor (3DR Robotics, 2015). For this reason, the team’s Quad-rotor requires
its own set, calibrated through Mission Planner. The PID numbers will need to be adjusted for the
typical Roll/Pitch (yellow), as seen below, yaw (orange)(Figure 51), altitude hold (green), loiter
(pink), and waypoint navigation (blue).

UAS CHALLENGE 2015
69 Flight modes and tuning MEng Team Project Report (7ENT1024) School of Engineering and Technology
Figure 51 Values that require change (3DR Robotics, 2015)
Stabilise mode, one of the initial recommended modes for tuning the Quad-rotor, as it handles
some level of control over the Quad-rotor over the pilot such as maximum roll and pitch. In ‘acro’
mode, the pilot has full control and could therefore push the Quad-rotor to overturn itself and if the
pilot was tuning the Quad-rotor without a test rig then the pilot could cause some serious damages
to the Quad-rotor and if the propellers snap off, damage to anyone nearby like the pilot. In stabilise
modem, the Quad-rotor will automatically try to stabilise itself once the pilot releases the stick,
making it the ideal starting point for tuning. As progress was made, more and more control would
be taken back from Pixhawk before testing it under acro mode.
As it’s a Quad-rotor, the pitch and roll values can remain the same since it can also be flown
sideways in the same way for forward flight. However, this will be tested later on if they require a
different set of PID values. As Pixhawk does not allow for a P value below 0.08, that will be what
the test will start with. I and D will be set to zero to minimise their effect and will be incorporated
once the P value is satisfactory.
15.2.1 Pitch and Roll tuning
To tune the pitch and roll PID values, the process follows a similar process as the one for
MATLAB:
1. Set the Quad-rotor up on the test rig, as seen on Figure 52, and make sure all arms are
fastened, all loose cables are tied and the batteries are well charged
2. Make sure that the batteries are well placed and not causing the Quad-rotor to tilt to one
side from the misaligned CG
3. Test the Quad-rotor with the given PID values for 3DR’s own Quad-rotor (3DR Robotics,
2015) to see how it handles
4. Test with the values from MATLAB to see if the Quad-rotor response time are the same
5. Test with minimal PID values to see how stable it may be naturally
6. Start increasing the P value to improve the response time to that close to which ever it was
most stable to (IRIS+ or MATLAB version)
7. Increase the P, I, and D values until the Quad-rotor stabilises whilst in the test rig

UAS CHALLENGE 2015
70 Flight modes and tuning MEng Team Project Report (7ENT1024) School of Engineering and Technology
Figure 52 Quad-rotor on the test rig
For a more detailed version of the test plan, please see full model in Appendix. J.
The test rig was finally completed approximately one week before the submission date which gave
the group two days to do some quick testing. During these two testing days the Quad-rotor
managed to pitch and return to level within a very good time frame, approximately 2.3 seconds,
however, due to the placement of the batteries, the roll took much longer than expected to stabilise
(just over 6 seconds). This is due to the Quad-rotor not being fully assembled as it was designed to
be but put together for testing purposes and the batteries were not closely placed at the centre to
minimise the moments and the placement of the CG. After some realignment, the pitch, roll and
yaw results were much improved and better than expected in some cases. However, Pixhawk has
its own method of providing data on how the Quad-rotor should stabilise, see Figure 53, and
unfortunately there wasn’t enough time to improve the result nor could the data be extracted (at the
time) for further analysis.
Figure 53 Results of what Pixhawk should output (Copter.Ardupilot, 2015)

UAS CHALLENGE 2015
71 Flight modes and tuning MEng Team Project Report (7ENT1024) School of Engineering and Technology
15.2.2 Yaw tuning
The Yaw tuning will involve a similar procedure to the pitch and roll tuning, although unlike the
pitch and roll values, it won’t require fine-tuning as yaw has less of an impact on stability. Having
said that, there are still good reasons for improving the yaw PID values to improve the response
(start and stop), reduce the overshoot and add a damping to the yaw acceleration.
Please see section 11.1.1 Loiter mode and 11.1.2 Altitude Hold Mode (AltHold) for other flight
modes.
15.2.3 Waypoint navigation tuning
In auto mode, the Quad-rotor will follow a pre-set path, from Mission Planner, and is capable of
doing certain tasks, such as deploy payload, taking video of flight path and pictures of current
locations. Tuning auto mode includes altitude and position from AltHold and loiter modes and as a
result should only be tuned after those two have been tuned. In the configuration menu the
maximum horizontal and vertical up/down speed can be changed in 10mm/s, so 25m/s will be
written as 2500. There is an issue where Pixhawk cannot maintain control of both altitude and
horizontal speed simultaneously whilst going over certain speeds, which can vary from Quad-rotor
to Quad-rotor. For this to be checked, the group’s Quad-rotor must be flown in auto mode to see
how much of a compromise this may be before steps are taken to overcome this issue.
Auto mode can be setup so that the Quad-rotor starts the mission from the ground or whilst flying.
If the Quad-rotor is set on the ground, then the throttle must be set to zero as the moment the
throttle is increased, the Quad-rotor will be set to auto mode and make its way to the first waypoint.
If the Quad-rotor is starting whilst in the air, it will start moving towards its first waypoint once the
controller has been set to auto. If, after it has been to auto, the first command is ‘take-off’, it will
recognise that command as completed and move to the next one. While the Quad-rotor is set to
auto mode, Pixhawk will overlook all inputs from the pilot as long as not disable auto mode and
yaw. As some pilots may decide to take pictures of the location, the pilot still has some control over
the yaw control, although Pixhawk will try to regain control once it has reached its next waypoint.
Waypoints can be set up as ‘fast waypoints’ (Ardupilot, 2015), which operate in the same way as
regular waypoints but without any delay or loitering at that waypoint. For both cases, a radius must
be inputted into Pixhawk, so that Pixhawk can recognise that way point as complete once it is
within a certain range.

UAS CHALLENGE 2015
72 Flight modes and tuning MEng Team Project Report (7ENT1024) School of Engineering and Technology
15.3 Tuning during flight Once all PID values have been gathered for pitch, roll, yaw, stabilize mode, altitude hold, loiter,
and waypoint navigation, the Quad-rotor will be removed from the Quad-rotor and taken to a
controlled environment for flight testing. If required, the all the PID values for all modes will be
further fine-tuned during flight to check the response, stability and how well it handles disturbances
such as mild wind. Once it can fly well with a pilot, the Quad-rotor will be set in auto mode and
made to fly through waypoints, up to 2km in length, slow at first before increasing speed to
maximise the thrust from the motors and minimise the time taken. Once the above has been
completed, the same process will be continued but with payload deployment until satisfied.
15.4 Future Work As the test rig has been made in the final week leading up to the submission, no successful testing
was done. Now that the test rig and Quad-rotor has been built, from here on out, it will solely be
testing and fine-tuning the PID values for maximum performance and response time and ideally
without losing too much stability during the process. The Quad-rotor will fly up to 2km during the
UAS Challenge and after the changes in the latest briefing from IMechE, the Quad-rotor has a
large advantage due the quick acceleration and stoppage of a Quad-rotor over a fixed wing
aircraft.

UAS CHALLENGE 2015
73 Flight Termination Case MEng Team Project Report (7ENT1024) School of Engineering and Technology
Section by Reyad 16 Flight Termination Case The core functionality of the Pixhawk software Mission Planner is to return to launch (RTL) if it
loses contact with the ground station or manual control. If more advanced options are required
then Pixhawk has an on-board Advanced Failsafe (AFS) system. The pilot can setup for failsafe
conditions so that the multi-copter can loiter for a short period of time before RTL, automatic
landing or termination (Plane.Ardupilot, 2014). If termination is chosen, then this will apply to all
modes of flight termination cases, whether that is GPS loss, communication loss, Geofence breach
or altitude breach. Once the aircraft has entered termination mode, it is no longer recoverable so
for this purpose the Quad-rotor will not be set on termination but land as a last resort.
16.1 GPS Loss The AFS system monitors the strength of the GPS receivers throughout the flight. If both GPS, on-
board and external, lose position lock for over 3 seconds, then the Pixhawk AFS initiates
(Plane.Ardupilot, 2014). This involves the system looking into one of the parameters called
‘AFS_WP_GPS_LOSS’ which instructs the multi-copter on its next action, ranging from loiter for a
period of time, disarming the motors and landing, or in a sequence of two or more of these actions.
It is also possible to specify a mission waypoint number which Pixhawk will use as a reference
point for where it should head to next if it loses GPS signal, similar to RTL. If the GPS regains
positioning then the multi-copter will continue its mission from where it left off.
16.2 Communication loss from Ground Station The AFS system constantly monitors the strength of the data-link between the Quad-rotor and the
ground station using the ‘HEARTBEAT MAVlink’ (Plane.Ardupilot, 2014) messages being
transmitted by the ground station. If for a period of 10 seconds or greater the multi-copter does not
receive a HEARTBEAT message then it enters AFS state. During AFS state, it looks for the
‘AFS_WP_COMMS’ parameter, which will contain a waypoint number to navigate to on
communication loss (APM Plane, 2014). The MAVlink messages are purely for Pixhawk, which
gets informed that it is receiving communication from the ground station. The ground station itself
will not see these messages from Pixhawk
If the multi-copter loses GPS positioning and connection with the ground station then this is
considered ‘dual loss’ and the multi-copter will immediately terminate. The user can, however,
override Pixhawk and enable manual mode and take control regardless of GPS loss, ground
station loss or both as long as Pixhawk has not already started flight termination. If all connections
are lost, including manual control then the multi-copter will terminate flight after a specified time in
milliseconds, in our case for 30,000 milliseconds or 30 seconds.
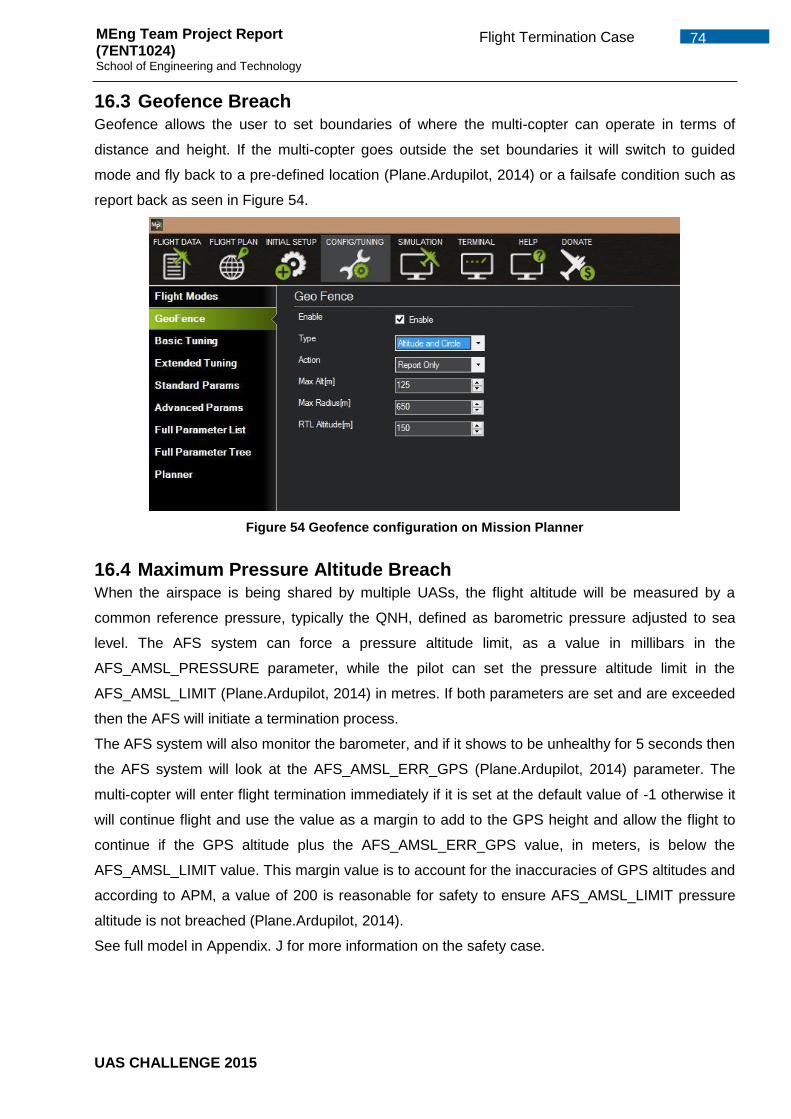
UAS CHALLENGE 2015
74 Flight Termination Case MEng Team Project Report (7ENT1024) School of Engineering and Technology
16.3 Geofence Breach Geofence allows the user to set boundaries of where the multi-copter can operate in terms of
distance and height. If the multi-copter goes outside the set boundaries it will switch to guided
mode and fly back to a pre-defined location (Plane.Ardupilot, 2014) or a failsafe condition such as
report back as seen in Figure 54.
Figure 54 Geofence configuration on Mission Planner
16.4 Maximum Pressure Altitude Breach When the airspace is being shared by multiple UASs, the flight altitude will be measured by a
common reference pressure, typically the QNH, defined as barometric pressure adjusted to sea
level. The AFS system can force a pressure altitude limit, as a value in millibars in the
AFS_AMSL_PRESSURE parameter, while the pilot can set the pressure altitude limit in the
AFS_AMSL_LIMIT (Plane.Ardupilot, 2014) in metres. If both parameters are set and are exceeded
then the AFS will initiate a termination process.
The AFS system will also monitor the barometer, and if it shows to be unhealthy for 5 seconds then
the AFS system will look at the AFS_AMSL_ERR_GPS (Plane.Ardupilot, 2014) parameter. The
multi-copter will enter flight termination immediately if it is set at the default value of -1 otherwise it
will continue flight and use the value as a margin to add to the GPS height and allow the flight to
continue if the GPS altitude plus the AFS_AMSL_ERR_GPS value, in meters, is below the
AFS_AMSL_LIMIT value. This margin value is to account for the inaccuracies of GPS altitudes and
according to APM, a value of 200 is reasonable for safety to ensure AFS_AMSL_LIMIT pressure
altitude is not breached (Plane.Ardupilot, 2014).
See full model in Appendix. J for more information on the safety case.

UAS CHALLENGE 2015
75 Systems Layout MEng Team Project Report (7ENT1024) School of Engineering and Technology
Section by Tarek 17 Systems Layout
17.1 System block diagram
The over view of the operation and systems of the Quad-rotor are shown in the following two
diagrams. The first diagram shows the hardware and how the subsystems interact with each other,
while the second focuses on the operation of the software subsystems operation with the Quad-
rotor. The schematics of the systems are in Appendix K.3(ardupilot) (S@M, 2014).
17.1.1 Hardware Systems
The following block diagram is off the hardware of the Quad-rotor, the diagram has two sections
which operate in their own unique way. The first section is the ground control station which has
two subsystems, the controller and the ground control station computer with the communication
system. The base station computer is what stores the Mission planner, this software allows for the
control of the flight path and the operation of the Quad-rotor. The communication system linked to
the computer communicates with the Quad-rotor which allows for transmitting and receiving data.
The radio control allow for manual control of the Quad-rotor by the pilot.
The second section is of the Quad-rotor consists of motors, flight controller, power distribution,
camera, GPS Module, and video graphics processing unit (VGPU) or the minimOSD along with
pixhawk. The motors flight controller and power distribution resample the systems that of
propulsion systems. The GPS module is for pinpointing the location of the Quad-rotor and flight to
the desired location. Finally the camera and the minimOSD with pixhawk are part of the
transmission of the video and data feed to the ground control station.
Figure 55 Overall System Hardware Block Diagram
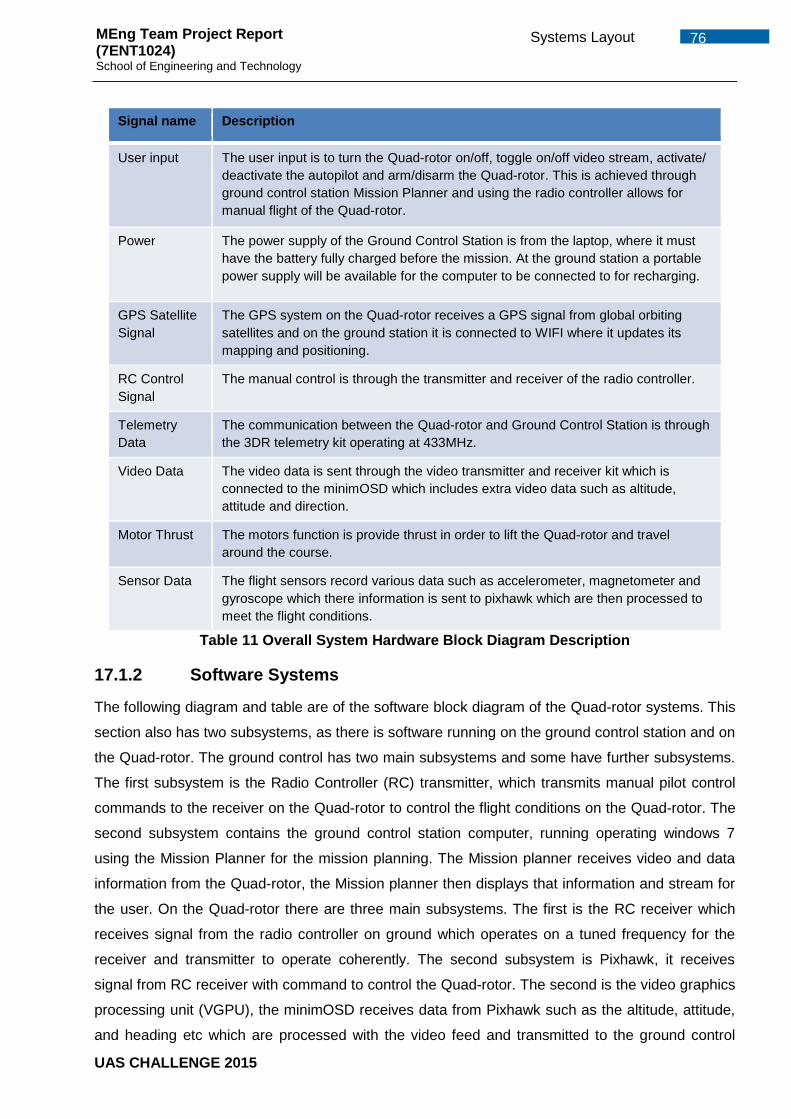
UAS CHALLENGE 2015
76 Systems Layout MEng Team Project Report (7ENT1024) School of Engineering and Technology
Signal name Description
User input The user input is to turn the Quad-rotor on/off, toggle on/off video stream, activate/
deactivate the autopilot and arm/disarm the Quad-rotor. This is achieved through
ground control station Mission Planner and using the radio controller allows for
manual flight of the Quad-rotor.
Power The power supply of the Ground Control Station is from the laptop, where it must
have the battery fully charged before the mission. At the ground station a portable
power supply will be available for the computer to be connected to for recharging.
GPS Satellite
Signal
The GPS system on the Quad-rotor receives a GPS signal from global orbiting
satellites and on the ground station it is connected to WIFI where it updates its
mapping and positioning.
RC Control
Signal
The manual control is through the transmitter and receiver of the radio controller.
Telemetry
Data
The communication between the Quad-rotor and Ground Control Station is through
the 3DR telemetry kit operating at 433MHz.
Video Data The video data is sent through the video transmitter and receiver kit which is
connected to the minimOSD which includes extra video data such as altitude,
attitude and direction.
Motor Thrust The motors function is provide thrust in order to lift the Quad-rotor and travel
around the course.
Sensor Data The flight sensors record various data such as accelerometer, magnetometer and
gyroscope which there information is sent to pixhawk which are then processed to
meet the flight conditions.
Table 11 Overall System Hardware Block Diagram Description
17.1.2 Software Systems
The following diagram and table are of the software block diagram of the Quad-rotor systems. This
section also has two subsystems, as there is software running on the ground control station and on
the Quad-rotor. The ground control has two main subsystems and some have further subsystems.
The first subsystem is the Radio Controller (RC) transmitter, which transmits manual pilot control
commands to the receiver on the Quad-rotor to control the flight conditions on the Quad-rotor. The
second subsystem contains the ground control station computer, running operating windows 7
using the Mission Planner for the mission planning. The Mission planner receives video and data
information from the Quad-rotor, the Mission planner then displays that information and stream for
the user. On the Quad-rotor there are three main subsystems. The first is the RC receiver which
receives signal from the radio controller on ground which operates on a tuned frequency for the
receiver and transmitter to operate coherently. The second subsystem is Pixhawk, it receives
signal from RC receiver with command to control the Quad-rotor. The second is the video graphics
processing unit (VGPU), the minimOSD receives data from Pixhawk such as the altitude, attitude,
and heading etc which are processed with the video feed and transmitted to the ground control

UAS CHALLENGE 2015
77 Systems Layout MEng Team Project Report (7ENT1024) School of Engineering and Technology
station. Pixhawk is the main computer or brain on board the Quad-rotor, Pixhawk receives data
through the telemetry kit which contains flight commands such as GPS coordinates or signal when
to release the payload. The table below contains more descriptions on individual systems.
Figure 56 Overall Software Block Diagram
Signal name Description
Video
Commands
Video command will be sent through the video link which makes the camera take a
photo of the target for it to then be processed. This will read the alphanumeric
information at the target and display it at the ground control station.
Video Data The video data is transmitted from the camera on bored the Quad-rotor, with
information from the minimOSD. The video will be displayed on the ground station
Mission planner. The video is transmitted through video transmitter which will be
operating in the same frequency as the video receiver on the ground station.
Telemetry
Command
The telemetry command is sent from the Ground Control Station Mission planner
through the telemetry transmitter to the receiver which then sends the information
to pixhawk to be processed.
Telemetry
Data
The telemetry data sends data from the Quad-rotor with pixhawk data to ground
station. The data from pixhawk includes information such altitude, attitude, location
and speed which are displayed on the Mission planner page.
User Data The user data is the collection of the flight information which is displayed on the
Mission planner with information regarding current flight conditions.
RC
Commands
The RC commands are the commands transmitted by the transmitter to the
receiver with flight control commands to control the flight conditions of the Quad-
rotor
Table 12- Overall Software Block Diagram Description

UAS CHALLENGE 2015
78 Systems Layout MEng Team Project Report (7ENT1024) School of Engineering and Technology
17.2 Communication
The range and performance of the radio frequency (RF) link are critically dependent on the
antenna used. The radiation pattern of a quarter wave monopole antenna is heavily dependent on
the design and layout. Therefore selecting the correct antenna and placing in the most efficient
location on the Quad-rotor is crucial. The mounting of the telemetry and the video transmitter, must
take into account of the possibilities of shadowing, as this can be a factor when mounted in an
obstructed area for example between the two structural plates of the Quad-rotor. The effects of
shadowing will hinder the range and coverage of the transmission range. For this reason the most
common set up on a UAV or aircraft is the vertical polarization. As the advantage of a vertical
polarization, waves propagate much more effectively in this orientation near the earth, whereas
horizontal polarized the waves will be cancelled out by the reflection from the earth.
Electromagnetic Interference (EMI) is common issue that occurs with electronic devices as they
might interfere or interrupt the performance of a device, due to radiation and the source could be
from nature or manmade devices. If the EMI intervenes with the aircraft systems it could turn out to
be a very serious issue during flight, especially if a system such as navigation are disrupted this
would lead to a loss of signal and would lead to missing the flight path hence increasing flight time.
Therefore, on the Quad-rotor the mounting of the GPS will be placed on most elevated location on
the Quad-rotor, and the telemetry and video transmitter will be placed some distance away from
each other to avoid interference (Wyatt & Tooley, 2008).
When testing the GPS and telemetry kit loss of performance was identified, and the reason for this
was that the operating frequency of the laptop is up to 400MHz and the telemetry operates at
frequency of 433MHz. During testing the laptop was used as the power source for the GPS and
telemetry kit. This could also be due to path loss as the test was carried out on a long narrow field
with trees obstructing the line of sight signal. Nonetheless a range of more than 400metters was
achieved as this was down to the maximum length of the field. To protect signal strength aluminum
shielded wires are used to protect against EMF to help reduce cable loss. Cable loss is the amount
of signal lost due to the cable, another measure taken to reduce this effect it to have long enough
cables to reach each connection point because the longer the cable the higher signal loss (Bailey,
2003).

UAS CHALLENGE 2015
79 Image Processing MEng Team Project Report (7ENT1024) School of Engineering and Technology
Section by Tarek 18 Image Processing
18.1 Image Recognition
18.1.1 The Requirements
Image recognition code will be used to read the letter at the target and displayed letter on the
ground station screen. Earlier competition requirements stated that there would be a mixture of
alphanumeric characters at the target which should be recognized and displayed at the ground
station (Barragan, 2014). However the march 2015 rules state that there will only be one letter at
the target in a target area of 2m by 2m.
18.1.2 Testing
For testing purpose the target has been scaled down to resemble real life operation. The
parameter of the square target is 2m by 2m and the Quad-rotor cruise altitude is at 100ft. To verify
the code ability to recognize the target letter, tests were carried out at different altitudes to compare
the results. The reason for testing at different altitudes is because for payload deployment the
Quad-rotor would need to descend to an altitude to safely deploy the payload at the target. The
altitudes that have been selected for testing are at 100ft, 50ft and 20ft. The target will be elevated
at 1.5 m above the ground.
Scaling
As the delivery box is elevated above ground at 1.5m = 150cm, taking scale at 1/20 therefore
testing is as follows:
For 100ft:
100ft = 3048cm → 3048 − 150 = 2898 cm
∴2898
20= 144.9 𝑐𝑚
For 50ft:
50ft = 1524cm → 1524 − 150 = 1374 cm
∴1374
20= 68.7 𝑐𝑚
For 20ft:
20ft = 609.6cm → 609.6 − 150 = 459.6 cm
∴459.6
20= 22.98 𝑐𝑚
As the altitude was scaled down the target character should also be scaled down. The target is 2m
by 2m.
2𝑚 = 200𝑐𝑚 →200
20= 10𝑐𝑚
Therefore the target will be 10cm by 10cm with the letter in the middle of the square target.

UAS CHALLENGE 2015
80 Image Processing MEng Team Project Report (7ENT1024) School of Engineering and Technology
18.1.3 Results
To represent the altitude of 100ft, 50ft and 20ft, the test will be carried out at 144.9cm, 68.7cm and 22.98cm.
For testing only two letters where tested, H and Z.
Altitude (cm) Alphanumeric Letter Result
144.9 H 1317 characters where displayed
144.9 Z 1400 characters where displayed
68.7 H 2489 characters where displayed
68.7 Z 1568 characters where displayed
22.98 H H
22.98 Z Z
Table 13 - Alphanumeric processing at different height
Figure 57 Matlab alphanumeric code processing letter at 22.98cm
18.1.4 Analysis
From the result obtained in Table 13, it shows that when taking a picture above 50ft the results are
not consistent and hence the Quad-rotor is required to descend to an altitude of lower then 20ft to
achieve a more accurate result. Descending to altitude lower than 20ft is beneficiary for the
payload deployment because it allows for greater possibility of a safer deployment.
18.1.5 Shape recognation
The shape recognation code was planned to be used to identify the target during flight, when the
Quad-rotor reaches the coordinate set at the ground station using the Mission planner the program
would be able to identify the target and center itself ontop of it. The code measures the properties
of image regions and will scalar the actual number of pixels in the region of the image, which then
can be identified as a shape, in the figure bellow it demontraights its operation. The setback of
running the code during the mission is its time to process the image, in this case it took more then
30mins as the code removes any connected components pixels that have fewer then 60 pixels.

UAS CHALLENGE 2015
81 Image Processing MEng Team Project Report (7ENT1024) School of Engineering and Technology
Normally it is running at a minimum of 20-30 pixels which takes 2-5 minutes, however as the test
will be in an open field the grass causes a lot of interferance during processing hence a higher
pixel setting is required (Samieh, 2007).
The figure below is taken from a height of 22.95cm to resemble 20ft and the size of the box is
10cm by 10 cm to resemble the target of 2m by 2m:
Figure 58 Shape recognition
18.2 Video
The camera model selected for the live feed video to the ground station is through Mobius
ActionCam. The Mobius camera is commonly used on such UAVs, the camera provides a high
quality video feed and the quality can be altered from three possible choices. This can be useful if
needed to transmit over a long range but operating at its highest resolution of 1080p-30fps will be
needed as the ground station is within a reasonable distance and it would need to process the feed
to determine the alphanumeric at the target. The camera is needed to provide a still image of the
target from the Quad-rotor and transmitted to ground station (Mobius, 2015).
The camera has the ability to record while streaming, this would allow for playback of the flight at
another time. However this feature is not crucial but it may be used to analyze the flight condition
of the Quad-rotor. The camera has five video recording cycles’ time settings they are 3, 5, 10,
15mins or “Max”. The max will record until the 4GB memory has reached its limit and if recording at
1080p-30fps that would equate to 30mins of footage this can be increased by the use of an
additional memory card.
Initially Boscam TR1 was going to be used as the FPV camera but this was dismissed as the
camera is not compatible with the minimOSD. The camera would require an additional transmitter
for it to transmit video data from the minimOSD. Mobius ActionCam was then selected for its video
quality its size and weight.

UAS CHALLENGE 2015
82 Image Processing MEng Team Project Report (7ENT1024) School of Engineering and Technology
18.3 On Screen Display Board (OSD) The Quad-rotor will be fitted with On Screen Display bored to view the flight data at the ground
station. The model chosen is the MinimOSD due its compatibility with Pixhawk, configuration ease
and the error indication and warning system (lost GPS fix, over speed, battery voltage and
percentage and the received signal strength indication). The MinimOSD also will display the
direction, altitude, attitude, current waypoint and heading. The displays can be changed by using
MinimOSD-extra Firmware to reprogram the OSD to display additional features such as vertical
speed and way point distance. The OSD must be connected through a FTDI Breakout board which
can then be connected to a computer for programming. The video feed must be connected to the
MinimOSD for it to contain the additional video data provided from pixhawk, the OSD will then
need to be connected to the video transmitter to transmit the video full diagram in (S@M, 2014).
The minimOSD will display the battery life remaining of the Pixhawk, the battery connected to the
Pixhawk will also be supplying power to the video transmitter and servomotor. The setback of this
setup is that at the ground station the user will not be able to observe the battery life of the motors
as they are not connected to pixhwak. The reason for the motors having a separate power source
is due to the fact that the motors are powered by a 5s battery where as Pixhawk can only operate
with a maximum sized battery of 4s.
18.4 Video transmitter The video transmitter Boscam TS351 operates at a frequency of 5.8GHz and transmission range
of 500m with a standard antenna. The transmitter will be mounted on the Quad-rotor legs to reduce
interference with other signal transmitters and receivers. The video transmitter will also be
operating in a vertical polarization position. Transmitter will be powered through the pixhawk
battery however the transmitter will require a voltage regulator to reduce the voltage provided from
the 4s battery to 12v from 14.8v.
18.5 Video Receiver The ground station will receive its video feed through the Boscam RC305 which contains 8
channels that similar to the transmitter, also the frequency band is 5.8GHz. The video receiver will
be connected to an external USB video capture card which will then display the video on the
laptop. The capture card contains its own software where it’s able to play video or toggle the video
stream to capture the image. The benefits this setup is that it allows for the image processing to be
done on one laptop and the mission management on a separate laptop. This will allow for a
delegation of reasonability distributing the work load between two users and will reduce the
possibilities of reduction in laptop performance. The video receiver contains two output pins, this
also allows for an optional additional FPV screen for the pilot, the output of the receiver is an AV
cable for that reason it can easily be connected to an FPV screen but it requires an adapter to
stream video on a laptop.

UAS CHALLENGE 2015
83 Verification and Validation MEng Team Project Report (7ENT1024) School of Engineering and Technology
Section by Tarek 19 Verification and Validation The validation and verification stage is from the V model, which is used in all forms of engineering
projects. The V model operates from a hierarchical perspective starting from requirements,
standards to testing. The benefit of the V model allows for easy tracking of the phase where the
product is currently held, for example when the product reaches the verification stage it measures
how the system was built to the system requirements (Monhem, 2010). The flow direction of the V
model is all interchangeable as after one stage is complete one can check if the outcome suite the
previous stage requirements as it’s a good method of defect tracking. Also it’s a cost effective
method of making sure the right product is built as once the product reaches the validation or
operation stage and spot that it does not match the requirements or regulations this will hinder the
progress of the project.
19.1 Verification Matrix
The verification stages starts off with verifying the systems requirements document and analyzing
the requirements and verify if they satisfied every “shall”, “may”, or “should” statements. The
statements are collected and in a document called Verification Matrix. The document will define
each requirement and the verification method it will show the type of test methods to be carried to
verify the product matches the requirements. The following key terms are used in the Verification
Matrix in Appendix K.1.
Inspection: Visually verify form and configuration of the hardware or software. Inspection involves
the use of measuring tools to retrieve values such as mass, dimensions and other physical
characteristics.
Analysis: includes computation or comparison to previous or experimental data. It verifies the
conformance by the use of analytical tools, modelling or simulations which will allow for a
predication of performance with use of calculation or subsystem testing.
Demonstration: Is to verify the required operability of a software or hardware that does not require
qualitative measurement or the aid of a test device. Test device can be used to contribute to
demonstration of the function.
Test: to verify the conformance of the performance, physical characteristics and characteristics to
requirements with use of technical operates to retrieve detailed quantification of the performance.
19.2 Validation test
The validation tests require relating the results of the verification back to the requirements in
evidence to show the compliance of the product to the requirements and to meet the rules
specified by IMechE. Some of the validation tests are yet to be completed but all the specified
validations in the table will be tested before the competition. The validation table contains the dates
when each test should be carried out are in Appendix K.2. Some of the tests that were carried out
did not meet the requirements and they are rescheduled for testing at a different date after further
development.

UAS CHALLENGE 2015
84 Future work MEng Team Project Report (7ENT1024) School of Engineering and Technology
Section by Tarek 20 Future work The following concepts where considered but where not investigated or developed further because
of complexity, time and mainly due to the limitation of remaining funding. The main reason for not
proceeding with these concepts is due to cost, as the spending on the Quad-rotor is very close to
the maximum value of COTS which is set at £1,000. If the component list goes above the
maximum COTS the Quad-rotor will not be allowed to enter the competition, hence these where
not established or expanded on further due to the cost issue.
20.1 Partial control of Quad-rotor positioning For partial control of the Quad-rotor during the deployment of the payload, it would require an
additional two small motors that allow for the maneuverability of the Quad-rotor in the +x,-x,+y and
–y axis. It was planned for the two motors to be controlled through a Bluetooth connection as the
deployment area to the ground control station is within a 60meters distance. The Bluetooth module
allows for transmission range of up to 60 meters. The motors can be controlled using a mobile
phone or tablets. The Bluetooth module would be connected to an ardunio bored which will allow
for the control of the motors. Pixhawk will still be controlling the altitude and attitude of the Quad-
rotor, this is only possible when the GPS is deactivated allowing for the manual control of the
motors to adjust the positioning of the Quad-rotor (Santos, 2013).
20.2 Full Autonomy To achieve full autonomy the shape recognition code must be used to detect the square target.
The camera can be mounted on a gimbal, which allows for the camera to adjust the target on the
screen by centralizing the target. Then as the gimbal aims towards the target and laser will be
mounted on to the gimbal with another sensor which will pick the laser and that would then operate
the two motors similar to section 20.1but without the need of the Bluetooth receiver. Therefore as
the camera tilt to centralize the target the laser will be pointing at an angle, the laser sensor would
then detect the laser and operate the motors until the Quad-rotor is directly above the target and
the laser is pointing vertically down in the z axis. This would also require deactivating the GPS for a
set time so pixhawk will not correct its positional hold (techbitar, 2013).
Figure 59 Circuit Diagram of Ardunio

UAS CHALLENGE 2015
85 Preliminary Payload Box Concept & Servo Integration
MEng Team Project Report (7ENT1024) School of Engineering and Technology
Section by Micky 21 Preliminary Payload Box Concept & Servo Integration
As part of the UAS design challenge, it has been given out to design a payload delivery system
and mechanism. Initially, 3 methods were considered to in the delivery of the payload which is the
hinge-clamps system, the electro-magnet method and the hinge-pin method. However, following a
radical change in the design of the Hex-rotor with a box capable to accommodate 2 bags, it was
concluded to fit the new Quad-rotor with a box able to accommodate only 1 bag to flour.
21.1 Initial designs
21.1.1 The Hinge-clamp Method
In this concept the bags of flour are to be put in pre-designed cases which have small holes in
which the clamps tooth will integrate. In addition, the cases of different sizes would be superposed,
with the bottom case slightly wider than the top one.
Then, the system would be coupled to a set of 4
clamps actuated by 2 servo motors.
The advantage of the system would be no variation
of the C.G in the XOY plane. In addition, the
structure is robust in case of turbulences, vibrations
or sudden movements
The disadvantage of this method is that the hinge-
clamp and servo motor can be tedious to implement
21.1.2 The electro-magnet method
In this second concept, the pre-designed cases
come with metallic bars placed at precise
places in the 2 cases that is to say; the top case
would have a metallic rod at its bottom top face.
The second case would have 2 metal rods
located at the corners of its top face. The metal
rods would interact with 3 electro-magnet
placed at specific locations on the airframe.
The advantage is that the C.G will not vary in the XOY plane
The main disadvantages of this method are first of all, once the electro-magnet are on, the
magnetic field might interfere with the overall electronics on board. Secondly, the electro-magnet
will drain the power greatly. Finally, the additional rods will add more weight on the UAV and the
structure might not be appropriately robust in turbulence and vibration scenarios.
Figure 60: Hinge clamp
Figure 61: electro-magnet

UAS CHALLENGE 2015
86 Preliminary Payload Box Concept & Servo Integration
MEng Team Project Report (7ENT1024) School of Engineering and Technology
21.1.3 The Hinge-pin method
This last concept relies upon a set of pins
coupled to hinges to release the payload. In
this scenario, the loads are placed beside
each other and one after the other are
released once the UAV arrive at their
respective drop-off point.
The advantage of this system is that it is a
relatively simple system to operate
The disadvantage of this method is that, once a load has been released, it would cause an offset of
the initial centre of gravity point which the UAV would have to adjust and thus, will use the power
greatly.
21.1.4 Others
This design came as the quad was still meant to carry 2 payloads and a set of linear servos.
However, the linear servos was found to be too big, heavy and very expensive. Moreover due to to
weigh restricted it was decided to use only 1 payload at the time.
Figure 63: Other concept
Figure 62: Hinge-pin

UAS CHALLENGE 2015
87 Preliminary Payload Box Concept & Servo Integration
MEng Team Project Report (7ENT1024) School of Engineering and Technology
Section by Micky Conceptual design by Zuber Khan
Actual design by Amit Ramji
Figure 64: CAD
21.1.5 Payload box mechanism integration
A representation of the payload box final designs is as show in Appendix B.7. Once the servo is
powered, it actuates the horn that rotates of an angle of 90 degrees. Subsequently, the movement
release the movable door which lets the bag of flour fall. The detailed design can be found in
section 4.2 and structural analysis in Appendix G.15 to G.16.
Figure 65 to Figure 69 is an illustrative reproduction of the final design carried out in section 4.2,
these aim to show the servo integration.
Figure 65: Overall payload box

UAS CHALLENGE 2015
88 Preliminary Payload Box Concept & Servo Integration
MEng Team Project Report (7ENT1024) School of Engineering and Technology
Figure 66: Horn and door connection
Figure 67: Start up release
Figure 68: Fully Unlocked door
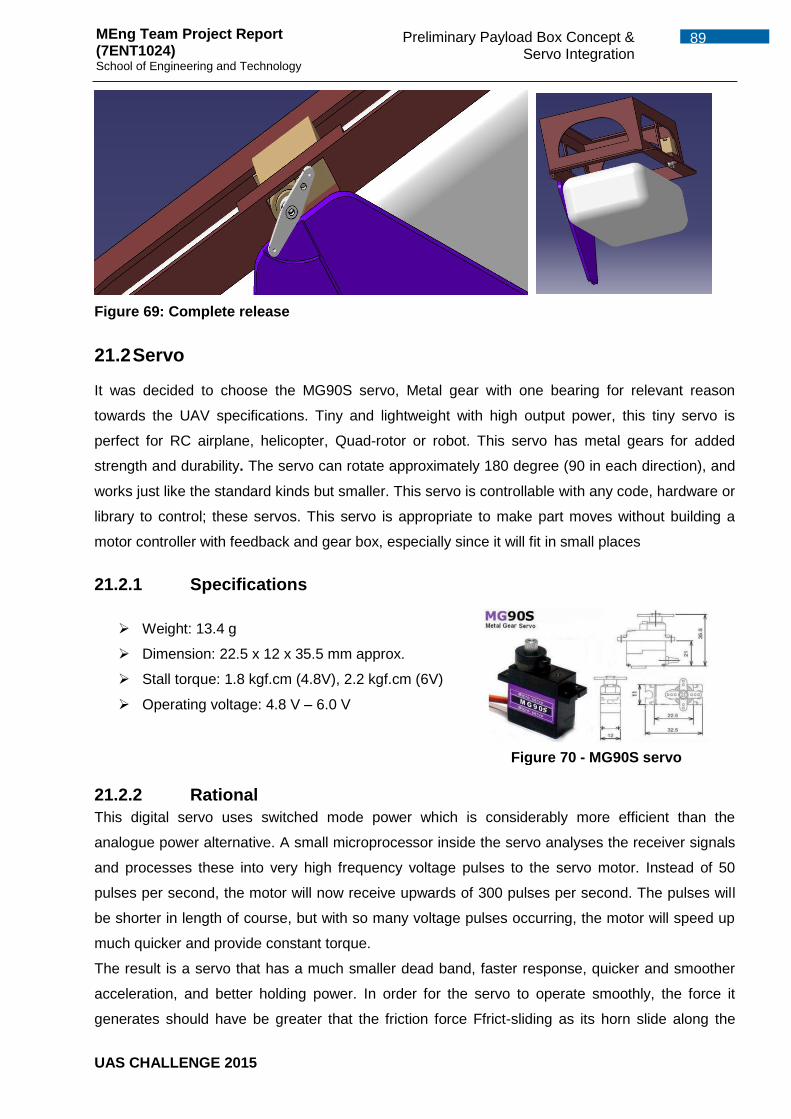
UAS CHALLENGE 2015
89 Preliminary Payload Box Concept & Servo Integration
MEng Team Project Report (7ENT1024) School of Engineering and Technology
Figure 69: Complete release
21.2 Servo
It was decided to choose the MG90S servo, Metal gear with one bearing for relevant reason
towards the UAV specifications. Tiny and lightweight with high output power, this tiny servo is
perfect for RC airplane, helicopter, Quad-rotor or robot. This servo has metal gears for added
strength and durability. The servo can rotate approximately 180 degree (90 in each direction), and
works just like the standard kinds but smaller. This servo is controllable with any code, hardware or
library to control; these servos. This servo is appropriate to make part moves without building a
motor controller with feedback and gear box, especially since it will fit in small places
21.2.1 Specifications
Weight: 13.4 g
Dimension: 22.5 x 12 x 35.5 mm approx.
Stall torque: 1.8 kgf.cm (4.8V), 2.2 kgf.cm (6V)
Operating voltage: 4.8 V – 6.0 V
21.2.2 Rational
This digital servo uses switched mode power which is considerably more efficient than the
analogue power alternative. A small microprocessor inside the servo analyses the receiver signals
and processes these into very high frequency voltage pulses to the servo motor. Instead of 50
pulses per second, the motor will now receive upwards of 300 pulses per second. The pulses will
be shorter in length of course, but with so many voltage pulses occurring, the motor will speed up
much quicker and provide constant torque.
The result is a servo that has a much smaller dead band, faster response, quicker and smoother
acceleration, and better holding power. In order for the servo to operate smoothly, the force it
generates should have be greater that the friction force Ffrict-sliding as its horn slide along the
Figure 70 - MG90S servo

UAS CHALLENGE 2015
90 Preliminary Payload Box Concept & Servo Integration
MEng Team Project Report (7ENT1024) School of Engineering and Technology
payload box door. Thus it should be greater that Ffs = 0.013 Kgf. The calculation can be found in
Appendix M.1
21.3 BEC They require +5V to power the opto-isolator and while the Pixhawk can be powered from the servo
rail, it does not provide +5V to the servo rail. The ESCs must be powered by a BEC or with a
jumper from an unused connector on the board. In this case, it was decided to use an SBEC to
power the electronic rather than a jumper.
Turnigy 5A SBEC is an advanced switching DC-DC regulator which will supply a constant 5A. It
works with 2 - 7 Cell Lipoly pack and supplies a constant 5 or 6v to your receiver and is
interference-free, perfect for confined spaces
21.3.1 Specification
Type: Switching
Input protection: Reverse polarity protection
Output (Constant): 5v/5A or 6v/5A
Input: 8v-26v (2-7cell lipo)
Weight: 18g
21.3.2 Rational
There are 3 main types of power regulator or battery elimition circuit which are BEC, UBEC and
sBEC.
The BEC and the UBEC are good power regulator for small specifications such as those involving
curreent bellow 10A and voltage difference across the BEC less than 5V otherwise there is a risk
of short circuit or melting circuit thus damaging the flight control.
In this case the Swicthing sBEC26 has been chosen because it design make it prone for hight
voltage discharge with considerably less heat emanation thus less waste of power. Moreover, it
can a providd more power throught the intensity of curent it supports. The crucial importance of a
voltage regulator for the system is that the high voltage supplied by the batteries (26 - 18V) would
damage the flight control components which opperates below 6V.
Figure 71 - SBEC26 Turnigy

UAS CHALLENGE 2015
91 Preliminary Payload Box Concept & Servo Integration
MEng Team Project Report (7ENT1024) School of Engineering and Technology
21.4 Schematics of connections from battery to servo through pixhawk
Figure 72: Schematics of connections
The Quad-rotor will run with 2 batteries. The battery pack 1 (18.5V, 16Ah, 3s LiPo) will only run the
motors whereas the RC receiver and the payload servo will be run by the battery pack 2 (11.1V,
2.2Ah, 2s cell LiPo). The reason for this arrangement is that once the motors are switched off, the
flight control system Pixhawk is still reading its mission.

UAS CHALLENGE 2015
92 Preliminary Payload Box Concept & Servo Integration
MEng Team Project Report (7ENT1024) School of Engineering and Technology
The battery pack 2 will power the servo and other receiver through the SBEC which will drop its
voltage to 5V-6V. The SBEC is connected on the AUX OUT pin 6 and the servo will be connected
on the AUX OUT pins from 1~4 since the platform is Arducopter. The RC receiver is connected at
the RC pin.
21.5 Controlling the servo as a servo
Firstly, the Quad-rotor will perform a loiter in a figure of 8 before engaging into releasing the loads.
As the servo will be used to operate the payload box door during the delivery phase, it will be set
as servo in the mission planner of Pixhawk. The way to control a servo under this type only works
as part of the mission that is to say autonomously. To do so, the Pixhawk should be connected to
the mission planner as follow:
On the Config/Tuning > Full Parameter List page, ensure that the RCXX_FUNCTION is set
to zero for the servo that’s to say RC9_FUNCTION as the servo is connected to the
Pixhawk’s AUX OUT 1).
Then Press the Write Params button
Figure 73: Configuration of the servo on Pixhawk
Following Create the mission to be fly and add a DO_SET_SERVO command and include the
servo number ( “10”) in the “Ser No” field and with the PWM value (usually between 1000 ~
2000) in the “PWM” field.
09

UAS CHALLENGE 2015
93 Preliminary Payload Box Concept & Servo Integration
MEng Team Project Report (7ENT1024) School of Engineering and Technology
Figure 74: Mission with GPS dropping points
The DO_SET_SERVO command is a “do command” which means that it can only be run between
waypoints so it must not be the first or last command in the mission. It will be executed
immediately after the waypoint that precedes it. After the first payload is dropped, the Quad-rotor
will return to the ground station location to be fitted with the 2nd payload and perhaps a new battery.
21.6 Testing with the Mission Planner This verification phase involve testing whether the servo are moving as expected. The mission
planner’s Flight Data screen includes a “Servo” tab on the bottom right that can be used to test that
the servos are moving correctly.
Figure 75: Verification of the performance of the Servo

UAS CHALLENGE 2015
94 Other Involvements MEng Team Project Report (7ENT1024) School of Engineering and Technology
Section by Micky 22 Other Involvements
22.1 Telemetry Kit The telemetry kit provides and ground-to-air data link between the auto pilot and your station
laptop or tablet. There are mainly 2 wireless telemetry kits which are a radio set kit and a Bluetooth
data link set. The latter is certainly cheap, however, it is only intended for pre-flight ground use
only, and it is not a replacement for a RC transmitter and receiver. The main disadvantages of the
Bluetooth set are its limited range of around 50m and its overall weight of 9.5 g. Therefore, it would
be appropriate to use a radio set telemetry kit. The 3DR radio set has been chosen for the purpose
of this project and details of the prices of the parts are included below in the Appendix. M The
range of the radio set could be increased by replacing the ducted original antenna with a high gain.
22.2 Design Convergence At the start of the project, we had to go through a design convergence method in order to choose
the right vehicle. I was responsible to look into an osprey design with titling rotors. It was found that
the mechanical design has a high complexity level. Furthermore, my involvement was noted on the
choice of the autopilots which were Ardupilot-Mega and Pixhawk.
22.3 Challenges
It was particularly challenging to find information related to the system integration for many
reasons. First of all, the use of Pixhawk has made it particularly difficult to find and integrate other
system component because it is relatively new. The majority of information available online are
related to APM (ardupilot Mega) which is the earlier version.

UAS CHALLENGE 2015
95 Manufacturing MEng Team Project Report (7ENT1024) School of Engineering and Technology
Section written by Mozammel Material, design and manufacturing decisions by Amit Ramji
Section by Mozammel
23 Manufacturing
In order to achieve an efficient structure, manufacturing methods were identified at a primary stage
of the project. The manufacturing plan included materials to be used, joining methods, machines to
be used and the best possible way to carry out the tasks on time. Initially composite laminates and
tubes were intended to be used however the complexity in manufacturing and cost restrictions did
not allow this.
23.1 Machining Selection
Acknowledging the weight and budget limit for the project, the manufacturing process includes
milling, lathe, laser cutting and CNC machining which are available within the lab facility of the
university.
23.1.1 Machines
The following machines are used to manufacture the parts depending on their operating functions.
Machine Type Functions
Milling machine (Bridgeport Series 2)
Use end mills to obtain precise dimensions
Use centre/slot drill to do holes
Use fly cutter to obtain smooth surface
XYZ 1330 Lathe Use high speed steel tooling to obtain smooth surface
on the nylon 6.6 rod
Use high speed steel tooling to machine centre holes
on the nylon 6.6 rod
Trotec Laser Cutter Use laser to cut the Nylon 2mm thick plate for main
body plate
Vertical Bandsaws machine Use to cut raw materials into required dimensions
Denford Router 2600 Pro Milling Machine
Use to obtain components directly from CAD model
Denford VMC 1300 Milling Machine Use to obtain components directly from CAD model
Table 14: List of Machines
23.1.2 Tools
Tools Functions
1 High Speed Steel Tooling For precise cutting in XYZ 1330 Lathe
2 End mills For precise cutting in milling machine
3 Centre drill For accuracy in drilling holes
4 Slot drills For drilling holes in milling machine
5 Fly cutter(single point) For precise cutting in Bridgeport series 2 milling machine

UAS CHALLENGE 2015
96 Manufacturing MEng Team Project Report (7ENT1024) School of Engineering and Technology
6 Centre Finder Complete To setup the datum (X,Y,Z directions) in XYZ 1330 lathe, Bridgeport series 2 milling machine
7 Metric slip gauges To obtain accurate measurements
8 Precision Parallel Set For accurate setup
9 Micrometre To measure dimensions
Table 15: List of tools and their functions
23.2 Manufacturing process of Quad-rotors components
The machining of the components includes different machines but identifying the most simple yet
better finishing quality was preferred. Due to the limitation of technical facilities and knowledge
components are marginally modified. All the sharp edges are smoothened to obtain edge fillets and
radii features by using sandpaper machine; by doing so the possibility of cracks and fatigues in the
structures is reduced.
23.2.1 Fixed Bracket
The fixed brackets are made of nylon 6.6, which has the favourable
characteristics to hold the arms in place. Also bearing in mind, the
finishing quality is more emphasised and that is why using the milling
machine, the brackets are manufactured. Figure 76: Machined fixed
bracket shows the fixed bracket machined in milling machine.
Due to some limitations in CNC machining, smooth edges were not
obtained as shown in Appendix. N
23.2.2 Motor arm end bracket
The compressive characteristics of nylon 6.6, makes it an ideal
material to be used to securely hold the motors into the motor mount
plates. The brackets are drilled by using end mills of 13 mm diameter
followed by 16 mm diameter. The 3mm diameter holes are drilled
through to be fastened with motor mount plates.
23.2.3 Movable arm vertical fixed bracket /support bracket
From nylon 6.6, the brackets are machined in milling machine as per
the technical drawings. All dimensions are carefully machined
according to the technical drawings but the edge fillets of radii of 12.5
mm were comprised due to complexity and availability of appropriate tools.
Figure 76: Machined
fixed bracket
Figure 77: Machined
end bracket
Figure 78: Machined Fixed bracket

UAS CHALLENGE 2015
97 Manufacturing MEng Team Project Report (7ENT1024) School of Engineering and Technology
23.2.4 Landing gear top/bottom support bracket
Considering the impact of the landing gear, nylon 6.6 (16mm cast sheet)
is used to manufacture the brackets which makes it more reliable to
support the landing gear. The bottom support bracket has a 2 mm
counter bored of 8 mm diameter to attach a spring which has
compression stiffness of 300 N/mm and the damping of 0 N.s/mm. The
spring is considered to withstand the impact from the landing gear which
is bridged between landing gear bottom support bracket and the landing
gear pivot.
23.2.5 Top/Bottom half T-joints
Evidently these parts were the most challenging to manufacture
considering the design detailing. Since the joints are designed to hold
the landing gear strut and stabilizer, the dimensions are critically
important. The parts could have been 3D printed but the materials
properties would have been different since the 3D printer at the
University of Hertfordshire only uses Acrylic.
23.2.6 Landing Gear Lug Bracket/ Pivot
From a 30 mm cast sheet of nylon 6.6, the part is machined to the
designed dimensions by the milling machine. The edge fillets and the
radii were achieved by using the sand paper through visual
inspection.
The landing gear pivot was machined by the lathe machine followed
by the milling machine to get the diameter of 25 mm from 30 mm cast sheet
of nylon 6.6 and the pivotal section respectively. The groove for the spring
was modified by making a counter bored of 2 mm depth.
Refer to 308Appendix. N for the landing gear lug bracket with the landing
gear pivot.
23.2.7 Arm pivot
The arm pivot required two types of machining; centre lathe and milling. The
nylon 6.6 rod was clamped into the four-jaw chuck and the desired length
and diameter was cut by high speed steel tooling; then the rod was
bored 22mm deep and milled 5.5 mm from both sides on the other end.
The remaining flat part was then drilled to make it suitable for pivotal
function for the movable arm.
Figure 79: Machined bottom support bracket
Figure 80:T-joint on foam
Figure 81: Lug bracket
Figure 82: Landing
gear pivot
Figure 83: Arm pivot
for movable arm

UAS CHALLENGE 2015
98 Manufacturing MEng Team Project Report (7ENT1024) School of Engineering and Technology
Section by Mozammel Motor Mounts Manufactured and Assembled by Zuber Khan
23.2.8 Main Body Plate
Due to ease of use in Trotec Laser machine setup, laser cutting was
attempted. Even though accurate dimensions were obtained but during
machining the heat of the laser melted the edges and clear smoke was
observed.
To overcome the challenge of heat damaged edges, the main body
plates were machined in Denford Router 2600 Pro. The advantage of
such machining has high accuracy and the material properties are not
affected as much by any thermal energy; deburr and polishing of sharp
edges was carried out using hand file.
23.2.9 PVCs tubes
All the tubes were roughly cut down by hand and then by lathe machine precise dimensions were
achieved.
23.2.10 Motor mount plate
The positions of the holes are really important as to align with the motors accordingly. The
machining of motor mounts plates were attempted on the CNC machine but since the thickness of
the aluminium plate is 1mm so clamping was not achieved properly with current tool constraints.
Therefore the holes positions were carefully marked by hand and piloted by a 1.5 mm drill and
finished off by a 3 mm drill. Figure 16 shows the brackets are screwed in with the motor mount
plates.
Figure 84: Cutting nylon plate
in Laser machine
Figure 85: Melted edges
Figure 86: Plate after cutting
Figure 88: Motor mount plate Figure 87: Assembled motor mount

UAS CHALLENGE 2015
99 Manufacturing MEng Team Project Report (7ENT1024) School of Engineering and Technology
23.2.11 Overview of Machining
1. Milling Machines (Bridgestone Series 2)
Mostly milling machine is used to obtain precise cutting (by end mills), smooth surface (by fly
cutter), and holes (by centre drill and slot drills). Centre finder complete, precision parallel sets,
micro-meter and metric slip gauges are the usual tools that are used while milling the components.
Refer to Appendix. N for figures of some machined components by milling.
2. XYZ 1330 Lathe
Arms (fixed and movable), arm pivots, landing gear pivot, landing gear strut and stabilizers are
machined in lathe machine. The arms were drilled in 20 mm by a 13mm slot drill on one side to
install the LED lights. The nylon 6.6 rod (diameter of 25mm) was machined to diameter 22 mm by
high speed steel tooling and then bored into 22 mm at the centre of the rod with a diameter of
16mm.Refer Appendix. N for figures regarding lathe machine.
3. Tortec Laser cutter
The laser cutter is used to machine the main body plates but it has been identified that the heat
has melted the edges of the plates so subsequently it is decided to machine on CNC machine
Refer Appendix. N for figures on laser machining set up.
4. Vertical Bandsaws Machine
Vertical bandsaws machine is used to cut the purchased block or sheet (aluminium alloy) into
required dimensions for the components Refer to Appendix. N
5. CNC Machines (Router 2600 Pro and VMC 1300)
CNC machines are used for machining the main body plate and the turn button for payload box
after several practise sessions. Although simulations were carried out to obtain motor mount
plates, brackets and T-joints but unfortunately due to lack of knowledge at that point of time,
machining was countered with many known and unknown errors. Since the building of the Quad-
rotor solely depends on the manufacturing timeline so with the supervision of the technicians
majority of the parts are machined in the milling and lathe machines.
Figure 89.1-3: CNC practice sessions

UAS CHALLENGE 2015
100 Manufacturing MEng Team Project Report (7ENT1024) School of Engineering and Technology
23.3 Challenges
Compared to acrylic and wood foam which are mainly used in practise session, nylon and
aluminium are proven to be hard to machine. Alongside desired tools for clamping, machine
planning and drill sizes were not available during manufacturing. Hence manufacturing of the parts
were mostly dependent on milling and lathe machines and as a result constrained some desired
features of the parts. Pace of manufacturing was also affected as supervision was required while
using the milling and lathe machine in the machine lab.
Below show failed attempts on motor mount when tried on VMC 1300 and router 2600 Pro.
Figure 90.1-3: Failed attempts
23.4 Manufacturing Plan
After the hand calculations and numerical analysis (Finite Element Analysis) carried out by, the
materials were purchased. As shown on the Gantt chart below, practise session is the longest due
to the limited availability of machining lab and lack of hands on experience with the machines. As
per the manufacturing plan the assembly is scheduled to be done on the first week of April.
23.5 Machining Cost
All the components were machined at the university labs thus eliminating any labour and
operational cost for the machines.
23.6 Other involvements in the project
In course of this project and due to the necessity of the project progression, the following
contributions we made.
Design Convergence – Manufacturing techniques for multi-rotors (3-8)
Initial estimation of Cost – Pre-PDR
Conceptual Payload CAD model – Using dimensions of 1 kg flour bag to propose potential
designs
Assisting on Test rig building

UAS CHALLENGE 2015
101 Test Rig MEng Team Project Report (7ENT1024) School of Engineering and Technology
Section by Mohammed Mohinuddin 24 Test Rig
This section comprises intensive testing and manufacture of a 3-axis gimbal test rig. As with any
project of this type, practical testing is vital to collaborate with the theoretical data determined for
the designed product. In general, testing during design of a new product is mandatory to reflect its
key performance factors and capabilities. It is most commonly known that manoeuvrability of a
multi-copter predominantly affects the flight performance. Therefore controlled flight during
manoeuvrability is a major factor to be achieved. In real world applications, achieving a stable
multi-copter during its flight regime is an issue of concern. Design of a test rig would aid in the
demonstration of multi-copter flight within a controlled environment and significantly add advantage
during the testing phase of this project. The test rig will be adopted to demonstrate safe control of
the UAV functions. Hence the design stage of the test rig began with rigorous brainstorming
activities bearing its effectiveness in mind.
To solely rely on systems to operate as efficiently as possible is not good practice, hence testing
the operation of individual system components and post integration would validate the testing
processes. The gimbal test rig would be a beneficial tool for the verification of sub-system tests in
controlled conditions. As part of the competition requirement, the chosen Quad-rotor design is
required to be able to carry two payloads (1kg each bags of flour) and deploy each payload
independently. This independent deployment of payloads at any given time could cause instability
post deployment and hence would affect the weight distribution on the UAS. The stability of the
multi-rotor after imbalance can be verified during testing within the gimbal design discussed later
on. It is anticipated that the test rig will aid to define PID control numbers which will hugely benefit
in the monitoring system and stability side of the project. Although the UAS design specification
does not require building a test rig, it was noted that fabricating a gimbal test rig would be
worthwhile as manoeuvrability and stability of a Quad-rotor is tremendously complex. Therefore a
safe testing method would have to be implemented to avoid damage on such a costly design. The
initial phase of testing using the gimbal test rig aided in the calibration of various sub systems such
as compass, magnetometer, Pixhawk, RC controller, GPS, etc.
24.1 Initial Conceptual Design of Gimbal Test Rig The initial brainstorming for designing a gimbal test rig began with a simplified design that would
establish the gyroscopic motion of the Quad-rotor. The general arrangement with bill of materials
(BOM) for initial conceptual design of the gimbal test rig assembly and further technical drawings
can be found in appendix O.1. However it was brought under notice that this design would be very
heavy and would occupy huge amount of space, therefore to overcome the consequences a more
robust and design specific based on actual Quad-rotor has been designed and is discussed
hereafter.

UAS CHALLENGE 2015
102 Test Rig MEng Team Project Report (7ENT1024) School of Engineering and Technology
24.2 Octagonal Gimbal Test Rig
In order to overcome a few challenges encountered through initial test rig design mentioned above,
a more compact and robust design has been established as shown below in Figure 91. The
principle aim during redesign of the test rig was to reduce the overall space it would require for
storage and also the cost of manufacture. However it was figured out that the test rig would allow
the model to perform movement about all six degrees of freedom i.e. a similar approach like a
gyroscope. (Experimental Aircraft Info, 2006)
Figure 91 - Gyroscope Test Rigs
Majority of aircraft instruments use the basic principle of gyroscopes to control attitude, compass
and turn coordinates. In course of this project construction wise the gyro is fixed in the instrument
by octagonal rings or gimbals as shown in Figure 91and these rings give the gyro certain motions
of freedom. It is these motions or movement in a plane which allow for the features used in these

UAS CHALLENGE 2015
103 Test Rig MEng Team Project Report (7ENT1024) School of Engineering and Technology
instruments. (Project, 2015) The gimbal test rig would utilise gyroscopic motion and is a device that
would be used to measure, maintain orientation and most importantly stabilise the Quad-rotor
under investigation.
Moreover the gimbal test rig’s operation is mainly based on the principle of preserving angular
momentum. The outer gimbal or ring (green coloured frame in Figure 91 which is the gyroscope
frame, is mounted so as to pivot about an axis in its own plane determined by the support from the
stand. This outer gimbal possesses one degree of rotational freedom and its axis possesses none.
The middle gimbal or ring (red coloured frame in Figure 91) is mounted to the outer gimbal so as to
pivot about an axis in its own plane that is always perpendicular to the pivotal axis of the gyroscope
frame (outer gimbal). This middle gimbal has two degrees of rotational freedom. The axle of the
spinning inner most gimbal (blue coloured frame in Figure 91) defines the spin axis. The motors
mounted on the Quad-rotor are coupled to spin about an axis, which is perpendicular to the axis of
the middle gimbal. Overall the entire gimbal test rig is meant to allow freedom of movement in all
yaw, roll and pitch axis. (Turner, 2015) See appendix O.2 for the general arrangement for the
updated octagonal gimbal test rig assembly with its bill of materials.
24.2.1 Octagonal Model Mount Frame
The figure alongside represents the general
arrangement for the model mount frame with
an inner spacing of 1000mm and shows the
necessary components used to construct the
frame. Refer appendix O.3 for detailed
technical drawing of the model mount frame.
The figure shown above validates the required inner length of each of the boxes used to construct
the model mount frame. An internet based octagon edge length calculator was used to obtain the
dimensions during the entire design.
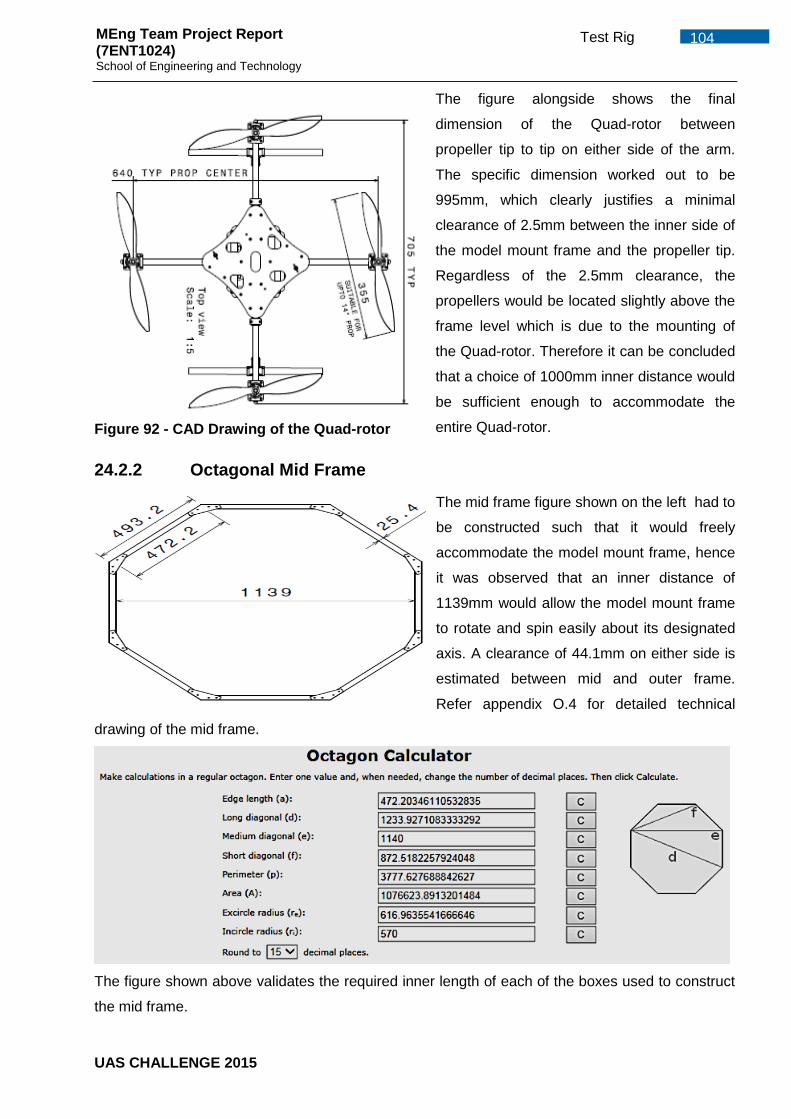
UAS CHALLENGE 2015
104 Test Rig MEng Team Project Report (7ENT1024) School of Engineering and Technology
Figure 92 - CAD Drawing of the Quad-rotor
The figure alongside shows the final
dimension of the Quad-rotor between
propeller tip to tip on either side of the arm.
The specific dimension worked out to be
995mm, which clearly justifies a minimal
clearance of 2.5mm between the inner side of
the model mount frame and the propeller tip.
Regardless of the 2.5mm clearance, the
propellers would be located slightly above the
frame level which is due to the mounting of
the Quad-rotor. Therefore it can be concluded
that a choice of 1000mm inner distance would
be sufficient enough to accommodate the
entire Quad-rotor.
24.2.2 Octagonal Mid Frame
The mid frame figure shown on the left had to
be constructed such that it would freely
accommodate the model mount frame, hence
it was observed that an inner distance of
1139mm would allow the model mount frame
to rotate and spin easily about its designated
axis. A clearance of 44.1mm on either side is
estimated between mid and outer frame.
Refer appendix O.4 for detailed technical
drawing of the mid frame.
The figure shown above validates the required inner length of each of the boxes used to construct
the mid frame.

UAS CHALLENGE 2015
105 Test Rig MEng Team Project Report (7ENT1024) School of Engineering and Technology
24.2.3 Octagonal Outer Frame
The outer frame figure shown alongside had to be
constructed such that it would freely accommodate
the mid frame, hence it was observed that an inner
distance of 1249mm would allow the mid frame to
rotate and spin easily about its designated axis.
Refer appendix O.5 for detailed technical drawing of
the outer frame.
The figure shown above validates the required inner length of each of the boxes used to construct
the outer frame.
24.3 Weight Estimation for Octagonal Test Rig
The spreadsheet in appendix O.7 represents the weight estimation for the entire gimbal test rig
conducted analytically, through CATIA estimation and from supplier data sheet. The entire test rig
frames and stand will be fabricated using 1”x1” aluminium box sections with the brackets
manufactured from 1.2mm aluminium sheet.
24.4 Cost Breakdown for Octagonal Test Rig
The overall cost for manufacturing the gimbal test rig was estimated to be £132.08 inc. VAT and
based on sourcing materials from one supplier named Metals4U. However the cost incurred for
materials purchase was raised through collective funding. The spreadsheet detailing the costing
can be found in appendix O.8.

UAS CHALLENGE 2015
106 Test Rig MEng Team Project Report (7ENT1024) School of Engineering and Technology
24.5 Manufacturing Stage of the Octagonal Test Rig
The entire test rig was fabricated using facilities provided at the university and tools brought from
colleagues. Conversely the initial design for the joint bracket was rectified to produce a much
simpler design to manufacture reducing the costs of water jet cutting. The figures shown below
illustrate the fabricated parts and the entire gimbal test rig assembly. The final test rig was
fabricated under the assistance of almost all the members in the group.
Figure 93 - Test Rig Components
Figure 94 - Test Rig Assembly

UAS CHALLENGE 2015
107 Structural Testing MEng Team Project Report (7ENT1024) School of Engineering and Technology
Section by Mohammed Mohinuddin 25 Structural Testing
In addition to stability checks on the test rig, other tests such as static material tests, impact/ crash
tests are proposed to be conducted. The selected material used as the base plates were tested to
validate its bending capabilities withholding its structural integrity. However further tests were also
proposed to be conducted to improve the performance of the Quad-rotor and to meet the
conformance.
25.1 Material Testing
It was collectively decided in the group that the material to be used for manufacturing the base
plates would be nylon 6. The figures in this section
represent the exact material used Figure 95 and the
manufactured base plate after cut-outs Figure 95
Figure 95 - Nylon Material and Main Body Plate
A compression test, using the Hounsfield 1kN Tensometer, was carried out on the base plate
material as seen in Figure 96 This test simulates the dominant load type experienced by the plates.
It was observed through this analysis that the plate would survive tremendous load and would not
deform permanently which is a justification to the stress analysis carried out in the structural
loading and analysis chapter. The nylon plate sample was tested in two different orientations and
provided reasonable understanding in the plate bending behaviour.
25.2 Component Testing
On receipt of various components such as motors, pixhawk, telemetry kit, GPS and servos, each
component was individually quality
checked and tested for conformance by
the relevant personnel. The motors were
tested to check the amount of current
drawn and to reflect their performance.
The other components were also tested
to check whether they would perform the
tasks they were purchased for.
Figure 96 - Compression Test conducted on Hounsfield Tensometer

UAS CHALLENGE 2015
108 Structural Testing MEng Team Project Report (7ENT1024) School of Engineering and Technology
Section by Osman Sibanda
25.3 Payload Drop Testing
It is anticipated that when an object hits the ground with a speed of 2-5 m/s, it would not cause any
substantial damage to the object withholding its structural integrity. Conversely a simple drop test
was used to replicate that the payload would remain intact after impact. To create the same
amount of energy dissipation in the test as there will be at full load the following calculations were
used. A trial drop test with 1Kg bag of flour was conducted and the following schematic represents
this.
Considering the conservation of energy, the potential energy possessed by the bag of flour will be
converted to kinetic energy on impact neglecting air resistance and heat. The following calculations
denote the possible results to be anticipated.
mgh = 0.5mv2
1x9.81x0.98 = 0.5x1xv2, therefore v= 4.4m/s
Hence it can be concluded through above calculation that the payload remains intact and free from
any substantial damage.
25.4 Initial Ball socket test rig Initially the group had intended to use two test rigs for testing and calibrating the systems in the
multi-copter prior to flying it. The idea of using test rigs was dismissed as the gimbal test rig was
enough to carry out all the testing and calibration
needed. Figure 97 below shows the proposed ball socket
test rig at that stage.
Figure 97 - Initial ball socket test rig

UAS CHALLENGE 2015
109 Business Case MEng Team Project Report (7ENT1024) School of Engineering and Technology
Section by Osman Sibanda
25.5 Manufacturing assistance Due to the amount of work and time needed for manufacturing the Quad-rotor components and
test rig, I was assigned to assist the manufacturing engineer and the testing engineer with the
manufacturing of the UAV and test rig. Refer to manufacturing report for details.
26 Business Case The main part of this report is the business case of our UAS with accordance to the iMechE
requirements. The rest of this report will focus on the business case of our Quad-rotor the
Odonata-XV. Our company name is Autoquads Inspection Ltd.
Figure 98 - Autoquads Inspection Ltd Logo
26.1 Executive Summary Inspections of structures are paramount for the safety of the users and the public on all
infrastructures. Some may have long intervals of inspections but some critical infrastructures
require regular inspections depending on the criticality. The current methods of inspections have
proved expensive and very risky for the inspectors that carry them out.
Autoquads Inspections Ltd proposes using our UAS, the Odonata XV to carry out inspections
autonomously for wind turbines, bridges, rail lines and overhead power lines in the UK with a future
plan of expanding to Europe. The ability for small UAS’s to manoeuvre in confined spaces, hover,
fly at low speeds and altitudes and to perform various manoeuvres at any given time makes them
ideal for inspections tasks. They can provide images in real time and also obtain high resolution
images which can be recorded at the same time for reviewing later on.
The business case will cover the key design features of the UAS and how these features can be
used to our advantage for different inspection purposes. The market research is covered in section
6 of this report and highlights the potential markets that could have been chosen. Also the market
size and predicted market growth by industry experts, regulations involved with this UAS category
and it also covers some of the competition that exists in the market already. The financial forecast
of this project can be found on chapter 26.6. It covers the key assumptions made in calculating the
related costs of this project and how long it would take for the company to break even.

UAS CHALLENGE 2015
110 Business Case MEng Team Project Report (7ENT1024) School of Engineering and Technology
26.2 Business overview Inspections of hard to reach areas (etc. power lines, bridges, wind turbines, roofs) using the
traditional methods has proved to be time consuming, expensive and dangerous in most situations
for the inspectors. Structures exposed to the environmental elements will suffer deterioration over
time and therefore require regular inspection to avoid any serious complications occurring and
interrupting the services being provided.
For power lines the current methods being used are by using helicopters, manually controlled
UAV’s or by line inspectors. The line inspectors usually work from the ground using binoculars and
are sometimes required to climb up the power lines to manually inspect them. This causes major
risks on the line inspectors if the power lines are live and this method is not very reliable. For
example the Killmore bushfire that occurred in Victoria, Australia as a result of poor inspection by
one of the inspectors caused casualties of around 119 people in 2009 (ABC NEWS, 2014). For the
business case of our UAS, Autoquads Inspection Ltd is hoping to enter into the inspection market
which will consist of different infrastructural inspections, which will include overhead power line
inspection, train paths, bridges and wind turbines. The UAS was designed to be able to carry a 1kg
payload and be able to drop it at designated targets autonomously. For the UAS to be used for
inspections, some minor changes will have to made in order to carry our inspections autonomously
this will include adding electro-optic and thermal imaging camera in order to inspect insulations on
power lines.
26.3 Mission statement Currently the inspection market uses manually controlled crafts (helicopters) or linemen on foot.
The existing usage of helicopters with crewmen using binoculars for inspections in some cases is
much more expensive and it’s unlikely to get any cheaper unless new technologies are introduced.
The use of helicopters has also caused a lot of damage to landowners around the power lines
especially to the farmers and their domestic animals. Some farmers have been compensated large
sums of money because of disturbances to the livestock by premature births or because of
stampedes leading to property damage (European Commission, 2014) .The use of linemen on the
ground is time consuming, very risky and very expensive since well qualified personnel have to do
the inspections and are usually paid by the hour. An introduction of autonomous UAS should
significantly cut down costs and at the same time cut down on the time taken to inspect structures.
Autonomous inspections will;
Ensure efficient use of experts by using them only when they are needed
Allow for targeted maintenance by prioritizing maintenance where it’s needed the most
therefore cutting down shutdown times. Longer shutdown of services leads to dissatisfied
customers/clients therefore a possibility for the companies to lose out on competitive
advantage
Reduce labour costs by having less staff to monitor the UAS during inspections

UAS CHALLENGE 2015
111 Business Case MEng Team Project Report (7ENT1024) School of Engineering and Technology
There is less risk involved with the crew and the surrounding environment including animals
Lesser environmental disturbances etc. noise pollution
A costs analysis carried out by Europa that using UAS’s for inspections compared to the other
methods can significantly reduce the costs involved by about a third. (European Commission,
2014)
26.4 UAS key design features The OXV has been designed to be collapsible by allowing 4 of the arms and landing gear to
rotate about pivots. This allows the OXV to fold into linear and compact configuration allowing
for easy transportation and storage as shown in Appendix B.7. The payload housing is
designed to be removable for ease of transport, increased functionality and the ability to attach
various devices as a payload or for this business case an electro optic and thermal imaging
camera would added on for high resolution images and for insulation inspection. The design of
the OXV was a well thought out process in consideration of the maintenance of the UAS. The
UAS is designed with quick release pins to allow the arms of the quad to fold up and also
allows the UAV to be stored in tighter spaces.
The UAS can also be set up for a perch and stare function. This function will allow the UAS to
land somewhere for an extended time for observation and re-launch itself after observing.
26.5 Market Assessment The growing interest/use of autonomous flying has allowed for opportunities in the inspection
sector. Inspections of structures is a growing market with the introduction of UAS’s as it is vital
for inspections of damaged components/parts, insulations, deteriorating parts and overhanging
trees. Rather than using manually controlled drones or using helicopters, the use of UAS’s has
a promise to be more efficient, less costly and less dangerous in this sector. Autoquads
Inspection Ltd aims to provide the best quality of service to its customers. This UAS will greatly
benefit entities that provide Enterprise Asset Management (EAM) for bridges, power lines, train
paths and wind turbines.
26.5.1 Potential market – Emergency Service
Sudden Cardiac Arrest (SCA) - is a condition where the heart suddenly stops beating and
blood to the brain and other organs stops flowing. Abnormal heart beat rhythms are called
arrhythmias; this is when a heart beats too fast, too slow or at irregular rhythms. 95% of people
who suffer Sudden Cardiac Arrest (SCA) die within minutes and for every 1 minute a persona
suffers cardiac arrest their chance of survival is decreased by 10%. (NIH, 2011)
Cardiopulmonary resuscitation (CPR) can be performed on individuals experiencing SCA but
they are not as effective as AED’s. Automatic external defibrillators (AED) are lightweight,
battery operated; portable devices used to measure heart rhythm and can send electric shocks
to restore the heart to normal rhythm. AED’s are very easy to use and also come with

UAS CHALLENGE 2015
112 Business Case MEng Team Project Report (7ENT1024) School of Engineering and Technology
instructions as well as voice commands to alert the user when to send electric shocks. Using
our UAS AED’s can be transported to the patients quickly to deliver the services before the
medics arrive to the scene.
Product Size (H x W x D) (cm) Weight (kg) Average Cost (£)
Zoll AED plus 13.3 x 24.1 x 29.2 3.1 1194
Phillips Heartstart Onsite 19 x 21 x 7 1.5 1199
HeartSine Samaritan PAD 350
AED
20 x 18.4 x 4.8 1.1 kg 1175
Defibtech Lifeline AED 22 x 30 x 7 2 1245
Table 16 Table showing potential AED's
Table 16 shows the potential AED products with the dimensions, weights and the average
costs. This option was not chosen for various reasons including the prices of the AED’s
themselves which are very expensive. The other reason was the time it would take to reach the
patients, the Odonata XV would have been able to reach some patients a little time before the
emergency staff get there but in most cases the emergency staff are improving their response
time therefore this market would not have proved to be profitable over time.
26.5.2 Market size and growth
The emerging UAV technology is to become key in the future competitiveness of the European
aerospace industry compared to other parts of the world. According to (European Commission,
2014) the common European market will offer a solid base to compete globally with other
leading competitors in the world e.g. USA, Israel, Brazil, China and Russia. It is predicted that if
an enabling legal framework is adopted it will furthermore allow the operations and the
manufacturing of the UAV’s to grow from simple operations to more complicated operations
thus allowing the current businesses to gain valuable practical expertise while developing their
businesses. For example in France the number of approved operators rose from 86 to 400
after the introduction of an initial regulation.UK and Sweden has also seen similar growths in
different markets because of an enabling regulation (QinetiQ, 2013).
Industry experts believe it is really difficult to predict the potential UAS’s have globally but it is
currently predicted to be worth about $5.2 billion and it is expected to grow to about $11.6
billion per year in 2023 (QinetiQ, 2013). Further to boosting businesses across Europe the UAV
market is set to increase jobs globally as well. In Europe around 150,000 jobs are forecasted
by 2050 (European Commission, 2014). According to the Scottish Enterprise, the UK has the
most ambitious project for wind farm plans. This therefore means more market for inspection
since operations and maintenance accounts for over a quarter of the lifetime cost of a wind
farm. Analysis by UK Government predicted that the number of wind turbines will increase to
over 5500 by year 2025 with the operations and maintenance claiming £2bn per year from this
business boost.

UAS CHALLENGE 2015
113 Business Case MEng Team Project Report (7ENT1024) School of Engineering and Technology
26.5.3 Regulation restriction
Since this UAS is less than 7Kg MTOM, they will be categorised as a SUA (Small Unmanned
Aircraft) category and should comply with UK Air Navigation Order 2009 articles 138, 166, 167
and CAA CAP 722, and CAP 393. (CAA, 1995)
The following chapter summarizes the UK legal requirements for flying UAV’s in the UK
(Austin, 2010):
The craft should not endanger anyone or anything, including the pilot of the UAV. The pilot
holds the responsibility for the operations to be conducted safely.
The UAV must be in VLOS (visual line of sight taken to be at 122m vertically and 500m
horizontally) of the pilot at all times. For any uses beyond these distances, the pilot must
seek CAA permission and prove the craft can be flown safely at that distance.
CAA permission is required for any aerial work
Should not be flown within restricted airspace
The craft should not be flown;
Above or around 150m of any congested area
Above or around 150m of an assembly of more 1000 people
Around 50m of any vessel, vehicle or structure which is not under the pilot’s control
Within 50m of any person during take-off or landing and within 30m of any persons
during flight except for the pilot
Figure 99 - Permissions required for different UAS sizes
Figure 99 (Austin, 2010) shows the permissions required from the CAA for the different sized
aircrafts. In our case the aircraft is under the 20kg limit therefore the registration and the
airworthiness approval is not required but an operating permission and pilot qualification would
be required.
26.5.4 Challenges for market entry
A lot of factors will heavily affect entering the inspection sector. The biggest challenge would be
the initial capital that would have to be invested in mass production of the Odonata XV. The
subsequent chapters give some details into technological challenges that the organisation
could face;
Safe operation
EU aviation policy defines safety as the paramount objective. The current regulatory system for
UAS based on fragmented rules for ad hoc operational authorizations is an administrative
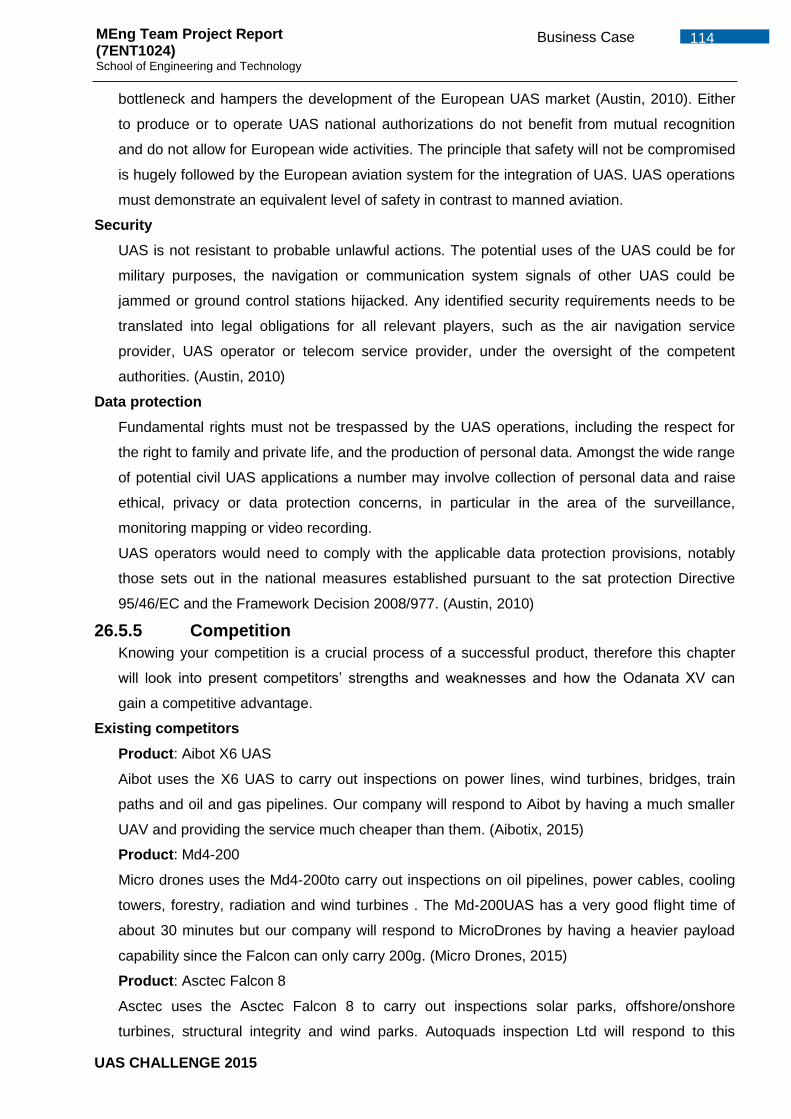
UAS CHALLENGE 2015
114 Business Case MEng Team Project Report (7ENT1024) School of Engineering and Technology
bottleneck and hampers the development of the European UAS market (Austin, 2010). Either
to produce or to operate UAS national authorizations do not benefit from mutual recognition
and do not allow for European wide activities. The principle that safety will not be compromised
is hugely followed by the European aviation system for the integration of UAS. UAS operations
must demonstrate an equivalent level of safety in contrast to manned aviation.
Security
UAS is not resistant to probable unlawful actions. The potential uses of the UAS could be for
military purposes, the navigation or communication system signals of other UAS could be
jammed or ground control stations hijacked. Any identified security requirements needs to be
translated into legal obligations for all relevant players, such as the air navigation service
provider, UAS operator or telecom service provider, under the oversight of the competent
authorities. (Austin, 2010)
Data protection
Fundamental rights must not be trespassed by the UAS operations, including the respect for
the right to family and private life, and the production of personal data. Amongst the wide range
of potential civil UAS applications a number may involve collection of personal data and raise
ethical, privacy or data protection concerns, in particular in the area of the surveillance,
monitoring mapping or video recording.
UAS operators would need to comply with the applicable data protection provisions, notably
those sets out in the national measures established pursuant to the sat protection Directive
95/46/EC and the Framework Decision 2008/977. (Austin, 2010)
26.5.5 Competition
Knowing your competition is a crucial process of a successful product, therefore this chapter
will look into present competitors’ strengths and weaknesses and how the Odanata XV can
gain a competitive advantage.
Existing competitors
Product: Aibot X6 UAS
Aibot uses the X6 UAS to carry out inspections on power lines, wind turbines, bridges, train
paths and oil and gas pipelines. Our company will respond to Aibot by having a much smaller
UAV and providing the service much cheaper than them. (Aibotix, 2015)
Product: Md4-200
Micro drones uses the Md4-200to carry out inspections on oil pipelines, power cables, cooling
towers, forestry, radiation and wind turbines . The Md-200UAS has a very good flight time of
about 30 minutes but our company will respond to MicroDrones by having a heavier payload
capability since the Falcon can only carry 200g. (Micro Drones, 2015)
Product: Asctec Falcon 8
Asctec uses the Asctec Falcon 8 to carry out inspections solar parks, offshore/onshore
turbines, structural integrity and wind parks. Autoquads inspection Ltd will respond to this

UAS CHALLENGE 2015
115 Business Case MEng Team Project Report (7ENT1024) School of Engineering and Technology
competitor by having thermal imaging cameras and by providing our service cheaper because
of the cost of the Odonata XV. (AscTec, 2015)
26.6 Financial Forecasts The financial forecast section will aim to estimate the predictable cost of this project for the next
5 years. The section will cover the assumptions to be made in order to predict some costs,
thee pro-forma income statement, cash flow statement, mass manufacturing costs for the
whole UAS and break-even analysis to predict how long it will take until the company makes
enough money to break even.
26.7 Key assumptions In order to make financial forecasts possible to calculate, a number of assumptions had to be
made. For the company to stay privatised the capital will come from a combination of
sponsorship and bank loans. Assuming 20 Quad-rotors and 1 controller in charge of 4
computers therefore only 5 controllers are needed. These controllers will also be in charge of
system maintenance. Inflation will be assumed to be 3% in the second year and will rise by 1%
yearly. Currently 500MW wind farms cost £50,000 to £100,000 averagely a year, we will
assume the cost to be £50,000 as we’re using a cheaper method (UAS) and to attract
customers (National Grid, 2013).The price of power line inspections is £15.46 per mile
(Network Rail, 2015).
Table 17 below shows the amount of wind farms, overhead power lines, bridges and rail lines
in the UK and how much of the market share Autoquads hopes to take over yearly. Autoquads
Inspection Ltd will aim to acquire 2% of the market share the first year and rising by 2% yearly
onwards except for the windfarms. The windfarms will take time to inspect because each
windfarm will contain several wind turbines that need inspecting, therefore for windfarms an
assumption of 20 (0.5% of market) windfarms for the first year and increasing by 30 yearly.
Amount 2% share
1st
year
4% share
2nd
year
6% share
3rd
year
8% share
4th
year
10% share
5th
year
Cost
(£)
Wind farms 4338 (+3000) 20 50 80 110 140 50000
Overhead power lines
4470 miles (National Grid) 89 178 268 357 447
50
Rail 9788 miles 195 391 587 783 978
200
Bridges 1000 20 40 60 80 100 1000
Cost 1063450 2627100 4190800 5754450 7317950
Table 17 UK market estimation and AIL market share
26.8 Costs Autoquads Inspection Ltd hopes to start with 5 crafts for each infrastructure inspection (20 in
total) to start with for the first year and use them to find efficient ways to undertake tasks. This
plan of introducing a few Quad-rotors for the first year will ensure the company establishes
itself and gets used to the way of working in this sector. This period will also ensure that

UAS CHALLENGE 2015
116 Business Case MEng Team Project Report (7ENT1024) School of Engineering and Technology
whatever challenges that are encountered can be solved and recorded down for future
reference. After the first year the company hopes to introduce 20 more Quad-rotors yearly for
the next four years, this will largely depend on the business growth so when the time comes it
could be more or less than planned. The table below shows the expected costs for the first 5
years;
Fixed Costs Cost (£) Quantity Total (£)
Manufacturing (materials) 1500 20 30000
Machines and tools 10000 1 10000
Infrastructure Equipment (Ground station.…) 50,000 1 50000
Marketing campaign 10000 1 10000
Administrative costs 30000 1 30000
Infrastructure 3000000 1 3000000
Total 3130000
Table 18 Fixed Cost
Running Costs Monthly Cost (£) Yearly Cost (£) 5 year cost
Building Repairs/maintenance 1000 12000 60000
Utility Bills 3000 36000 180000
Controller/Inspectors/Monitors 10000 120000 600000
Maintenance costs 1000 12000 60000
Labour 7000 84000 420000
Training 2000 24000 120000
Miscellaneous (transportation, 1000 12000 60000
Total 25000 300000 1500000
Table 19 Running Costs
Year Cost (£) Addition of new
crafts (£)
Extra Labour
(£)
Inflation Total (£) Information
1 3430000 0
0 3430000 Fixed, infrastructure
2 300000 30000 120000 3% 463500 Pay, maintenance
3 300000 30000 120000 4% 468000 Pay, maintenance
4 300000 30000 120000 5% 472500 Pay, maintenance
5 300000 30000 120000 6% 477000 Pay, maintenance
Total
5311000
Table 20 Yearly Costs

UAS CHALLENGE 2015
117 Business Case MEng Team Project Report (7ENT1024) School of Engineering and Technology
26.8.1 Financial statements
Pro-forma statement
The pro-forma statement table below shows the costs and revenues anticipated for the next 5
years.
Cost/Revenue Year 1 (£) Year 2 (£) Year 3 (£) Year 4 (£) Year 5 (£)
Services revenue 1063450 2627100 4190800 5754450 7317950
Variable cost of services provided 120000 240000 480000 960000 1920000
Fixed cost of services 12000 12000 12000 12000 12000
Gross margin 931450 2375100 3698800 4782450 5385950
Variable operating costs 3130000 270000 510000 990000 1950000
Fixed operating costs 300000 300000 300000 300000 300000
Untaxed income -2498550 1805100 2888800 3492450 3135950
Income tax (40%) - 722040 1155520 1396980 1254380
Net Income -2498550 1083060 1733280 2095470 1881570
Table 21 Pro-forma statement
Cash Flow
The cash flow statement table shows the key costs in and out. The key values in the cash flow
statement are the beginning cash balance and the ending cash balance.
Item Year 1 (£) Year 2 (£) Year 3 (£) Year 4 (£) Year 5 (£)
Beginning Cash balance
0 -2504796.375 -1424444.025 304502.775 2394734.1
Net income after tax -2498550 1083060 1733280 2095470 1881570
Depreciation expense 6246.375 2707.65 4333.2 5238.675 4703.925
Ending Cash balance -2504796.375 -1424444.025 304502.775 2394734.1 4271600.175
Table 22 Cash flow statement
Break even
As shown from the cash flow statement Auto quads Inspection Ltd starts off with nothing (not
including sponsorship and loans) and the ending cash balance is a negative £2.5m, for the
second year the ending cash balance is still negative meaning the company hasn’t started
making profit yet but the value is decreasing. By the end of the third year the ending cash
balance is £304000, this is the break-even point. It will be at this point that the company will
start making profit in this sector, so it will take 3 years for the company to break even.

UAS CHALLENGE 2015
118 Business Case MEng Team Project Report (7ENT1024) School of Engineering and Technology
26.8.2 Profitability
Figure 100 - Break Even Graph
As the graph above shows, the profitability of this business looks promising if everything goes
according to plan. Although the capital is a huge amount it should pay off at the end of the third
year with a profit of £300000 after the capital is paid. Beyond the third year the profit will be
expected to rise steadily for a couple of years then the rise will depend on the market growth at
that time. For the time being though the market looks promising so therefore it can be concluded
that this project will be very profitable.
Business risk assessment
The business risk assessment can be found in Appendix N.1.
-£2.50 -£1.42
£0.30
£2.39
£4.27
-£3
-£2
-£1
£0
£1
£2
£3
£4
£5
1 2 3 4 5
Pro
fit
Mill
ion
s
Years

UAS CHALLENGE 2015
119 Conclusion MEng Team Project Report (7ENT1024) School of Engineering and Technology
Conclusion As part of the University’s academic curriculum, engineering projects at Masters Level have both a
documentation aspect (Dissertation or Report) and a physical aspect (product development and
testing); both aspects of the UAS Challenge project were carried out successfully under the
guidance of supervisors and technicians. The UAS challenge is a 1st generation IMechE
competition for Unmanned Aircraft Systems making this project the first of its kind in the University
of Hertfordshire. The UAS was designed and built to have real-world applications and this was
quantified through numerous validation and verification tests as well as quality control processes.
The UAS challenge project was carried out by a team of 12 aerospace engineers who worked
industriously in order to meet the project deadlines and objectives over a course of seven months
to deliver a top-tier product. In order to successfully deliver this project, product development
processes were integrated into the project phases through the creation of the design specification
which was used to keep engineering design process in line with rules from CAA and IMechE.
The management of the project was very professional as the meetings were held with supervisors
to discuss potential project pitfalls and solutions. The project manager also created a project plan
and budget plan to keep the project on schedule and on budget. Project management processes
such as QFD and WBS was used in the requirement analysis carried out on the design
specification in order to determine the right aerial vehicle to use for meeting the requirements.
Frequent requirement analysis were carried out in order to make sure that the product being
development meets the requirements and the management model used is a form of the “V” model.
An example is the change from a quadcopter to a hexacopter after the results of a structural
analysis showed that the weight limit set by IMechE would be exceeded. Another example is the
switch from Arducopter Autopilot System to Pixhawk Autopilot System after critical analysis
showed that processing capacity, safeguard measures and competency of the Pixhawk Autopilot
System was significantly higher than the Pixhawk Autopilot System.
The technical approach to the project was very professional and conservative as every process is
documented properly for analysis and this is shown in the level of testing carried out on electronic
components and the structural analysis of the UAS materials and components (Finite Element
Analysis and Bending Tests). The selection of materials used for manufacture was done after
meticulously analysing different materials and comparing them in areas such as strength and price,
this resulted in the manufacture of a structure below the weight limit. Catia and Ansys were used to
design the UAV structural components and Mission Planner software was used to program the
Autopilot System and every other programmable component. A control system operating manual
was created to enable non-system group members would be able to use the UAS control systems.

UAS CHALLENGE 2015
120 Conclusion MEng Team Project Report (7ENT1024) School of Engineering and Technology
Safety regulations were followed in the course of the project such as following all laboratory
regulations when using the facilities for manufacturing, assembly and testing and also designing
the UAS according to regulations set by IMechE and CAA. Failsafe have been programmed into
the UAS for safe operation and recovery when failsafe conditions such as loss of GPS, loss of
communication are activated.
The project’s objective has been met as the UAV is below the weight limit set by the IMechE and
can also be certified by the CAA. The UAS is also capable of a number of flight modes such as
autonomous flight, semi-manual and manual flight. The project budget was also not exceeded and
the UAS has been built and tested a couple of times. This project would serve as a foundation and
legacy to future generations of aerospace engineers that would partake in the UAS challenge from
University of Hertfordshire in the hope of reaching and surpassing the levels reached in the course
of this project.

UAS CHALLENGE 2015
121 REFERENCES MEng Team Project Report (7ENT1024) School of Engineering and Technology
REFERENCES 3DR Robotics. (2015, April 13). IRIS+. Retrieved April 17, 2015, from 3drobotics:
http://whois.domaintools.com/3drobotics.com
3DR Robotics. (2015, January 08). Tuning. Retrieved April 7th, 2015, from ardupilot: http://copter.ardupilot.com/wiki/configuration/tuning/
3DRobotics. (2015). Altitude Hold Mode. Retrieved 03 23, 2015, from http://copter.ardupilot.com/wiki/altholdmode/
3DRobotics. (2015). Verifying performance with dataflash logs. Retrieved 04 03, 2015, from http://copter.ardupilot.com/wiki/flying-arducopter/flight-modes/stabilize-mode/#Tuning_Parameters
ABC NEWS. (2014, June 11). Retrieved March 30, 2015, from ABC News website: http://www.abc.net.au/news/2014-06-11/black-saturday-bushfires-largest-class-action-enters-final-week/5516648
Aibotix. (2015). Aibox international. Retrieved March 30, 2015, from aibotix.com: https://www.aibotix.com/en/industry.html
Ananda, G. (2015). UIUC Propeller Database. Retrieved 04 04, 2015, from http://m-selig.ae.illinois.edu/props/propDB.html
andy, D. (2014). reddit. Retrieved 04 07, 2015, from http://www.reddit.com/r/Multicopter/comments/2fg4pu/calculating_forward_velocity_for_Quad-rotor_design/
APM Plane. (2014). Complete Parameter List. Retrieved December 02, 2014, from http://plane.ardupilot.com/wiki/arduplane-parameters/
Ardupilot. (2015). Automode. Retrieved April 04th, 2015, from http://copter.ardupilot.com/wiki/flying-arducopter/flight-modes/auto-mode/
ardupilot. (n.d.). Pixhawk Overview. Retrieved February 2, 2015, from http://copter.ardupilot.com/wiki/common-autopilots/common-pixhawk-overview/
AscTec. (2015). Ascending Techologies. Retrieved March 30, 2015, from asctec.de: http://www.asctec.de/en/asctec-professional-line/
Austin, R. (2010). Unmanned Aircraft Systems. West Sussex: John Wiley and Sons.
Bailey, D. (2003). Path Loss. In Practical Radio Engineering and Telemetry for Industry (pp. 71-76). Oxford: Elsevier Science & Technology.
Barragan, D. (2014). mathworks: Optical Character Recognition . Retrieved Ferbruary 2, 2015, from http://www.mathworks.com/matlabcentral/fileexchange/18169-optical-character-recognition-ocr/content/OCR/OCR.m
Bernhard, M. (2009). rc universe. Retrieved 12 24, 2014, from http://www.rcuniverse.com/forum/brushed-brushless-motors-speed-controls-gear-drives-123/9016420-brushless-motor-rpm-formula.html
CAA. (1995). UNMANNED AIRCRAFT AND AIRCRAFT SYSTEMS. Retrieved March 25, 2015, from caa.co.uk: http://www.caa.co.uk/default.aspx?catid=1995

UAS CHALLENGE 2015
122 REFERENCES MEng Team Project Report (7ENT1024) School of Engineering and Technology
Civil Aviation Authority. (2012, 07 10). Unmanned Aircraft System Operations in UK Airspace – Guidance. Retrieved 12 13, 2014, from http://www.caa.co.uk/docs/33/CAP%20722%20Sixth%20Edition%20March%202015.pdf
Copter.Ardupilot. (2015). Stabilize Mode. Retrieved April 19th, 2015, from http://copter.ardupilot.com/wiki/flying-arducopter/flight-modes/stabilize-mode/
Copter.ardupilot.com. (2015). Loiter Mode | Copter. Retrieved march 23, 2015, from http://copter.ardupilot.com/wiki/flying-arducopter/flight-modes/loiter-mode/#Tuning
Corneliussen, R. (2002). Nylon 66 Molding Compound. Retrieved 03 30, 2015, from maropolymeronline.com: http://www.maropolymeronline.com/Properties/nylon_66_properties.asp
Datasheet, N. 6. (2015). Direct Plastic Limited. Retrieved 02 10, 2015, from directplastics.co.uk: http://www.directplastics.co.uk/nylon-6.6-sheet
Datasheet, N. 6. (2015). Direct Plastic Limited. Retrieved 02 10, 2015, from www.directplastics.co.uk: http://www.directplastics.co.uk/nylon-6.6-rod.
Datasheet, N. 6. (2015). Direct Plastics Limited. Retrieved 02 10, 2015, from www.directplastics.co.uk: http://www.directplastics.co.uk/nylon-6-sheet
Ditom. (2014). Qualification Test Plan. Retrieved 04 10, 2015, from http://www.ditom.com/space/wp-content/uploads/2015/01/Qualification-Test-Plan.pdf: http://www.ditom.com/space/wp-content/uploads/2015/01/Qualification-Test-Plan.pdf
European Commission. (2014, April 8). Retrieved March 05, 2015, from Europa.eu: http://ec.europa.eu/transport/modes/air/doc/com(2014)207_en.pdf
Experimental Aircraft Info. (2006). Gyroscopic Principles. Retrieved 03 20, 2015, from experimentalaircraft.info: http://www.experimentalaircraft.info/articles/aircraft-gyroscopic-principles.php
google. (2015). maps. Retrieved 02 01, 2015, from https://www.google.co.uk/maps/@51.6637479,-0.0803102,13z
Hart, D. K. (2013). Propeller Perfomance . Retrieved 02 01, 2015, from http://www.studynet1.herts.ac.uk/crs/13/6ENT1010-0906.nsf/Teaching+Documents?Openview&count=9999&restricttocategory=main
Hove. (2013). PID tuning, how “I did it my way”. Retrieved 02 17, 2015, from http://blog.pistuffing.co.uk/pid-tuning-how-i-did-it-my-way/
Khan, M. (2014). Quad-rotor Flight Dynamics. Retrieved 08 01, 2014, from http://www.ijstr.org/final-print/aug2014/Quad-rotor-Flight-Dynamics.pdf
Mathworks. (2014). MATLAB And Simulink Student Design Challenge Winners. Retrieved April 11th, 2015, from http://uk.mathworks.com/academia/student-challenge/spring-2014/
Micro Drones. (2015). Drone based aerial inspection. Retrieved March 30, 2015, from microdrones.com: http://www.microdrones.com/en/applications/areas-of-application/inspection/
mit education. (2012). Retrieved 01 07, 2014, from http://web.mit.edu/16.unified/www/FALL/thermodynamics/notes/node86.html
Mobius. (2015). Instruction Manual for the Mobius ActionCam. Retrieved Aprial 08, 2015, from http://www.mytempfiles.info/mobius/MobiusManual.pdf

UAS CHALLENGE 2015
123 REFERENCES MEng Team Project Report (7ENT1024) School of Engineering and Technology
Monhem, R. (2010). The V Model in Service Management. Retrieved March 28, 2015, from http://rmonhem.blog.com/2010/11/23/the-v-model-in-services-management/
National Grid. (2013). Striving to meet customer needs while reducing costs and maintaining reliability. Retrieved March 30, 2015, from nationalgridconnecting.com: http://www.nationalgridconnecting.com/striving-to-meet-customer-needs-while-reducing-costs-and-maintaining-reliability/
Network Rail. (2015). Display Report : National rail trends. Retrieved March 30, 2015, from dataportal.orr.gov.uk: http://dataportal.orr.gov.uk/displayreport/report/html/c35e0c28-324f-4168-81b9-be197963f251
NIH. (2011, December 2). What is an AED? Retrieved March 30, 2015, from nhlbi.nih.gov: http://www.nhlbi.nih.gov/health/health-topics/topics/aed
Norris, D. (2012). In r. stewart (Ed.), Build your own Quad-rotor (pp. 95-128). New york: Mc Graw Hill.
Oscar. (2013, 10 13). Quad-rotor PID Explained and Tuning. Retrieved 01 24, 2015, from http://blog.oscarliang.net/: http://blog.oscarliang.net/Quad-rotor-pid-explained-tuning/
Physics. (2014). Retrieved 12 01, 2014, from http://www.physicsclassroom.com/class/circles/Lesson-1/Speed-and-Velocity
Plane.Ardupilot. (2014). Advanced Failsafe Configuration. Retrieved November 31, 2014, from http://plane.ardupilot.com/wiki/advanced-failsafe-configuration/
Project, W. D. (2015). Gyroscope. Retrieved 03 23, 2015, from demonstrations.wolfram.com: http://demonstrations.wolfram.com/Gyroscope/
QinetiQ. (2013). Civil Commercial UAV market. Retrieved March 30, 2015, from uas.qinetiq.com: http://www.uas.qinetiq.com/Documents/civil-commercial-uav-market.pdf
rc groups. (2008). Retrieved 09 05, 2014, from http://www.rcgroups.com/forums/showthread.php?t=1646919
robotics. (2014). Retrieved 02 01, 2015, from http://robotics.stackexchange.com/questions/2704/Quad-rotor-forward-speed
Rogershobbycenter.com. (n.d.). A Guide to Understanding LiPo Batteries. Retrieved 02 25, 2015, from http://www.rogershobbycenter.com/lipoguide/
S, J. (2014). physics forums. Retrieved 12 01, 2014, from https://www.physicsforums.com/threads/propeller-and-thrust.143230/
S, J. (n.d.). Propeller and thrust. Retrieved from Physics Forums: https://www.physicsforums.com/threads/propeller-and-thrust.143230/
S@M. (2014). samaritakis: How to connect Mobius camera – Boscam FPV – MinimOSD (noise problems, solution). Retrieved Aprial 8, 2015, from http://blog.samaritakis.gr/connect-mobius-camera-boscam-fpv-minimosd-problems-solutions/
Samieh, A. (2007). mathworks: Shape Recognition. Retrieved January 26, 2015, from http://www.mathworks.com/matlabcentral/fileexchange/15491-shape-recognition
Santos, R. (2013). randomnerdtutorials: Arduino – Control 2 DC Motors Via Bluetooth (Perfect To Build a Robot). Retrieved March 23, 2015, from http://randomnerdtutorials.com/arduino-control-2-dc-motors-via-bluetooth/

UAS CHALLENGE 2015
124 REFERENCES MEng Team Project Report (7ENT1024) School of Engineering and Technology
schoolworkhelper.net. (2014). Nylon: Background, Dangers, Disposal. Retrieved 03 23, 2015, from http://schoolworkhelper.net/nylon-background-dangers-disposal/
sengpielaudio. (2015). Retrieved 07 02, 2014, from http://www.sengpielaudio.com/calculator-ohm.htm
Smith, B. (n.d.). THE SAFE AND EFFECTIVE USE OF LITHIUM POLYMER BATTERIES IN MODEL. Retrieved 03 25, 2015, from http://www.doddington-kent.org.uk/MMFC/images/front_page_pics/Battery%20Safety%20Booklet%20-%20June%202014.pdf
Staples, G. (2014, 12 12). electric rc aircraft guy. Retrieved from http://www.electricrcaircraftguy.com/2013/09/propeller-static-dynamic-thrust-equation.html#.VTZnipWBHIU
techbitar. (2013). instructables: Face detection and tracking with Arduino and OpenCV. Retrieved March 16, 215, from http://www.instructables.com/id/Face-detection-and-tracking-with-Arduino-and-OpenC/?ALLSTEPS
Turner, G. (2015). Gyroscopes. Retrieved 03 26, 2015, from gyroscopes.org.uk: http://www.gyroscopes.org.uk/how.asp
UK CAA Safety and Airspace Regulation Group. (2014, 02 09). UK UAS Operations. Retrieved 02 15, 2015, from http://jarus-rpas.org/pdf/2_Workshop_140319/2014_Presentation_01_Corbett-Gerry_CAA_UK.pdf
University of Michigan. (1996, August 26th). PID Tutorial. Retrieved March 16th, 2015, from University of Michigan: http://www.ee.usyd.edu.au/tutorials_online/matlab/PID/PID.html
unmannedtechshop. (2015). 3DR uBlox GPS with Compass Kit. Retrieved 03 02, 2015, from https://store.3drobotics.com/products/3dr-gps-ublox-with-compass
unmannedtechshop. (2015). ARDUPILOT MEGA MINIM OSD V1.2. Retrieved 04 15, 2015, from http://www.unmannedtechshop.co.uk/ardupilot-mega-minim-osd-v1-2/
Wyatt, D., & Tooley, M. (2008). Electrical and magnetic fi elds . In E. S. Books (Ed.), Aircraft Electrical and Electronic Systems: Principles, Maintenance and Operation (pp. 337-352). Oxford: Elsevier Ltd.

UAS CHALLENGE 2015
125 MEng Team Project Report (7ENT1024) School of Engineering and Technology
Appendix. A
A.1. Initial Project Plan
[PAGE INTENTIONALLY LEFT BLANK]

ID Task Name Duration Start Finish
0 UAS Challenge Project Plan 191 days Fri 10/10/14 Sun 05/07/151 Scope 15 days Fri 10/10/14 Thu 30/10/142 Determine project scope 3 days Fri 10/10/14 Tue 14/10/143 Define resources 12 days Wed 15/10/14 Thu 30/10/144 Scope complete 0 days Thu 30/10/14 Thu 30/10/145 Sponsorship 97 days Fri 10/10/14 Sun 22/02/156 Secure project sponsorship 97 days Fri 10/10/14 Sun 22/02/157 Design Specification/System
Requirements12 days Fri 31/10/14 Sun 16/11/14
8 Create Design specification for a UAV 7 days Fri 31/10/14 Sun 09/11/14
9 Review system specifications 7 days Sun 09/11/14 Sun 16/11/1410 Create system requirements 12 days Fri 31/10/14 Sun 16/11/1411 Obtain approvals to proceed (concept,
timeline, budget)12 days Fri 31/10/14 Sun 16/11/14
12 Analysis complete 0 days Sun 16/11/14 Sun 16/11/1413 Preliminary Design 16 days Sun 16/11/14 Fri 05/12/1414 Review specifications 15 days Sun 16/11/14 Thu 04/12/1415 Payload Delivery System 15 days Sun 16/11/14 Thu 04/12/1416 Propulsion System design 15 days Sun 16/11/14 Thu 04/12/1417 Systems design 15 days Sun 16/11/14 Thu 04/12/1418 Concept Structural design 15 days Sun 16/11/14 Thu 04/12/1419 Preliminary Safety Case consideration 15 days Sun 16/11/14 Thu 04/12/1420 Preliminary Weights estimation 15 days Sun 16/11/14 Thu 04/12/1421 Obtain approval to proceed 15 days Sun 16/11/14 Thu 04/12/1422 Preliminary Design complete 0 days Thu 04/12/14 Thu 04/12/1423 Deliver PDR to IMeche 0 days Fri 05/12/14 Fri 05/12/1424 Final Design ready for purchase 8 days Fri 05/12/14 Tue 16/12/1425 System compents finalised ready for
purchase 7 days Fri 05/12/14 Mon 15/12/14
26 Propulsion components ready for purchase
7 days Fri 05/12/14 Mon 15/12/14
27 Structrual material and sizing ready forpurchase
7 days Fri 05/12/14 Mon 15/12/14
28 Design purchase readyness 0 days Tue 16/12/14 Tue 16/12/1429 Order parts 30 days Tue 16/12/14 Mon 26/01/1530 Send out order list for components and
delivery30 days Tue 16/12/14 Mon 26/01/15
31 Manufacturing & Assembly 47 days Mon 26/01/15 Tue 31/03/1532 Machine structural frame 26 days Mon 26/01/15 Sat 28/02/1533 Integrate systems components 26 days Mon 26/01/15 Sat 28/02/1534 Integrate structural frame, system and
propulsion components 23 days Sun 01/03/15 Tue 31/03/15
35 Testing and Validation 47 days Mon 26/01/15 Tue 31/03/1536 Develop unit test plans using design
specifications47 days Mon 26/01/15 Tue 31/03/15
37 Develop integration test plans using design specifications
47 days Mon 26/01/15 Tue 31/03/15
38 Integration Testing 67 days Sun 01/03/15 Sun 31/05/1539 Test system integration 23 days Sun 01/03/15 Tue 31/03/1540 Integration testing complete 0 days Sun 31/05/15 Sun 31/05/1541 Critical Design Review (CDR) and
Flight Readiness Review (FRR)40 days Mon 09/03/15 Fri 01/05/15
42 Draft CDR report 0 days Mon 09/03/15 Mon 09/03/1543 Draft FRR report 0 days Mon 09/03/15 Mon 09/03/1544 Deliver CDR report 0 days Mon 06/04/15 Mon 06/04/1545 Deliver FRR report 0 days Fri 01/05/15 Fri 01/05/1546 Pre-Competition 26 days Mon 01/06/15 Sun 05/07/1547 Design Presentation 6 days Mon 01/06/15 Sun 07/06/1548 Flight Readiness Review 6 days Mon 08/06/15 Sun 14/06/1549 Certification Test Flight 11 days Mon 15/06/15 Mon 29/06/1550 Competition day 3 days Wed 01/07/15 Fri 03/07/15
Scope complete 30/10Scope complete
Analysis complete 16/11
Preliminary Design complete 04/12
Deliver PDR to IMeche 05/12
Design purchase readyness 16/12
Draft CDR report 09/03
Draft FRR report 09/03
Deliver CDR report 06/04
Deliver FRR report 01/05
T W T F S S M T W T F S S M T W T F S S M T W T F S S M T W T F S S M T W T F25 Aug '14 15 Sep '14 06 Oct '14 27 Oct '14 17 Nov '14 08 Dec '14 29 Dec '14 19 Jan '15 09 Feb '15 02 Mar '15 23 Mar '15 13 Apr '15 04 May '15 25 May '15 15 Jun '15 06 Jul '15
Task
Split
Milestone
Summary
Project Summary
External Tasks
External Milestone
Inactive Task
Inactive Milestone
Inactive Summary
Manual Task
Duration-only
Manual Summary Rollup
Manual Summary
Start-only
Finish-only
Deadline
Progress
Page 1
Project: UAS Challenge Project PlaDate: Wed 03/12/14

UAS CHALLENGE 2015
127 MEng Team Project Report (7ENT1024) School of Engineering and Technology
A.2. Up to date Project plan
[PAGE INTENTIONALLY LEFT BLANK]

ID Task Mode
Task Name Duration Start Finish
1 Scope 15 days Fri 10/10/14 Thu 30/10/142 Determine project scope 3 days Fri 10/10/14 Tue 14/10/143 Define resources 12 days Wed 15/10/14 Thu 30/10/144 Scope complete 0 days Thu 30/10/14 Thu 30/10/145 Sponsorship 97 days Fri 10/10/14 Sun 22/02/156 Secure project sponsorship 97 days Fri 10/10/14 Sun 22/02/157 Design Specification/System
Requirements12 days Fri 31/10/14 Sun 16/11/14
8 Create Design specification for a UAV7 days Fri 31/10/14 Sun 09/11/149 Review system specifications 7 days Sun 09/11/14 Sun 16/11/14
10 Create system requirements 12 days Fri 31/10/14 Sun 16/11/1411 Obtain approvals to proceed
(concept, timeline, budget)12 days Fri 31/10/14 Sun 16/11/14
12 Analysis complete 0 days Sun 16/11/14 Sun 16/11/1413 Preliminary Design 16 days Sun 16/11/14 Fri 05/12/1414 Review specifications 15 days Sun 16/11/14 Thu 04/12/1415 Payload Delivery System 15 days Sun 16/11/14 Thu 04/12/1416 Propulsion System design 15 days Sun 16/11/14 Thu 04/12/1417 Systems design 15 days Sun 16/11/14 Thu 04/12/1418 Concept Structural design 15 days Sun 16/11/14 Thu 04/12/1419 Preliminary Safety Case consideration15 days Sun 16/11/14 Thu 04/12/1420 Preliminary Weights estimation15 days Sun 16/11/14 Thu 04/12/1421 Obtain approval to proceed 15 days Sun 16/11/14 Thu 04/12/1422 Preliminary Design complete 0 days Thu 04/12/14 Thu 04/12/1423 Deliver PDR to IMeche 0 days Fri 05/12/14 Fri 05/12/1424 Final Design ready for purchase8 days Fri 05/12/14 Tue 16/12/1425 System compents finalised
ready for purchase 7 days Fri 05/12/14 Mon 15/12/14
26 Propulsion components readyfor purchase
7 days Fri 05/12/14 Mon 15/12/14
27 Structrual material and sizing ready for purchase
7 days Fri 05/12/14 Mon 15/12/14
28 Design purchase readyness 0 days Tue 16/12/14 Tue 16/12/1429 Order parts 30 days Tue 16/12/14 Mon 26/01/1530 Send out order list for
components and delivery55 days Tue 16/12/14 Mon 02/03/15
31 Manufacturing & Assembly 47 days Mon 26/01/15 Tue 31/03/1532 Machine structural frame 26 days Mon 09/03/15 Mon 13/04/1533 Integrate systems
components 26 days Mon
09/03/15Mon 13/04/15
34 Integrate structural frame, system and propulsion components
23 days Mon09/03/15
Wed 08/04/15
35 Testing and Validation 47 days Mon 26/01/15 Tue 31/03/1536 Develop unit test plans using
design specifications37 days Mon
26/01/15Tue 17/03/15
37 Develop integration test plans using design specifications
37 days Mon26/01/15
Tue 17/03/15
38 Integration Testing 37 days Sun 01/03/15 Mon 20/04/1539 Test system integration 23 days Mon 09/03/15 Wed 08/04/1540 Integration testing complete 0 days Mon 20/04/15 Mon 20/04/1541 configure PID for Quad 67 days Sun 01/03/15 Mon 01/06/1542 Critical Design Review (CDR)
and Flight Readiness Review (FRR)
71 days Mon09/03/15
Mon 15/06/15
43 Draft CDR report 0 days Mon 09/03/15 Mon 09/03/1544 Deliver CDR report 0 days Wed 01/04/15 Wed 01/04/1545 Draft FRR report 11 days Mon 18/05/15 Sun 31/05/1546 Deliver FRR report 0 days Mon 15/06/15 Mon 15/06/1547 Pre-Competition 15 days Mon 15/06/15 Fri 03/07/1548 Design Presentation 0 days Wed 01/07/15 Wed 01/07/1549 Flight Readiness Review 0 days Wed 01/07/15 Wed 01/07/1550 Certification Test Flight 11 days Mon 15/06/15 Mon 29/06/1551 Competition day 3 days Tue 30/06/15 Thu 02/07/1552 UAS CHALLENGE FINISH 0 days Fri 03/07/15 Fri 03/07/15
0%
100%100%
100%
Scope complete 0%Scope complete
0%
0%
100%
100%100%
100%100%
100%
100%
Analysis complete 100%
100%
100%
100%
100%
100%
100%
100%
100%
100%
Preliminary Design complete 100%
Deliver PDR to IMeche 100%
100%
100%
100%
100%
Design purchase readyness 100%
100%
100%100%
0%
0%
0%
0%
0%
50%
50%
0%
0%
Integration testing complete 75%
0%
Draft CDR report 0%
Deliver CDR report 0%
15/06
0%
Design Presentation 01/07
Flight Readiness Review 01/07
0%
UAS CHALLENGE FINISH 03/07
15 22 29 06 13 20 27 03 10 17 24 01 08 15 22 29 05 12 19 26 02 09 16 23 02 09 16 23 30 06 13 20 27 04 11 18 25 01 08 15 22 29 06 13Sep '14 Oct '14 Nov '14 Dec '14 Jan '15 Feb '15 Mar '15 Apr '15 May '15 Jun '15 Jul '15
Task
Split
Milestone
Summary
Project Summary
External Tasks
External Milestone
Inactive Task
Inactive Milestone
Inactive Summary
Manual Task
Duration-only
Manual Summary Rollup
Manual Summary
Start-only
Finish-only
Deadline
Progress
Page 1
Project: Updated UAS Challenge PDate: Thu 23/04/15

UAS CHALLENGE 2015
129 MEng Team Project Report (7ENT1024) School of Engineering and Technology
A.3. Example of Minutes
[PAGE INTENTIONALLY LEFT BLANK]

Supervisors meeting |MINUTES
Meeting date | time 10/28/2014 12:00 AM | Meeting location Sim Laboratory
Meeting called by Alfred
Type of meeting Progress check
Note taker Johnathan
Timekeeper Zuber
Attendees
Alfred, Mohin, Zuber, Tarek, Johnathan, Micky, Reyad,
Kasun, Osman, Zee, Hassan , Amit
AGENDA TOPICS
Time allotted | 50 mins | Agenda topic PDS and design convergence | Presenter Alfred
Discussion Presenting the product design specification and the design convergence to Johanna to update the
supervisors on decision and conclusion has been made by the group.
Conclusion: we still need to validate some criteria’s with numbers and not just use assumptions
Time allotted | 10 mins | Agenda topic |Ordering products | Presenter Alfred
Discussion We asked if it was possible to order products from eBay seen as it would be a lot cheaper ordering
product of their manufacture website itself. A list of product was also shown to Johanna specifying what products
we want
Conclusion Johanna proposed that she would as Howard ash if he could purchase some of the products we want
seen as the aerospace department don’t allow purchases from eBay
Time allotted | 10 mins | Agenda topic The need for sponsors | Presenter Alfred
Discussion We was considering if there was a need for sponsors because seen as we are getting a budget of £1000
from the university, there wouldn’t really be a need because we believe the can easily be made with a budget of
£1000
Conclusion we probably won’t need a sponsorship but the option is still open if need but we need to act soon if we
want a sponsor rather than later
Time allotted | 30 mins | Agenda topic multi rotor concept | Presenter Alfred
Discussion For our final concept of a multi rotor, we need to decide if we are going for a 3, 4, 6 or 8 rotor system as
our finalized concept
Conclusion to come up with another design convergence which has a list of criteria for multi rotor which will
compare different types of multi rotors and hence the win concept will be our final design.
Action items Person responsible Deadline
To improve the numbering system on the Product design spec Alfred 10/11/2014 12:00 PM
Research on manufacturing techniques for 3 to 8 rotor system Zee 10/11/2014 12:00 PM
For one motor failing research the stability for 3 to 8 rotor system
and maneuverability of multi rotor systems
Kasun 10/11/2014 12:00 PM

Page 2
The power requirements ie the thrust produced, time and the
speed
Hassan 10/11/2014 12:00 PM
Research into the costs and strength of material for multi rotors Ozy 10/11/2014 12:00 PM
Research Potential Payload capacity for a series of multi rotor
system
Mohin 10/11/2014 12:00 PM
Look into the Noise levels at which 3 to 8 rotor systems of the
same size produce noise
Amit 10/11/2014 12:00 PM
Look into root sizing and complexity and spacing for a series of
multi rotor system
Zuber 10/11/2014 12:00 PM
Research into Criticality of payload, CofG, stability during flight
and how they differ for 3 to 8 rotor systems
Mo 10/11/2014 12:00 PM
Research optical recognition system to see if an extra board is
required and the potential of using matlab
Tarek 10/11/2014 12:00 PM
Look into systems required for a multi rotor system and present a
list to the group
Jonathan and micky 10/11/2014 12:00 PM
Send an email with updated PDS and Design convergence to
supervisors
Alfred 10/11/2014 12:00 PM
MEng meeting times invitations Johanna 10/11/2014 12:00 PM

UAS CHALLENGE 2015
132 MEng Team Project Report (7ENT1024) School of Engineering and Technology
A.4. Example of Agenda
[PAGE INTENTIONALLY LEFT BLANK]

AGENDA
Finalizing Design Concept
October 28, 2014
12:00PM – 2:30 PM
Meeting called by Alfred Dzadey
Attendees:
Alfred, Mohin, Zuber, Tarek, Jonathan, Micky, Reyad, Kasun, Osman, Mozammel, Hassan,
Amit
Note taker: Jonathan
Please bring: List of ideas/ sketches/ brainstorm for multi-rotor to the table
Location: The Simulation Laboratory
Objective: Discussion of multi rotor concept, finalizing roles of groups and ideas of having sponsors
Introduction
Taking register of attendees and general updates
Schedule
Present design Specification and Design
convergence
Discuss ideas and brainstorm multi rotor idea and
structure
Appoint areas to research for each individual with
regards to multi-rotor discussed
To get a sponsor or not to get a sponsor
Presenter
Alfred
Alfred
Alfred
Alfred
Additional Instructions:
DON’T BE LATE PLEASE!!!

UAS CHALLENGE 2015
134 MEng Team Project Report (7ENT1024) School of Engineering and Technology
A.5. Team members Performance review
Jonathan has from the very beginning, been very enthusiastic about the project, even though he had been
moved around quite a few times from one role to another. Though his enthusiasm had led to great results,
it took some work getting there as the systems group had not properly managed their time. Having said
this, he has guided the group through many hurdles, some of which may have been daunting, and helped
speed up certain processes. Jonathon has on multiple occasions tried to stick to the plan to allow for ample
amount of time for testing, and while there have been delays, the planning for of all the systems
integration has allowed for little room for error. Even though there is room for improvement in managing
the team, Jonathon took great pride in both, his team and work, and this has led to a great contribution on
his part.
Tarek’s strong point, coming into this project, was his experience in electronics and has provided his
knowledge in getting some of the systems up and running quickly. His importance to the team was noted
fairly quickly as he could simply put his head down and make good headway. Nevertheless, there were
times where he was slowed down by delays in purchasing which meant he had to wait. While he had
planned for contingency, he never expected certain things to take as long as it did delaying thing further.
0
1
2
3
4
5
Jonathon Ebhota
0
1
2
3
4
5
Enthusiasm Team value Planning Delivery Contribution
Tarek Kherbouche

UAS CHALLENGE 2015
135 MEng Team Project Report (7ENT1024) School of Engineering and Technology
His knowledge was still valued to the team and his never wavering enthusiasm and support allowed him to
work well with all members of the group very well and help make a large contribution overall.
While Malwenna has not shown as much enthusiasm in the beginning, although this could be attributed to
him being an introvert, it did grow as the group started to become much more comfortable with each
other. Malwenna had constantly researched for a large part of semester one, making sure the rest of the
systems team was going the simplest and most effective route to a successful project. While Malwenna was
a great team player and a great asset to the team, by taking up more workload to help out, he ended up
pausing his own role for a short while, but on the other hand, had he not, the rest of the systems would
have been delayed anyhow making this a no win situation. Nevertheless, he has delivered his role
effectively and made a great contribution to the team.
While Mohammed showed some good levels of enthusiasm, his lack of planning led to rushing and some
late nights to get the task done on time. He initially started to help the propulsion engineer to make sure
that the motors that were chosen were right for the task. While this led to a more objective choice for the
motors, his actual role as a stability engineer had to take a back seat. However, he has since focused on his
role as the stability engineer alongside Malwenna and has made great progress in simulation and testing in
the short time he had. Overall, he started on the right path before getting side-tracked but has come to and
has made some great contribution to the team.
0
1
2
3
4
5
Enthusiasm Team value Planning Delivery Contribution
Malwenna Malwenna
0
1
2
3
4
5
Enthusiasm Team value Planning Delivery Contribution
Mohammed Rayad Ullah

UAS CHALLENGE 2015
136 MEng Team Project Report (7ENT1024) School of Engineering and Technology
Hassan has continuously worked very hard on his role as the propulsion engineer and has continuously
delivered, driven by his enthusiasm. Hassan has spent a large amount of time making sure that the parts he
chose were the right ones. From an extensive number of calculations through to testing; he has worked
very hard throughout the entire project. However, all this came at the cost of time management, although
he has pulled off all the stops and has completed his work on time to great results.
Amit has consistently pushed for more throughout the entire project, not only from himself but from
others as well. He brought in great level of experience and insight to almost all issues for the Quad-rotor.
His enthusiasm has never wavered and motivated some of the other team members to compete on who
can produce the most quality work. He regularly put his team in front and tried to help out where he could,
and though it may occasionally come as unneeded, and sometimes overbearing, he never let it bother him
and continued forward. His delivery to the project was invaluable and his overall contribution was
exceptional.
0
1
2
3
4
5
Enthusiasm Team value Planning Delivery Contribution
Hassan Turabi
0
1
2
3
4
5
Enthusiasm Team value Planning Delivery Contribution
Amit Ramji
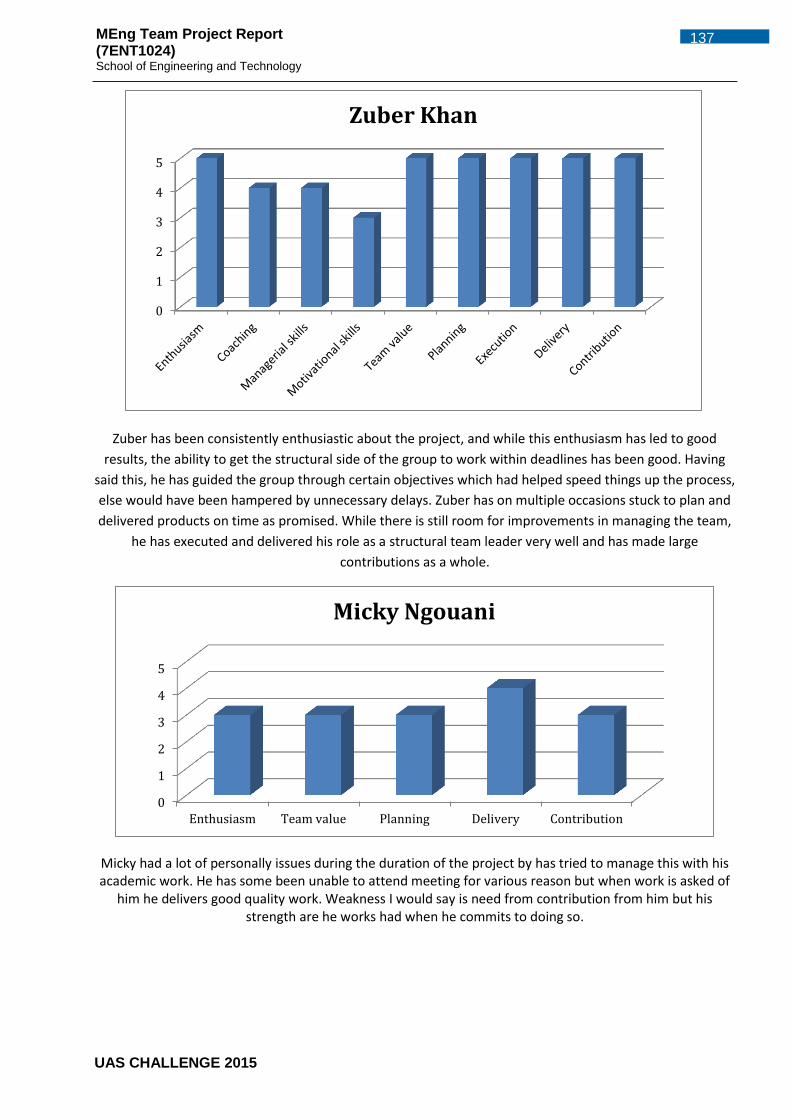
UAS CHALLENGE 2015
137 MEng Team Project Report (7ENT1024) School of Engineering and Technology
Zuber has been consistently enthusiastic about the project, and while this enthusiasm has led to good
results, the ability to get the structural side of the group to work within deadlines has been good. Having
said this, he has guided the group through certain objectives which had helped speed things up the process,
else would have been hampered by unnecessary delays. Zuber has on multiple occasions stuck to plan and
delivered products on time as promised. While there is still room for improvements in managing the team,
he has executed and delivered his role as a structural team leader very well and has made large
contributions as a whole.
Micky had a lot of personally issues during the duration of the project by has tried to manage this with his academic work. He has some been unable to attend meeting for various reason but when work is asked of
him he delivers good quality work. Weakness I would say is need from contribution from him but his strength are he works had when he commits to doing so.
0
1
2
3
4
5
Zuber Khan
0
1
2
3
4
5
Enthusiasm Team value Planning Delivery Contribution
Micky Ngouani

UAS CHALLENGE 2015
138 MEng Team Project Report (7ENT1024) School of Engineering and Technology
While Mohin showed some good levels of enthusiasm, his lack of planning led to rushing and some late
nights to get the task done on time. He generally isn’t a morning person and means that he usually is only
available during the day and late evening. During semester B he has become more involved with the group
and has made some great contribution to the team. His work was mostly of good standard and but
struggled to meet deadlines at times due to various reasons. Mohin is team player and is by far his best
attribute.
Osman has contributed greatly with his all-round support to everyone. He is always willing to help out in
any task and go the extra mile. He completes task in reasonable and expected time and has a good amount
of contribution to the team. He is definitely a team player and has shown some levels of enthusiasm during
the period of the project.
0
1
2
3
4
5
Enthusiasm Team value Planning Delivery Contribution
Mohammed Mohinuddin
0
1
2
3
4
5
Enthusiasm Team value Planning Delivery Contribution
Osman Sibanda

UAS CHALLENGE 2015
139 MEng Team Project Report (7ENT1024) School of Engineering and Technology
Mozammel has not shown as much enthusiasm in the beginning, although this could be attributed to him
being an introvert. He grew in confidence and began to take responsibility for his role and contribution to
the team. His time management wasn’t great due to personal problems outside academic work but
nevertheless he has produced reasonably standard work. He had put in the extra hours to complete tasks
when asked to and hence has had great contribution to the team progression so far.
0
1
2
3
4
5
Enthusiasm Team value Planning Delivery Contribution
Mozammel

UAS CHALLENGE 2015
140 MEng Team Project Report (7ENT1024) School of Engineering and Technology
A.6. Project manager performance review
PROJECT MANAGER EVALUATION FORM
City Project Name: UAS Challenge Dates Evaluated Beginning: September 2014 To: May 2015
Name of Project Manager: Alfred Dzadey Type of Evaluation: MEng Project Final
Code Scale -- Please use the rating code below to appraise the project manager’s work
5 The Absolute Best Project Manager that we have knowledge of and experience with anywhere. Very
Exceptional and Far Superior to others. Value added to the project / Achieved on almost always /
4 Above Average -- Noticeably competent / capable / proficient / adept / knowledgeable / skilled / High
Quality / Achieved on a consistent basis /
3 Average: (satisfactory / acceptable / suitable / reasonable / no major problems / potential is there /
dependable / meets the stands of the job
2 Marginal (Fair: improvement is necessary / deficient in certain area, but potential may be there)
1 Below Average (Needs significant or substantial improvement / really lacking / unsatisfactory)
0 Not observed or applicable
Project Manager’s Rating
5 Management of Team / Project 4 Dependability (can be counted on, return calls/email,
4 Understanding of other PM’s needs 3 Ability to anticipate and analyze problems
4 Professionalism 4 Timeliness (attendance, punctuality, fulfillment of
obligations)
4 Achieved project goals 5 Ability to locate & utilize resources effectively
4 Written communications ability 5 Ability to work with others
4 Oral communications ability 5 Ability to present options and/or reach decisions
OVERALL PROJECT PERFORMANCE OR END PRODUCT (use 1 to 5 scale again on project basis)
4 Adherence to Budget 3 Adherence to Schedule
5 Good Public / Private Team Relationship 4 High Quality Results
Overall Rating 5 in terms of public / private time, resources, and money required to work with them
Circle One:
Definitely looking forward to working with this Project Manager again on another project.
Willing to work with this Project Manager again on another project without any changes
Willing to work with this Project Manager again on another project with some changes
Prefer not to work with this Project Manager again or Project Manager needs significant
improvements
Please note any specific comments here or on a separate sheet (weak points needing improvement, strong
points, instances of going the extra mile.)
- Needs to be kept within the deadlines, you are far too lenient.
+ Good communication skills, and persuasiveness
+ Always going the extra mile
+ Always stands up for teams in front of supervisors and very supportive

UAS CHALLENGE 2015
141 UAV Design MEng Team Project Report (7ENT1024) School of Engineering and Technology
Section by Amit Ramji
Section by Amit Ramji
Appendix. B UAV Design
B.1. Weight Reduction - Quad-Rotor
In order to eliminate excess mass, design considerations such as those discussed in Appendix G.1 have been used. The main focus was to achieve a high strength to weight ratio with a fairly high stiffness; hence the use of thin plates in a sandwich design justifies the decision rationale. Using an initial arm bending calculation and iterative process, the best tube diameter was converged to be 16mm x 11.5mm with a wall thickness of 2.25. The Outside diameter of the tube now needs a support to sandwich the plates, a high strength Nylon 66 material is selected for the compression blocks (FB-001, FB-002, EB-001 – Appendix B.7). Decreasing the plate spacing to 25mm proves a challenge for incorporating systems and mechanical pivots, however this reduced the overall weight significantly. Furthermore the Nylon 6 plates (BP-001 & 002 – Appendix B.7) incorporates cut-outs and holes to reduce weight further and allow for a reduced cross section during flight. The gust pressure loading of such cross section has been calculated in 8.4 and added to the maximum flight forces however assuming an opposed direction in order to satisfy worst-case flight conditions. The isolated plate deflection is modelled in Appendix G.11 as an infinite plate assembly. Compared with the analytical technique, the error between results is minimal as is discussed in section 8.7. Main Body Plate sizes (BP-001 & 002) have been sized to be the minimal thickness to allow for stress distribution and maintain a stiffened root structure. Reducing the thickness of these plate further without changing materials would mean the plates would be subject to localised bending and shear deflections (similar to ladder/truss design with weak rail supports). Additionally the planar dimensions consider the contact positions of the Arm support brackets and every attempt has been made to reduce the overall root size of the main body plates. Further cut-outs and weight reduction on most components is still possible however due to time and resource constraints, further material optimisation is not considered. Further mass can be removed from the Undercarriage components (UV-001 & UH-001), along with increased cut-outs on the Main Body plates (BP-001 & 002) and tapering of out-board structures. A further study into the use of Short Fibre Reinforces Composite (SFRC) blocks can also be carried out, however this would be mass produced injection moulded components as detail and finer machining is time consuming and costly.
B.2. Detailed Design and CAD Modelling
The design of the Quad-rotor has been carried out while considering manufacturability and precision of machinability. The overall geometry of the Quad-Rotor is controlled by positions of the Main Body plates (BP-001 & 002), where the CNC process is accurate of 0.2mm. If the Fixed or Movable blocks (FB and MB series) are not accurate to nominal values, the through bolts being used in compression will take up the tolerance as Nyloc Nuts are also being used to ensure no assembly is loosened during flight. The 16mm diameter hole in the blocks for the Arms is also considered at the manufacturing stage during component design; if the manufactured component is loose fit, the gap can be closed by the O-rings and hand finishing of mating half-block surfaces (sandwich of FB-001 x 2 to FA-001 - Appendix B.7). Compression and bolt preload of the fasteners holding this local sandwich together will allow the Arm to be secure during assembly and in flight.

UAS CHALLENGE 2015
142 UAV Design MEng Team Project Report (7ENT1024) School of Engineering and Technology
Figure 101 - Overall View of Quad-Rotor
Figure 102 - Motor Mount Design (Left) & Undercarriage T-Joint (Right)
Figure 103 - Undercarriage Pivot Design (Left) & Main Body Sandwich Design (Right)

UAS CHALLENGE 2015
143 UAV Design MEng Team Project Report (7ENT1024) School of Engineering and Technology
Section by Amit Ramji
Section by Amit Ramji
Section by Amit Ramji
Figure 104 - Movable Arm Pivot Design
B.3. Payload Housing Design
The payload housing is designed to be removable for ease of transport, increased functionality and the ability to attach various devices as a payload (eg, Camera and gimbal on a quick release turn button). Parts PB-009 and PB-010 (Appendix B.7) allow the Quad-rotor to be multi-functional and allow for a sleek appearance for mounting accessories. The payload housing is a key component in the design, a hollow truss type design has been converged upon to enable the structure to be lightweight and have high stiffness. Multiple design iterations had been considered during the design stage where Appendix G.15 and G.16 show the changes made to PB-006 and PB-008 (Appendix B.7) to increase the stiffness of the housing during flight conditions to avoid pre-mature deployment of payloads. Rendered views of the payload housing can be observed in Figure 10 though Figure 13.
B.4. Supplier Discount and Advertising Opportunities
The value of structural components such as raw Nylon (PA6 & PA66) blocks / sheets have been demonstrated in Appendix. D where the usage costs have been calculated. The usage cost of materials is equivalent to a buy-back scheme used in industry where off-cuts and machining swarf is sold back to the supplier for recycling. Ensinger Ltd (Watford Plastics division) is one of the largest suppliers globally and has agreed to provide the raw materials at a cost equivalent to supply costs in exchange for advertisement. Buy-back schemes are usually used for long term and large volume purchases, however advertisement has been offered in place of a large contractual order. Costing of plastics is non-standard and a retail price is differing between suppliers, many suppliers can afford to offer the same materials at a fraction of the cost depending on their commercial footprint.
B.5. BOM Assembly Techniques
To save time on assembly level modelling in CATIA, the use of repeated parts is key to a quick design and manufacture. Complexity is also reduced as modifications to single parts can be projected to its upstream parent products. Kits have been arranged in the CATIA model comprising of various repeat components. Such kits include; fixed brackets kits, motor mount kits, fastener kits and overall allows for reduction in possibility of clashes and configuration errors.

UAS CHALLENGE 2015
144 UAV Design MEng Team Project Report (7ENT1024) School of Engineering and Technology
Section by Amit Ramji B.6. Configuration Control
In order to avoid having multiple versions of the same components with little changes in geometry, a single group member had carried out all modelling. This ensures there is one main CAD model with no chance of duplication of parts and introducing variants. An industry equivalent to this restriction would be a check-in/check-out database such as Siemens Teamcentre or CATIA Enovia, however this could not be possible during the timescales involved in the project for integration. The entire model has undergone a 4-step manufacturing readiness level; where level 1 is conceptual design, level 2 being detail design of components, level 3 being further product level design and manufacturing readiness and level 4 being systems 3D modelling and cable routing.
Part Numbering Scheme
Location Identifiers:
FB = Fixed Bracket EB = End Bracket MB = Movable Bracket AP = Arm Pivot LP = Landing Pivot LB = Landing Bracket BP = Body Plates MP = Motor Plates TJ = T-Joint MA = Movable Arm FA = Fixed-arm UV = Undercarriage Vertical UH = Undercarriage Horizontal
Revision Control:
Revisions of parts are a possibility to introduce under configuration control when the Fit, Form or Function of the part does not change. Due to the constant update of design parts and releasing in a 4 level time-line, revision numbers are not required. Additionally the fact that a single entity is in control of the entire CAD model and configuration control, the potential to introduce part and assembly revisions is unnecessary.
Part and Drawing Release for Manufacture:
Real engineering projects involving a multitude of parts would require a release process, however as the same team member models the Design and carried out the Stress analysis of the structural components, the need for internal release is non-essential. Only one working copy of the entire Quad-Rotor design exists, hence part release and freezing of the design is carried out at internal stage reviews (Levels 1 - 4). Release for manufacture and configuration control again is simplified as a single member is in control of the design and drawing release that also inputs into selecting materials and purchasing. For this reason, drawing release uses the same part-numbering scheme as above and all drawings are deemed as Work-In-Progress until the drawing is assigned a number. An industry equivalent would involve a workflow process where each part and assembly along with material cards and instructions are released at separate departments, however due to project integration constraints, tools such as Teamcentre have not been used.
XY - 00Z
Location / Description Letters Part Number Identifier

UAS CHALLENGE 2015
145 UAV Design MEng Team Project Report (7ENT1024) School of Engineering and Technology
Section by Amit Ramji
B.7. Production Support and Drawings
[PAGE INTENTIONALLY LEFT BLANK]


UAS CHALLENGE 2015
171 UAV Detailed Mass Breakdown MEng Team Project Report (7ENT1024) School of Engineering and Technology
Section by Zuber Khan Appendix. C UAV Detailed Mass Breakdown A detailed mass breakdown was carried out of the whole UAV to ensure that it is within specifications. The itemised breakdown of components and their quantities are shown below.
Structural Part Name
Part No. (Appendix
B.7)
Material
(Appendix.
E)
Density (g/cm3)
Area cm2
Length/ Thickness
(cm)
Volume (cm3)
Mass (g)
Qty Total
Mass (g) Picture
(Appendix B.7)
Tubular Arms MA-001, FA-001
PVC 1.4 0.97 29 28.18 39.46 4 157.84
Fixed-arm Nylon clamps
LB-001 Nylon 1.14 5.2 1 3.56 4.06 16 65.00
Moveable arm half block
clamp FB-002 Nylon 1.14 4.52 1 3.14 3.58 2 7.16
Moveable arm full block
clamp MB-001 Nylon 1.14 8.92 1 5.52 6.29 2 12.59
Moveable arm pivot
AP-001 Nylon 1.14 6.25 5 13.11 14.95 2 29.90

UAS CHALLENGE 2015
172 UAV Detailed Mass Breakdown MEng Team Project Report (7ENT1024) School of Engineering and Technology
Motor clamp full block (end)
EB-001 Nylon 1.14 10.2 1 7.77 8.86 4 35.45
Motor block plate
MP-001 Aluminium 2.7 20 0.1 1.81 4.90 8 39.24
Plates BP-001, BP-
002 Nylon 1.14
351.58
0.2 70.25 80.09 2 160.19
Undercarriage pivot
assembly
LP-001, LB-003
Nylon 1.14 7.37 4 21.67 24.70 2 49.41
Undercarriage tube
UV-001 PVC 1.4 0.97 20 19.43 27.21 2 54.42
Horizontal undercarriage
tube UH-001 PVC 1.4 0.97 35 34.01 47.62 2 95.24

UAS CHALLENGE 2015
173 UAV Detailed Mass Breakdown MEng Team Project Report (7ENT1024) School of Engineering and Technology
Undercarriage T Joint
TJ-001, TJ-002
Nylon 1.14 13.1
2 8 16.06 18.31 2 36.63
Payload box PB-000 Nylon 1.14 101.924 116.19
M3 x 35 Button Head
M3 x 35 x 0.5 Stainless
Steel 7.2 35 0.28 1.7 34 57.8
M3 Nyloc Nut Nyloc M3 x 0.5 Stainless
Steel 7.2 0.09 0.4 34 13.6
M5 x 30 Button Head
M5 x 30 x 0.8 Stainless
Steel 7.2 30 0.4123 4.4 2 8.8
M5 Nyloc Nut Nyloc M5 x 0.8 Stainless
Steel 7.2 0.176 1.4 2 2.8

UAS CHALLENGE 2015
174 UAV Detailed Mass Breakdown MEng Team Project Report (7ENT1024) School of Engineering and Technology
25mm M3 Hex standoff (F/F)
Hexagonal Standoff
Brass 8.45 25 0.55 3.7 4 14.8
M3 Nylon Spacer – 3.2mm
Internal, Outer 6mm, length
25mm
M3 Nylon Spacer
Nylon 1.14 25 0.7 2 1.4
M5 Nylon Spacer – 5.3mm
Internal, Outer 10mm, length
10mm
M5 Nylon Spacer
Nylon 1.14 10 0.7 2 1.4
M6 Nylon Spacer – 6.4mm
Internal, Outer 12.5mm,
length 10mm
M6 Nylon Spacer
Nylon 1.14 10 1 4 4
M3 x 10 Button Head, pitch 0.5mm
M3 x 10 Button Stainless
Steel 7.2 10 0.6 24 14.4
O-Rings 16mm
internal, O-Rings Rubber 30 2

UAS CHALLENGE 2015
175 UAV Detailed Mass Breakdown MEng Team Project Report (7ENT1024) School of Engineering and Technology
18mm External, c/s
1mm
Quick Release Pin
Quick Release Aluminium 2.7 0.50
3 4.5 2.26 6.11 2 12.21
Springs Springs Steel 7.2 10 2 20
Total (Structural)
1012.5
(g)
Table 23 – Itemised Mass Breakdown of all Structural UAV Components

UAS CHALLENGE 2015
176 UAV Detailed Mass Breakdown MEng Team Project Report (7ENT1024) School of Engineering and Technology
Table 24 - Electronics and Misc Component Masses
Mass for Electronic / Misc Components
Height (mm) Width (mm)
Thickness (mm)
Mass (g)
Qty Total
Mass (g)
Pixhawk 80 49 15 40 1 40
GPS 40 40 9 14.4 1 17.1
OSD 50 18 10 4 1 4
Telemetry kit 50 30 10 50 1 50
Batteries 194 45 47 1848 2 1848
Motors 52.5 35 0 187.4 4 749.6
Propeller Blades
40 4 160
Esc's 80 30 17 75.2 4 300.8
Camera 61 35 18 50 1 50
Lights
150 1 150
Lights control board 46 28 13 73.2 1 73.2
Servos 35.5 22.5 12 13.4 1 13.4
Payload* (Single per trip) 140 105 70 1000 1 1000
Cable ties/ additional cables
100
Power regulator 10 10 7 21.5 1 21.5
Buzzer 30d
5 4.8 1 4.8
Power cable for power module df13
20 15 10 1.5 1 1.5
Power switch 25 7
1.8 1 1.8
Competition GPS Tracker (IMechE, Jan 2015)
59 38 18 50 1 50
XT60 Connectors and Velcro
85 1 85
Motor Extension cable 120 1 120
Additional Systems battery 102 15 35 118 1 118
BEC for servo 50 30 15 55 1 55
Total (Electronics / Misc) 5013.7(g
)
From the summation of all the masses for the electronic and miscellaneous components in Table 24, a total mass of 5013.7 grams was calculated. Total Mass of the UAV 6026.2 grams.

UAS CHALLENGE 2015
177 UAV Detailed Cost Breakdown MEng Team Project Report (7ENT1024) School of Engineering and Technology
Section by Zuber Khan Appendix. D UAV Detailed Cost Breakdown
Material / Component
Used for (Appendix B.7 for Structural Parts
and Section 10 for Systems)
Raw Cost for Total
Material (£ inc Vat
and Delivery)
Usage cost for Parts
(£ inc Vat and Delivery)
Usage cost for Parts – Excluding Delivery
(£ inc Vat)
PVC Tube MA-001, FA-001, UV-001, UH-001.
£50.34 £37.92 £31.67
10mm Nylon 6.6 Block
FB-001, FB-002, MB-001, EB-001 LB-001, LB-002 PB-009, PB-010
£4.40 £2.25 £1.25
16mm Nylon 6.6 Block
TJ-001, TJ-002 £4.40 £1.01 £0.51
30mm Nylon 6.6 Block
LB-003, LP-001 £6.60 £1.33 £0.67
25mm Solid Circular Bar
AP-001 £4.40 £2.29 £1.145
2mm Nylon 6 Black Plate
BP-001, BP-002, PB-005
£8.80 £7.44 £3.72
1mm Nylon 6 Black Plate
PB-004 £4.40 £3.04 £1.52
Rigid Angle Sections
PB-001, PB-002, PB-003, PB-006, PB-007, PB-008
£39.54 £18.56 £12.31
Aluminium 1mm Plate
MP-001 £9.08 £7.26 £7.26
Pixhawk Pixhawk £159.98 £159.98 £159.98
GPS & Telemetry Kit
GPS & Telemetry Kit
£89.77 £89.77 £89.77
OSD OSD £44.95 £44.95 £43.45
Batteries Batteries £188.76 £188.76 £182.74*
Motors Motors £91.80 £91.80 £91.80
Propeller Blades Blades £12.00 £12.00 £12.00
ESC’s ESC’s £141.75 £141.75 £135.80
Lights & LED panel Board
Lights & LED panel Board
£14.13 £14.13 £14.13
Servo Servo £13.69 £3.42 £3.42
Camera Camera £52.43 £52.43 £47.01
M3 x 35mm x 0.5mm Pitch Bolt
Fasteners £3.95 £2.37 £2.37
M3 Nyloc Nuts Fasteners £1.78 £1.21 £1.21
M5 x 30mm x 0.8mm Pitch
Bolts Fasteners £2.79 £0.56 £0.56
M5 Nyloc Nuts Fasteners £1.19 £0.24 £0.24

UAS CHALLENGE 2015
178 UAV Detailed Cost Breakdown MEng Team Project Report (7ENT1024) School of Engineering and Technology
Table 25 – UAV Itemised Cost Breakdown *Conversion rate accurate as of 26/03/15 - $1 = £0.6678 Total Cost of COTS £824.84 Total Cost of Structure £81.34
M3 Nylon Spacer 3.2mm internal, outside 6mm, length 25mm
Spacer
£4.09
£0.68
£0.68
M5 Nylon Spacer 5.3mm internal, outside 10mm, length 10mm
Spacer £3.39 £0.57 £0.57
M6 Nylon Spacer 6.4mm internal, outside 12.5mm,
length 10mm
Spacer £3.59 £1.20 £1.20
M3 Brass Hexagonal – F/F -
Standoff Spacer £3.09 £2.06 £1.07
M3 x 10mm x 0.5mm Pitch
Fasteners £1.39 £1.11 £1.11
Cable Ties 2.5x100mm
Cable Ties £0.99 £0.99 £0.99
O-Rings – 16mm Internal, 18mm
External, c/s 1mm O-Rings £4.24 £3.60 £3.60
Nylon Hinges 20 x 20mm for
Payload Box Hinge £2.90 £0.97 £0.97
Heat Shrink Tubing Set
Tubing £5.28 £2.53 £0.65
Braided Sleeve Cable Protection
Cable Protection £19.35 £1.55 £1.55
Strobe controller Strobe controller £4.49 £4.49 £4.49
Black Rubber Washers
Black Rubber Washers
£4.39 £4.39 £4.39
M3 x 40mm x 0.5mm Pitch Bolt
Fasteners £1.79 £0.72 £0.72
XT60 Connectors and Velcro
Connectors and Fasteners
£14.29 £14.29 £8.87
Motor Extension Cable
Wires £15.80 £9.88 £9.88
ESC for servo £8.40 £8.40 £8.40
Additional Systems Battery
Batteries £8.50 £8.50 £8.50
Springs £2 £2 £1.60
LED’s x20, Require 4
Lights £11.98 £2.40 £2.40
Total £1062.48 £954.80 £906.18

UAS CHALLENGE 2015
179 Material Properties MEng Team Project Report (7ENT1024) School of Engineering and Technology
Section by Amit Ramji Appendix. E Material Properties
Material ID Components (Appendix B.7)
Property Value
1 -
Al
All
oy
(MIL
-HD
BK
-5H
)
MP-001 Density ρ= 2770 kg/m3
Young’s Modulus 𝐸= 7.1E10 Pa = 71 GPa
Poisson’s Ratio 𝜈= 0.33
Bulk Modulus K= 6.9608E10 Pa = 69.6 GPa
Shear Modulus G= 2.6692E10 Pa = 26.6 GPa
Tensile Yield Strength σTYS= 280 MPa
Compressive Yield Strength σCTS= 280 MPa
Ultimate Tensile Strength σUTS= 310 MPa
2 -
Bra
ss
(Die
hl, 2
01
5)
Brass M3x25 F/F Spacers.
Density ρ= 8450 kg/m3
Young’s Modulus 𝐸= 1.15E11 Pa = 115 GPa
Poisson’s Ratio 𝜈= 0.331
Bulk Modulus K= 1.1341E11 Pa = 113.4 GPa
Shear Modulus G= 4.3201E10 Pa = 432 GPa
Tensile Yield Strength σTYS= 160 MPa
Ultimate Tensile Strength σUTS= 270 MPa
3 -
Ny
lon
66
[TE
CA
MID
-66-M
O-
Bla
ck
]
(En
sin
ge
r, 2
01
5b
)
FB, MB, AP, LP, LB, EB & TJ Series. PB-009 & PB-010.
Density ρ= 1150 kg/m3
Modulus of Elasticity (Flexural) 𝐸= 3100 MPa
Poisson’s Ratio 𝜈= 0.4
Bulk Modulus K= 4.1667E9 Pa = 4.1667 GPa
Shear Modulus G= 8.9286E10 Pa = 89.28 GPa
Tensile Yield Strength σTYS= 83 MPa
Ultimate Tensile Strength σUTS= 84 MPa
4 -
Ny
lon
6
[TE
CA
MID
-6-M
O-
Bla
ck
]
(En
sin
ge
r, 2
01
5a)
BP-001, BP-002, PB-004 & PB-005
Density ρ= 1140 kg/m3
Modulus of Elasticity (Flexural) 𝐸= 3100 MPa
Poisson’s Ratio 𝜈= 0.4
Bulk Modulus K= 4.1667E9 Pa = 4.1667 GPa
Shear Modulus G= 8.9286E10 Pa = 89.28 GPa
Tensile Yield Strength σTYS= 82 MPa
Ultimate Tensile Strength σUTS= 84 MPa
5 -
PV
C H
707
Eq
uiv
(Dir
ect_
Pla
sti
cs,
201
5)
FA-001, MA-001, UV-001 & UH-001
Density ρ= 1800 kg/m3
Modulus of Elasticity (Flexural) 𝐸= 3100 MPa
Poisson’s Ratio 𝜈= 0.41
Bulk Modulus K= 5.7407E9 Pa = 5.7407 GPa
Shear Modulus G= 1.0993E9 Pa = 1.0993 GPa
Tensile Yield Strength σTYS= 55 MPa
Ultimate Tensile Strength σUTS= 56 MPa

UAS CHALLENGE 2015
180 Material Properties MEng Team Project Report (7ENT1024) School of Engineering and Technology
6 -
Au
sti
nit
ic S
tain
less
Ste
el -
(C
lass
70,
304
gra
de
- c
old
dra
wn
)
(BS
SA
, 2
01
5)
M3 & M5 Fasteners and Nyloc Nuts.
Density ρ= 8030 kg/m3
Modulus of Elasticity 𝐸= 193 GPa
Poisson’s Ratio 𝜈 = 0.29
Bulk Modulus K= 134 GPa
Shear Modulus G= 86 GPa
Tensile Proof Strength (0.2% - R1, P0.2)
σ= 450 Mpa
Ultimate Tensile Strength σUTS= 700 Mpa
7 –
PV
C R
igid
An
gle
(Dir
ect_
Pla
sti
cs,
2015)
PB-001, PB-002, PB-003, PB-006, PB-007 & PB-008
Density ρ= 1800 kg/m3
Modulus of Elasticity (Flexural) 𝐸= 3100 MPa
Poisson’s Ratio 𝜈= 0.41
Bulk Modulus K= 5.7407E9 Pa = 5.7407 GPa
Shear Modulus G= 1.0993E9 Pa = 1.0993 GPa
Tensile Yield Strength σTYS= 55 MPa
Ultimate Tensile Strength σUTS= 56 MPa

UAS CHALLENGE 2015
181 Load Cases and Load Transfer MEng Team Project Report (7ENT1024) School of Engineering and Technology
Section by Zuber Khan
Section by Zuber Khan
Appendix. F Load Cases and Load Transfer (Supplement to section 7.1)
F.1. Steady Flight Case A steady flight case scenario during which the UAV would be under maximum flight loads. This would include: the motors producing the maximum amount of thrust, the UAV flying at maximum velocity and maximum gust being applied in the opposite direction of flight. The steady flight case analysis covers various conditions which the UAV will be put under such as, take-off, manoeuvres during flight and hover.
F.2. Drag on the Main Plates Maximum flight speed would be achieved when the UAV is at a maximum tilt angle of 54 degrees (Section 7.1) to the vertical. Using this along with the total surface area of the main body plates, the Drag force could be calculated.
Figure 105 - Project Main Body Area
𝑠𝑖𝑛(54) =𝑇𝑜𝑡𝑎𝑙 𝑃𝑟𝑜𝑗𝑒𝑐𝑡𝑒𝑑 𝐴𝑟𝑒𝑎 (𝑆)
35129.71= 28420.53𝑚𝑚2
Equation 18 - Projected Area For steady flight the motors produce enough thrust to balance the weight. Therefore the mass was
is by 4. 7
4= 1.75𝐾𝑔. However this would not be the thrust when in flight due to the UAV being at
an angle of 54 degrees. Therefore a component was taken as shown below.
𝑐𝑜𝑠(54) =𝑇ℎ𝑟𝑢𝑠𝑡 (𝑇)
1.75= 1.0286 𝐾𝑔
Equation 19 - Thrust at 54 Degrees
To calculate the drag force, the following equation is used:
𝐷 =1
2𝜌𝑉2𝑆𝐶𝐷
Equation 20 - Drag Equation (R. H. Barnard, 2010) Where: D = Drag Force, p = Density, V = Velocity, S = Area, Cd = Coefficient of Drag The maximum gust the UAV has to fly in is 25knots and the maximum allowable flight speed of the UAV is restricted to 60knots. Therefore the maximum wind on the UAV would be 85Knots. A Cd value for the plate was worked out using, ‘(1.28 x sin(angle))’ (NASA, 2014).
1.28 × sin(54) = 1.0355 𝐷 = 1
2 × 1.226 × (85 × 0.5144)2 × 28420.53 × 10−6 × 1.0355
= 34.491𝑁 ∴ 𝐷 = 3.516𝐾𝑔 is the drag force equivalent distributed on the main plate. To this a ‘global load safety factor of 1.5’ was added for the purpose of working out the Maximum stresses and deflections. 1.5 × 3.516 = 5.274𝐾𝑔
Total Surface Area = 35129.71mm2
54° Total Projected
Area
54°
T
1.75Kg

UAS CHALLENGE 2015
182 Stress Analysis MEng Team Project Report (7ENT1024) School of Engineering and Technology
Section by Amit Ramji
Section by Amit Ramji
Appendix. G Stress Analysis
G.1. Stress Reduction Techniques The following design techniques have been adopted to maximise efficiency of the material and ensure a lightweight and stress reduced structure at local discontinuities and overall load paths.
Align known material properties with major load direction where possible. Hence the use of Nylon 66 Blocks being used in compression (FB-001 & 002) and fasteners being used in shear and tension (M3’s & M5’s).
Use of flexible joints to avoid excessive stress load transfer (70 Shore Rubber O-Rings and Landing Springs – See Appendix B.7).
Stiffen or reinforce unsymmetrical features to minimize flexure. An example of this consideration is the use of the Nylon 66 Fixed Blocks (FB-001 & 002) used in the main body alongside the M3 Brass spacers which act as rigid links between the main body plates (BP-001 and 002) to reduce total body deflection.
Encourage smooth transitions in cross section and stress levels, avoiding hard points in the primary load path. In some cases this could not be avoided (MA-001 contacting FB-002 – See Figure 115 through Figure 119), therefore an additional local support (MB-001 – Appendix B.7) is incorporated.
Accounting for structural deflections and considering specific threats (Heavy Landing) where compromised integrity of the structure and/or the integrity of the systems installed in the structure could be a cause for concern.
Where appropriate, distribute the load pathways between multiple components to avoid bulky structure and concentrated stress distributions on single components. An example of such situation is the multiple load paths in the main body, where a sandwich type design is achieved. The stiffness of the main body structure is greatly increased with rigid links (M3 Fasteners, FB-001, FB-002, MB-001 and M3 spacers).
G.2. Fatigue Awareness A gain in fatigue life can in most situations be achieved without an increase in cost, simply by attention to design detail. The following should be taken into account when considering the Quad-Rotor structure:
Avoiding sharp edges, corners and sudden changes in cross-section can reduce stress concentrations. Fillet and intersection radii should be as large as possible as such used in the Lug Bracket (LB-003) and Pivots (AP-001 & LP-001).
Avoiding joggles in the load line or catering for joggles by additional stiffening to bridge the joggles. Considering the combined loading effect of cut outs and holes in close proximity as those used in the Main Body Plates and Motor Mount Plates (BP-001, BP-002 and MP-001). A detail hand calculation using Petersons Stress Concentration Factors (Pilkey and Pilkey, 2008) has not been carried out as this complex geometry and cut-outs are previously considered in the Finite Element Model with mesh refinement, inflation and pinch controls.
The majority of fatigue cracks will start at stress concentrations such as holes, notches, etc. Any design features or processes that can be applied to reduce the severity of such stress concentrations should be used.
Ensuring design of joints are such as not to give rise to built-in stresses on assembly, or load some portions of the joint unduly. The use of M3 and M5 from the same supplier to avoid mixing fasteners of dissimilar material/strength and those that require differing tolerances of fit. Fasteners with tighter tolerances will load the local structure during repeated flexure more than a loose tolerance fastener due to the miniscule freedom of movement of the joint.
In fatigue critical areas, interference fit fasteners shall be used whenever possible in preference to clearance fit. A close tolerance for clearance/transition fit fasteners will improve the fatigue performance of the joint, as this will minimize the risk of individual holes being over-loaded. For the current Quad-Rotor design, fasteners are loaded axially hence

UAS CHALLENGE 2015
183 Stress Analysis MEng Team Project Report (7ENT1024) School of Engineering and Technology
Section by Amit Ramji
Section by Amit Ramji
introducing a bolt pre-load and reducing the miniscule movement if any existed. Pre-tensioning of the bolt can reduce alternating stresses in the bolt and improve its fatigue
performance. The correct seating of the fastener head and nut along with use of the correct installation torque is therefore essential to avoid local bending.
G.3. Fatigue due to induced vibration
Fatigue damage can often arise from induced vibration from the motors as compared with fatigue damage arising from directly applied structural stresses. Often this vibration is not sustained for long periods of time, a modal analysis case has been considered for the Fixed-arm assembly as shown in Appendix 8.17 and compared to analytical methods as shown in Appendix 8.16. Such calculated modal frequencies should be avoided or swiftly passed through the first 3 natural frequencies when powering up the motors to idle and can be programmed into the ESC’s as “soft, medium, hard” starts.
Avoiding the use of long cantilevered members, as these will experience high inertia forces in vibration. The modal analysis of the Arm has been the main concentration for the purpose of frequency response analysis, as the cantilever of the Arms are more susceptible to vibration than any other components.
Rigidly mounted equipment may be vibrated by the structure to which it is attached, hence the use of O-Rings at the motor mounts and dampening foam being used on all sensitive components such as Pixhawk due to its susceptibility to compass excitation during vibration.
G.4. Boundary Conditions - Connection Type and Contact Element Type
Bonded
The bonded connection applies to all contact regions (surfaces, solids, lines, faces, edges). With this connection type there is no sliding or separation between faces or edges (Ansys, November 2013a). This type of contact was used for a quick initial analysis of all assemblies as the solution time and model could be checked. Bonded contact allows for a linear solution since the contact length/area will not change during the application of the loads. Using the bonded contact elements, the contact is determined on the mathematical model where any gaps will be closed and any initial penetration will be ignored (Ansys, November 2013b, Ansys, November 2013e). Correct refinement was carried out once the models were deemed correct and the calculated displacements or stress match analytical methods in sampled areas. The contact types in most regions had been refined to rough or frictionless where appropriate, bonded contact was maintained between LP-001 and UV-001, alongside MA-001 and AP-001 (Appendix B.7).
Frictionless
The Frictionless contact connection is a standard unilateral contact where normal pressure is zero is separation occurs (Ansys, November 2013a). With frictionless connections, gaps can form in the model between bodies depending on the loading criteria and directions. Hence this solution is nonlinear due to the area of contact prone to changing as the load is applied. A zero coefficient of friction is assumed, thus allowing free sliding and is used in the model where pivot regions and open surfaces exist. Such frictionless areas modelled in specific load cases (e.g. landing and entire quad flight cases (Appendix G.14) is associated with parts AP-001, LP-001 and FB-002 (Appendix B.7). For the analysis to converge, all surrounding geometry is well constrained by using bolted connections at bolt surfaces and rough connections at relevant arm brackets. Weak springs are added to the assembly by default during the iterative process to help stabilize the DOF’s in order to achieve a reasonable solution. In many cases the solution processing time was reduced by enabling parallel processing and post compilation of solutions, up to 8-cores had been programmed in some solution cases (Ansys, November 2013f).
UAS CHALLENGE 2015
184 Stress Analysis MEng Team Project Report (7ENT1024) School of Engineering and Technology
Rough
The rough connection is similar to the frictionless type however models perfectly rough frictional contact where there is no sliding. Alternative connection types are also possible where friction factors can be modelled, however increases solution time significantly and for the purpose of this analysis is deemed unnecessary. Rough connections apply to regions of faces or edges of plates, brackets and O-ring locations (Appendix B.7). By default, no automatic closing of gaps is performed and corresponds to an infinite friction coefficient between the contacting bodies (Ansys, November 2013a). The rough connection had been replaced by No Separation connections in motor plate regions (MP-001 to EB-001 & FB-001) for the entire quad analysis and landing cases (Appendix G.14). Using this method, the solution time is reduced and allows for accurate stress solutions at the root of the quad-rotor as non-linearity is previously demonstrated in the arm stress analysis (Appendix G.7 and G.8)
No Separation – Rigid Body
The No Separation contact setting is similar to the bonded case and only applies to regions of faces or edges. Separation of the geometries in this contact connection is not permitted (Ansys, November 2013a). The No Separation connection is used in the motor plate regions (MP-001 to EB-001 & FB-001) for the entire quad analysis and landing cases (Appendix G.14). Once again, solution time is reduced and allows for accurate stress solutions at the root of the quad-rotor as non-linearity and friction contact has previously been demonstrated in the arm stress analysis (Appendix G.7 and G.8).
Bolted – Rigid Body
For modelling bolted connections in Ansys Workbench an MPC184 Revolute Joint Element is used instead of Rigid Body Elements (RBE2 or RBE3) used in Ansys Mechanical APDL or NASTRAN. The MPC184 revolute joint is a two-node element that has only one primary degree of freedom, the relative rotation about the revolute (hinge) axis. The Revolute joint is similar to modelling a Beam Line Element at the bolt location alongside using RBE’s to average the bearing pressure loading at hole contact surfaces. This element imposes kinematic constraints such that the nodes forming the element have the same displacements. Additionally, “only a relative rotation is allowed about the revolute axis, while the rotations about the other two directions are fixed” (Ansys, November 2013a, Ansys, November 2013c).
Spring
For the landing consideration a compression spring has been modelled between components (LB-002 and LP-001 (Appendix B.7)). The compression stiffness was set to 300 N/mm and the damping was set to 0 N.s/mm for an initial deflection analysis. The solution is yet to converge due the increased DOF solution from the Ansys modeller.

UAS CHALLENGE 2015
185 Stress Analysis MEng Team Project Report (7ENT1024) School of Engineering and Technology
Section by Amit Ramji
Section by Amit Ramji G.5. Solver Formulation Augmented Lagrange solver method has been used for the majority of contact models involving Bonded and No separation contact, as it is a penalty-based method. In comparison to the Pure Penalty method, this method usually leads to “The Augmented Lagrange method requiring additional iterations, especially if the deformed mesh becomes too distorted” (Ansys, November 2013g). In some analysis cases, Program Controlled or the Pure Penalty method is used for decreasing the solution time and iterations. Such cases include the landing case where solution time is significant due to the Degrees of Freedom of the Undercarriage components.
G.6. Mesh
Element Types Used
SOLID187
The SOLID187 element used as per Table 26 is a high order 3 dimensional, 10-node element. The SOLID187 has a quadratic displacement behaviour and is well suited to modelling irregular meshes (Ansys, November 2013c).
The element allows for having 3 DOF at each node: translations x, y, and z directions. The element has large deflection and strain capabilities; alongside plasticity, hyperelasticity, stress stiffening and creep capabilities. Figure 106 – SOLID187 Element
(Ansys, November 2013c)
PLANE182
The PLANE182 element used as per Table 26 is also known as a QUAD182 [PATRAN Conversion: WEDGE15, HEX20] depending on its use in 2D or 3D configuration. The PLANE182 element can be used for 2D representation of a solid 3D structure.
The element is a 4 node type which has 2 DOF at each node. The element has large deflection and strain capabilities; alongside plasticity, hyperelasticity, stress stiffening and limited 2D creep capabilities (Ansys, November 2013c). Figure 107 – PLANE182 Element (Ansys, November
2013c)

UAS CHALLENGE 2015
186 Stress Analysis MEng Team Project Report (7ENT1024) School of Engineering and Technology
Mesh Refinement
The process of mesh refinement is a post mesh generation step in which elements on the selected parts are split and refined. The process of mesh refinement has only been used for small sub-assemblies where the local features are to be studied, for example in the arm stress cases and motor mount plates. Local mesh refinement has been used on main body plates for entire quad-rotor flight analysis cases at the hole and cut-out locations and has been removed at the arms and motor plate regions to decrease computing time. Mesh refinement being removed from such regions is no longer important as the parts have been justified in another upstream analysis case.
Contact Pinch Controls and Inflation
Pinch controls have been used at contact positions where removal of small features (such as short edges and narrow regions) at the mesh level. Pinch control helps to generate better quality elements around such contact positions as the nodes are aligned and shared between mating components. The Pinch control provides an alternative to Virtual Topology modeling used at geometry level. Both Virtual Topology and Pinch Controls work together to simplify meshing constraints due to small features such as edge chamfers and corner radii and grooves. To further ensure the mesh and analysis was efficient, such small features had been removed in a separate simplified CAD model, which also removed fasteners and small non-structural components. Inflation is used in certain locations where high stress concentrations exist and involves additional layers or elements surrounding the feature under question. An example of where inflation has been used is at the Motor plate fastener positions (Table 26).

UAS CHALLENGE 2015
187 Stress Analysis MEng Team Project Report (7ENT1024) School of Engineering and Technology
Mesh attributes used in Quad-Rotor Analysis
The following mesh properties have been used to identify the localised stress on individual components, for larger assemblies these values have been changed suited to their location within the load path. e.g. Motor Mounting Plates (MP-001) in the entire quad assembly or Arm assembly has had refinement, inflation and contact pinch controls removed to save on computing time and simultaneously provide accurate results of the global assembly (Ansys, November 2013h, Ansys, November 2013d). The cases where detail analysis of failure points is to be considered, pinch controls, inflation and refinement mesh elements have been used in each analysis case where appropriate. The table below is for reference values of mesh values that should be used for such detail analysis.
Part No. (Appendix B.7)
Material ID (Appendix. E)
Property Value Image
MP-001 1
Element Type
Solid – Tet 10 node
Type of Mesh
TET10 – SOLID187
Size (Aspect Ratio)
1.15 (Min)
9.5 (Max)
2.5 (Ave)
Refinement Level 2 @ 40 Hole and Slot Faces
Inflation 3 Layers at Bolt Interface Positions - Growth Rate 1.2
Pinch Controls
Default at Bolt Locations
FB-001 FB-002 MB-001 EB-001 LB-001 LB-002 PB-009 PB-010
3 Element Type
Solid – Tet 10 node
Type of Mesh
TET10 – SOLID187
Size (Aspect Ratio)
1.3 (Min)
26 (Max)
2.8 (Ave)
Refinement None
Inflation None
Pinch Controls
None
FA-001 MA-001 UV-001 UH-001
5 Element Type
Plane – Quad 4 Node
Types of Mesh
PLANE182 / QUAD182, [PATRAN Conversion: WEDGE15, HEX20]
Size (Aspect Ratio)
1.28 (Min)
26.4 (Max)
2.82 (Ave)
Refinement None
Inflation None
Pinch Controls
None

UAS CHALLENGE 2015
188 Stress Analysis MEng Team Project Report (7ENT1024) School of Engineering and Technology
LB-003 3 Element Type
Solid – Tet 10 node
Types of Mesh
TET10 – SOLID187
Size (Aspect Ratio)
1.21 (Min)
52 (Max)
2.84 (Ave)
Refinement None
Inflation None
Pinch Controls
None
LP-001 AP-001
3 Element Type
Solid – Tet 10 node
Types of Mesh
TET10 – SOLID187
Size (Aspect Ratio)
1.28 (Min)
26.4 (Max)
2.82 (Ave)
Refinement None
Inflation None
Pinch Controls
None
TJ-001 TJ-002
3 Element Type
Solid – Tet 10 node
Types of Mesh
TET10 – SOLID187
Size (Aspect Ratio)
1.236 (Min)
44.1 (Max)
3.213 (Ave)
Refinement None
Inflation None
Pinch Controls
None
BP-001, BP-002, PB-004 & PB-005
4 Element Type
Solid – Tet 10 node
Types of Mesh
TET10 – SOLID187
Size (Aspect Ratio)
5mm (Body Size)
1.2 (Min)
15.2 (Max)
3.0 (Ave)
Refinement Level 1 @ 44 Hole and Slot Faces
Inflation 3 Layers at Bolt Interface Positions - Growth Rate 1.2
Pinch Controls
Default at Bolt Locations

UAS CHALLENGE 2015
189 Stress Analysis MEng Team Project Report (7ENT1024) School of Engineering and Technology
PB-001, PB-002, PB-003, PB-006, PB-007 & PB-008
7 Element Type
Plane – Quad 4 Node
Types of Mesh
PLANE182 / QUAD182, [PATRAN Conversion: WEDGE15, HEX20]
Size (Aspect Ratio) Refinement
1.19 (Min)
63.3 (Max)
5.20 (Ave)
None
Inflation None
Pinch Controls
None
Table 26 – Mesh Attributes for Components

UAS CHALLENGE 2015
190 Stress Analysis MEng Team Project Report (7ENT1024) School of Engineering and Technology
Section by Zuber Khan G.7. Stationary Motor Arm Stress Analysis Materials: As per Appendix. E
D1 = 0.06m & 0.067m D2 = 0.23m & 0.247m
Transferring loads from F1 to F2 required a moment transfer using: 𝑀 = 𝐹 × 𝑑
Equation 21 – Moment Calculation
Fixed-arm
Full Arm length of 0.23m 𝑀1 = (1.75 × 9.81) × 0.23 = 3.9485𝑁𝑚 Equation 22 - Moment for Fixed Arm The moment can then be transferred to the first Nylon clamp where D1 =0.06m. Which can then be used to find out the force that will be applied on the Nylon clamps. 3.9485 = 𝐹2 × 0.06 𝐹2 = 65.81𝑁
Maximum Fixed Arm Stress
Maximum force was applied to represent maximum thrust produced by the motor. The thrust was then multiplied by the ‘global load safety factor of 1.5’.
Figure 108 - Arm Cross-section for Stress Calculation To work out the stress in the arm the following equation was used.
𝜎 =𝑀𝑦
𝐼=
𝐹 × 𝑑 ×𝐷12
𝜋64 (𝐷1
4 − 𝐷24)
Equation 23 - Stress in a Cylindrical Pipe (Warren C. Young) When the motors are on full thrust the arm will be under maximum compression on the top surface and under maximum tension on the bottom surface as shown in Figure 109.
Figure 109 - Tension & Compression Stress in Arm
Reaction
Force
0.17m
0.23m
Moment
D1=0.016m
D2=0.0115m
Compression
Tension
F1
D1
F2
D2

UAS CHALLENGE 2015
191 Stress Analysis MEng Team Project Report (7ENT1024) School of Engineering and Technology
Section by Amit Ramji
Section by Zuber Khan Stress analysis at Fixed-arm – Analytical Solution
𝐹 =𝑀𝑇𝑂𝑊
4 𝐴𝑟𝑚𝑠=
7 × 9.81
4≈ 25𝑁
𝜎 =25 × 0.17 ×
0.0162
𝜋64
(0.0164 − 0.01154)= 14416251.37
𝑁
𝑚2
𝜎 = 14.42𝑀𝑃𝑎 (𝑇𝑒𝑛𝑠𝑖𝑜𝑛) & − 14.42𝑀𝑃𝑎 (𝐶𝑜𝑚𝑝𝑟𝑒𝑠𝑠𝑖𝑜𝑛)
Stress analysis at Fixed-arm – FEA Method
Mesh: Values as per section G.6
Figure 110 – Mesh for Fixed-arm Assembly – Values as per Appendix G.6 Results:
Figure 111 - Deflection of Fixed-arm Assembly (Flight Loads) with 7.6mm Deflection

UAS CHALLENGE 2015
192 Stress Analysis MEng Team Project Report (7ENT1024) School of Engineering and Technology
Figure 112 - Stress of Fixed-arm Assembly (Flight Loads) with Stress 15.8MPa (Contact) and 20MPa (Peak)
Figure 113 – Stress (Close-up) of Fixed-arm Assembly (Flight Loads) with Stress 15.8MPa (Contact) and 20MPa (Peak)
FEM Verification: Tube Stress Comparison
One can observe the results from the above analytical stress calculation being 14.42MPa and the
stress level as seen in the far field stress contour of the tube in Figure 109 (15.8MPa) being very
close. Substantiation of the numerical modelling and contact constraints can be deemed as
accurate as a very small difference is observed between the methods.

UAS CHALLENGE 2015
193 Stress Analysis MEng Team Project Report (7ENT1024) School of Engineering and Technology
Section by Zuber Khan
Section by Amit Ramji
G.8. Movable Arm Stress Concentration at Contact Points Materials: As per Appendix. E
Movable-arm
Full Arm length of 0.247m 𝑀1 = (1.75 × 9.81) × 0.247 = 4.2404𝑁𝑚 Equation 24 - Moment for Movable-arm The moment can then be transferred to the first Nylon clamp where D1 =0.067m. This can then be used to find out the force which will be applied on the Nylon clamps. 4.2404 = 𝐹2 × 0.067 𝐹2 = 63.29𝑁
Analytical Stress at Movable-arm
𝜎 =25 × 0.18 ×
0.0162
𝜋64
(0.0164 − 0.01154)= 15264266.16
𝑁
𝑚2
𝜎 = 15.26𝑀𝑃𝑎 (𝑇𝑒𝑛𝑠𝑖𝑜𝑛) & − 15.26𝑀𝑃𝑎 (𝐶𝑜𝑚𝑝𝑟𝑒𝑠𝑠𝑖𝑜𝑛)
The yield strength of the material used for the arms is 55MPa (Appendix. E). One can observe that the arms have a minimum of 3.6 reserve factor remaining, in addition to the added factor of 1.5 for the global safety. From this analysis, it can be justified that the arms at this size and with the properties defined in Appendix. E are suitable for the UAV.
FEA Method for Movable-arm
Mesh: Values as per section G.6
Figure 114 – Mesh for Arm Assembly (With additional Tab) – Mesh Values as per G.6

UAS CHALLENGE 2015
194 Stress Analysis MEng Team Project Report (7ENT1024) School of Engineering and Technology
Results:
An additional 0.4129g results in slightly lower stress levels (see Figure 116 & Figure 118). However the main reason for introducing this modification is to eliminate the possibility of piercing MA-001 during repeated loading. By increasing the contact surface area allows for a more distributed loading edge during deflection. Figure 115 - Modified FB-002 for reduction in point contact stress concentration
Figure 116 - Stress Concentration at Arm (without addition) Contact (a) & Close-up (b)
Modified FB-002 Bracket with Tab Addition
Benefits – Increased fatigue resistance and larger Non-Linear contact area, which is important for repetitive loading and general contact stress reduction. Point contact is now a Line contact (for Non-Linear Flexure) and Line contact is now a Surface Contact (for Linear Flexure).
mOrange = rV =1.15g / cm3 ´3.142cm3 = 3.6133g
mBlue = rV =1.15g / cm3 ´3.501cm3 = 4.0262g
\Dm = +0.4129g

UAS CHALLENGE 2015
195 Stress Analysis MEng Team Project Report (7ENT1024) School of Engineering and Technology
Figure 117 - Deflection of Modified Movable Motor Arm of 7.88mm for flight loads with SF
Figure 118 - Stress of Modified Movable Motor Arm of 20.8MPa for flight loads with SF
Figure 119 - Modified Movable Motor Arm with Stress of 20.8MPa for flight loads with SF (a) & Close-up (b)

UAS CHALLENGE 2015
196 Stress Analysis MEng Team Project Report (7ENT1024) School of Engineering and Technology
Section by Zuber Khan
G.9. Undercarriage Lug Bracket Flange Addition Materials: As per Appendix. E
Lug Analysis Using Analytical Methods
Lug analysis was carried out to calculate if the lug design would be able to cope with the loads put upon it.
Figure 120 - Load on the Lug (Niu, 1988) To carry out the analysis the load was split into components as shown in Figure 121.
Thickness of Lug (t) = 4.5mm Width (W) = 25mm Diameter (D) = 5mm 𝑇𝑟𝑎𝑛𝑣𝑒𝑟𝑠𝑒 𝐿𝑜𝑎𝑑 (𝑃𝑇) = 7 × 1.5 × 9.81 × cos 45 = 72.84𝑁
𝐴𝑥𝑖𝑎𝑙 𝐿𝑜𝑎𝑑 (𝑃𝐴) = 7 × 1.5 × 9.81 × cos 45 = 72.84𝑁 Ultimate strength of the material (Ftu) = 85MPa Figure 121 - Components of the Load (Niu, 1988)
The Areas on the lug were determined to be able to calculate the maximum allowable load.
𝐴𝑟𝑒𝑎 𝐴1 = ((𝑊𝑖𝑑𝑡ℎ
2) − (
0.707 × 𝐷𝑖𝑎𝑚𝑒𝑡𝑒𝑟
2)) × 𝑇ℎ𝑖𝑐𝑘𝑛𝑒𝑠𝑠
𝐴𝑟𝑒𝑎 𝐴1 = ((25
2) − (
0.707 × 5
2)) × 4.5 = 48.29𝑚𝑚2
Equation 25 - Area A1 on Lug (Niu, 1988)
𝑨𝒓𝒆𝒂 𝑨𝟐 = (𝑾𝒊𝒅𝒕𝒉−𝑫𝒊𝒂𝒎𝒆𝒕𝒆𝒓
𝟐) × 𝑻𝒉𝒊𝒄𝒌𝒏𝒆𝒔𝒔AreaA2 =
(Width-Diameter
2) × Thickness = (
𝟐𝟓−𝟓
𝟐) × 𝟒. 𝟓 = 𝟒𝟓𝒎𝒎𝟐
Figure 122 - Areas on the Lug Equation 26 – Area A2 on Lug (Niu, 1988)
𝐴𝑟𝑒𝑎 𝐴3 = 𝐴𝑟𝑒𝑎 𝐴2 Equation 27 - Area A3 on Lug (Niu, 1988)
𝐴𝑟𝑒𝑎 𝐴4 = 𝐴𝑟𝑒𝑎 𝐴1 Equation 28 - Area A4 on Lug (Niu, 1988)
𝐴𝑣𝑒𝑟𝑎𝑔𝑒 𝐴𝑟𝑒𝑎 (𝐴𝑎𝑣) = 6
3𝐴1 +
1𝐴2 +
1𝐴3 +
1𝐴4
= 6
348.296 +
145
+1
45+
148.296
= 47.145𝑚𝑚2
Equation 29 - Average Area of Lug (Niu, 1988)
PA
PT
D W
PT
A2
A1 A3
A4
45'

UAS CHALLENGE 2015
197 Stress Analysis MEng Team Project Report (7ENT1024) School of Engineering and Technology
Section by Amit Ramji
𝐵𝑒𝑎𝑟𝑖𝑛𝑔 𝐴𝑟𝑒𝑎 (𝐴𝑏𝑟) = 𝑇ℎ𝑖𝑐𝑘𝑛𝑒𝑠𝑠 × 𝐷𝑖𝑎𝑚𝑒𝑡𝑒𝑟 = 4.5 × 5 = 22.5𝑚𝑚2
Equation 30 - Bearing Area on Lug (Niu, 1988)
𝐴𝑎𝑣
𝐴𝑏𝑟= 2.095 Using 2.095 and the tension efficiency graph a Ktu & Kty value of 0.923 was
determined. Therefore the allowable traverse load = Ktu x Abr x Ftu = 1765.15
Therefore the reserve factor for the lug is: 𝑅. 𝐹 =1765.15
72.84= 24.23
From this one can conclude that the lug is more than sufficient for the purpose of this UAV.
Lug Analysis Using FEA Methods with Flange addition
Mesh: Values as per section G.6 Results: Previous Lug Bracket without Flange To improve the stress distribution within the Lug bracket (LB-003) for the Undercarriage, additional flanges have been incorporated to distribute the load evenly to the fastened plate face. It proves beneficial to repeated heavy landings and side impact cases.
Figure 123 - Lug Bracket Without Flange (Left) & with additional Flange (Right)
An additional 0.67g results in lower stress levels (see Figure 124) and is also beneficial for repeated loading and impact consideration during a side impact landing as demonstrated in Appendix G.13. Although the Lug Bracket (LB-003) in Figure 123 (Right) is more complex to machine, the design is a one-off and if a series production part was to be introduced, an injection moulded equivalent would take its place and be simpler and quicker to manufacture. The additional flange demonstrates that the small addition of material can improve the structural performance and repeated loading capability of parts significantly.
mLeft = rV =1.15g / cm3 ´8.833cm3 =10.1579g
mRight = rV =1.15g / cm3 ´9.415cm3 =10.8272g
\Dm = +0.67g

UAS CHALLENGE 2015
198 Stress Analysis MEng Team Project Report (7ENT1024) School of Engineering and Technology
Figure 124 – Lateral Unit Load Deflection (Left) & Stress (Right) of Lug Bracket Without Flange Modified Lug Bracket with Flange Addition Benefits – Increased fatigue resistance and multiple load paths which is important with repetitive heavy landing and sideward crash cases.
Figure 125 – Lateral Unit Load Deflection (Left) & Stress (Right) of Lug Bracket With Flange

UAS CHALLENGE 2015
199 Stress Analysis MEng Team Project Report (7ENT1024) School of Engineering and Technology
Section by Amit Ramji G.10. Motor Plate Stress Analysis Materials: As per Appendix. E Mesh: Values as per section G.6
Figure 126 - Mesh for MP-001 (Appendix B.7) with values as per Appendix G.6 Results:
Figure 127 – Motor Plate Deflection (0.038 mm) and Stress (41.7 MPa) for flight case with SF at start-up
Figure 128 - Error Elements in Model - Due to Separation at FB-001 and EB-001
25N Flight Case at 4 RBE3’s 10 Nm of Torque* *(Translated to 4 RBE3’s as in-plane Loads)

UAS CHALLENGE 2015
200 Stress Analysis MEng Team Project Report (7ENT1024) School of Engineering and Technology
Section by Zuber Khan
Section by Zuber Khan
G.11. Main Body Plate Stress Analysis Materials: As per Appendix. E
Simply Supported Plate Deflection
A simple plate deflection was determined of a 2mm thick Nylon plate with dimensions of 315mm by 280mm. This was the largest the plate would go to on the UAV if necessary therefore was used for the purpose of this analysis. The reason for doing this was to compare the analytical results with the results produced by the FEA model. If the results were similar or close to the analytical method, the method could be applied to the whole UAV model.
Figure 129 - Simplified Plate Representations All the edges are simply supported for this analysis.
Analytical Method
Below are the Navier stokes equations used to work out the plate deflection at the centre, where the maximum deflection will take place from engineering judgement.
𝐷 = 𝐸𝑡3
12(1 − 𝑣2)
Equation 31 - Flexural Rigidity of the Plate (Ventsel and Krauthammer, 2001)
𝑤(𝑥, 𝑦) = ∑ ∑ 𝑤𝑚𝑛 sin𝑚𝜋𝑥
𝑎sin
𝑛𝜋𝑦
𝑏
∞
𝑛=1
∞
𝑚=1
= 𝑤11 sin𝜋𝑥
𝑎sin
𝜋𝑦
𝑏+ 𝑤12 sin
𝜋𝑥
𝑎sin
2𝜋𝑦
𝑏+ 𝑤21 sin
2𝜋𝑥
𝑎sin
𝜋𝑦
𝑏+ …
Equation 32 – Navier solution (Ventsel and Krauthammer, 2001)
𝑎𝑚𝑛 =16𝑞0
𝑚𝑛𝜋2
Equation 33 - Navier stokes coefficient 1 (Ventsel and Krauthammer, 2001)
𝑤𝑚𝑛 =1
𝜋4𝐷
𝑎𝑚𝑛
[(𝑚2
𝑎2 ) + (𝑛2
𝑏2)]2
Equation 34 - Navier Stokes coefficient 2(Ventsel and Krauthammer, 2001) First the pressure distributed on the whole plate surface was calculated. 𝐹𝑜𝑟𝑐𝑒
𝐴𝑟𝑒𝑎=
33.8445
88200 × 10−6= 383.72
𝑁
𝑚2
Followed by calculating the flexural rigidity
𝐷 = 3300 × 106 × 0.0023
12(1 − 0.42)= 2.61905
The Navier coefficients 1 and 2 could be calculated for when mn = 1 1, 1 3, 3 1, 3 3
𝑎11 =16×383.72
1×1×𝜋2 = 622.063 𝑎13 = 207.35 𝑎31 = 207.35 𝑎33 = 69.12
X = a = 315mm
Y
=
b
=
280
mm
Youngs Modulus, E = 3300MPa Thickness, t = 0.002m Poisson’s Ratio, v =0.3 Distributed Force = 33.8445N Area = 88200 x 10e-6 m2

UAS CHALLENGE 2015
201 Stress Analysis MEng Team Project Report (7ENT1024) School of Engineering and Technology
Section by Zuber Khan
w11 =1
π4 × 2.61905
622.063
[(12
0.3152) + (12
0.282)]2 = 4.67689 × 10⁻³
w13 =1
π4 × 2.61905
207.35
[(12
0.3152) + (32
0.282)]2 = 5.21215 × 10⁻⁵
w31 =1
π4 × 2.61905
207.35
[(32
0.3152) + (12
0.282)]2 = 7.59333 × 10⁻⁵
𝑤33 =1
𝜋4 × 2.61905
69.12
[(32
0.3152) + (32
0.282)]2 = 6.41566 × 10⁻⁶
The coefficients were then input into the Navier solution equation to calculate the deflection at the centre.
𝑤(𝑥, 𝑦) = 4.67689 × 10⁻³ × sin (𝜋 × 0.1575
0.315) × sin (
𝜋 × 0.14
0.28) + 5.21215 × 10⁻⁵ × sin (
π × 0.1575
0.315)
× sin (3π × 0.14
0.28) + 7.59333 × 10⁻⁵ × sin (
3π × 0.1575
0.315)
× sin (π × 0.14
0.28) + 6.41566 × 10⁻⁶ × sin (
3π × 0.1575
0.315) × sin (
3π × 0.14
0.28)
w(x, y) = 4.67689 × 10⁻³ − 5.21215 × 10⁻⁵ − 7.59333 × 10⁻⁵ + 6.41566 × 10⁻⁶
w(x, y) = 4.555 × 10⁻³m = 4.555mm
FEA – Simplified Rectangular Approximation
Using Catia the same plate was modelled with the same constraints and loads to see the deflection it would cause.
Figure 130 - Simple Plate Deflection Carried out on CATIA structural analysis

UAS CHALLENGE 2015
202 Stress Analysis MEng Team Project Report (7ENT1024) School of Engineering and Technology
Section by Amit Ramji
From the FEA model it can be observed that the deflection has been calculated to be 4.54mm. The mesh used was set to a size of 2mm with absolute sag of 1.5mm. Therefore any further plate bending analysis carried out on CATIA, should be set to the same mesh size and constraints as it has been substantiated to provide accurate answers.
Method Deflection
Analytical (Rectangular Plate) 4.555mm
FEA CATIA (Rectangular Plate) 4.54mm
Table 27 – Comparison of Simplified Plate Deflection for Model Substantiation
FEA – As Built (Single Plate) Ansys Results
Mesh: Values as per section G.6
Figure 131 - Mesh of Main Body Plate - Values as per Appendix G.6 Results:
Figure 132 – Single Main Body Plate Analysis – with 17.8MPa Stress at contact holes for flight case with pressure load

UAS CHALLENGE 2015
203 Stress Analysis MEng Team Project Report (7ENT1024) School of Engineering and Technology
Section by Amit Ramji
G.12. Main Body Plate Stress Analysis as Built Ansys Results Materials: As per Appendix. E Representation: In order to carry out a quick analysis of the main body assembly, point masses for the payload, systems and batteries had been added to the structure with the masses defined in Appendix. C.
Figure 133 – Mass Representation of components and payloads as per Appendix. C Mesh: Values as per section G.6
Figure 134 - Mesh of Main body assembly with Values as per Appendix G.6 Results:
Figure 135 – Contact model Flight Case for Main body assembly Deflection (left) and Equivalent Stress (right)

UAS CHALLENGE 2015
204 Stress Analysis MEng Team Project Report (7ENT1024) School of Engineering and Technology
Section by Zuber Khan
Figure 136 - Contact model Flight Case for Main body assembly - Equivalent Stress with predicted locations
G.13. Undercarriage Buckling and Torsion Cases Materials: As per Appendix. E
Undercarriage Stress Analysis
For carrying out the undercarriage stress analysis the leg was treated as a single entity. The loads were first applied individually to see how the material would react and if it would be able to cope for the initial sizing stage. For all the cases the worst-case scenario would be the full weight of the UAV landing on one leg.
Analytical – Undercarriage Leg Buckling – Without Spring
To calculate the leg buckling stress and critical load, the following equations were used.
𝑛𝐿
𝜌≥ √
𝜋2𝐸
𝜎𝑦𝑠
Equation 35 – Slenderness Ratio (Warren C. Young)
𝜌 = √𝐼
𝐴
Equation 36 - Radius of Gyration (Warren C. Young)
𝑃𝐶𝑅 =𝜋2𝐸𝐼
(𝑛𝐿)2
Equation 37 - Critical Load to Cause Buckling (Warren C. Young)
𝜎𝐶𝑅 =𝜋2𝐸
(𝑛𝐿𝜌 )
2
Equation 38 - Critical Stress to Cause Buckling (Warren C. Young) The assumption was made whilst calculating the buckling load and stress that 1 end was fixed due to a jam and one end free resulting in the equivalent length ‘n value’ to be 2. Working out the second moment of area of the tube.
𝐼 =𝜋
64(𝐷4 − 𝑑4) =
𝜋
64(0.0164 − 0.01154) = 2.35845 × 10⁻⁹𝑚4
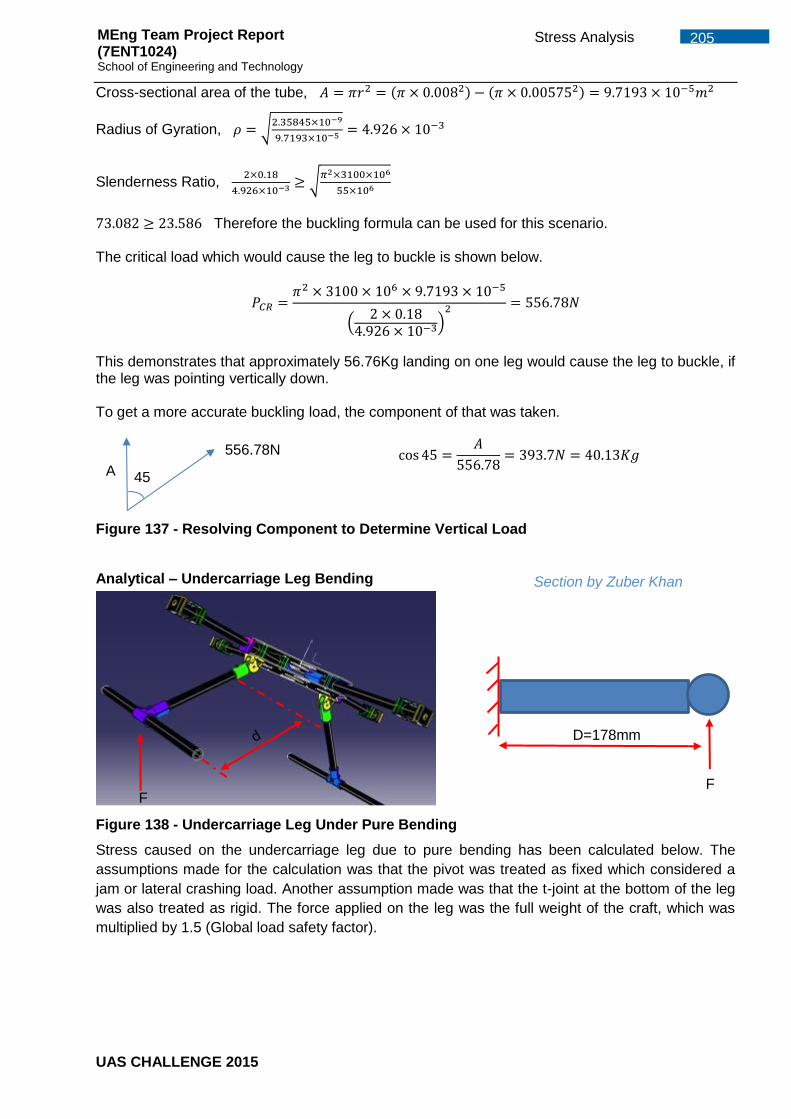
UAS CHALLENGE 2015
205 Stress Analysis MEng Team Project Report (7ENT1024) School of Engineering and Technology
Section by Zuber Khan
Cross-sectional area of the tube, 𝐴 = 𝜋𝑟2 = (𝜋 × 0.0082) − (𝜋 × 0.005752) = 9.7193 × 10⁻⁵𝑚2
Radius of Gyration, 𝜌 = √2.35845×10⁻⁹
9.7193×10−5 = 4.926 × 10⁻³
Slenderness Ratio, 2×0.18
4.926×10⁻³ ≥ √𝜋2×3100×106
55×106
73.082 ≥ 23.586 Therefore the buckling formula can be used for this scenario. The critical load which would cause the leg to buckle is shown below.
𝑃𝐶𝑅 =𝜋2 × 3100 × 106 × 9.7193 × 10−5
(2 × 0.18
4.926 × 10⁻³)2 = 556.78𝑁
This demonstrates that approximately 56.76Kg landing on one leg would cause the leg to buckle, if the leg was pointing vertically down. To get a more accurate buckling load, the component of that was taken.
cos 45 =𝐴
556.78= 393.7𝑁 = 40.13𝐾𝑔
Figure 137 - Resolving Component to Determine Vertical Load
Analytical – Undercarriage Leg Bending
Figure 138 - Undercarriage Leg Under Pure Bending
Stress caused on the undercarriage leg due to pure bending has been calculated below. The
assumptions made for the calculation was that the pivot was treated as fixed which considered a
jam or lateral crashing load. Another assumption made was that the t-joint at the bottom of the leg
was also treated as rigid. The force applied on the leg was the full weight of the craft, which was
multiplied by 1.5 (Global load safety factor).
D=178mm
F F
45°
556.78N
A

UAS CHALLENGE 2015
206 Stress Analysis MEng Team Project Report (7ENT1024) School of Engineering and Technology
Section by Zuber Khan
Equation 23 is used to determine the stress in the tube.
𝜎 =𝑀𝑦
𝐼=
𝐹 × 𝑑 ×𝐷12
𝜋64 (𝐷1
4 − 𝐷24)
𝜎 =7 × 1.5 × 9.81 × 0.178 ×
0.0162
𝜋64
(0.0164 − 0.01154)=
0.14668
2.35845 × 10−9= 62193016.6𝑃𝑎 = 62.2𝑀𝑃𝑎
62.2MPa is the maximum stress the leg would undergo under pure bending if the UAV were to land on one leg. This would cause the leg to yield however the load applied is excessive and it is applied only to one leg, which would not occur repeatedly. Additionally this analysis does not consider the entire body deflection that would dramatically reduce the stress levels. In this calculation, the pivot is assumed to be fixed with infinite stiffness, however in reality this cannot be true, as the main assembly would also deflect. Working backwards using Equation 23 the max force could be found out which would cause the undercarriage leg to yield.
55 × 106 =𝐹 × 0.178 × 0.008
2.35845 × 10−9= 91.0918𝑁 = 9.29𝐾𝑔
9.29Kg is the force required in pure bending to cause the leg to yield. This is a significantly low load, however in reality the UAV would land on both legs repeatedly therefore this force could be doubled. The undercarriage design proposes to incorporate springs to help reduce the impact force on the structure and provide some give by allowing for a designed deflection.
Analytical – Undercarriage leg Torsion
Stress caused on the undercarriage leg due to pure torsion has been calculated below. The assumptions made for the calculation was that the pivot was treated as fixed which considered a jam in the pivot mechanism. Another assumption made was that the t-joint at the bottom of the leg was also treated as rigid. The force applied on the leg was the full weight of the craft which was multiplied by 1.5 (Global load safety factor). Figure 139 - Undercarriage Leg Under Pure Torsion
𝜃 =𝑇𝐿
𝐺𝐽
Equation 39 - Angle of Twist (Warren C. Young)
G = Shear Modulus = 1.0993 x 10⁹Pa (Appendix. E)
𝐽 =𝜋𝑑4
32=
𝜋 × (164 − 11.54)
32= 4716.899𝑚𝑚4
Equation 40 - Polar Moment (Warren C. Young)
F

UAS CHALLENGE 2015
207 Stress Analysis MEng Team Project Report (7ENT1024) School of Engineering and Technology
Section by Zuber Khan
T=Torque Applied = 7 × 1.5 × 175 × 9.81 = 18025.9𝑁𝑚𝑚 L= Length = 0.175m Therefore the twist angle was calculated to be:
𝜃 =18025.9 × 180
1.0993 × 103 × 4716.899= 0.6257 𝑟𝑎𝑑 = 35.85°
𝜏 =𝑇𝑟
𝐽
Equation 41 - Shear Stress (Warren C. Young) For shear stress to be maximum, r (radius) needs to be maximum.
𝜏 =18025.9 × 8
4716.899= 30.57𝑀𝑃𝑎
Yield in shear = 1099.3MPa (Appendix. E) Therefore the material is suitable to withstand maximum torque which could be applied on it with an RF=35 in this loading condition.
Analytical – Undercarriage Combined Loading – Bending, Buckling and Torsion
A combined loading analysis was carried out in which 3 different forces are applied to the undercarriage at the same time to see if the material can withstand the loads. The loads which were applied were a bending load, buckling force and a torque at the bottom of the leg with an applied 1.5 global load safety factor. If the material can withstand the loads without yielding it can be assumed that the material is suitable, and can withstand the worst loads the UAV shall face.
Figure 140 - Stress Element A (Warren C. Young) Using the stress element A as shown in Figure 140, the equations of combined load can be used. A plan view of element A has been shown below.
Figure 141 - Plan View of Stress Element A
T = Torque
Buckling Load
Bending Load
𝜏𝑥𝑦
𝜎𝑥
𝜎𝑦
𝜏𝑥𝑦
𝜏𝑦𝑥
𝜎𝑦
𝜎𝑥
𝜏𝑦𝑥
A

UAS CHALLENGE 2015
208 Stress Analysis MEng Team Project Report (7ENT1024) School of Engineering and Technology
The formulas used to work out the combined stress and their principle angles have been shown below.
𝜎𝑥 = −𝐹
𝐴
Equation 42 - Compression Stress on Pipe (Warren C. Young)
𝜎𝑦 =𝑀𝑦
𝐼=
𝐹 × 𝑑 ×𝐷12
𝜋64 (𝐷1
4 − 𝐷24)
Equation 23 - Stress in a Cylindrical Pipe (Warren C. Young)
𝜏 =𝑇𝑟
𝐽
Equation 41 - Shear Stress (Warren C. Young)
𝜎1 =𝜎𝑥 + 𝜎𝑦
2±
1
2√(𝜎𝑥 − 𝜎𝑦)
2+ 4𝜏𝑥𝑦
2
Equation 43 - Principle Stress 1 and 2 (Warren C. Young)
The compression stress on the leg using Equation 42: 𝜎𝑥 = −7×1.5×9.81
𝜋
4(162−11.52)
= −1.059798𝑁
𝑚𝑚2
Bending stress on the leg using Equation 23: 𝜎𝑦 =𝑀𝑦
𝐼=
7×1.5×0.178×0.016
2𝜋
64(0.0164−0.01154)
= −6.34𝑀𝑃𝑎
Shear stress on the leg using Equation 41: 𝜏 =7×1.5×0.175×9.81×8
4716.878884= 30.572𝑀𝑃𝑎
Using the above stresses the principle stress could be worked out using Equation 43:
𝜎1 =−1.059798 − 6.34
2+
1
2√(−1.059798 − 6.34)2 + 4 × 30.5722 = 27.095 𝑀𝑃𝑎
𝜎2 =−1.059798 − 6.34
2−
1
2√(−1.059798 − 6.34)2 + 4 × 30.5722 = −34.495 𝑀𝑃𝑎
Using the stresses above the principle angles were determined to show the direction they were in.
tan 2𝜃 =2𝜏𝑥𝑦
𝜎𝑥−𝜎𝑦=
2×30.572
−1.059798−6.34= −8.2629 ∴ 𝜃1 = −41.55° & 𝜃2 = 48.45°
Equation 44 - Principle Stress Angles (Warren C. Young) The principle stresses and their angles could then be applied to Figure 141. Figure 142 - Stress Element A with Principle Stresses
𝜏𝑥𝑦
𝜎𝑥
𝜎𝑦
𝜏𝑥𝑦
𝜏𝑦𝑥 𝜎𝑦
𝜎𝑥
𝜏𝑦𝑥
A 𝜃1
𝜃2
27.095
-34.495

UAS CHALLENGE 2015
209 Stress Analysis MEng Team Project Report (7ENT1024) School of Engineering and Technology
Section by Amit Ramji
The maximum shear caused by the combined loadings has been calculated below using Equation 45.
𝜏 =1
2√(𝜎𝑥 − 𝜎𝑦)
2+ 4𝜏𝑥𝑦
2
Equation 45 - Shear Due to Combined Loadings
𝜏 =1
2√(−1.059798 − 6.34)2 + 4 × 30.5722 = 30.795𝑀𝑃𝑎
It can be concluded that the material would be able to withstand the maximum shear cause by the combined loadings.
FEA Solutions
Mesh: Values as per Appendix G.6
Figure 143 - Undercarriage Mesh for Contact Model with values as per G.6
FEA Results – Bending – Lateral Crash Landing
Figure 144 – Lateral Landing on Single Undercarriage Leg with 53.6mm Deflection

UAS CHALLENGE 2015
210 Stress Analysis MEng Team Project Report (7ENT1024) School of Engineering and Technology
Figure 145 - Lateral Landing on Single Undercarriage Leg with 60MPa Bending Stress Figure 145 and Figure 146 show the results of the bending analysis to be 60MPa. The analytical bending calculation from above also results in a similar bending stress of 62.2MPa. The justifications on yielding in the above section still hold true for this analysis.
As above, the entire structure will deform and reduce stress hence 60MPa is not a realistic situation. This infinite stiffness constraint can be solved by finer mesh and adding a spring (Deformable support) with the stiffness of Nylon at the Lug bracket holt-holes. Figure 146 - Lateral Landing on Single
Undercarriage Leg with 60MPa Bending Stress (Close-up)
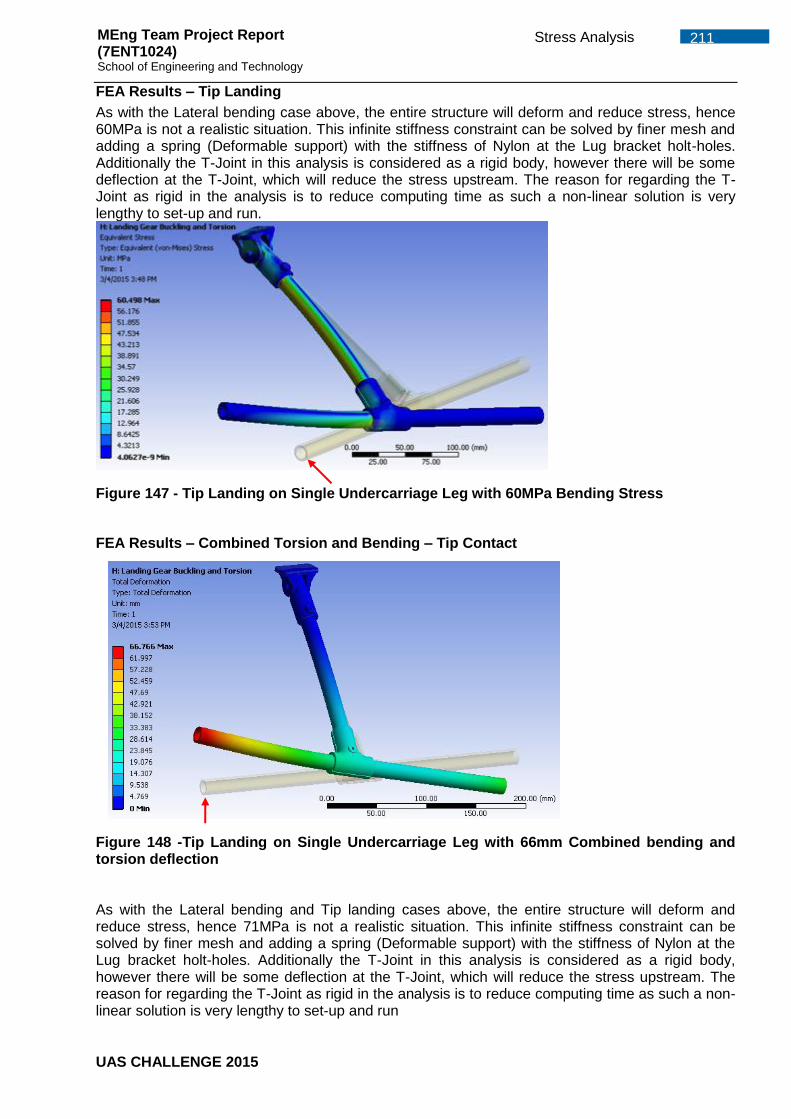
UAS CHALLENGE 2015
211 Stress Analysis MEng Team Project Report (7ENT1024) School of Engineering and Technology
FEA Results – Tip Landing
As with the Lateral bending case above, the entire structure will deform and reduce stress, hence 60MPa is not a realistic situation. This infinite stiffness constraint can be solved by finer mesh and adding a spring (Deformable support) with the stiffness of Nylon at the Lug bracket holt-holes. Additionally the T-Joint in this analysis is considered as a rigid body, however there will be some deflection at the T-Joint, which will reduce the stress upstream. The reason for regarding the T-Joint as rigid in the analysis is to reduce computing time as such a non-linear solution is very lengthy to set-up and run.
Figure 147 - Tip Landing on Single Undercarriage Leg with 60MPa Bending Stress
FEA Results – Combined Torsion and Bending – Tip Contact
Figure 148 -Tip Landing on Single Undercarriage Leg with 66mm Combined bending and torsion deflection As with the Lateral bending and Tip landing cases above, the entire structure will deform and reduce stress, hence 71MPa is not a realistic situation. This infinite stiffness constraint can be solved by finer mesh and adding a spring (Deformable support) with the stiffness of Nylon at the Lug bracket holt-holes. Additionally the T-Joint in this analysis is considered as a rigid body, however there will be some deflection at the T-Joint, which will reduce the stress upstream. The reason for regarding the T-Joint as rigid in the analysis is to reduce computing time as such a non-linear solution is very lengthy to set-up and run

UAS CHALLENGE 2015
212 Stress Analysis MEng Team Project Report (7ENT1024) School of Engineering and Technology
Section by Amit Ramji
Figure 149 - Tip Landing on Single Undercarriage Leg with 71MPa Combined bending and torsion stress
FEM Verification – Summary or Undercarriage Results
Case Description Deflection (mm) or (deg)
Equivalent Load (N) or Stress (MPa)
Buckling Analytical Axial loading of UV-001 N/A 393.7N
Bending Analytical Bending of UV-001
N/A 62.2MPa
Bending FEA 53.6 mm 60.63MPa
Torsion Analytical Torsion of UV-001 35.85 deg 30.57MPa
Combined Analytical
Combined Bending and Torsion of UV-001
N/A 34.495MPa
Combined FEA 66.76mm 71.76MPa
Table 28 – Summary of Undercarriage Results

UAS CHALLENGE 2015
213 Stress Analysis MEng Team Project Report (7ENT1024) School of Engineering and Technology
Section by Amit Ramji
G.14. Entire Quad Non-Liner Contact Model – Flight Case Parts: As per Appendix B.7 Materials: As per Appendix. E Mesh: Values as per section G.6 Results:
Figure 150 – Entire Quad-Rotor Flight Deflection of 7.9mm at Motor Arm Tips
Figure 151 - Entire Quad-Rotor Flight Deflection of 7.9mm at Motor Arm Tips (Close-up)
Figure 152 - Entire Quad-Rotor Flight Stress of 28.8 MPa at Motor mount plates

UAS CHALLENGE 2015
214 Stress Analysis MEng Team Project Report (7ENT1024) School of Engineering and Technology
Figure 153 - Entire Quad-Rotor Flight Stress with Plate Stress peak at 14.42Mpa

UAS CHALLENGE 2015
215 Stress Analysis MEng Team Project Report (7ENT1024) School of Engineering and Technology
Section by Amit Ramji
G.15. Payload Housing Non-Liner Contact Model – Old Design Parts: As per Appendix B.7 Materials: As per Appendix. E Mesh: Values as per section G.6 Results:
Figure 154 – Downward Load - 1kg Payload and 10N Additional Load onto PB-005 Plate
Figure 155 - Side Load - 1kg Payload and 10N Additional Load onto Hinge Plate at 45deg to horizontal
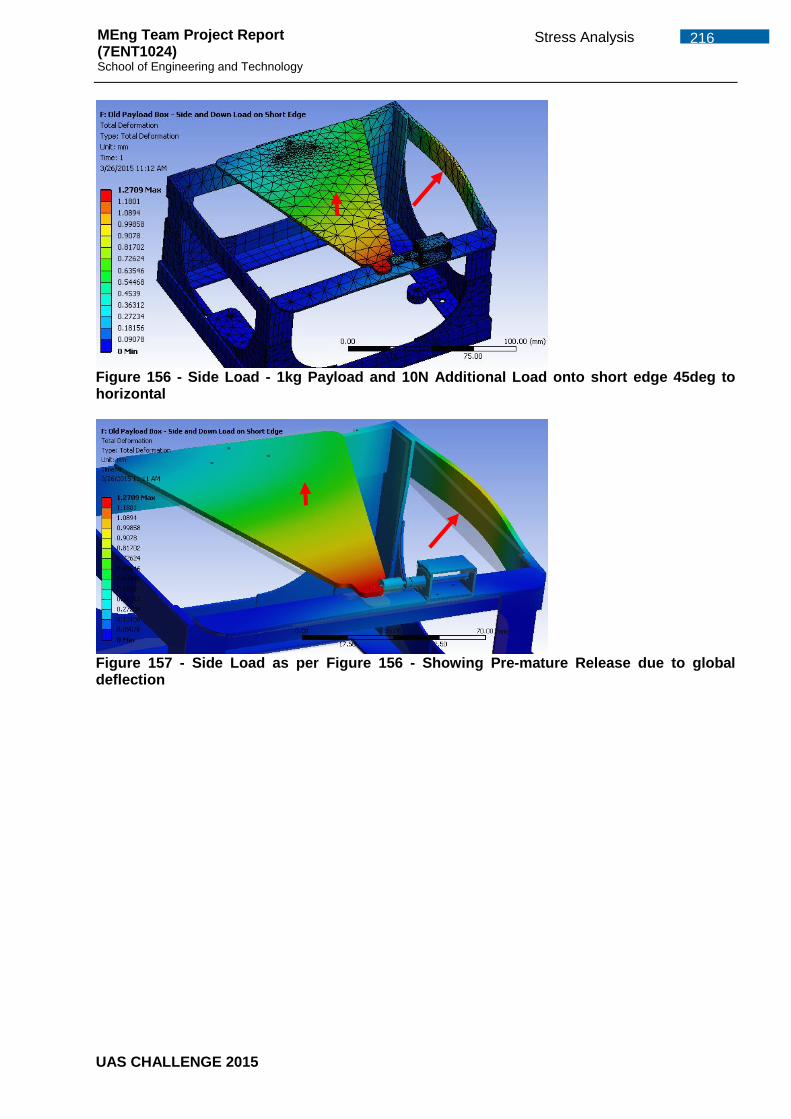
UAS CHALLENGE 2015
216 Stress Analysis MEng Team Project Report (7ENT1024) School of Engineering and Technology
Figure 156 - Side Load - 1kg Payload and 10N Additional Load onto short edge 45deg to horizontal
Figure 157 - Side Load as per Figure 156 - Showing Pre-mature Release due to global deflection

UAS CHALLENGE 2015
217 Stress Analysis MEng Team Project Report (7ENT1024) School of Engineering and Technology
Section by Amit Ramji
G.16. Payload Housing Non-Liner Contact Model – New Design
Modification of PB-006 and PB-008 to result in a more rigid design to avoid pre-mature deployment of payload and incorporation of two smaller hinge positions. Parts: As per Appendix B.7 Materials: As per Appendix. E Mesh: Values as per section G.6 Results:
Figure 158 – Downward Load as per Figure 154 - new design showing 0.73mm Deflection
Figure 159 - Side Load as per Figure 155 –new rigid design and Deflection of 1.56mm
*No pre-mature deployment during manoeuvres as seen in the previous design from Figure 156 and Figure 157 Figure 160 – Side Load as per Figure 156 and Figure 157 – with new design and deflection of 0.41mm*

UAS CHALLENGE 2015
218 Stress Analysis MEng Team Project Report (7ENT1024) School of Engineering and Technology
Section by Amit Ramji G.17. Finite Element Model Checking For the majority of Finite Element Analysis (FEA) modelling used in industry, a sample analytical
calculation should be carried out on a simplified load case or geometry or by correlation with a
physical test. However for the majority of cases, usage of material is required and modal response
is not possible in most laboratories due to costly test equipment and resources. The simplified
geometry cases show substantiation is possible by using the same modelling techniques and
contact types.
As a result, FEA techniques with guidance from NAFEMS and by reference to Ansys
guides*shows good correlation for the analytical solutions and complex non-linear contact models.
Model checks have been carried out at various stages which include material properties, geometry
checks, mesh sizes, boundary conditions and preliminary validation checks such as free modal
analysis in the static workbench, resulting in a zero displacements in all DOF at 0 Hz. Additional
quick model checks as those described in Appendix G.4 make use of initial bonded contacts to
check if all parts of assemblies have been well constrained and later refined before investing
further computing time.
UAS CHALLENGE 2015
219 Performance & Propulsion MEng Team Project Report (7ENT1024) School of Engineering and Technology
Appendix. H Performance & Propulsion
H.1. Propulsion
This section investigates the possible inrunner and outrunner electric motors, propellers, and power sources
that are capable of producing the thrust required to firstly lift the Hex-rotor, and secondly attain the velocity
required to complete the challenge on time before the batteries are exhausted.
1. To calculate Hex-rotor’s performance the MTOW weight is vital, and for this initially 7kg was used
based on 2kg payload, 1.5kg power source, 1.2kg propeller, motors and attachment, the frame and
all other electronics components adding to 2kg plus another 5% for possible unexpected weight
addition.
2. Identified Hover thrust – Using MTOW of 7kg it was identified that for the Hex-rotor to hover it would
require each of the six motors to produced 1.167kg of thrust to hover in 1g
3. Identified thrust for manoeuvrability – Using an equation provided by leading multicopter builders just
as DJI, thrust required for improved manoeuvrability was calculated
(MTOW ∗ 2 ∗ 1.2
Number of motors) = 2.8kg of thrust/motor
4. Identified performance criteria to complete the mission in 2minutes – The mission consists of a
range of 2km, taking into account 2 minutes the velocity that the Hex-rotor requires to travel at is
16.67m/s (32knots) taking into account 12.8m/s (25knot) gust and 10.2m/s (20knot) wind the Hex-
rotor would require to travel at relative speed of 29.7m/s (57knots)
5. Propeller, Motor, ESC and Battery selection- It was very quickly identified that a low rpm/V brushless
electric motor was required so that it can use a large propeller with high pitch so that it can produce
the lift and thrust required but also not too larger of a propeller so the velocity isn’t sacrificed. The
selection of these important components required the use of a sophisticated website called
ecalc.com and theoretical calculations, which identified 20 different combination of producing the
thrust required, velocity required and battery life that can last greater than 2 minutes. By performing
these calculations it helped to narrow down from countless number of propeller, motor, ECS and
battery combinations that would achieve the specification required. Specification of these
components can be found in Apendix E
6. Calculations using xcalc.com
As it can be seen from Appendix C the Turnigy G32-770kv motor has a maximum of 1000Watts. The
1000W is based on no load condition were a propeller is not attached to the motor, but these
conditions change when a propeller is added to the motors, the effect is that the added load reduces
the motors capability to 791.9W. The motor itself also has an efficiency factor of 0.882 which is
specified by the manufacturer that further reduces the motors capability to 698.2W
Performance Calculations
The flight profile for the Hex-rotor has been calculated using the flight path specified in Appendix C and the
performance calculations has been based on using the Turnigy G32-770 motor, APC-E 11x7 composite
propellers, 60A ESC and 16000mAh lipo batteries options include using 5S but cost constraints may result in
using multiple 3S or 4S. Results of the flight profile, velocity, time, distance covered and battery status are
presented below table 1.1.1

UAS CHALLENGE 2015
220 Performance & Propulsion MEng Team Project Report (7ENT1024) School of Engineering and Technology
Table 1.1.1 shows Realistic Calculation Under Windy Condition
Location Velocity (m/s) Time (s) Battery Status (%) Distance Covered (m)
[Runway] 0 0 100 0
[Runway]-[30.5m Altitude] 6.77 3.85 98.7 26.2
[30.5m Altitude]-[1] 15.932 16 92.5 (282-26)=255.8
At [1] half loiter performed 8 0.875 92.2 7
[1]-[2] 15.932 50.78 66.5 (842-7-26)=809
[30.5m Altitude]-[descend to
1m]
6.77 3.85 65.3 26.2
Hover N/A 5 64.5 N/A
From 1m to 30.5m 6.77 3.85 63.3 26.2
[30.5m]-[3] 15.932 24.6 51.8 (418-26.2)=391.8
At [3] half loiter performed 8 0.875 51.5 7
[3]-[Target] 15.932 18.9 42.7 (334-7-26)=301
[30m Altitude]-[descend to
1m]
6.77 3.85 41.3 26.2
Hover N/A 5 40.5 N/A
From 1m to 30.5m 6.77 3.85 39.1 26.2
[30.5m]-[Runway] 15.932 6.13 36.2 (124-26.2)=97.8
Hover N/A 5 35 N/A
Total N/A 152.41
(2.54
minutes)
N/A 2000
Sample Calculation
Max velocity calculation
Total Thrust = Max thrust per motor*number of motors*9.81
Total thrust = 2.8kg*6*9.81m/s2 = 164.8N
Total thrust produced at 49degree tilt angle = Total thrust*Cos(ϴ)
Total thrust produced at 49degree tilt angle = 164.8Cos(49) = 108N
Max velocity (m/s) = √𝑇𝑜𝑡𝑎𝑙 𝑡ℎ𝑟𝑢𝑠𝑡 𝑝𝑟𝑜𝑑𝑢𝑐𝑒𝑑 𝑎𝑡 49𝑑𝑒𝑔𝑟𝑒𝑒 𝑡𝑖𝑙𝑡 𝑎𝑛𝑔𝑙𝑒
2∗𝜌∗𝜋∗𝑟2
Max velocity (m/s) = √108𝑁
2∗1.226∗𝜋∗𝑟2 = 26.22m/s
Taking into account 10.288m/s wind condition Velocity = 15.932m/s
Google maps was used to measure the distance from runway to point [1] = 255.8m
From this time(s) taken is calculated = T=distance/velocity = 16s

UAS CHALLENGE 2015
221 Performance & Propulsion MEng Team Project Report (7ENT1024) School of Engineering and Technology
RPM Range
Velocity Increases with RPM
Lift (N
) Calculating battery percentage remaining
Battery charge state at runway = 16000mAh (16Ah)
Current (I) = 44.77A*number of motors = 44.77A*6 = 268.62A
Time (s) = 16s = 0.267minutes
𝐵𝑎𝑡𝑡𝑒𝑟𝑦 𝐶𝑎𝑝𝑎𝑐𝑖𝑡𝑦 (𝐴ℎ)
268.62 (𝐴)∗ 60 = 0.267(𝑚𝑖𝑛𝑢𝑡𝑒𝑠)
Battery Capacity (Ah) = 0.267∗268.62
60 = 1.193Ah
Battery capacity remaining = 16Ah-1.193Ah = 14.8Ah
Battery percentage % = 14.8𝐴ℎ
16𝐴ℎ∗ 100 = 92.5%
H.2. DATA Figure: 1.1 shows lift (N) of 11*8 propeller at different RPM
Figure 1.2 shows Lift Vs RPM graph
RPM
Lift Vs RPM Graph
7*6

UAS CHALLENGE 2015
222 Performance & Propulsion MEng Team Project Report (7ENT1024) School of Engineering and Technology
Po
we
r (W
)
Figure: 1.3 shows power vs rpm graph
Table 1.1 showing propeller constant values for different manufacturers.
Propeller Manufacturer 𝐾𝑝
APC 1.11
Graunper 1.18
Aeronaut 1.31
Table 1.2 showing propeller dimensions and acceptability
Propeller Dimensions (in) Rpm Power (W) Lift (N) Acceptable propeller Y/N 7*6 20,000 463 16.53 N 7*9 20,000 694 20.24 N
7*8.25 20,000 637 19.38 N 7.8*6 20,000 714 24.15 N 7.8*7 20,000 833 27.88 N 8*3.8 20,000 500 21.00 N 8*4 20,000 526 21.50 N 8*5 20,000 658 24.08 N 8*6 20,000 790 26.38 N 8*7 20,000 617 19.09 N 8*8 20,000 619 30.46 N 8*9 20,000 1185 32.31 N 8*10 20,000 1316 34.06 N 9*3.8 20,000 801 31.71 N 9*4.7 20,000 991 35.26 Y 9*6 20,000 1265 39.84 Y
RPM
Power Vs RPM Graph
Power required line for
propeller 7*6

UAS CHALLENGE 2015
223 Performance & Propulsion MEng Team Project Report (7ENT1024) School of Engineering and Technology
18,750 1042 35.02 Y 9*7 20,000 1476 43.04 Y
18,100 1094 35.24 Y 9*7.5 20,000 1582 44.55 Y
17,800 1115 35.28 Y 9*8 20,000 1130 46.01 Y
17,500 930 35.22 Y 9*9 20,000 1898 48.80 Y
17,000 1165 35.26 Y 9*10 20,000 2109 51.43 Y
16,550 1195 35.22 Y 10*3 20,000 965 40.73 Y
18,550 770 35.05 Y 10*4 20,000 1286 47.04 Y
17,000 832 35.20 Y 10*4.7 20,000 1511 50.99 Y
16,570 859 35.00 Y 10*5 20,000 1608 52.59 Y
16,400 886 35.36 Y 10*6 20,000 1929 57.62 Y
15,600 915 35.05 Y 10*7 20,000 2250 62.22 Y
15,000 949 35.00 Y 10*8 20,000 2572 66.52 Y
14,600 1000 35.45 Y 10*9 20,000 2893 70.56 Y
14,100 1013 35.07 Y 10*10 20,000 3215 74.37 Y
13,750 1044 35.15 Y 11*3 20,000 1412 56.87 Y
15,700 683 35.04 Y 11*3.8 20,000 1788 64.00 Y
14,800 724 35.05 Y 11*5 20,000 2353 73.41 Y
13,900 790 35.46 Y 11*6 20,000 2824 80.42 Y
13,200 811 35.03 Y 11*7 20,000 3295 86.87 Y
12,700 843 35.02 Y 11*8 20,000 3765 92.86 Y
12,300 875 35.12 Y 11*9 20,000 4236 98.50 Y
12,000 915 35.46 Y

UAS CHALLENGE 2015
224 Performance & Propulsion MEng Team Project Report (7ENT1024) School of Engineering and Technology
11*10 20,000 4707 103.82 Y 11,700 942 35.53 Y
12*6 20,000 4000 109.06 Y 11,350 731 35.12 Y
12*8 20,000 5333 125.93 Y 10,600 764 35.37 Y
13*4 20,000 3672 117.83 Y 10,900 594 35.00 Y
13*6 20,000 5509 144 Y 9,900 668 35.36 Y
13*8 20,000 7345 166.70 Y 9,200 715 35.26 Y
13*10 20,000 9182 186.31 Y 8,700 755 35.25 Y
14*13 20,000 16056 275.33 Y 7,150 733 35.19 Y
15*6 20,000 9765 238.14 Y 7,700 557 35.29 Y
17*10 20,000 26852 476.45 Y 5,450 543 35.37 Y
Table: 1.3 shows a section of table 1.2 with propeller dimensions 9*6
Propeller Dimensions (in) Rpm Power (W) Lift (N) Acceptable propeller Y/N
9*6 20,000 1265 39.84 Y
18,750 1042 35.02 Y
Table: 1.4 shows a section of table 1.2 with propeller dimensions 17*10
Propeller Dimensions (in) Rpm Power (W) Lift (N) Acceptable propeller Y/N
17*10 20,000 26852 476.45 Y
5,450 543 35.37 Y

UAS CHALLENGE 2015
225 Performance & Propulsion MEng Team Project Report (7ENT1024) School of Engineering and Technology
H.3. Motor Specfication and maxium RPM values
Table: 1.5 showing rc motor specifications, and maximum rpm values
Manufacturer
/Model
Power
(W)
KV
(rpm/V)
Max
Current
(I)
Working
Current
(I)
Power
Supply
Cell
Range
(s)
Propeller
Dimension
Range (in)
Weight
(g)
Cost
(£)
Max
RPM
BRC HOBBIES
PRODUCTS
EMax
GT2820/07
600 850 54 48 3-4 9*4.7 – 12*6 140 20.95 10064
A2826-5T 645 840 45 37.6 4 12*6 –13*6.7 175 27.70 9945
Emax
BL2820-07
740 919 59 33.5 3-4 10*5 – 13*6 145 17.95 10880
Emax
GT2826-06
962 710 52 42 4-5 10*5-14-7 175 23.95 12987
Emax
GT3526-04
875 870 69 55 3-4 12*6-13*6.5 265 32.95 10300
Boost 0.50 800 600 55 45 3-5 12-13 295 62.95 8880
Boost 0.60 900 490 60 50 4-6 13-14 345 69.95 8702
Boost 0.80 950 340 60 52 5-7 14-15 395 79.95 7044
Boost 0.90 1000 300 65 55 6-9 16-17 455 79.95 7992
HOBBY KING
PRODUCTS
Turnigy G46 925 550 55 46 4-5 12-15 303 34.43 8140
Turnigy
D3548/4
910 1100 50 45 3-4 159 13.30 13024
Turnigy
D3542/4
690 1450 48 42 2-3 10-12 130 13.60 12876
Turnigy
2834-800
660 800 45 40 2-4 10-12 195 22.38 9472
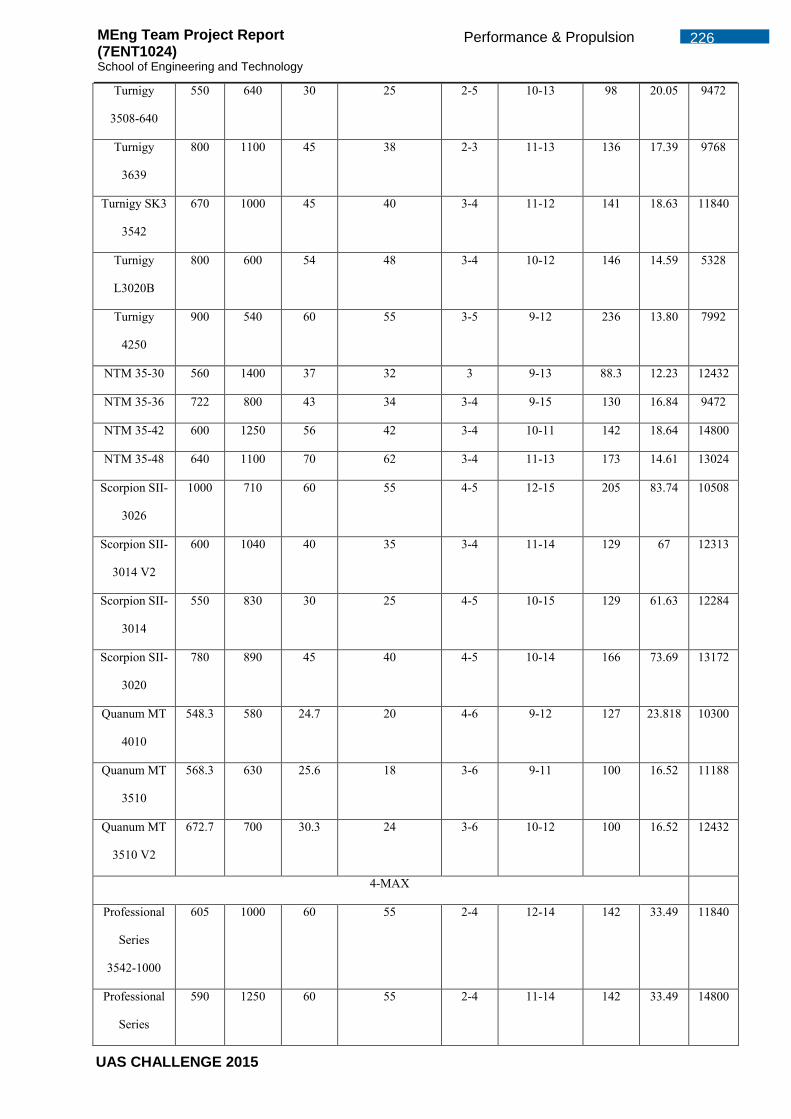
UAS CHALLENGE 2015
226 Performance & Propulsion MEng Team Project Report (7ENT1024) School of Engineering and Technology
Turnigy
3508-640
550 640 30 25 2-5 10-13 98 20.05 9472
Turnigy
3639
800 1100 45 38 2-3 11-13 136 17.39 9768
Turnigy SK3
3542
670 1000 45 40 3-4 11-12 141 18.63 11840
Turnigy
L3020B
800
600 54 48 3-4 10-12 146 14.59 5328
Turnigy
4250
900 540 60 55 3-5 9-12 236 13.80 7992
NTM 35-30 560 1400 37 32 3 9-13 88.3 12.23 12432
NTM 35-36 722 800 43 34 3-4 9-15 130 16.84 9472
NTM 35-42 600 1250 56 42 3-4 10-11 142 18.64 14800
NTM 35-48 640 1100 70 62 3-4 11-13 173 14.61 13024
Scorpion SII-
3026
1000 710 60 55 4-5 12-15 205 83.74 10508
Scorpion SII-
3014 V2
600 1040 40 35 3-4 11-14 129 67 12313
Scorpion SII-
3014
550 830 30 25 4-5 10-15 129 61.63 12284
Scorpion SII-
3020
780 890 45 40 4-5 10-14 166 73.69 13172
Quanum MT
4010
548.3 580 24.7 20 4-6 9-12 127 23.818 10300
Quanum MT
3510
568.3 630 25.6 18 3-6 9-11 100 16.52 11188
Quanum MT
3510 V2
672.7 700 30.3 24 3-6 10-12 100 16.52 12432
4-MAX
Professional
Series
3542-1000
605 1000 60 55 2-4 12-14 142 33.49 11840
Professional
Series
590 1250 60 55 2-4 11-14 142 33.49 14800

UAS CHALLENGE 2015
227 Performance & Propulsion MEng Team Project Report (7ENT1024) School of Engineering and Technology
3542-1250
Professional
Series
3548-790
850 790 50 45 3-4 11-12 171 35.99 9353
Professional
Series
3548-900
840 900 50 45 3-4 11-13 171 35.99 10656
Professional
Series
3548-1100
850 1100 50 45 3-4 11-12 171 35.99 13024
Professional
Series
4250-650
1150 650 60 55 3-4 12-14 230 48.95 13616
E-FLITE
Power 32 800 770 60 45 4-5 11-14 200 50.27 11396
Power 15 575 950 42 34 3-4 10-13 152 43.57 11248
Power 60 1000 470 80 65 5-6 15-17 230 73.73 8347
Power 46 925 670 55 40 5-6 12-14 290 60.32 11899
Power 25 600 870 44 32 3-4 11-14 190 46.92 10300
Power 25BL 850 1250 58 50 3-4 8-10 183 46.92 14800
Table: 1.6 shows a section of table 1.5 for motor model EMax GT2820/07
Manufacturer
/Model
Power
(W)
KV
(rpm/V)
Max
Current
(I)
Working
Current
(I)
Power
Supply
Cell
Range
(s)
Propeller
Dimension
Range (in)
Weight
(g)
Cost
(£)
Max
RPM
EMax
GT2820/07
600 850 54 48 3-4 9*4.7 – 12*6 140 20.95 10064

UAS CHALLENGE 2015
228 Performance & Propulsion MEng Team Project Report (7ENT1024) School of Engineering and Technology
Table: 1.6 shows a section of table 1.5 for motor model EMax GT2820/07
Manufacturer
/Model
Power
(W)
KV
(rpm/V)
Max
Current
(I)
Working
Current
(I)
Power
Supply
Cell
Range
(s)
Propeller
Dimension
Range (in)
Weight
(g)
Cost
(£)
Max
RPM
EMax
GT2820/07
600 850 54 48 3-4 9*4.7 – 12*6 140 20.95 10064
Table 1.2.1 shows updated version of table 1.2 taking into account motor capabilities
Propeller Dimensions (in) Rpm Power (W) Lift (N) Acceptable propeller Y/N
10*8 20,000 2572 66.52 Y
14,600 1000 35.45 Y
10*9 20,000 2893 70.56 Y
14,100 1013 35.07 Y
10*10 20,000 3215 74.37 Y
13,750 1044 35.15 Y
11*3.8 20,000 1788 64.00 Y
14,800 724 35.05 Y
11*5 20,000 2353 73.41 Y
13,900 790 35.46 Y
11*6 20,000 2824 80.42 Y
13,200 811 35.03 Y
11*7 20,000 3295 86.87 Y
12,700 843 35.02 Y
11*8 20,000 3765 92.86 Y
12,300 875 35.12 Y
11*9 20,000 4236 98.50 Y
12,000 915 35.46 Y
11*10 20,000 4707 103.82 Y
11,700 942 35.53 Y
12*6 20,000 4000 109.06 Y

UAS CHALLENGE 2015
229 Performance & Propulsion MEng Team Project Report (7ENT1024) School of Engineering and Technology
11,350 731 35.12 Y
12*8 20,000 5333 125.93 Y
10,600 764 35.37 Y
13*4 20,000 3672 117.83 Y
10,900 594 35.00 Y
13*6 20,000 5509 144 Y
9,900 668 35.36 Y
13*8 20,000 7345 166.70 Y
9,200 715 35.26 Y
13*10 20,000 9182 186.31 Y
8,700 755 35.25 Y
14*13 20,000 16056 275.33 Y
7,150 733 35.19 Y
15*6 20,000 9765 238.14 Y
7,700 557 35.29 Y
17*10 20,000 26852 476.45 Y
5,450 543 35.37 Y
H.4. Propeller data Table: 2.0 shows maximum rpm required at different propeller pitch setting to achieve 29.46m/s
Propeller Pitch
(in)
𝑉𝑚𝑎𝑥
(m/s) 𝜃𝑚𝑎𝑥 (degrees) 𝑅𝑃𝑀𝑚𝑎𝑥
3.8 29.46 32 20,371
4 29.46 32 19,352
5 29.46 32 15,481
6 29.46 32 12,901
7 29.46 32 11,058
8 29.46 32 9,676
9 29.46 32 8601
10 29.46 32 7740
13 29.46 32 5954
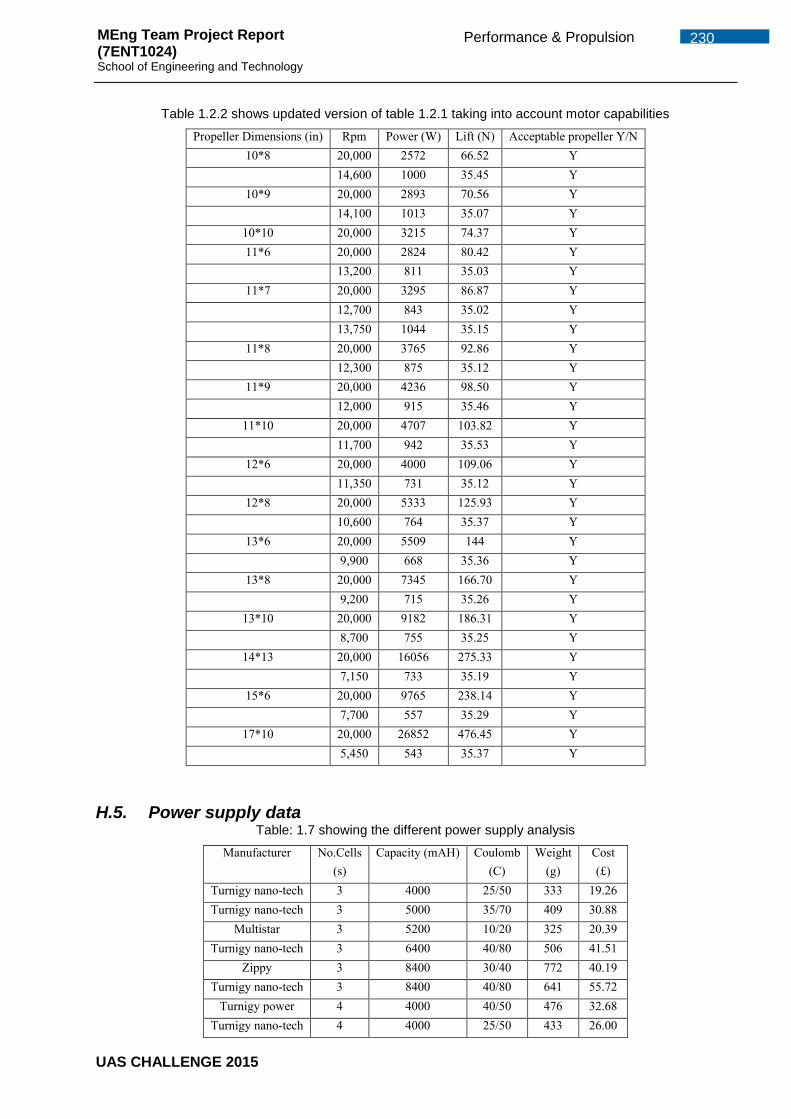
UAS CHALLENGE 2015
230 Performance & Propulsion MEng Team Project Report (7ENT1024) School of Engineering and Technology
Table 1.2.2 shows updated version of table 1.2.1 taking into account motor capabilities
Propeller Dimensions (in) Rpm Power (W) Lift (N) Acceptable propeller Y/N 10*8 20,000 2572 66.52 Y
14,600 1000 35.45 Y 10*9 20,000 2893 70.56 Y
14,100 1013 35.07 Y 10*10 20,000 3215 74.37 Y 11*6 20,000 2824 80.42 Y
13,200 811 35.03 Y 11*7 20,000 3295 86.87 Y
12,700 843 35.02 Y 13,750 1044 35.15 Y
11*8 20,000 3765 92.86 Y 12,300 875 35.12 Y
11*9 20,000 4236 98.50 Y 12,000 915 35.46 Y
11*10 20,000 4707 103.82 Y 11,700 942 35.53 Y
12*6 20,000 4000 109.06 Y 11,350 731 35.12 Y
12*8 20,000 5333 125.93 Y 10,600 764 35.37 Y
13*6 20,000 5509 144 Y 9,900 668 35.36 Y
13*8 20,000 7345 166.70 Y 9,200 715 35.26 Y
13*10 20,000 9182 186.31 Y 8,700 755 35.25 Y
14*13 20,000 16056 275.33 Y 7,150 733 35.19 Y
15*6 20,000 9765 238.14 Y 7,700 557 35.29 Y
17*10 20,000 26852 476.45 Y 5,450 543 35.37 Y
H.5. Power supply data Table: 1.7 showing the different power supply analysis
Manufacturer No.Cells (s)
Capacity (mAH) Coulomb (C)
Weight (g)
Cost (£)
Turnigy nano-tech 3 4000 25/50 333 19.26 Turnigy nano-tech 3 5000 35/70 409 30.88
Multistar 3 5200 10/20 325 20.39 Turnigy nano-tech 3 6400 40/80 506 41.51
Zippy 3 8400 30/40 772 40.19 Turnigy nano-tech 3 8400 40/80 641 55.72
Turnigy power 4 4000 40/50 476 32.68 Turnigy nano-tech 4 4000 25/50 433 26.00

UAS CHALLENGE 2015
231 Performance & Propulsion MEng Team Project Report (7ENT1024) School of Engineering and Technology
Zippy 4 4000 20/30 399 19.98 Turnigy nano-tech 4 4500 25/50 467 31.00 Turnigy nano-tech 4 5000 65/130 576 53.71 Turnigy nano-the 4 6000 25/50 623 46.08 Turnigy power 4 7200 40/80 840 48.36
Zippy 4 8000 30/40 845 42.83 Turnigy nano-tech 5 4000 25/50 525 31.99
Zippy 5 5000 45/55 732 46.57 Turnigy power 5 5000 25/30 677 33.12 Turnigy power 5 5000 30/40 695 39.53
Turnigy nano-tech 5 5000 35/70 659 47.73 Zippy 5 5000 20/30 640 29.19 Zippy 5 8000 30/40 1054 53.65
Turnigy nano-tech 5 8000 25/50 924 63.87 Turnigy nano-tech 6 4000 25/50 623 38.36
Turnigy power 6 4500 30/40 745 51.84 Turnigy power 6 5000 35/45 812 44.52
Zippy 6 5000 20/30 754 35.60 Zippy 6 5000 30/40 784 41.30
Turnigy nano-tech 6 5000 25/50 769 51.66 Turnigy power 6 5800 25/35 914 55.58
Turnigy nano-tech 6 6000 25/50 908 57.48 Turnigy nano-tech 6 8000 25/50 1105 78.56 Turnigy nano-tech 7 4500 65/130 895 66.99 Turnigy nano-tech 7 5000 65/130 978 66.99
Zippy 7 5000 25/35 818 46.79 Turnigy power 7 5000 60/120 1025 50.46
Turnigy nano-tech 8 4400 65/130 1012 90.03 Zippy 8 4500 35/45 911 67.19 Zippy 8 5000 25/35 937 53.59
Turnigy nano-tech 8 5000 65/130 1106 110.03 Zippy 8 5800 25/35 1025 60.68
Turnigy power 8 5800 25/35 1216 66.99 Zippy 9 5000 25/35 1021 69.12
Table: 1.8 shows a section of table 1.7 which investigates different power supplies
Manufacturer Number of Lithium polymer cells (s)
Capacity (mAH) Coulomb (C)
Weight (g)
Cost (£)
Turnigy nano-tech 3 4000 25/50 333 19.26 Turnigy nano-tech 4 4000 25/50 433 26.00 Turnigy nano-tech 5 4000 25/50 525 31.99 Turnigy nano-tech 6 4000 25/50 623 38.36
Zippy 7 5000 25/35 818 46.79 Zippy 8 4500 35/45 911 67.19 Zippy 9 5000 25/35 1021 69.12

UAS CHALLENGE 2015
232 Performance & Propulsion MEng Team Project Report (7ENT1024) School of Engineering and Technology
Table 1.9 showing increasing number of lithium cells for a calculated power consumption, current draw will
decrease
Lithium-Ion Cells (s) & Current Draw
(I)
Propeller
Dimensions (in)
Rpm to sustain
lift of 35N
Power
(W)
Rpm to sustain forward
velocity (29.46m/s)
3s 4s 5s 6s 7s 8s 9s
10*8 14,600 1000 9,676 90 67 54 45 38 33 30
Table 2.1 shows the rpm required to sustain lift and rpm required to achieve forward velocity of 29.46m/s
coupled with current draw using different lithium ion cells
Lithium-Ion Cells (s) & Current Draw (I)
Propeller
Dimensions
(in)
Rpm
to
sustain
lift of
35N
Power
(W)
Rpm to
sustain
forward
velocity
(29.46m/s)
3 4 5 6 7 8 9
10*8 14,600 1000 9,676 90 67 54 45 38 33 30
10*9 14,100 1013 8,601 91 68 55 46 39 34 30
10*10 13,750 1044 7,740 94 70 56 47 40 35 31
11*6 13,200 811 12,901 73 54 43 36 31 27 24
11*8 14,088 1316 9,676 118 88 71 59 50 44 39
11*9 12,522 1039 8,601 93 70 56 46 40 35 31
11*10 11,700 942 7,740 84 63 50 42 36 31 28
12*6 11,350 731 12,901 65 49 39 32 28 24 21
12*8 14,088 1864 9,676 167 125 100 83 71 62 55
13*6 9,900 668 12,901 60 45 36 30 25 22 20
13*8 14,088 2567 14088 231 173 138 115 99 86 77
13*10 11,270 1643 11270 148 111 89 74 63 55 49
14*13 8,670 1307 5,954 117 88 70 58 50 44 39
15*6 7,700 557 12,901 50 37 30 25 21 18 16
17*10 11270 4804 11270 432 324 259 216 185 162 144

UAS CHALLENGE 2015
233 Performance & Propulsion MEng Team Project Report (7ENT1024) School of Engineering and Technology
Table 2.2 shows the rpm required to sustain forward velocity of 29.46m/s exceeds the rpm to sustain 35N of
lift
Lithium-Ion Cells (s) & Current Draw
(I)
Propeller
Dimensions (in)
Rpm to sustain
lift of 35N
Power
(W)
Rpm to sustain forward
velocity (29.46m/s)
3s 4s 5s 6s 7s 8s 9s
13*6 9,900 668 12,901 60 45 36 30 25 22 20
Table 2.3 shows that by increasing the rpm power consumption increases along with current draw
Lithium-Ion Cells (s) & Current Draw
(I)
Propeller
Dimensions (in)
Rpm to sustain
lift of 35N
Power
(W)
Rpm to sustain forward
velocity (29.46m/s)
3s 4s 5s 6s 7s 8s 9s
13*6 12,901 1478 12,901 133 99 79 67 57 49 44
Table 3.9 shows updated version of table 2.1
Lithium-Ion Cells (s) & Current Draw (I) Propeller
Dimensions (in)
Rpm to
sustain lift of 35N
Power (W)
Rpm to sustain forward velocity
(29.46m/s)
3 4 5 6 7 8 9
10*8 14,600 1000 9,676 90 67 54 45 38 33 30 10*9 14,100 1013 8,601 91 68 55 46 39 34 30
10*10 13,750 1044 7,740 94 70 56 47 40 35 31 11*6 13,200 811 12,901 73 54 43 36 31 27 24 11*8 14,088 1316 9,676 118 88 71 59 50 44 39 11*9 12,522 1039 8,601 93 70 56 46 40 35 31
11*10 11,700 942 7,740 84 63 50 42 36 31 28 12*6 12,901 1073 12,901 97 72 58 48 41 36 32 12*8 14,088 1864 9,676 167 125 100 83 71 62 55 13*6 12901 1478 12,901 133 99 79 66 57 49 44 13*8 14,088 2567 14088 231 173 138 115 99 86 77
13*10 11,270 1643 11270 148 111 89 74 63 55 49 14*13 8,670 1307 5,954 117 88 70 58 50 44 39 15*6 12901 2621 12,901 236 177 141 118 101 88 79
17*10 11270 4804 11270 432 324 259 216 185 162 144

UAS CHALLENGE 2015
234 Performance & Propulsion MEng Team Project Report (7ENT1024) School of Engineering and Technology
Table 2.4 shows propellers with lowest current draw
Lithium-Ion Cells (s) & Current Draw (I) Propeller
Dimensions (in)
Rpm to
sustain lift of 35N
Power (W)
Rpm to sustain forward velocity
(29.46m/s)
3 4 5 6 7 8 9
10*8 14,600 1000 9,676 90 67 54 45 38 33 30 10*9 14,100 1013 8,601 91 68 55 46 39 34 30
10*10 13,750 1044 7,740 94 70 56 47 40 35 31 11*6 13,200 811 12,901 73 54 43 36 31 27 24 11*9 12,522 1039 8,601 93 70 56 46 40 35 31
11*10 11,700 942 7,740 84 63 50 42 36 31 28 12*6 12,901 1073 12,901 97 72 58 48 41 36 32
H.6. Current drawn
Table 2.5 showing the rc wiring rating and maximum current permissible
AWG Maximum current permissible
8 200
10 140
12 90
14 60
16 35
18 16
24 6
Table 1.7.1 shows updated version of table 1.7 in power supply data
Manufacturer No.Cells (s)
Capacity (mAH)
Coulomb (C)
Weight (g)
Cost (£)
Total Weight
(g)
Total Cost (£)
Turnigy nano-tech 5 4000 25/50 525 31.99 2100 128 Zippy 5 5000 45/55 732 46.57 2196 140
Turnigy power 5 5000 25/30 677 33.12 2031 99 Turnigy power 5 5000 30/40 695 39.53 2085 119
Turnigy nano-tech 5 5000 35/70 659 47.73 1977 143 Zippy 5 5000 20/30 640 29.19 1920 87 Zippy 5 8000 30/40 1054 53.65 2108 107
Turnigy nano-tech 5 8000 25/50 924 63.87 1848 128 Turnigy nano-tech 6 4000 25/50 623 38.36 2492 153
Turnigy power 6 4500 30/40 745 51.84 2980 207

UAS CHALLENGE 2015
235 Performance & Propulsion MEng Team Project Report (7ENT1024) School of Engineering and Technology
Turnigy power 6 5000 35/45 812 44.52 2436 133 Zippy 6 5000 20/30 754 35.60 2262 107 Zippy 6 5000 30/40 784 41.30 2352 124
Turnigy nano-tech 6 5000 25/50 769 51.66 2307 155 Turnigy power 6 5800 25/35 989 55.58 2967 167
Turnigy nano-tech 6 6000 25/50 908 57.48 2724 172 Turnigy nano-tech 6 8000 25/50 1105 78.56 2210 157 Turnigy nano-tech 7 4500 65/130 895 66.99 2685 268 Turnigy nano-tech 7 5000 65/130 978 66.99 2934 201
Zippy 7 5000 25/35 818 46.79 2454 140 Turnigy power 7 5000 60/120 1025 50.46 3075 151
Turnigy nano-tech 8 4400 65/130 1012 90.03 3036 360 Zippy 8 4500 35/45 911 67.19 2733 269 Zippy 8 5000 25/35 937 53.59 2811 161
Turnigy nano-tech 8 5000 65/130 1106 110.03 3318 330 Zippy 8 5800 25/35 1025 60.68 3075 182
Turnigy power 8 5800 25/35 1216 66.99 3648 201 Zippy 9 5000 25/35 1021 69.12 3063 207
Table 2.6 shows section of table 1.7.1 which identifies lowest weight and lowest costing power supplies
Manufacturer No.Cells (s)
Capacity (mAH)
Coulomb (C)
Weight (g)
Cost (£)
Total Weight
(g)
Total Cost (£)
Zippy 5 5000 20/30 640 29.19 1920 87 Turnigy nano-tech 5 8000 25/50 924 63.87 1848 128
H.7. Motor data Table 2.7 showing updated version of table 1.5
Manufacturer/Model
Power (W)
KV (rpm/V)
Max Current
(I)
Working Current
(I)
Power Supply
Cell Range
(s)
Propeller Dimension Range (in)
Weight (g)
Cost (£)
Max RPM
BRC HOBBIES PRODUCTS
EMax GT2826-06
962 710 52 42 4-5 10*5-14-7 175 23.95 12987
Boost 0.50 800 600 55 45 3-5 12-13 295 62.95 8880 Boost 0.60 900 490 60 50 4-6 13-14 345 69.95 8702 Boost 0.80 950 340 60 52 5-7 14-15 395 79.95 7044 Boost 0.90 1000 300 65 55 6-9 16-17 455 79.95 7992
HOBBY KING PRODUCTS
Turnigy G46 925 550 55 46 4-5 12-15 303 34.43 8140 Turnigy
3508-640 550 640 30 25 2-5 10-13 98 20.05 9472
Turnigy 4250
900 540 60 55 3-5 9-12 236 13.80 7992
Scorpion SII- 1000 710 60 55 4-5 12-15 205 83.74 10508

UAS CHALLENGE 2015
236 Performance & Propulsion MEng Team Project Report (7ENT1024) School of Engineering and Technology
3026 Scorpion SII-
3014 550 830 30 25 4-5 10-15 129 61.63 12284
Scorpion SII-3020
780 890 45 40 4-5 10-14 166 73.69 13172
Quanum MT 4010
548.3 580 24.7 20 4-6 9-12 127 23.818 10300
Quanum MT 3510
568.3 630 25.6 18 3-6 9-11 100 16.52 11188
Quanum MT 3510 V2
672.7 700 30.3 24 3-6 10-12 100 16.52 12432
E-FLITE Power 32 800 770 60 45 4-5 11-14 200 50.27 11396 Power 60 1000 470 80 65 5-6 15-17 230 73.73 8347 Power 46 925 670 55 40 5-6 12-14 290 60.32 11899
Table 2.8 shows rc brushless motors that can use 5s lithium-ion power supply
Manufacturer/Model
Power (W)
KV (rpm/V)
Max Current
(I)
Working Current
(I)
Power Supply
Cell Range
(s)
Propeller Dimension Range (in)
Weight (g)
Cost (£)
Max RPM Based on 5s
BRC HOBBIES PRODUCTS
EMax GT2826-06
962 710 52 42 4-5 10*5-14-7 175 23.95 12987
HOBBY KING PRODUCTS
Quanum MT 3510 V2
672.7 700 30.3 24 3-6 10-12 100 16.52 10360
E-FLITE Power 46 925 670 55 40 5-6 12-14 290 60.32 9916
Table 2.9 shows maximum thrust, maximum velocity, current draw, power consumption and maximum flight
time based on 83% thrust setting and 11168rpm
Maximum Thrust per motor (N)
Maximum angle (degrees)
Maximum Velocity
(m/s)
Power (W)
Current Draw (I)
Flight Time (Minutes)
34 43 20.9 800 43 5.6

UAS CHALLENGE 2015
237 Performance & Propulsion MEng Team Project Report (7ENT1024) School of Engineering and Technology
H.8. ESC data Table 4.0 shows comparison between different esc’s
Manufacturer/Model Constant Current (I) Burst Current (I) Weight (g) Cost (£)
Platinum Pro 60 90 68 47.95
Robotbirds Pro 60 80 63 33.95
Turnigy Super Brain 60 70 50 33.49
4 max 60A 60 70 62 44.95
SimonK 60 80 63 17.49
Hobbywing 60 80 60 39.97
Table 3.0 show a section of appendix L that has two esc’s that is lowest in weight and lowest in cost
Manufacturer/Model Constant Current (I) Burst Current (I) Weight (g) Cost (£)
Robotbirds Pro 60 80 63 33.95
Hobbywing 60 80 60 39.97
H.9. Cost and weights In this section the total cost and weight of the four different components will be gathered and transferred on
table 3.1.
Table 3.1 showing total cost and weight of each component
Component Quantity Cost (£) Weight (g)
Propeller 4 15.8 100
Power supply 2 128 1848
Motor 4 95.8 700
ESC 4 135.8 252
Total 375.4 2900
At the start of the project certain limitation as stated below were set. By looking at table 3.1it can be seen
that these initial limitation has been met and even exceeded resulting in extra cost saving of £174.6 and total
weight saving of 800g.
“Initial cost limitation of £550 after taking into account structural other electrical components
Initial propulsion and power supply weight limitation of 3.7kg was set after taking into account structural,
payload and electrical components weights

UAS CHALLENGE 2015
238 Performance & Propulsion MEng Team Project Report (7ENT1024) School of Engineering and Technology
H.10. Testing data Test Rigs & Data
In section: D table 2.4 identified seven different propellers that required further testing to identify the most
efficient propeller that would achieve the velocity and lift required for this project. In this section two test rigs
will be presented one for single motor thrust and torque testing and the other wind tunnel test rig used for
testing the velocity of the Quad-rotor. These test rigs were constructed so that an accurate value for current
draw
The first test rig was used to measure six different parameters which are all essential for this project. The
parameters that were measured are listed below:
1. Current draw
2. Power required
3. Thrust
4. Torque
5. RPM
6. Temperature
Figure: 1.7 shows the full set-up of the first test rig
The test rig in figure 1.7 works by applying throttle from the radio controller to the receiver, this then engages
the esc, which then controls the rc motor rotational speed and ultimately the rotation of the propeller. The rc
motor is attached to an aluminium tube and the aluminium tube at the bottom end is wired onto the lift scale.
When the throttle setting is increased the lift also increased which pulled the lift scale and displayed the
result on the digital read out in grams. When the motor and propeller is rotated there is also a torque
component that occurs in the same direction as the rotation, this is measures by the torque scale. The
torque values were particularly important to the stability section when it came to using the Quad-rotor
simulation model. For this testing an ammeter is used for measuring the current draw and power required
illustrated in figure 1.8. These two values were essential as the rc brushless motor and the esc both have a
specific power and current draw values that cannot be exceeded, if these values are exceeded has the
potential to damage the motor and the esc. Current draw was particularly important because this is the
deciding factor for flight time, the higher the current draw the lower the flight time will be for a given power
supply capacity. Another important factor that was tested involved using an infrared temperature sensor, this
is illustrated in figure 1.9. RPM (revolutions per minute) was investigated using an optical rpm reader

UAS CHALLENGE 2015
239 Performance & Propulsion MEng Team Project Report (7ENT1024) School of Engineering and Technology
illustrated in figure 2.0, rpm values were particularly important in calculating the maximum velocity of the
Quad-rotor. Figure 1.8 shows ammeter used for testing Figure: 1.9 shows infrared temperature sensor
Figure 2.0 shows the rpm reader used for testing
Table 5.3 is used to log the data obtained for propeller with dimensions 11*8
Propeller Dimensions 11*8 Throttle Setting Percentage (%)
0 16.6 33.2 49.8 66.4 83 99.6
Current drawn (A) 0 2.35 6.20 11.26 19.51 37.20 49.63
Power required (W) 0 49.2 128.2 232.0 398.7 747.8 918.1
Lift (N) 0 0.29 0.70 2.71 8.45 22.68 23.86
Torque (Q) 0 0.082 0.193 0.292 0.427 0.794 0.915
RPM 0 1020 3510 5124 7514 9741 1302
Temperature (0C) 37 39 43 45 52 68 72
From this data the total flight time can be obtained using equation 3.2. In this case we have 4 motors and
reach one can draw up to 49.63A, therefore 198.52A in total. Under these values the Quad-rotor can have a
flight time of up to 4.83 minutes. The Quad-rotor can hover for much longer time than 4.83minutes as the
current draw reduces to around 11.26A, this give a total hover time of up to 21minutes. Take the
temperature of the motor as particularly important because over heating could lead to motor failure during
the competition day. Temperature results was conducted after running the motors at each motor setting to
1minute which allowed for them to heat up to a certain degree presented in table 5.3. Similar analysis as the
one in table 5.3 was conducted for the remaining six propellers and presented below.

UAS CHALLENGE 2015
240 Performance & Propulsion MEng Team Project Report (7ENT1024) School of Engineering and Technology
𝐵𝑎𝑡𝑡𝑒𝑟𝑦 𝐶𝑎𝑝𝑎𝑐𝑖𝑡𝑦 (𝐴ℎ)
𝑇𝑜𝑡𝑎𝑙 𝐶𝑢𝑟𝑟𝑒𝑛𝑡 𝐷𝑟𝑎𝑤 (𝐴)∗ 60 = 𝑇𝑜𝑡𝑎𝑙 𝑓𝑙𝑖𝑔ℎ𝑡 𝑚𝑖𝑛𝑢𝑡𝑒𝑠 Equation 3.2
16 (𝐴ℎ)
49.63 (𝐴) ∗ 4∗ 60 = 4.83𝑚𝑖𝑛𝑢𝑡𝑒𝑠
Table 5.3.1 is used to log the data obtained for propeller with dimensions 10*8
Propeller Dimensions 10*8 Throttle Setting Percentage (%)
0 16.6 33.2 49.8 66.4 83 99.6
Current drawn (A) 0 2.42 7.21 14.7 22.1 36.4 48.2
Power required (W) 0 44.7 133.3 271.9 408.8 673.4 891.7
Lift (N) 0 0.24 0.57 3.71 7.1 17.1 20.2
Torque (N.m) 0 0.074 0.187 0.274 0.421 0.697 0.845
RPM 0 795 3005 4901 7521 8964 12940
Temperature (0C) 37 40 42 44 54 65 70
Table 5.3.2 is used to log the data obtained for propeller with dimensions 10*9
Propeller Dimensions 10*9 Throttle Setting Percentage (%)
0 16.6 33.2 49.8 66.4 83 99.6
Current drawn (A) 0 2.43 7.24 14.9 22.5 37.1 48.9
Power required (W) 0 44.9 133.9 275.6 416.2 676.3 904.6
Lift (N) 0 0.22 0.54 3.45 6.9 17.0 19.7
Torque (N.m) 0 0.087 0.201 0.312 0.511 0.721 0.874
RPM 0 841 3117 5101 7045 9521 12972
Temperature (0C) 37 41 43 47 55 67 71

UAS CHALLENGE 2015
241 Performance & Propulsion MEng Team Project Report (7ENT1024) School of Engineering and Technology
Table 5.3.3 is used to log the data obtained for propeller with dimensions 11*6
Propeller Dimensions 11*6 Throttle Setting Percentage (%)
0 16.6 33.2 49.8 66.4 83 99.6
Current drawn (A) 0 2.47 8.2 15.4 24.1 38.2 49.4
Power required (W) 0 45.7 151.7 284.9 445.9 706.7 913.9
Lift (N) 0 0.25 0.64 5.41 9.41 21.12 22.45
Torque (N.m) 0 0.094 0.297 0.387 0.547 0.799 0.944
RPM 0 940 3201 4987 7012 9624 12984
Temperature (0C) 37 43 45 48 57 68 74
Table 5.3.4 is used to log the data obtained for propeller with dimensions 11*10
Propeller Dimensions 11*10 Throttle Setting Percentage (%)
0 16.6 33.2 49.8 66.4 83 99.6
Current drawn (A) 0 3.4 12.0 22.1 34.1 47.2 52.1
Power required (W) 0 62.9 222.0 408.9 630.8 873.2 963.8
Lift (N) 0 0.27 0.75 5.87 8.98 21.47 23.1
Torque (N.m) 0 0.97 0.301 0.421 0.687 0.822 0.972
RPM 0 1074 3521 6210 7742 1045 1308
Temperature (0C) 37 46 49 54 67 72 78
Table 5.3.5 is used to log the data obtained for propeller with dimensions 12*6
Propeller Dimensions 12*6 Throttle Setting Percentage (%)
0 16.6 33.2 49.8 66.4 83 99.6
Current drawn (A) 0 2.2 7.1 12.42 31.74 40.3 45.7
Power required (W) 0 40.7 131.4 229.7 587.2 745.5 845.5
Lift (N) 0 7.1 12.9 18.2 21.7 29.2 31.2
Torque (N.m) 0 0.31 0.68 0.94 1.09 1.20 1.31
RPM 0 1558 3766 6623 8051 11168 12987
Temperature (0C) 37 38 30 42 47 55 67
Now that the propeller that will be used on the Quad-rotor has been identified as 12*6, its time to analyse the
performance further. The second test rig was built with the intention to calculating the maximum velocity the
Quad-rotor can achieve under different wind speeds and also the current draw increase due to increased
headwind velocity.

UAS CHALLENGE 2015
242 Performance & Propulsion MEng Team Project Report (7ENT1024) School of Engineering and Technology
Figures 2.1 & 2.2 illustrate the full test rig set up in the wind tunnel.
Figure 2.1 shows test rig inside wind tunnel Figure 2.2 shows test rig structure in wind tunnel
For this test
rig to
operate a
prototype
Quad-rotor
was built as
shown in
figure 2.3
Figure 2.3 shows the prototype Quad-rotor built for testing purposes.
Figure 2.3 shows the prototype Quad-rotor was built for the purpose of initial propulsion system integration
and performance testing. System integration involved all the components, ecs’s, motors, and power system
working together harmoniously, this also helped to eliminate any problems before it was wired onto the main
Quad-rotor. Some of the problems encountered involved esc throttle recalibration and esc programming, all
of which would have been difficult to accomplish once the system gets wired onto the main Quad-rotor and
the esc wires will be installed inside the arms of the copter. The prototype also allowed for the positive,
negative and signal wires to be accurately cut to side ready for installation. From the performance side of
things the KK 2 board was an important and a necessary piece of hardware to positioning the Quad-rotor in
correct pitch angle via digital read out.
Operating the test rig
The prototype Quad-rotor is set in place as shown in figure 2.1, pitch angle is set using KK 2 board and
clamped into place. The stopping pin is inserted into the rear of the test rig, this will allow for the Quad-rotor
to be powered up to 83% throttle setting without moving forward. After 5 seconds at 83% throttle setting the
stopping pin is removed. Removing the pin allows for the copter to travel in the x-axis very rapidly. To
calculate forward speed distance travelled and time is required, in figure 2.4 a pre-set distance of 0.185m is
identified. To measure time taken to cover 0.185m a standard camera was used to record the event and
using software called videopad video editor, the recording was slowed down so that time taken can be
KK 2 Board

UAS CHALLENGE 2015
243 Performance & Propulsion MEng Team Project Report (7ENT1024) School of Engineering and Technology
calculated to cover 0.185m. Figure 2.5 to 271 shows how the events video recording was captured. This test
was conducted under different wind speeds from 0m/s to 25.6m/s which was the limit of the wind tunnel.
Table 5.3.6 identifies the velocity that the Quad-rotor can travel at under different headwind velocities.
Figure 2.4 shows pre-set distance of 0.185m Figures 2.5 shows start of recording
Figure: 2.6 shows motion capture midway at 0.0925m Figure: 2.7 shows full distance 0.185m
Table 5.3.6 shows wind tunnel velocity and corresponding Quad-rotor velocity
Wind Tunnel Velocity m/s Quad-rotor velocity achieved
m/s
0 20.2
10.28 10.4
12.86 8.4
15 5.7
20 1.2
25 Went Backwards
Effect of current draw due to headwind
From the use of the first test rig it was identified that propeller dimension of 12*6 will be used on the Quad-
rotor therefore further current draw testing was conducted using the wind tunnel. One APC 12*6 propeller
was put into the wind tunnel to investigate the aeroelastic effect on current draw. The testing was conducted
at different wind tunnel head speed of 25.6m/s. The results are shown in table 5.4
Table 5.4 shows the effect of propeller current draw increase at head speed of 25.6m/s
Propeller Dimensions 12*6 Throttle Setting Percentage (%)
0 16.6 33.2 49.8 66.4 83 99.6
Current drawn (A) 0 2.23 7.5 12.8 32.4 42.2 47
Power required (W) 0 41.2 138.7 236.8 599.4 780.7 869.5
Temperature (0C) 37 38 30 41 43 51 64

UAS CHALLENGE 2015
244 Performance & Propulsion MEng Team Project Report (7ENT1024) School of Engineering and Technology
From table 5.4 and table 5.3.5 the same propeller can be compared to each other, as stated earlier one of
the propeller is tested in ideal conditions with 0m/s head wind and the other in the wind tunnel with 25.6m/s
head wind. The results indicated that the maximum current draw increases from 45.7A to 47A but the overall
temperature of the motors decreased as a result of headwind cooling down the motors. The rpm of the
propellers in this case could not be obtained because the door to the wind tunnel at 25.6m/s was very hard
to open due to suction cause by the wind turbine.
H.11. Prop Performance Propeller Efficiency
Propeller performance is required to be recalculated to improve accuracy of the calculations. From the
University of Illinois at Urbana-Champaign (UIUC) students performed propeller analysis such as propeller
efficiency for every rc propeller that is available for use as an rc propeller, in this section their data and
graphs will be used to improve the accuracy of the calculations performed in this report.
The aim of this section is to calculate propeller thrust taking into account propeller efficiency obtained from
data that is presented by UIUC students
Engine power = Torque * rpm * 2𝜋
60 Equation 1.8
Rc motor torque can be calculated using “equation 1.9 (rc groups, 2008)”
𝑇𝑜𝑟𝑞𝑢𝑒 (𝑙𝑏 − 𝑓𝑡) = 𝐻𝑃
𝑟𝑝𝑚∗ 5252 Equation 1.9
Where
HP = horsepower of motor 1.289HP, as 1HP = 746W and the motor that is used has 962W
Revs Per Minute = 10508 rpm, this was calculated earlier
𝑇𝑜𝑟𝑞𝑢𝑒 (𝑙𝑏 − 𝑓𝑡) = 1.289
10508∗ 5252
Theoretical Torque Value = 0.6442lb-ft = 0.873N.m
Calculated Experimental Torque Value = 1.21N.m obtained from table 5.3.5
Now the engine power can be calculated using “equation 1.8 (Hart, 2013)” and data obtained from
experimental data, table 5.3.5 based on 83% thrust setting
Engine power = 1.21 * 11168 * 2𝜋
60
Engine power (N) = 1415N
Advance Ratio (J) is calculated using “equation 2.0 (mit education, 2012)”
J = 𝑉0
𝑛𝐷 Equation 2.0
Where
V0 = Forward velocity = 20.2m/s obtained from wind tunnel test
D = Propeller diameter = 0.3048m
n = 𝑟𝑝𝑚
60 = 186rev/s
Advanced ratio J can now be calculated using equation 2.0
J = 20.2
186∗0.3048 = 0.356

UAS CHALLENGE 2015
245 Performance & Propulsion MEng Team Project Report (7ENT1024) School of Engineering and Technology
Now by using figure below propeller efficiency Vs advanced j ratio provided by UIUC propeller efficiency can
be obtained. Which in this case is 42%.
“Figure 3.1 (Ananda, 2015)” shows graph of propeller efficiency Vs advanced J ratio for propeller dimension
12*6
To calculate propeller power engine power is required as it can be seen from “equation 2.2 (Hart, 2013)”
Propeller power = Engine power * Propeller efficiency Equation 2.2
Propeller power = 1415N * 0.42
Propeller power = 594N
Therefore propeller actual thrust = 𝑝𝑟𝑜𝑝𝑒𝑙𝑙𝑒𝑟 𝑝𝑜𝑤𝑒𝑟 𝑁
𝑉0 =
594
20.2= 29.5𝑁
Theoretical thrust was calculated using equation 1.3 as 34N per motor at thrust setting of 83% and the
results were shown in table 2.9, appendix G.
Experimental data using the test rig shows that thrust obtained at 83% thrust setting is equal to 29.5N.
As the propeller thrust has changed from 34N as stated in table 5.3.5 to 29.5N so will the maximum angle,
maximum velocity, power current draw and flight time. The new changes has been calculated and stated in
table 3.2
Table 3.2 shows the updated Quad-rotor performance
Maximum Thrust per
motor
(N)
Maximum angle
(degrees)
Maximum Velocity
(m/s)
Power
(W)
Current Draw
(I)
Flight Time
(Minutes)
29.5 32 20.2 800 43 5.6

UAS CHALLENGE 2015
246 Performance & Propulsion MEng Team Project Report (7ENT1024) School of Engineering and Technology
H.12. Flight dynamics In this section “Flight Dynamics” is referenced to a research paper that was written to investigate a Quad-
rotors flight ability” (Khan, 2014), therefore flight dynamics will be investigated to further deepen the
capabilities of this copter. The Quad-rotor can be defined under two frame’s one which moves with its body
called the body frame and the other which is defined with respects to the ground, the layouts of these can be
seen in figure 1.5
Figure 1.5 (Khan, 2014)” showing body frame and inertial frame
Each of the four motors operate
and produce thrust independently for example if the Quad-rotor is required to hover at any height the thrust
must equal to its MTOW which in this case is 68.67N and reach motor will work independently to produce
one fourth of this value. If the Quad-rotor is to perform any type of manoeuvre such as pitch to move forward
then again each motor would work independently to produce the thrust required but in this case each motors
thrust value will vary. Manoeuvres such as, pitch, roll and climb. “Equation 2.3 (Khan, 2014) “ shows total
thrust required during certain pitch angle and roll angle.
𝑇 = 𝑚𝑔
𝐶𝑜𝑠(𝛳)∗𝐶𝑜𝑠(𝜑) Equation 2.3
Where
T = Thrust (N)
mg = MTOW (N)
cos(𝜃) = pitch angle
𝑐𝑜𝑠(𝜑) = roll angle
If the Quad-rotor climbs and performs any of the same manoeuvres then “equation 2.4 (Khan, 2014) “ is
considered to calculate the total thrust required.
𝑇 = 𝜌∗𝐴∗4∗𝑔∗(ℎ𝑓−ℎ)+𝑚𝑔
𝐶𝑜𝑠(𝛳)∗𝐶𝑜𝑠(𝜑) Equation 2.4
Where
ρ = Density kg/m3
A = Total propeller area m2
g = 9.81m/s2
hf = FInal altitude (m)
h = Initial altitude (m)

UAS CHALLENGE 2015
247 Performance & Propulsion MEng Team Project Report (7ENT1024) School of Engineering and Technology
Magnitude of component vectors within the x-y and z axis are calculated using “equations 2.5, 2.6 and 2.7
(Khan, 2014)”.
𝑇𝑥 = √−𝑇2 ∗ cos(𝜃)2 ∗ (1 −1
cos(𝜃)2) Equation 2.5
𝑇𝑦 = 𝑇 ∗ 𝑐𝑜𝑠(𝜃) ∗ sin(𝜑) Equation 2.6
𝑇𝑧 = 𝑇 ∗ cos(𝜃) ∗ cos(𝜑) Equation 2.7
“Table 3.2 (Khan, 2014)” shows the pitch and roll angle that the Quad-rotor can operate within
Manoeuvre Pitch (𝜃) Roll (𝜑) 𝑇𝑥 𝑇𝑦 𝑇𝑧
Hover 0 0 0 0 + or -
Pitch Forward 0-90 0 + 0 + or -
Pitch Backward -90-0 0 - 0 + or -
Roll Left 0 0-90 0 + + or -
Roll Right 0 -90-0 0 - + or -
Pitch Forward and Roll left 0-90 0-90 + + + or -
Pitch Backward and Roll Right -90-0 -90-0 - - + or -
The manoeuvre that is required ultimately depends on the angle setting as it can be seen form table 3.2. For
example if the Quad-rotor was required to hover then both pitch and roll is required to be zero as it can be
seen in table 3.2. Another example can be considered when the Quad-rotor moves forward therefore pitch is
required, this results in a pitch forward manoeuvre with angles between 0 and 90, which requires zero roll
angle.
Table 3.3 shows thrust required to sustain hover
x-axis y-axis z-axis Total Thrust
Thrust (N) 0 0 68.6 68.8
“Table 3.4 (Khan, 2014)” shows thrust that is required by each propeller to perform a certain manoeuvre
Propeller Hover Pitch Forward/Pitch
Backward
Roll left/Roll
right
Pitch Forward and roll left/Pitch backward and roll
right
1 +
𝑍
4 +
𝑍
4 +
𝑍
4 +
𝑍
4
2 −
𝑍
4 −
𝑍
4 −(𝑇 − 𝑍) +
𝑍
4 −(𝑇 −
𝑍
2) +
𝑍
4

UAS CHALLENGE 2015
248 Performance & Propulsion MEng Team Project Report (7ENT1024) School of Engineering and Technology
3 −
𝑍
4 −
𝑍
4 −
𝑍
4
𝑍
4
4 +
𝑍
4 +(𝑇 − 𝑍) +
𝑍
4 +
𝑍
4 +(𝑇 −
𝑍
2) +
𝑍
4
Table 3.4 is used to calculate thrust required by individual propellers example for hover can be seen in table
3.5
For hover the very first column will be used and it can be seen that each individual propeller is divided by 4
as it’s a Quad-rotor. All the values within the x and y axis is identified as zero because no pitching or roll is
required.
Table 3.5 shows thrust required by individual propeller
Propeller x-axis y-axis z-axis Total thrust
1 0 0 17.15 17.15
2 0 0 17.15 17.15
3 0 0 17.15 17.15
4 0 0 17.15 17.15
0 0 68.6 68.6
Another example can be identified in table 3.6 and 3.7 which shows forward flight with an angle setting of
320.
Table 3.6 shows thrust required by each axis and
total thrust at forward flight with angle setting of 320
From table 3.6 it can be seen that there is a variation of thrust required by different propellers, which is quite
different from hover, table 3.7 also confirms this.
Table 3.7 shows thrust required by individual propeller for forward flight.
Propeller x-axis y-axis z-axis Total thrust
1 9.09 0 14.54 17.15
2 9.09 0 14.54 17.15
3 9.09 0 14.54 17.15
4 15.61 0 24.97 29.45
Thrust (N) 42.9 0 68.6 80.9
x-axis y-axis z-axis Total Thrust
Thrust (N) 42.91 0 68.67 80.9

UAS CHALLENGE 2015
249 Performance & Propulsion MEng Team Project Report (7ENT1024) School of Engineering and Technology
Calculating variation in thrust for forward flight
To calculate variation in thrust for forward flight table 3.6 must be obtained using equations 2.4, 2.5, 2.6, and
2.7. By using table 3.4 each propeller total thrust is obtained
Calculating Total thrust column
Propeller: 1 = 𝑍
4
Propeller: 2 = 𝑍
4
Propeller: 3 = 𝑍
4
Propeller: 4 = +(𝑇 − 𝑍) +𝑍
4
Where
Z = Total thrust in the z-axis which in this case is 68.6N
T = Total thrust which in this case is 80.8N
Now that the total thrust column has been calculated z-axis column can be calculated.
It is known that total z-axis thrust is 68.6N and total thrust is 80.9N, therefore 68.6𝑁
80.9𝑁 = 0.848. Individual thrust
for each propeller in the z-axis be calculated.
From table 3.7 it can be seen that propeller 1 has total thrust of 17.15N, therefore propeller 1 in the z-axis
can be calculated as 17.1N * 0.848 = 14.54N
Similarly the same method can be applied to propeller 4 in the z- axis, where 29.45N * 0.848 = 24.97N
The same method can be used to calculate thrust required by individual propeller in the x-axis. X-axis total
thrust is calculated as 34.76N.
42.9𝑁
80.9𝑁 = 0.530
Propeller 1 = 17.15N * 0.530 = 9.09N
Propeller 4 = 29.45N * 0.530= 15.61N
Now that the thrust for individual propeller has been obtained for performing a certain manoeuver, velocity of
each propeller and hence the voltage reduction can be calculated using “equations 2.8 and 2.9 (Khan,
2014)”.
𝑣𝑒𝑙𝑜𝑐𝑖𝑡𝑦𝑝𝑟𝑜𝑝𝑒𝑙𝑙𝑒𝑟 𝑁𝑜. = √𝑇𝑜𝑡𝑎𝑙 𝑡ℎ𝑟𝑢𝑠𝑡 𝑃𝑟𝑜𝑝𝑒𝑙𝑙𝑒𝑟 𝑁𝑜.
𝜌∗𝐴 Equation 2.8
𝑉𝑜𝑙𝑡𝑎𝑔𝑒𝑃𝑟𝑜𝑝𝑒𝑙𝑙𝑒𝑟 𝑁𝑜. = 1
𝑀𝑜𝑡𝑜𝑟 𝐾𝑉*
60∗𝑣𝑒𝑙𝑜𝑐𝑖𝑡𝑦𝑝𝑟𝑜𝑝𝑒𝑙𝑙𝑒𝑟 𝑁𝑜.
2∗𝜋∗𝑟 Equation 2.9
Taking the example used for forward flight each propellers thrust, velocity and corresponding voltage is
shown in table 3.8
Table 3.8 shows thrust, velocity and voltage for each propeller

UAS CHALLENGE 2015
250 Performance & Propulsion MEng Team Project Report (7ENT1024) School of Engineering and Technology
Propeller No Propeller Thrust (N) Velocity using equation 2.8 (m/s) Voltage using equation 2.9 (V) Voltage required per
motor (V)
1 17.15 13.85 1.22 18.5
2 17.15 13.85 1.22 18.5
3 17.15 13.85 1.22 18.5
4 29.45 18.15 1.60 20.9
From table 3.8 it can be seen that for the Quad-rotor to attain an angle of 32 degrees the voltage required
from the batteries is 18.5V for three motors and 20.9V for one motor which can be achieved by the lithium-
ion batteries chosen for this project.
H.13. Velocity of Quad rotor Take of velocity for a Quad-rotor can be calculated based on the velocity of the air while the free stream of
the Quad-rotor is equal to zero.
𝑉ℎ = √𝑇
2𝜌𝐴 Equation 3.0
Where:
T = Thrust
𝜌 = Density kg/𝑚3
𝐴 = 𝑃𝑟𝑜𝑝𝑒𝑙𝑙𝑒𝑟 𝐴𝑟𝑒𝑎 𝑚2
Table 4.0 shows different density setting at certain altitude coupled with Quad-rotor thrust required with and
without payload
Using table 4.0 and equation 3.0 take-off velocity can be calculate:
Take-Off Velocity with payload to 30.48m = 9.9m/s
Take-Off Velocity without payload to 30.48m = 9.1m/s
Take-Off Velocity with payload to 121.92m = 10m/s
Take-Off Velocity without payload to 121.92 = 9.2m/s
Time to reach cruise altitude
Time to cruise altitude of between 100ft and 400ft can now be calculated using “equation 3.1 (Physics,
2014)”
𝑑 (𝑚) = 𝑉𝑖 ∗ 𝑡𝑖 + 1
2∗ 𝑎 (
𝑚
𝑠2) ∗ 𝑡2 Equation 3.1
Table 4.0 Density at
30.48m
kg/𝑚3
Density at
121.92m
kg/𝑚3
Mass with
Payload
(kg)
Thrust required
with Payload
(N)
Mass without
Payload
(kg)
Thrust required
without
payload
(N)
Propeller
Area
(𝑚2)
1.192 1.179 7 68.67 6 58.86 0.292

UAS CHALLENGE 2015
251 Performance & Propulsion MEng Team Project Report (7ENT1024) School of Engineering and Technology
Where:
d = Distance m
𝑉𝑖 = Initial velocity m/s
𝑡𝑖 = Initial time s
𝑎 = 𝐹𝑜𝑐𝑒 (𝑁)
𝑀𝑎𝑠𝑠 (𝑘𝑔)= Acceleration m/𝑠2
t = time taken s
Table 4.1 Distance
(m)
Distance
(m)
Initial
velocity
(m/s)
Initial
time (s)
Force
(N)
Mass
with
payload
(kg)
Mass without
payload (kg)
Acceleration
with payload
(m/𝑠2)
Accelerati
on
without
payload
(m/𝑠2)
Time
taken (s)
30.48 121.92 0 0 86.33 7 6 12.33 14.38 6
Using table 4.1 and equation 3.1 can be rearranged to
𝑑 (𝑚) =1
2∗ 𝑎 (
𝑚
𝑠2) ∗ 𝑡2 or to calculate time to height t = √𝑑 (𝑚)∗2
𝑎(𝑚
𝑠2)
Time to height of 30.48m with payload = 2.2s
Time to height of 30.48m without payload = 2.0s
Time to height of 121.92m with payload = 4.45s
Time to height of 121.92 without payload = 4.1s
Stall
Stall for a Quad-rotor that weights 7kg will stall if the maximum tilt angle of 320 is exceeded
H.14. Flight performance Flight performance below is calculated based the flight path that would be undertaken during the
competition. Each leg of the flight path is identify by a number (i.e. [1]). The distance of each leg is
calculated using google earth.
Important Data

UAS CHALLENGE 2015
252 Performance & Propulsion MEng Team Project Report (7ENT1024) School of Engineering and Technology
1. Flight performance calculations will be based on a worst case scenario were the Quad-rotor has a
mass 7kg and in full gust conditions throughout the flight path.
2. Having constructed a test rig and performed analysis on the propeller/brushless motor combination it
was obtained that a current draw per motor is identified as 47Amps and power required as
829Watts.
“Figure 1.6 (google, 2015)” shows example flight course provided by IMECH
Initial starting point: On the runway with no power
Table: 4.2 shows initial starting state of the Quad-rotor
Location Velocity (m/s) Time (s) Battery Status (%) Distance Covered (m)
[Runway] 0 0 100 0
First leg: Quad-rotor will take-off to its cruise altitude of 100ft ready to transit to its maximum pitch angle of
26.870. 100ft is used as the cruise altitude so that when it approaches the drop box it can perform a quicker
drop of time. Also a Quad-rotor cannot tilt immediately from the runway position as the propeller will make
contact with the asphalt, therefore it would require a certain height before a manoeuver is performed.
As the time is known to vertically climb to height of 30.46m and also the current draw of 37.26A per motor is
obtained from test rig based on 75% throttle setting, the battery percentage can therefore be calculated
using equation 3.2
𝐵𝑎𝑡𝑡𝑒𝑟𝑦 𝐶𝑎𝑝𝑎𝑐𝑖𝑡𝑦 (𝐴ℎ)
𝑇𝑜𝑡𝑎𝑙 𝐶𝑢𝑟𝑟𝑒𝑛𝑡 𝐷𝑟𝑎𝑤 (𝐴)∗ 60 = 𝑇𝑜𝑡𝑎𝑙 𝑓𝑙𝑖𝑔ℎ𝑡 𝑚𝑖𝑛𝑢𝑡𝑒𝑠 Equation 3.2
𝐵𝑎𝑡𝑡𝑒𝑟𝑦 𝐶𝑎𝑝𝑎𝑐𝑖𝑡𝑦 (𝐴ℎ)
37.26(𝐴) ∗ 4∗ 60 = 2.2 ∗ 0.0167(𝑚𝑖𝑛𝑢𝑡𝑒𝑠)
Battery Capacity remaining can be calculated
𝐵𝑎𝑡𝑡𝑒𝑟𝑦 𝐶𝑎𝑝𝑎𝑐𝑖𝑡𝑦 (𝐴ℎ) 𝑈𝑠𝑒𝑑 =2.2 ∗ 0.0167
60∗ (37.26 ∗ 4)
𝐵𝑎𝑡𝑡𝑒𝑟𝑦 𝐶𝑎𝑝𝑎𝑐𝑖𝑡𝑦 (𝐴ℎ) 𝑈𝑠𝑒𝑑 = 0.091
Therefore
16𝐴ℎ − 0.091𝐴ℎ = 15.91𝐴ℎ

UAS CHALLENGE 2015
253 Performance & Propulsion MEng Team Project Report (7ENT1024) School of Engineering and Technology
Battery Status %
15.91𝐴ℎ
16𝐴ℎ∗ 100 = 99.4%
Table 4.3 shows time taken and battery state from runway to cruise altitude
Location Velocity (m/s) Time (s) Battery Status (%) Distance Covered (m)
[Runway] to [30.46m] 0 2.2 99.4% 0
Second Leg: Now that the Quad-rotor is at a safe altitude maximum tilt angle of 26.870 can be applied. Also
using google earth the distance from runway to point [1] is calculated as 282m. Earlier it was calculated that
the Quad-rotor can achieve maximum velocity of 20.2m/s. Taking into account wind condition of 25knots
(12.86m/s) then the Quad-rotor can travel at a maximum velocity of 7.51m/s. Current draw of 47A per motor
was obtained again from the sophisticated test rig
Using the data above calculations for time and battery status can be calculated
𝑇𝑖𝑚𝑒 (𝑠) = 𝐷𝑖𝑠𝑡𝑎𝑛𝑐𝑒 (𝑚)
𝑆𝑝𝑒𝑒𝑑 (𝑚𝑠
)
𝑇𝑖𝑚𝑒 (𝑠) = 282𝑚
7.51𝑚/𝑠
𝑇𝑖𝑚𝑒 (𝑠) = 37.55𝑠
𝐵𝑎𝑡𝑡𝑒𝑟𝑦 𝐶𝑎𝑝𝑎𝑐𝑖𝑡𝑦 (𝐴ℎ)
𝑇𝑜𝑡𝑎𝑙 𝐶𝑢𝑟𝑟𝑒𝑛𝑡 𝐷𝑟𝑎𝑤 (𝐴)∗ 60 = 𝑇𝑜𝑡𝑎𝑙 𝑓𝑙𝑖𝑔ℎ𝑡 𝑚𝑖𝑛𝑢𝑡𝑒𝑠
𝐵𝑎𝑡𝑡𝑒𝑟𝑦 𝐶𝑎𝑝𝑎𝑐𝑖𝑡𝑦 (𝐴ℎ)
47(𝐴) ∗ 4∗ 60 = 37.55 ∗ 0.0167(𝑚𝑖𝑛𝑢𝑡𝑒𝑠)
Battery Capacity remaining can be calculated
𝐵𝑎𝑡𝑡𝑒𝑟𝑦 𝐶𝑎𝑝𝑎𝑐𝑖𝑡𝑦 (𝐴ℎ) 𝑈𝑠𝑒𝑑 =37.55 ∗ 0.0167
60∗ (47 ∗ 4)
𝐵𝑎𝑡𝑡𝑒𝑟𝑦 𝐶𝑎𝑝𝑎𝑐𝑖𝑡𝑦 (𝐴ℎ) 𝑈𝑠𝑒𝑑 = 1.96
Therefore
15.91𝐴ℎ − 1.96𝐴ℎ = 13.95𝐴ℎ
Battery Status %
13.95𝐴ℎ
16𝐴ℎ∗ 100 = 87.2%
Table 4.4 shows time taken and battery state from cruise altitude to point [1]
Location Velocity (m/s) Time (s) Battery Status (%) Distance Covered (m)
[30.5m]-[1] 7.51 37.55 87.2 282
Third Leg: After a quick turn at point [1] the Quad-rotor will travel another 842m which again was measured
from google earth. Again the velocity will be taken as 7.51m/s and current draw of 47A per motor.
𝑇𝑖𝑚𝑒 (𝑠) = 842𝑚
7.51𝑚/𝑠
𝑇𝑖𝑚𝑒 (𝑠) = 112.12𝑠
𝐵𝑎𝑡𝑡𝑒𝑟𝑦 𝐶𝑎𝑝𝑎𝑐𝑖𝑡𝑦 (𝐴ℎ)
𝑇𝑜𝑡𝑎𝑙 𝐶𝑢𝑟𝑟𝑒𝑛𝑡 𝐷𝑟𝑎𝑤 (𝐴)∗ 60 = 𝑇𝑜𝑡𝑎𝑙 𝑓𝑙𝑖𝑔ℎ𝑡 𝑚𝑖𝑛𝑢𝑡𝑒𝑠

UAS CHALLENGE 2015
254 Performance & Propulsion MEng Team Project Report (7ENT1024) School of Engineering and Technology
𝐵𝑎𝑡𝑡𝑒𝑟𝑦 𝐶𝑎𝑝𝑎𝑐𝑖𝑡𝑦 (𝐴ℎ)
47(𝐴)∗4∗ 60 = 112.12 ∗ 0.0167(𝑚𝑖𝑛𝑢𝑡𝑒𝑠)
Battery Capacity remaining can be calculated
𝐵𝑎𝑡𝑡𝑒𝑟𝑦 𝐶𝑎𝑝𝑎𝑐𝑖𝑡𝑦 (𝐴ℎ) 𝑈𝑠𝑒𝑑 =112.12∗0.0167
60∗ (47 ∗ 4)
𝐵𝑎𝑡𝑡𝑒𝑟𝑦 𝐶𝑎𝑝𝑎𝑐𝑖𝑡𝑦 (𝐴ℎ) 𝑈𝑠𝑒𝑑 = 5.87
Therefore
13.95𝐴ℎ − 5.87𝐴ℎ = 8.08𝐴ℎ
Battery Status %
8.08𝐴ℎ
16𝐴ℎ∗ 100 = 50.5%
Table 4.5 shows time taken and battery state from [1] to point [2]
Location Velocity (m/s) Time (s) Battery Status (%) Distance Covered (m)
[1]-[2] 7.51 112.12 50.5 842
Fourth Leg: Again at point [2] the Quad-rotor will perform a sharp turn to align itself with point [3] which 418m
away from point [2]. With velocity of 7.51m/s and current draw of 47A per motor
𝑇𝑖𝑚𝑒 (𝑠) = 418𝑚
7.51𝑚/𝑠
𝑇𝑖𝑚𝑒 (𝑠) = 55.7𝑠
𝐵𝑎𝑡𝑡𝑒𝑟𝑦 𝐶𝑎𝑝𝑎𝑐𝑖𝑡𝑦 (𝐴ℎ)
𝑇𝑜𝑡𝑎𝑙 𝐶𝑢𝑟𝑟𝑒𝑛𝑡 𝐷𝑟𝑎𝑤 (𝐴)∗ 60 = 𝑇𝑜𝑡𝑎𝑙 𝑓𝑙𝑖𝑔ℎ𝑡 𝑚𝑖𝑛𝑢𝑡𝑒𝑠
𝐵𝑎𝑡𝑡𝑒𝑟𝑦 𝐶𝑎𝑝𝑎𝑐𝑖𝑡𝑦 (𝐴ℎ)
47(𝐴)∗4∗ 60 = 55.7 ∗ 0.0167(𝑚𝑖𝑛𝑢𝑡𝑒𝑠)
Battery Capacity remaining can be calculated
𝐵𝑎𝑡𝑡𝑒𝑟𝑦 𝐶𝑎𝑝𝑎𝑐𝑖𝑡𝑦 (𝐴ℎ) 𝑈𝑠𝑒𝑑 =55.7∗0.0167
60∗ (47 ∗ 4)
𝐵𝑎𝑡𝑡𝑒𝑟𝑦 𝐶𝑎𝑝𝑎𝑐𝑖𝑡𝑦 (𝐴ℎ) 𝑈𝑠𝑒𝑑 = 2.91
Therefore
8.08𝐴ℎ − 2.91𝐴ℎ = 5.17𝐴ℎ
Battery Status %
5.17𝐴ℎ
16𝐴ℎ∗ 100 = 32.3%
Table 4.6 shows time taken and battery state from [2] to point [3]
Location Velocity (m/s) Time (s) Battery Status (%) Distance Covered (m)
[2]-[3] 7.51 55.7 32.3 418
Fifth Leg: Again for this section same performance criteria can be assumed
𝑇𝑖𝑚𝑒 (𝑠) = 334𝑚
7.51𝑚/𝑠
𝑇𝑖𝑚𝑒 (𝑠) = 44.47𝑠
𝐵𝑎𝑡𝑡𝑒𝑟𝑦 𝐶𝑎𝑝𝑎𝑐𝑖𝑡𝑦 (𝐴ℎ)
𝑇𝑜𝑡𝑎𝑙 𝐶𝑢𝑟𝑟𝑒𝑛𝑡 𝐷𝑟𝑎𝑤 (𝐴)∗ 60 = 𝑇𝑜𝑡𝑎𝑙 𝑓𝑙𝑖𝑔ℎ𝑡 𝑚𝑖𝑛𝑢𝑡𝑒𝑠

UAS CHALLENGE 2015
255 Performance & Propulsion MEng Team Project Report (7ENT1024) School of Engineering and Technology
𝐵𝑎𝑡𝑡𝑒𝑟𝑦 𝐶𝑎𝑝𝑎𝑐𝑖𝑡𝑦 (𝐴ℎ)
47(𝐴)∗4∗ 60 = 44.47 ∗ 0.0167(𝑚𝑖𝑛𝑢𝑡𝑒𝑠)
Battery Capacity remaining can be calculated
𝐵𝑎𝑡𝑡𝑒𝑟𝑦 𝐶𝑎𝑝𝑎𝑐𝑖𝑡𝑦 (𝐴ℎ) 𝑈𝑠𝑒𝑑 =44.47∗0.0167
60∗ (47 ∗ 4)
𝐵𝑎𝑡𝑡𝑒𝑟𝑦 𝐶𝑎𝑝𝑎𝑐𝑖𝑡𝑦 (𝐴ℎ) 𝑈𝑠𝑒𝑑 = 2.33
Therefore
5.17𝐴ℎ − 2.33ℎ = 2.84𝐴ℎ
Battery Status %
2.84𝐴ℎ
16𝐴ℎ∗ 100 = 17.8%
Table 4.7 shows time taken and battery state from [3] to [Target]
Location Velocity (m/s) Time (s) Battery Status (%) Distance Covered (m)
[3]-[Target] 7.51 44.47 17.8 334
Hover and Navigation Leg: A this point the Quad-rotor will be hovering over the top of the target but also
navigating so that is can precisely on top of the 2x2 red square. It is estimated that it would take 20 seconds
for this to occur with current draw of 17.3A per motor
𝑇𝑖𝑚𝑒 (𝑠) = 20𝑠
𝐵𝑎𝑡𝑡𝑒𝑟𝑦 𝐶𝑎𝑝𝑎𝑐𝑖𝑡𝑦 (𝐴ℎ)
𝑇𝑜𝑡𝑎𝑙 𝐶𝑢𝑟𝑟𝑒𝑛𝑡 𝐷𝑟𝑎𝑤 (𝐴)∗ 60 = 𝑇𝑜𝑡𝑎𝑙 𝑓𝑙𝑖𝑔ℎ𝑡 𝑚𝑖𝑛𝑢𝑡𝑒𝑠
𝐵𝑎𝑡𝑡𝑒𝑟𝑦 𝐶𝑎𝑝𝑎𝑐𝑖𝑡𝑦 (𝐴ℎ)
17.3(𝐴)∗4∗ 60 = 20 ∗ 0.0167(𝑚𝑖𝑛𝑢𝑡𝑒𝑠)
Battery Capacity remaining can be calculated
𝐵𝑎𝑡𝑡𝑒𝑟𝑦 𝐶𝑎𝑝𝑎𝑐𝑖𝑡𝑦 (𝐴ℎ) 𝑈𝑠𝑒𝑑 =20∗0.0167
60∗ (17.3 ∗ 4)
𝐵𝑎𝑡𝑡𝑒𝑟𝑦 𝐶𝑎𝑝𝑎𝑐𝑖𝑡𝑦 (𝐴ℎ) 𝑈𝑠𝑒𝑑 = 0.39Ah
Therefore
2.84𝐴ℎ − 0.39𝐴ℎ = 2.45𝐴ℎ
Battery Status %
2.45𝐴ℎ
16𝐴ℎ∗ 100 = 15.3%
Table 4.8 shows time taken and battery state at [Target]
Location Velocity (m/s) Time (s) Battery Status (%) Distance Covered (m)
[Target] 0 20 15.3 0
Final Leg: Final leg of the mission is to return from the target drop off point back to the runway
𝑇𝑖𝑚𝑒 (𝑠) = 124𝑚
7.51𝑚/𝑠
𝑇𝑖𝑚𝑒 (𝑠) = 16.51𝑠
𝐵𝑎𝑡𝑡𝑒𝑟𝑦 𝐶𝑎𝑝𝑎𝑐𝑖𝑡𝑦 (𝐴ℎ)
𝑇𝑜𝑡𝑎𝑙 𝐶𝑢𝑟𝑟𝑒𝑛𝑡 𝐷𝑟𝑎𝑤 (𝐴)∗ 60 = 𝑇𝑜𝑡𝑎𝑙 𝑓𝑙𝑖𝑔ℎ𝑡 𝑚𝑖𝑛𝑢𝑡𝑒𝑠
𝐵𝑎𝑡𝑡𝑒𝑟𝑦 𝐶𝑎𝑝𝑎𝑐𝑖𝑡𝑦 (𝐴ℎ)
47(𝐴)∗4∗ 60 = 16.51 ∗ 0.0167(𝑚𝑖𝑛𝑢𝑡𝑒𝑠)

UAS CHALLENGE 2015
256 Performance & Propulsion MEng Team Project Report (7ENT1024) School of Engineering and Technology
Battery Capacity remaining can be calculated
𝐵𝑎𝑡𝑡𝑒𝑟𝑦 𝐶𝑎𝑝𝑎𝑐𝑖𝑡𝑦 (𝐴ℎ) 𝑈𝑠𝑒𝑑 =16.51∗0.0167
60∗ (47 ∗ 4)
𝐵𝑎𝑡𝑡𝑒𝑟𝑦 𝐶𝑎𝑝𝑎𝑐𝑖𝑡𝑦 (𝐴ℎ) 𝑈𝑠𝑒𝑑 = 0.86Ah
Therefore
2.45𝐴ℎ − 0.86𝐴ℎ = 1.59𝐴ℎ
Battery Status %
1.59𝐴ℎ
16𝐴ℎ∗ 100 = 9.93%
Table 4.8 shows time taken and battery state from [Target] to [Runway]
Location Velocity (m/s) Time (s) Battery Status (%) Distance Covered (m)
[Target]-[Runway] 7.51 16.51 9.93 124
Time Taken up to this point 288.55s (4.82minutes)
Reload Leg: At this point the Quad-rotor will be on the runway, power supply (8Ah) and
the second payload will be replaced ready for flight the estimated time for this will be 30
seconds. After the reload the same performance criteria as the first leg and can used.
𝐵𝑎𝑡𝑡𝑒𝑟𝑦 𝐶𝑎𝑝𝑎𝑐𝑖𝑡𝑦 (𝐴ℎ)
𝑇𝑜𝑡𝑎𝑙 𝐶𝑢𝑟𝑟𝑒𝑛𝑡 𝐷𝑟𝑎𝑤 (𝐴)∗ 60 = 𝑇𝑜𝑡𝑎𝑙 𝑓𝑙𝑖𝑔ℎ𝑡 𝑚𝑖𝑛𝑢𝑡𝑒𝑠
𝐵𝑎𝑡𝑡𝑒𝑟𝑦 𝐶𝑎𝑝𝑎𝑐𝑖𝑡𝑦 (𝐴ℎ)
37.26(𝐴)∗4∗ 60 = 2.2 ∗ 0.0167(𝑚𝑖𝑛𝑢𝑡𝑒𝑠)
Battery Capacity remaining can be calculated
𝐵𝑎𝑡𝑡𝑒𝑟𝑦 𝐶𝑎𝑝𝑎𝑐𝑖𝑡𝑦 (𝐴ℎ) 𝑈𝑠𝑒𝑑 =2.2∗0.0167
60∗ (37.26 ∗ 4)
𝐵𝑎𝑡𝑡𝑒𝑟𝑦 𝐶𝑎𝑝𝑎𝑐𝑖𝑡𝑦 (𝐴ℎ) 𝑈𝑠𝑒𝑑 = 0.091
Therefore
8𝐴ℎ − 0.091𝐴ℎ = 7.91𝐴ℎ
Battery Status %
7.91𝐴ℎ
8𝐴ℎ∗ 100 = 98.8%
Table 4.9 shows time taken and battery state from [Runway] to [30.46m]
Location Velocity (m/s) Time (s) Battery Status (%) Distance Covered (m)
[Runway] to [30.46m] 0 2.2 98.8% 0
Final Leg: The Quad-rotor will be at a height of 30.46m and will head towards the target.
𝑇𝑖𝑚𝑒 (𝑠) = 124𝑚
7.51𝑚/𝑠
𝑇𝑖𝑚𝑒 (𝑠) = 16.51𝑠

UAS CHALLENGE 2015
257 Performance & Propulsion MEng Team Project Report (7ENT1024) School of Engineering and Technology
𝐵𝑎𝑡𝑡𝑒𝑟𝑦 𝐶𝑎𝑝𝑎𝑐𝑖𝑡𝑦 (𝐴ℎ)
𝑇𝑜𝑡𝑎𝑙 𝐶𝑢𝑟𝑟𝑒𝑛𝑡 𝐷𝑟𝑎𝑤 (𝐴)∗ 60 = 𝑇𝑜𝑡𝑎𝑙 𝑓𝑙𝑖𝑔ℎ𝑡 𝑚𝑖𝑛𝑢𝑡𝑒𝑠
𝐵𝑎𝑡𝑡𝑒𝑟𝑦 𝐶𝑎𝑝𝑎𝑐𝑖𝑡𝑦 (𝐴ℎ)
47(𝐴)∗4∗ 60 = 16.51 ∗ 0.0167(𝑚𝑖𝑛𝑢𝑡𝑒𝑠)
Battery Capacity remaining can be calculated
𝐵𝑎𝑡𝑡𝑒𝑟𝑦 𝐶𝑎𝑝𝑎𝑐𝑖𝑡𝑦 (𝐴ℎ) 𝑈𝑠𝑒𝑑 =16.51∗0.0167
60∗ (47 ∗ 4)
𝐵𝑎𝑡𝑡𝑒𝑟𝑦 𝐶𝑎𝑝𝑎𝑐𝑖𝑡𝑦 (𝐴ℎ) 𝑈𝑠𝑒𝑑 = 0.86Ah
Therefore
7.91𝐴ℎ − 0.86𝐴ℎ = 7.1𝐴ℎ
Battery Status %
7.1𝐴ℎ
8𝐴ℎ∗ 100 = 88.12%
Table 5.0 shows time taken and battery state from [Runway] to [Target]
Location Velocity (m/s) Time (s) Battery Status (%) Distance Covered (m)
[Runway]-[Target] 7.51 16.51 88.12 124
Again we will have the Hover and Navigation Leg: A this point the Quad-rotor will be hovering over the top of
the target but also navigating so that is can precisely on top of the 2x2 red square. It is estimated that it
would take 20 seconds for this to occur with current draw of 17.3A per motor
𝑇𝑖𝑚𝑒 (𝑠) = 20𝑠
𝐵𝑎𝑡𝑡𝑒𝑟𝑦 𝐶𝑎𝑝𝑎𝑐𝑖𝑡𝑦 (𝐴ℎ)
𝑇𝑜𝑡𝑎𝑙 𝐶𝑢𝑟𝑟𝑒𝑛𝑡 𝐷𝑟𝑎𝑤 (𝐴)∗ 60 = 𝑇𝑜𝑡𝑎𝑙 𝑓𝑙𝑖𝑔ℎ𝑡 𝑚𝑖𝑛𝑢𝑡𝑒𝑠
𝐵𝑎𝑡𝑡𝑒𝑟𝑦 𝐶𝑎𝑝𝑎𝑐𝑖𝑡𝑦 (𝐴ℎ)
17.3(𝐴)∗4∗ 60 = 20 ∗ 0.0167(𝑚𝑖𝑛𝑢𝑡𝑒𝑠)
Battery Capacity remaining can be calculated
𝐵𝑎𝑡𝑡𝑒𝑟𝑦 𝐶𝑎𝑝𝑎𝑐𝑖𝑡𝑦 (𝐴ℎ) 𝑈𝑠𝑒𝑑 =20∗0.0167
60∗ (17.3 ∗ 4)
𝐵𝑎𝑡𝑡𝑒𝑟𝑦 𝐶𝑎𝑝𝑎𝑐𝑖𝑡𝑦 (𝐴ℎ) 𝑈𝑠𝑒𝑑 = 0.39Ah
Therefore
7.1𝐴ℎ − 0.39𝐴ℎ = 6.71𝐴ℎ
Battery Status %
6.71𝐴ℎ
8𝐴ℎ∗ 100 = 83.8%
Table 5.1 shows time taken and battery state at [Target]
Location Velocity (m/s) Time (s) Battery Status (%) Distance Covered (m)
[Target] 0 20 83.8 0
Lastly we have final leg again: Final leg of the mission is to return from the target drop off point back to the
runway
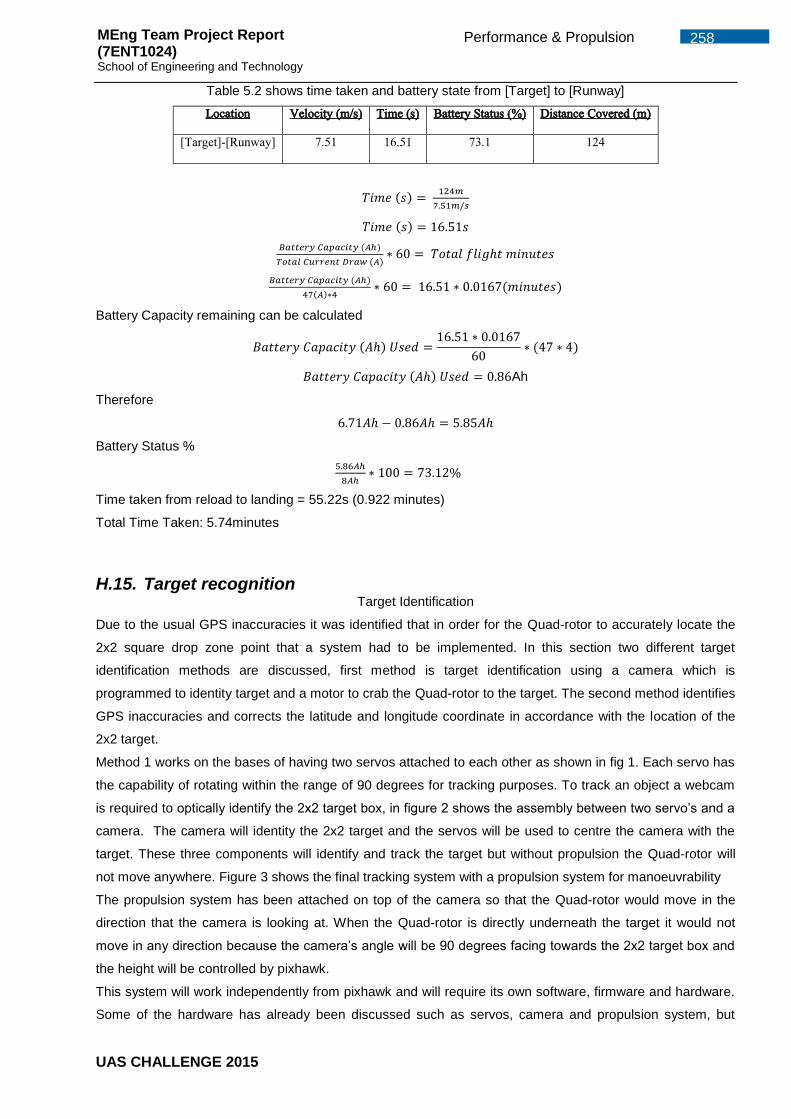
UAS CHALLENGE 2015
258 Performance & Propulsion MEng Team Project Report (7ENT1024) School of Engineering and Technology
Table 5.2 shows time taken and battery state from [Target] to [Runway]
Location Velocity (m/s) Time (s) Battery Status (%) Distance Covered (m)
[Target]-[Runway] 7.51 16.51 73.1 124
𝑇𝑖𝑚𝑒 (𝑠) = 124𝑚
7.51𝑚/𝑠
𝑇𝑖𝑚𝑒 (𝑠) = 16.51𝑠
𝐵𝑎𝑡𝑡𝑒𝑟𝑦 𝐶𝑎𝑝𝑎𝑐𝑖𝑡𝑦 (𝐴ℎ)
𝑇𝑜𝑡𝑎𝑙 𝐶𝑢𝑟𝑟𝑒𝑛𝑡 𝐷𝑟𝑎𝑤 (𝐴)∗ 60 = 𝑇𝑜𝑡𝑎𝑙 𝑓𝑙𝑖𝑔ℎ𝑡 𝑚𝑖𝑛𝑢𝑡𝑒𝑠
𝐵𝑎𝑡𝑡𝑒𝑟𝑦 𝐶𝑎𝑝𝑎𝑐𝑖𝑡𝑦 (𝐴ℎ)
47(𝐴)∗4∗ 60 = 16.51 ∗ 0.0167(𝑚𝑖𝑛𝑢𝑡𝑒𝑠)
Battery Capacity remaining can be calculated
𝐵𝑎𝑡𝑡𝑒𝑟𝑦 𝐶𝑎𝑝𝑎𝑐𝑖𝑡𝑦 (𝐴ℎ) 𝑈𝑠𝑒𝑑 =16.51 ∗ 0.0167
60∗ (47 ∗ 4)
𝐵𝑎𝑡𝑡𝑒𝑟𝑦 𝐶𝑎𝑝𝑎𝑐𝑖𝑡𝑦 (𝐴ℎ) 𝑈𝑠𝑒𝑑 = 0.86Ah
Therefore
6.71𝐴ℎ − 0.86𝐴ℎ = 5.85𝐴ℎ
Battery Status %
5.86𝐴ℎ
8𝐴ℎ∗ 100 = 73.12%
Time taken from reload to landing = 55.22s (0.922 minutes)
Total Time Taken: 5.74minutes
H.15. Target recognition Target Identification
Due to the usual GPS inaccuracies it was identified that in order for the Quad-rotor to accurately locate the
2x2 square drop zone point that a system had to be implemented. In this section two different target
identification methods are discussed, first method is target identification using a camera which is
programmed to identity target and a motor to crab the Quad-rotor to the target. The second method identifies
GPS inaccuracies and corrects the latitude and longitude coordinate in accordance with the location of the
2x2 target.
Method 1 works on the bases of having two servos attached to each other as shown in fig 1. Each servo has
the capability of rotating within the range of 90 degrees for tracking purposes. To track an object a webcam
is required to optically identify the 2x2 target box, in figure 2 shows the assembly between two servo’s and a
camera. The camera will identity the 2x2 target and the servos will be used to centre the camera with the
target. These three components will identify and track the target but without propulsion the Quad-rotor will
not move anywhere. Figure 3 shows the final tracking system with a propulsion system for manoeuvrability
The propulsion system has been attached on top of the camera so that the Quad-rotor would move in the
direction that the camera is looking at. When the Quad-rotor is directly underneath the target it would not
move in any direction because the camera’s angle will be 90 degrees facing towards the 2x2 target box and
the height will be controlled by pixhawk.
This system will work independently from pixhawk and will require its own software, firmware and hardware.
Some of the hardware has already been discussed such as servos, camera and propulsion system, but

UAS CHALLENGE 2015
259 Performance & Propulsion MEng Team Project Report (7ENT1024) School of Engineering and Technology
there are others such as the Arduino Uno were it enables the two servos and the camera to be integrated
together.
To ensure that all the hardware works with each other certain software’s programs are required to ensure
that the firmware is implemented correctly. Codes are available on request.
How the whole system will function
Method 2
The second idea involves calculating the error between google maps and the pixhawk. Firstly a location is
chosen in google maps as seen in figure 2.8 and figure 2.9
“Figure 2.8 (google, 2015)” shows an easily identifiable location for easy GPS extraction

UAS CHALLENGE 2015
260 Performance & Propulsion MEng Team Project Report (7ENT1024) School of Engineering and Technology
“Figure 2.9 (google, 2015)” show street view of the location in figure 2.8
By identifying a specific point on google earth the coordinates can then be identified pretty accurately, e.g.
the location above has coordinates of 51038’47.13”N; 0
004’29.80”W. The next process was to take pixhawk
to that exact same location which showed coordinates of 51038’47.28”N and 0
004’29.88N which is about 3.5
meters in difference. This process is repeated over several days at different locations so that a data base is
built up and the error between the two coordinates can be calculated and inputted back into pixhawk so that
it would have the same coordinate points as google earth.
Competition day scenario
On the competition day when the target location in given, at that point it would be logged into google maps
and the location identified via surrounding structures e.g. runway. From there the coordinates will be
identified and inputted into pixhawk after taking into account the error which has been calculated. From
figure 3.0 google maps identifies the target coordinates as 53055’128.83”N; 0
058’27.94”W
“Figure 3.0 (google, 2015)” shows the target drop point zone

UAS CHALLENGE 2015
261 UAS System Set Up MEng Team Project Report (7ENT1024) School of Engineering and Technology
Section by Johnathan Appendix. I UAS System Set Up H.1. Control Systems Standard Operating Procedures These procedures are step by step instructions on how to operate, maintain and test control systems components without the need of the control systems manager. These instructions would cover the following operations:
Installing the Autopilot firmware and configuring the autopilot main sensors
Implementing a flight plan
Configuring all other necessary parameters for the autopilot system
H.2. Connecting the Autopilot Controller (PIXHAWK) There are two main ways of connecting Pixhawk to a ground control station (Laptop with a Mission Planner Software) which are Serial connection and Telemetry kit. The steps are shown below:
Connect Pixhawk to the laptop, the driver necessary to make it connect should be
downloaded automatically or you can download from the PX4 official website. The first form
of connection to a GCS should be done through a USB port.
When Pixhawk is connected to the GCS, the buzzer would play a musical note to alert the
programmer that it has been connected to a power source.
After the first connection, a dedicated port is chosen by the laptop for the serial connection
and this port would show as COM5 on the GCS whenever Pixhawk is connected.
To connect Pixhawk to a GCS through a telemetry kit, the port to be used is COM3. An
easier method is to choose the option of AUTO whenever connecting Pixhawk to the GCS,
it would automatically find the correct port for whatever connection is chosen.
After the correct port is chosen and Pixhawk can then be fully connected. The following
screen would show if Pixhawk is connected properly.
Figure 161: Proof of Connection
H.3. Configuring the Autopilot Before the autopilot system can be programmed, the firmware must be downloaded to Pixhawk and this can be done through the Wizard function on Mission Planner. Another way to do this is to manually create a model of the UAV you want to build by specifying the UAV’s properties. The steps to do this are show below:
Click on the Initial Setup Button on the top menu of mission planner

UAS CHALLENGE 2015
262 UAS System Set Up MEng Team Project Report (7ENT1024) School of Engineering and Technology
Figure 162: Mission Planner top menu
The Initial Setup menu is the environment where the firmware and all hardware are
configured whether they are mandatory or optional.
Figure 163: Initial Setup for all components
Every single component to be connected to Pixhawk is to be configured from here including all the primary on-board sensors such as the accelerometer and compass. To configure a specific one, click on it and follow the instructions.
H.4. Implementing a Flight Plan To implement a flight plan (especially for autonomous flight), GPS coordinates are required to be inputted into Mission Planner.
Figure 164: Mission Planner Waypoint Entry Point
Before any waypoints are entered, the GPS should be left for a minute or two in order to
get satellite fix and then that first fixed position would be the home or launch position.
At the above shown environment in mission planner, the longitude, the latitude and altitude
of the waypoints for a flight plan. The waypoint radius, loiter radius and default altitude are
set at this environment.

UAS CHALLENGE 2015
263 UAS System Set Up MEng Team Project Report (7ENT1024) School of Engineering and Technology
Other commands for secondary mission purposes such as servo commands or camera
commands for image processing or payload deployment. Flight modes such as loiter is also
set in this environment.
The commands would work at the waypoint altitude before them and as such it is not
necessary to set waypoints for the secondary commands.
Figure 165: Secondary Commands
After all the necessary commands for the flight plan has been inputted into Mission
Planner, the next step is to write it to Pixhawk Memory and start the mission; the
environment to write the at the right side of the mission planner
Figure 166: Area for writing flight plans into Pixhawk's Memory
Another method to enter in commands is to load waypoint files that have been saved in the
form of text files.
The speed of the Quad-rotor flight to waypoints can be also programmed at this
environment with a DO_CHANGE_SPEED command or at the configuration setting area
where PID values are set.
H.5. Stability and Control Procedures for Quad-rotor For the Quad-rotor to be fully stable in flight, Pixhawk programming has in built controllers that control the Quad-rotor and stabilises it if it any external disturbances are encountered in the Quad-rotor flight path. Although Pixhawk has in built controllers, the controllers need to be programmed for the different motions. The PID numbers have to be set and there are a variety of methods to get it.
To input the PID numbers, click on the CONFIG/TUNING button at the top of the Mission
Planner Software.
Click on Extended tuning; in the environment, all PID numbers can be set as well.
Waypoint Speed, radius, ascending and descending speed.

UAS CHALLENGE 2015
264 UAS System Set Up MEng Team Project Report (7ENT1024) School of Engineering and Technology
Figure 167: Stability Tuning for Quad-rotor Control
H.6. Configuring other Autopilot Parameters The Quad-rotor flight parameters can be changed or fine-tuned in order to improve flight performance and stability. Such parameters include control systems fail-safes, sensor settings, monitoring systems settings, radio controller settings, etc.
To get to this area in mission planner, click on the CONFIG/TUNING button at the top
menu on Mission Planner.
After that, click on standard parameters button on the side menu.
A list of parameters would appear and most of them would have been set to default or
disable in order to prevent systems from malfunctioning.
For changed parameters to have effect they have to be written to Pixhawk memory, to do
that, after changing the parameter click write and to be sure it has saved, a progress bar
would appear and then disappear when the parameter is being written.
Figure 168: Mission Plannner environment for changing parameters
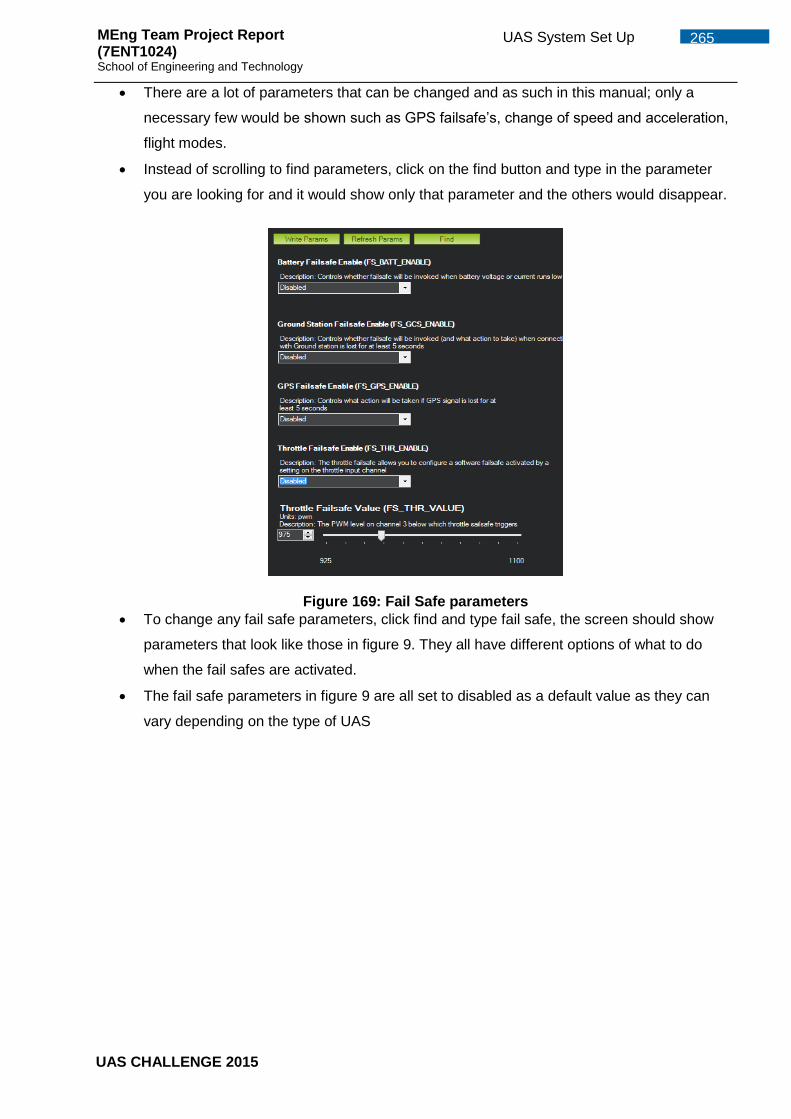
UAS CHALLENGE 2015
265 UAS System Set Up MEng Team Project Report (7ENT1024) School of Engineering and Technology
There are a lot of parameters that can be changed and as such in this manual; only a
necessary few would be shown such as GPS failsafe’s, change of speed and acceleration,
flight modes.
Instead of scrolling to find parameters, click on the find button and type in the parameter
you are looking for and it would show only that parameter and the others would disappear.
Figure 169: Fail Safe parameters
To change any fail safe parameters, click find and type fail safe, the screen should show
parameters that look like those in figure 9. They all have different options of what to do
when the fail safes are activated.
The fail safe parameters in figure 9 are all set to disabled as a default value as they can
vary depending on the type of UAS

UAS CHALLENGE 2015
266 UAS System Set Up MEng Team Project Report (7ENT1024) School of Engineering and Technology
Figure 170: Typical Set Fail Safe Values
Figure 10 shows the appropriate fail safe values to be set for a Quad-rotor; after these
values have been chosen click on the write button to copy them to Pixhawk memory.
These parameters would hold even after a reboot but they would be set to their default
values if Pixhawk is reset (firmware deleted or overwritten on the board).
The monitoring system parameters are shown at their defaults value in figure 11.
The monitoring system parameters include the arming check for the Quad-rotor, GPS
failsafe, throttle failsafe enable.
To be flight ready, the monitoring system should be set as shown in figure 12.
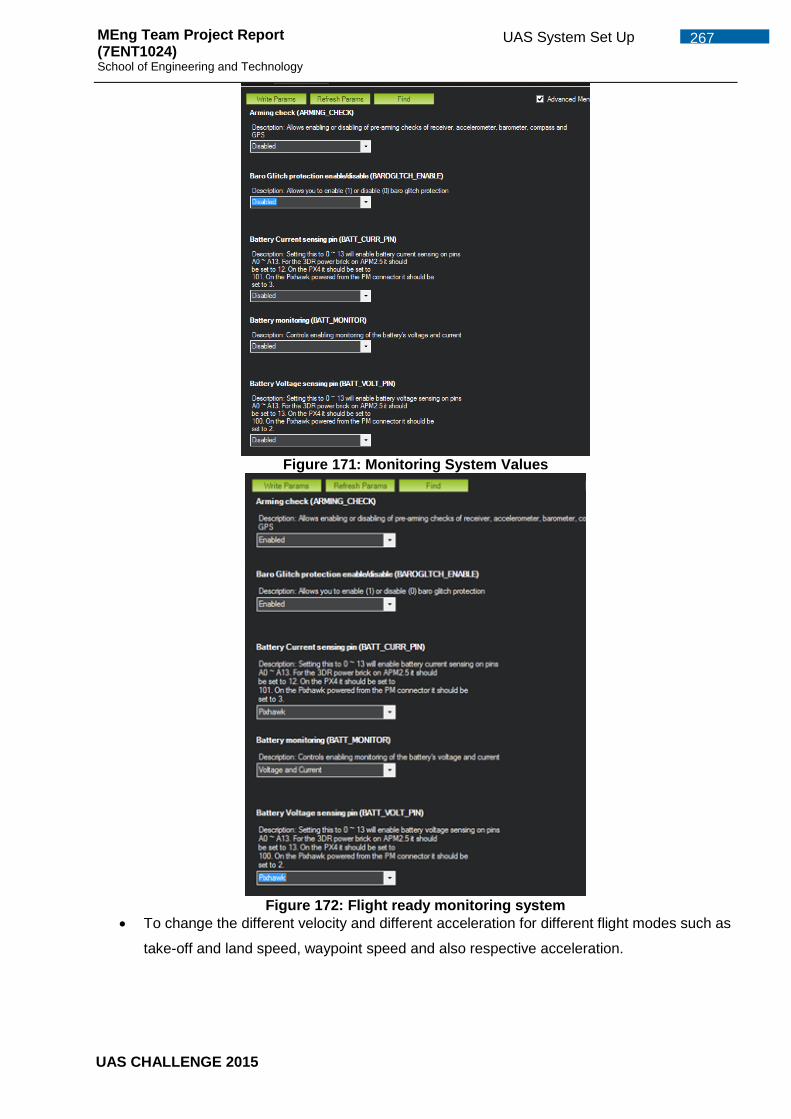
UAS CHALLENGE 2015
267 UAS System Set Up MEng Team Project Report (7ENT1024) School of Engineering and Technology
Figure 171: Monitoring System Values
Figure 172: Flight ready monitoring system
To change the different velocity and different acceleration for different flight modes such as
take-off and land speed, waypoint speed and also respective acceleration.

UAS CHALLENGE 2015
268 UAS System Set Up MEng Team Project Report (7ENT1024) School of Engineering and Technology
Figure 173: Quad-rotor Acceleration and Velocity parameters
The units of velocity and acceleration are in cm/s and cm/s2.
H.7. General remarks and safety warnings To configure the autopilot system for flight, the most important configurations are all shown above. To make sure that all configurations are done in a safe way in order to prevent damage, the following notes should be taken into consideration.
Whenever Pixhawk is to be used, the buzzer and the safety switch must always be plugged
in. The musical tones would sound when Pixhawk is booted up or when important
parameters are saved on Pixhawk hard drive.
Do not change the transmission rate for any connection methods.
Do not turn off Pixhawk without using the safety switch.
Only use Mission Planner to program the Pixhawk.
Before any flight, pre-arm check must be carried out on the components of the control
system.
Do not arm the motors when the batteries are low, if the propellers aren’t screwed on
properly and if the pre-arm check is failed.

UAS CHALLENGE 2015
269 Systems MEng Team Project Report (7ENT1024) School of Engineering and Technology
Section by Malwenna Malwenna
Appendix. J Systems
J.1. AltHold Mode Tuning
Test Changes to PID values
Expectations Changes required
1 Altitude Hold P set to zero
PID at standard 3DR Quad-rotor levels
P -0.7500
I- 1.500
D- 0.000
Keeping the throttle stick in the middle will still cause a climb with very little stability
This would be done to primarily observe the effect of altitude hold P gain on the system and purpose of AltHold mode being maintaining the altitude to hover, Altitude Hold gain P will be never zero.
1.1 Altitude Hold P slightly increased
PID at standard 3DR Quad-rotor levels
P -0.7500
I- 1.500
D- 0.000
The copter will start responding to the throttle command and will be able to maintain altitude at 40% -60% throttle
Increment in Altitude Hold P is needed for a better desired climb or desired decent rate to maintain the altitude
1.2 Altitude Hold P increased more
PID at standard 3DR Quad-rotor levels
P -0.7500
I- 1.500
D- 0.000
The copter will start to aggressively maintain altitude while having considerable amount of oscillations
Altitude Hold P gain will better the response time to correct however may need to change by further increasing to determine the best response time. PID values will need changing since current is optimum values for the 3DR Quad-rotor which is fairly small compared to ours.
1.3 Altitude Hold P increased to a higher number
PID at standard 3DR Quad-rotor levels
P -0.7500
I- 1.500
D- 0.000
Controlling the throttle will result in abrupt stops and starts of motors
Altitude Hold P gain should always be kept below this value since it can cause mechanical failure.
2 Changing The Throttle Rate P, D
Has to be observed since the expectation is not
As advised in the Ardupilot tuning guide, The Throttle Rate gains would not require tuning and therefor will be
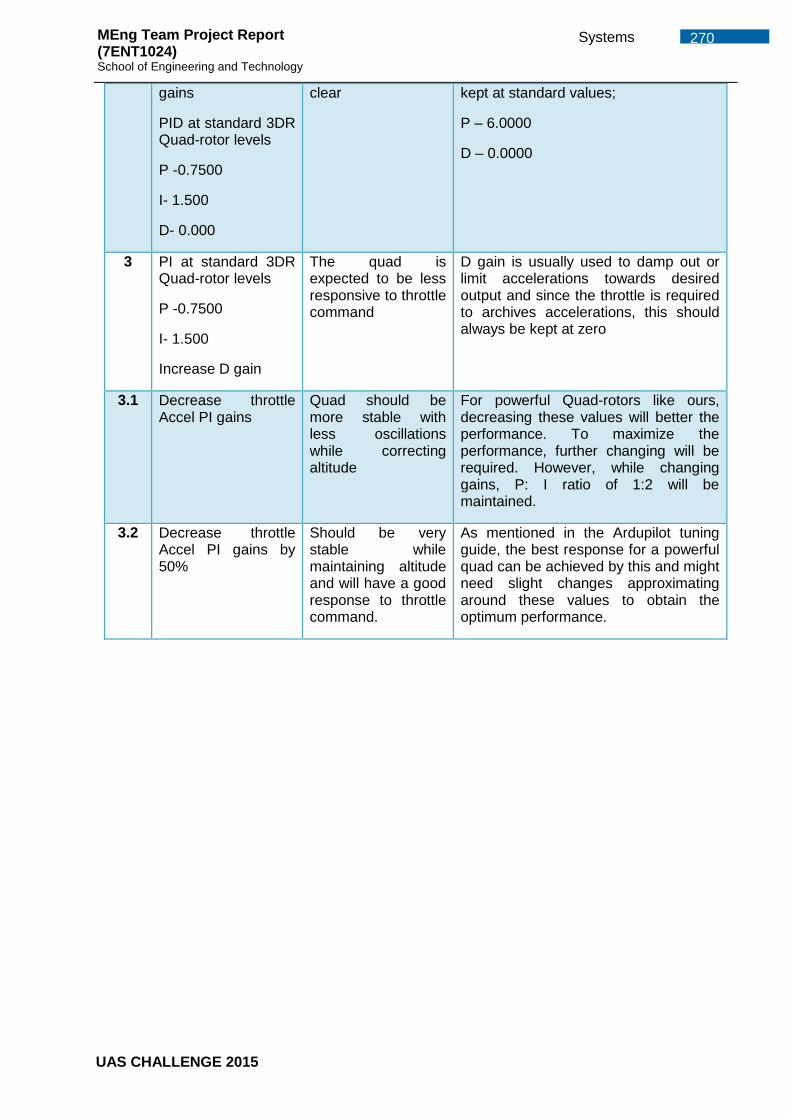
UAS CHALLENGE 2015
270 Systems MEng Team Project Report (7ENT1024) School of Engineering and Technology
gains
PID at standard 3DR Quad-rotor levels
P -0.7500
I- 1.500
D- 0.000
clear kept at standard values;
P – 6.0000
D – 0.0000
3 PI at standard 3DR Quad-rotor levels
P -0.7500
I- 1.500
Increase D gain
The quad is expected to be less responsive to throttle command
D gain is usually used to damp out or limit accelerations towards desired output and since the throttle is required to archives accelerations, this should always be kept at zero
3.1 Decrease throttle Accel PI gains
Quad should be more stable with less oscillations while correcting altitude
For powerful Quad-rotors like ours, decreasing these values will better the performance. To maximize the performance, further changing will be required. However, while changing gains, P: I ratio of 1:2 will be maintained.
3.2 Decrease throttle Accel PI gains by 50%
Should be very stable while maintaining altitude and will have a good response to throttle command.
As mentioned in the Ardupilot tuning guide, the best response for a powerful quad can be achieved by this and might need slight changes approximating around these values to obtain the optimum performance.

UAS CHALLENGE 2015
271 Systems MEng Team Project Report (7ENT1024) School of Engineering and Technology
J.2. Auto Tuning
Ensure the quad is properly tuned at AltHold mode prior Auto Tuning.
Procedure
1. Change one flight mode switch to AltHold.
2. Change Ch7 Opt or Ch8 Opt at Extended parameters to Auto tune.
3. Keep the Auto tune set switch in Low position.
4. Take the cat in a large open area away from the crowd to be tested.
5. Ensure there is no trim been set up in Radio controller.
6. Arm motors and take off to a desired altitude (not too high) and switch to AltHold mode to
hover.
7. Put Auto tune set switch to high position to engage auto tuning.
8. Input roll, pitch and yaw if quad starts drifting away.
9. Use switch to abandon Auto tuning if it seems too destabilized.
10. At the end of the tuning, PID gains will be changed back to original and can be monitored
through mission planner.
11. Switch Auto tune set switch to low position and back to high position to test the new PIDs.
12. Land and disarm the motors while at high position to save the new PIDs.
13. Land and disarm motors at low position to return to original PIDs
J.3. Risk Assessment
Likelihood definition
1 – 0-10% probability / Rare
2 – 11-40% probability / Unlikely
3 – 41-60% probability / Moderate
4 – 61-90% probability / Likely
5 – 91-100% probability / Very likely

UAS CHALLENGE 2015
272 Systems MEng Team Project Report (7ENT1024) School of Engineering and Technology
Severity definition
1 – There will be little or no impact and need to review quarterly.
2 – There will be a nominal impact associated with small budgets and lateness impacts and
unlikely to require monitoring.
3 – There will be significant effects on the project exceeding the budget by at least 10% with at
least a 10% lateness impact.
4 – There will be a significant impact on the outcome of the project exceeding the budget by at
least 25% with at least a 25% lateness impact.
5 – The project is likely to fail exceeding the budget by at least 50% with at least a 50%
lateness impact.
Lik
elih
oo
d
5 5 10 15 20 25
4 4 8 12 16 20
3 3 6 9 12 15
2 2 4 6 8 10
1 1 2 3 4 5
1 2 3 4 5
Severity

UAS CHALLENGE 2015
273 Systems MEng Team Project Report (7ENT1024) School of Engineering and Technology
I.D Risk Likeli
hood
Seve
rity
Ris
k
Lev
el
Control/Mitigation
1 Bird Strikes 1 5 5 Cannot be managed.
2 One motor failure 1 5 5 power of the motor in front of the failed to
counter the rotation about yaw axis and
guide the copter to safety.
3 Adverse weather conditions 2 4 8 Monitor weather forecast and avoid flying
in hazardous weather conditions.
4 Take-off and Landing failure 1 4 4 Use a checklist to ensure equipment are
working properly prior to take off.
5 Incorrect assembly of UAS
components
1 3 3 Use a checklist to be used prior every
flight, use setup guides and manuals
provided by equipment manufacturers.
6 Radio frequency interference 3 2 6 Keep wire/cable away from transmitters
and antennas, Use of shielding for your
wiring runs, Keep antennas as far apart as
possible, Monitor RC Channel interference
in between flights.
7 Propeller Injuries 1 5 5 Operate away from congested areas, 50m
away from all personals and structures.
8 Battery detachment 2 4 8 Use a Velcro Strap to hold the batteries.
9 Battery combustion 1 5 5 Monitor their temperature and regulate
their charging and discharging.
10 Systems compatibility issues 2 4 5 Research on compatibility and use same
suppliers
11 CAD and analysis work lost 2 2 4 Keep multiple backups
12 Suppliers delaying the
delivery of components/
material
3 3 9 Plan ahead and include a contingency in
time plan
13 Run out of budget 2 5 10 Accurate cost analysis and good planning

UAS CHALLENGE 2015
274 Systems MEng Team Project Report (7ENT1024) School of Engineering and Technology
14 Insufficient time for testing 2 4 8 Stage testing earlier and include a
contingency in time plan
15 Manufacturing lab and
equipment unavailable
2 4 8 Book in advance
16 University procurement
process delays
2 3 6 Finalizing required materials and
components early and communicate with
procurement early
17 UAS overheats 2 3 6 Check for any malfunctions before running
and do not exhaust the system
18 Wind tunnel unavailable 2 3 6 Book sessions in advance, design
alternative testing methods
19 Stability and control
algorithms fail
3 5 15 Use MATLAB to validate obtained PID
values through testing
20 Project delays 3 5 15 Good planning and including a
contingency time
21 Structural failure 1 5 5 Perform FEA test and revalidate
22 Autonomy fails 2 3 6 Designed to be able to manually control

UAS CHALLENGE 2015
275 Systems MEng Team Project Report (7ENT1024) School of Engineering and Technology
J.4. Diposal methods
Component The process used Environmental Hazards
Circuit Boards Open burning
Acid baths
Hazardous gas
emissions
Pollutants such as tin,
lead, glass powder
(brominated dioxin,
beryllium cadmium and
mercury) discharge into
rivers.
Gold plated components Chemical stripping using nitric
and hydrochloric acid
Burning of chips
Tin and lead discharged
directly into rivers
acidifying fish and flora.
Air emissions of
brominated dioxins,
heavy metals and
hydrocarbons can be
poisonous
Wires Stripping to remove copper
Open burning
Hydrocarbon residues,
free into water, air and
soil.
Table 29 system component disposal method

UAS CHALLENGE 2015
276 Systems MEng Team Project Report (7ENT1024) School of Engineering and Technology
J.5. OSD Specification
This section is used to justify the purchase of the autopilot equipment explained below.
Scope
The UAS Equipment is the on screen display board (OSD) to view the telemetry data.
Purpose
The On Screen Display is the video output of telemetry data of the UAS and will be
connected to the autopilot control board. The OSD transmits the telemetry ground data to the
ground control station. The module chosen for purchase is the MINIM OSD V1.1.
System Description
Overview
Figure 174 Minim OSD V2.1 (unmannedtechshop, 2015)
Part Name/Number The UAS Equipment is the on-screen display board (OSD) to view the telemetry data. The
module chosen for purchase is the MINIM OSD V2.
Criteria for Selection
A number of OSD modules were evaluated under the following checklist:
Compatibility for PIXHAWK control board.
Number of telemetry data outputs
Configuration ease
Cost
Power consumption
Size
Error indication and warning system (Lost GPS Fix, stall, over speed, battery voltage
and percentage, RSSI)

UAS CHALLENGE 2015
277 Systems MEng Team Project Report (7ENT1024) School of Engineering and Technology
List of Other Choices
1) MAX7456 On Screen Display OSD
2) Remzibi OSD 3DR
3) DJI iOSD Mark II
4) OSD Pro Pkg
5) Skylark Dianmu OSD
Conclusions
After comparing with other OSD modules the MEng control system group have decided that
this is the OSD module that should be bought.
Specifications
ATmega328P with Arduino bootloader
MAX7456 monochrome on-screen display
FTDI cable compatible pinout
Standard 6-pin ISP header
Two independent power sections with an LED indicator on each
Solder jumpers for combining the power sections
+5V 500mA regulator for up to +12V supply input
Solder jumper for PAL video option
Exposed test points for HSYNC and LOS
Dimensions: 0.7"W x 1.7"L (2.4" w/ pins as shown) x 0.3"H
Suppliers
The following are links where the Minim OSD Rev 1.1 can be bought.
http://www.hobbyking.co.uk/hobbyking/store/__36844__Minim_OSD_v1_1.html
http://store.3drobotics.com/products/apm-minimosd-rev-1-1
http://www.buildyourowndrone.co.uk/ardupilot-mega-minim-osd-rev-1-1.html
http://www.unmannedtechshop.co.uk/sample-marc-retro-style-summer-mid-dress/
Prices
Buidyourowndrone - £ 45.98
Hobby King - £ 13.63
Unmanned tech shop - £44.95

UAS CHALLENGE 2015
278 Systems MEng Team Project Report (7ENT1024) School of Engineering and Technology
J.6. GPS Specification
This section is used to justify the purchase of the autopilot equipment explained below.
Scope
The UAS Equipment is the external GPS with compass. The GPS with Compass chosen for
purchase is the 3DR uBlox GPS with Compass Kit,
Purpose
The GPS+compass unit will be the primary means navigation and tracking of the UAS and
will be connected to the autopilot control board.
System Description
Overview
Figure 175: 3DR uBlox GPS with Compass Kit (unmannedtechshop, 2015)
Part Name/Number The UAS Equipment is the external GPS with Compass. The GPS with Compass chosen for
purchase is the 3DR uBlox GPS with Compass Kit.
Criteria for Selection
A number of GPS + Compass modules were evaluated under the following checklist:
Compatibility for PIXHAWK control board.
GPS accuracy
Configuration ease
Cost

UAS CHALLENGE 2015
279 Systems MEng Team Project Report (7ENT1024) School of Engineering and Technology
Power consumption
Battery life
Battery rechargerbility
Protectiveness
List of Other Choices
1) Zubax GNSS
2) UBLOX NEO-M8N GPS GNSS
3) MediaTek MT3329 GPS V2.0
4) I2C GPS Shield Rev 2.0
Features and Specifications
ublox LEA-6H module
3-Axis Digital Compass IC HMC5883L
5 Hz update rate
25 x 25 x 4 mm ceramic patch antenna
LNA and SAW filter
Rechargeable 3V lithium backup battery
Low noise 3.3V regulator
I2C EEPROM for configuration storage
Power and fix indicator LEDs
Protective case
APM compatible 6-pin DF13 connector
Exposed RX, TX, 5V and GND pad
38 x 38 x 8.5 mm total size, 16.8 grams.
Conclusion After comparing with other GPS modules and also considering the recommendation to use
3DR uBlox GPS with Compass Kit on Pixhawk by Pixhawk manufacturer, the MEng control
system group have decided that this is the GPS module that should be bought. However,
given the unavailability, , GPS Crius CN-06 v2 was purchased instead.
Suppliers
The following are links where the uBlox GPS with Compass Kit can be bought.
http://www.buildyourowndrone.co.uk/3dr-ublox-gps-with-compass-lea-6h.html
http://www.hobbyking.co.uk/hobbyking/store/__42833__UBLOX_LEA_6H_GPS_Mod
ule_w_Built_in_Antenna_2_5m_Accuracy_V1_01.html
http://store.3drobotics.com/products/3dr-gps-ublox-with-compass
Prices Buidyourowndrone - £54.16
Also includes following
DF13 6 Position connector cable

UAS CHALLENGE 2015
280 Systems MEng Team Project Report (7ENT1024) School of Engineering and Technology
DF 13 4 Position connector cable.
Hobby King - £35.13
3D Robotics - £ 57.24
Also includes following
Four-position cable (compass)
Five-position-to-six-position cable (GPS) for APM or PX4

UAS CHALLENGE 2015
281 Altitude control MEng Team Project Report (7ENT1024) School of Engineering and Technology
Section by Reyad Malwenna Appendix. K Altitude control
Figure 176 CG calculations for the x and y-axis
Figure 177 CG calculations for z-axis
Assuming one motor is doing all the work, it requires 180g of additional thrust to compensate for CG that is off-centre by 2cm. As thrust/power ratio is not linear, increasing thrust will reduce motor efficiency.
With 1kg of payload, CG is at 0.88 cm and -1.67 cm with no payload

UAS CHALLENGE 2015
282 Altitude control MEng Team Project Report (7ENT1024) School of Engineering and Technology
J.1. Altitude control on MATLAB PID Values Effect on Quad-rotor Desired effect Mitigation
P = 0 I = 0 D = 0
Quad-rotor does not move No expectations As this is a trial and error method, the PID values were set to zero to see their effect, before adjustments can start being made
P = 1 I = 0 D = 0
Quad-rotor reaches 100ft at just under 3 seconds but continuously oscillates between 250ft and ground level due to lack of dampening
Quad-rotor to gradually reach 100ft, from a low P value, although this may be due to the high power of the motors, with a much lower levels of oscillation
Increase proportional value to see if a higher value may increase the time to 100ft and possibly reduce the oscillation
P = 2 I = 0 D = 0
Time to 100ft reduced further to approximately 2 seconds, with a peak altitude of hardly changed while the oscillation amplitude increased with the peak just over 320ft and no sign of damping. Throttle continuously hits 100% for extended periods of time.
Small change in going to 100ft Decrease the P value which will also reduce the voltage draw
P = 0.5 I = 0 D = 0
Time to reach 100ft increased to a much more reasonable level of 5 seconds while the peak altitude reduced to just above 220ft while oscillations also reduced
Amplitude to go down alongside the number of oscillations
Reduce the P value further, but this time by a much smaller amount. However, increasing the P value increases the sensitivity, but oscillations also increase. Derivative value will need to be increased to reduce oscillation
P = 0.4 I = 0 D = 0
Very little change from above Maximum height to fall 0.4 for the P value is far too low, even if the overshoot is very high. Reducing the P value from 0.5 to 0.4 reduced has very little effect which means we’re already at the point of diminishing returns. The P value will remain at 0.5 for the meantime while the Derivative value will be dampen the oscillations and overshoot
P = 0.5 I = 0 D = 0.1
Maximum height reduced to just over 200ft once the derivative value was included. However, while the oscillations are being damped, the rate of damping is very low, taking over 250 seconds to stabilise while the error margin was about 100% above the ideal position at 201ft.
Basic assumption that if the Proportional value is low, the Derivative value may also need to be fairly low to be effective which is not the case
D value must be increased by a fairly large amount to stabilise the Quad-rotor much quicker otherwise we’ll reduce forward speed whilst continuously trying to stabilise.
P = 0.5 I = 0
Quad-rotor now stabilises at 45 seconds, a far cry from the previous 250+ seconds
Rapidly damped oscillations D value will be further increased to reduce the time to settle

UAS CHALLENGE 2015
283 Altitude control MEng Team Project Report (7ENT1024) School of Engineering and Technology
D = 0.5 while the max altitude is at 155ft
P = 0.5 I = 0 D = 1
Max amplitude at approximate 120 seconds with oscillations fully damped by 25 seconds
Improved damping D value needs to be increased further to reduce damping time
P = 0.5 I = 0 D = 2
No overshoot. Settles at 100ft by about 15 seconds
Small overshoot D needs to be increased as settling time needs to reduced further but there is an issue here where the P value is too low and can cause the settling time to increase as D is increased
P = 0.5 I = 0 D = 4
Just as before, no overshoot but settling time is now 40 seconds
No specific expectation, simply curiosity The current D value is too high for the P value, although both are below what is ideal. D value will be returned to 2 while P will be increased
P = 1 I = 0 D = 2
Small overshoot, 7% over which is quite ideal while settling time is about 15 seconds
Settling time to reduce with a small overshoot which was close to what was desired
D value increased to see its effect as they are both assumed to be lower than ideal
P = 1 I = 0 D = 4
No overshoot while settling time did not change
Settling time to increase With the D value increased with very little change in settling time, it seems like the D value can be increased further. Although not without the P value first which will most create an overshoot but reduce the settling time
P = 2 I = 0 D = 4
No overshoot with settling time at approximately 7.5 seconds
Settling time reduced with a small overshoot
Seems like the P and D values are close and can be worked with. However, the P value will be increased to see for any positive changes
P = 4 I = 0 D = 4
Very large overshoot, with a maximum altitude of just over 120ft with no change in settling time
Overshoot with a reduction in settling time
P value will be reduced slightly to reduce the overshoot and settling time
P = 3 I = 0 D = 4
Overshoot reduced to a much more tolerable level while settling time reduce to just about 6 seconds
Reduced overshoot and settling time Seems close to where the PID values should be, therefore no more changes will be made as of yet. However, no disturbances were included where the I value will be needed
Table 30 Attitude control on MATLAB

UAS CHALLENGE 2015
284 Altitude control MEng Team Project Report (7ENT1024) School of Engineering and Technology
J.2. Roll and Pitch control on MATLAB PID Values Effect on Quad-rotor Desired effect Mitigation
P = 1 I = 0 D = 0
Very unstable, but cannot stabilise and falls out of the sky in less than 20 seconds
Gradually pitching down before becoming unstable
D value will be increased to see if It can stabilise
P = 1 I = 0 D = 1
Stabilises fairly quickly and continues to fly
Some form of stabilisation Double values to see if there are any changes
P = 2 I = 0 D = 2
Flight quite stable Some possible small changes Seems like any PID numbers in the PD numbers will not result in a change. Disturbances will be introduced to see what effect it has
P = 2 I = 0 D = 2
With oncoming wind, the quad gets thrown off initially before flying relatively well
A small struggle with the oncoming wind
Increase the I value
P = 2 I = 1 D = 2
Flight far less smooth and corrects itself a few times
A smoother flight Increase the I value further
P = 2 I = 2 D = 2
Flight path not followed correctly whatsoever with very sharp turns which are also inaccurate
Better correction While it seems like reducing the Integral value will allow for better flight path, the P and D values will be increased to check for any improvements
P = 4 I = 2 D = 4
Flight path much more smoother, small corrections need to be made every now and then
Smoother flight While the flight path is now much smoother, it still made one incorrect adjustment. The P and D values will be increased to see if they can rectify this
P = 6 I = 2 D = 6
Smooth flight path without any need for adjustments
Flight path to be the same as if there were no disturbances
No changes required for the PID values but may require further fine-tuning with the physical test rig
Table 31 Pitch and Roll control on MATLAB

UAS CHALLENGE 2015
285 Altitude control MEng Team Project Report (7ENT1024) School of Engineering and Technology
Test Changes to PID values
Expectations Changes required
1 P minimised I set to zero D set to zero
Very little sensitivity, gradually moving in the axis with little recovery from stabilise mode
While it may not be the case, the P will most likely required to be higher as this Quad-rotor will be quite heavy, including payload. Depending on the level of sensitivity, the P value may be increased by a large number or a low number, therefore either 2.1, 2.2 or 2.3 will be followed
2.1 P slightly increased I at zero D at zero
Much better levels of sensitivity
If a low value of P allows for a good level of control then further increasing P may allow for tighter sensitivity
2.2 P moderately increased I at zero D at zero
Improved responsiveness or possibly oscillations
If the P value required a moderate increase, then this should either greatly improve the level of control and a slight improvements required or cause the Quad-rotor to oscillate as the P value may have been set too high
2.3 P value greatly increased I at zero D at zero
Very high level of sensitivity or possibly oscillations which may be needed
As the P value had a major change, the sensitivity may be there but there is a likely chance that it will oscillate.
3 P value in/decreased I at zero D at zero
Quad-rotor should show very low levels of oscillations
If the P value will be further increased or decreased to get the Quad-rotor to show very low levels of oscillations. At this point, the P value will remain the way it is and the D value will be increased
4 P set as before I at zero D slightly increased
Low levels of recovery when pitched/rolled and lower to no oscillations
The D value at this point will most have a very small impact on the flight mode, although that will depend on how high or low the P value is. However, it will allow the quad to gradually return to zero and smoothen the flight
5 P value from previous I at zero D slightly increased
Quad-rotor should have a smoother flight once the stick has been removed to neutral and ideally all forms of oscillations gone
D may require a further slight increase to further improve the stick free movement although it may reduce the speed of response
6 P value from previous I at zero D slightly in/decreased
Quad-rotor may once again start to oscillate but at a lower level than when P was on its own
The D may be too high and oscillate and therefore require a slight decrease or slight increase of it hasn’t yet started to oscillate. Once it starts to oscillate, this will be the maximum value for D and P must be further increased to remove the oscillation
7 P increased I at zero D set as before
Quad-rotor should move a little faster with reduced oscillations
Increase the P value further
8 P value increased I at zero D as before
As the P value is increased, the responsiveness should increase until it starts to oscillate again
Once the Quad-rotor starts to oscillate, the P value needs to be increased to just below where the oscillations starts which should be where it will be set. Now the I value needs to be increased
9 P as before I slight increased D as before
The quad should no longer pull back as quickly once stick is no longer pushed
I being quite low will have very little visible effect on the Quad-rotor, which should be further hampered by the fact that it is on a test rig. The I value should still be increased a little more
10 P as before I slightly increased D as before
The quad should take a little longer to pull back
Now the quad should have a much smoother flight, if it was free of the test rig but a further increase might be beneficial
11 P as before The quad should take a At this stage the quad may stay in that

UAS CHALLENGE 2015
286 Altitude control MEng Team Project Report (7ENT1024) School of Engineering and Technology
I slight increased D as before
while longer to stabilise once again
position for too long which means reducing it.
12 P as before I slightly decreased D as before
The Quad-rotor should fly as intended for its task
Now that the PID values have been gathered and are effective, they need to be tested under disturbances
13 P as before I as before D as before weight added to one motor
With an added weight added to one motor, it should no longer fly as smoothly as before since the quad should be trying to rectify the change in CG and moment
If the weights are causing too much of an issue then some of the PID numbers may require adjustment which will depend on the level of change in flight the extra weight causes
14 P as before I as before D as before High airflow fan used for controlled wind conditions
The high airflow should buffet the Quad-rotor but it should be able to stabilise relatively quickly
It if struggles then the PID numbers may require some adjustment
15 P as before I as before D as before
Now that the all the PID values have been obtained, they need to reduced slightly (10-20%) as during flight they will no longer be attached to the test rig and therefore the extra force will no longer be needed and could cause oscillations during flight
16 P as before I as before D as before Flown outside
Smooth movements and relatively speedy reactions when stick is pulled back
If it doesn’t fly as well as intended then the PID may need to be changed. However, this will always depend on the pilot as not all pilots prefer one type of setup over another
Table 32 Pitch and Roll tuning on the test rig
Figure 178 Overview of the Simulink model
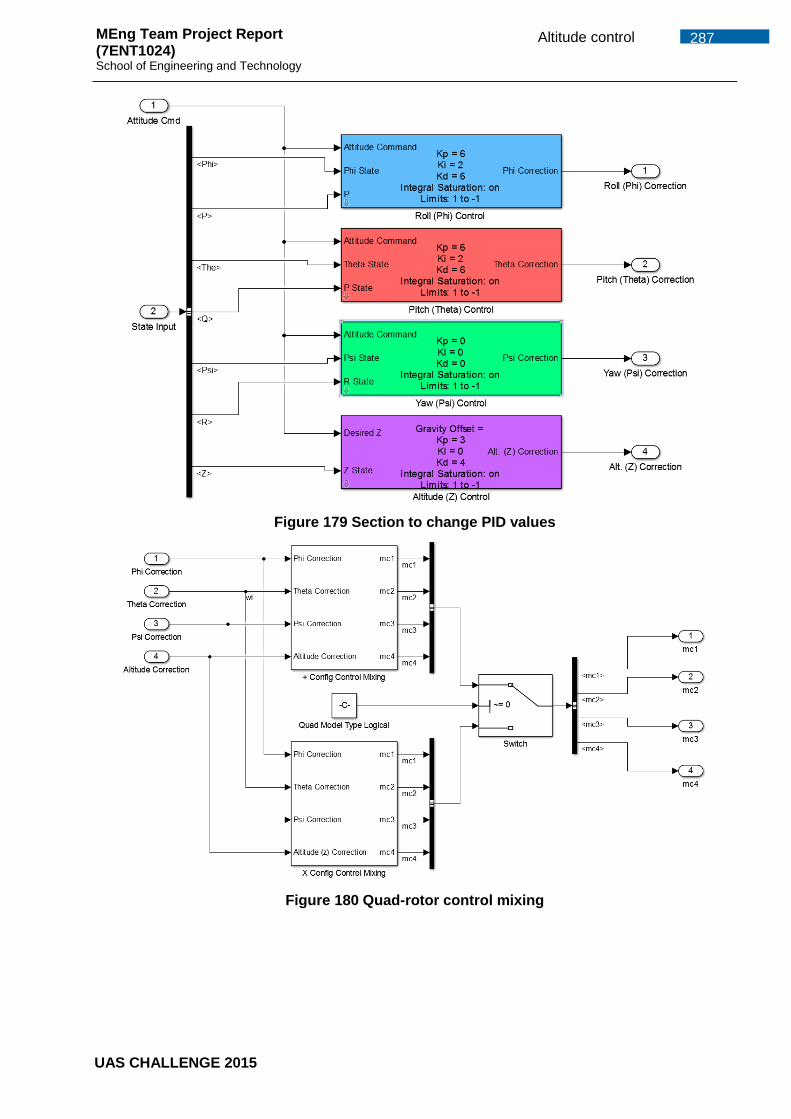
UAS CHALLENGE 2015
287 Altitude control MEng Team Project Report (7ENT1024) School of Engineering and Technology
Figure 179 Section to change PID values
Figure 180 Quad-rotor control mixing

UAS CHALLENGE 2015
288 Altitude control MEng Team Project Report (7ENT1024) School of Engineering and Technology
Figure 181 Quad-rotor dynamics
Figure 182 GUI of the Quad-rotor general parameters

289 | P a g e
289 Verification and validation MEng Team Project Report (7ENT1024) School of Engineering and Technology
Section by Tarek Appendix. L Verification and validation
K.1. Verfication Matrix Requirements Verification
Requiremen
t number
Requirement Inspection Analysi
s
Demo Test Comments
2.3 The UAV shall be capable of being controlled manually via radio
control however autonomous control is preferred.
Manual control can be demonstrated
by pilot and autonomous flight will be
demonstrated by setting the flight
conditions using pixhawk.
2.4 GPS waypoint locations and delivery will be provided on the
event day hence the UAS shall be programmable in the field.
Demonstration of the programming of
the flight setting can be shown.
2.5 The UAV shall be designed to remain within the range of 1km of
the ground station
An analysis will be required to be
carried out before testing and
demonstrating the
2.6 The UAV shall be visible at a distance of 500m* from the ground
station safety pilot (0) within the operating altitudes.
Simple visual assessment of the
Quad-rotor from a set distance.
2.7 UAV shall take off from the designated take-off and landing area
(APPENDIX C), remain in steady controlled flight from take-off to
an altitude between 100-400ft AGL (Above Ground Level).
Element of ground-based assistance for take-off and landing is
permitted, with transition to automatic control subject to point
penalties (APPENDIX A).
Demonstration of the Quad-rotor
operating at the required conditions
that are taking off from a set take of
space and land in the same space.
Also fly at altitude of up to 400ft AGL.
2.8 The UAS shall be controllable in forward speed together with 3 Pixhawk will be able to achieve this

290 | P a g e
290 Verification and validation MEng Team Project Report (7ENT1024) School of Engineering and Technology
axis control (Roll, Pitch and Yaw). and it will be demonstrated by setting
the Quad-rotor for autonomous flight.
2.9 The Ground Control Station shall display the following
information and be visible to the Operators, Flight Safety Officer
and Judges:
Current UAV position on a moving map.
Local Airspace including any No Fly Zones.
Search Area Boundaries.
Height AGL.
Indicated Airspeed (kts).
Information on UAV Health such as remaining fuel/battery,
engine/motor RPM and Orientation.
This can be demonetarised by the
use of the ground station and the
minimOSD which will show the
required information on screen.
3.1 The UAS shall have a Maximum Take-Off Mass (MTOM) of 7kg. Analysis of Quad-rotors weight can
be carried out using a scale.
3.2 The UAV control system shall have adequate sensitivity for
corrections during take-off and landing in conditions ranging
from 0kts up to winds of 5kts and gusts of 8kts.
The testing and demonstration of this
will be reviewed by using a testing
which will be able to rotate freely
demonstrating flight conditions. Part
of the test a weight will be added to
one of the arms and then time
correction until full stability.
3.3 The UAV must be designed to fly in wind conditions up to 20kts
and gusts of 25kts.
Calculations of wind conditions must
be carried out and demonstrated and
re-evaluated using the wind tunnel.

291 | P a g e
291 Verification and validation MEng Team Project Report (7ENT1024) School of Engineering and Technology
3.4 The maximum airspeed of the UAV shall not exceed 60 Kts_IAS)
(60.4Kts_(TAS)).
The testing of the speed of the Quad-
rotor can be tested in the wind tunnel
3.5 The UAS shall operate in temperature range of -10C to 35C
including solar radiation, with an atmospheric humidity of 95%
w/w.
This can be analysed using previous
or experimntal data and running
simulation to reprent wather
conidtions effects on the Quad-rotor.
3.6 The UAV stability* shall be predictable and controllable during
the mission, including during delivery of payload
A pilot with the required license will
shall demonstrate this.
4.1 The UAV shall be able to accomplish a flight path of 2km
considering the local conditions described in 3.2-3.5 and
payload configuration described in 4.5, at a working altitude of
that described in 2.7, in the time frame described in 4.2-4.3.
Wind tunnel can demonstrate the
distance that can be flown, by finding
the flight speed and time which will
allow to determining the distance as it
will also allow simulating different
weather conditions.
4.2 A target time for completion of the mission of 120 seconds is
required for scoring of maximum points. A Penalty (-1
point/5sec) is deductible for the total time of mission going
above 120 seconds.
This can be tested phew times in
different weather conditions using a
stop watch to measure time.
4.3 The UAV must be ready to launch within 5 minutes of the
allocated timeslot.
This can be timed using a stop watch.
4.6 The UAV shall be designed to operate from within a 10m x 30m
box, orientated within 30° of the wind direction and required to
stop within the box. Landing includes touchdown and roll-out,
with the UAV required to stop within the box.
Test will be carried out to determine
the flying ability of the Quad-rotor.
Take-off and landing test at different
weather conditions will need to be

292 | P a g e
292 Verification and validation MEng Team Project Report (7ENT1024) School of Engineering and Technology
undertaken to satisfy the requirement.
4.7 Consideration (for maximum accuracy and viability of a system
to autonomously detect an alphanumeric code shall be studied,
to compare in real time against the GPS. The ground marker
position for payload delivery is described. where a 2x2m red box
with an alphanumeric code, all placed within a white 8x8m box
border.
The simulation of the alphanumeric
detection will show the program
ability to process the image. After
processing a simple test can see
weather pixahw triggers the servo for
the payload delivery.
6.1 All radio equipment and data links must comply with EEC
directives, and must be licensed for use in the UK.
When purchasing verification of the
spec met the UK requirement and
specification requirement.
6.2 UAS shall receive (RX) and transmit (TX) data between the
ground station and UAV itself. i.e. Global Positioning System
(GPS) telemetry and health (0) data from a distance of minimum
500m of the control station.
This can be demonetarised by the
use of the ground station to locate the
Quad-rotor and the minimOSD will
show other information on screen.
6.3 The UAS shall autonomously fly around selected GPS
waypoints that shall be provided on the mission day, whilst
remaining inside the designated flying zone, and avoiding no-fly
zones.
Demonstration of the autonomous
flight of the Quad-rotor can be verified
by programing it to fly in a set area.
7.1 Batteries used in the UAV shall have bright coloured casings to
facilitate their location in the event of a crash.
Can visually analyse by seeing the
battery from a distance.
7.4 Batteries used in the UAV shall have bright coloured casings to
facilitate their location in the event of a crash.
Visually inspect the Quad-rotor to see
if the batteries are clearly visible.
7.5 The critical UAV components must be protected for water
ingress by light rain (2mm/hr).
This can be visually assessed by
looking at the parts setup.
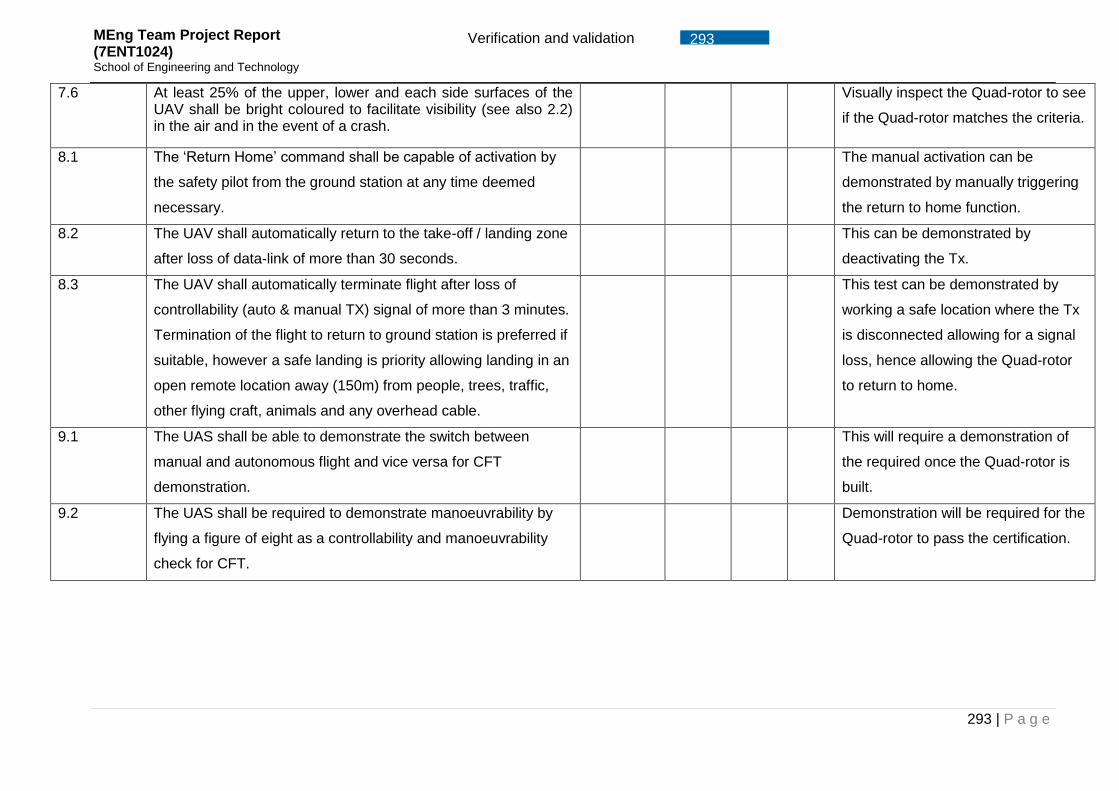
293 | P a g e
293 Verification and validation MEng Team Project Report (7ENT1024) School of Engineering and Technology
7.6 At least 25% of the upper, lower and each side surfaces of the UAV shall be bright coloured to facilitate visibility (see also 2.2) in the air and in the event of a crash.
Visually inspect the Quad-rotor to see
if the Quad-rotor matches the criteria.
8.1 The ‘Return Home’ command shall be capable of activation by
the safety pilot from the ground station at any time deemed
necessary.
The manual activation can be
demonstrated by manually triggering
the return to home function.
8.2 The UAV shall automatically return to the take-off / landing zone
after loss of data-link of more than 30 seconds.
This can be demonstrated by
deactivating the Tx.
8.3 The UAV shall automatically terminate flight after loss of
controllability (auto & manual TX) signal of more than 3 minutes.
Termination of the flight to return to ground station is preferred if
suitable, however a safe landing is priority allowing landing in an
open remote location away (150m) from people, trees, traffic,
other flying craft, animals and any overhead cable.
This test can be demonstrated by
working a safe location where the Tx
is disconnected allowing for a signal
loss, hence allowing the Quad-rotor
to return to home.
9.1 The UAS shall be able to demonstrate the switch between
manual and autonomous flight and vice versa for CFT
demonstration.
This will require a demonstration of
the required once the Quad-rotor is
built.
9.2 The UAS shall be required to demonstrate manoeuvrability by
flying a figure of eight as a controllability and manoeuvrability
check for CFT.
Demonstration will be required for the
Quad-rotor to pass the certification.

294 | P a g e
294 Verification and validation MEng Team Project Report (7ENT1024) School of Engineering and Technology
K.2. Validation Test System Test Procedure Date Result
Telemeter
kit
Establishing
connection
with Tx and
Rx
Plug in the telemetry kit receiver into the laptop using ground
control software (Mission planner) and establish connection with
the transmitter connected to the Pixhawk.
09/03/2015 Setting the ground control station into auto
it will automatically select the operating
frequency allowing for a quick connection.
Transmission
rate
Tilt pixhawk into different orientation and verify the response of
the orientation on the ground control station software (verify
attitude response)
09/03/2015 After carrying out this test an observation
was made that the ground control station
did see a change of attitude but there was
phew occasions where the response
displayed was lagging as the signal was
weakened.
Test the transmission connection in door 09/03/2015 Due to the massive interference of the
indoor testing the data displayed was not
accurate (especially the GPS data)
Place the receiver indoor and the transmitter outdoor and see the
connection response along with signal strength
10/03/2015 This test established the fact of the indoor
interference of the GPS as when the GPS
was placed outdoors it was able establish a
GPS lock on to location. Hence displaying
accurate data.
Transmission
range
Test the distance of transmission at an open field. 16/03/2015 Testing the maximum transmission range
at an open filed, a distance of 450 meters
was recorded but this was limited due to
the size of the field. Therefore the distance

295 | P a g e
295 Verification and validation MEng Team Project Report (7ENT1024) School of Engineering and Technology
connection will be further as the spec state
a distance of more than 500meters is
possible.
Video
transmissio
n
Transmission
rate
Transmit the video through pixhawk and receive the live video
feed at the ground station (check if there is a lag in the video
transmission)
11/05/2015
Transmission
range
Test if the distance of transmission is the same as in telemetry kit
test.
11/05/2015
Video display Connect the camera to the Minim OSD and verify if the display
the live feed with the correct information
11/05/2015
Image
processing
Video display Program the Minim OSD to display the battery life, altitude,
attitude and direction.
12/05/2015
Image
processing
The image processing will need to be able to identify
alphanumeric at the location of the target and translate it to a text
file.
19/01/2015 The program has been tested and it
successfully outputted the right results
Pixhawk will able to take picture when triggered, which will then
process the image to output a text file.
14/05/2015
Pixhawk Testing
pixhawk
sensors
The servo test will try to operate four servo channels connected
on the USART2 pins
14/04/2015 The servo was tested and is fully
operational after realisation that the servo
only worked with the use of the BEC.
The tone test will allow to play a tune which will indicate that
pixhawk is ready for use
02/03/2015 The test was a simple test as when power
is supplied to pixhawk it would
automatically alert the user that’s its ready
for use.

296 | P a g e
296 Verification and validation MEng Team Project Report (7ENT1024) School of Engineering and Technology
LED test will show the different conditions of the pixhawk (when
on, off, connected)
02/03/2015 When pixhawk is first switched on the kill
switch will indicate a red light however
before disconnecting pixhawk the kill switch
must be toggled to disconnect it and that
will display a flashing light to indicate it’s
safe to disconnect.
Calibrating the RC receiver with pixhawk 16/04/2015 The radio control had been calibrated to fly
the Quad-rotor. An additional joypad was
also calibrated to operate the Quad-rotor.
Navigation
system
Signal
strength
Examine the GPS location test on different weather conditions at
different locations, to test its signal triangulation.
23/03/2015 The GPS was able to achieve its global
positioning lock even when tested inside a
building.
Plan a journey using the ground control, and test the navigation
system GPS response by moving to the destination
19/03/2015 The setting of the way point for the Quad-
rotor is straight forward either by the use of
coordinates or point selection on the map.
Propulsion performance Test the voltage usage at full power and the current drain from
the batteries
19/03/2015
Test the current drain from the engines at different wind speeds
(in wind tunnel).
27/03/2015
Time how long the battery last at full power 25/03/2015
Test the amount of weights the motors are able to carry 20/05/2015
Safety test Drop the final built Quad-rotor from 15 cm from ground to
represent landing
18/05/2015
Test the final model in the wind tunnel to see the structural rigidly 31/03/2015 After testing the Quad-rotor looked staple
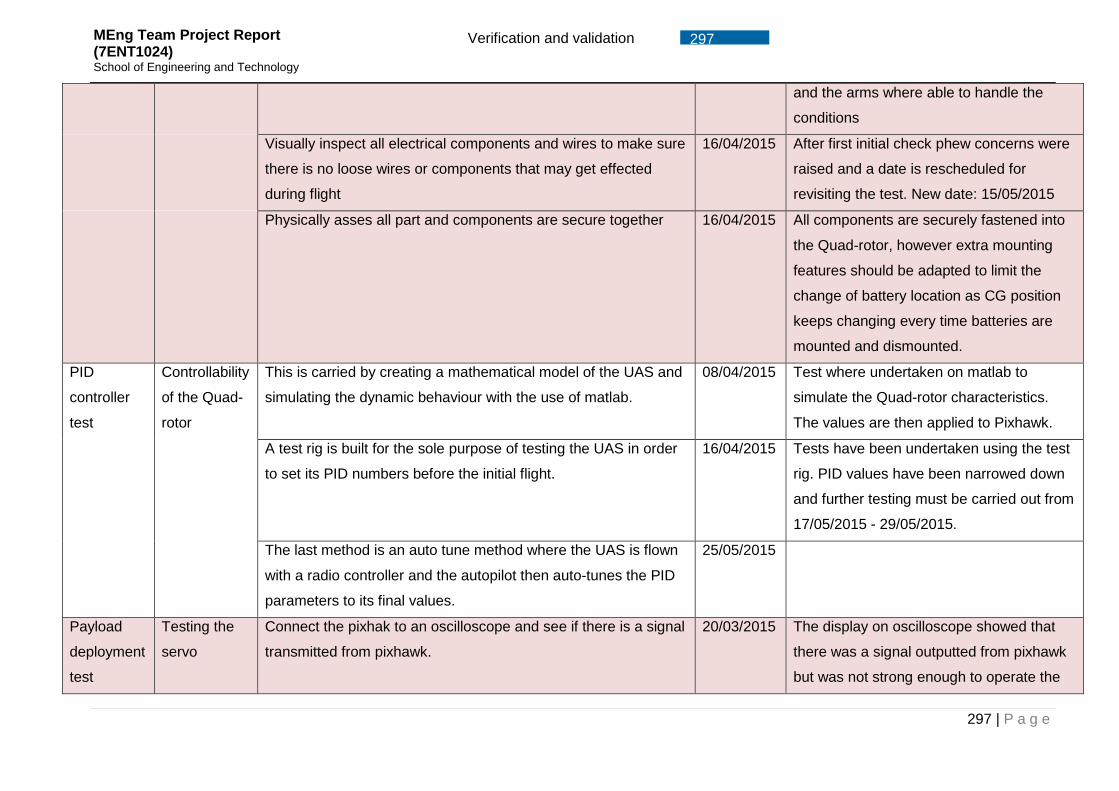
297 | P a g e
297 Verification and validation MEng Team Project Report (7ENT1024) School of Engineering and Technology
and the arms where able to handle the
conditions
Visually inspect all electrical components and wires to make sure
there is no loose wires or components that may get effected
during flight
16/04/2015 After first initial check phew concerns were
raised and a date is rescheduled for
revisiting the test. New date: 15/05/2015
Physically asses all part and components are secure together 16/04/2015 All components are securely fastened into
the Quad-rotor, however extra mounting
features should be adapted to limit the
change of battery location as CG position
keeps changing every time batteries are
mounted and dismounted.
PID
controller
test
Controllability
of the Quad-
rotor
This is carried by creating a mathematical model of the UAS and
simulating the dynamic behaviour with the use of matlab.
08/04/2015 Test where undertaken on matlab to
simulate the Quad-rotor characteristics.
The values are then applied to Pixhawk.
A test rig is built for the sole purpose of testing the UAS in order
to set its PID numbers before the initial flight.
16/04/2015 Tests have been undertaken using the test
rig. PID values have been narrowed down
and further testing must be carried out from
17/05/2015 - 29/05/2015.
The last method is an auto tune method where the UAS is flown
with a radio controller and the autopilot then auto-tunes the PID
parameters to its final values.
25/05/2015
Payload
deployment
test
Testing the
servo
Connect the pixhak to an oscilloscope and see if there is a signal
transmitted from pixhawk.
20/03/2015 The display on oscilloscope showed that
there was a signal outputted from pixhawk
but was not strong enough to operate the

298 | P a g e
298 Verification and validation MEng Team Project Report (7ENT1024) School of Engineering and Technology
servo. Hence we decided to use a BEC as
a signal amplifier.
After connecting the servo to the pixhawk, verify whether the
servo is receiving signal to retract the pin to release the payload
using the BEC as signal amplifier.
13/04/2015 The test was carried and the Mission
Planner was able to control the servo
through pixhawk. Further understanding is
needed on the timing setting of the
deployment. As once the Quad-rotor
reaches target the servo should
automatically deploy the payload.
Deploy the payload at the set destination or target (as the Quad-
rotor would not be built yet an initial test will be carried out as
when the Quad-rotor reached a destination or target it would emit
a signal for the servo to deploy the payload.
24/03/2015 Due to setbacks this was not achieved but
a date has been rescheduled for the
18/05/2015
Flight Test Checking the
operations of
the merged
systems
After integrating all the systems together into
the final product, test the response of the
pixhawk and motors when commanded is
sent by:
Remote
controller
01/04/2015 This test was carried out on the
17/04/2015. There was a good response
from the Quad-rotor but would requires a
bit more work to find the ideal PID values.
Ground control
station
01/04/2015 This test is yet to be carried out,
rescheduled for 19/05/2015.
Test the return home function after signal is lost, during period
more than 30sec.
03/06/2015
Testing maximum flight time with motors running at full speed. 17/04/2015 Rescheduled for 15/05/2015
Testing the
ground
Plan the journey of the Quad-rotor using the ground control
software, with a set coordinates.
01/06/2015
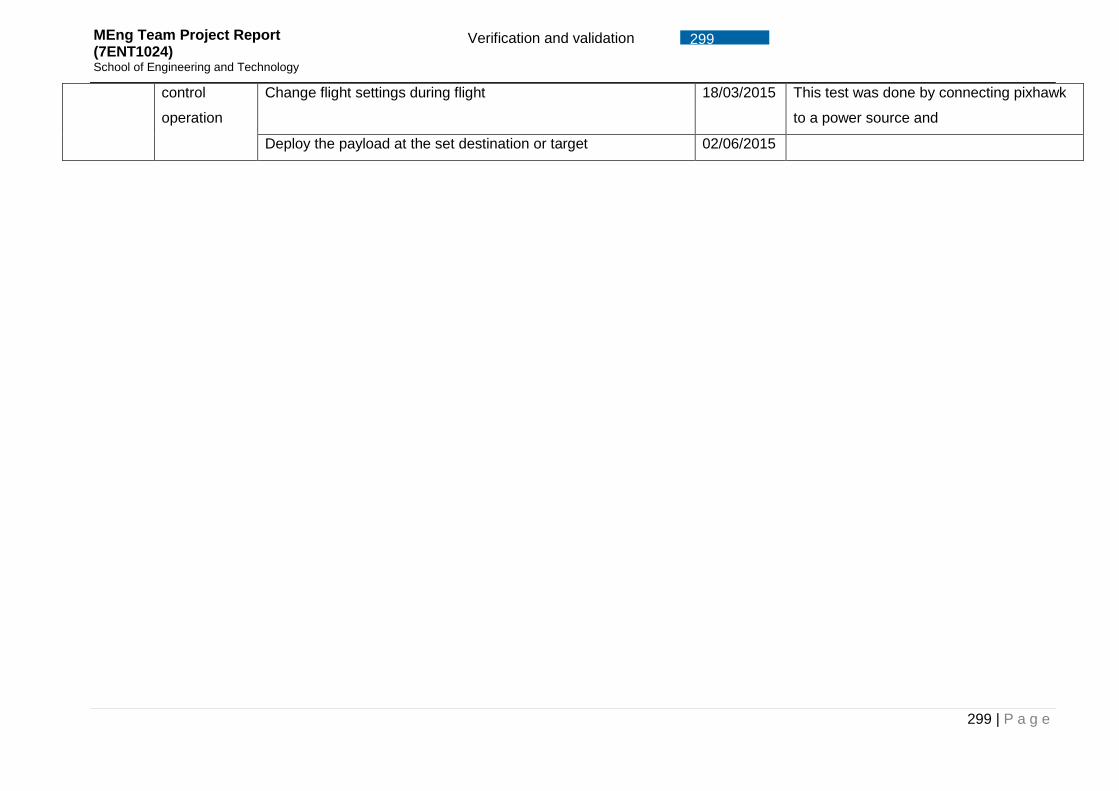
299 | P a g e
299 Verification and validation MEng Team Project Report (7ENT1024) School of Engineering and Technology
control
operation
Change flight settings during flight 18/03/2015 This test was done by connecting pixhawk
to a power source and
Deploy the payload at the set destination or target 02/06/2015

300 | P a g e
300 Verification and validation MEng Team Project Report (7ENT1024) School of Engineering and Technology
K.3. Schematics Transmitter and Receiver with Video Graphics Processing Unit (VGPU) the MinimOSD
Quad-rotor Propulsion setup
Pixhawk hardware connections

301 | P a g e
301 Verification and validation MEng Team Project Report (7ENT1024) School of Engineering and Technology

302 | P a g e
302 Telemetry kit Specification MEng Team Project Report (7ENT1024) School of Engineering and Technology
Section by Micky Malwenna
Appendix. M Telemetry kit Specification 1. [3DR Radio telemetry Kit – 433 Mhz (UK)
Price: £82.45 (inc VAT) £68.71 (exc VAT) Weight: 100 Grams
2. 3DR Radio modules V2
Price: £45.00 (inc VAT) £37.50 (exc VAT) Weight: 50 Grams
3. 5.8 GHz High Gain
Antenna (RP-SMA)
Price: £5.45 (inc VAT) £4.54 (exc VAT) Weight: 30 Grams Specs:

303 | P a g e
303 Telemetry kit Specification MEng Team Project Report (7ENT1024) School of Engineering and Technology
Frequency band: 5600-5900MHz,
Gain: 9dbi
Interface: RP- SMA
VSWR: <1.5
Input impedance: 50 ohms
Polarization: vertical
Maximum power: 15 W
Length: 275 mm
Range: 1.2 miles
4. DF13 6 positions connector 15 cm or 30cm
Price: £1.75 (inc VAT) £1.46 (exc VAT) Weight: 2 Grams RADIOS DESCRIPTION
SPECIFICATION Processing
100 mW maximum output power
(adjustable)
-117 dBm receive sensitivity
Based on HopeRF’s HM-TRP module
RP-SMA connector
2-way full-duplex communication
through adaptive TDM
UART interface
Transparent serial link
MAVLink protocol framing
Frequency Hopping Spread Spectrum
(FHSS)
Configurable duty cycle
Error correction corrects up to 25% of
bit error
Configuration through mission planner
and & APM planner
Features 2 Interchangeable air and ground
radio modules
433 mHz since it is in UK
Micro-USB port

304 | P a g e
304 Telemetry kit Specification MEng Team Project Report (7ENT1024) School of Engineering and Technology
6-position DF13 connector (for
Pixhawk)
Android OTG adapter cable (to
connect radio with your tablet)
Dimensions 26.7cm x 55.5 cm x 13.3 cm (without
antenna)
Power Supply voltage: 3.7-6 VDC (from USB
or DF13)
Transmit current: 100 mA at 20 dBm
Receive current: 25 mA
Serial interface: 3.3 V UART
5. E38 Bluetooth Telmetry Bridge 433mhz
Price: £114.5 (inc VAT) £95.42 (exc VAT) Weight: 100 Grams
6. DRONCELL –
GSM TELEMTRY
Price: £59 (inc VAT) £49.17 (exc VAT) Weight: 100 Grams The main advantage of this telemetry link is that it potentialy has much greater range, and can also be used to send/receive other information like images, or video from your drone

305 | P a g e
305 Telemetry kit Specification MEng Team Project Report (7ENT1024) School of Engineering and Technology
FEATURES/SPECS:
LED indication for both network status
and power
Small footprint (5cm x 4.5cm)
Breadboard compatible for easy
prototyping
4.5VDC-16VDC power supply input
3.3V or 5V UART Interface (voltage-
shifting is done on board)
High serial data rate (up to 115200
baud)
GPRS communication rate (86.5 kbps
downlink) - cellular to server
communication
CSD (up to 14.4 kbps) - cellular to
cellular communication
Software configurable baud rate
Works with any SIM card
Quad band cellular connectivity
Internal switch to detect SIM card
presence
Dial and receive phone calls
(however, no microphone or speaker
interface setup)
Send and receive text messages
Send and receive Multimedia
Messages
Send and receive data to any Internet
connected computer
Send and receive data over TCP or
UDP sockets
Super long range (anywhere there is
cell reception)
High altitude (at least 10,000 feet, up
to 30,000 depending on Cell tower)
Phonebook entries and storage
Software libraries for AVR
Real time clock, synced to cellular
tower time
User set alarms
POTENTIAL APPLICATIONS: UAVs and Balloons - live data reporting
- GPS, pressure, altitude, streaming
video
set waypoints, camera commands, etc.
Cars- remote start, car alarm
notification, GPS tracking
Security systems - cars, boards, sheds,
etc.
Home automation - thermostat control,
lighting
Robots - data transfer, remote
commands
Processors and computers- data
transfer, wireless ssh, telnet
Wireless Industrial Systems - reset
computers, activate pumps
Wireless Asset tracking - GPS track
your car, your spouse, your cat
TCP/UDP DATA TRANSFER METHODS:
iPod server/client socket app
HyperTerminal
Custom socket server/client - Perl,
Python,
Previous design before change

306 | P a g e
306 Telemetry kit Specification MEng Team Project Report (7ENT1024) School of Engineering and Technology
L.1. Payload box
Figure 183: Other CAD views

307 | P a g e
307 Servo calculation MEng Team Project Report (7ENT1024) School of Engineering and Technology
M.1. Servo calculation
Calculation for the selection of the servo
Figure 184: schematics for the force calculations
Ffrict-sliding = μfrict-slinding x Fnorm
W = Fnorm + Fhinge
Thus; 1 = Fnorm + Fhinge
Moment about the horn; 0 = 0.0525x1-Fhx0.105 Fh = 0.5N
Fn = 0.5N Ffrict-sliding = μ frict-sliding x Fnorm
Ffrict-sliding = 0.25 x 0.5 = 0.125N
Ffrict sliding =0.125
9.81= 0.013kg. f]

308 | P a g e
308 Manufacturing MEng Team Project Report (7ENT1024) School of Engineering and Technology
Section by Mozammel Malwenna
Appendix. N Manufacturing
Figure 185: Machined fixed bracket is CNC Router Pro 2600
Figure 186: Dry assemble of landing gear lug, pivot and the vertical landing strut
Figure 187: Slot bracket Figure 188: Turn button for servo motor
Figure 189: Support corners machined in CNC Figure 190: Triangle payload support glued with hinges

309 | P a g e
309 Manufacturing MEng Team Project Report (7ENT1024) School of Engineering and Technology
N.1. Machining by milling machine
Figure 191: Drilling centre hole in fixed bracket Figure 192: Milling arm Pivot
Figure 193: Chamfering of movable arm support Figure 194: Smoothing surface by fly cutter
Figure 195.1-2: Drilling using slot drills
N.2. Machining by XYZ 1330 Lathe
Figure 196: High speed steel tool

310 | P a g e
310 Manufacturing MEng Team Project Report (7ENT1024) School of Engineering and Technology
Figure 197.1-2: Machining arm pivot on lathe
N.3. Laser Cutting by Tortec Laser cutter
Figure 198.1-2 Laser Cutting of Nylon 6 sheet for main body plate
N.4. Cutting blocks by vertical bandsaws machine
Figure 199: Cutting Nylon 6.6 cast block in vertical band saw machine

311 | P a g e
311 Appendix. O Test Rig MEng Team Project Report (7ENT1024) School of Engineering and Technology
Appendix. O Test Rig

312 | P a g e
312 Appendix. O Test Rig MEng Team Project Report (7ENT1024) School of Engineering and Technology
O.1. Initial Gimbal Test Rig Conceptual Design
[PAGE INTENTIONALLY LEFT BLANK]

AD
BC AD
33
22
44
11
DESIGNED BYMohin
DATE
24/01/2015
CHECKED BY
XXX
DRAWN BYMohinuddin
This drawing is our property.It can't be reproducedor communicated withoutour written agreement.UNIVERSITY OF HERTFORDSHIRE
SCALE 1:1 WEIGHT(kg) XXX SHEET 1/1
SIZE
A4DRAWING NUMBER
ONEREV
X
DRAWING TITLE
Gimbal Frames' Assembly
Gimbal Test Rig
5
36.5
26
822
14
11
27
1314
2647.5
4
Note: All dimensions in mmunless mentioned otherwise
Top view
A
B
Detail AScale: 1:3
Detail BScale: 1:3
864.5
76.59
Side view
101.4 8
8 271.4
2nd Pin
78
8
Stand Pin

314 | P a g e
314 Appendix. O Test Rig MEng Team Project Report (7ENT1024) School of Engineering and Technology
O.2. Updated Octagonal Gimbal Test Rig Assembly
[PAGE INTENTIONALLY LEFT BLANK]

AD
BC AD
33
22
44
11
DESIGNED BYMohin
DATE
15/03/2015
CHECKED BY
XXX
DRAWN BYMohinuddin
This drawing is our property.It can't be reproducedor communicated withoutour written agreement.UNIVERSITY OF HERTFORDSHIRE
SCALE 1:1 WEIGHT(kg) XXX SHEET 1/1
SIZE
A4DRAWING NUMBER
ONEREV
X
DRAWING TITLE
Gimbal Frames' Assembly
Gimbal Test Rig
5
36.5
26
822
14
11
27
1314
2647.5
4Note: All dimensions in mmunless mentioned otherwise
121.4 8
2nd Pin8106.4
Mid/Outter Pin
878
Stand Pin
Front View
698.3
41.1
Top View
A
B
Detail AScale: 1:3
Detail BScale: 1:3

316 | P a g e
316 Appendix. O Test Rig MEng Team Project Report (7ENT1024) School of Engineering and Technology
O.3. Octagonal Model Mount Frame Technical Drawing
[PAGE INTENTIONALLY LEFT BLANK]

Note: All dimensions in mmunless stated otherwise.Deburand polish all sharp edges.
AD
BC AD
33
22
44
11
DESIGNED BYMohin
DATE
15/03/2015
CHECKED BY
XXX
DRAWN BYMohinuddin
This drawing is our property.It can't be reproducedor communicated withoutour written agreement.UNIVERSITY OF HERTFORDSHIRE
SCALE 1:1 WEIGHT(kg)2.51
SIZE
A4DRAWING NUMBER
ONEREV
X
DRAWING TITLE
Model Mount Frame Drawing
Gimbal Test Rig
Exact AL Box SectionReq. 5482.4mm
435.3
414.2
1000
127
436.5
Front View
Exploded View
A
B
Detail AScale: 1:4
Detail BScale: 1:4
130
135
1542
20
4TYP
47
Front View
Front View
60
60
4 TYP
10 TYP
25.4
47.3
10
25
34.6
5R

318 | P a g e
318 Appendix. O Test Rig MEng Team Project Report (7ENT1024) School of Engineering and Technology
O.4. Octagonal Mid Frame Technical Drawing
[PAGE INTENTIONALLY LEFT BLANK]

Note: All dimensions in mm unlessstated otherwise.Debur and polishsharp edges.
AD
BC AD
33
22
44
11
DESIGNED BYMohin
DATE
15/03/2015
CHECKED BY
XXX
DRAWN BYMohinuddin
This drawing is our property.It can't be reproducedor communicated withoutour written agreement.UNIVERSITY OF HERTFORDSHIRE
SCALE 1:1 WEIGHT(kg)1.8 Exact AL Box SectionReq. 3946.4mm
SIZE
A4DRAWING NUMBER
ONEREV
X
DRAWING TITLE
Mid Frame Drawing
Gimbal Test Rig
493.2
8246.62
25.4
Mid Frame BoxTop View
493.2
3030
4.9
67.5
Mid Frame BoxSide View
TYP TYP
1139
493.2
472.2 25
.4
Front View Isometric viewScale: 1:14A
Detail AScale: 1:3
130
135
1542
20
4TYP
47
Front view

320 | P a g e
320 Appendix. O Test Rig MEng Team Project Report (7ENT1024) School of Engineering and Technology
O.5. Octagonal Outer Frame Technical Drawing
[PAGE INTENTIONALLY LEFT BLANK]

Note: All dimensions in mm unlessstated otherwise.Debur and polishall sharp edges.
AD
BC AD
33
22
44
11
DESIGNED BYMohin
DATE
15/03/2015
CHECKED BY
XXX
DRAWN BYMohinuddin
This drawing is our property.It can't be reproducedor communicated withoutour written agreement.UNIVERSITY OF HERTFORDSHIRE
SCALE 1:1 WEIGHT(kg)1.96
SIZE
A4DRAWING NUMBER
ONEREV
X
DRAWING TITLE
Outer Frame Drawing
Gimbal Test Rig
Exact AL Box SectionReq. 4310.4mm
538.8
30304.9
67.5
Outter Frame BoxSide View
TYP
TYP
8
538.8
269.4
Outter Frame BoxTop View
538.8
517.8
1249
Front View Exploded ViewA
Detail AScale: 1:4
130
135
1542
20
4TYP
47
Front View

322 | P a g e
322 Appendix. O Test Rig MEng Team Project Report (7ENT1024) School of Engineering and Technology
O.6. Octagonal Gimbal Test Rig Stand Technical Drawing
[PAGE INTENTIONALLY LEFT BLANK]

Note: All dimensions in mm unless stated otherwise.Deburand polish all sharp edges. All holes on the bars arepositioned at the center of each part.
AH BG
DE CF BG AH
33
22
44
11
DESIGNED BYMohin
DATE
15/03/2015
DRAWN BYMohinuddin
This drawing is our property.It can't be reproducedor communicated withoutour written agreement.UNIVERSITY OF HERTFORDSHIRE
WEIGHT(kg) 2.7
SIZE
A3
DRAWING NUMBER
Stand Assembly andParts' Drawing REV
X
Gimbal Test Rig
Exact AL Box Section Req.6019.2mm
960
30
30
4.9
45
67.5
Slant Stand BoxSide ViewTYP
960
20
40
Slant Stand BoxTop View
215
30
308
107.5
67.5
Stand Top BoxSide View
Slant Base BracketIsometric View
5R40
20
25.4
Slant Base BracketTop View
1.2
135
80
80
Slant Base BracketSide View
L BracketIsometric View
40
10
5R
L BracketTop View
1.290
60
60
L BracketSide View
Stand Long Leg BoxIsometric View
40
87.3
300
25.4
Stand Long Leg BoxSide View
Stand Short Leg BoxIsometric View
137.3
25.44 0
10
Stand Short Leg BoxSide View
40
31.1
137.3
Stand Short Leg BoxTop View
Stand Isometric View Front View
130
135
1542
20
4TYP
47

324 | P a g e
324 Appendix. O Test Rig MEng Team Project Report (7ENT1024) School of Engineering and Technology
O.7. Gimbal Test Rig Weight / Cost Estimation
[PAGE INTENTIONALLY LEFT BLANK]

Model Mount Frame
COMPONENTS Material Item Exact Length (mm) Qty Cost (£) Ex VAT
Box Auminium Square Tube (1.626mm thickness/ 16swg) 5482.4
(5m lengths) 1 NB: Extra 482.4mm taken from mid
frame left over 16.32
Brackets Auminium Sheet (1.2mm) (80mmx80mm) x 48 (1mx1m) 1 21.1
Pins Stainless Steel Round bar 611.6 (8mm Dia 303) 1m x 1 7.33
Mid Frame
Material Item Exact Length (mm) Qty Cost (£) Ex VAT
Auminium Square Tube 3946 (5m lengths) 1 16.32
Outter Frame
Material Item Exact Length (mm) Qty Cost (£) Ex VAT
Auminium Square Tube 4310.4 (5m lengths) 1 16.32
Stand
Material Item Exact Length (mm) Qty Cost (£) Ex VAT
Auminium Square Tube 6019.2 (5m lengths) 1 16.32
Extra Material Auminium Square Tube (5m lengths) 1 16.32
TOTAL REQUIRED LENGTH (mm) 19758
TOTAL NO. OF REQUIRED 5m LENGTH BOXES 3.9516 4 5
Total Cost (£) Ex VAT 110.03
Purchase Cost (£) Inc VAT 132.08
Per person 11.00666667 £11.50
http://www.metals4u.co.uk/stainless-
steel/round/8-mm-diameter-
303/detail.asp?prd_id=1686
http://www.ascmetals.com/downloads/wholebrochure.pdf
http://www.rapidtables.com/calc/wire/swg-to-mm.htm

326 | P a g e
326 Appendix. O Test Rig MEng Team Project Report (7ENT1024) School of Engineering and Technology
O.8. Gimbal Test Rig Manufacturing Cost
O.9. Qualification test plan
On completion of all manufacturing activities and processes, all aerospace qualification hardware shall be tested according to and following the order of the qualification test plan found in Table 1. (Ditom, 2014)
Test Description
Initial Electrical Performance Test
Storage Temperature Cycling
Electrical Performance Test
Thermal Shock
Electrical Performance Test
Sine Vibration
Electrical Performance Test
Random Vibration
Electrical Performance Test
Operational Temperature Cycling
Final Electrical Performance Test
Table 1 Qualification Test Plan
Electrical Performance Tests (Initial, In-Process, Final) To verify electrical performance of the isolator/circulator, electrical performance measurements shall be performed. Measured data displaying insertion loss, Voltage Standing Wave Ratio (VSWR) (every port), and isolation (isolator only) performance over the full operating bandwidth shall be captured for each test. During the initial and final electrical performance tests, RF leakage performance shall also be measured at the center frequency of operation. However all electrical performance tests shall be captured on a calibrated Vector Network Analyser (VNA) given sufficient time to warm up and kept in ambient
conditions (18-26℃) for the entire duration of the test.
Storage Temperature Cycling Non-operational temperature cycling shall be performed to ensure the hardware meets all electrical performance specifications after being exposed to the storage temperature range. The hardware shall be exposed to each temperature extreme for a minimum of 1 hour. The
rate of change between each temperature extreme shall not exceed 20℃/minute. The hardware shall be kept at ambient conditions for no less than 1h after the test is complete prior to electrical performance measurements.
Thermal Shock Thermal shock testing shall be performed to ensure the hardware can survive rapid changes in ambient temperature without any degradation to its coatings, surfaces or electrical performance.

327 | P a g e
327 Appendix. O Test Rig MEng Team Project Report (7ENT1024) School of Engineering and Technology
Random/Sine Vibration Random vibration testing shall be performed to ensure the hardware can survive the vibrations associated with the launch and ascent of the Quad-rotor without any degradation to its coatings, surfaces, or electrical performance.
Operational Temperature Cycling Operational temperature cycling shall be performed to ensure the hardware meets all electrical performance specifications while being exposed to the operational temperature range. All the above mentioned qualification tests have to be performed at regular intervals to ensure worthy performance of the Quad-rotor. The results obtained shall also be verified and validated to meet certain conformances. The results from various tests should also be recorded and checked.
O.10. Initial Involvement in the MEng Team Project I was allocated to a few tasks in the very early stages of this project, the details are as follows:
Write up of the rules and conditions derived from the UAS challenge 2015 handbook
Compiling product design specification document
Research on testing strategies and experiments
Refining design of the gimbal test rig for more than 5 times
The CAD model shown below was the very first concept of the gimbal test rig presented at the PDR. Conversely design iterations had led to changes in to a more robust design discussed in the previous chapters.
The figure on the top right shows an angled bracket that was planned to be used in the updated octagonal gimbal test rig. However lack of facilities present at the university’s fabrication workshop, they had to be subcontracted. But to save finances and quicken the manufacturing stage of the test rig, a tri angular bracket as shown below on the bottom right figure was designed to replace the angled bracket from above. The use of these brackets had tremendously helped in speeding up the fabricating process of the final design as shown on the bottom left figure.

328 | P a g e
328 Appendix. O Test Rig MEng Team Project Report (7ENT1024) School of Engineering and Technology
O.11. Tri Angular Bracket Technical Drawing
[PAGE INTENTIONALLY LEFT BLANK]

Note: All dimensions in mm unlessstated otherwise.Debur and polishsharp edges.
AD
BC AD
33
22
44
11
DESIGNED BYMohin
DATE
31/03/2015
CHECKED BY
XXX
DRAWN BYMohinuddin
This drawing is our property.It can't be reproducedor communicated withoutour written agreement.UNIVERSITY OF HERTFORDSHIRE
SCALE 1:1 WEIGHT(kg) 0.043 SHEET 1/1
SIZE
A4DRAWING NUMBER
ONEREV
X
DRAWING TITLE
Joint Bracket
Gimbal Test Rig
130
135
15
42
20
4TYP
47
12
24
Front viewScale: 1:1
MATERIAL - MACHINE FROM:ALUMINIUM ALLOY (AL-2024-T3)1.2MM WORK HARDENED AL SHEETSUPPLIER: METALS4UQUATITY REQUIRED: 56
Isometric viewScale: 1:1

330 | P a g e
330 Appendix. O Test Rig MEng Team Project Report (7ENT1024) School of Engineering and Technology
O.12. T-Bracket Technical Drawing
[PAGE INTENTIONALLY LEFT BLANK]

Note: All dimensions in mm unlessstated otherwise.Debur and polishsharp edges.
MATERIAL - MACHINE FROM:ALUMINIUM ALLOY (AL-2024-T3)1.2MM WORK HARDENED AL SHEETSUPPLIER: METALS4UQUATITY REQUIRED: 8
AD
BC AD
33
22
44
11
DESIGNED BYMohin
DATE
31/03/2015
CHECKED BY
XXX
DRAWN BYMohinuddin
This drawing is our property.It can't be reproducedor communicated withoutour written agreement.UNIVERSITY OF HERTFORDSHIRE
SCALE 1:1 WEIGHT(kg) 0.023 SHEET 1/1
SIZE
A4DRAWING NUMBER
ONEREV
X
DRAWING TITLE
T BRACKET
Gimbal Test Rig
60
60
10
25
47.3
4 TYP
10 TYP
5R
34.6
2 5.4
Front viewScale: 1:1
Isometric viewScale: 1:1

332 | P a g e
332 Design features for business case MEng Team Project Report (7ENT1024) School of Engineering and Technology
Section by Osman sibanda
Appendix. O Design features for business case
Figure 200 -OXV in storage configuration
Figure 201 - Electro-optic camera on the OXV
Figure 202- Main body of the OXV

333 | P a g e
333 MEng Team Project Report (7ENT1024) School of Engineering and Technology
N.1. Risk Assessment for business case The table below quantifies the risks by the probability of the risk occurring and the impact it would have on the business. The table below it numbers these quantities by using the probability x impact ratings. The ratings are explained below.
Impact
Probability
1 2 3 4 5
1 1 2 3 4 5
2 2 4 6 8 10
3 3 6 9 12 15
4 4 8 12 16 20
5 5 10 15 20 25
Where; Impact rating 1 – There is little or no impact at all 2 - Nominal risk 3 - Significant effect on project 4 - Significant impact on outcome 5 – Project may fail and affects organisation function Probability rating 1 0-10% 2 11-40% 3 41-60% 4 61-90% 5 91-100%
#
Impact
Probability
Trivial Minor Moderate Major Extreme
Rare Low Low Low Medium Medium
Unlikely Low Low Medium Medium Medium
Moderate Low Medium Medium Medium High
Likely Medium Medium Medium High High
Very likely Medium Medium High High High

334 | P a g e
334 MEng Team Project Report (7ENT1024) School of Engineering and Technology
Potential Failure Mode/Risk
Effect on business
Possible Cause
Impact rating
Likelihood of occurrence
Risk Rating
Remedial Action(s)
Manufacturing
Incorrect assembly of UAS components
Product will not be launch
Lack of executing incorrect procedure
4 2 8
Use a checklist to be used prior every flight, use setup guides and manuals provided by equipment manufacturers.
Suppliers delaying the delivery of components/ material
Delay in manufacturing
Delays in shipping
3 3 9
Plan ahead and include a contingency in time plan
Systems compatibility issues
Product will not operate
Lack of validation
2 4 8
Research on compatibility and use same suppliers
Testing
Legislation changes
Affect and delay project delivery
CAA review 5 1 5
-dedicate a team to follow up and anticipate changes -Get involved with the governing bodies in order to influence changes
Exceeding allowable noise pollution
Product not allowed to be flown
Specifications not well defined
3 2 6
-specifications should be well defined -proper testing should be carried out
Insufficient time for testing
Delay in launch and poor quality
Poor project management
2 4 8
Stage testing earlier and include a contingency in time plan
Stability and control algorithms fail
Product will not meet design specification
Inaccurate stability analysis
5 3 15
Use Matlab to validate obtained PID values through
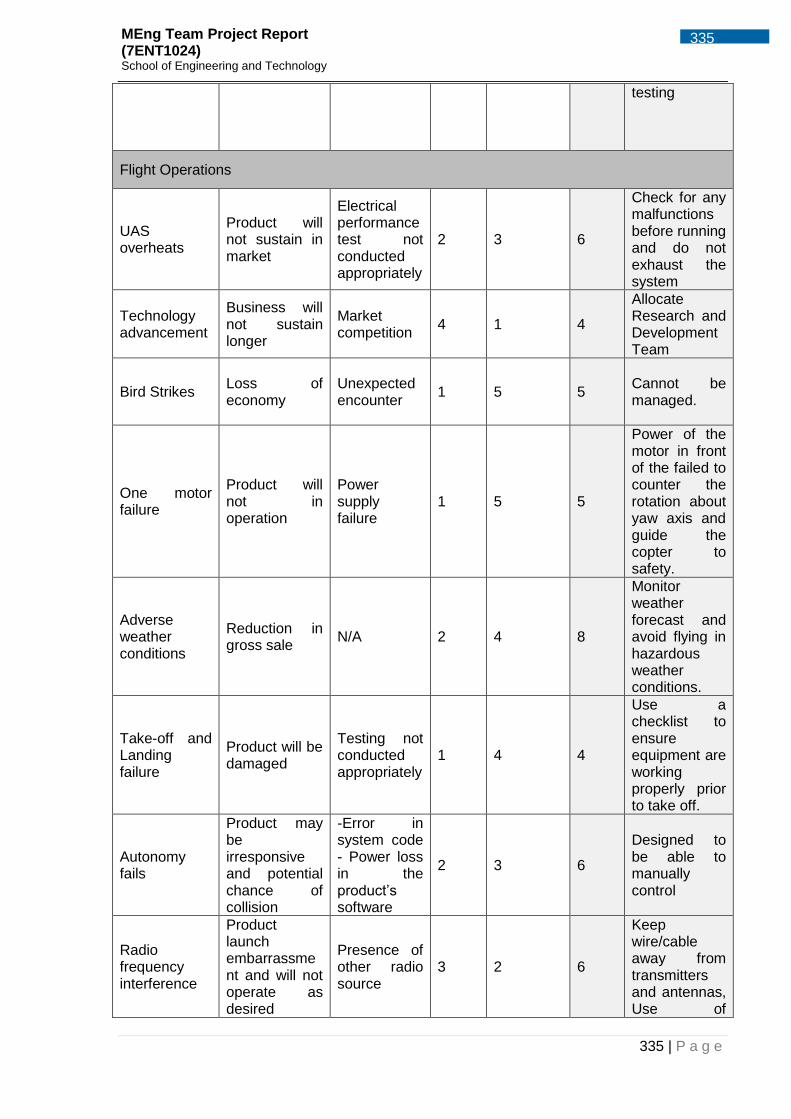
335 | P a g e
335 MEng Team Project Report (7ENT1024) School of Engineering and Technology
testing
Flight Operations
UAS overheats
Product will not sustain in market
Electrical performance test not conducted appropriately
2 3 6
Check for any malfunctions before running and do not exhaust the system
Technology advancement
Business will not sustain longer
Market competition
4 1 4
Allocate Research and Development Team
Bird Strikes Loss of economy
Unexpected encounter
1 5 5 Cannot be managed.
One motor failure
Product will not in operation
Power supply failure
1 5 5
Power of the motor in front of the failed to counter the rotation about yaw axis and guide the copter to safety.
Adverse weather conditions
Reduction in gross sale
N/A 2 4 8
Monitor weather forecast and avoid flying in hazardous weather conditions.
Take-off and Landing failure
Product will be damaged
Testing not conducted appropriately
1 4 4
Use a checklist to ensure equipment are working properly prior to take off.
Autonomy fails
Product may be irresponsive and potential chance of collision
-Error in system code - Power loss in the product’s software
2 3 6
Designed to be able to manually control
Radio frequency interference
Product launch embarrassment and will not operate as desired
Presence of other radio source
3 2 6
Keep wire/cable away from transmitters and antennas, Use of

336 | P a g e
336 MEng Team Project Report (7ENT1024) School of Engineering and Technology
shielding for your wiring runs, Keep antennas as far apart as possible, Monitor RC Channel interference in between flights.
Propeller Injuries
Bad reputation Poor quality control
1 5 5
Operate away from congested areas, 50m away from all personals and structures.
Battery detachment
Loss of economy
Business specification was not met
2 4 8 Use a Velcro Strap to hold the batteries.
Battery combustion
Reduction in gross sales due to safety issues
Inappropriate procedure followed during wiring
1 5 5
Monitor their temperature and regulate their charging and discharging.
Hackers
Committed crimes, possible accidents
Intentional suspect/ Pre-planned by criminal
5 2 10
Automatic return home override in case of any control interruptions
UAS theft hacking the system or vandalism
Hacking purposes, selling product parts and criminal activity
1 2 2
- The vehicle must have CCTVs mounted in and around outside -Allow immediate control of vehicle by CT staff -alert CT staff of anything suspicious or out of ordinary
Mechanical Failure
Some system might not function or vehicle may not start
Old parts in the vehicle or not maintained properly
3 1 3
-certify regular maintenance for all vehicle parts and system -adequate

337 | P a g e
337 MEng Team Project Report (7ENT1024) School of Engineering and Technology
and professional training provided to maintenance crew
System Failure
product may be irresponsive and potential chance of collision
-Error in system code - Power loss in the product computer
5 1 5
- Substantial product system testing. - Emergency Stop button must be present in the product. - Remotely monitor product - Failsafe system embedded in the product
Staff Changes
Project delay
Retirement, illnesses, demotion, strategic focus
2 3 6
identify skill shortages and act accordingly -sub-contract suitable skilled workers from different organisation
Public damaging the UAS
Loss of business
Poor public awareness for product operation
5 2 10
Regular product usage presentation and advertisements
Disposal
Decomposition of materials
High manufacturing cost
Wrong choice of materials
3 2 6
-thorough analysis before material selection
Carbon foot print
High operational costs
Business expansion
3 2 6
-strategic business plan for product distribution.