Memphis Alcorn TippahTippah Tishomingo LeeLee §¨¦mdot.ms.gov/documents/planning/freight/files/MS...
16
p p ¥ o ¢ ¥ o ¢ ¥ o ¢ ¥ o ¢ ¥ o ¢ ¥ o ¢ ¥ o ¢ ¥ o ¢ ¥ o ¢ ¥ o ¢ ¥ o ¢ ¥ o ¢ ¥ o ¢ ¥ o ¢ ¥ o ¢ ¥ o ¢ § ¨ ¦ 55 £ ¤ 78 £ ¤ 45 £ ¤ 72 £ ¤ 61 £ ¤ 45 £ ¤ 61 £ ¤ 61 £ ¤ 82 £ ¤ 82 £ ¤ 45 U V 25 U V 25 £ ¤ 49 £ ¤ 98 £ ¤ 45 § ¨ ¦ 20 £ ¤ 49 U V 27 £ ¤ 98 £ ¤ 61 § ¨ ¦ 69 § ¨ ¦ 22 § ¨ ¦ 55 § ¨ ¦ 59 § ¨ ¦ 10 § ¨ ¦ 220 § ¨ ¦ 110 Jackson Memphis Hattiesburg U S 7 8 ( I -2 2 )/ BNS F I - 5 5 / C N I - 5 5 / C N US 72/N S U S 82 U S 6 1 MS 2 5 U S 4 5 / K C S I-20 /KCS US 49/KCS I-5 9 / N S MS 27 US 9 8/ CN I - 5 5 / C N I - 10 /CSX T M&M MI S S I SS I PPI RI V E R T E N N - T O M WA T E R WA Y Hinds Hinds Yazoo Yazoo Amite Amite Lee Lee Bolivar Bolivar Attala Attala Jones Jones Wayne Wayne Perry Perry Scott Scott Rankin Rankin Copiah Copiah Smith Smith Clarke Clarke Holmes Holmes Monroe Monroe Panola Panola Jasper Jasper Kemper Kemper Leake Leake Greene Greene Tate Tate Pike Pike Clay Clay Warren Warren Madison Madison Jackson Jackson Carroll Carroll Leflore Leflore Marshall Marshall Lamar Lamar Noxubee Noxubee Marion Marion Stone Stone Lincoln Lincoln Newton Newton Winston Winston Union Union Calhoun Calhoun Lafayette Lafayette Pearl River Pearl River Adams Adams Simpson Simpson Wilkinson Wilkinson Tunica Tunica Sunflower Sunflower DeSoto DeSoto Harrison Harrison Tippah Tippah Franklin Franklin Neshoba Neshoba Washington Washington Coahoma Coahoma Forrest Forrest George George Alcorn Alcorn Lauderdale Lauderdale Benton Benton Lowndes Lowndes Hancock Hancock Itawamba Itawamba Pontotoc Pontotoc Jefferson Jefferson Sharkey Sharkey Grenada Grenada Tallahatchie Tallahatchie Webster Webster Walthall Walthall Prentiss Prentiss Claiborne Claiborne Choctaw Choctaw Yalobusha Yalobusha Chickasaw Chickasaw Lawrence Lawrence Oktibbeha Oktibbeha Covington Covington Humphreys Humphreys Quitman Quitman Issaquena Issaquena Tishomingo Tishomingo Montgomery Montgomery Jefferson Davis Jefferson Davis Tier I Highway Tier I Railway Tier I Water Tier II Highway Tier II Railway Tier II Water Other Interstates US Highway p Airport ¥ o ¢ Port W Source: ESRI, MDOT. FIGURE C.1 MISSISSIPPI FREIGHT NETWORK CORRIDORS MISSISSIPPI STATEWIDE FREIGHT PLAN LEGEND US 49/CN
-
Upload
truongkien -
Category
Documents
-
view
216 -
download
0
Transcript of Memphis Alcorn TippahTippah Tishomingo LeeLee §¨¦mdot.ms.gov/documents/planning/freight/files/MS...

p
p
¥o¢
¥o¢
¥o¢
¥o¢
¥o¢
¥o¢
¥o¢
¥o¢
¥o¢
¥o¢
¥o¢
¥o¢
¥o¢
¥o¢
¥o¢¥o¢
§̈¦55
£¤78
£¤45
£¤72
£¤61
£¤45£¤61
£¤61
£¤82 £¤82
£¤45
UV25
UV25
£¤49
£¤98
£¤45
§̈¦20
£¤49UV27
£¤98£¤61
§̈¦69
§̈¦22
§̈¦55
§̈¦59
§̈¦10
§̈¦220
§̈¦110
Jackson
Memphis
Hattiesburg
US 78 (I-22)/BNSF
I-5
5/C
N
I-5
5/C
N
US 72/NS
US 82
US
61
MS 2
5 US
45
/KC
S
I-20/KCS
US
49/KC
S
I-59/
NS
MS 27
US 98/CN
I-5
5/C
N
I-10/CSXT M&M
MIS
SIS
SIP
PI R
IVE
R
TE
NN
-TO
M W
AT
ER
WA
Y
H i n d sH i n d s
Ya z o oYa z o o
A m i t eA m i t e
L e eL e e
B o l i v a rB o l i v a r
A t t a l aA t t a l a
J o n e sJ o n e s W a y n eW a y n e
P e r r yP e r r y
S c o t tS c o t t
R a n k i nR a n k i n
C o p i a hC o p i a h
S m i t hS m i t h C l a r k eC l a r k e
H o l m e sH o l m e s
M o n r o eM o n r o e
P a n o l aP a n o l a
J a s p e rJ a s p e r
K e m p e rK e m p e rL e a k eL e a k e
G r e e n eG r e e n e
Ta t eTa t e
P i k eP i k e
C l a yC l a y
W a r r e nW a r r e n
M a d i s o nM a d i s o n
J a c k s o nJ a c k s o n
C a r r o l lC a r r o l l
L e f l o r eL e f l o r e
M a r s h a l lM a r s h a l l
L a m a rL a m a r
N o x u b e eN o x u b e e
M a r i o nM a r i o n
S t o n eS t o n e
L i n c o l nL i n c o l n
N e w t o nN e w t o n
W i n s t o nW i n s t o n
U n i o nU n i o n
C a l h o u nC a l h o u n
L a f a y e t t eL a f a y e t t e
P e a r l R i v e rP e a r l R i v e r
A d a m sA d a m s
S i m p s o nS i m p s o n
W i l k i n s o nW i l k i n s o n
T u n i c aT u n i c a
S u n f l o w e rS u n f l o w e r
D e S o t oD e S o t o
H a r r i s o nH a r r i s o n
T i p p a hT i p p a h
F r a n k l i nF r a n k l i n
N e s h o b aN e s h o b a
W a s h i n g t o nW a s h i n g t o n
C o a h o m aC o a h o m a
F o r r e s tF o r r e s t
G e o r g eG e o r g e
A l c o r nA l c o r n
L a u d e r d a l eL a u d e r d a l e
B e n t o nB e n t o n
L o w n d e sL o w n d e s
H a n c o c kH a n c o c k
I t a w a m b aI t a w a m b a
P o n t o t o cP o n t o t o c
J e f f e r s o nJ e f f e r s o n
S h a r k e yS h a r k e y
G r e n a d aG r e n a d a
Ta l l a h a t c h i eTa l l a h a t c h i e
W e b s t e rW e b s t e r
W a l t h a l lW a l t h a l l
P r e n t i s sP r e n t i s s
C l a i b o r n eC l a i b o r n e
C h o c t a wC h o c t a w
Ya l o b u s h aYa l o b u s h a
C h i c k a s a wC h i c k a s a w
L a w r e n c eL a w r e n c e
O k t i b b e h aO k t i b b e h a
C o v i n g t o nC o v i n g t o n
H u m p h r e y sH u m p h r e y s
Q u i t m a nQ u i t m a n
I s s a q u e n aI s s a q u e n a
T i s h o m i n g oT i s h o m i n g o
M o n t g o m e r yM o n t g o m e r y
J e f f e r s o n D a v i sJ e f f e r s o n D a v i s
Tier I Highway
Tier I Railway
Tier I Water
Tier II Highway
Tier II Railway
Tier II Water
Other Interstates
US Highway
p Airport
¥o¢ Port
WSource: ESRI, MDOT. FIGURE C.1
MISSISSIPPIFREIGHT NETWORK
CORRIDORS
MISSISSIPPI STATEWIDEFREIGHT PLAN
LE
GE
ND
US 49/CN

Highway Rail Ports & Waterways Commercial AirportsI‐10 from Louisiana border to Alabama border (78 miles) CSXT M&M Subdivision mainline from
Louisiana border to Alabama border that
parallels the Gulf Coast (74 miles)
Port of Gulfport, Port of Pascagoula, Port of
Bienville
Gulfport‐Biloxi International
Airport
I‐110 from I‐10 to Biloxi CSXT connection to Chevron Pascagoula
Refinery and Mississippi Phosphates
To Port of Gulfport from I‐10 via US 90:
south on port access road (NHS Intermodal
Connector)
US 49 connecting I‐10 to US 90 at Port of Gulfport. (US 49 is
also a Tier I corridor, projects captured in US 49 corridor
profile)
KCS Hattiesburg to Gulfport mainline's
branch to DuPont and Bayou Concrete Plant
To Port of Gulfport from I‐10 via US 90:
West Pier Gate to 27th Avenue (NHS
Intermodal Connector)
MS 63 connecting I‐10 to Chevron Pascagoula Refinery and
Mississippi Phosphates
Mississippi Export Railroad (MSE) ‐
connecting CN and east‐west CSXT M&M
subdivision
To Port of Pascagoula (east) via I‐90: south
on MS 611 (NHS Intermodal Connector)
MS 57 between I‐10 and US 90 / Mallette Brothers
Construction Co
To Port of Pascagoula (west) via US 90:
south on MS 617 to MS 619, east on River
Edge Rd (NHS Intermodal Connector)
MS 609/Tucker Road between I‐10 and Daisy Vestry Road to
Allied Waste Svc
Kiln Delisle Road (Pass Christian) between I‐10 and DuPont
PlantWIM
PrePass
Gulf Region Incident Management System:
‐ CCTV cameras
‐ Dynamic Message Signs
Highway Rail Ports & Waterways Commercial Airports2011 60.9 / $117.3 16.4 / $27.6 23.0 / $14.3 < 1 / < $0.1
2040 91.7 / $243.5 24.1 / $50.7 25.2 / $13.4 < 1 / < $0.1
2011
2040
2011
2040
2011 61% 16% 23% < 1%
2040 65% 17% 18% < 1%
Average % Truck Mix /
Average Total Daily Volume2011 14% / 47,400
ATRI (1) None
FAC / Freight
User Survey (2)
I‐10: Pascagoula River bridge (from Exit 61 to 68) None identified None identified None identified
Tonnage
Value
Tonnage (3)
Highway Rail Ports & Waterways Commercial Airports
2011
15 miles (19%) congested:
‐ Exit 24 (Firetower Rd) to Exit 28 (County Farm Rd)
‐ Exit 50 (Washington Ave) to Exit 68 (MS 613)
2040
72 miles (93%) congested:
‐ Exit 2 (LA Stateline) to Exit 28 (County Farm Rd)
‐ Exit 31 (Canal Rd) to Exit 45 (I 110)
‐ Exit 50 (Washington Ave) to Exit 75 (AL Stateline)Crash rate: 75
8 miles (10%) across the corridor with high crash segments.
35 crossings of 72 (49%) do not have Active
2 warning devices.
IRI rating (8)
IRI score: 95%
4 miles (5%) of I‐10 unacceptable.
High IRI > 95 segments:
‐ From Louisiana Stateline to Shuttle Pkwy/Exit 1
‐ From US 49/Exit 34 to Shriners Blvd/Exit 41
‐ Entire I‐110 connector unacceptable
Vertical
clearance
1 of 9 bridges (11%) deficient
Weight‐
restricted
bridges
0 of 66 (0%) restricted
Highway Rail Ports & Waterways Commercial AirportsLevel of Service: Today I‐10 provides acceptable LOS outside
of a few short congested segments (most notably I‐10/US 49
interchange), but is forecast to experience growing
congestion and delay along the entire corridor by 2040.
Portions of I‐10 have been widened but more capacity
expansion is needed to accommodate freight and passenger
travel demand. Additional capacity improvements are
needed on I‐110 given its high congestion levels.
Safety: I‐10 overall is a safe highway corridor.
Operations: ITS deployments contribute to relatively smooth
corridor operations today.
Physical Condition: Only a few I‐10 miles are unacceptable
with capacity rather than condition posing more challenges.
Low vertical clearance might impact interstate freight flows
at one bridge location.
Primary Access Routes: I‐110 pavement condition is
unacceptable.
Capacity: The CSXT mainline and key
connectors within the corridor can all
handle 286k weight limit.
Safety: Half of the railroad crossings on the
CSXT mainline do not have Active 2 warning
devices.
Physical Condition: CSXT mainline track
meets freight rail speed standards.
For MS Gulf Coast ports to remain
competitive, need for new or improved last‐
mile access roads to ports, with particular
focus on physical and operating conditions
at the 6 existing and 1 proposed NHS
Intermodal Connectors.
Last‐mile roadway access
improvements can improve
freight flows in and out of
Gulfport‐Biloxi International
Airport.
V/C need to be maintained
below 100% to avoid capacity
shortfall ‐ currently GPT
comfortably meets the criteria.
I‐10: add 2 lanes each direction for entire length (MDOT
STIP/Preliminary Priority List).
I‐10/I‐110 and I‐10/US 49 interchanges: capacity and
interchange improvements.
I‐110: pavement reconstruction.
I‐110: construct new interchanges at Stewart Rd, Old Fort
Bayou Rd, and Stone crest Rd (Gulf Coast MTP).
Construct East Harrison County connector (from US 90 to I‐
10) to enhance freight access (MDOT Preliminary Priority
List).
Raise I‐10 bridges (1) to provide 16’ clearance.
Finalize deployment of the Gulf Region Incident Management
System ITS improvements along the Gulf Coast.
Improve operating speeds, reliability, and
safety along the CSXT mainline: upgrade
warning devices with signals and gates in
Biloxi: crossings at Iroquois, Seal, Magnolia,
and Nixon; and Long Beach: crossing at N.
Lang Ave. (MS State Rail Plan).
Upgrade all public corridor crossings along
the CSXT mainline with Active 2 warning
devices.
Construct new road access to Port of
Gulfport : from I‐10 via MS 601/Canal Rd ‐
to Port of Gulfport (MULTIPLAN 2035).
Consider and prioritize improvements to the
identified corridor NHS connectors in
highway project programming due to their
role in providing roadway access to ports.
Replace CSXT bridge over Pearl
River ‐ access to Port of Bienville (MS State
Rail Plan).
None identified
Corridor Infrastructure Performance
Capacity:
Highways: Level of Service (4)
Rail: % supporting 286k weight limits
Ports: channel depth
Commercial airports: storage volume to
capacity (5)
* Excludes through freight
Safety:
Highways: Annual Crash Rate (174/100M vmt) (6)
Rail: RR crossings w/o active warning devices (7)
Corridor Needs Assessment and Infrastructure Need
Infrastructure Condition:
Highways: Pavement & Structures
Rail: Speed/Track (9)
100% of CSX M&M Subdivision supports
286k
Authorized channel depth vs actual depth 64% in 2008 (MSGM&TS)
100% of track meets freight rail speed
standards
(1) FHWA/ATRI Nationwide Bottleneck Analysis (6) Crash rate greater than 80% of state average for Tier I and 100% for Tier II
(2) MS Freight Advisory Committee input and Freight User Survey Bottleneck Identification (7) Criteria applies to all public road crossings with active crossing warning devices
(gates and warning signals for Tier I and Tier II crossings). (3) Major freight generators move over 1 million tons or $200 million in value
Chemicals Petroleum, Coal Minerals, Crude petrol Gas, Secondary Traffic Others, Food Tobacco, and Concrete Glass Primary MetalTop Commodities
Top 10 Statewide Freight Counties Served
Chevron Pascagoula Refinery, Holden Earth Moving & Construction, Mississippi Phosphates Corp, Du Pont, Mallette Brothers Construction Co, Allied Waste Svc
Chemicals Petroleum, Fabricated Metal Machinery Equipment, Concrete Glass Primary Metal, Secondary Traffic Others, and Food Tobacco
Jackson, Harrison
Primary Facilities / Operators
Freight Flow Characteristics
Annual Inbound/ Outbound/ Intrastate:
Value ($ billions)*
$27.2 / $22.2 / $3.4
$39.1 / $25.5 / $4.7
To Port of Bienville from I‐10 via US 90/MS
607, southwest on US 90, south on Ansley
Rd (NHS Intermodal Connector)
US 49 and Airport Rd / 34th
Street in Gulfport connecting I‐
10 to Gulfport‐Biloxi
International Airport (NHS
Intermodal Connector)
Port Bienville Railroad (PBVR) ‐ serving Port
Bienville Industrial Park
Key Connectors
Annual Freight: Tonnage (millions) /
Value ($ billions)
33.0 / 18.5 / 3.4
38.5 / 20.1 / 5.7
Tier I: I‐10 / CSXT (Gulf Coast) CorridorGeneral Description
Corridor Freight Infrastructure
Corridor MapThe Gulf Coast Corridor covers southern Mississippi, including two of the top five most populated counties in the state,
Harrison and Jackson. The three counties in the corridor account for 13% of both population and employment in MS. The five
leading employment sectors in the corridor include government, food services, retail trade, manufacturing, and construction.
Northrop Grumman Ship Systems, the state’s largest employer with over 13,000 employees, is located in this corridor. The
corridor serves three major Gulf Coast ports, including two deep water ports: Pascagoula and Gulfport. Truck freight is the
dominant mode in the corridor and is expected to grow from 61% of total freight in 2011 to 65% in 2040. The Gulf Coast
Corridor includes two major highways, I‐10 and US 90 between the Louisiana and Alabama borders. The major intersecting
highways are US 49 in Pascagoula (connection to Jackson‐Hattiesburg‐Gulfport Corridor) and MS 63 in Gulfport. The major rail
mainline is the CSXT M&M subdivision, parallel to I‐10. Freight flows to and from Mississippi along this corridor reflect
important industry segments along the Gulf Coast, chemicals and petroleum.
Major Bottlenecks as identified
Annual Inbound/ Outbound/ Intrastate:
Tonnage (millions)*
Major Freight Generators
Existing ITS Deployments
% Freight Flows by Mode
Performance Assessment
Potential Freight Improvement Projects
(4) Undesired Level of Service defined as below LOS C in rural areas and below LOS D for urban areas. (8) Pavement condition is satisfactory if IRI rating on 65% of primary route miles < 95 for Tier I and 60% < 95 for Tier II.
(5) Capacity includes the total storage space for air cargo, ramp space and capacity in tonnage.
Volume refers to cargo volumes in tonnage.
(9) Tier I: all core track meets or exceeds FRA Class 4 standards (> 40 mph for freight, > 60 mph for passenger).
Tier II: 80% of core track meets or exceeds FRA Class 3 standards (> 25 mph for freight, > 30 mph for passenger; no signals).
Notes:
Page C‐3 5/15/2015
Highway Rail Ports & Waterways Commercial AirportsI‐20 from Louisiana border to Meridian (141 miles) KCS mainline (Meridian Speedway) from
Louisiana border to Meridian, parallel to I‐
20 (138 miles)
Port of Vicksburg Jackson International Airport
I‐220 between I‐55 and I‐20 in Jackson Mississippi Southern Railroad (MMS) from
junction with KCS at Newton to
Bay Springs
US 51 between I‐55 and I‐20 Meridian and Bigbee Railroad (MNBR) ‐ 145‐
mile line bridges the Alabama‐Mississippi
state line and provides direct connections
with major carriers: KCS, NS, CSXT, and
BNSF.
MS 27 between US 80 and I‐20 (MS 27 is also its own Tier II
corridor)
Vicksburg Southern Railroad (VSOR) ‐
connection to Port of Vicksburg
WIM; PrePass;
Jackson Metro Incident Management I / Hurricane Response
Project:
‐ CCTV cameras
‐ Dynamic Message Signs
Mississippi River I‐20 bridge in Vicksburg ITS monitoring:
‐ Surveillance cameras
‐ Traffic volumes/speeds on approaches
‐ Real Time River Current data sensors
‐ Dynamic Message signs
‐ Detour monitoring
Highway Rail Ports & Waterways Commercial Airports
2011 45.0 / $78.1 48.1 / $55.5 3.4 / $1.8 < 1 / $1.6
2040 80.3 / $166.6 69.9 / $101.2 3.2 / $1.2 < 1 / $4.4
2011
2040
2011
2040
2011 47% 50% 3% < 1%
2040 52% 46% 2% < 1%
Average % Truck Mix /
Average Total Daily Volume2011 21% / 28,700
ATRI (1)I‐55 at I‐20 in Jackson
I‐59 at I‐20 in Meridian
FAC / Freight
User Survey (2)
I‐59 at I‐20 in Meridian
I‐20 at the Pearl River Bridge
None identified None identified None identified
Tonnage
Value
Tonnage (3)
Highway Rail Ports & Waterways Commercial Airports
2011
3 miles (2%) congested:
‐ Exit 47 (US 49) to Exit 48 (S Pearson Rd)
‐ Exit 40 (MS 18) to Exit 42 (Ellis Ave)
2040
64 miles (41%) congested:
‐ Exit 1 (LA Stateline) to Exit 31 (Williamson Rd)
‐ Exit 35 (Clinton Raymond Rd) to Exit 56 (W Government St)
‐ Exit 59 (US 80) to Exit 68 (MS 43)
‐ Exit 150 (US 11) to Exit 153 (Roebuck Dr)
Crash rate: 104.
26 miles (17%) across the corridor with high crash segments.
20 crossings of 43 (47%) do not have Active
2 warning devices.
IRI rating (8)
IRI score: 70%
41 miles (26%) unacceptable.
High IRI > 95 segments:
‐ US 61/Exit 5 to Brownsville Rd/Exit 27
‐ Springridge Rd/Exit 36 to Spearson Rd/Exit 48
‐ Blossom Hill Rd to Lake Norris Rd/Exit 96
‐ I‐59/Exit 149 to US 11/Exit 154
Vertical
clearance
11 of 80 bridges (14%) deficient
Weight‐
restricted
bridges
0 of 143 (0%) restricted
Highway Rail Ports & Waterways Commercial AirportsLevel of Service: I‐20 provides acceptable LOS outside of a few
congested segments in the Jackson area. ATRI identified the I‐20/I‐
55 interchange as a major nationwide bottleneck, along with I‐20/I‐
59 interchange in Meridian. Growing congestion is forecasted by
2040, with 41% of the corridor congested. I‐20 west and east of
Jackson is already in need of capacity and interchange
improvements based on congestion analysis and also according to
the FAC. No segments of I‐20 are programmed to be widened.
Safety: I‐20 overall is a relatively safe highway corridor.
Operations: The corridor is a significant national and regional
freight link for through and regional freight, with freight destined
for Jackson area and Meridian, and through freight travelling
between northeastern states in the U.S. to Texas, New Orleans,
and beyond. The recently implemented ITS bridge and detour
monitoring across Mississippi River in Vicksburg increase truck
volumes/speeds on approaches.
Physical Condition: I‐20 does not meet Tier I pavement condition
criteria, with IRI rating better than 95 for less than 75% of primary
route miles ‐ 70%. 26% of I‐20 pavement miles are unacceptable
but overall condition is not an issue. Low vertical clearance might
impact interstate freight flows, with 14% of I‐20 bridges deficient.
Capacity: The KCS mainline handles 286k
weight limit.
Safety: Half of the railroad crossings on this
busy freight rail corridor do not have Active
2 warning devices.
Physical Condition: KCS mainline track
meets freight rail speed standards.
I‐20 via US 61 provides critical access to the
Port of Vicksburg.
Last‐mile roadway access
improvements can improve
freight flows in and out of
Jackson International Airport.
V/C need to be maintained
below 100% to avoid capacity
shortfall ‐ currently Jackson
airport comfortably meets the
criteria.
I‐20 widening projects:
‐ Mississippi River west to Brownsville Rd/Exit 27 (MDOT
Preliminary Priority List)
‐ I‐220 interchange to Pearl River Bridge (MDOT Preliminary
Priority List)
‐ I‐59/Exit 149 to US 11/Exit 154
Raise I‐20 bridges (11) to meet 16' clearance performance
standard.
Leverage Jackson Metro Incident Management II/Hurricane
Response Project to include expanded commercial vehicle
elements.
KCS: rail crossings in Vicksburg at Crawford
St and Depot St: upgrade warning devices
with signals and gates (MS State Rail Plan).
Upgrade all public corridor crossings along
the KCS mainline with Active 2 warning
devices.
None identified None identified
(5) Capacity includes the total storage space for air cargo, ramp space and capacity in tonnage.
Volume refers to cargo volumes in tonnage.
(9) Tier I: all core track meets or exceeds FRA Class 4 standards (> 40 mph for freight, > 60 mph for passenger).
Tier II: 80% of core track meets or exceeds FRA Class 3 standards (> 25 mph for freight, > 30 mph for passenger; no signals).
(2) MS Freight Advisory Committee input and Freight User Survey Bottleneck Identification (7) Criteria applies to all public road crossings with active crossing warning devices
(gates and warning signals for Tier I and Tier II crossings). (3) Major freight generators move over 1 million tons or $200 million in value
(4) Undesired Level of Service defined as below LOS C in rural areas and below LOS D for urban areas. (8) Pavement condition is satisfactory if IRI rating on 65% of primary route miles < 95 for Tier I and 60% < 95 for Tier II.
(1) FHWA/ATRI Nationwide Bottleneck Analysis (6) Crash rate greater than 80% of state average for Tier I and 100% for Tier II
Corridor Needs Assessment and Infrastructure Need
Top 10 Statewide Freight Counties Served Hinds, Warren, Rankin
Safety:
Highways: Annual Crash Rate (174/100M vmt) (6)
Rail: RR crossings w/o active warning devices (7)
Infrastructure Condition:
Highways: Pavement & Structures
Rail: Speed/Track (9)
100% of track meets freight rail speed
standards.
Performance Assessment
Potential Freight Improvement Projects
Notes: * Excludes through freight
Existing ITS Deployments
Corridor Infrastructure Performance
Capacity:
Highways: Level of Service (4)
Rail: % supporting 286k weight limits
Ports: channel depth
Commercial airports: storage volume to
capacity (5)
100% of KCS mainline supports 286k Recovery time from flood or drought to 12'
minimum depth
21% in 2008 (MSGM&TS)
Top Commodities Chemicals Petroleum, Coal Minerals, Crude petrol Gas, Secondary Traffic Others, Food Tobacco, and Agriculture
Chemicals Petroleum, Fabricated Metal Machinery Equipment, Secondary Traffic Others, Concrete Glass Primary Metal, and Misc Freight
Major Freight Generators N Runyon WJ & Son Inc, Akzo Nobel Coatings Inc.
Major Bottlenecks as identified
Freight Flow Characteristics
Annual Freight: Tonnage (millions) /
Value ($ billions)
Annual Inbound/ Outbound/ Intrastate:
Tonnage (millions)*
21.4 / 13.7 / 8.8
29.5 / 22.4 / 13.5
Annual Inbound/ Outbound/ Intrastate:
Value ($ billions)*
$22.2 / $21.4 / $4.6
$41.6 / $43.5 / $7.2
% Freight Flows by Mode
Corridor Freight Infrastructure
Primary Facilities / Operators
Key Connectors
To Port of Vicksburg : from I‐20, west on
Clay St, Cherry St, & 1st East St, north on
Washington, west on Haining Rd, and
northwest on Industrial Dr to port (NHS
Intermodal Connector)
MS 475 / Airport Rd (north)
connecting I‐20 to Jackson
International Airport (NHS
Intermodal Connector)
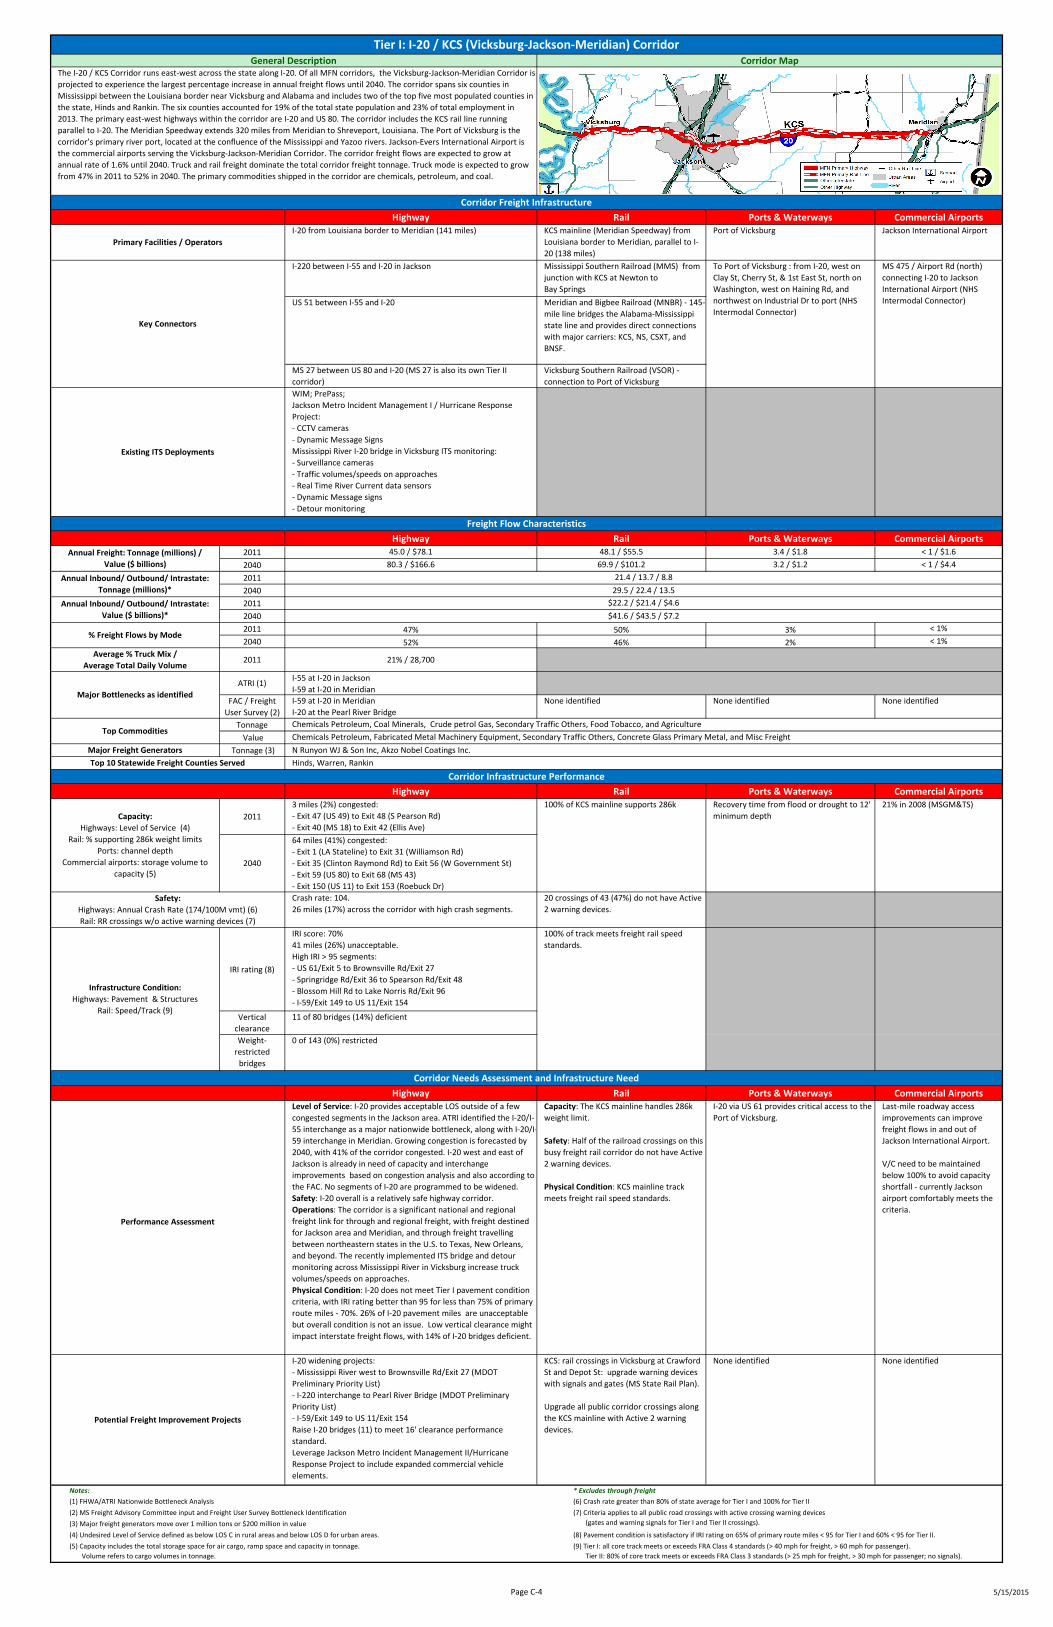
The I‐20 / KCS Corridor runs east‐west across the state along I‐20. Of all MFN corridors, the Vicksburg‐Jackson‐Meridian Corridor is
projected to experience the largest percentage increase in annual freight flows until 2040. The corridor spans six counties in
Mississippi between the Louisiana border near Vicksburg and Alabama and includes two of the top five most populated counties in
the state, Hinds and Rankin. The six counties accounted for 19% of the total state population and 23% of total employment in
2013. The primary east‐west highways within the corridor are I‐20 and US 80. The corridor includes the KCS rail line running
parallel to I‐20. The Meridian Speedway extends 320 miles from Meridian to Shreveport, Louisiana. The Port of Vicksburg is the
corridor’s primary river port, located at the confluence of the Mississippi and Yazoo rivers. Jackson‐Evers International Airport is
the commercial airports serving the Vicksburg‐Jackson‐Meridian Corridor. The corridor freight flows are expected to grow at
annual rate of 1.6% until 2040. Truck and rail freight dominate the total corridor freight tonnage. Truck mode is expected to grow
from 47% in 2011 to 52% in 2040. The primary commodities shipped in the corridor are chemicals, petroleum, and coal.
Tier I: I‐20 / KCS (Vicksburg‐Jackson‐Meridian) CorridorGeneral Description Corridor Map
Page C‐4 5/15/2015

Highway Rail Ports & Waterways Commercial AirportsI‐55 from Tennessee border to Louisiana border (290 miles). CN mainline between Memphis and New
Orleans, entering Mississippi near Memphis
and exiting near
McComb (305 miles)
Port of Yazoo Jackson International Airport
I‐69 between I‐55 and US 61
I‐220 between I‐55 and I‐20 in Jackson
MS 27 between I‐55 and Hopewell Road
MS 28 between I‐55 and Bailey Road
MS 7 between I‐55/ Grenada and Greenwood The Grenada Railway, LLC (GRYR) from
Tennessee state line to Canton (runs parallel
to I‐55)
MS 315 between US 51 and I‐55
US 278 between MS 35 and I‐55
Paper Mill Road (Grenada) between Resolute Forest Products Plant and I‐
55
MS 6 / US 278 west of US 61 to I‐55
WIM
Jackson Metro Incident Management I / Hurricane Response Project:
‐ CCTV cameras
‐ Dynamic Message Signs
Desoto County Incident Management Project: Phase 1:
‐ CCTV cameras
‐ Dynamic Message Signs
Highway Rail Ports & Waterways Commercial Airports
2011 80.6 / $116.9 58.9 / $62.7 < 1 / < $1 < 1 / $1.6
2040 134.7 / $216.1 71.0 / $115.2 < 1 / < $1 < 1 / $4.4
2011
2040
2011
2040
2011 58% 42% < 1% < 1%
2040 65% 35% < 1% < 1%
Average % Truck Mix /
Average Total Daily Volume2011 16% / 26,200
ATRI (1) I‐55 at I‐20 in Jackson
FAC / Freight
User Survey (2)
Tier I: I‐55/I‐20 interchange in Jackson
I‐55: between Ridgeland and Madison; between McDowell Rd and
Savanna St. in Jackson
MS 6 / US 278 west to US 61 from I‐55/Batesville.
CN line from Jackson to Memphis via
Grenada (short rail line parallel to I‐55)
None identified None identified
Tonnage
Value
Tonnage (3)
Highway Rail Ports & Waterways Commercial Airports
2011
8 miles (3%) congested:
‐ Exit 104 (I‐220) to Exit 105 (Natchez Rd)
‐ Exit 92 (E McDowell Rd) to Exit 98 (Lakeland Dr)
2040
66 miles (23%) congested:
‐ Exit 265 (E Main St) to Exit 287 (Church Rd)
‐ Exit 91 (Wynndale Rd) to Exit 119 (W Peace St)
‐ Exit 72 (MS 27) to Exit 78 (Green Gold Rd)
‐ Exit 61 (MS 28) to Exit 65 (W Gellman)
Crash rate: 109
38 miles (13%) across the corridor with high crash segments.
29 crossings of 81 (36%) do not have Active
2 warning devices
IRI rating (8)
IRI score: 69%
90 miles (31%) unacceptable.
High IRI > 95 segments:
‐ E. Commerce St./Exit 280 to MS 740/Exit 263
‐ MS 35 N/Exit 245 to Exit 233
‐ MS 35/Exit 174 to MS 12/Exit 156
‐ I‐220/Exit 104 to E. County Line Rd/Exit 103
‐ E Woodrow Wilson Ave/ Exit 98 to Green Gable Rd/Exit 78
‐ US 98/Exit 20 to MS 584/Exit 1
Vertical
clearance
26 of 113 bridges (23%) deficient
Weight‐
restricted
bridges
0 of 237 (0%) restricted
Highway Rail Ports & Waterways Commercial AirportsLevel of Service: I‐55 provides acceptable LOS outside of some congested
segments in the Jackson area, notably its interchanges with I‐20 and I‐
220. Growing congestion by 2040, with nearly one quarter of the corridor
congested. Completion of the I‐69/I‐269 should relieve congestion in the
southern Memphis area, especially west to US 61 from I‐55/Batesville,
identified by the FAC as a bottleneck. I‐55 south and north of Jackson is in
need of capacity and interchange improvements, based on congestion
analysis. Portions of I‐55 are programmed to be widened. This should
alleviate congestion for both passenger and freight traffic, but more
widening will be needed in the future to accommodate freight demand.
Safety: I‐55 overall is a relatively safe highway corridor.
Operations: The corridor’s extensive connectivity makes it a significant
national link for through freight, with connections between Memphis,
Jackson, and down to New Orleans. The percentage of trucks as a used
freight mode in the corridor is forecasted to increase by 2040. The I‐55/I‐
20 interchange is a critical interchange in the region, and is also identified
as one of the top highway bottlenecks nationwide by ATRI.
Physical Condition: The corridor does not meet Tier I pavement condition
criteria, with IRI rating better than 95 for less than 75% of primary route
miles ‐ 69%. Condition of 31% of I‐55 pavement miles is unacceptable ‐
the most percentage of all Tier I Corridors, but overall capacity rather
than condition is posing more challenges.
Low vertical clearance might impact interstate freight flows, with 23% of I‐
55 bridges deficient.
Capacity: The CN mainline handles 286k
weight limit.
Safety: 36% the railroad crossings on this
busy freight rail corridor do not have Active
2 warning devices, but the mainline does not
intersect many busy highways since it does
not run parallel to I‐55.
Physical Condition: FRA track speed
standards are not met north of Jackson and
in Greenwood area.
Last mile rail access to Port of Yazoo is an
issue.
Last‐mile roadway access
improvements can improve
freight flows in and out of
Jackson International Airport.
V/C need to be maintained
below 100% to avoid capacity
shortfall ‐ currently Jackson
airport comfortably meets the
criteria.
I‐55 ‐ widening and repaving:
‐ I‐220/Exit 104 to E. County Line Rd/Exit 103 in Jackson
‐ Hernando/Exit 283/I‐269 to South Haven/TN State Line (MDOT STIP /
Preliminary Priority List & MULTIPLAN 2035)
Raise I‐55 bridges (26) to meet 16' clearance performance standard.
Leverage Desoto County Incident Management Project to include
expanded commercial vehicle elements.
Installation of additional ITS Phases of the Desoto County Incident
Management Project, including expanded commercial vehicle elements.
CN mainline core track improvements in
Greenwood and north of Jackson to to raise
line speed.
Upgrade all public corridor crossings along
the CN mainline with Active 2 warning
devices.
Implement Port of Yazoo rail access
improvements: resurface grade crossings
and rehabilitate trackage. (MS State Rail
Plan).
None identified
(5) Capacity includes the total storage space for air cargo, ramp space and capacity in tonnage.
Volume refers to cargo volumes in tonnage.
(9) Tier I: all core track meets or exceeds FRA Class 4 standards (> 40 mph for freight, > 60 mph for passenger).
Tier II: 80% of core track meets or exceeds FRA Class 3 standards (> 25 mph for freight, > 30 mph for passenger; no signals).
Performance Assessment
Potential Freight Improvement Projects
Notes: * Excludes through freight
(1) FHWA/ATRI Nationwide Bottleneck Analysis (6) Crash rate greater than 80% of state average for Tier I and 100% for Tier II
(2) MS Freight Advisory Committee input and Freight User Survey Bottleneck Identification (7) Criteria applies to all public road crossings with active crossing warning devices
(gates and warning signals for Tier I and Tier II crossings). (3) Major freight generators move over 1 million tons or $200 million in value
(4) Undesired Level of Service defined as below LOS C in rural areas and below LOS D for urban areas. (8) Pavement condition is satisfactory if IRI rating on 65% of primary route miles < 95 for Tier I and 60% < 95 for Tier II.
Corridor Needs Assessment and Infrastructure Need
Top 10 Statewide Freight Counties Served Hinds, Copiah, Rankin, Yazoo
Existing ITS Deployments
Corridor Infrastructure Performance
Capacity:
Highways: Level of Service (4)
Rail: % supporting 286k weight limits
Ports: channel depth
Commercial airports: storage volume to
capacity (5)
100% of CN mainline supports 286k Recovery time from flood or drought to 12'
minimum depth
21% in 2008 (MSGM&TS)
Safety:
Highways: Annual Crash Rate (174/100M vmt) (6)
Rail: RR crossings w/o active warning devices (7)
Infrastructure Condition:
Highways: Pavement & Structures
Rail: Speed/Track (9)
Does not meet track speed standards in
Greenwood area and north of Jackson.
Top Commodities Coal Minerals, Crude petrol Gas, Chemicals Petroleum, Food Tobacco, Secondary Traffic Others, and Agriculture
Chemicals Petroleum, Fabricated Metal Machinery Equipment, Misc Freight, Food Tobacco, and Concrete Glass Primary Metal
Major Freight Generators Oddee Smith & Sons Construction, Green Brothers Gravel Co, Krystal Gravel Co, Krystal Gravel Pit, Blain Sand & Gravel Inc, Hammett Gravel Co Inc, D & B Sand & Gravel Inc, Memphis Stone & Gravel, Smith
Brothers Sand & Gravel, Eaton Corp, H H Petermann Jr Sand & Gravel, Resolute Forest Products, MMC Materials Inc.
Major Bottlenecks as identified
Freight Flow Characteristics
Annual Freight: Tonnage (millions) /
Value ($ billions)
Annual Inbound/ Outbound/ Intrastate:
Tonnage (millions)*
22.0 / 17.6 / 15.7
31.7 / 31.5 / 29.3
Annual Inbound/ Outbound/ Intrastate:
Value ($ billions)*
$26.7 / $27.5 / $5.9
$50.1 / $57.5 / $9.5
% Freight Flows by Mode
Corridor Freight Infrastructure
Primary Facilities / Operators
Key Connectors
IC Railroad in Jackson connectors :
‐North Connector: from I‐55 via N. Mill St,
Woodrow Wilson to facility (NHS Intermodal
Connector)
‐South Connector: from I‐55 via
Pearl/Pascagoula St to Mill St to facility (NHS
Intermodal Connector)
CN Class I line from Jackson to Canton
(parallel to I‐55)
To Port of Yazoo: from I‐55 via MS 3, River
Rd, and Levee Rd to port (NHS Intermodal
Connector)
The I‐55 / CN Corridor consists of 19 counties and includes Jackson, the largest city in Mississippi and its capital. One‐third of Mississippi’s
population and available jobs are located within this corridor, particularly Hinds, Desoto, Madison, and Rankin counties that alone account
for 66% of the total population within the corridor and 73% of its employment force. With the state capital located within the corridor, the
government is the leading source of jobs. The I‐55 / CN Corridor is the most heavily traveled freight corridor in Mississippi, with 139 million
tons moved by truck or rail along the corridor's counties in 2011. Truck is the dominant freight mode in the corridor and is expected to
grow from 58% share in 2011 to 65% in 2040. The rail share is expected to decline from 42% to 35%. To facilitate the freight flows, the
corridor’s major freight network elements include: Interstate 55 and US 49; the CN rail line; the Jackson and Memphis International
Airports; and the Yazoo County Port served by CN rail line. The primary commodities shipped through the corridor are chemical petroleum
products and coal.
Tier I: I‐55 / CN (Southaven‐Jackson‐McComb) CorridorGeneral Description Corridor Map
Page C‐5 5/15/2015

Highway Rail Ports & Waterways Commercial AirportsI‐59 from Louisiana border to Alabama border (170
miles)
NS Crescent Corridor mainline between
Meridian and New Orleans, exiting
Mississippi near Picayune, parallel to I‐59
(171 miles)
WIM
Highway Rail Ports & Waterways Commercial Airports
2011 86.2 / $124.3 28.8 / $36.4
2040 119.9 / $207.5 41.8 / $64.5
2011
2040
2011
2040
2011 75% 25%
2040 74% 26%
Average % Truck Mix /
Average Total Daily Volume2011 16% / 17,400
ATRI (1) I‐59 at I‐20 in Meridian
FAC / Freight
User Survey (2)
I‐59 at I‐20 in Meridian None identified
Tonnage
Value
Tonnage (3)
Highway Rail Ports & Waterways Commercial Airports
2011 0 miles (0%) congested
2040
35 miles (22%) congested:
‐ Exit 1 (LA Stateline) to Exit 6 (Sycamore Rd)
‐ Exit 59 (US 98) to Exit 85 (MS 590)
‐ Exit 93 (Ellisville Blvd) to Exit 95 (US 11)
Crash rate: 95
21 miles (14%) across the corridor with high crash
segments.
7 crossings of 30 (23%) do not have Active
2 warning devices.
IRI rating (8)
IRI score: 88%
19 miles (12%) unacceptable.
High IRI > 95 segments:
‐ Louisiana Stateline to Exit 1
‐ Monroe Rd/Exit 73 to Moselle Seminary/Exit 80
‐ Ellisville Blvd/Exit 93 to US 11/Exit 99
Vertical
clearance
7 of 48 bridges (15%) deficient
Weight‐
restricted
bridges
0 of 89 (0%) restricted
Highway Rail Ports & Waterways Commercial AirportsLevel of Service: I‐59 provides acceptable LOS with no
existing congestion. By 2040, the facility is forecasted
to experience congestion along 35 miles (22%): in the
Hattiesburg, Laurel, and Picayune areas. ATRI also
identified the I‐59/I‐20 interchange in Meridian at the
northern terminus of this corridor as one of the major
nationwide bottlenecks. No segments of I‐59 are
programmed to be widened.
Safety: I‐59 overall is a relatively safe highway
corridor.
Operations: The corridor is a significant national
freight link for through freight, with freight destined
for New Orleans and states northeast of Mississippi.
The I‐59/I‐20 interchange is one of the critical
interchanges in the region, and also identified as one
of the top highway bottlenecks nationwide by ATRI.
Physical Condition: 12% of I‐59 pavement miles are
unacceptable but overall condition is not an issue.
Overall, the I‐59 corridor is in the best physical shape
of all Tier I corridors. Low vertical clearance might
impact interstate freight flows ‐ 15% of I‐59 bridges
are deficient.
Capacity: The NS mainline is part of the
Crescent Corridor that extends from
Louisiana to New Jersey. The NS mainline
handles 286k weight limit.
Safety: A relatively small percentage of
railroad crossings along this rail corridor,
23%, do not have Active 2 warning devices.
Physical Condition: FRA track speed
standards are not met in Laurel and
Picayune areas.
Raise I‐59 bridges (7) to meet 16' clearance
performance standard.
Leverage deployment of the Hattiesburg region ITS
Incident Management System & TMC Operations to
include expanded commercial vehicle elements.
NS mainline core track improvements in
Laurel and Picayune areas to raise line
speed.
Upgrade all public corridor crossings along
the NS mainline with Active 2 warning
devices.
(5) Capacity includes the total storage space for air cargo, ramp space and capacity in tonnage.
Volume refers to cargo volumes in tonnage.
(9) Tier I: all core track meets or exceeds FRA Class 4 standards (> 40 mph for freight, > 60 mph for passenger).
Tier II: 80% of core track meets or exceeds FRA Class 3 standards (> 25 mph for freight, > 30 mph for passenger; no signals).
(2) MS Freight Advisory Committee input and Freight User Survey Bottleneck Identification (7) Criteria applies to all public road crossings with active crossing warning devices
(gates and warning signals for Tier I and Tier II crossings). (3) Major freight generators move over 1 million tons or $200 million in value
(4) Undesired Level of Service defined as below LOS C in rural areas and below LOS D for urban areas. (8) Pavement condition is satisfactory if IRI rating on 65% of primary route miles < 95 for Tier I and 60% < 95 for Tier II.
(1) FHWA/ATRI Nationwide Bottleneck Analysis (6) Crash rate greater than 80% of state average for Tier I and 100% for Tier II
Corridor Needs Assessment and Infrastructure Need
Top 10 Statewide Freight Counties Served None
Safety:
Highways: Annual Crash Rate (174/100M vmt) (6)
Rail: RR crossings w/o active warning devices (7)
Infrastructure Condition:
Highways: Pavement & Structures
Rail: Speed/Track (9)
Does not meet track speed standards in
Laurel and Picayune areas.
Performance Assessment
Potential Freight Improvement Projects
Notes: * Excludes through freight
Existing ITS Deployments
Corridor Infrastructure Performance
Capacity:
Highways: Level of Service (4)
Rail: % supporting 286k weight limits
Ports: channel depth
Commercial airports: storage volume to
capacity (5)
100% of NS mainline supports 286k.
Top Commodities Chemicals Petroleum, Coal Minerals, Crude petrol Gas, Secondary Traffic Others, Food Tobacco, and Concrete Glass Primary Metal
Chemicals Petroleum, Fabricated Metal Machinery Equipment, Concrete Glass Primary Metal, Food Tobacco, and Misc Freight
Major Freight Generators Johnston's Sand & Gravel, Hutchinson Island Mining Corp, John L Sanford Jr Inc, Sei Seal Enterprises Inc, Huey Stock Still, Hover Gravel Co, Sanderson Farms Inc, Customs Abrasives
LLC, American Sand & Gravel Co.
Major Bottlenecks as identified
Freight Flow Characteristics
Annual Freight: Tonnage (millions) /
Value ($ billions)
Annual Inbound/ Outbound/ Intrastate:
Tonnage (millions)*
13.6 / 10.4 / 5.4
18.5 / 14.1 / 8.4
Annual Inbound/ Outbound/ Intrastate:
Value ($ billions)*
$10.9 / $14.1 / $4.1
$19.8 / $21.9 / $6.2
% Freight Flows by Mode
Corridor Freight Infrastructure
Primary Facilities / Operators
Key Connectors
Meridian Southern Railway (MDS) ‐ former
KCS branch line between Meridian and
Waynesboro
MS 43 between Pine Grove Road and I‐59
The I‐59 / NS Corridor spans seven Mississippi counties including the cities of Hattiesburg and Meridian, the state's
third and sixth largest city, respectively. In 2013, an estimated 13% of the state's total population resided within the
corridor, compared to 12% of the total statewide employment. Through freight accounts for 75% of the total corridor
freight, the highest share of all the MFN corridors. Freight flows along the Picayune‐Hattiesburg‐Meridian Corridor are
expected to grow at 1.2% annually until 2040. Truck is the dominant mode with 75% of the total corridor freight
tonnage, with the rest associated with the rail mode. The primary highways running through this corridor are I‐59 and
US 11. By 2040 nearly half of the corridor’s length along I‐59 is expected to be congested. Major rail lines serving the
corridor include the NS mainline, which parallels I‐59 and has major interchanges with the CN at Hattiesburg and with
KCS in Meridian, where it interchanges with the Meridian Speedway. The primary commodities shipped through the
corridor are chemical petroleum products, followed by coal and crude oil.
Tier I: I‐59 / NS (Picayune‐Hattiesburg‐Meridian) CorridorGeneral Description Corridor Map
Page C‐6 5/15/2015

Highway Rail Ports & Waterways Commercial AirportsUS 49 from Jackson to Gulfport via Hattiesburg (154 miles) CN Beaumont Subdivision between
Jackson and Hattiesburg.
KCS Gulfport Subdivision between
Hattiesburg and Gulfport. (161 miles total).
Port of Gulfport Gulfport‐Biloxi International
Airport
Jackson International Airport
To Port of Gulfport from I‐10 via US 90:
port access road (NHS Intermodal
Connector)
To Port of Gulfport from I‐10 via US 90:
West Pier Gate to 27th Avenue (NHS
Intermodal Connector)
Jackson Metro Incident Management I / Hurricane Response
Project:
‐ CCTV cameras
‐ Dynamic Message Signs
Gulf Region Incident Management System:
‐ CCTV cameras
‐ Dynamic Message Signs
Highway Rail Ports & Waterways Commercial Airports2011 32.7 / $53.6 42.5 / $62.0 3.6 / $0.3 < 1 / $1.6
2040 51.7 / $102.7 63.4 / $113.0 7.3 / $1.5 < 1 / $4.4
2011
2040
2011
2040
2011 42% 54% 5% < 1%
2040 42% 52% 6% < 1%
Average % Truck Mix /
Average Total Daily Volume2011 10% / 20,700
ATRI (1) None
FAC / Freight
User Survey (2)
US 49: between I‐20 and Star; between Hattiesburg and Port of
Gulfport
None identified None identified None identified
Tonnage
Value
Tonnage (3)
Highway Rail Ports & Waterways Commercial Airports
2011
9 miles (6%) congested:
‐ I‐20 to E Main St/MS 469
‐ Oneal Rd north of I‐10 to Airport Rd south of I‐10
2040
46 miles (30%) congested:
I‐20 to Star Rd; Old Hwy 49 N to Richland Cir; Gunter Rd to E Main
St; Zion Hill Rd to Pinola Rd; Rock Hill Rd to US 84; Main St to Kola
Rd; MS 42 to Old HWY 42/Campbell Dr; Hardy St to Elks Lake
Rd/Edwards St; E. Wrotham Rd to Dedeaux Rd; Landon Rd to
Beach Blvd/US 90Crash rate: 364
Corridor does not meet Tier I safety performance criteria.
40 miles (26%) across the corridor with high crash segments.
38 crossings of 49 (78%) do not have Active
2 warning devices.
IRI rating (8)
IRI score: 70%
46 miles (30%) unacceptable.
High IRI > 95 segments:
‐ I‐20 to MS 149
‐ Cascio Rd to Peps Point Rd
‐ W 7th St to MS 198
‐ Southgate Rd to Carnes Rd
‐ Old Hwy 49 to MS 53/N Swan Rd
‐ I‐10 to US 90
Vertical
clearance
10 of 13 bridges (77%) deficient
Weight‐
restricted
bridges
2 of 71 (3%) restricted
Highway Rail Ports & Waterways Commercial AirportsLevel of Service: US 49 provides acceptable LOS today, with only
short congested segments. The FAC identified multiple sections
of the highway as existing bottlenecks though, including Jackson,
Richland, Hattiesburg, and Port of Gulfport areas. The FAC also
recommended that US 49 should be upgraded to Interstate
standards from Hattiesburg to Gulfport. By 2040, the facility is
forecasted to experience congestion along 46 miles (30%).
Segments of US 49 are programmed to be widened, most notably
in the Florence area south of Jackson.
Safety: US 49 is the only Tier I corridor that does not meet safety
performance criteria. Crash rate is very high ‐ more than triple
Tier I corridor average.
Operations: The corridor is a significant statewide and regional
freight link with freight destined for Jackson area from the Gulf
Coast and vice‐versa. There are no existing ITS deployments
outside of Jackson area.
Physical Condition: The corridor does not meet Tier I pavement
condition criteria, with IRI rating better than 95 for less than 75%
of primary route miles ‐ 70%. 26% of US 49 pavement miles are
unacceptable but overall condition is not an issue. This is the
worst faring Tier I corridor by bridge clearance, with 77% of
bridges deficient and potentially impacting freight flows. US 49 is
the only Tier I corridor with weight‐restricted bridges, although
small (2 of 71 bridges).
Capacity: the CN and KCS mainlines handle
286k weight limit.
Safety: 78% the railroad crossings on this
busy freight rail corridor do not have Active
2 warning devices.
Physical Condition: the CN mainline and
sections of KCS mainline do not have active
or passive warning devices.
Last mile roadway and rail connection is
critical for the Port of Gulfport to remain
competitive, need for new or improved last‐
mile access roads to ports, with particular
focus on their physical and operating
conditions. US 49 provides the critical link
between I‐10, US 90, and to the Port of
Gulfport. KCS provides rail access to the
port's vicinity, but not directly to the
facility.
Last‐mile roadway access
improvements can improve
freight flows in and out of
Gulfport‐Biloxi International
Airport and Gulfport‐Biloxi
International Airport.
V/C need to be maintained
below 100% to avoid capacity
shortfall ‐ currently both
airports within the corridor
comfortably meet the criteria.
Repaving and widening of US 49 from I‐10 to US 90 (MDOT
STIP/Preliminary Priority List).
Repaving and widening of US 49 from I‐20 to Star Rd in Star
(MDOT STIP/Preliminary Priority List).
Repaving and widening US 49 from School Rd to O'Neal Rd in
Gulfport ‐ to 6 lane divided.
I‐10/US 49 interchange: capacity and interchange improvements.
Safety improvements along US 49.
Raise US 49 bridges (10) to meet 16' clearance performance
standard.
Reconstruct two US 49 bridges to lift weight restrictions.
Leverage deployment of Hattiesburg region ITS Incident
Management System & TMC Operations to include expanded
commercial vehicle elements.
Finalize deployment of the Gulf Region Incident Management
System ITS improvements along the Gulf Coast.
CN mainline and KCS mainline in Gulfport
and Wiggins track improvements to raise
line speed.
Upgrade all public corridor crossings along
the KCS and NS mainlines with active 2
warning devices.
Develop rail access directly into Port of
Gulfport facility (MS State Rail Plan).
None identified
(5) Capacity includes the total storage space for air cargo, ramp space and capacity in tonnage.
Volume refers to cargo volumes in tonnage.
(9) Tier I: all core track meets or exceeds FRA Class 4 standards (> 40 mph for freight, > 60 mph for passenger).
Tier II: 80% of core track meets or exceeds FRA Class 3 standards (> 25 mph for freight, > 30 mph for passenger; no signals).
(2) MS Freight Advisory Committee input and Freight User Survey Bottleneck Identification (7) Criteria applies to all public road crossings with active crossing warning devices
(gates and warning signals for Tier I and Tier II crossings). (3) Major freight generators move over 1 million tons or $200 million in value
(4) Undesired Level of Service defined as below LOS C in rural areas and below LOS D for urban areas. (8) Pavement condition is satisfactory if IRI rating on 65% of primary route miles < 95 for Tier I and 60% < 95 for Tier II.
(1) FHWA/ATRI Nationwide Bottleneck Analysis (6) Crash rate greater than 80% of state average for Tier I and 100% for Tier II
Corridor Needs Assessment and Infrastructure Need
Top 10 Statewide Freight Counties Served Harrison, Rankin
Safety:
Highways: Annual Crash Rate (174/100M vmt) (6)
Rail: RR crossings w/o active warning devices (7)
Infrastructure Condition:
Highways: Pavement & Structures
Rail: Speed/Track (9)
Sections of CN mainline and sections of
KCS mainline in Wiggins and south of I‐10
in Gulfport do not meet track speed
standards.
Performance Assessment
Potential Freight Improvement Projects
Notes: * Excludes through freight
Capacity:
Highways: Level of Service (4)
Rail: % supporting 286k weight limits
Ports: channel depth
Commercial airports: storage volume to
capacity (5)
CN Beaumont Subdivision and KCS
Gulfport Subdivision both support 286k
limits.
Authorized channel depth vs actual depth Jackson: 21% in 2008
(MSGM&TS)
Gulfport: 64% in 2008
(MSGM&TS)
% Freight Flows by Mode
Major Bottlenecks as identified
Corridor Infrastructure Performance
Major Freight Generators John L Sanford Jr Inc, Sanderson Farms, Hover Gravel Co, Hood Industries, American Sand & Gravel Co.
Top Commodities Chemicals Petroleum, Coal Minerals, Crude petrol Gas, Food Tobacco, Concrete Glass Primary Metal, and Agriculture
Chemicals Petroleum, Fabricated Metal Machinery Equipment, Misc Freight, Concrete Glass Primary Metal, and Food Tobacco
Tier I: US 49 / CN / KCS (Jackson‐Hattiesburg‐Gulfport) CorridorGeneral Description Corridor Map
Key Connectors
To Gulfport‐Biloxi International
Airport: US 49 and Airport
Rd/34th Street to airport (NHS
Intermodal Connector)
NHS Connector to the corridor's Port of Gulfport (listed under
'Ports & Waterways')
KCS branch to DuPont and Bayou Concrete
Plant
Annual Inbound/ Outbound/ Intrastate:
Value ($ billions)*
$18.3 / $15.8 / $6.3
$35.8 / $27.2 / $8.7
The US 49/CN Corridor runs through central Mississippi, between Jackson and Gulfport, and includes Hattiesburg. The nine
counties within the corridor account for 18% of both the total population and statewide employment. Rail is the dominant mode
in this corridor and accounts for over 50% of total freight tonnage, followed by truck with 42%. Significant increase in congestion
is expected along the corridor’s primary highway, US 49, with 57% of the facility’s length becoming congested by 2040. The
corridor includes the CN rail line running along US 49 between Jackson and Hattiesburg (it continues along US 98 from
Hattiesburg to the Alabama border). The KCS line runs between Hattiesburg and Gulfport along US 49. The Jackson‐Evers
International Airport provides freight aviation services while the Port of Gulfport is the deep water port serving the area. Corridor
freight flow is expected to grow at 1.5% annually until 2040. The primary commodities shipped through the corridor are chemical
petroleum products and coal.
Corridor Freight Infrastructure
Primary Facilities / Operators
Existing ITS Deployments
Freight Flow Characteristics
Annual Freight: Tonnage (millions) /
Value ($ billions)
Annual Inbound/ Outbound/ Intrastate:
Tonnage (millions)*
20.4 / 10.6 / 7.6
30.8 / 16.9 / 12.3
Page C‐7 5/15/2015

Highway Rail Ports & Waterways Commercial AirportsUS 78 / I‐22 from Tennessee border to Alabama border (118
miles)
BNSF mainline between Memphis, TN and
Birmingham, AL (130 miles)
Port of Amory, Port of Itawamba
US 278 between Amory and US 78 Mississippi Central Railroad Company
(MSCI) from Oxford, connecting with BNSF
at Holly Springs and NS at Grand Junction,
Tennessee
To Port of Amory: I‐22 to US 45: east on US
278, north on Waterway Dr, west on Port
Access Road to port (NHS Intermodal
Connector)
MS 15 between US 78 and Blue Mountain Mississippi Tennessee Railroad (MTNR) runs
from connections with
BNSF and KCS at New Albany to Falkner.
R.J. Corman‐Tennessee Terminal (RJCK)
running east from junction and interchange
with BNSF at Olive Branch
The Mississippian Railway Cooperative
(MMSW) ‐ northeast from BNSF connection
in Amory to Fulton
PrePass; WIM
Highway Rail Ports & Waterways Commercial Airports
2011 24.7 / $37.7 48.7 / $44.4 0.4 / $0.2
2040 54.9 / $80.9 52.8 / $78.7 0.8 / $0.2
2011
2040
2011
2040
2011 33% 66% 1%
2040 51% 49% 1%
Average % Truck Mix /
Average Total Daily Volume2011 11% / 18,400
ATRI (1) None
FAC / Freight
User Survey (2)
None identified None identified None identified
Tonnage
Value
Tonnage (3)
Highway Rail Ports & Waterways Commercial Airports
2011 0 miles (0%) congested
2040
37 miles (31%) congested:
‐ Exit 1 (Craft Rd) to Exit 4 (Cockrum Rd)
‐ Exit 6 (Bethel Rd) to Exit 26 (Landfill Rd)
‐ Exit 30 (MS 4) to Exit 37 (CCC Rd)
‐ Exit 76 (MS 9) to Exit 81 (MS 178)
‐ Exit 85 (Natchez Trace Pkwy) to Exit 94 (MS 371)
Crash rate: 65
13 miles (11%) across the corridor with high crash segments.
10 crossings of 21 (48%) do not have Active
2 warning devices.
IRI rating (8)
IRI score: 70%
36 miles (30%) unacceptable.
High IRI > 95 segments:
‐ Red Bank Rd to Landfill Rd
‐ Sawmill Rd to MS 178
‐ MS 30 to MS 15
‐ MS 25 to Alabama Stateline
Vertical
clearance
1of 51 bridges (2%) deficient
Weight‐
restricted
bridges
0 of 113 (0%) restricted
Highway Rail Ports & Waterways Commercial AirportsLevel of Service: Today US 78 provides acceptable LOS, but is
forecast to experience growing congestion and delay by
2040, with 31% of the corridor congested, notably in the
Memphis area, and around Tupelo. Conversion of US 78 to I‐
22 west all the way to Memphis should improve future LOS
for both passenger and freight traffic.
Safety: US 78 is a very safe highway corridor. It is the safest
Tier I corridor overall.
Operations: The corridor is an important regional freight link
from Memphis, a major national freight hub, to
northeastern MS, including Tupelo, and to points east in
Alabama. Converting US 78 to interstate standards will
improve operations along the corridor, with average truck
travel speed bound to increase.
Physical Condition: The corridor does not meet Tier I
pavement condition criteria, with IRI rating better than 95
for less than 75% of primary route miles ‐ 70%. Large portion
of the corridor, 30%, has unacceptable pavement condition.
Low vertical clearance might slightly impact freight flows,
with only one bridge not meeting this performance measure.
Capacity: Rail freight flows are more
dominant on a percentage basis than truck
freight flows within the corridor (66% vs.
33%). 100% of the BNSF mainline can
handle 286k weight limit.
Safety: 48% of the railroad crossings along
this rail corridor do not have Active 2
warning devices.
Physical Condition: FRA track speed
standards are met outside of one section in
the Tupelo area.
Last mile rail and roadway access is critical
for the two river ports located within the
corridor. The river ports are not served
directly by US 78, but rather via collectors ‐
in both cases NHS Intermodal Connectors.
Rail access to Port of Itawamba is provided
by the Mississippian Railway Cooperative
connecting to the BNSF mainline, while Port
of Amory currently has no rail access. The
quality of last mile access rail service
provided by the MMSW depends on the
quality of its connection to the BNSF.
US 78 repaving projects:
‐ Exit 1 (Craft Rd) to Exit 37 (CCC Rd)
‐ Exit 76 (MS 9) to Exit 94 (MS 371)
Raise one US 78 bridge to meet 16' clearance performance
standard.
Development and deployment of the ITS Projects in the
Tupelo area, including commercial vehicle elements.
Complete conversion of US 78 to I‐22 (long term).
BNSF mainline core track improvements in
Tupelo to raise line speed.
Upgrade all public corridor crossings along
the BNSF mainline with Active 2 warning
devices.
Port of Amory ‐ BNSF spur: upgrade 12 rail
bridges between Amory and Columbus to
permit 286K loads and extend rail spur to
US 278 bridge (MULTIPLAN 2035 and MS
State Rail Plan).
Port of Itawamba (MMSW): rehabilitate 23
miles of rail line from Fulton to Amory to
handle 286k carload weights (MS State Rail
Plan).
US 278 ‐ US 45: widen to 4 lanes to Port of
Amory (MULTIPLAN 2035).
(5) Capacity includes the total storage space for air cargo, ramp space and capacity in tonnage.
Volume refers to cargo volumes in tonnage.
(9) Tier I: all core track meets or exceeds FRA Class 4 standards (> 40 mph for freight, > 60 mph for passenger).
Tier II: 80% of core track meets or exceeds FRA Class 3 standards (> 25 mph for freight, > 30 mph for passenger; no signals).
(2) MS Freight Advisory Committee input and Freight User Survey Bottleneck Identification (7) Criteria applies to all public road crossings with active crossing warning devices
(gates and warning signals for Tier I and Tier II crossings). (3) Major freight generators move over 1 million tons or $200 million in value
(4) Undesired Level of Service defined as below LOS C in rural areas and below LOS D for urban areas. (8) Pavement condition is satisfactory if IRI rating on 65% of primary route miles < 95 for Tier I and 60% < 95 for Tier II.
(1) FHWA/ATRI Nationwide Bottleneck Analysis (6) Crash rate greater than 80% of state average for Tier I and 100% for Tier II
Corridor Needs Assessment and Infrastructure Need
Top 10 Statewide Freight Counties Served Monroe
Safety:
Highways: Annual Crash Rate (174/100M vmt) (6)
Rail: RR crossings w/o active warning devices (7)
Infrastructure Condition:
Highways: Pavement & Structures
Rail: Speed/Track (9)
Meets track speed standards outside of one
track segment in Tupelo.
Performance Assessment
Potential Freight Improvement Projects
Notes: * Excludes through freight
Existing ITS Deployments
Corridor Infrastructure Performance
Capacity:
Highways: Level of Service (4)
Rail: % supporting 286k weight limits
Ports: channel depth
Commercial airports: storage volume to
capacity (5)
100% of BNSF mainline supports 286k. Recovery time from flood or drought to 12'
minimum depth
Top Commodities Coal Minerals, Crude petrol Gas, Chemicals Petroleum, Agriculture, Secondary Traffic Others, and Food Tobacco
Fabricated Metal Machinery Equipment, Chemicals Petroleum, Misc Freight, Secondary Traffic Others and Food Tobacco
Major Freight Generators Axiall Corp, Profile Products LLC, Mississippi Gravel Sales Inc
Major Bottlenecks as identified
Freight Flow Characteristics
Annual Freight: Tonnage (millions) /
Value ($ billions)
Annual Inbound/ Outbound/ Intrastate:
Tonnage (millions)*
12.4 / 8.1 / 2.4
21.4 / 16.2 / 5.3
Annual Inbound/ Outbound/ Intrastate:
Value ($ billions)*
$8.4 / $12.5 / $2.3
$14.6 / $25.9 / $2.5
% Freight Flows by Mode
Corridor Freight Infrastructure
Primary Facilities / Operators
Key Connectors
To Port of Itawamba: from US 78: north on
MS 25, west on South Access Route to port
(NHS Intermodal Connector)
MS 302 from I‐55 to US 78
The US 78 (I‐22) / BNSF Corridor runs from Olive Branch to the Alabama border along US 78 (I‐22) and the BNSF rail line,
passing through eight counties in northern Mississippi. These counties account for 14% of total population and 13% of total
employment across the state. The corridor freight tonnage is expected to grow 1.3% annually. Rail freight was the dominant
mode in 2011, accounting for 66% of the total corridor freight. However, truck freight is expected to grow its modal share
from 33% in 2011 to 51% in 2040. By 2040, it is expected that 88% of US 78 within the corridor will be congested. Key
transportation infrastructure in this corridor includes I‐22 and US 78. The corridor runs parallel to BNSF main line that
connects to the KCS in Tupelo and CN in Memphis. The primary commodities shipped through the corridor are coal, crude oil,
and chemicals.
Tier I: US 78 ( I‐22) / BNSF (Olive Branch‐Tupelo‐Fulton) CorridorGeneral Description Corridor Map
Page C‐8 5/15/2015

Highway Rail Ports & Waterways Commercial AirportsUS 61 (also Tier II corridor) from Port of Rosedale to Port of
Natchez
Mississippi River, Yazoo River;
Port of Greenville, Port of Natchez, Port of
Rosedale, Port of Vicksburg, Port of Yazoo,
and Port of Claiborne County
To Port of Greenville: from US 82: 2.8 mi on Harbor Front
Road to port (NHS Intermodal Connector)
The Columbus and Greenville Railway
(CAGY) serves Port of Greenville
To Port of Rosedale: Port Access Rd to Russell Crutcher to MS
8 to US 61 (NHS Intermodal Connector)
The Great River Railroad (GTR) serves Port
of Rosedale.
To Port of Vicksburg : from US 61/I‐20 interchange, west on
Clay St, Cherry St, 1st East St, north on Washington, and west
on Haining Rd to port (NHS Intermodal Connector)
Vicksburg Southern Railroad (VSOR) ‐
connection to Port of Vicksburg
To Port of Natchez: from U.S. 84 / MS 425: Government Fleet
Rd to Magnolia Bluff Rd, L.E. Barry Rd to port (NHS
Intermodal Connector)
Natchez Railway, LLC (NTZR) ‐ former CN
branch to Port of Natchez.
To Port of Yazoo: from I‐55 via MS 3, River Rd, and Levee Rd
to port (NHS Intermodal Connector)
CN mainline to Port of Yazoo
PrePass (US 84 Mississippi River crossing)
Four Mississippi River bridges monitoring:
US 49 bridge in Lula, Mississippi / Helena, Arkansas; US 82
bridge in Greenville, Mississippi / Lake Village, Arkansas; I‐20
bridge in Vicksburg, Mississippi; and US 84 bridge in Natchez,
Mississippi / Ferriday, Louisiana:
‐ Surveillance cameras
‐ Traffic volumes/speeds on approaches
‐ Real Time River Current data sensors
‐ Dynamic Message Signs
‐ Detour monitoring
Highway Rail Ports & Waterways Commercial Airports
2011 8.7 / $4.0
2040 11.4 / $4.9
2011
2040
2011
2040
2011 100%
2040 100%
Average % Truck Mix /
Average Total Daily Volume2011
ATRI (1)
FAC / Freight
User Survey (2)
None identified None identified None identified
Tonnage
Value
Tonnage (3)
Highway Rail Ports & Waterways Commercial Airports
2011
2040
IRI rating (8)
Vertical
clearance
Weight‐
restricted
bridges
Highway Rail Ports & Waterways Commercial AirportsHighways such as US 61, US 82, US 84 and local connectors
provide critical last mile access to the Mississippi River inland
ports.
I‐20 via US 61 provides critical access to the Port of
Vicksburg. The recently implemented ITS bridge and detour
monitoring across Mississippi River in Vicksburg, Greenville,
Natchez, and Lula increase truck volumes/speeds on
approaches.
Last mile rail access is an issue for multiple
MS River ports served by short lines. Port of
Rosedale has no rail access currently, and
all other MS River ports are in need of rail
access, maintenance, modernization, and
capacity improvements.
Mississippi has five public ports
immediately adjacent to the Mississippi
River, and one accessed from the
Mississippi River via the Yazoo River. All are
important to the state's economy (although
Port of Claiborne County currently does not
process any cargo). Inland port alternatives
help keep rates for other modes
competitive. Beyond Mississippi, inland
ports provide feeder service for
international and domestic shipments.
Consider and prioritize improvements to the identified
corridor NHS connectors in highway project programming
due to their role in providing roadway access to the
Mississippi River ports.
US 61 to Haining Rd./ Port of Vicksburg ‐ new roadway to the
port (MULTIPLAN 2035; FAC)
US 61 Business / Haining Rd bridge access to Port of
Vicksburg ‐ bridge replacement with 4 lane bridge
(MULTIPLAN 2035).
Reinstate rail access to the Port of
Rosedale.
Implement Port of Yazoo rail access
improvements: resurfacing grade crossings
and rehabilitation of trackage. (MS State
Rail Plan).
Encourage continued use of the Port of
Vicksburg, Port of Greenville, and Port of
Rosedale through promoting highway and
rail access to port facilities along the I‐20,
US 61, and US 82 through the Intermodal
Connector Improvement Program.
(5) Capacity includes the total storage space for air cargo, ramp space and capacity in tonnage.
Volume refers to cargo volumes in tonnage.
(9) Tier I: all core track meets or exceeds FRA Class 4 standards (> 40 mph for freight, > 60 mph for passenger).
Tier II: 80% of core track meets or exceeds FRA Class 3 standards (> 25 mph for freight, > 30 mph for passenger; no signals).
(2) MS Freight Advisory Committee input and Freight User Survey Bottleneck Identification (7) Criteria applies to all public road crossings with active crossing warning devices
(gates and warning signals for Tier I and Tier II crossings). (3) Major freight generators move over 1 million tons or $200 million in value
(4) Undesired Level of Service defined as below LOS C in rural areas and below LOS D for urban areas. (8) Pavement condition is satisfactory if IRI rating on 65% of primary route miles < 95 for Tier I and 60% < 95 for Tier II.
(1) FHWA/ATRI Nationwide Bottleneck Analysis (6) Crash rate greater than 80% of state average for Tier I and 100% for Tier II
Corridor Needs Assessment and Infrastructure Need
Top 10 Statewide Freight Counties Served Warren, Washington
Safety:
Highways: Annual Crash Rate (174/100M vmt) (6)
Rail: RR crossings w/o active warning devices (7)
Infrastructure Condition:
Highways: Pavement & Structures
Rail: Speed/Track (9)
Performance Assessment
Potential Freight Improvement Projects
Notes: * Excludes through freight
Existing ITS Deployments
Corridor Infrastructure Performance
Capacity:
Highways: Level of Service (4)
Rail: % supporting 286k weight limits
Ports: channel depth
Commercial airports: storage volume to
capacity (5)
Recovery time from flood or drought to 12'
minimum depth
Top Commodities Agriculture, Chemicals Petroleum, Coal Minerals, Crude petrol Gas, Concrete Glass Primary Metal, and Fabricated Metal Machinery Equipment
Agriculture, Chemicals Petroleum, Coal Minerals, Crude petrol Gas, Concrete Glass Primary Metal, and Fabricated Metal Machinery Equipment
Major Freight Generators N Runyon WJ & Son Inc, Monsanto Co, Mars Food US
Major Bottlenecks as identified
Freight Flow Characteristics
Annual Freight: Tonnage (millions) /
Value ($ billions)
Annual Inbound/ Outbound/ Intrastate:
Tonnage (millions)*
4.5 / 4.0 / 0.3
5.1 / 5.9 / 0.3
Annual Inbound/ Outbound/ Intrastate:
Value ($ billions)*
2.2 / 1.6 / 0.2
2.0 / 2.7 / 0.2
% Freight Flows by Mode
Tier I: Mississippi River (Port of Rosedale‐Port of Natchez) CorridorRiver Corridor Map
Corridor Freight Infrastructure
Primary Facilities / Operators
Key Connectors
Waterborne freight movement along Mississippi River provide Mississippi with access to one of the most affordable forms of
freight transportation that tends to relieve highways and rail congestion, has high throughput, is energy efficient, and is a
relatively safe way of moving large amounts of freight. The Mississippi portion of the Mississippi River includes the Port of
Greenville, Port of Natchez, Port of Rosedale, Port of Vicksburg, Port of Yazoo, and Port of Claiborne County. Nearly 9 million
tons of freight flowed through the Mississippi River between Port of Rosedale to Port of Natchez in 2011, of which about 4
million tons originated or terminated in one of six ports in Mississippi. Agriculture, and grain shipments specifically, comprise
the largest share of Mississippi River commerce in Mississippi overall, but petroleum products are the largest commodity
group handled by Mississippi’s ports. Coal, crude oil, concrete glass metals, and fabricated machinery equipment are other
primary commodities handled by the six Mississippi River ports in the state.
Page C‐9 5/15/2015

Highway Rail Ports & Waterways Commercial AirportsMS 25 from Jackson / I‐55 northeast to Starkville / US
82 via Carthage and Louisville (124 miles)
Jackson International Airport
MS 35 from MS 25 in Carthage to MS 12 in Kosciusko,
providing access to Tyson Foods Inc.
MS 475 between I‐20 and MS 25, providing access to
Jackson and Jackson International Airport (NHS
Intermodal Connector south of Jackson International
Airport)
None
Highway Rail Ports & Waterways Commercial Airports
2011 19.7 / $39.7 18.8 / $22.3 < 0.1 / $1.6
2040 34.7 / $79.7 26.1 / $41.3 < 0.1 / $4.4
2011
2040
2011
2040
2011 51% 49% < 0.1%
2040 57% 43% < 0.1%
Average % Truck Mix /
Average Total Daily Volume2011 7% / 8,900
ATRI (1) None
FAC / Freight
User Survey (2)
Jackson area None identified None identified
Tonnage
Value
Tonnage (3)
Highway Rail Ports & Waterways Commercial Airports
2011
7 miles (5%) congested:
‐ I‐55 to Luckney Rd
2040
13 miles (10%) congested:
‐ I‐55 to MS 471
Crash rate: 265
Corridor does not meet Tier II safety performance
criteria.
22 miles (18%) across the corridor with high crash
segments.
IRI rating (8)
IRI score: 89%
14 miles (11%) unacceptable.
High IRI > 95 segments:
‐ I‐55 to Lakeland Dr
‐ Flowood Dr to Holly Bush Rd
‐ Pisgah Rd to MS 43
‐ Old Hwy 25 to MS 12
Vertical
clearance
0 of 9 (0%) restricted
Weight‐
restricted
bridges
0 of 73 (0%) restricted
Highway Rail Ports & Waterways Commercial AirportsLevel of Service: MS 25 provides good LOS with only
short congested segments in Jackson. Multiple
segments of MS 25 in the urban Jackson area are
programmed to be widened.
Safety: MS 25 overall does not meet Tier II safety
performance criteria.
Operations: The corridor passes through a variety of
settings, including urbanized Jackson and small towns,
Jackson International Airport. Its major interchanges
with key statewide facilities (e.g., I‐55) allow for quick
interstate access. It provides regional connection
between Jackson and Starkville /Columbus area. Issues
with operations along the corridor are attributed to
urban congestion in Jackson, with no issues outside
the capitol area.
Physical Condition: Only 11% of MS 25 pavement
miles is unacceptable and overall pavement condition
is not an issue. This corridor is one of the few MFN
corridors that has no issues with bridge vertical
clearance or weight restrictions.
Last‐mile roadway access
improvements can improve
freight flows in and out of
Jackson International Airport.
V/C need to be maintained
below 100% to avoid capacity
shortfall ‐ currently Jackson
airport comfortably meets the
criteria.
Repaving and widening of MS 25 from Grants Ferry Rd
to MS 471 (MDOT STIP/Preliminary Priority List).
Safety improvements along MS 25.
None identified
(5) Capacity includes the total storage space for air cargo, ramp space and capacity in tonnage.
Volume refers to cargo volumes in tonnage.
(9) Tier I: all core track meets or exceeds FRA Class 4 standards (> 40 mph for freight, > 60 mph for passenger).
Tier II: 80% of core track meets or exceeds FRA Class 3 standards (> 25 mph for freight, > 30 mph for passenger; no signals).
(2) MS Freight Advisory Committee input and Freight User Survey Bottleneck Identification (7) Criteria applies to all public road crossings with active crossing warning devices
(gates and warning signals for Tier I and Tier II crossings). (3) Major freight generators move over 1 million tons or $200 million in value
(4) Undesired Level of Service defined as below LOS C in rural areas and below LOS D for urban areas. (8) Pavement condition is satisfactory if IRI rating on 65% of primary route miles < 95 for Tier I and 60% < 95 for Tier II.
(1) FHWA/ATRI Nationwide Bottleneck Analysis (6) Crash rate greater than 80% of state average for Tier I and 100% for Tier II
Corridor Needs Assessment and Infrastructure Need
Top 10 Statewide Freight Counties Served Rankin
Safety:
Highways: Annual Crash Rate (174/100M vmt) (6)
Rail: RR crossings w/o active warning devices (7)
Infrastructure Condition:
Highways: Pavement & Structures
Rail: Speed/Track (9)
Performance Assessment
Potential Freight Improvement Projects
Notes: * Excludes through freight
Existing ITS Deployments
Corridor Infrastructure Performance
Capacity:
Highways: Level of Service (4)
Rail: % supporting 286k weight limits
Ports: channel depth
Commercial airports: storage volume to
capacity (5)
21% in 2008 (MSGM&TS)
Top Commodities Chemicals Petroleum, Coal Minerals, Crude petrol Gas, Food Tobacco, Agriculture, and Secondary Traffic Others
Fabricated Metal Machinery Equipment, Concrete Glass Primary Metal, Misc Freight, Food Tobacco, and Chemicals Petroleum
Major Freight Generators None
Major Bottlenecks as identified
Freight Flow Characteristics
Annual Freight: Tonnage (millions) /
Value ($ billions)
Annual Inbound/ Outbound/ Intrastate:
Tonnage (millions)*
9.4 / 5.8 / 4.8
12.6 / 9.3 / 9.3
Annual Inbound/ Outbound/ Intrastate:
Value ($ billions)*
$9.1 / $9.3 / $3.7
$18.2 / $19.3 / $6.0
% Freight Flows by Mode
Corridor Freight Infrastructure
Primary Facilities / Operators
Key Connectors
Tier II: MS 25 (Jackson‐Louisville‐Starkville) CorridorGeneral Description Corridor Map
KCS mainline from West Point south to
Newton, serving Starkville and Louisville
The MS 25 Tier II Corridor runs northeast from Jackson to Starkville. Truck freight was the dominant mode in 2011,
accounting for 51% of the total corridor freight by tonnage. Truck is also the dominant mode in the corridor by the
value of moved freight. Truck freight is expected to grow its modal share from 51% in 2011 to 57% in 2040. The
corridor currently experiences no congestion and by 2040 less than 10% of its length will be congested. Key
transportation infrastructure in this corridor includes MS 25, and Jackson International Airport. There are no mainline
rail tracks parallel to MS 25, but KCS mainline from Starkville to Newton provides access to multiple towns along the
MS 25 corridor. The primary commodities shipped through the corridor is petroleum chemicals, coal, and crude oil.
Page C‐10 5/15/2015

Highway Rail Ports & Waterways Commercial AirportsMS 27 from I‐20 in Vicksburg to I‐55 in Crystal Springs via
Utica (41 miles)
No primary rail
MS 18 from MS 27 in Utica to MS 467 in Raymond
MS 18 from MS 27 in Utica to US 61 in Port Gibson
None
Highway Rail Ports & Waterways Commercial Airports
2011 10.1 / $14.8 36.0 / $40.9 3.4 / $1.8
2040 18.8 / $35.4 51.0 / $47.1 3.2 / $1.2
2011
2040
2011
2040
2011 21% 73% 7%
2040 26% 70% 4%
Average % Truck Mix /
Average Total Daily Volume2011 6% / 3,400
ATRI (1) None
FAC / Freight
User Survey (2)
MS 18 between Raymond and Port Gibson
Tonnage
Value
Tonnage (3)
Highway Rail Ports & Waterways Commercial Airports
2011
0 miles (0%) congested
20400 miles (0%) congested
Crash rate: 316
Corridor does not meet Tier II safety performance criteria.
12 miles (28%) across the corridor with high crash segments.
IRI rating (8)
IRI score: 56%
19 miles (43%) unacceptable.
Corridor below Tier II performance target.
High IRI > 95 segments:
‐ I‐20 to Raxton Rd
‐ Pine St to I‐55
Vertical
clearance
0 of 2 bridges (0%) deficient
Weight‐
restricted
bridges
2 of 9 (22%) restricted
Highway Rail Ports & Waterways Commercial AirportsLevel of Service: MS 27 provides good LOS with minimal
existing and forecasted congestion. A few segments of MS 25
around MS 18 are programmed to be widened.
Safety: MS 27 does not meet Tier II safety performance
criteria. 28% of corridor miles do not meet the
recommended safety standard.
Operations: The corridor is a significant regional link for
trucks bypassing Jackson and also accessing major freight
activity centers in the area, particularly near the junction of
MS 27 and I‐55. It provides a quick short‐cut between I‐20
and I‐55. Issues with operations along the corridor are
attributed to congestion in suburban Jackson, with
intersecting MS 18 reported to have more issues than MS 27.
Increasing urbanization southwest of Jackson in the corridor
area might adversely impact truck flows in the future due to
potential truck / passenger auto conflicts and capacity
constraints.
Physical Condition: The corridor does not meet Tier II
pavement condition criteria, with IRI rating better than 95
for less than 65% of primary route miles ‐ 56%. 43% of MS 27
pavement miles is unacceptable and overall pavement
condition is an issue, with pavement condition worst of all
Tier II corridors. Weight restricted bridges impact freight
flows, with 22% of MS 27 bridges deficient.
Safety improvements along MS 27.
MS 27 pavement management program.
Reconstruct two MS 27 bridges to lift weight restrictions.
(5) Capacity includes the total storage space for air cargo, ramp space and capacity in tonnage.
Volume refers to cargo volumes in tonnage.
(9) Tier I: all core track meets or exceeds FRA Class 4 standards (> 40 mph for freight, > 60 mph for passenger).
Tier II: 80% of core track meets or exceeds FRA Class 3 standards (> 25 mph for freight, > 30 mph for passenger; no signals).
(2) MS Freight Advisory Committee input and Freight User Survey Bottleneck Identification (7) Criteria applies to all public road crossings with active crossing warning devices
(gates and warning signals for Tier I and Tier II crossings). (3) Major freight generators move over 1 million tons or $200 million in value
(4) Undesired Level of Service defined as below LOS C in rural areas and below LOS D for urban areas. (8) Pavement condition is satisfactory if IRI rating on 65% of primary route miles < 95 for Tier I and 60% < 95 for Tier II.
(1) FHWA/ATRI Nationwide Bottleneck Analysis (6) Crash rate greater than 80% of state average for Tier I and 100% for Tier II
Corridor Needs Assessment and Infrastructure Need
Top 10 Statewide Freight Counties Served Hinds, Warren, Copiah
Safety:
Highways: Annual Crash Rate (174/100M vmt) (6)
Rail: RR crossings w/o active warning devices (7)
Infrastructure Condition:
Highways: Pavement & Structures
Rail: Speed/Track (9)
Performance Assessment
Potential Freight Improvement Projects
Notes: * Excludes through freight
Existing ITS Deployments
Corridor Infrastructure Performance
Capacity:
Highways: Level of Service (4)
Rail: % supporting 286k weight limits
Ports: channel depth
Commercial airports: storage volume to
capacity (5)
Top Commodities byCoal Minerals, Crude petrol Gas, Chemicals Petroleum, Agriculture, Paper Printed Matter, and Food Tobacco
Chemicals Petroleum, Misc Freight, Fabricated Metal Machinery Equipment, Secondary Traffic Others, and Concrete Glass Primary Metal
Major Freight Generators served by Blain Sand & Gravel Inc, N Runyon WJ & Son Inc.
Major Bottlenecks as identified by
Freight Flow Characteristics
Annual Freight: Tonnage (millions) /
Value ($ billions)
Annual Inbound/ Outbound/ Intrastate:
Tonnage (millions)*
12.3 / 7.1 / 3.4
15.4 / 11.9 / 5.2
Annual Inbound/ Outbound/ Intrastate:
Value ($ billions)*
$9.7 / $10.9 / $1.8
$16.4 / $27.6 / $2.6
% Freight Flows by Mode
Corridor Freight Infrastructure
Primary Facilities / Operators
Key Connectors
The MS 27 Tier II Corridor runs southeast from Vicksburg to Crystal Springs via Utica. Nearby rail freight was the dominant
mode in 2011, accounting for 73% of the total corridor freight by tonnage. Rail is also the dominant mode in the corridor by
the value of moved freight. Truck freight is expected to grow its modal share from 21% in 2011 to 26% in 2040. Trucks are
able to use MS 27 to connect between I‐20 and I‐55 within having to drive through Jackson. This bypass of the Jackson area
also provides access to some of the largest freight generators by tonnage in the state near the interchange of I‐55 and MS 27
in Copiah County. The MS 27 Corridor currently experiences and is forecast to experience no roadway congestion. Key
transportation infrastructure in this corridor includes MS 27. Although there are no mainline rail tracks parallel to MS 27,
both the KCS mainline flows (running parallel to I‐20) and CN mainline flows (parallel to I‐55) are captured as part of this
corridor's overall flows due to their proximity. The primary commodities shipped through the corridor is coal and other
minerals, crude oil, and chemicals petroleum.
Tier II: MS 27 (Vicksburg‐Utica‐Crystal Springs) CorridorGeneral Description Corridor Map
Page C‐11 5/15/2015

Highway Rail Ports & Waterways Commercial AirportsUS 45: north‐south Tennessee border via Corinth‐Meridian
route, continuing south to Mobile, Alabama (266 miles)
KCS / Artesia subdivision mainline: north‐
south Corinth‐Meridian route (212 miles)
Port of Aberdeen, Clay County Port,
Lowndes County Port, Port of Amory
To Port of Aberdeen: from US 45 via Port
Access Rd to the port (NHS Intermodal
Connector)
To Port of Amory: from US 45 east on US
278, Waterway Dr, and Port Access Road to
port (NHS Intermodal Connector)
To Lowndes County Port: From US 45: on
MS 182 to the port (NHS Intermodal
Connector)
WIM (US 45 at the Tennessee border)
Highway Rail Ports & Waterways Commercial Airports
2011 20.6 / $20.3 69.9 / $71.3 0.8 / $0.4
2040 41.1 / $44.8 80.9 / $125.3 1.4 / $1.0
2011
2040
2011
2040
2011 23% 77% 1%
2040 33% 66% 1%
Average % Truck Mix /
Average Total Daily Volume2011 11% / 9,000
ATRI (1) None
FAC / Freight
User Survey (2)
Columbus None identified None identified
Tonnage
Value
Tonnage (3)
Highway Rail Ports & Waterways Commercial Airports
2011 0 miles (0%) congested
2040
23 miles (8%) congested:
‐ US 278 to Euclautubba Rd in Tupelo
‐ Golding Rd Warriner Rd south of Corinth
Crash rate: 112
37 miles (14%) across the corridor with high crash segments.
12 crossings of 15 (80%) do not have Active
2 warning devices.
IRI rating (8)
IRI score: 88%
31 miles (11%) unacceptable.
High IRI > 95 segments:
‐ Tennessee State Line to US 72
‐ MS 178 to MS 6
‐ MS 76 to Brewer Rd
‐ Noah Curtis Rd to Pine Grove Rd
‐ Strong Rd to W Hazelwood Rd
‐ Lone Oak Dr to Sumter Rd
‐ Townsend Rd to Dan Whitsett Rd
‐ I‐20 to MS 145
Vertical
clearance
0 of 35 bridges (0%) deficient
Weight‐
restricted
bridges
0 of 217 (0%) restricted
Highway Rail Ports & Waterways Commercial AirportsLevel of Service: US 45 provides acceptable LOS with minimal
existing and forecasted congestion. FAC cited the Columbus
area as experiencing congestion. No segments of US 45 are
programmed to be widened.
Safety: US 45 overall is a relatively safe highway corridor. US
45 corridor is the only Tier II corridor with a crash rate better
than Tier II average.
Operations: The corridor functions well and is a significant
regional freight link providing access to area freight
generators and emerging manufacturing activity centers. US
45 provides quick access to I‐20, I‐22/US 78, US 82, and US
72. The planned Columbus Bypass will improve freight flows
along the corridor and provide quicker access to area ports.
Physical Condition: 11% of US 45 pavement miles is
unacceptable but overall condition is not an issue.
Capacity: Rail freight flows are more
dominant on a percentage basis than truck
freight flows within the corridor, but a
significant portion of the KCS mainline is
not able to handle 286k weight limit. Only
some rail spurs to the river ports can handle
286k weight limits.
Safety: 80% the railroad crossings do not
have Active 2 warning devices.
Physical Condition: FRA track speed
standards are not met from Corinth to
Tupelo.
Class I railroads (KCS and BNSF) directly
serve several of the Tenn–Tom Waterway
System ports in the corridor. Port of
Aberdeen has no existing direct rail
connection.
The quality of last mile access rail service
provided by other short line carriers
depends on these Class I connections.
Last mile roadway access is also critical
since none of the river ports are served
directly by US 45, but rather via collectors
and local streets that connect to US 45.
None identified Upgrade the KCS mainline from Corinth to
West Point to handle 286k weight limit.
KCS mainline core track improvements from
Corinth to Tupelo to to raise line speed.
Upgrade all public corridor crossings along
the KCS mainline with at least Active 2
warning devices.
Port of Amory ‐ BNSF: upgrade 12 rail
bridges between Amory and Columbus to
permit 286k loads (MULTIPLAN 2035 and
MS State Rail Plan).
Port of Aberdeen: construct 3.2‐mile
connection track (MULTIPLAN 2035 and MS
State Rail Plan).
(5) Capacity includes the total storage space for air cargo, ramp space and capacity in tonnage.
Volume refers to cargo volumes in tonnage.
(9) Tier I: all core track meets or exceeds FRA Class 4 standards (> 40 mph for freight, > 60 mph for passenger).
Tier II: 80% of core track meets or exceeds FRA Class 3 standards (> 25 mph for freight, > 30 mph for passenger; no signals).
(2) MS Freight Advisory Committee input and Freight User Survey Bottleneck Identification (7) Criteria applies to all public road crossings with active crossing warning devices
(gates and warning signals for Tier I and Tier II crossings). (3) Major freight generators move over 1 million tons or $200 million in value
(4) Undesired Level of Service defined as below LOS C in rural areas and below LOS D for urban areas. (8) Pavement condition is satisfactory if IRI rating on 65% of primary route miles < 95 for Tier I and 60% < 95 for Tier II.
(1) FHWA/ATRI Nationwide Bottleneck Analysis (6) Crash rate greater than 80% of state average for Tier I and 100% for Tier II
Corridor Needs Assessment and Infrastructure Need
Top 10 Statewide Freight Counties Served Lowndes, Monroe
Safety:
Highways: Annual Crash Rate (174/100M vmt) (6)
Rail: RR crossings w/o active warning devices (7)
Infrastructure Condition:
Highways: Pavement & Structures
Rail: Speed/Track (9)
KCS mainline does not meet speed track
speed standards from Corinth to Tupelo.
Performance Assessment
Potential Freight Improvement Projects
Notes: * Excludes through freight
Existing ITS Deployments
Corridor Infrastructure Performance
Capacity:
Highways: Level of Service (4)
Rail: % supporting 286k weight limits
Ports: channel depth
Commercial airports: storage volume to
capacity (5)
Only about half of the KCS trackage
between Corinth and Meridian handles
286k weight limit.
Recovery time from flood or drought to 12'
minimum depth
Top Commodities Coal Minerals, Crude petrol Gas, Chemicals Petroleum, Concrete Glass Primary Metal, Food Tobacco, and Misc Freight
Misc Freight, Chemicals Petroleum, Fabricated Metal Machinery Equipment, Concrete Glass Primary Metal, and Food Tobacco
Major Freight Generators Axiall Corp, Mississippi Gravel Sales Inc, Holcim US Inc
Major Bottlenecks as identified
Freight Flow Characteristics
Annual Freight: Tonnage (millions) /
Value ($ billions)
Annual Inbound/ Outbound/ Intrastate:
Tonnage (millions)*
12.0 / 9.6 / 5.4
23.0 / 16.8 / 9.8
Annual Inbound/ Outbound/ Intrastate:
Value ($ billions)*
$9.4 / $10.6 / $3.9
$16.0 / $25.6 / $5.7
% Freight Flows by Mode
Corridor Freight Infrastructure
Primary Facilities / Operators
Key Connectors
Rail service access to Lowndes County Port
provided by KCS and Columbus and
Greenville Railway (CAGY)
NHS Connectors to the corridor's ports (listed under 'Ports &
Waterways')
The US 45 / KCS Tier II Corridor runs north‐south through the eastern portion of the state along US 45 and the KCS rail line,
and parallel to the Tennessee‐Tombigbee Waterway, a designated national marine highway. Rail freight was the dominant
mode in 2011, accounting for 77% of the total corridor freight by tonnage. Rail is also the dominant mode in the corridor by
the value of moved freight. Truck freight is expected to grow its modal share from 23% in 2011 to 23% in 2040. The corridor
currently experiences no congestion and by 2040 less than 10% of its length will be congested. Key transportation
infrastructure in this corridor includes US 45, KCS mainline and six river ports on the Tennessee‐Tombigbee Waterway.
Although the four river ports closest to US 45 and KCS mainline do not move high amount of freight by tonnage or value, they
are still critical elements of the regional and statewide MS economy. The primary commodities shipped through the corridor
is coal, crude oil, and petroleum chemicals.
Tier II: US 45 / KCS (Corinth‐Meridian‐Waynesboro) CorridorGeneral Description Corridor Map
Page C‐12 5/15/2015

Highway Rail Ports & Waterways Commercial AirportsUS 61 north‐south from Memphis /Tennessee border to Louisiana border
(317 miles)
No primary rail Port of Natchez, Port of Rosedale, Port of
Vicksburg, Port of Greenville, Port of
Claiborne County
US 49 from US 61 to US 49 Mississippi River bridge in Lula
MS 8 from US 61 in Cleveland to Rosedale
US 61 Business from I‐20 north and south on Washington St to Haining
Rd and Port of Vicksburg
The Great River Railroad (GTR) between
Greenville and Rosedale and serves the Port
of Rosedale. Note: GTR has been out of
service for 10 years.
To Port of Rosedale: Port Access Rd to
Russell Crutcher to MS 8 to US 61 (NHS
Intermodal Connector)
US 84 / MS 425 from US 61 to US 84 Mississippi River bridge in Natchez Natchez Railway, LLC (NTZR) ‐ former CN
branch from Brookhaven to the Port of
Natchez
To Port of Natchez: from U.S. 84 / MS 425:
Government Fleet Rd to Magnolia Bluff Rd,
L.E. Barry Rd to port (NHS Intermodal
Connector)
US 84 from US 61 in Natchez east to I‐55/ Brookhaven
US 82 from US 61 in Leland west to Greenville
US 278/MS 6 from US 61 (Clarksville) to I‐55 (Batesville)
WIM
PrePass (US 84 Mississippi River crossing)
Mississippi River bridges monitoring:
‐ US 49 bridge in Lula, Mississippi / Helena, Arkansas; and US 84 bridge in
Natchez, Mississippi / Ferriday, Louisiana:
‐ Surveillance cameras
‐ Traffic volumes/speeds on approaches
‐ Real Time River Current data sensors
‐ Dynamic Message signs
‐ Detour monitoring
Highway Rail Ports & Waterways Commercial Airports2011 51.0 / $71.7 56.5 / $60.9 8.7 / $4.0
2040 80.4 / $119.7 67.7 / $112.9 11.4 / $4.9
2011
2040
2011
2040
2011 44% 49% 8%
2040 50% 42% 7%
Average % Truck Mix /
Average Total Daily Volume2011 8% / 6,800
ATRI (1) None
FAC / Freight
User Survey (2)
MS 6 (US 278) east of US 61 to I‐55 None identified From US 61 to Port of Vicksburg
From US 61 to Port of Natchez
Tonnage
Value
Tonnage (3)
Highway Rail Ports & Waterways Commercial Airports2011 0 miles (0%) congested
2040
14 miles (4%) congested:
‐ US 425 to US 61 BUS in Natchez
‐ MS 547 to MS 18 in Port Gibson
‐ Grange Hall Rd to US 61 BUS in Vicksburg
‐ US 80 to Culkin Rd in Vicksburg
‐ MS 8 to E Rosemary Rd in Cleveland
‐ I‐69 to MS 304 in Robinsonville
‐ MS 302 to Tennessee Sate Line
Crash rate: 225
Corridor does not meet Tier II safety performance criteria.
62 miles (19%) across the corridor with high crash segments.
IRI rating (8)
IRI score: 85%
41 miles (13%) unacceptable.
High IRI > 95 segments:
‐ Mcknight Rd to South St
‐ US 82 to Kennedy Flat Rd
‐ MS 12 to MS 436
‐ Southdale Rd to MS 16
‐ Fork Creek Rd to Magnolia Dr
‐ Blanto Rd to MS 1
‐ Culkin Rd to I‐20
‐ Allen Station Rd to Big Black Creek
‐ MS 18 to MS 547
‐ Old US 84 to Lynda Lee Dr
‐ John R Junkin Dr to Col John Pitchford Pkwy
‐ Will Washington Rd to Hyde Park Rd
‐ Buffalo Rd to MS 563
‐ Byrd Rd to MS 24
Vertical
clearance
0 of 12 bridges (0%) deficient
Weight‐
restricted
bridges
0 of 116 (0%) restricted
Highway Rail Ports & Waterways Commercial AirportsLevel of Service: US 61 provides good LOS with minimal existing and
forecasted congestion. No segments of US 61 are programmed to be
widened outside of its future connection to I‐69.
Safety: US 61 overall does not meet Tier II safety performance criteria.
Operations: The corridor due to its length and functional classification
passes through a variety of settings, including small towns, major
interchanges with key statewide facilities (e.g., I‐20), and rural areas. It
provides access to major freight generators along the corridor, and MS
River ports. Issues with operations along the corridor are localized or
regional, rather than corridor‐wide. Once I‐69 is completed, US 61 will
gain in significance as a major access link to Memphis via I‐69.
The recently implemented ITS bridge and detour monitoring across
Mississippi River in Natchez and Lula should benefit truck flows by
increasing truck volumes/speeds on approaches.
Physical Condition: 13% of US 61 pavement miles is unacceptable but
overall condition is not an issue.
US 61 and local streets connecting to it
provide critical last mile access to multiple
ports in the area. Inadequate roadway
access to Port of Vicksburg has been cited
as an issue by the FAC.
Safety improvements along US 61. US 61 Business / Haining Rd bridge access to
Port of Vicksburg ‐ bridge replacement with
4 lane bridge (MULTIPLAN 2035).
US 61 to Haining Rd / Port of Vicksburg ‐
new roadway to the port (MULTIPLAN 2035;
FAC).
Notes: * Excludes through freight
(1) FHWA/ATRI Nationwide Bottleneck Analysis (6) Crash rate greater than 80% of state average for Tier I and 100% for Tier II
(2) MS Freight Advisory Committee input and Freight User Survey Bottleneck Identification (7) Criteria applies to all public road crossings with active crossing warning devices
(gates and warning signals for Tier I and Tier II crossings). (3) Major freight generators move over 1 million tons or $200 million in value
(4) Undesired Level of Service defined as below LOS C in rural areas and below LOS D for urban areas. (8) Pavement condition is satisfactory if IRI rating on 65% of primary route miles < 95 for Tier I and 60% < 95 for Tier II.
(5) Capacity includes the total storage space for air cargo, ramp space and capacity in tonnage.
Volume refers to cargo volumes in tonnage.
(9) Tier I: all core track meets or exceeds FRA Class 4 standards (> 40 mph for freight, > 60 mph for passenger).
Tier II: 80% of core track meets or exceeds FRA Class 3 standards (> 25 mph for freight, > 30 mph for passenger; no signals).
Infrastructure Condition:
Highways: Pavement & Structures
Rail: Speed/Track (9)
Corridor Needs Assessment and Infrastructure Need
Performance Assessment
Potential Freight Improvement Projects
Safety:
Highways: Annual Crash Rate (174/100M vmt) (6)
Rail: RR crossings w/o active warning devices (7)
Top 10 Statewide Freight Counties Served Warren, Washington
Existing ITS Deployments
Corridor Infrastructure Performance
Top Commodities
Capacity:
Highways: Level of Service (4)
Rail: % supporting 286k weight limits
Ports: channel depth
Commercial airports: storage volume to
capacity (5)
Recovery time from flood or drought to 12'
minimum depth
N Runyon WJ & Son IncMajor Freight Generators
Key Connectors
Major Bottlenecks as identified
Freight Flow Characteristics
Annual Freight: Tonnage (millions) /
Value ($ billions)
Annual Inbound/ Outbound/ Intrastate:
Tonnage (millions)*
19.3 / 16.1 / 2.7
26.5 / 27.3 / 4.3
Annual Inbound/ Outbound/ Intrastate:
Value ($ billions)*
$15.3 / $18.0 / $1.2
$25.6 / $36.1 / $1.6
The Columbus and Greenville Railway
(CAGY) between Columbus and Greenville
to the Port of Greenville
% Freight Flows by Mode
Tier II: US 61 (Southaven‐Vicksburg‐Woodville) CorridorGeneral Description Corridor Map
The US 61 Tier II Corridor runs north‐south through the western portion of the state along US 61, parallel to the Mississippi River, and
near its multiple ports. At 317 miles, this is the longest of all MFN corridors. Although there are no key mainline routes along the corridor
and major freight origins and destinations are served by multiple short lines, rail freight was the dominant mode in 2011, accounting for
49% of the total corridor freight by tonnage. Truck freight is expected to grow its modal share from 44% in 2011 to 50% in 2040 and
overtake rail as number one mode. With multiple MS River ports, the US 61 Corridor has the largest percentage of waterborne freight
flows of all Tier II Corridors (outside the water‐only Tennessee‐Tombigbee Waterway Corridor). US 61 currently experiences and is
forecasted to experience no congestion. Key transportation infrastructure in this corridor includes US 61 and four Mississippi River ports.
The primary commodities shipped through the corridor are chemicals / petroleum, crude oil, and coal.
Corridor Freight Infrastructure
Primary Facilities / Operators
Chemicals Petroleum, Coal Minerals, Crude petrol Gas, Food Tobacco, Agriculture, and Secondary Traffic Others
Chemicals Petroleum, Misc Freight, Fabricated Metal Machinery Equipment, Concrete Glass Primary Metal, and Food Tobacco
To Port of Greenville: from US 61 to US 82
and 2.8 mi on Harbor Front Road to port
(NHS Intermodal Connector)
The Vicksburg Southern Railroad (VSOR)
connects to the Port of Vicksburg and north
to Redwood. VSOR interchanges with KCS in
Vicksburg.
To Port of Vicksburg : from US 61/I‐20
interchange, west on Clay St, Cherry St, 1st
East St, north on Washington, and west on
Haining Rd to port (NHS Intermodal
Connector)
Page C‐13 5/15/2015

Highway Rail Ports & Waterways Commercial AirportsUS 72 west‐east from Tennessee border to Alabama
border (90 miles)
NS Crescent Corridor mainline between
Chattanooga and Memphis, with a short
segment of 17 miles passing through
northeastern Mississippi, parallel to US 72
(36 miles)
Yellow Creek Port
MS 25 from US 72 south to MS 30 / Tishomingo and
access to DuraClass plant
Yellow Creek Port Railroad (YCRK) operated
by KCS: 10 miles from Sharp, Mississippi, to
Counce, Tennessee, to Yellow Creek Port
where it terminates
To Yellow Creek Port:
North Connector: from US 72, north on MS
25, east on Port Access Rd (CR 370), west
along CR 351 to terminals
South Connector: from US 72 south along
MS 365 to the Port Access Rd, to port (NHS
Intermodal Connectors)
WIM
Highway Rail Ports & Waterways Commercial Airports
2011 21.3 / $33.9 48.0 / $35.0 0.9 / $0.4
2040 48.2 / $79.8 44.9 / $61.8 0.9 / $0.3
2011
2040
2011
2040
2011 30% 68% 1%
2040 51% 48% 1%
Average % Truck Mix /
Average Total Daily Volume2011 16% / 9,700
ATRI (1) None
FAC / Freight
User Survey (2)
US 72 in Corinth None identified None identified
Tonnage
Value
Tonnage (3)
Highway Rail Ports & Waterways Commercial Airports
2011 0 miles (0%) congested
2040
1 miles (1%) congested:
‐ US 45 to MS 145 in Corinth
Crash rate: 230
Corridor does not meet Tier II safety performance
criteria.
16 miles (18%) across the corridor with high crash
segments.
2 crossings of 2 (100%) do not have Active
2 warning devices.
IRI rating (8)
IRI score: 82%
16 miles (18%) unacceptable.
High IRI > 95 segments:
‐ US 45 to S Cass St
‐ MS 304 to MS 300
‐ Front St to MS 365
‐ MS 172 to Alabama State Line
Vertical
clearance
0 of 3 bridges (0%) deficient
Weight‐
restricted
bridges
0 of 60 (0%) restricted
Highway Rail Ports & Waterways Commercial AirportsLevel of Service: US 72 provides good LOS with
minimal existing and forecasted congestion. No
segments of US 72 are programmed to be widened,
but its short segment from MS 302 to TN border is on
MDOT's Preliminary Priority List for widening. The FAC
did report that congestion can be a localized issue
along US 72 in Corinth. As trucks as percentage of
freight flows by mode is projected to increase by 70%
between now and 2040, the number of trucks along
the corridor is bound to increase as well.
Safety: US 72 Corridor does not meet Tier II safety
performance criteria.
Operations: The corridor functions well and is a
significant regional freight link providing access to
Memphis and relief to US 78/I‐22 corridor.
Physical Condition: 18% of US 72 pavement miles is
unacceptable but overall condition is certainly not an
issue today. With the projected increase in percentage
of trucks using the corridor, pavement condition might
deteriorate in the future.
Capacity: The NS mainline is part of the
Crescent Corridor that extends from
Louisiana to New Jersey and passes
through Mississippi briefly on its section
connecting Chattanooga and Memphis. The
NS mainline is able to handle 286k weight
limit.
Safety: All public railroad crossings on the
NS mainline within Mississippi borders do
not have Active 2 warning devices.
US 72 via MS 25 and MS 365 provides
critical roadway last mile access to the
Yellow Creek Port.
The Yellow Creek Port Railroad (YCRK)
short line operated by KCS provides direct
access to the port but is reportedly in need
of rehabilitation (MS State Rail Plan &
Multiplan 2035).
Safety improvements along US 72. Upgrade all public corridor crossings along
the NS mainline with at least Active 2
warning devices.
Rehabilitate the 10‐mile Yellow
Creek Railroad connecting Yellow
Creek State Inland Port to KCS
(MS State Rail Plan & Multiplan 2035).
(5) Capacity includes the total storage space for air cargo, ramp space and capacity in tonnage.
Volume refers to cargo volumes in tonnage.
(9) Tier I: all core track meets or exceeds FRA Class 4 standards (> 40 mph for freight, > 60 mph for passenger).
Tier II: 80% of core track meets or exceeds FRA Class 3 standards (> 25 mph for freight, > 30 mph for passenger; no signals).
(2) MS Freight Advisory Committee input and Freight User Survey Bottleneck Identification (7) Criteria applies to all public road crossings with active crossing warning devices
(gates and warning signals for Tier I and Tier II crossings). (3) Major freight generators move over 1 million tons or $200 million in value
(4) Undesired Level of Service defined as below LOS C in rural areas and below LOS D for urban areas. (8) Pavement condition is satisfactory if IRI rating on 65% of primary route miles < 95 for Tier I and 60% < 95 for Tier II.
Performance Assessment
Potential Freight Improvement Projects
Notes: * Excludes through freight
(1) FHWA/ATRI Nationwide Bottleneck Analysis (6) Crash rate greater than 80% of state average for Tier I and 100% for Tier II
Existing ITS Deployments
Corridor Infrastructure Performance
Capacity:
Highways: Level of Service (4)
Rail: % supporting 286k weight limits
Ports: channel depth
Commercial airports: storage volume to
capacity (5)
The NS mainline handles 286k weight limit. Recovery time from flood or drought to 12'
minimum depth
Major Freight Generators None
Top Commodities Coal Minerals, Crude petrol Gas, Secondary Traffic Others, Chemicals Petroleum, Food Tobacco, and Concrete Glass Primary Metal
Fabricated Metal Machinery Equipment, Misc Freight, Secondary Traffic Others, Chemicals Petroleum, and Food Tobacco
Corridor Needs Assessment and Infrastructure Need
Top 10 Statewide Freight Counties Served None
Safety:
Highways: Annual Crash Rate (174/100M vmt) (6)
Rail: RR crossings w/o active warning devices (7)
Infrastructure Condition:
Highways: Pavement & Structures
Rail: Speed/Track (9)
Not enough sufficient data points to draw
conclusions.
Corridor Freight Infrastructure
Primary Facilities / Operators
Key Connectors
Major Bottlenecks as identified
Freight Flow Characteristics
Annual Freight: Tonnage (millions) /
Value ($ billions)
Annual Inbound/ Outbound/ Intrastate:
Tonnage (millions)*
5.5 / 4.6 / 0.3
11.7 / 10.3 / 0.8
Annual Inbound/ Outbound/ Intrastate:
Value ($ billions)*
$3.9 / $4.9 / $0.3
$8.4 / $13.5 / $0.4
% Freight Flows by Mode
Tier II: US 72 / NS (Mt. Pleasant‐Corinth‐Iuka) CorridorGeneral Description Corridor Map
The US 72 / NS Tier II Corridor runs west‐east through the northern portion of the state along US 72, with NS Crescent
Corridor mainline parallel to the highway facility in the northeastern section of the corridor. Rail freight was the
dominant mode in 2011, accounting for 68% of the total corridor freight by tonnage. Truck freight is expected to grow
its modal share from 30% in 2011 to 51% in 2040 and overtake rail as number one mode. The Yellow Creek Port
located on Tenn‐Tombigbee Waterway is served by a short line spur operated by KCS. US 72 currently experiences
and is forecasted to experience no congestion. Key transportation infrastructure in this corridor includes US 72, NS
mainline, and Yellow Creek Port. The primary commodities shipped through the corridor is coal, minerals, and crude
oil.
Page C‐14 5/15/2015

Highway Rail Ports & Waterways Commercial AirportsUS 82 from Greenville / Arkansas state line east to Columbus /
Alabama state line (179 miles)
None (short lines only) Lowndes County Port, Port of Greenville
The Columbus and Greenville Railway
(CAGY) between Columbus and Greenville,
parallel to US 82. The Port of Greenville is
served by CAGY, and CN ‐ Greenwood
interchange connection is CAGY's largest.
Lowndes County Port in Columbus is also
served by CAGY (and a KCS spur).
To Lowndes County Port: from US 82: 2.7 mi
on Port Access Road to port (NHS
Intermodal Connector)
The Great River Railroad (GTR) between
Greenville and Rosedale serves the Port of
Rosedale. Note: GTR has been out of service
for 10 years (MS State Rail Plan).
To Port of Greenville: from US 82: 2.8 mi on
Harbor Front Road to port (NHS Intermodal
Connector)
WIM (Greenville)
Mississippi River bridge monitoring: US 82 bridge in Greenville,
Mississippi / Lake Village, Arkansas:
‐ Surveillance cameras
‐ Traffic volumes/speeds on approaches
‐ Real Time River Current data sensors
‐ Dynamic Message signs
‐ Detour monitoring
Highway Rail Ports & Waterways Commercial Airports2011 15.0 / $13.4 31.2 / $25.6 2.9 / $1.3
2040 25.7 / $34.4 41.3 / $45.7 3.4 / $1.7
2011
2040
2011
2040
2011 31% 64% 6%
2040 37% 59% 5%
Average % Truck Mix /
Average Total Daily Volume2011 9% / 10,000
ATRI (1) None
FAC / Freight
User Survey (2)
US 82 in Columbus None identified None identified
Tonnage
Value
Tonnage (3)
Highway Rail Ports & Waterways Commercial Airports2011 0 miles (0%) congested
2040
8 miles (5%) congested:
‐ US 49E to Main St in Greenwood
‐ US 45 to Military Rd in Greenwood
Crash rate: 211
Corridor does not meet Tier II safety performance criteria.
35 miles (20%) across the corridor with high crash segments.
IRI rating (8)
IRI score: 61%
69 miles (38%) unacceptable.
High IRI > 95 segments:
‐ MS 454 to S Raceway Rd
‐ Airport Rd to US 49 W
‐ Schiey St to Cow Rd
‐ MS 35 to Middleton Rd
‐ Bailey Rd to Grady Rd
‐ County line Rd to MS 182
‐ Camps Airport Rd to MS 791
‐ Plymouth Bluff Access Rd to Military Rd
Vertical
clearance
0 of 13 bridges (0%) deficient
Weight‐
restricted
bridges
0 of 113 (0%) restricted
Highway Rail Ports & Waterways Commercial AirportsLevel of Service: US 82 provides good LOS with minimal existing
and forecasted congestion. The FAC identified US 82 in Columbus
as congested. No segments of US 82 are programmed to be
widened.
Safety: US 82 does not meet Tier II safety performance criteria.
Operations: The corridor due to its length and functional
classification passes through a variety of settings, including
regional freight activity centers (manufacturing: Columbus;
rail/highway intermodal terminal: Greenwood (CN/truck); major
interchanges with key statewide facilities (e.g., I‐55 in Winona),
major inland ports (Port of Greenville, and Lowndes County Port)
and rural coal mining areas. Issues with operations along the
corridor are localized, rather than corridor‐wide ‐ e.g., congestion
along US 82 in Columbus cited by the FAC.
The recently implemented ITS bridge and detour monitoring across
Mississippi River in Greenville should benefit truck flows by
increasing truck volumes/speeds on approaches.
Physical Condition: The corridor does not meet Tier II pavement
condition criteria, with IRI rating better than 95 for less than 65%
of primary route miles ‐ 61%. 38% of US 82 pavement miles (69
miles) is unacceptable. US 82 is the second worst faring Tier II
corridor by IRI rating, behind MS 27.
Although there are no key rail facilities
within the corridor, the CAGY short line has
potential to provide long distance east‐west
freight rail service along the corridor.
Unfortunately, continuous east‐west CAGY
operations were suspended in 2002 due to
line and bridge conditions, and 93 miles
between West Point and Greenwood is out
of service (MS State Rail Plan).
Port of Rosedale has no existing rail service;
Great River Railroad (GTR) runs 32 miles
between Greenville and Rosedale and
serves the Port
of Rosedale but has not been in operation
due to lack of funding since 2002.
US 82 and local streets connecting to it
provide critical last mile access to multiple
inland ports: Lowndes County Port, Port of
Greenville, and Port of Rosedale.
Safety improvements along US 82.
US 82 pavement management program.
Reinstate rail access to the Port of
Rosedale.
Consider and prioritize improvements to the
NHS connectors in highway project
programming due to their role in providing
roadway access to the two corridor ports.
(5) Capacity includes the total storage space for air cargo, ramp space and capacity in tonnage.
Volume refers to cargo volumes in tonnage.
(9) Tier I: all core track meets or exceeds FRA Class 4 standards (> 40 mph for freight, > 60 mph for passenger).
Tier II: 80% of core track meets or exceeds FRA Class 3 standards (> 25 mph for freight, > 30 mph for passenger; no signals).
(2) MS Freight Advisory Committee input and Freight User Survey Bottleneck Identification (7) Criteria applies to all public road crossings with active crossing warning devices
(gates and warning signals for Tier I and Tier II crossings). (3) Major freight generators move over 1 million tons or $200 million in value
(4) Undesired Level of Service defined as below LOS C in rural areas and below LOS D for urban areas. (8) Pavement condition is satisfactory if IRI rating on 65% of primary route miles < 95 for Tier I and 60% < 95 for Tier II.
(1) FHWA/ATRI Nationwide Bottleneck Analysis (6) Crash rate greater than 80% of state average for Tier I and 100% for Tier II
Corridor Needs Assessment and Infrastructure Need
Top 10 Statewide Freight Counties Served Lowndes, Choctaw, Washington
Safety:
Highways: Annual Crash Rate (174/100M vmt) (6)
Rail: RR crossings w/o active warning devices (7)
Infrastructure Condition:
Highways: Pavement & Structures
Rail: Speed/Track (9)
Performance Assessment
Potential Freight Improvement Projects
Notes: * Excludes through freight
Existing ITS Deployments
Corridor Infrastructure Performance
Capacity:
Highways: Level of Service (4)
Rail: % supporting 286k weight limits
Ports: channel depth
Commercial airports: storage volume to
capacity (5)
Recovery time from flood or drought to 12'
minimum depth
Top Commodities Coal Minerals, Crude petrol Gas, Chemicals Petroleum, Agriculture, Food Tobacco, and Concrete Glass Primary Metal
Chemicals Petroleum, Fabricated Metal Machinery Equipment, Concrete Glass Primary Metal, Food Tobacco, and Secondary Traffic Others
Major Freight Generators Blubox, Mars Food US
Major Bottlenecks as identified
Freight Flow Characteristics
Annual Freight: Tonnage (millions) /
Value ($ billions)
Annual Inbound/ Outbound/ Intrastate:
Tonnage (millions)*
14.8 / 10.0 / 4.8
19.0 / 17.7 / 8.9
Annual Inbound/ Outbound/ Intrastate:
Value ($ billions)*
$9.8 / $12.3 / $2.1
$16.3 / $34.7 / $3.6
% Freight Flows by Mode
Corridor Freight Infrastructure
Primary Facilities / Operators
Key Connectors
MS 1 from US 82 / Greenville to Rosedale
Tier II: US 82 (Greenville‐Winona‐Columbus) CorridorGeneral Description Corridor Map
The US 82 Tier II Corridor runs west‐east through the central part of the state along US 82. This Tier II Corridor is also the only MFN
Corridor that provides a direct connection between Mississippi River and the Tennessee‐Tombigbee Waterway. Rail freight was the
dominant mode in 2011, accounting for 64% of the total corridor freight by tonnage. Truck freight is expected to grow its modal
share from 31% in 2011 to 37%. US 82 currently experiences and is forecasted to experience no congestion. Key transportation
infrastructure in this corridor includes US 82 and the Port of Greenville and Lowndes County Port. The primary commodities shipped
through the corridor is coal and other minerals, crude oil, and petroleum.
Page C‐15 5/15/2015

Highway Rail Ports & Waterways Commercial AirportsUS 98 from I‐55/McComb east to Lucedale and
Alabama via Hattiesburg (141 miles)
CN mainline from Hattiesburg southeast to
Lucedale and to Alabama (68 miles)
MS 13 between Columbia and Lumberton / I‐59,
serving Marion Clay & Gravel in Columbia
MS 589 from US 98 to Purvis / I‐59
WIM
Highway Rail Ports & Waterways Commercial Airports
2011 22.0 / $37.7 32.3 / $28.0
2040 36.1 / $71.6 41.1 / $45.1
2011
2040
2011
2040
2011 41% 60%
2040 47% 53%
Average % Truck Mix /
Average Total Daily Volume2011 11% / 1,400
ATRI (1) None
FAC / Freight
User Survey (2)
None identified
Tonnage
Value
Tonnage (3)
Highway Rail Ports & Waterways Commercial Airports
20118 miles (5%) congested:
‐ MS 589 to I‐59 in Hattiesburg
2040
11 miles (8%) congested:
‐ MS 589 to I‐59 in Hattiesburg
‐ I‐59 to US 49 in Hattiesburg
Crash rate: 292
Corridor does not meet Tier II safety performance
criteria.
26 miles (19%) across the corridor with high crash
segments.
10 crossings of 10 (100%) do not have
Active 2 warning devices.
IRI rating (8)
IRI score: 70%
40 miles (28%) unacceptable.
High IRI > 95 segments:
‐ I‐55 to Leatherwood Rd
‐ Old New Hope Rd to Old Lakeview Dr
‐ US 98 to Ralston Rd
‐ MS 15 to W Main St
‐ MS 198 to Agricola‐Latonia Rd
Vertical
clearance
0 of 5 bridges (0%) deficient
Weight‐
restricted
bridges
2 of 64 (3%) restricted
Highway Rail Ports & Waterways Commercial AirportsLevel of Service: US 98 provides good LOS with
minimal existing and forecasted congestion. No
segments of US 98 are programmed to be widened.
Safety: US 98 does not meet Tier II safety performance
criteria.
Operations: The corridor provides regional
connections to freight activity centers between I‐55,
Hattiesburg, and points along US 98 southeast to
Alabama border and further down to Mobile,
Alabama. Major interchanges with I‐55, I‐59 and US 49
operate smoothly and issues with operations along the
corridor are localized, rather than corridor‐wide ‐ e.g.,
congestion in Hattiesburg. Deployment of the
Hattiesburg Region ITS should further improve
operations along the corridor.
Physical Condition: 28% of US 98 pavement miles (or
40 miles) is unacceptable, but overall condition is not
an issue. This corridor is one of the few MFN corridors
that has no issues with bridge vertical clearance and
very few bridge weight restrictions.
Capacity: Even though there are more
corridor highway miles than rail trackage,
rail freight flows are more dominant on a
percentage basis than truck freight flows
within the corridor. 100% of the CN
mainline can handle 286k weight limit.
Safety: All railroad crossings in this corridor
do not have Active 2 warning devices.
Physical Condition: CN mainline in
Hattiesburg and in McLain area suffers
from low track speed.
Safety improvements along US 98.
Leverage deployment of Hattiesburg region Incident
Management System & TMC Operations to include
expanded commercial vehicle elements.
Reconstruct two US 98 bridges to lift weight
restrictions.
CN mainline core track improvements in
Hattiesburg and McLainto raise line speed.
Upgrade all public corridor crossings along
the CN mainline with at least Active 2
warning devices.
(5) Capacity includes the total storage space for air cargo, ramp space and capacity in tonnage.
Volume refers to cargo volumes in tonnage.
(9) Tier I: all core track meets or exceeds FRA Class 4 standards (> 40 mph for freight, > 60 mph for passenger).
Tier II: 80% of core track meets or exceeds FRA Class 3 standards (> 25 mph for freight, > 30 mph for passenger; no signals).
(2) MS Freight Advisory Committee input and Freight User Survey Bottleneck Identification (7) Criteria applies to all public road crossings with active crossing warning devices
(gates and warning signals for Tier I and Tier II crossings). (3) Major freight generators move over 1 million tons or $200 million in value
(4) Undesired Level of Service defined as below LOS C in rural areas and below LOS D for urban areas. (8) Pavement condition is satisfactory if IRI rating on 65% of primary route miles < 95 for Tier I and 60% < 95 for Tier II.
(1) FHWA/ATRI Nationwide Bottleneck Analysis (6) Crash rate greater than 80% of state average for Tier I and 100% for Tier II
Corridor Needs Assessment and Infrastructure Need
Top 10 Statewide Freight Counties Served None
Safety:
Highways: Annual Crash Rate (174/100M vmt) (6)
Rail: RR crossings w/o active warning devices (7)
Infrastructure Condition:
Highways: Pavement & Structures
Rail: Speed/Track (9)
CN mainline does not meet track speed
standards in southeast Hattiesburg and
McLain.
Performance Assessment
Potential Freight Improvement Projects
Notes: * Excludes through freight
Existing ITS Deployments
Corridor Infrastructure Performance
Capacity:
Highways: Level of Service (4)
Rail: % supporting 286k weight limits
Ports: channel depth
Commercial airports: storage volume to
capacity (5)
CN mainline from Hattiesburg southeast to
Lucedale and to Alabama supports 286k
limits.
Top Commodities Chemicals Petroleum, Coal Minerals, Crude petrol Gas, Agriculture, Food Tobacco, and Secondary Traffic Others
Chemicals Petroleum, Concrete Glass Primary Metal, Fabricated Metal Machinery Equipment, Food Tobacco, and Agriculture
Major Freight Generators Singley Construction Co, John L Sanford Jr Inc., Riverside Gravel, Hover Gravel Co, American Sand & Gravel Co, Marion Clay & Gravel LLC.
Major Bottlenecks as identified
Freight Flow Characteristics
Annual Freight: Tonnage (millions) /
Value ($ billions)
Annual Inbound/ Outbound/ Intrastate:
Tonnage (millions)*
9.2 / 6.2 / 3.9
12.6 / 9.5 / 8.0
Annual Inbound/ Outbound/ Intrastate:
Value ($ billions)*
$6.5 / $8.0 / $3.2
$12.1 / $12.9 / $4.9
% Freight Flows by Mode
Corridor Freight Infrastructure
Primary Facilities / Operators
Key Connectors
Tier II: US 98 / CN (McComb‐Hattiesburg‐Lucedale) CorridorGeneral Description Corridor Map
Mississippi Export Railroad (MSE) ‐
connecting CN and east‐west CSXT M&M
subdivision
The US 98/CN Tier II Corridor runs west‐east through the south‐central part of the state along US 98 from I‐55 east via
Hattiesburg to Alabama state border (and further east to Mobile); the CN mainline runs parallel to US 98 on its
Hattiesburg to Alabama state line segment (the same CN route extends northwest of Hattiesburg and is part of the US
49/CN Tier I corridor). This Tier II Corridor provides vital regional level west‐east connectivity between freight activity
centers in southern Mississippi. Rail freight was the dominant mode in 2011, accounting for 60% of the total corridor
freight by tonnage. Truck freight is expected to grow its modal share from 41% in 2011 to 47%. US 98 currently
experiences and is forecasted to experience little congestion. Key transportation infrastructure in this corridor includes
US 98, and CN mainline from Hattiesburg along US 98 to Alabama border. The primary commodities shipped through
the corridor are petroleum chemicals, coal, and crude oil.
Page C‐16 5/15/2015

Highway Rail Ports & Waterways Commercial AirportsUS 45 (also Tier II corridor) from Corinth to Columbus Tennessee‐Tombigbee Waterway;
Port of Aberdeen, Port of Itawamba,
Lowndes County Port, Port of Amory,
Yellow Creek Port, and Clay County Port
To Port of Itawamba: from U.S. 78: north on MS 25, west on
South Access Route to port (NHS Intermodal Connector)
The Mississippian Railway Cooperative
(MMSW) ‐ rail connection to Port of
Itawamba.
To Lowndes County Port: From U.S. 45: on MS 182 to the
port (NHS Intermodal Connector)
KCS and Columbus and Greenville Railway
(CAGY) ‐ rail connection to Lowndes County
Port
To Yellow Creek Port:
North Connector: from US 72, north on MS 25, east on Port
Access Rd (CR 370), west along CR 351 to terminals
South Connector: from US 72 south along MS 365 to the Port
Access Rd, to port (NHS Intermodal Connectors)
Yellow Creek Port Railroad (YCRK) ‐
operated by KCS, rail connection to the
Yellow Creek Port
To Port of Amory: I‐22 to US 45: east on U.S. 278, north on
Waterway Dr, west on Port Access Road to port (NHS
Intermodal Connector)
To Port of Aberdeen: from US 45 via Port Access Rd to the
port (NHS Intermodal Connector)
None
Highway Rail Ports & Waterways Airports2011 1.9 / $0.8
2040 2.4 / $1.3
2011
2040
2011
2040
2011 100%
2040 100%
Average % Truck Mix /
Average Total Daily Volume2011
ATRI (1)
FAC / Freight
User Survey (2)
None identified None identified None identified
Tonnage
Value
Tonnage (3)
Highway Rail Ports & Waterways Airports
2011
2040
IRI rating (8)
Vertical
clearance
Weight‐
restricted
bridges
Highway Rail Ports & Waterways AirportsHighways such as I‐22/US 78, US 45, US 72, and US 82 and
local connectors provide critical last mile access to the
Tennessee‐Tombigbee Waterway ports.
Last mile rail access is an issue for multiple
TN‐Tombigbee ports served by short lines.
Port of Aberdeen currently has no direct
rail access, and all other TN‐Tombigbee
ports are in need of rail access,
maintenance, modernization, and capacity
improvements. Only some rail spurs to the
river ports can handle 286k weight limits.
The national and statewide significance of
the Tn‐Tombigbee ports is signified by the
fact that all but one of them are served by
the NHS Intermodal Connectors. (Port of
Aberdeen and Clay County Port currently
process very minimum cargo volumes.).
Inland port alternatives along the TN‐
Tombigbee help keep rates for other modes
competitive. Beyond Mississippi, inland
ports provide feeder service for
international and domestic shipments
downstream through Mobile, Alabama.
Last mile rail and roadway access is critical
for the six river ports located within the
corridor. Class I railroads (KCS and BNSF)
directly serve several of the Tenn–Tom
Waterway System ports in the corridor,
with short lines providing connecting
services. The quality of last mile access rail
service provided by other short line carriers
depends on these Class I connections. (Port
of Aberdeen has no existing direct rail
connection.)
Consider and prioritize improvements to the NHS connectors
in highway project programming due to their role in
providing roadway access to the Tennessee‐Tombigbee
Waterway ports.
US 278 ‐ US 45 to Amory: widen to 4 lanes (to Port of
Amory).
Port of Itawamba (MMSW): Rehabilitate 23
miles of rail line from Fulton to Amory to
handle 286k carload weights (MS State Rail
Plan).
Port of Amory (near the facility) ‐ BNSF:
upgrade 12 rail bridges between Amory and
Columbus to permit 286K loads
(MULTIPLAN 2035 and MS State Rail Plan).
Port of Amory ‐ BNSF: extend rail spur to US
278 bridge (MULTIPLAN 2035 and MS State
Rail Plan).
Port of Aberdeen: construction of a 3.2‐
mile‐long connection track to the Kansas
City Southern Railway (MULTIPLAN 2035
and MS State Rail Plan).
Rehabilitate the 10‐mile Yellow
Creek Railroad that connects Yellow
Creek State Inland Port to the KCS
system (MS State Rail Plan & Multiplan
2035).
Encourage continued use of the Port of
Itawamba, Port of Amory, Lowndes County
Port, and Yellow Creek Port through
promoting highway and rail access to port
facilities along the I‐22/US 78, US 45, US 72,
and US 82 through the Intermodal
Connector Improvement Program.
(9) Tier I: all core track meets or exceeds FRA Class 4 standards (> 40 mph for freight, > 60 mph for passenger).
Tier II: 80% of core track meets or exceeds FRA Class 3 standards (> 25 mph for freight, > 30 mph for passenger; no signals).
(8) Pavement condition is satisfactory if IRI rating on 65% of primary route miles < 95 for Tier I and 60% < 95 for Tier II.
(7) Criteria applies to all public road crossings with active crossing warning devices
(gates and warning signals for Tier I and Tier II crossings).
Notes: * Excludes through freight
(4) Undesired Level of Service defined as below LOS C in rural areas and below LOS D for urban areas.
(5) Capacity includes the total storage space for air cargo, ramp space and capacity in tonnage.
Volume refers to cargo volumes in tonnage.
(6) Crash rate greater than 80% of state average for Tier I and 100% for Tier II
Performance Assessment
Potential Freight Improvement Projects
(1) FHWA/ATRI Nationwide Bottleneck Analysis
(2) MS Freight Advisory Committee input and Freight User Survey Bottleneck Identification
(3) Major freight generators move over 1 million tons or $200 million in value
Corridor Needs Assessment and Infrastructure Need
Top 10 Statewide Freight Counties Served Lowndes, Monroe
Existing ITS Deployments
Corridor Infrastructure Performance
Capacity:
Highways: Level of Service (4)
Rail: % supporting 286k weight limits
Ports: channel depth
Commercial airports: storage volume to
capacity (5)
Recovery time from flood or drought to 12'
minimum depth
Safety:
Highways: Annual Crash Rate (174/100M vmt) (6)
Rail: RR crossings w/o active warning devices (7)
Infrastructure Condition:
Highways: Pavement & Structures
Rail: Speed/Track (9)
Top Commodities Lumber Furniture, Coal Minerals, Crude petrol Gas, Concrete Glass Primary Metal, Chemicals Petroleum, and Waste Hazardous Matter
Concrete Glass Primary Metal, Chemicals Petroleum, Fabricated Metal Machinery Equipment, Lumber Furniture, and Waste Hazardous Matter
Major Freight Generators Bluebox, Axiall Corp, Mississippi Gravel Sales Inc.
Annual Inbound/ Outbound/ Intrastate:
Value ($ billions)*
$0.4 / $0.4 / < $0.1
$0.4 / $0.9 / < $0.1
% Freight Flows by Mode
Major Bottlenecks as identified
Freight Flow Characteristics
Annual Freight: Tonnage (millions) /
Value ($ billions)
Annual Inbound/ Outbound/ Intrastate:
Tonnage (millions)*
0.7 / 1.1 / < 0.1
0.8 / 1.6 / < 0.1
Corridor Freight Infrastructure
Primary Facilities / Operators
Key Connectors
BNSF ‐ provides connection to vicinity of
the Port of Amory
Tier II: Tennessee‐Tombigbee Waterway (Yellow Creek Port‐Lowndes County Port) CorridorGeneral Description Corridor Map
The Tennessee‐Tombigbee Waterway, a designated national marine highway, runs north‐south through the eastern portion
of Mississippi. The Waterway connects the Tombigbee River with the Tennessee River, creating a water transportation route
that serves 23 southern and mid‐western states from the Gulf of Mexico (Port of Mobile) northward. Six public ports are
located in the Mississippi state: Port of Aberdeen, Port of Itawamba, Lowndes County Port, Port of Amory, Yellow Creek
Port, and Clay County Port. In 2011, the Tenn‐Tom carried nearly 2 million tons of goods with the primary commodity
carried on the Mississippi portion of the Tenn‐Tom being lumber, followed by coal, crude oil, concrete glass / metals, and
petroleum products.
Page C‐17 5/15/2015