
Membranous Nephropathy: Physiopathology and Natural History
40
Membranous Nephropathy: Physiopathology and Natural History Dr Barbara Seitz-Polski Laboratoire d’Immunologie CHU de Nice UMR 7275 IPMC
Transcript of Membranous Nephropathy: Physiopathology and Natural History

Membranous Nephropathy:
Physiopathology and Natural History
Dr Barbara Seitz-Polski
Laboratoire d’Immunologie CHU de Nice
UMR 7275 IPMC

• 1.3 cases/100,000
• >50 years old, 2/3 men
• Major cause of nephrotic syndrome
• Histological diagnosis by biopsy
with the presence of immune
complexes
• Podocyte dysfunction leading to
proteinuria
• Idiopathic 85%
• Secondary 15%
Urine
Membranous Nephropathy
Podocyte autoantigens ? Proteinuria

Natural History
Schieppati et al., NEJM 1993
Recurrence after graft:
30-40%
Poor prognosis:
- >50 years old
- Men
+20% ESKD
+35% Nephrotic Syndrome
100 consecutive MN patients only treated with symptomatic therapy

KDIGO Recommendations
Perform appropriate investigations to exclude secondary causes
Symptomatic Therapy
Urinary protein excretion persistently>4g/g
or
Complication related to the Nephrotic Syndrome
or
SCr>30% from the time of diagnosis
6 m
onth
s
Immunosuppressive Therapy
- Corticosteroids + Cyclophosphamide
- CNI

Mecanisms of Immuns Complex
Formation
Glassock , New Engl J Med 2009, 361:81
Antigens identification?
B

Physiopathology
Antigens identification

1. Heymann Nephritis: Megalin
Immunization with crude
renal extracts
IgG deposits
Antigen : Megalin
Human antigen?
Formation in situ of immuns complex
Podocytes
GBM Proteinuria
Complement
Activation
Saito et al. PNAS 1994,
Heymann et al., PNAS 1959

2. Neutral Endopeptidase
Antenatal MN
Mother NEP -
Baby NEP +
Alloimmunization in mother NEP- :
Ab anti-NEP
Debiec et al, NEJM 2002
First human antigen New-born proteinuria J0
4 weeks

3. PLA2R1 first antigen in Idiopathic MN
Beck et al., NEJM 2009
• Anti-PLA2R1 Ab : 70% Idiopathic MN
• Pathogenic role?
PLA2R1
180 kDa

1st test anti-PLA2R1
Hofstra et al CJASN 2011
HEK PLA2R1+
Hoxha et al., NDT 2011
Correlation with
disease activity
WB IIFT
HEK PLA2R1-

ELISA PLA2R1 humain
Dähnrich C, Komorowski L, Probst C, Seitz-Polski B et al. Clin Chim Acta 2013
IgG4
IgG tot

Other Antigen in
Human Glomerular Extract ?
260
140
100
70
50
40
35
MN sera
- BME
Solubilized membrane fraction
Denaturation 8 min at 95°C
Blocking 2 h RT
1° Ab 1:100
DALBAGNE, sec. MN (Hep C), -
2° Ab 1:20000 / 1:30000
anti-IgG tota / anti-IgG4
pL
PC
X-G
FP
Hu
man
glo
meru
lar extract
pL
PC
X-h
-PL
A2R
1-H
A
pM
MR
33
3-h
MR
C1
pL
PC
X-h
MR
C2-H
A
pL
PC
X-h
LY
75-H
A
HGE PLA2R1
Serum 1/100
MN HIV+ HCV+
Beck, Seminars in Nephrology 2010

4. THSD7A in Idiopathic MN
Tomas*, Beck* et al., NEJM
Brevet déposé
Confid
ential: F
or R
eview
Fig. 5
Page 22 of 21
Confidential: Destroy when review is complete.
Submitted to the New England Journal of Medicine
12
34
56
78
9
1011
1213
1415
161718
1920
2122
2324
25
2627
2829
3031
3233
34
3536
3738
3940
414243
4445
4647
484950
5152
5354
5556
5758
59
60
23
Figure S9. Co-localization of IgG4 and THSD7A
Figure S9. Confocal microscopy analysis of the biopsy of a patient with membranous
nephropathy (MN) and serum autoantibodies against THSD7A. IgG4 (Panel A, green)
and THSD7A (Panel B, red) are both present in this biopsy specimen. Panel C shows staining for DRAQ5 (blue), a marker of cell nuclei. Panel D shows co-localization of IgG4
and THSD7A in the peripheral capillary wall and the glomerular basement membrane.
Panel E is an enlargement of Panel D.
IgG Elution
Confid
ential: F
or R
eview
Fig. 2
Page 19 of 21
Confidential: Destroy when review is complete.
Submitted to the New England Journal of Medicine
1
23
45
67
89
10
1112
1314
1516
1718
19
2021
2223
2425
26
2728
2930
3132
3334
353637
3839
4041
4243
44
4546
4748
4950
51
5253
5455
5657
5859
60
• Screening 500 MN patients
• 10% MN PLA2R1-
• PLA2R1+ or THSD7A+ but no double positive
• No clinical difference between PLA2R1+ and THSD7A+

Anti-THSD7A Ab
HEK THSD7A-
IIFT
70 kDa
100 kDa
250kDa
130 kDa
55 kDa
THS (T8-2015)
P BSA
WB ELISA
HEK THSD7A+

Pathogenic role of Anti-THSD7A Ab
Human Anti-THSD7A Ab
Tomas et al., JCI 2016

Anti-THSD7A Ab and Cancer
Hoxha NEJM 2016

Four Podocyte Antigens
Figure2. Molecular featuresof antigens involvedandalloimmuneandautoimmunemembranousnephropathy
THSD7A, 250kDa, 1657aa
NC
NEP, 90kDa, 750aaN
C
Activesite21aa
PLA2R1, 180kDa, 1463aa
NC
N
RGD-like
TSP1-like
YWTDspacer region
EGF-typerepeat
Complement-typerepeat
CysR
FNII
CTLD
45aa
29aa
209aa

Pronosis Factor
MN PLA2R1+

Anti-PLA2R1 titer predict MN prognosis
Cohorte n=82 Cohorte n=66
Hoxha et al., JASN 2014 Kanigicherla et al., KI 2013
IgG tot IgG 4

180 kDa
≈1500 aa
10 domains
Conformational epitope
PLA2R1epitope ? Disease Activity ?

Identification of immunodominant Epitope in
PLA2R1
CysR-FNII-CTLD1
Kao et al., JASN 2014
1 sample
Fresquet et al., JASN 2014
A pool of 5 samples
CysR
No link with disease activity
Other épitopes ?
No link with disease activity

Epitopes in PLA2R1: 50 sera – 3 epitope profiles
Anti-CTLD1
Anti-CysR
Anti-CTLD7
HA HA HA HA HA HA HA HA HA HA
OUT
IN
B
C
WT ∆C ∆F ∆1 ∆2 ∆3 ∆4 ∆5 ∆6 ∆7
E
D
ACysR
FNII
CTLD1
CTLD2
CTLD3
CTLD4
CTLD5
CTLD6
CTLD7
CTLD8
Anti-HA
iMNserumwithCTLD1activity
iMNserumwithCysRactivity
iMNserumwithCTLD7activity
Figure1
HA HA HA HA HA HA HA HA HA HA
OUT
IN
B
C
WT ∆C ∆F ∆1 ∆2 ∆3 ∆4 ∆5 ∆6 ∆7
E
D
ACysR
FNII
CTLD1
CTLD2
CTLD3
CTLD4
CTLD5
CTLD6
CTLD7
CTLD8
Anti-HA
iMNserumwithCTLD1activity
iMNserumwithCysRactivity
iMNserumwithCTLD7activity
Figure1
Seitz-Polski et al., JASN 2016
CysR
12/50
CTLD1
11/50
CTLD7
27/50
HA HA HA HA HA HA HA HA HA HA
OUT
IN
B
C
WT ∆C ∆F ∆1 ∆2 ∆3 ∆4 ∆5 ∆6 ∆7
E
D
ACysR
FNII
CTLD1
CTLD2
CTLD3
CTLD4
CTLD5
CTLD6
CTLD7
CTLD8
Anti-HA
iMNserumwithCTLD1activity
iMNserumwithCysRactivity
iMNserumwithCTLD7activity
Figure1
3 Antibodies ? Expression of each mutants Screening of 50 sera

Epitopes PLA2R1: 3 Epitopes - 3 domaines
Seitz-Polski et al., JASN 2016
Profil CTLD1 Profil CTLD7
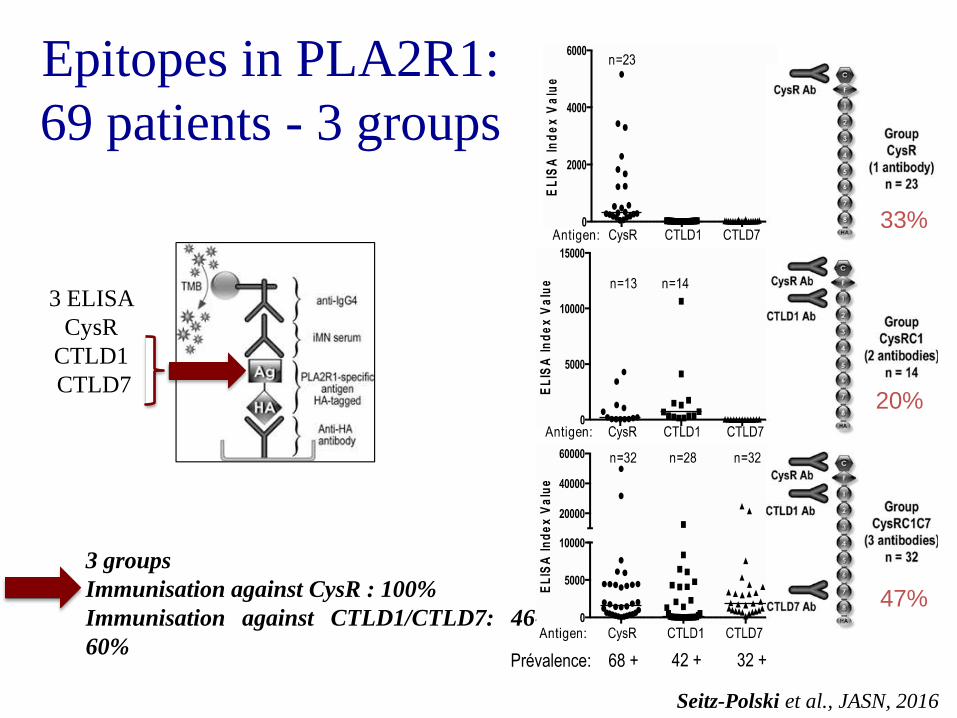
Epitopes in PLA2R1:
69 patients - 3 groups
Seitz-Polski et al., JASN, 2016
3 groups
Immunisation against CysR : 100%
Immunisation against CTLD1/CTLD7: 46-
60%
3 ELISA
CysR
CTLD1
CTLD7
Prévalence: 68 + 42 + 32 +
33%
20%
47%
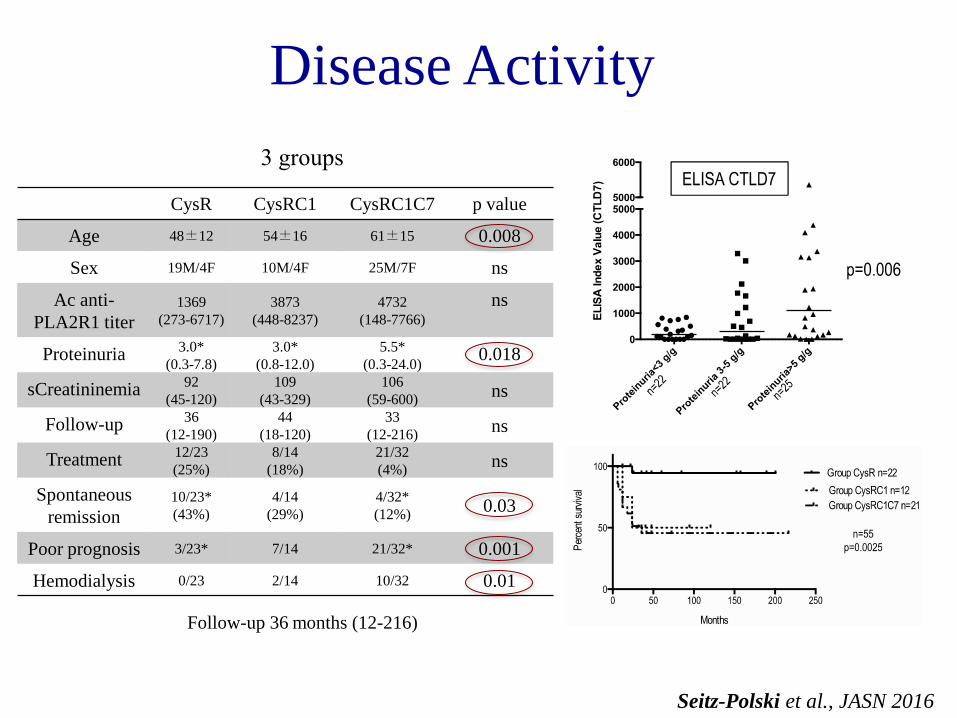
CysR CysRC1 CysRC1C7 p value
Age 48±12 54±16 61±15 0.008
Sex 19M/4F 10M/4F 25M/7F ns
Ac anti-
PLA2R1 titer
1369
(273-6717)
3873
(448-8237)
4732
(148-7766)
ns
Proteinuria 3.0*
(0.3-7.8)
3.0*
(0.8-12.0)
5.5*
(0.3-24.0) 0.018
sCreatininemia 92
(45-120)
109
(43-329)
106
(59-600) ns
Follow-up 36
(12-190)
44
(18-120)
33
(12-216) ns
Treatment 12/23
(25%)
8/14
(18%)
21/32
(4%) ns
Spontaneous
remission
10/23*
(43%)
4/14
(29%)
4/32*
(12%) 0.03
Poor prognosis 3/23* 7/14 21/32* 0.001
Hemodialysis 0/23 2/14 10/32 0.01
Disease Activity
Seitz-Polski et al., JASN 2016
3 groups
Follow-up 36 months (12-216)

Prognosis Factors
Seitz-Polski et al., JASN, 2016
Good Prognosis
n=38
Bad Prognosis
n=31
p value
univariate
Sex 9F/29M 6F/25M ns
Age 50 +/- 2.2 62 +/- 2.6 0.0006
Proteinuria at
diagnosis (g/g) 4.45 5.20 ns
Creatinemia at
diagnosis (μmol/L) 88 113 0.0002
Proteinuria at test
(g/g) 3.16 5.0 0.0082
Creatinemia at test
(μmol/L) 88 112.5 0.003
CysR Group 20 3 0.0002
CysRC1 Group 7 7 ns
CysRC1C7 Group 11 21 0.0013
Immunosuppressive
treatment 21 20 ns
PLA2R1 Titer 2594 5947 0.04 Multivariate Cox regression Analysis

0
2
4
6
8
10
12
14
CysR
CT
LD
1
CT
LD
6-7
CysR
CT
LD
1
CT
LD
6-7
CysR
CT
LD
1
CT
LD
6-7
CysR
CT
LD
1
CT
LD
6-7
CysR
CT
LD
1
CT
LD
6-7
CysR
CT
LD
1
CT
LD
6-7
CysR
CT
LD
1
CT
LD
6-7
may-11 nov-11 may-12 nov-12 may-13 nov-13 apr-14
Evolution during Follow-up
Seitz-Polski et al., JASN 2016
0 10 20 30 40 50 60 70 80 90
CysR
CT
LD
1
CT
LD
7
CysR
CT
LD
1
CT
LD
7
CysR
CT
LD
1
CT
LD
7
CysR
CT
LD
1
CT
LD
7
CysR
CT
LD
1
CT
LD
7
CysR
CT
LD
1
CT
LD
7
apr-12 aug-12 dec-12 apr-13 dec-13 apr-14

Mild disease
Spontaneous remission Severe disease
First event: anti-CysR reactivity
Second event: Intramolecular epitope spreading
Temps
Seitz-Polski et al., JASN 2015
Epitope Spreading : Natural History

Peptide CysR - Mimétisme Moléculaire ?
Fresquet et al., JASN 2014

Peptide in CysR – Molecular Mimicry?
Complete homology with the sequence LTLENCK
which is a part of the bacterial cell wall enzyme D-alanyl-D alamine carboxypeptidase
common to Clostridium species
Fresquet et al., JASN 2014

Epitope Spreading in Heymann Nephritis
Shah et al., JASN 2007
Peptide L6
Ab + Actice disease

Epitope Spreading in THSD7A ?
Figure2. Molecular featuresof antigens involvedandalloimmuneandautoimmunemembranousnephropathy
THSD7A, 250kDa, 1657aa
NC
NEP, 90kDa, 750aaN
C
Activesite21aa
PLA2R1, 180kDa, 1463aa
NC
N
RGD-like
TSP1-like
YWTDspacer region
EGF-typerepeat
Complement-typerepeat
CysR
FNII
CTLD
45aa
29aa
209aa
Link with disease Activity?
Beck ASN 2015

82 patients GEM entre 1978 - 2007
42 PLA2R1-Ab +
(52%)
2 THSD7A-Ab +
(2%)
38 double negative
(46%)
• 24 patients Isupp (57%)
• 18 Kidney Failure (41%)
• 12 ESKD (28%)
• 34 patients Isupp (42%)
• 38 Kidney Failure (46%)
• 25 ESKD (30%)
• 9 patients Isupp (23%)
• 19 Kidney Failure (50%)
• 12 ESKD (32%)
Group CysR
n=15
Group CysRC1
n=10
Group CysRC1C7
n=17
• 8 patients Isupp
• 1 Kidney Failure
• 0 ESKD
• 16 patients Isupp
• 17 Kidney Failure
• 12 ESKD
• 2 patients Isupp (100%)
• 1 Kidney Failure
• 1 ESKD
Epitope Spreading : Cohort confirmation
Seitz-Polski B. et al. in preparation

PLA
2R1+ D
N
0
200
400
600
800
Cre
atin
em
ia (m
mo
l/l)
Evolution Creatinemia
Creat at diagnosis
Creat at LOCF
Epitope Spreading : a Bad prognosis factor
Cys
R
Cys
RC1/
Cys
RC1C
7
0
200
400
600
800
1000
Evolution Creat CysR vs Spread+
Cre
atin
em
ia (
mm
ol/l)
At diagnosis
At LOCF
p=0.003
0 100 200 3000
50
100
Survie sans IRC à 60 mois
Months
Pe
rce
nt s
urv
iva
l
CysR
CysRC1
CysRC1C7
0 100 200 3000
50
100
Survie sans IRC à 60 mois
Months
Pe
rce
nt s
urv
iva
l
PLA2R1
DN
Seitz-Polski B. et al. in preparation
p=0.07
DC
fre
e
DC
fre
e
p=0.013
p=0.4

GEM-Ritux
75 MN PLA2R1+
38 Symptomatic therapy + Placébo 37 Symptomatic therapy + Rituximab
• Primary endpoint: Remission at M6 p>0.05
• Secondary endpoint:
• Proteinuria<50% from baseline p<0.05
• Remission at M12 p<0.05
K. Dahan et al., JASN 2016
• Tolerance : OK
• ≈Immunosuppressive Therapy

75 MN
37 RTX+ 38 RTX-
6 Remission at M6 21 Active disease M6
10 PLA2R1- 1 ech non testé? 28 PLA2R1+
27 PLA2R1+
10 PLA2R1- 27 PLA2R1+
8 Remisson at M6 19 Active disease at M6
Cohorte GEM-Ritux

38 RTX-
10 PLA2R1- 1 sample NA 28 PLA2R1+
27 PLA2R1+
10 CysR
(37%)
5 CysRC1
(18%)
12 CysRC7 ou CysRC1C7
(44%)
Rem M6
n=5/10 50%
Active M6
n=5/10 50%
Rem M6
n=0
Active M6
n=5/5 (100%)
Rem M6
n=1/12 (8%)
Active M6
n=11/12 (92%)
Spontaneous
Remission n=6
Active Disease
n=22
p
Spreading vs
No Spreading M0 1/5 16/6 0.021*

5
10
15
20 N
um
ber
of
pat
ien
ts
NIAT
Spread M0 No spread
Ritux
M6 Last M6 Last M6 Last M6 Last
R No-R R No-R R No-R R No-R
M6 Remission
(n=15)
No Remission
(n=43)
P value
NIAT - NO spread M0 5 (33.33) 6 (13.95) 0.0374
NIAT - Spread M0 1 (6.67) 17 (39.53)
RITUX - NO spread M0 4 (26.67) 5 (11.63)
RITUX - Spread M0 5 (33.33) 15 (34.88)
Last follow-up Remission
(n=32)
No Remission
(n=26) P value
NIAT - NO spread M0 8 (25.00) 3 (11.54)
0.0118 NIAT - Spread M0 5 (15.63) 13 (50.00)
RITUX - NO spread M0 8 (25.00) 1 (3.85)
RITUX - Spread M0 11 (34.38) 9 (34.62)
En analyse
multivariée seul le
Spreading est associé
à la rémission à M6
et au dernier suivi
contrairement au titre
d’Ac anti-PLA2R1 et
au recours au
Rituximab

In development…
HEK non transfectées
IIFT

Conclusion
New anti-PLA2R1 test based upon epitope specificity:
• To stratify patients at risk of ESKD
• To treat earlier this group


![Biochimie - crmrsni-nice.fr · Biochimie 118 (2015) 104e115. 1. Introduction Idiopathic membranous nephropathy (iMN) is a common cause of nephrotic syndrome in adults [1e5]. Clinically,](https://static.fdocuments.us/doc/165x107/5e76ad242dc49a39761aceac/biochimie-crmrsni-nicefr-biochimie-118-2015-104e115-1-introduction-idiopathic.jpg)


![MEMBRANOUS NEPHROPATHY - kdigo.org · Glomerulonephritis will be used as the Reference- Point for Discussion (Kidney International Supplements Volume 2 [June] 2012) Recommendation](https://static.fdocuments.us/doc/165x107/5d5026fb88c993e32d8b4a9b/membranous-nephropathy-kdigoorg-glomerulonephritis-will-be-used-as-the-reference-.jpg)

