MEMBERS’ GUIDE TO 2021 REFRESHER READINGS
88
MEMBERS’ GUIDE TO 2021 REFRESHER READINGS
Transcript of MEMBERS’ GUIDE TO 2021 REFRESHER READINGS

MEMBERS’ GUIDE TO 2021 REFRESHER READINGS

© 2020 CFA Institute. All rights reserved.
This copyright covers material written expressly for this volume by the editor/s as well as the compilation itself. It does not cover the individual selections herein that first appeared elsewhere. Permission to reprint these has been obtained by CFA Institute for this edition only. Further reproductions by any means, electronic or mechanical, including photocopying and recording, or by any information storage or retrieval systems, must be arranged with the individual copyright holders noted.
CFA®, Chartered Financial Analyst®, AIMR-PPS®, and GIPS® are just a few of the trademarks owned by CFA Institute. To view a list of CFA Institute trademarks and the Guide for Use of CFA Institute Marks, please visit our website at www.cfainstitute.org.
This publication is designed to provide accurate and authoritative information in regard to the subject matter covered. It is sold with the understanding that the publisher is not engaged in rendering legal, accounting, or other professional service. If legal advice or other expert assistance is required, the services of a competent professional should be sought.
All trademarks, service marks, registered trademarks, and registered service marks are the property of their respective owners and are used herein for identification purposes only.
In the mainland of China, CFA Institute accepts CFA charterholders only.
ISBN 978-1-953337-03-0
10 9 8 7 6 5 4 3 2 1

2.75 PL credits, inclusive of 0.25 SER credits
X PL credits, inclusive of X SER credits
ContentsForeword 1
Investment Analysis 3
What Is Changing in the 2021 Curriculum? 4Why Does It Matter to Members? 6Technical Analysis 8Pricing and Valuation of Forward Commitments 15Private Equity Investments 23
Data Science 31
What Is Changing in the 2021 Curriculum? 32Why Does It Matter to Members? 34Organizing, Visualizing, and Describing Data 36Machine Learning 46Backtesting and Simulation 53
Wealth Management 59
What Is Changing in the 2021 Curriculum? 60Why Does It Matter to Members? 62Topics in Private Wealth Management 64
Ethics, Rules, and Standards 77
What Is Changing in the 2021 Curriculum? 78Why Does It Matter to Members? 80Application of the Code and Standards: Level II 81Application of the Code and Standards: Level III 83

This page intentionally left blank

© 2020 CFA Institute. All rights reserved. 1
ForewordThis Year, Members Benefit First from Refresher Readings
Our aim is to equip investment management professionals with the highest level of knowledge and skills they need to achieve their career goals. To deliver on this promise, we are keeping our learners at the center of everything we do. We are creating a holistic learning expe-rience that integrates digital, in-person, live, and virtual offerings so we can become a leading resource for learning among all investment professionals globally.
We know the 2021 Refresher Readings are one of the most valu-able learning products we offer. This year, members are receiving these readings before CFA® Program candidates because the pan-demic-related deferral of CFA exams has led us to extend and test candidates on the 2020 curriculum. To enhance learners’ experience, we are also adding online learning modules on two topics: “Machine Learning” and “Organizing, Visualizing, and Describing Data.” Look for future invitations to participate in these opportunities.
Extensive work through practice analysis and curriculum devel-opment has resulted in literally everything in the curriculum being updated or revised within the past three years. We have updated data, added new cases, streamlined readings to provide better learning experiences, and improved end-of-reading questions.
All of these efforts better align the CFA Program curriculum with what CFA charterholders do daily on the job. The CFA Program curriculum today may be the most up to date it has been since we customized the readings in the mid-2000s.

2 Members’ Guide to 2021 Refresher Readings
Last year, we updated the Level I CFA Program curriculum. For the 2021 curriculum, we accomplished the following:
• Updated and refreshed almost every reading at Level II.
• Completely revamped Level III, by replacing some of the classic text of the past. Almost every reading is now less than five years old. We completed the planned revisions to the Private Wealth Management segments to reflect the most current practice.
• Modernized the quant methods throughout the curriculum to reflect the move to big data. A new reading at Level I introduces candidates to this topic early in the program and helps them understand the role of big data in investing.
• Built out the machine learning content to help candidates with portfolio management and added a set of real working cases to the “Machine Learning” reading. An advanced simulation and backtesting reading helps readers truly understand the process, strengths, and weaknesses of machine learning.
I believe these Refresher Readings should be required reading for all CFA charterholders because so much has changed in the investment management industry since most of us earned our charter.
I hope you find the readings and online learning modules to be extremely useful.
Stephen Horan, CFA, CIPM Managing Director, Professional Learning and Americas

© 2020 CFA Institute. All rights reserved. 3
Investment Analysis
Applicable Readings
Technical Analysis (Level I)By Aksel Kibar, CMT, Barry M. Sine, and Robert A. Strong, PhD, CFA 2.5 PL Credits Access the full reading: https://www.cfainstitute.org/membership/professional-development/refresher-readings/technical-analysis
Pricing and Valuation of Forward Commitments (Level II)By Adam Schwartz, PhD, CFA 2.5 PL Credits Access the full reading: https://www.cfainstitute.org/membership/ professional-development/refresher-readings/pricing-and- valuation-of-forward-commitments
Private Equity Investments (Level II)By Yves Courtois, CMT, MRICS, CFA, and Tim Jenkinson, PhD 1.5 PL Credits Access the full reading: https://www.cfainstitute.org/membership/professional-development/refresher-readings/private-equity-investments

4 Members’ Guide to 2021 Refresher Readings
What Is Changing in the 2021 Curriculum?Investment analysis is always evolving, but never more so than today. Academic work and practices in the investment industry are constantly changing to meet the challenges of structural changes in markets. Additions to the CFA Program curriculum on investment analysis reflect these shifts and offer investment professionals up-to-date guidance based on workplace experience.
Technical analysis is a good example. The new “Technical Analysis” reading takes a pragmatic approach to technical analysis, highlighting the main tools that can be used, and examines how technical analysis—which aims to measure market behavior—can be employed as a complement to fundamental analysis in portfolio man-agement. Whereas fundamental analysis may help us decide what asset to buy or sell, technical analysis can help us to decide when to buy or sell it. In this sense, technical analysis becomes an integral part of the trading process.
The 50-plus technical analysis charts in the reading illustrate a range of real-life scenarios, allowing readers to develop a practical understanding of how technical analysis can help professionals in their work. A deeper dive into a (fictionalized) scenario invites read-ers into the offices of a sovereign wealth fund, where a portfolio ana-lyst is about to make a critical allocation decision about an existing investment in gold. How will technical analysis guide the decision and inform the execution strategy?
Meanwhile, the updated “Private Equity Investments” reading introduces the venture capital (VC) method—a technique that allows more nuanced valuations to be produced for early stage, nonpublic

What Is Changing in the 2021 Curriculum?
© 2020 CFA Institute. All rights reserved. 5
companies. The VC method acknowledges that early stage companies carry with them greater risk and uncertainty and cannot be valued in the same way as more mature companies. The reading discusses the ways private equity firms add value to their portfolio companies and then contrasts the two main forms of private equity—buyout and VC—comparing valuation approaches for each.
A streamlined version of the “Pricing and Valuation of Forward Commitments” reading creates greater clarity for investment profes-sionals through the use of intuitive visuals and graphics and provides more and better detail on the principles for pricing and valuing for-wards, futures, and swaps. For example, the arbitrage-free approach and offsetting bond portfolios are used to illustrate the pricing and valuation of forwards.

6 Members’ Guide to 2021 Refresher Readings
Why Does It Matter to Members?The new material reflects how investment professionals constantly encounter change and uncertainty when they conduct investment analysis. Many professionals welcome practical guidance to under-stand how to respond and incorporate new ideas into their work.
Private equity analysis is a case in point. A distinguishing fea-ture of VC companies is the substantial uncertainty around their future prospects. Because of this uncertainty, traditional valuation techniques, such as discounted cash flow and earnings multiples, are not appropriate for most VC companies. This uncertainty generally requires VC companies to undertake financing in multiple stages or rounds, and investors must be able to understand and measure the ownership dilution that occurs at each stage and identify who bears the burden of this dilution.
The deployment of technical analysis is designed to mitigate uncertainty, too. Fundamental theorists argue that markets are effi-cient and that prices will reflect fundamental indicators over the long term. Technicians, in contrast, believe that human impacts on mar-kets ensure that prices are irrational and emotional, both in the short and long term. These two trains of thought are not always mutually exclusive: Although fundamental data are critical for measuring value, the data are analyzed by humans, who are driven by motiva-tions that are not rational. So while technical analysis and funda-mental analysis can be seen as opposing approaches, in reality, many investors like to combine the two techniques. They may, for instance, identify an undervalued stock using fundamental analysis and then apply technical analysis to time buying and selling the stock.

Why Does It Matter to Members?
© 2020 CFA Institute. All rights reserved. 7
The new “Pricing and Valuation of Forward Commitments” read-ing represents a clearer and more practical approach for special-ist professionals who use forwards and swaps to manage a broad range of market risks. The content is useful for anyone who wants to understand the work of, say, a private wealth manager using futures to hedge clients’ equity risk, a pension scheme manager using swaps to hedge interest rate risk, or a manager of a university endow-ment using derivatives for tactical asset allocation and portfolio rebalancing.
8 Members’ Guide to 2021 Refresher Readings
Technical AnalysisAksel Kibar, CMT, Barry M. Sine, and Robert A. Strong, PhD, CFAAksel Kibar, CMT, is at Tech Charts Research & Trading (Bulgaria). Barry M. Sine is at Drexel Hamilton, LLC (USA). Robert A. Strong, PhD, CFA, is at the University of Maine (USA).
Learning Outcomes
The candidate should be able to:
a. explain principles and assumptions of technical analysis;
b. describe potential links between technical analysis and behav-ioral finance;
c. compare principles of technical analysis and fundamental analysis;
d. describe and interpret different types of technical analysis charts;
e. explain uses of trend, support, and resistance lines;
f. explain common chart patterns;
g. explain common technical indicators;
h. describe principles of intermarket analysis; and
i. explain technical analysis applications to portfolio management.

Technical Analysis
© 2020 CFA Institute. All rights reserved. 9
Introduction
Technical analysis has been used by traders, analysts, and inves-tors for centuries and has achieved broad acceptance among regu-lators and the academic community—particularly with regard to its behavioral finance aspects. This reading gives a brief overview of the field, compares technical analysis with other schools of analysis, and describes some of the main tools used in technical analysis. Although technical analysis follows predefined rules and principles, the interpretation of results is generally subjective. That is, although certain aspects, such as the calculation of indicators, follow specific rules, the interpretation of findings is often based on a melding of techniques that suit the style and approach of the indi-vidual analyst. In this respect, technical analysis is similar to fun-damental analysis, which has specific rules for calculating ratios, for example, but introduces increased subjectivity in the evaluation phase.
Summary
• Technical analysis is a form of security analysis that uses price data and volume data, typically displayed graphically in charts. The charts are analyzed using various indicators in order to make investment recommendations.
• Technical analysis has three main principles and assumptions: (1) The market discounts everything, (2) prices move in trends and countertrends, and (3) price action is repetitive, with certain patterns reoccurring.

Investment Analysis
10 Members’ Guide to 2021 Refresher Readings
• Increasingly, analysts, fund managers, and individual investors are studying the basic principles of technical analysis to support their decision making in financial markets. Behavioral finance, which is the study of the influence of psychology on the behav-ior of investors, focuses on the fact that investors are not always rational, have limits to their self-control, and are influenced by their own biases. This relatively new field of finance is motivat-ing more practitioners to consider technical analysis as a tool for understanding and explaining irrationalities in financial markets.
• Technical analysis can be used on any freely traded security in the global market and is used on a wide range of financial instru-ments, such as equities, bonds, commodities, currencies, and futures. However, in general, technical analysis is most effec-tively applied to liquid markets. Therefore, technical analysis has limited usefulness for illiquid securities, where a small trade can have a large impact on prices.
• The primary tools used in technical analysis are charts and indi-cators. Charts are graphical displays of price and volume data. Indicators are approaches to analyzing the charts. While the tools can be used on a standalone basis, many analysts, fund managers, and investors will find added value in combining the techniques of chart analysis with their own research and invest-ment approach.
• Charts provide information about past price behavior and pro-vide a basis for inferences about likely future price behavior. Basic charts include line charts, bar charts, and candlestick charts.
• Charts can be drawn either to a linear scale or to a logarith-mic scale. A logarithmic scale is appropriate when the data move through a range of values representing several orders of

Technical Analysis
© 2020 CFA Institute. All rights reserved. 11
magnitude (e.g., from 10 to 10,000), whereas a linear scale is bet-ter suited to narrower ranges (e.g., $35 to $50).
• Volume is an important element of technical analysis and is often included on charts. Volume can be viewed as a confirmation in that it indicates the strength or conviction of buyers and sellers in determining a security’s price.
• One of the most important steps in successfully applying technical analysis is to define the time period being analyzed. Technical analysis and charting become more reliable as the time scale increases from intraday to daily, weekly, and even monthly. Analysts and investors whose primary research method is funda-mental analysis will find more value in charting instruments on a weekly and/or a monthly scale. Longer time frames allow ana-lysts and investors to better identify the consolidation and trend periods and time their purchases or sales of securities.
• Several basic concepts can be applied to charts. These include relative strength analysis, trend, consolidation, support, resis-tance, and change in polarity.
• Relative strength analysis is based on the ratio of the prices of a security and a benchmark and is used to compare the perfor-mance of one asset with the performance of another asset.
• The concept of trend is an important aspect of technical analysis. An uptrend is defined as a sequence of higher highs and higher lows. To draw an uptrend line, a technician draws a line con-necting the lows on the price chart. A downtrend is defined as a sequence of lower highs and lower lows. To draw a downtrend line, a technician draws a line connecting the highs on the price chart.
• Support is defined as a low price range in which the price stops declining because of buying activity. It is the opposite of

Investment Analysis
12 Members’ Guide to 2021 Refresher Readings
resistance, which is a price range in which price stops rising because of selling activity.
• Chart patterns are formations appearing on price charts that cre-ate some type of recognizable shape. There are two major types of chart patterns: reversal patterns and continuation patterns.
• Reversal patterns signal the end of a trend. Common reversal patterns are head and shoulders (H&S), inverse H&S, double top, double bottom, triple top, and triple bottom.
• Continuation patterns indicate that a market trend that was in place prior to the pattern formation will continue once the pat-tern is completed. Common continuation patterns are triangles (symmetrical, ascending, and descending), rectangles (bullish and bearish), flags, and pennants.
• Technical indicators are used to derive additional information from basic chart patterns. An indicator is any measure based on price, market sentiment, or fund flows that can be used to predict changes in price. Mathematically calculated indicators usually have a supply-and-demand underpinning. Basic types of indicators include price-based indicators, momentum oscillators, and sentiment indicators.
• Price-based indicators incorporate information contained in market prices. Common price-based indicators include the mov-ing average and Bollinger Bands.
• The moving average is the average of the closing prices of a secu-rity over a specified number of periods. Moving averages are a smoothing technique that gives the technical analyst a view of market trends. So, a moving average can be viewed as a trend filter. Long-term moving averages can provide important signals. A price move above the long-term moving average is a sign of an

Technical Analysis
© 2020 CFA Institute. All rights reserved. 13
uptrend. A price move below the long-term moving average is a sign of a downtrend.
• When a short-term moving average crosses over a longer-term moving average from underneath, this movement is considered a bullish indicator and is called a “bullish crossover.” When a short-term moving-average crosses over a longer-term moving average from above, this movement is a bearish indicator and is called a “bearish crossover.”
• Bollinger Bands combine the concept of a moving average with standard deviations around the moving average. This tool is use-ful in defining a trading range for the security being analyzed. The Bollinger Band width indicator provides an indication of volatility. The idea is that periods of low volatility are followed by periods of high volatility, so that a relatively narrow band width can foreshadow an advance or decline in the security under analysis.
• Momentum oscillators are constructed from price data, but they are calculated so that they fluctuate between a low and a high, typically between 0 and 100. Some examples of momentum oscillators include rate-of-change (ROC) oscillators, the rela-tive strength index (RSI), stochastic oscillators, and the MACD (moving-average convergence/divergence oscillator).
• Momentum oscillators can be viewed as graphical representa-tions of market sentiment that show when selling or buying activity is more aggressive than usual. Technical analysts also look for convergence or divergence between oscillators and price. For example, when the price reaches a new high, this outcome is usually considered “bullish.” But if the momentum oscillator does not also reach a new high, this scenario is considered diver-gence and an early warning sign of weakness.

Investment Analysis
14 Members’ Guide to 2021 Refresher Readings
• Momentum oscillators also alert the technical analyst to over-bought or oversold conditions. For example, in an oversold con-dition, market sentiment is considered unsustainably bearish.
• Sentiment indicators attempt to gauge investor activity for signs of increasing bullishness or bearishness. Commonly used calcu-lated statistical indexes are the put–call ratio, the VIX, and mar-gin debt.
• Intermarket analysis combines technical analysis of the major categories of securities—namely, equities, bonds, currencies, and commodities—to identify market trends and possible inflections in trends. Intermarket analysis also looks at industry subsectors and their relationship to sectors and industries. In addition, it measures the relative performance of major equity benchmarks around the globe.
• Technical analysis can use either a top-down approach or a bottom-up approach to analyze securities. The top-down method is useful for identifying outperforming asset classes, countries, or sectors. This approach can add value to asset allocation deci-sions. Allocation shifts can occur within an asset class or across asset classes. The bottom-up method is useful for identifying individual stocks, commodities, or currencies that are outper-forming, irrespective of market, industry, or macro trends.
• The technical analyst can add value to an investment team by providing trading/investment ideas through either top-down or bottom-up analysis, depending on the nature of the investment firm or fund. In addition, technical analysis can add value to a fundamental portfolio approach by providing input on the tim-ing of the purchase or sale of a security.

© 2020 CFA Institute. All rights reserved. 15
Pricing and Valuation of Forward CommitmentsAdam Schwartz, PhD, CFAAdam Schwartz, PhD, CFA, is at Bucknell University (USA).CFA Institute would like to thank Robert Brooks, PhD, CFA, and Barbara Valbuzzi, CFA, for their contributions to earlier versions of this reading.
Learning Outcomes
The candidate should be able to:
a. describe the carry arbitrage model without underlying cash flows and with underlying cash flows;
b. describe how equity forwards and futures are priced, and calcu-late and interpret their no-arbitrage value;
c. describe how interest rate forwards and futures are priced, and calculate and interpret their no-arbitrage value;
d. describe how fixed-income forwards and futures are priced, and calculate and interpret their no-arbitrage value;
e. describe how interest rate swaps are priced, and calculate and interpret their no-arbitrage value;
f. describe how currency swaps are priced, and calculate and inter-pret their no-arbitrage value; and

Investment Analysis
16 Members’ Guide to 2021 Refresher Readings
g. describe how equity swaps are priced, and calculate and inter-pret their no-arbitrage value.
Introduction
Forward commitments include forwards, futures, and swaps. A for-ward contract is a promise to buy or sell an asset at a future date at a price agreed to at the contract’s initiation. The forward contract has a linear payoff function, with both upside and downside risk.
A swap is essentially a promise to undertake a transaction at a set price or rate at several dates in the future. The technique we use to price and value swaps is to identify and construct a portfolio with cash flows equivalent to those of the swap. Then, we can use tools, such as the law of one price, to determine swap values from simpler financial instruments, such as a pair of bonds with a cash flow pat-tern similar to those of our swap.
Look out for the big picture: value additivity, arbitrage, and the law of one price are important valuation concepts.
Forwards and swaps are widely used in practice to manage a broad range of market risks. As well, more complex derivative instru-ments can sometimes be understood in terms of their basic building blocks: forwards and option-based components. Here are just some of the many and varied uses for forwards, futures, and swaps that you might encounter in your investment career:
• Use of equity index futures and swaps by a private wealth man-ager to hedge equity risk in a low tax basis, concentrated position in his high-net-worth client’s portfolio.
Pricing and Valuation of Forward Commitments
© 2020 CFA Institute. All rights reserved. 17
• Use of interest rate swaps by a defined benefits plan manager to hedge interest rate risk and to manage the pension plan’s dura-tion gap.
• Use of derivatives (e.g., total return swaps, equity futures, bond futures) overlays by a university endowment for tactical asset allocation and portfolio rebalancing.
• Use of interest rate swaps by a corporate borrower to syntheti-cally convert floating-rate debt securities to fixed-rate debt secu-rities (or vice versa).
• Use of VIX futures and inflation swaps by a firm’s market strat-egist to infer expectations about market volatility and inflation rates, respectively.
Summary
This reading on forward commitment pricing and valuation provides a foundation for understanding how forwards, futures, and swaps are both priced and valued.
Key points include the following:
• The arbitrageur would rather have more money than less and abides by two fundamental rules: Do not use your own money, and do not take any price risk.
• The no-arbitrage approach is used for the pricing and valuation of forward commitments and is built on the key concept of the law of one price, which states that if two investments have the same future cash flows, regardless of what happens in the future, these two investments should have the same current price.

Investment Analysis
18 Members’ Guide to 2021 Refresher Readings
• Throughout this reading, the following key assumptions are made:
■ Replicating and offsetting instruments are identifiable and investable.
■ Market frictions are nil.
■ Short selling is allowed with full use of proceeds.
■ Borrowing and lending are available at a known risk-free rate.
• Carry arbitrage models used for forward commitment pricing and valuation are based on the no-arbitrage approach.
• With forward commitments, there is a distinct difference between pricing and valuation. Pricing involves the determina-tion of the appropriate fixed price or rate, and valuation involves the determination of the contract’s current value expressed in currency units.
• Forward commitment pricing results in determining a price or rate such that the forward contract value is equal to zero.
• Using the carry arbitrage model, the forward contract price (F0) is:
F0 = FV(S0) = S0(1 + r)T (assuming annual compounding, r)
F0 = FV(S0) = S0exprcT (assuming continuous compounding, rc)
• The key forward commitment pricing equations with carry costs (CC) and carry benefits (CB) are:
F0 = FV[S0 + CC0 – CB0] (with discrete compounding)
F0 = S0 exp(rc + CC – CB)T (with continuous compounding)
Futures contract pricing in this reading can essentially be treated the same as forward contract pricing.

Pricing and Valuation of Forward Commitments
© 2020 CFA Institute. All rights reserved. 19
• The value of a forward commitment is a function of the price of the underlying instrument, financing costs, and other carry costs and benefits.
• The key forward commitment valuation equations are:
Long Forward: Vt = PV[Ft – F0] [Ft – F0](1 + r)T – t
and
Short Forward: –Vt = PV[F0 – Ft] [F0 – Ft](1 + r)T – t
,
with the present value (PV) of the difference in forward prices adjusted for carry costs and benefits. Alternatively,
Long Forward: Vt = St – PV[F0] = St – F0
(1 + r)T – t
and
Short Forward: –Vt = PV[F0] – St = F0
(1 + r)T – t – St.
• With equities and fixed-income securities, the forward price is determined such that the initial forward value is zero.
• A forward rate agreement (FRA) is a forward contract on interest rates. The FRA’s fixed interest rate is determined such that the initial value of the FRA is zero.
• FRA settlements amounts at Time h are:
Pay-fixed (long): NA × {[Lm – FRA0] tm}/[1 + Dmtm] and
Receive-fixed (short): NA × {FRA0 – Lm] tm}/[1 + Dmtm].

Investment Analysis
20 Members’ Guide to 2021 Refresher Readings
• The FRA’s fixed interest rate (annualized) at contract initiation is:
FRA0 = {[1 + LTtT]/[1 + Lhth] – 1}/tm.
• The Time g value of an FRA initiated at Time 0 is:
Long FRA: Vg = NA × {[FRAg – FRA0] tm}/[1+ D(T–g) t(T–g)] and
Short FRA: –Vg = NA × {[FRA0 – FRAg] tm}/[1+ D(T–g) t(T–g)]. • The fixed-income forward (or futures) price including conversion
factor (i.e., adjusted price) is:
F0 = Q0 × CF = FV[S0 + CC0 – CB0] = FV[B0 + AI0 – PVCI],
and the conversion factor adjusted futures price (i.e., quoted futures price) is:
Q0 = [1/CF] {FV [B0 + AI0] – AIT – FVCI}.
• The general approach to pricing and valuing swaps as covered here is using a replicating portfolio or offsetting portfolio of comparable instruments, typically bonds for interest rate and currency swaps and equities plus bonds for equity swaps.
• The swap pricing equation, which sets rFIX for the implied fixed bond in an interest rate swap, is:
rFIX ∑( )( )
= −
=
r1 PV 1
PV 1FIX
n
i
ni1
.
• The value of an interest rate swap at a point in Time t after ini-tiation is the sum of the present values of the difference in fixed swap rates times the stated notional amount, or:
∑( )= × − ×=
V NA FS FS PVSWAP t t i
ni, 10 (Value of
receive-fixed swap)
Pricing and Valuation of Forward Commitments
© 2020 CFA Institute. All rights reserved. 21
and
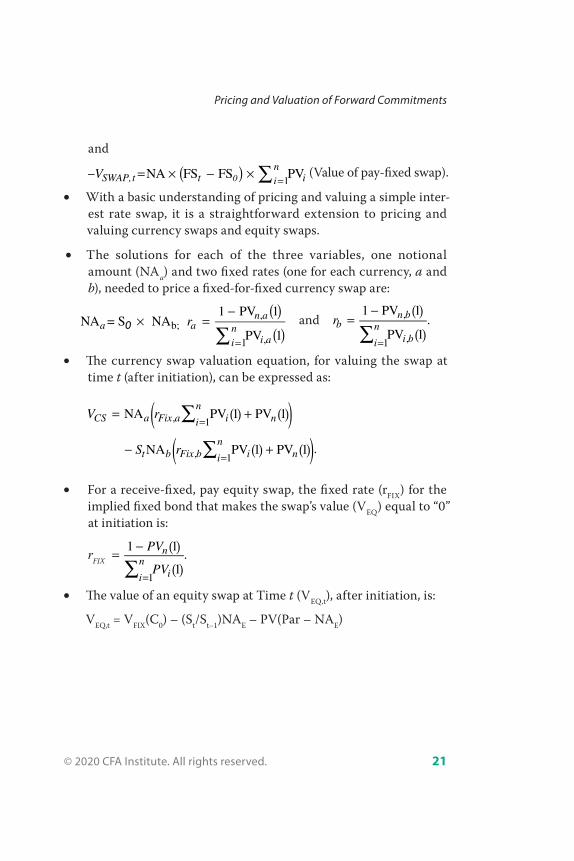
∑)(− = × − × =V NA FS FS PVSWAP,t t in
i10 (Value of pay-fixed swap).
• With a basic understanding of pricing and valuing a simple inter-est rate swap, it is a straightforward extension to pricing and valuing currency swaps and equity swaps.
• The solutions for each of the three variables, one notional amount (NAa) and two fixed rates (one for each currency, a and b), needed to price a fixed-for-fixed currency swap are:
∑))
((
× =−
=
rNA = S NA1 PV 1
PV 1a a
n a
in
i ab;
,
1 ,0 and
∑( )( )
=−
=
r1 PV 1
PV 1.b
n b
i
ni b
,
1 ,
• The currency swap valuation equation, for valuing the swap at time t (after initiation), can be expressed as:
∑
∑
( )( )
( ) ( )
( ) ( )
= +
− +
=
=
V r
S r
NA PV 1 PV 1
NA PV 1 PV 1
CS a Fix a i ni
n
t b Fix b i ni
n
, 1
, 1.
• For a receive-fixed, pay equity swap, the fixed rate (rFIX) for the implied fixed bond that makes the swap’s value (VEQ) equal to “0” at initiation is:
rFIX ∑( )( )
= −
=
rPV
PV
1 1
1
n
i
ni1
FIX.
• The value of an equity swap at Time t (VEQ,t), after initiation, is:
VEQ,t = VFIX(C0) – (St/St–1)NAE – PV(Par – NAE)

Investment Analysis
22 Members’ Guide to 2021 Refresher Readings
where VFIX (C0) is the Time t value of a fixed-rate bond initiated with coupon C0 at Time 0, St is the current equity price, St–1 is the equity price at the last reset date, and PV() is the PV function from the swap maturity date to Time t.

© 2020 CFA Institute. All rights reserved. 23
Private Equity InvestmentsYves Courtois, CMT, MRICS, CFA, and Tim Jenkinson, PhDYves Courtois, CMT, MRICS, CFA, is at KPMG (Luxembourg). Tim Jenkinson, PhD, is at Saïd Business School, Oxford University (United Kingdom).
Learning Outcomes
The candidate should be able to:
a. explain sources of value creation in private equity;
b. explain how private equity firms align their interests with those of the managers of portfolio companies;
c. distinguish between the characteristics of buyout and venture capital (VC) investments;
d. interpret the leveraged buyout (LBO) model and VC method output;
e. explain alternative exit routes in private equity and their impact on value;
f. explain risks and costs of investing in private equity;
g. explain private equity fund structures, terms, due diligence, and valuation in the context of an analysis of private equity fund returns;
h. interpret and compare financial performance of private equity funds from the perspective of an investor; and

Investment Analysis
24 Members’ Guide to 2021 Refresher Readings
i. calculate management fees, carried interest, net asset value, dis-tributed to paid in (DPI), residual value to paid in (RVPI), and total value to paid in (TVPI) of a private equity fund.
Introduction
Private equity’s shift from a niche activity to a critical component of the financial system is evident from investors’ financial commitment: around $2.8 trillion globally as of mid-2018. And that’s just the equity portion. The use of debt means transaction value is often two or three times the actual equity raised. Blackstone, Carlyle, and KKR are household names and publicly traded companies of significant size. Private equity funds may account for 15–18% of the value of all mergers and acquisitions, and the market capitalization of Alibaba, Amazon, Facebook, and Google has raised the profile of venture capital (VC) investing.
We take two approaches to illuminate our subject: In Section 2, the perspective is primarily that of the private equity firm evaluating potential investments. Valuing acquisitions is particularly complex; except for public-to-private transactions, there will be no market prices to refer to, and the challenges are considerable. In Section 3, we take the perspective of an outside investor investing in a fund sponsored by the private equity firm.
Definitions of private equity differ, but here we include the entire asset class of equity investments that are not quoted on stock mar-kets. Private equity stretches from VC, working with early stage com-panies that may be without revenues but that possess good ideas or technology; to growth equity, providing capital to expand established private businesses often by taking a minority interest; all the way to large buyouts (leveraged buyouts, or LBOs), in which the private

Private Equity Investments
© 2020 CFA Institute. All rights reserved. 25
equity firm buys the entire company. When the target is publicly traded, the private equity fund performs a public-to-private transac-tion, removing the target from the stock market. But buyout transac-tions usually involve private companies and very often a particular division of an existing company.
Some exclude VC from the private equity universe because of the higher risk profile of backing new companies as opposed to mature ones. For this reading, we refer simply to venture capital and buyouts as the two main forms of private equity.
Many classifications of private equity are available. Classifications proposed by the European and Private Equity Venture Capital Association (EVCA) are displayed in Exhibit 1.
Exhibit 1. Classification of Private Equity in Terms of
Stage and Type of Financing of Portfolio Companies
Broad Category Subcategory Brief Description
Venture capital
Seed stage Financing provided to research business ideas, develop prototype products, or conduct market research
Start-up stage Financing to recently created compa-nies with well-articulated business and marketing plans
Later (expansion) stage
Financing to companies that have started their selling effort and may already be covering costs: Financing may serve to expand production capacity, product development, or provide working capital
(Continued)

Investment Analysis
26 Members’ Guide to 2021 Refresher Readings
Broad Category Subcategory Brief Description
Replacement capital
Financing provided to purchase shares from other existing VC investors or to reduce financial leverage
Growth Expansion capital Financing to established and mature companies in exchange for equity, often a minority stake, to expand into new markets or improve operations
Buyout Acquisition capital
Financing in the form of debt, equity, or quasi-equity provided to a company to acquire another company
Leveraged buyout Financing provided by an LBO firm to acquire a company
Management buyout
Financing provided to the management to acquire a company, specific product line, or division (carve-out)
Special situations
Mezzanine finance
Financing generally provided in the form of subordinated debt and an equity kicker (e.g., warrants, equity) frequently in the context of LBO transactions
Distressed/turn-around
Financing of companies in need of restructuring or facing financial distress
One-time opportunities
Financing in relation to changing industry trends and new government regulations
Other Other forms of private equity financing are also possible (e.g., activist investing, funds of funds, and secondaries)
Exhibit 1. (Continued)

Private Equity Investments
© 2020 CFA Institute. All rights reserved. 27
Private equity funds may also be classified geographically, by sector, or both. Certain specialists target real asset classes, such as real estate, infra-structure, energy, and timber, or they seek out emerging or niche sectors, such as agribusiness or royalties in pharmaceuticals, music, film, or TV.
US private equity enjoyed a far larger market size historically than private equity in other regions, with few restrictions on hostile takeovers. Buyouts subsequently expanded to Europe and then Asia as friendly deals became commonplace. In broad terms, around four-fifths of the money has been flowing into buyout, growth, and other types of private equity in both the United States and Europe, with buyout amounts far exceeding other types. The sheer scale of buyouts means that an individual deal can absorb billions of dollars in capital. Buyout funds have benefited from increased allocations given their ability to absorb far higher capital amounts and to deliver historically higher-than-average returns.
VC deals, in contrast, tend to drip, providing small amounts of feed money. Still, advances in technology and communications are causing the number of VC funds and the availability of start-up capi-tal to grow. Investor attention started to shift to China in 2015, an especially active year for raising capital. VC funds targeting Asia had more than US$200 billion in 2017, up from US$50 billion in 2010.
Most private equity money comes from institutional inves-tors, such as pension funds, sovereign wealth funds, endowments, and insurance companies, although many family offices and high-net-worth individuals also invest directly or through fund-of-funds intermediaries. VC investors include government agencies and cor-porations seeking to promote regional investment or gain insight into, and possibly control of, emerging businesses and technologies.
Private equity investment is characterized by a buy-to-sell ori-entation: Investors typically expect their money to be returned, with a handsome profit, within 10 years of committing their funds. The economic incentives of the funds are aligned with this goal.

Investment Analysis
28 Members’ Guide to 2021 Refresher Readings
Summary
• Private equity funds seek to add value by various means, includ-ing optimizing financial structures, incentivizing management, and creating operational improvements.
• Private equity can be thought of as an alternative system of gov-ernance for corporations: Rather than ownership and control being separated as in most publicly quoted companies, private equity concentrates ownership and control. Many view the com-bination of ownership and control as a fundamental source of the returns earned by the best private equity funds.
• A critical role for the general partner is valuation of potential investments. But because these investments are usually privately owned, valuation encounters many challenges.
• Valuation techniques differ according to the nature of the invest-ment. Early stage ventures require very different techniques than leveraged buyouts. Private equity professionals tend to use multiple techniques when performing a valuation, and they explore many different scenarios for the future development of the business.
• In buyouts, the availability of debt financing can have a big impact on the scale of private equity activity, and it seems to affect valuations observed in the market.
• Because private equity funds are incentivized to acquire, add value, and then exit within the lifetime of the fund, they are considered buy-to-sell investors. Planning the exit route for the investment is a critical role for the GP, and a well-timed and well-executed investment can be a significant source of realized value.

Private Equity Investments
© 2020 CFA Institute. All rights reserved. 29
• In addition to the problems encountered by the private equity funds in valuing potential portfolio investments, challenges exist in valuing the investment portfolio on an ongoing basis. This is because the investments have no easily observed market value and there is a large element of judgment involved in valuing each of the portfolio companies prior to their sale by the fund.
• The two main metrics for measuring the ongoing and ultimate performance of private equity funds are internal rate of return (IRR) and multiples. Comparisons of private equity returns across funds and with other assets are demanding because it is important to control for the timing of cash flows, differences in risk and portfolio composition, and vintage-year effects.

This page intentionally left blank

© 2020 CFA Institute. All rights reserved. 31
Data ScienceApplicable Readings
Organizing, Visualizing, and Describing Data (Level I)By Pamela Peterson Drake, PhD, CFA, and Jian Wu, PhD 3.75 PL Credits Access the full reading: https://www.cfainstitute.org/membership/ professional-development/refresher-readings/organizing- visualizing-and-describing-data
Machine Learning (Level II)By Kathleen DeRose, CFA, Matthew Dixon, PhD, FRM, and Christophe Le Lannou 2.5 PL Credits Access the full reading: https://www.cfainstitute.org/membership/professional-development/refresher-readings/machine-learning
Backtesting and Simulation (Level II)By Yin Luo, CPA, PStat, CFA, and Sheng Wang 3 PL Credits Access the full reading: https://www.cfainstitute.org/membership/professional-development/refresher-readings/backtesting-and-simulation
https://www.cfainstitute.org/membership/professional-development/refresher-readings/machine-learning

32 Members’ Guide to 2021 Refresher Readings
What Is Changing in the 2021 Curriculum?Investment firms increasingly are using data analysis across the investment management value chain—from improving their under-standing of clients, to uncovering new sources of alpha, to executing trades more efficiently.
The new “Organizing, Visualizing, and Describing Data” reading provides the foundation for data-driven quantitative methods such as backtesting, simulation, machine learning, and big data projects. It covers a number of visualization techniques, such as tree maps, word clouds, and heat maps, which are key to understanding the inputs and outputs of investment analyses and strategies. The reading also contains a wealth of visuals and graphics to aid understanding of the application of technology in the investment industry.
Machine learning techniques first appeared in finance in the 1990s and have greatly developed in recent years amid the explosion of data and cheap computing power. The revised “Machine Learning” reading adds three case studies using real-world investment data to demonstrate the power of machine learning in everyday practice.
In the first case, a research analyst uses machine learning to identify the best- and worst-performing exchange-traded funds (ETFs) and mutual funds, out of a universe of some 6,000-plus mutual funds and nearly 1,600 ETFs. The analyst trains a model to classify the winners and losers and then repurposes the model to pre-dict future outperformers. In the second case, an endowment fund seeks three “buy” recommendations for its large-cap equity portfolio. An analyst is instructed to assess stocks in the S&P 500 and deter-mine the correlation of their returns for diversification purposes. The

What Is Changing in the 2021 Curriculum?
© 2020 CFA Institute. All rights reserved. 33
analyst uses a “clustering” machine learning technique to search for stocks with low correlation to each other.
In the third case, an investment manager wants to select stocks based on their predicted performance using a fundamental equity factor model. The manager seeks to capture superior performance using a nonlinear factor model and chooses a deep neural network to perform a task that otherwise would be challenging and very time intensive.
This year, we are excited to present the material in our “Machine Learning” and “Organizing, Visualizing, and Describing Data” read-ings in interactive, online learning modules (in addition to the PDF and EPUB files we typically offer), eligible for Professional Learning credit.
A brand new reading, “Backtesting and Simulation,” is the first in the CFA Program curriculum to explore the A to Z of backtesting and simulating innovative investment strategies. The rise of big data and the increase in computing power have spurred the development of quantitative investing and almost every major data vendor now offers tools that make systematic backtesting and simulation acces-sible to professional investors. The essential elements of backtesting and simulation are presented through a portfolio construction exer-cise using eight well-known equity factors. The factors are used to construct two portfolios—equal factor weighted and risk-parity fac-tor weighted—which are then backtested to compare their risk and return profiles. The backtesting is presented through clear visuals and graphics, and without complex math.

34 Members’ Guide to 2021 Refresher Readings
Why Does It Matter to Members?With the rise of big data and machine learning techniques, invest-ment practitioners can explore and exploit an abundance of informa-tion to feed and enhance their investment strategies.
Although a data-rich environment offers tremendous oppor-tunities for investors, turning data into useable information is not straightforward. Organizing, cleaning, and analyzing data are crucial to the development of successful investment strategies: otherwise, analysts risk a “garbage in, garbage out” scenario in which expected outcomes do not materialize in the real world.
It is often said that 80% of analysts’ time is spent on finding, organizing, cleaning, and analyzing data, whereas just 20% of their time is devoted to model development. So the importance of having a properly organized, cleansed, and well-analyzed dataset cannot be overemphasized. Using visual tools and quantitative methods, like the ones covered in the “Organizing, Visualizing, and Describing Data” reading, is an important first step to organizing data so that it can become a material input into an investment strategy. These essential data concepts pave the way to the use of more sophisticated tools to manage asset classes and employ investment techniques that are presented later in the CFA Program curriculum.
Understanding the concepts and methods behind backtesting and simulation, as well as being capable of interpreting their outputs, have become key competencies for investment managers. Without risking the capital of portfolio managers and their clients, backtest-ing and simulation enable practitioners to simulate the performance of investment strategies using historical data. In a CFA Institute

Why Does It Matter to Members?
© 2020 CFA Institute. All rights reserved. 35
survey of nearly 250 analysts, portfolio managers, and private wealth managers on quantitative investment techniques, 50% of respondents said they had conducted backtesting in the past 12 months.
The “Machine Learning” reading and the new case studies are designed to provide the generalist investment practitioner with the essential information, including key terminology, needed to interact effectively with machine learning specialists. The reading is designed to equip investment practitioners with a basic understanding of the types of investment problems that machine learning can address, how the algorithms work, and the vocabulary to interact with machine learning and data science experts.
Investment practitioners need not master the details and math-ematics of machine learning, but practitioners can play an important role in the implementation of these techniques by sourcing model inputs, helping interpret model outputs, and translating outputs into investment actions that increase the value of portfolios.

36 Members’ Guide to 2021 Refresher Readings
Organizing, Visualizing, and Describing DataPamela Peterson Drake, PhD, CFA, and Jian Wu, PhDPamela Peterson Drake, PhD, CFA, is at James Madison University (USA). Jian Wu, PhD, is at State Street (USA).
Learning Outcomes
The candidate should be able to:
a. identify and compare data types;
b. describe how data are organized for quantitative analysis;
c. interpret frequency and related distributions;
d. interpret a contingency table;
e. describe ways that data may be visualized and evaluate uses of specific visualizations;
f. describe how to select among visualization types;
g. calculate and interpret measures of central tendency;
h. select among alternative definitions of mean to address an investment problem;
i. calculate quantiles and interpret related visualizations;
j. calculate and interpret measures of dispersion;

Organizing, Visualizing, and Describing Data
© 2020 CFA Institute. All rights reserved. 37
k. calculate and interpret target downside deviation;
l. interpret skewness;
m. interpret kurtosis; and
n. interpret correlation between two variables.
Introduction
Data have always been a key input for securities analysis and investment management, but the acceleration in the availability and the quantity of data also has been driving the rapid evolution of the investment industry. With the rise of big data and machine learning techniques, investment practitioners are embracing an era featuring large volume, high velocity, and a wide variety of data—allowing them to explore and exploit this abundance of information for their investment strategies.
While this data-rich environment offers potentially tremendous opportunities for investors, turning data into useful information is not so straightforward. Organizing, cleaning, and analyzing data are crucial to the development of successful investment strategies; otherwise, we end up with “garbage in and garbage out” and failed investments. It is often said that 80% of an analyst’s time is spent on finding, organizing, cleaning, and analyzing data, while just 20% of her or his time is taken up by model development. So, the importance of having a properly organized, cleansed, and well-analyzed dataset cannot be overemphasized. With this essential requirement met, an appropriately executed data analysis can detect important relation-ships within data, uncover underlying structures, identify outliers, and extract potentially valuable insights. Utilizing both visual tools and quantitative methods, like the ones covered in this reading, is the

Data Science
38 Members’ Guide to 2021 Refresher Readings
first step in summarizing and understanding data that will be crucial inputs to an investment strategy.
This reading provides a foundation for understanding impor-tant concepts that are an indispensable part of the analytical tool kit needed by investment practitioners, from junior analysts to senior portfolio managers. These basic concepts pave the way for more sophisticated tools that will be developed as the quantitative meth-ods topic unfolds and that are integral to gaining competencies in the investment management techniques and asset classes that are presented later in the CFA Program curriculum.
Section 2 covers core data types, including continuous and discrete numerical data, nominal and ordinal categorical data, and structured versus unstructured data. Organizing data into arrays and data tables and summarizing data in frequency distributions and contingency tables are discussed in Section 3. Section 4 introduces the important topic of data visualization using a range of charts and graphics to sum-marize, explore, and better understand data. Section 5 covers the key measures of central tendency, including several variants of mean that are especially useful in investments. Quantiles and their investment applications are the focus of Section 6. Key measures of dispersion are discussed in Section 7. The shape of data distributions—specifically, skewness and kurtosis—are covered in Sections 8 and 9, respectively. Section 10 provides a graphical introduction to covariance and correla-tion between two variables. The reading concludes with a summary.
Summary
In this reading, we have presented tools and techniques for organiz-ing, visualizing, and describing data that permit us to convert raw data into useful information for investment analysis.

Organizing, Visualizing, and Describing Data
© 2020 CFA Institute. All rights reserved. 39
• Data can be defined as a collection of numbers, characters, words, and text—as well as images, audio, and video—in a raw or organized format to represent facts or information.
• From a statistical perspective, data can be classified as numerical data and categorical data. Numerical data (also called quantita-tive data) are values that represent measured or counted quanti-ties as a number. Categorical data (also called qualitative data) are values that describe a quality or characteristic of a group of observations and usually take only a limited number of values that are mutually exclusive.
• Numerical data can be further split into two types: continuous data and discrete data. Continuous data can be measured and can take on any numerical value in a specified range of values. Discrete data are numerical values that result from a counting process and therefore are limited to a finite number of values.
• Categorical data can be further classified into two types: nomi-nal data and ordinal data. Nominal data are categorical values that are not amenable to being organized in a logical order, while ordinal data are categorical values that can be logically ordered or ranked.
• Based on how they are collected, data can be categorized into three types: cross-sectional, time series, and panel. Time-series data are a sequence of observations for a single observational unit on a specific variable collected over time and at discrete and typically equally spaced intervals of time. Cross-sectional data are a list of the observations of a specific variable from multiple observational units at a given point in time. Panel data are a mix of time-series and cross-sectional data that consist of observa-tions through time on one or more variables for multiple obser-vational units.

Data Science
40 Members’ Guide to 2021 Refresher Readings
• Based on whether or not data are in a highly organized form, they can be classified into structured and unstructured types. Structured data are highly organized in a predefined manner, usually with repeating patterns. Unstructured data do not fol-low any conventionally organized forms; they are typically alter-native data as they are usually collected from unconventional sources.
• Raw data are typically organized into either a one-dimensional array or a two-dimensional rectangular array (also called a data table) for quantitative analysis.
• A frequency distribution is a tabular display of data constructed either by counting the observations of a variable by distinct val-ues or groups or by tallying the values of a numerical variable into a set of numerically ordered bins. Frequency distributions permit us to evaluate how data are distributed.
• The relative frequency of observations in a bin (interval or bucket) is the number of observations in the bin divided by the total number of observations. The cumulative relative frequency cumulates (adds up) the relative frequencies as we move from the first bin to the last, thus giving the fraction of the observations that are less than the upper limit of each bin.
• A contingency table is a tabular format that displays the frequency distributions of two or more categorical vari-ables simultaneously. One application of contingency tables is for evaluating the performance of a classification model (using a confusion matrix). Another application of contin-gency tables is to investigate a potential association between two categorical variables by performing a chi-square test of independence.

Organizing, Visualizing, and Describing Data
© 2020 CFA Institute. All rights reserved. 41
• Visualization is the presentation of data in a pictorial or graphi-cal format for the purpose of increasing understanding and for gaining insights into the data.
• A histogram is a bar chart of data that have been grouped into a frequency distribution. A frequency polygon is a graph of fre-quency distributions obtained by drawing straight lines joining successive midpoints of bars representing the class frequencies.
• A bar chart is used to plot the frequency distribution of categori-cal data, with each bar representing a distinct category and the bar’s height (or length) proportional to the frequency of the cor-responding category. Grouped bar charts or stacked bar charts can present the frequency distribution of multiple categorical variables simultaneously.
• A tree-map is a graphical tool to display categorical data. It con-sists of a set of colored rectangles to represent distinct groups, and the area of each rectangle is proportional to the value of the corresponding group. Additional dimensions of categorical data can be displayed by nested rectangles.
• A word cloud is a visual device for representing textual data, with the size of each distinct word being proportional to the fre-quency with which it appears in the given text.
• A line chart is a type of graph used to visualize ordered observa-tions and often to display the change of data series over time. A bubble line chart is a special type of line chart that uses various size bubbles as data points to represent an additional dimension of data.
• A scatter plot is a type of graph used to visualize the joint varia-tion in two numerical variables. It is constructed by drawing dots to indicate the values of the two variables plotted against

Data Science
42 Members’ Guide to 2021 Refresher Readings
the corresponding axes. A scatter plot matrix organizes scatter plots between pairs of variables into a matrix format to inspect all pairwise relationships between more than two variables in one combined visual.
• A heat map is a type of graphic that organizes and summarizes data in a tabular format and represents them using a color spec-trum. It is often used to display frequency distributions or to visualize the degree of correlation among different variables.
• The key consideration when selecting among chart types is the intended purpose of visualizing data (i.e., whether it is for explor-ing and presenting distributions or relationships or for making comparisons).
• A population is defined as all members of a specified group. A sample is a subset of a population.
• A parameter is any descriptive measure of a population. A sam-ple statistic (statistic, for short) is a quantity computed from or used to describe a sample.
• Sample statistics—such as measures of central tendency, mea-sures of dispersion, skewness, and kurtosis—help with invest-ment analysis, particularly in making probabilistic statements about returns.
• Measures of central tendency specify where data are centered and include the mean, median, and mode (i.e., the most fre-quently occurring value).
• The arithmetic mean is the sum of the observations divided by the number of observations. It is the most frequently used mea-sure of central tendency.

Organizing, Visualizing, and Describing Data
© 2020 CFA Institute. All rights reserved. 43
• The median is the value of the middle item (or the mean of the values of the two middle items) when the items in a set are sorted into ascending or descending order. The median is not influ-enced by extreme values and is most useful in the case of skewed distributions.
• The mode is the most frequently observed value and is the only measure of central tendency that can be used with nominal data. A distribution may be unimodal (one mode), bimodal (two modes), trimodal (three modes), or have even more modes.
• A portfolio’s return is a weighted mean return computed from the returns on the individual assets, where the weight applied to each asset’s return is the fraction of the portfolio invested in that asset.
• The geometric mean, XG , of a set of observations X1, X2, …, Xn, is =X X X X XG n
n1 2 3 , with Xi ≥ 0 for i = 1, 2, …, n. The geomet-
ric mean is especially important in reporting compound growth rates for time-series data. The geometric mean will always be less than an arithmetic mean whenever there is variance in the observations.
• The harmonic mean, XH , is a type of weighted mean in which an observation’s weight is inversely proportional to its magnitude.
• Quantiles—such as the median, quartiles, quintiles, deciles, and percentiles—are location parameters that divide a distribution into halves, quarters, fifths, tenths, and hundredths, respectively.
• A box and whiskers plot illustrates the interquartile range (the “box”) as well as a range outside of the box that is based on the interquartile range, indicated by the “whiskers.”

Data Science
44 Members’ Guide to 2021 Refresher Readings
• Dispersion measures—such as the range, mean absolute devia-tion (MAD), variance, standard deviation, target downside deviation, and coefficient of variation—describe the variability of outcomes around the arithmetic mean.
• The range is the difference between the maximum value and the minimum value of the dataset. The range has only a limited use-fulness because it uses information from only two observations.
• The MAD for a sample is the average of the absolute deviations of observations from the mean,
∑ −=
X X
n
ii
n
1 , where X is the sample mean and n is the number of observations in the sample.
• The variance is the average of the squared deviations around the mean, and the standard deviation is the positive square root of variance. In computing sample variance (s2) and sample standard deviation (s), the average squared deviation is computed using a divisor equal to the sample size minus 1.
• The target downside deviation, or target semideviation, is a mea-sure of the risk of being below a given target. It is calculated as the square root of the average squared deviations from the target, but it includes only those observations below the target (B), or
∑ ( )−−≤
X B
n 1i
X B
n 2
for all i
.
• The coefficient of variation, CV, is the ratio of the standard devia-tion of a set of observations to their mean value. By expressing the magnitude of variation among observations relative to their average size, the CV permits direct comparisons of dispersion

Organizing, Visualizing, and Describing Data
© 2020 CFA Institute. All rights reserved. 45
across different datasets. Reflecting the correction for scale, the CV is a scale-free measure (i.e., it has no units of measurement).
• Skew or skewness describes the degree to which a distribution is asymmetric about its mean. A return distribution with posi-tive skewness has frequent small losses and a few extreme gains compared with a normal distribution. A return distribution with negative skewness has frequent small gains and a few extreme losses compared with a normal distribution. Zero skewness indi-cates a symmetric distribution of returns.
• Kurtosis measures the combined weight of the tails of a distribu-tion relative to the rest of the distribution. A distribution with fatter tails than the normal distribution is referred to as fat-tailed (leptokurtic); a distribution with thinner tails than the normal distribution is referred to as thin-tailed (platykurtic). Excess kur-tosis is kurtosis minus 3, because 3 is the value of kurtosis for all normal distributions.
• The correlation coefficient is a statistic that measures the asso-ciation between two variables. It is the ratio of covariance to the product of the two variables’ standard deviations. A positive correlation coefficient indicates that the two variables tend to move together, whereas a negative coefficient indicates that the two variables tend to move in opposite directions. Correlation does not imply causation, simply association. Issues that arise in evaluating correlation include the presence of outliers and spuri-ous correlation.

46 Members’ Guide to 2021 Refresher Readings
Machine LearningKathleen DeRose, CFA, Matthew Dixon, PhD, FRM, and Christophe Le LannouKathleen DeRose, CFA, is at New York University, Stern School of Business (USA). Matthew Dixon, PhD, FRM, is at Illinois Institute of Technology, Stuart School of Business (USA). Christophe Le Lannou is at dataLearning (United Kingdom).
Learning Outcomes
The candidate should be able to:
a. distinguish between supervised machine learning, unsupervised machine learning, and deep learning;
b. describe overfitting and identify methods of addressing it;
c. describe supervised machine learning algorithms—including penalized regression, support vector machine, k-nearest neigh-bor, classification and regression tree, ensemble learning, and random forest—and determine the problems for which they are best suited;
d. describe unsupervised machine learning algorithms—including principal components analysis, k-means clustering, and hierar-chical clustering—and determine the problems for which they are best suited; and
e. describe neural networks, deep learning nets, and reinforcement learning.

Machine Learning
© 2020 CFA Institute. All rights reserved. 47
Introduction
Investment firms are increasingly using technology at every step of the investment management value chain—from improving their understanding of clients to uncovering new sources of alpha and exe-cuting trades more efficiently. Machine learning (ML) techniques, a central part of that technology, are the subject of this reading. These techniques first appeared in finance in the 1990s and have since flourished with the explosion of data and cheap computing power.
This reading provides a high-level view of ML. It covers a selection of key ML algorithms and their investment applications. Investment practitioners should be equipped with a basic under-standing of the types of investment problems that machine learning can address, an idea of how the algorithms work, and the vocabulary to interact with machine learning and data science experts. While investment practitioners need not master the details and mathemat-ics of machine learning, as domain experts in investments, they can play an important role in the implementation of these techniques by being able to source appropriate model inputs, interpret model out-puts, and translate outputs into appropriate investment actions.
Section 2 gives an overview of machine learning in investment management. Section 3 defines machine learning and the types of problems that can be addressed by supervised and unsupervised learning. Section 4 describes evaluating machine learning algorithm performance. Key supervised machine learning algorithms are cov-ered in Section 5, and Section 6 describes key unsupervised machine learning algorithms. Neural networks, deep learning nets, and rein-forcement learning are covered in Section 7. Section 8 provides a decision flowchart for selecting the appropriate ML algorithm. The reading concludes with a summary.

Data Science
48 Members’ Guide to 2021 Refresher Readings
Summary
Machine learning methods are gaining usage at many stages in the investment management value chain. Among the major points made are the following:
• Machine learning aims at extracting knowledge from large amounts of data by learning from known examples to determine an underly-ing structure in the data. The emphasis is on generating structure or predictions without human intervention. An elementary way to think of ML algorithms is to “find the pattern, apply the pattern.”
• Supervised learning depends on having labeled training data as well as matched sets of observed inputs (Xs, or features) and the associated output (Y, or target). Supervised learning can be divided into two categories: regression and classification. If the target variable to be predicted is continuous, then the task is one of regression. If the target variable is categorical or ordinal (e.g., determining a firm’s rating), then it is a classification problem.
• With unsupervised learning, algorithms are trained with no labeled data, so they must infer relations between features, sum-marize them, or present an underlying structure in their distri-butions that has not been explicitly provided. Two important types of problems well suited to unsupervised ML are dimension reduction and clustering.
• In deep learning, sophisticated algorithms address complex tasks (e.g., image classification, natural language processing). Deep learning is based on neural networks, highly flexible ML algorithms for solving a variety of supervised and unsupervised tasks characterized by large datasets, nonlinearities, and inter-actions among features. In reinforcement learning, a computer

Machine Learning
© 2020 CFA Institute. All rights reserved. 49
learns from interacting with itself or data generated by the same algorithm.
• Generalization describes the degree to which an ML model retains its explanatory power when predicting out of sample. Overfitting, a primary reason for lack of generalization, is the tendency of ML algorithms to tailor models to the training data at the expense of generalization to new data points.
• Bias error is the degree to which a model fits the training data. Variance error describes how much a model’s results change in response to new data from validation and test samples. Base error is due to randomness in the data. Out-of-sample error equals bias error plus variance error plus base error.
• K-fold cross-validation is a technique used to mitigate the hold-out sample problem (excessive reduction of the training set size). The data (excluding test sample and fresh data) are shuffled randomly and then divided into k equal sub-samples, with k – 1 samples used as training samples and one sample, the kth, used as a validation sample.
• Regularization describes methods that reduce statistical variabil-ity in high-dimensional data estimation or prediction problems by reducing model complexity.
• Least absolute shrinkage and selection operator (LASSO) is a popular type of penalized regression in which the penalty term involves summing the absolute values of the regression coeffi-cients. The greater the number of included features, the larger the penalty. So, a feature must make a sufficient contribution to model fit to offset the penalty from including it.
• Support vector machine (SVM) is a classifier that aims to seek the optimal hyperplane—the one that separates the two sets of

Data Science
50 Members’ Guide to 2021 Refresher Readings
data points by the maximum margin (and thus is typically used for classification).
• K-nearest neighbor (KNN) is a supervised learning technique most often used for classification. The idea is to classify a new observation by finding similarities (“nearness”) between it and its k-nearest neighbors in the existing dataset.
• Classification and regression tree (CART) can be applied to pre-dict either a categorical target variable, producing a classification tree, or a continuous target variable, producing a regression tree.
• A binary CART is a combination of an initial root node, deci-sion nodes, and terminal nodes. The root node and each deci-sion node represent a single feature ( f ) and a cutoff value (c) for that feature. The CART algorithm iteratively partitions the data into sub-groups until terminal nodes are formed that contain the predicted label.
• Ensemble learning is a technique of combining the predictions from a collection of models. It typically produces more accurate and more stable predictions than any single model.
• A random forest classifier is a collection of many different deci-sion trees generated by a bagging method or by randomly reduc-ing the number of features available during training.
• Principal components analysis (PCA) is an unsupervised ML algorithm that reduces highly correlated features into fewer uncorrelated composite variables by transforming the feature covariance matrix. PCA produces eigenvectors that define the principal components (i.e., the new uncorrelated composite variables) and eigenvalues, which give the proportion of total variance in the initial data that are explained by each eigenvector and its associated principal component.

Machine Learning
© 2020 CFA Institute. All rights reserved. 51
• K-means is an unsupervised ML algorithm that partitions obser-vations into a fixed number (k) of nonoverlapping clusters. Each cluster is characterized by its centroid, and each observation belongs to the cluster with the centroid to which that observa-tion is closest.
• Hierarchical clustering is an unsupervised iterative algorithm that is used to build a hierarchy of clusters. Two main strat-egies are used to define the intermediary clusters (i.e., those clusters between the initial dataset and the final set of clus-tered data).
• Agglomerative (bottom-up) hierarchical clustering begins with each observation being its own cluster. Then, the algorithm finds the two closest clusters, defined by some measure of dis-tance, and combines them into a new, larger cluster. This pro-cess is repeated until all observations are clumped into a single cluster.
• Divisive (top-down) hierarchical clustering starts with all obser-vations belonging to a single cluster. The observations are then divided into two clusters based on some measure of distance. The algorithm then progressively partitions the intermediate clusters into smaller clusters until each cluster contains only one observation.
• Neural networks consist of nodes connected by links. They have three types of layers: an input layer, hidden layers, and an out-put layer. Learning takes place in the hidden layer nodes, each of which consists of a summation operator and an activation func-tion. Neural networks have been successfully applied to a variety of investment tasks characterized by nonlinearities and complex interactions among variables.

Data Science
52 Members’ Guide to 2021 Refresher Readings
• Neural networks with many hidden layers (at least 2 but often more than 20) are known as deep neural networks (DNNs) and are the backbone of the artificial intelligence revolution.
• Reinforcement learning (RL) involves an agent that should per-form actions that will maximize its rewards over time, taking into consideration the constraints of its environment.
© 2020 CFA Institute. All rights reserved. 53
Backtesting and SimulationYin Luo, CPA, PStat, CFA, and Sheng WangYin Luo, CPA, PStat, CFA, is at Wolfe Research LLC (USA). Sheng Wang is at Wolfe Research LLC (USA).
Learning Outcomes
The candidate should be able to:
a. describe objectives in backtesting an investment strategy;
b. describe and contrast steps and procedures in backtesting an investment strategy;
c. interpret metrics and visuals reported in a backtest of an invest-ment strategy;
d. identify problems in a backtest of an investment strategy;
e. describe different ways to construct multifactor models;
f. compare methods of modeling randomness;
g. evaluate and interpret a scenario analysis;
h. contrast Monte Carlo and historical simulation;
i. explain inputs and decisions in simulation and interpret a simu-lation; and
j. demonstrate the use of sensitivity analysis.

Data Science
54 Members’ Guide to 2021 Refresher Readings
Introduction
This reading provides an overview of backtesting and simulation of investment strategies. Backtesting and related techniques enable investment practitioners to simulate the performance of investment strategies (especially quantitative strategies) using historical data or data derived from the distributions of historical data, to generate test results, and to analyze risk and return, without investing any real capital in the strategies.
The rise of big data and the increase in computing power have spurred the development and spread of quantitative investing. Almost every major data vendor has available tools that make system-atic backtesting and simulation increasingly accessible. Off-the-shelf software allows backtesting and simulation of endless combinations of possible investment strategies, formulation of multifactor models, and construction of investable portfolios. Developing quantitative investment strategies may appear relatively straightforward, but in reality, it is not. However, understanding the steps and procedures, the implicit assumptions, the pitfalls, and the interpretation of results in backtesting and simulation is a prerequisite for proper uti-lization of these tools and successful development and implementa-tion of investment strategies.
In a CFA Institute survey of nearly 250 analysts, portfolio man-agers, and private wealth managers on quantitative investment techniques, 50% of respondents reported that they had conducted backtesting of an investment strategy within the past 12 months of the survey date. This result underscores the importance of backtest-ing (and other simulation techniques) for investors in practice, and this reading is a starting point on the journey to building this core professional competency.

Backtesting and Simulation
© 2020 CFA Institute. All rights reserved. 55
Summary
In this reading, we discussed how to perform rolling window back-testing—a widely used technique in the investment industry. Next, we described how to use scenario analysis and simulation along with sensitivity analysis to supplement backtesting, so investors can better account for the randomness in data that may not be fully captured by backtesting.
• The main objective of backtesting is to understand the risk–return trade-off of an investment strategy, by approximating the real-life investment process.
• The basic steps in a rolling window backtesting include specify-ing the investment hypothesis and goals, determining the rules and processes behind an investment strategy, forming an invest-ment portfolio according to the rules, rebalancing the portfolio periodically, and computing the performance and risk profiles of the strategy.
• In the rolling window backtesting methodology, researchers use a rolling window (or walk-forward) framework, fit/calibrate fac-tors or trade signals based on the rolling window, rebalance the portfolio periodically, and then track the performance over time. Thus, rolling window backtesting is a proxy for actual investing.
• There are two commonly used approaches in backtesting: long/short hedged portfolio and Spearman rank IC. The two approaches often give similar results, but results can be quite different at times. Choosing the right approach depends on the model building and portfolio construction process.
• In assessing backtesting results, in addition to traditional perfor-mance measurements (e.g., Sharpe ratio, maximum drawdown),

Data Science
56 Members’ Guide to 2021 Refresher Readings
analysts need to take into account data coverage, return distribu-tion, factor efficacy, factor turnover, and decay.
• Analysts need to pay attention to several behavioral issues in backtesting, including survivorship bias and look-ahead bias.
• Risk parity is a popular portfolio construction technique that takes into account the volatility of each factor (or asset) and the correlations of returns between all factors (or assets) to be com-bined in the portfolio. The objective is for each factor (or asset) to make an equal (hence “parity”) risk contribution to the overall or targeted risk of the portfolio.
• Asset (and factor) returns are often negatively skewed and exhibit excess kurtosis (fat tails) and tail dependence compared with normal distribution. As a result, standard rolling window back-testing may not be able to fully account for the randomness in asset returns, particularly on downside risk.
• Financial data often face structural breaks. Scenario analysis can help investors understand the performance of an investment strategy in different structural regimes.
• Historical simulation is relatively straightforward to perform but shares pros and cons similar to those of rolling window back-testing. For example, a key assumption these methods share is that the distribution pattern from the historical data is suffi-cient to represent the uncertainty in the future. Bootstrapping (or random draws with replacement) is often used in historical simulation.
• Monte Carlo simulation is a more sophisticated technique than historical simulation is. In Monte Carlo simulation, the most important decision is the choice of functional form of the sta-tistical distribution of decision variables and return drivers.

Backtesting and Simulation
© 2020 CFA Institute. All rights reserved. 57
Multivariate normal distribution is often used in investment research, owing to its simplicity. However, a multivariate normal distribution cannot account for negative skewness and fat tails observed in factor and asset returns.
• The Monte Carlo simulation technique makes use of the inverse transformation method—the process of converting a randomly generated uniformly distributed number into a simulated value of a random variable of a desired distribution.
• Sensitivity analysis, a technique for exploring how a target vari-able and risk profiles are affected by changes in input variables, can further help investors understand the limitations of conven-tional Monte Carlo simulation (which typically assumes a mul-tivariate normal distribution as a starting point). A multivariate skewed t-distribution takes into account skewness and kurtosis but requires estimation of more parameters and thus is more likely to suffer from larger estimation errors.

This page intentionally left blank

© 2020 CFA Institute. All rights reserved. 59
Wealth Management
Applicable Reading
Topics in Private Wealth Management (Level III)By Paul Bouchey, CFA, Helena Eaton, PhD, CFA, Philip Marcovici 3 PL Credits Access the full reading: https://www.cfainstitute.org/membership/ professional-development/refresher-readings/topics-in-private- wealth-management

60 Members’ Guide to 2021 Refresher Readings
What Is Changing in the 2021 Curriculum?The dynamics of wealth management are changing: Client numbers have increased dramatically over the past decade and the needs of clients are evolving. As a consequence, last year, we added the new reading “Overview of Private Wealth Management” to the curricu-lum. This year, the three remaining Private Wealth Management readings have been consolidated and streamlined into a single, all-encompassing reading called “Topics in Private Wealth Management.” The streamlined reading is segmented into three key areas of techni-cal expertise: the impact of taxes on wealth accumulation, how to manage concentrated positions, and tools and techniques for families to preserve wealth through generations.
The reading takes a close look at tax issues, analyzing the tax efficiency of investments and comparing how income, wealth, and wealth transfers are taxed. It discusses how taxation varies around the globe and across different asset types and sets out some portfolio tax management strategies.
An in-depth discussion of concentrated wealth—where indi-viduals’ and families’ wealth is concentrated in a narrow group of assets—considers how to deal with the inherent lack of diversifica-tion and liquidity risk. The assets in question may be publicly traded stocks, perhaps owned in the wake of an initial public offering of a family business or the sale of a privately owned business to a public company. Or the asset could be substantial commercial or invest-ment real estate. Often, the asset is a privately owned business, built up by one family or individual over many years.

What Is Changing in the 2021 Curriculum?
© 2020 CFA Institute. All rights reserved. 61
Finally, the reading shows how wealth may be managed for future generations, with topics including how to oversee estates and how to efficiently execute bequests and gifts.

62 Members’ Guide to 2021 Refresher Readings
Why Does It Matter to Members?Even the best private wealth managers never have all the answers to clients’ questions. This streamlined, contextualized wealth manage-ment reading is designed to help private wealth managers ask the right questions and consult the right experts to help clients navi-gate a complex series of choices. The reading is practical in nature, guiding investment professionals through the issues encountered regularly by wealth management specialists, and presenting relevant solutions.
In particular, it sets out why taxes are an important determinant of most investors’ returns and how to address this. While fees and trading costs receive attention in the press and academic circles, the erosion of returns due to taxes can be significantly larger.
Tax considerations, however, are just one element of manag-ing assets for private wealth clients. Consider the not-uncommon case in which 50% of a client’s assets are tied up in a private com-pany in which the client is the main shareholder. Classical portfo-lio theory would argue that this represents an unacceptably high concentration of assets. But business ownership is not a classical investment and selling the position to diversify the wider portfo-lio could create an enormous tax liability or lead to an unwelcome loss of control over the business. How, then, can advisers help the client manage the risks? This reading discusses some practical tools.
Then, consider succession planning. Many clients want to pass on wealth for their children’s and grandchildren’s futures. This is not as easy as it may appear. The saying “shirtsleeves to shirtsleeves

Why Does It Matter to Members?
© 2020 CFA Institute. All rights reserved. 63
in three generations” exists in many cultures, meaning that family wealth rarely survives three generations. The reading acknowledges that many wealth management clients need help to create structures that can counter this conventional wisdom.

64 Members’ Guide to 2021 Refresher Readings
Topics in Private Wealth ManagementPaul Bouchey, CFA, Helena Eaton, PhD, CFA, and Philip MarcoviciPaul Bouchey, CFA, is at Parametric Portfolio Associates, Seattle, WA (USA). Helena Eaton, PhD, CFA, is at J.P. Morgan, London (UK). Philip Marcovici is at the Offices of Philip Marcovici, Hong Kong SAR (China).
Helena Eaton is a contributing author. Her contributions solely represent her views and should in no way be taken to reflect the views of JPMorgan Chase & Co.
Learning Outcomes
The candidate should be able to:
a. compare taxation of income, wealth, and wealth transfers;
b. describe global considerations of jurisdiction that are relevant to taxation;
c. discuss and analyze the tax efficiency of investments;
d. analyze the impact of taxes on capital accumulation and decu-mulation in taxable, tax-exempt, and tax-deferred accounts;
e. explain portfolio tax management strategies and their application;

Topics in Private Wealth Management
© 2020 CFA Institute. All rights reserved. 65
f. discuss risk and tax objectives in managing concentrated single-asset positions;
g. describe strategies for managing concentrated positions in pub-lic equities;
h. describe strategies for managing concentrated positions in pri-vately owned businesses and real estate;
i. discuss objectives—tax and nontax—in planning the transfer of wealth;
j. discuss strategies for achieving estate, bequest, and lifetime gift objectives in common law and civil law regimes; and
k. describe considerations related to managing wealth across mul-tiple generations.
Introduction
This reading focuses on three important areas of technical compe-tency in the management of private client assets: the impact of taxes on wealth accumulation, the management of concentrated positions in public or private assets, and basic tools and techniques for pre-serving wealth through generations.
We begin with a discussion of taxes. Taxes are an important determinant of the taxable investor’s final returns. While fees and trading costs have received a lot of attention in the press and aca-demic spheres, the erosion of returns due to taxes can be much more significant.

Wealth Management
66 Members’ Guide to 2021 Refresher Readings
Consider this scenario: After significant development and test-ing, your firm has just launched a new strategy that tactically shifts between different equity indexes. The backtests show significant alpha over most time horizons and especially strong performance during market downturns—a risk–return profile that should be highly attractive to your clients. You launch the strategy 1 January, and everyone is pleased with the performance in the first year. On 15 February of the following year, the founder of the firm receives a tele-phone call from the accountant for Charles and Ivy Lee, an important private client relationship. The accountant has been compiling the Lees’ tax documents in preparation for filing the annual tax return. It seems that the trading activity inherent in your new strategy has gen-erated a lot of capital gains, and the resulting tax bill is larger than the excess returns generated by your strategy.
This scenario is not uncommon. Because a significant proportion of actively managed assets is managed on behalf of tax-exempt institu-tions, such as retirement plans and sovereign wealth funds, strategies are often developed either without regard to taxes or with taxes as an afterthought and then applied—unsuccessfully—to taxable investors.
To illustrate the effect of taxes on wealth accumulation, let’s examine a longer time horizon. The S&P 500 Index from 1 January 1990 through 30 June 2019 appreciated 7.5% per year, on average. With dividends reinvested and ignoring fees and transaction costs, the compound annual growth rate would have been 9.8%. If the Lees had invested $1 million on 1 January 1990, we would expect their portfolio to have grown to $16 million by the end of the nearly 30-year period. However, this is only true if the assets are not subject to taxation during the accumulation phase, as would be the case if they are held in a retirement account or a private family foundation. Exhibit 1 shows the growth of this hypothetical portfolio under sev-eral different tax assumptions.
If we assume the worst case, that both dividends and capital gains are taxed fully at a marginal tax rate of 50%, then the 9.8% compound annual growth rate would be cut roughly in half, to

Topics in Private Wealth Management
© 2020 CFA Institute. All rights reserved. 67
5.0%. In other words, their $1 million would have only grown to $4 million after almost 30 years—only one-fourth of what the tax-exempt account realized. Clearly, taxes are an important investment consideration.Fortunately, as a tax-aware practitioner, you may be able to use vari-ous tax-management techniques to reduce the tax drag. If capital gains and dividends are taxed at 25%, the final wealth of the taxable portfolio would have grown to $8 million. If capital gains taxes can be eliminated or deferred and only dividends are taxed at the 25% rate, then the $1 million would have grown to $13 million at the end of our horizon. It is still not as good as the tax-exempt case, but it is significantly better than our worst case.
Exhibit 1. Growth of $1 million in the S&P 500 Index
Dollar (millions)
1716151413121110
98765432101990 2000 201020051995 2015
16 Tax-Exempt Investor
13 Only Dividends Taxed at 25%
8 Capital Gains and Dividends Taxed at 25%
4 Capital Gains and Dividends Taxed at 50%
(Continued)

Wealth Management
68 Members’ Guide to 2021 Refresher Readings
Notes: Growth of $1 million from January 1990 through June 2019 for the S&P 500 Index with dividends reinvested, ignoring fees and transaction costs. After-tax returns are computed in three ways: (1) only dividends are taxed at 25%, (2) dividends and capital gains are taxed at 25%, and (3) dividends and capital gains are taxed at 50%. In each month, we multiply the component of return by 1 minus the tax rate. For example, pre-tax returns of 10% and −10% would become 5% and −5% under a 50% tax rate. This calculation assumes that all capital gains and losses are realized each month and that when capital losses occur, there are sufficient capital gains from other investments so that the investor may deduct the losses in full. Essentially, the tax liability is deducted and the tax benefit added to the account as if it were a cash flow, thus reducing the magnitude and volatility of returns.
Sources: Authors’ calculations using the S&P 500 Total Return Index and the S&P 500 Price Return Index. The after-tax return methodology follows Lucas and Sanz (2016).
Broadly speaking, a portfolio manager managing assets for a private client looks to maximize after-tax returns for a given level of risk. This reading lays the groundwork for understanding how dif-ferent types of taxes affect wealth accumulation. We review the gen-eral principles of taxation, how to measure tax efficiency, and how to reduce the impact of taxes on a portfolio.
Hopefully we’ve convinced you why it is important to manage your client’s portfolio with taxes in mind. Tax considerations, how-ever, are just one element of managing assets for private wealth clients. Suppose that only 50% of your private client’s assets are invested in your tax-aware investment strategy. The other 50% of assets are tied up in a company that was the primary source of wealth creation for
Exhibit 1. (Continued)

Topics in Private Wealth Management
© 2020 CFA Institute. All rights reserved. 69
your client: Ivy Lee started a business in her early 20s that succeeded far beyond her initial expectations. While she has accumulated liquid assets outside of that business, a substantial portion of her net worth is held in company stock. From your earlier readings in the course of the CFA Program, you realize that this is a very risky position. Taken in the aggregate, her portfolio is undiversified; however, to sell the posi-tion outright would create an enormous tax liability or lead to a loss of control over the business she created. How, then, do you help the client achieve her goals? This reading discusses some practical tools that you can employ to manage the risk of this concentrated position.
Finally, Ivy and Charles want to maximize the likelihood that the strong financial foundation they have created will survive to provide support for their children’s and grandchildren’s future endeavors. Ivy has frequently heard the phrase “shirtsleeves to shirtsleeves in three generations,” meaning that family wealth rarely survives beyond three generations. Some variation of that saying exists in many cul-tures. The Lees want your help to create a structure that will counter that conventional wisdom. This reading won’t make you an estate planning expert, but it will prepare you to identify estate planning opportunities that may help the Lees achieve that goal and to work more effectively with the their estate planning professionals toward that end.
Summary
Even the best private wealth manager will never have all the answers. An effective private wealth manager, however, will be in a position to ask the right questions and consult the right experts to help clients navigate an increasingly complex world. This reading covers impor-tant points for managing assets on a tax-aware basis and managing

Wealth Management
70 Members’ Guide to 2021 Refresher Readings
concentrated positions in real estate and private and public equities. It also provides an overview of estate planning.
• Three foundational elements of investment taxation include the following: (1) taxation of the components of return, (2) the tax status of the account, and (3) the jurisdiction that applies to the investor (and/or account).
• Many countries’ tax codes create preferential treatment for some types of dividend and interest income. Long-term capital gains are typically taxed at a lower rate than other forms of income.
• Income from real estate investments may be reduced by mainte-nance, interest, and depreciation expenses.
• Private clients often have a mix of taxable, tax-deferred, and tax-exempt investment accounts. Returns in tax-deferred and tax-exempt accounts compound using the pre-tax rate of return. Tax-deferred accounts pay tax only when assets are withdrawn from the account. Taxable accounts compound using the after-tax rate of return.
• Broadly speaking, countries may operate under one of three tax regimes: tax havens, territorial tax systems, and worldwide tax systems. A tax haven has no or very low tax rates for foreign investors. A territorial regime taxes only locally sourced income. A worldwide tax regime taxes all income, regardless of its source.
• The Common Reporting Standard exists to ensure the exchange of financial account information to combat tax evasion. The United States uses FATCA, the Foreign Account Tax Compliance Act, for the same purpose.
• Equity portfolios are often more tax efficient than strategies that rely on derivatives, real assets, or taxable fixed income.

Topics in Private Wealth Management
© 2020 CFA Institute. All rights reserved. 71
Higher-yield and higher-turnover strategies tend to be less tax efficient.
• The tax considerations associated with alternative asset classes are more complicated than those associated with stocks and bonds.
• Measures of tax efficiency include after-tax holding period return, annualized after-tax return, after-tax post-liquidation return, after-tax excess return, and the tax-efficiency ratio.
• Asset location is the process for determining which assets should be held in each type of account. A general rule of thumb is to put tax-efficient assets in the taxable account and tax-inefficient assets in the tax-exempt or tax-deferred account. The actual solution may differ depending on the strategy and the investor’s horizon.
• It is typically better to make withdrawals from the taxable account first and then from the tax-deferred accounts. Under progressive tax regimes, it may be more tax efficient to withdraw from the retirement account first until the lowest tax brackets have been fully utilized.
• Tax avoidance is the legal activity of understanding the tax laws and finding approaches that avoid or minimize taxation. Tax evasion is the illegal concealment and nonpayment of taxes that are otherwise due.
• Tax avoidance strategies include holding assets in a tax-exempt account versus a taxable account, investing in tax-exempt bonds instead of taxable bonds, holding assets long enough to qualify for long-term capital gains treatment, and holding dividend-paying stocks long enough to pay the more favorable tax rate. Tax-deferral strategies include limiting portfolio turnover

Wealth Management
72 Members’ Guide to 2021 Refresher Readings
and the consequent realization of capital gains and tax loss harvesting.
• The structure of the investment vehicle in which a client’s assets are held may affect the tax liability and the adviser’s ability to manage the client portfolio in a tax-aware manner. In a part-nership, the income, realized capital gains, and realized capital losses are passed through to the investors, who are then respon-sible for any tax liability. In a mutual fund, the income and real-ized capital gains (but not losses) are passed through to the investors. The taxation of capital gains varies by jurisdiction.
• Potential capital gain exposure (PCGE) can be used to gauge the amount of tax liability embedded in a mutual fund.
• Exchange-traded funds are very tax efficient. Separately man-aged accounts offer the most flexibility for tax management.
• Tax loss harvesting is a technique whereby the manager realizes a loss that can be used to offset gains or other income. Tax loss harvesting requires diligent tax lot accounting.
• Common methods of tax lot accounting are first in, first out (FIFO); last in, first out (LIFO); and highest in, first out (HIFO).
• A concentrated position subjects the portfolio to a higher level of risk, including unsystematic risk and liquidity risk. Approaches that can be used to mitigate the risks of a concentrated position include sell and diversify; staged diversification; hedging and monetization strategies; tax-free exchanges; tax-deferral strate-gies; and estate and tax planning strategies, such as charitable trusts, private foundations, and donor-advised funds.

Topics in Private Wealth Management
© 2020 CFA Institute. All rights reserved. 73
• A completion portfolio is an index-based portfolio that, when added to the concentrated position, creates an overall portfolio with exposures similar to the investor’s benchmark.
• Equity monetization refers to a group of strategies that allows an investor to receive cash for a stock position without an out-right sale. The investor can hedge a part of the position using a short sale, a total return swap, options, futures, or a forward sale contract and then borrow against the hedged position. The loan proceeds are then invested in a diversified portfolio of other investments.
• Donating the appreciated asset to a charitable remainder trust allows the shares to be sold without incurring a capital gains tax. The trust can then build a diversified portfolio to provide income for the life of the beneficiaries.
• Strategies to free up capital concentrated in a privately owned business or real estate include a personal line of credit secured by company shares, leveraged recapitalization, an employee stock ownership plan, mortgage financing, and a charitable trust or donor-advised fund.
• Estate planning is the process of preparing for the disposition of one’s estate upon death and during one’s lifetime. Objectives of gift and estate planning include maintaining sufficient income and liquidity, achieving the clients’ goals with respect to control over the assets, protection of the assets from creditors, mini-mization of tax liability, preservation of family wealth, business succession, and achieving charitable goals.
• An estate tax is the tax on the aggregate value of a deceased per-son’s assets. It is paid out of the estate. An inheritance tax is paid by each individual beneficiary. A gift tax is paid on a transfer of

Wealth Management
74 Members’ Guide to 2021 Refresher Readings
money or property to another person without receiving at least equal value in return. Many jurisdictions have tax-free allow-ances that can be used to transfer assets under a certain thresh-old without paying an estate or inheritance tax.
• A will outlines the rights others will have over one’s property after death. Probate is the legal process to confirm the validity of the will.
• Common law jurisdictions give owners the right to use their own judgment regarding the rights others will have over their property after death. Many civil law countries place restrictions on the disposition of an estate, typically giving certain relatives some minimum share of the assets.
• Common estate planning tools include trusts, foundations, life insurance, and companies. A trust is a legal relationship in which the trustee holds and manages the assets for the benefit of the beneficiaries. A trust can be either revocable or irrevocable. An irrevocable trust generally provides greater asset protection from creditors. A foundation is typically established to hold assets for a specific charitable purpose. The founder can exercise some control in the administration and decision making of the foundation.
• Life insurance and other forms of insurance can be used to accomplish estate planning objectives.
• Companies—specifically, a controlled foreign corporation—may allow the owner to defer taxes on income until the earnings are distributed to shareholders or until the company is sold or shares otherwise disposed.
• Family governance is a process for a family’s collective com-munication and decision making designed to serve current and

Topics in Private Wealth Management
© 2020 CFA Institute. All rights reserved. 75
future generations. Good family governance establishes prin-ciples for collaboration among family members, preserving and growing family’s wealth, and increasing human and financial capital across the generations. A sound family governance sys-tem may mitigate many of the behavioral biases that impede effective decision making.
• Conflict resolution can be particularly challenging in a family context. A family constitution can help wealthy families antici-pate possible conflicts and agree on a common set of rights, val-ues, and responsibilities.
• Managing a concentrated position arising from a family business is more than just an investment issue. The private wealth adviser should be prepared to work with the client in succession plan-ning and post-sale considerations, such as the loss of a key activ-ity that united family members.
• Effective estate planning requires planning for the unexpected, including divorce and incapacity.

This page intentionally left blank

© 2020 CFA Institute. All rights reserved. 77
Ethics, Rules, and Standards
Applicable Readings
Application of the Code and Standards (Level II)1 PL /1 SER Credit Access the full reading: https://www.cfainstitute.org/membership/ professional-development/refresher-readings/application-of-the- code-and-standards-level-ii
Application of the Code and Standards (Level III)2 PL/ 2 SER Credits Access the full reading: https://www.cfainstitute.org/membership/ professional-development/refresher-readings/application-of-the- code-and-standards-level-iii

78 Members’ Guide to 2021 Refresher Readings
What Is Changing in the 2021 Curriculum?Ethical dilemmas faced by financial organizations are showcased in the new “Application of the Code and Standards” readings. The read-ings present a number of ethical dilemmas commonly faced by indi-viduals in private and institutional asset management and feature two new cases.
The first case is a fictional private bank, called Banco Libertad, based in the country of Urutina. Banco Libertad is investigated by law enforcement officials from the governments of nearby Chiladour and Panaguay, who demand confidential information on clients who are suspected of wrongdoing. One client is the former minister of finance in Chiladour, who has deposited more than $5 million with the bank. He is under investigation for allegedly embezzling from the Chiladour Treasury. How should staff at the private bank react to the investigation? What should they say, and what should they not say? How does the CFA Institute Code of Ethics and Standards of Professional Conduct (Code and Standards) coexist with the relevant laws?
Other clients of Banco Libertad pose different ethical chal-lenges to the bank’s staff. One has deposited money that subsequently turned out to be sourced from bribes. Another client owns a luxury hotel in the Bahamas and rewards the bank’s investment advisers with free trips to the hotel if they perform to expectations. Is this legal? Is it ethical?
The second case focuses on a fictional country’s sovereign wealth fund that was set up to fund local projects, generate positive invest-ment returns, and attract global partners. The sovereign wealth

What Is Changing in the 2021 Curriculum?
© 2020 CFA Institute. All rights reserved. 79
fund’s new CIO is secretly asked to fund projects that help certain political factions within the country. How might she respond to this? She is also asked, by a friend, to accept a personal investment in the fund. Furthermore, she is asked to provide complete transparency over the fund’s strategies by some stakeholders, but to not disclose certain transactions by other stakeholders. She additionally suspects that fees levied by partners in the fund are higher than they should be. The Code and Standards have something to say about all these issues, and the reading explains how investment professionals might deal with them.

80 Members’ Guide to 2021 Refresher Readings
Why Does It Matter to Members?The new case studies provide color and context for the types of ethi-cal dilemmas that actually occur in the investment industry. The individual and corporate behavior (and misbehavior) surrounding these two fictional financial institutions is certainly not beyond the realm of possibility. Similar behavior has been identified in real sce-narios, leading to censure and punishment. Investment profession-als may well come across such behavior at some point during their careers and will need a benchmark for knowing how to react.
Referencing the Code and Standards can help investment pro-fessionals identify applicable ethical principles on which sound deci-sions and appropriate behavior can be based. These new cases add to existing cases in the reading that focus on identifying why and how violations of the Code and Standards may occur, with discus-sion and rationale as to why or why not a violation may have taken place. The cases present possible corrective actions, including how to develop a policy statement to help prevent future violations by a firm’s employees.
By working through these cases, investment professionals can consider how applying the framework for ethical decision mak-ing might help them if they find themselves in an unfamiliar, and uncomfortable, situation.

© 2020 CFA Institute. All rights reserved. 81
Application of the Code and Standards: Level II
Learning Outcomes
The candidate should be able to:
a. evaluate practices, policies, and conduct relative to the CFA Institute Code of Ethics and Standards of Professional Conduct; and
b. explain how the practices, policies, and conduct do or do not violate the CFA Institute Code of Ethics and Standards of Professional Conduct.
Introduction
This reading presents cases to illustrate how the CFA Institute Code of Ethics and Standards of Professional Conduct (Code and Standards) can be applied in situations requiring professional and ethical judgment. Exhibit 1 presents a useful framework to help guide individuals in their ethical decision-making process and appli-cation of the Code and Standards. By identifying where the Code and Standards might be relevant and considering actions and conse-quences within this framework, individuals can make more ethically sound decisions.

Ethics, Rules, and Standards
82 Members’ Guide to 2021 Refresher Readings
Although the framework’s components do not need to be addressed in the sequence shown, a review of the outcome should conclude the process. This review provides insights for improved decision making in the future.
Exhibit 1. A Framework for Ethical Decision Making
• Identify: Relevant facts, stakeholders and duties owed, ethical principles, and conflicts of interest
• Consider: Situational influences, additional guidance, and alternative actions
• Decide and act
• Reflect: Was the outcome as anticipated? Why or why not?
This reading presents a number of scenarios involving individu-als in private and institutional asset management. The first four cases focus on identifying whether violations of the Code and Standards occurred, with discussion and rationale as to why or why not a viola-tion may have taken place. The last two cases focus on identifying violations of the Code and Standards, taking necessary corrective actions, and developing a policy statement to prevent future viola-tions by a firm’s employees. As you read through these cases, consider how applying the framework might have helped each individual to make decisions.

© 2020 CFA Institute. All rights reserved. 83
Application of the Code and Standards: Level III
Learning Outcomes
The candidate should be able to:
a. evaluate practices, policies, and conduct relative to the CFA Institute Code of Ethics and Standards of Professional Conduct; and
b. explain how the practices, policies, and conduct do or do not violate the CFA Institute Code of Ethics and Standards of Professional Conduct.
Introduction
The purpose of this reading is to provide examples of how the CFA Institute Code of Ethics and Standards of Professional Conduct (Code and Standards) can be applied in situations requiring profes-sional and ethical judgment. Exhibit 1 presents a useful framework to help navigate the ethical decision-making process and apply the Code and Standards. The framework’s components do not need to be addressed in the sequence shown, but a review of the outcome should conclude the process. This review provides insights for improved decision making in the future.

Ethics, Rules, and Standards
84 Members’ Guide to 2021 Refresher Readings
Exhibit 1. A Framework for Ethical Decision Making
• Identify: Relevant facts, stakeholders and duties owed, ethical principles, and conflicts of interest
• Consider: Situational influences, additional guidance, and alternative actions
• Decide and act
• Reflect: Was the outcome as anticipated? Why or why not?
These cases involve individuals in private wealth and institutional asset management settings and discussion as to whether actions, taken or not taken, are in violation of the Code and Standards. As you work through these cases, think about how applying the ethi-cal decision-making framework might have changed the decisions and actions of those in the scenarios. Referencing the Code and Standards will help you identify applicable ethical principles upon which sound decisions and appropriate behavior can be based. The reading concludes with practice problems in item-set format.