Melting and structural transformations of carbonates and hydrous ...
126
Melting and structural transformations of carbonates and hydrous phases in Earth's mantle by Zeyu Li A dissertation submitted in partial fulfillment of the requirements for the degree of Doctor of Philosophy (Geology) in the University of Michigan 2015 Doctoral Committee: Associate Professor Jie Li, Chair Professor Udo Becker Professor Edwin A. Bergin Professor Rebecca A. Lange Professor Peter E. Van Keken
-
Upload
truonglien -
Category
Documents
-
view
219 -
download
0
Transcript of Melting and structural transformations of carbonates and hydrous ...

Melting and structural transformations of carbonates and hydrous
phases in Earth's mantle
by
Zeyu Li
A dissertation submitted in partial fulfillment
of the requirements for the degree of
Doctor of Philosophy
(Geology)
in the University of Michigan
2015
Doctoral Committee:
Associate Professor Jie Li, Chair
Professor Udo Becker
Professor Edwin A. Bergin
Professor Rebecca A. Lange
Professor Peter E. Van Keken

© Zeyu Li 2015
All Rights Reserved

ii
To Menglian, my mum and dad

iii
Acknowledgements
First I would like to sincerely thank my advisor, associate professor Jie Li. During my
Ph.D study, she supports and encourages me all the time, constantly saving me from getting lost.
I would also like to thank Professors Edwin Bergin, Udo Becker, Rebecca Lange and Peter van
Keken for serving on my dissertation committee. Especially I would like to thank Dr. Hongwu
Xu providing me with the chance and financial support to collaborate with them on hydrous
mineral study.
In addition, I appreciate the collaborations and student life spent with Jiachao Liu,
Elisabeth Tanis and all the other peer graduate students. I also thank previous or current faculties
Dr. Bin Chen, Dr. Fuxiang Zhang and Dr. Gordon Moore for their helps with my experiments. I
also thank staff Anne Hudon and Nancy Kingsbury for their kind helps with academic affairs. I
spent six wonderful years in the University of Michigan with all the professors, fellow students
and friends here, I really appreciate everything the University offered to me.
At last, I’d like to thank my girlfriend Menglian Zhou and my Mum and Dad. Because of
their love and support, I can make to this step.

iv
Table of Contents
Dedication ........................................................................................................................... ii
Acknowledgements ............................................................................................................ iii
List of Tables .................................................................................................................... vii
List of Figures .................................................................................................................. viii
Abstract ............................................................................................................................... x
Chapter I. Introduction ........................................................................................................ 1
1.1 Deep carbon cycle ..................................................................................................... 1
1.2 Deep hydrogen cycle................................................................................................. 5
Chpater II. High pressure melting temperature measurement through electrical measurement of
capacitive current .......................................................................................................... 11
2.1 Introduction ............................................................................................................. 11
2.2 Method ................................................................................................................... 14
2.2.1 Ambient pressure tests .................................................................................. 14
2.2.2 High pressure tests ........................................................................................ 16
2.3 Results and discussion ............................................................................................ 20
2.3.1 Ambient pressure tests .................................................................................. 20
2.3.2 High pressure tests ........................................................................................ 26
2.4 Conclusions ............................................................................................................. 30
Chapter III. Melting curve of NaCl to 20 GPa from electrical measurements of capacitive
current……………………………………………………………………………….....33

v
3.1 Introduction ............................................................................................................. 33
3.2 Method ................................................................................................................... 34
3.3 Results and discussion ............................................................................................ 39
3.4 Implications............................................................................................................. 48
Chapter IV. Melting temperature of calcium carbonate up to 22 GPa and implications for carbon
cycle in the mantle ........................................................................................................ 56
4.1 Introduction ......................................................................................................... 56
4.2 Method ................................................................................................................ 58
4.3 Results and discussions ....................................................................................... 60
4.4 Implications......................................................................................................... 69
Chapter V. Melting curves and phase diagrams of Na2CO3 and K2CO3 up to 20 GPa .... 75
5.1 Introduction……………………………………………………………..……...….75
5.2 Method ................................................................................................................... 75
5.2.1 Melting curve measurement ........................................................................... 75
5.2.2 In situ X-ray diffraction ................................................................................. 76
5.3 Results and discussion ............................................................................................ 79
5.3.1 Melting curve of Na2CO3 ............................................................................... 79
5.3.2 Melting curve of K2CO3................................................................................. 83
5.3.3 In situ X-ray diffraction and phase diagram of K2CO3 ................................. 85
5.4 Implications............................................................................................................. 88
Chapter VI. Phase relations of dense hydrous germanate minerals (DHMG) ................. 93
6.1 Introduction ............................................................................................................. 93
6.2 Method ................................................................................................................... 95
6.3 Results and discussions ........................................................................................... 96

vi
Chapter VII. Conclusions and future directions………………………………...……....107
7.1 Measure melting temperature at high pressure………………………….…....…..107
7.2 Melting behaviors of carbonates……………………………………………….…109

vii
List of Tables
Table 2.1: Summary of experiment conditions of high pressure tests . .........................................19
Table 3.1: Experimental condition and results of NaCl experiments ............................................40
Table 3.2: Fitting parameters of melting equations of NaCl ........................................................ 52
Table 4.1: Conditions and results of CaCO3 melting experiments………..……...….….………..63
Table 5.1: Conditions and results of Na2CO3 and K2CO3 melting experiments...........................81
Table 5.2: In situ X-ray diffraction experiments on K2CO3………………………..…….…...….86
Table 6.1: High pressure DHMG synthesis experiments……...……………….…………...…....97
Table 6.2: Conditions and results of high pressure phase equilibrium experiments on dense
hydrous germanates……………………… ………………………………...…........98

viii
List of Figures
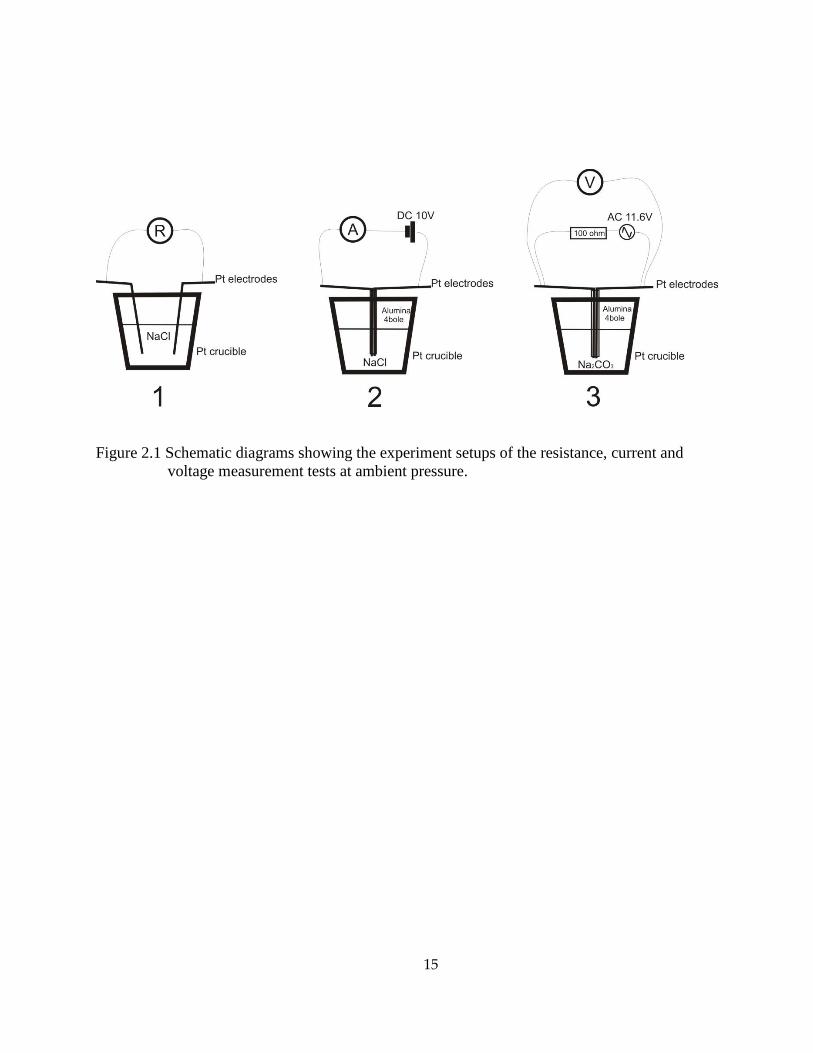
Figure 2.1: Schematic diagrams showing the experiment setups of the resistance, current and
voltage measurement tests at ambient pressure. ..........................................................15
Figure 2.2: Schematic diagrams of 8mm TEL pressure assemblies used in high pressure tests ...18
Figure 2.3: Resistance versus temperature relationship of NaCl during heating in the ambient
pressure test using an ohmmeter ..................................................................................21
Figure 2.4: Current versus temperature relationship of NaCl during heating in the ambient
pressure test using DC 10V and an ammeter ...............................................................23
Figure 2.5: Voltage versus temperature relationship of Na2CO3 during heating in the ambient
pressure test using AC 11.6V and voltammeter...........................................................25
Figure 2.6: SEM image of recovered charges from high pressure capacitive current experiments
.................................................................................... ………………………………27
Figure 2.7: Reflected light microscopic images of recovered experiment charges and measured
melting curves of CaCO3 .............................................................................................29
Figure 3.1: Experimental configurations for NaCl melting detection using capacitive current
method..........................................................................................................................36
Figure 3.2: Representative current-temperature curves of NaCl at selected pressures. .................36
Figure 3.3: Fittings of experimental data of NaCl to melting equations. ......................................50
Figure 4.1: Experimental configurations for CaCO3 melting detection using capacitive current
method..........................................................................................................................59
Figure 4.2: Representative current-temperature curves of CaCO3 at selected pressures. ..............61
Figure 4.3: Melting curve and related phase diagram of CaCO3. ..................................................65
Figure 4.4: Melting curve of CaCO3 and solidus curves of simplified carbonated peridotite and
calcium number of melts from melting experiments of simplified carbonated
peridotite. .....................................................................................................................68
ix
Figure 4.5: Comparison of the melting of curve of CaCO3 with varisous geotherms. ..................71
Figure 5.1: Schematic diagram of in situ X-ray diffraction with double-sided laser heating ........78
Figure 5.2: Melting curve of Na2CO3 over 3-18 GPa.. ..................................................................82
Figure 5.3: Melting curve of K2CO3 over 3-20 GPa ......................................................................85
Figure 5.4: X-ray diffraction patterns of K2CO3 at different temperature and pressure
conditions... ..................................................................................................................87
Figure 5.5: Phase diagram of K2CO3 based on in situ X-ray diffraction experiments.. ................88
Figure 5.6: Comparison of melting curves of MgCO3, CaCO3, FeCO3, Na2CO3 and K2CO3 .......90
Figure 6.1 X-ray diffraction patterns of Mg2GeO4+H2O system below 8 GPa .............................99
Figure 6.2 X-ray diffraction patterns of Mg2GeO4+H2O system above 8 GPa ...........................100
Figure 6.3 Phase diagram of Mg2GeO4+H2O under high pressure and temperature ...................102
Figure 6.4 Comparison of stability ranges of dense hydrous magnesium germinates (DHMG)
and dense hydrous magnesium silicates (DHMS)…........ ........................................103
Figure 7.1 Eutectic melting of carbonated silicates……………………………………………….…………..111

x
Abstract
This dissertation addresses questions about carbon and hydrogen transport and storage in the
mantle through experimental investigations of the melting behaviors of carbonates under high
pressure and phase stability of dense hydrous germanate.
In Chapter II, a new technique was developed to measure melting temperatures at high
pressures by monitoring the sudden change of capacitive current through ionic compounds upon
melting.
In Chapter III, the melting curve of NaCl up to 20 GPa was measured using the capacitive
current technique. New results are consistent with previous data on melting temperature of NaCl
up to 6.5 GPa, thus validating the accuracy of capacitive current based measurement.
In Chapter IV, we measured the melting curve of CaCO3 between 3 and 22 GPa. The
melting temperature of CaCO3 was found to decrease between 7 and 15 GPa and then increase
with pressure between 15 and 21 GPa. The negative melting slope was attributed to the
melt/solid density crossover at 7 GPa and the positive melting slope at higher pressures can be
explained by calcite V to aragonite phase transition at 15 GPa. The melting curve of CaCO3 may
cross a hot adiabatic geotherm at the transition zone depth in an upwelling setting, producing
carbonate melt in the transition zone.
In Chapter V, the melting curves of two more carbonates, Na2CO3 and K2CO3, were
measured between 3 and 20 GPa. Above 9 GPa the melting temperature of K2CO3 was found to
increase with pressure at a much higher rate than Na2CO3. Results from high pressure in situ X-

xi
ray diffraction experiments indicated two solid phase transitions of K2CO3 at ~3 and ~9 GPa,
respectively.
In Chapter VI, the stability of three new dense hydrous magnesium germanate (DHMG)
minerals were reported on the basis of phase equilibrium experiments using in situ synchrotron
X-ray diffraction and hydrothermal diamond anvil cell. One of them was determined as
germanate analogue of phase D, and the other two were likely germanium analogues of
superhdrous B and phase H.

1
CHAPTER I
Introduction
Volatile elements, including hydrogen, carbon, sulfur, fluorine, chlorine play important
roles in the Earth’s mantle processes. Even at low concentrations, their presence lowers the
solidus temperature of mantle rock and induces melting in the mantle. Without them, there
would be no arc volcanism that constantly reshapes the Earth. The fates of these volatile
elements, especially carbon and hydrogen, in the deep mantle are still not well understood.
In this dissertation I will address the questions of carbon and hydrogen storage in the mantle
from high pressure melting and phase equilibrium experiments.
1.1 Deep carbon cycle
Carbon is one of the most important volatiles in the mantle. Besides participating in
the carbon cycle in exosphere which is crucial to the Earth’s climate and life activities,
carbon is moving in another deep cycle on the planetary level. Carbon enters the Earth’s
interior though subduction in forms of organics in seafloor sediments or carbonates in oceanic
basalts (Alt et al. 2012). When the subduction slab goes deep into the mantle and is heated
up, some of the carbon escapes from the slab and goes into a highly mobile fluid phase in
the form of CO2, CO and CH4 (Manning et al. 2013) along with H2O. Some carbonates in
2
the slab dissolve into the fluid (Ague and Nicolescu, 2014) and eventually get back to the
atmosphere through volcanism (Dasgupta and Hirschmann, 2010). Some of the carbon in the
form of carbonates will survive in the slab (e.g. Poli et al. 2009; Conolly 2005) and continue
to dive deeper into the mantle. At certain depths, if the slab is warmed up and reaches the
solidus temperature of carbonated mantle rock, melting may happen and creates
carbonatitic melt, a small portion of which ascends fast to the Earth’s surface, forming
kimberlite and carbonatite (Jones et al. 2013). The solidus temperature varies with alkaline
content and Ca number (molar Ca/(Ca+Mg+Fe)%) (Dasguputa et al. 2005). The solidus of
carbonated eclogite with a normal composition seems higher than the temperatures of most
of the Earth’s subduction systems (Dasguputa and Hirschmann, 2010), which indicates
carbonates can enter the transition zone and lower mantle. With a low oxygen fugacity in
the lower mantle (Frost and McCammon, 2008), carbonates may get reduced to graphite or
diamond (Rohrbach and Schmidt, 2011; Stagno et al. 2013). Carbon in the lower mantle can
be brought back to a shallower depth by upwelling mantle. With increasing oxygen fugacity
upon ascending, diamonds may be oxidized back to carbonates and experience melting
(Rohrbach and Schmidt, 2011; Stagno et al. 2013). Some questions about deep carbon cycle
are still unknown, such as carbon exchange between core and mantle, the interaction
between hydrogen and carbon in deep mantle, carbon bearing phases in lower most mantle
and etc. Phase equilibrium experiment is one of the most widely used approaches to study
melting of carbonated mantle rock. But large discrepancies exist among those results from
phase equilibrium experiments, especially the solidus temperatures of carbonated mantle
rocks (Kiseeva et al. 2013), which lead to different scenarios of deep carbon cycle. The
discrepancies could be caused by the composition variations of starting materials, which

3
reflects the complexities of the system. Another approach to study melting of carbonated
mantle rock is thermodynamic modeling (e.g. Kerrick and Connolly, 2001; Connoll 2005).
By building a thermodynamic model which is calibrated upon results of phase equilibrium
experiments, one can predict solidus temperature and mineral assemblage under any given
starting composition and pressure. However, a comprehensive thermodynamic model requires
thermodynamic parameters of every species in the system, such as heat capacity, enthalpy of
fusion, compressibility, thermal expansibility, etc. Even though there are relatively complete
models for silicate melting (e.g. Ghiorso et al. 2002), carbonates still lack crucial data such as
compressibility of their melts to be incorporated into the model. By addressing this problem, we
started to work on end member carbonates, CaCO3, Na2CO3, K2CO3, which are of the most
important carbonates in the mantle. By studying the melting curves of these end member
carbonates, the compressibility of each species can be calculated from the slope of the curve by
method such as fusion curve analysis (Ghiorso, 2004). The melting curve can provide other
information, e.g., the sub-melting solid phase transition can be discovered from the sudden
change of melting curve slope.
To accurately measure melting temperatures of carbonates under upper mantle condition,
we developed a new technique for high pressure melting temperature measurement by
monitoring sudden change of capacitive current through the sample upon melting. Details about
this new technique are reported in Chapter II. This new technique is an in situ approach and the
measurement is non-destructive to the sample, so the melting curve of an ionic crystal over the
entire pressure range of the upper mantle can be measured in a single high pressure experiment.
Besides its efficiency, this technique also has advantages such as high signal/noise ratio and
simple implementation.

4
In Chapter III, the melting curve of NaCl up to ~20 GPa is reported using the new technique
described in Chapter II. The results from our measurement closely resemble previous data on
melting temperature of NaCl up to 6.5 GPa (Clark 1959; Pistorius 1966; Akella et al. 1969),
which validates the accuracy of this capacitive current based measurement. New data about
melting temperature of NaCl up to ~20 GPa was acquired and several melting equations were
fitted the new data set.
In Chapter IV, the melting curve of CaCO3 is reported up to ~22 GPa using the new
technique described in chapter II. The new results densely cover the pressure range from ~3 to
~22 GPa. Two features of the CaCO3 melting curve were discovered for the first time: the
melting curve reached a local maximum at ~7 GPa and started to decrease slowly until 15 GPa,
which we interprets as the melt/solid density crossover at 7 GPa; the melting curve has a sudden
change in slope at 15 GPa from decreasing to increasing with higher pressure, which we
interprets as the solid/melt density overturn caused by calcite V to aragonite phase transition.
The melting curve of CaCO3 keeps within 1700-1800 °C over 4 -20 GPa, and may cross over
with a hot adiabatic geotherm at the transition zone depth in a upwelling setting, indicating
carbonate induced melting in the transition zone.
In Chapter V, the melting curves of two more carbonates, Na2CO3 and K2CO3, are reported
up to ~20 GPa using the same method described in Chapter II. With a similar structure and
chemical properties, the Na2CO3 and K2CO3 were expected to behave similarly, but our results
show that even starting with similar melting temperature below 3GPa, the melting temperature of
Na2CO3 increases at a much slower rate than K2CO3. The melting temperature of K2CO3 based
on our measurement has caught up with that of MgCO3 (Katsura and Ito, 1990) at ~ 17 GPa. The
melting curve of K2CO3 shows a deflection point at ~ 9 GPa, which may indicate a sub-melting

5
solid transition. In order to further investigate the high pressure polymorphs of K2CO3 suggested
by the deflection of its melt curve, in situ X-ray diffraction experiments with laser heated
diamond anvil cells were conducted. Two new phase transitions of K2CO3 at ~ 3 GPa and ~9
GPa are reported.
1.2 Deep hydrogen cycle
Hydrogen enters the Earth interior through subduction, in the form of H2O (Peacock, 1990).
Most of pore H2O in the ocean sediment and crust is lost in the initial dehydration in the
subduction prism (Rüpke et al. 2004). The chemically bounded water, in the form of serpentine,
can reach a depth of ~ 200 km and a temperature of ~600 °C (Rüpke et al. 2004) before
deserpentinization, releasing the chemically bounded water, which are commonly believed to
trigger arc melting. Some serpentine will survive the deserpentinization (Van Keken et al. 2002),
and experiences a series of phase transitions towards higher pressure and higher temperature.
These phases are a group of minerals called the dense hydrous magnesium silicates (DHMS),
such as phase A, phase B (Ringwood and Major, 1967), phase superhydrous B (Gasparik, 1990),
phase D (Liu, 1986), phase E (Kudoh et al. 1993), phase H (Nishi et al. 2014) and δ phase
(Suzuki et al. 2000). These DHMS can carry water all the way to the lower mantle (Ohtani et al.
2014). The nominally anhydrous minerals, wadsleyite and ringwoodite, were found to able to
contain up to 1% H2O in their structures (Smyth, 1987; Kohlstedt et al. 1996). The recent
discovery of diamond inclusion containing ringwoodite with up to 1% wt H2O (Pearson et al.
2014) suggested that the transition zone is the largest water reservoir inside the Earth.
Research interests on deep water cycle focus on phase equilibrium (e.g. Irifune et al. 1998;
Ohtani et al. 2000; Shieh et al. 2000; Angel et al. 2001), crystal structures (e.g. Yang et al. 1997;

6
Bindi et al. 2014) and physical properties (e.g. Sanchez-Valle et al. 2008; Mao et al. 2012) of
those hydrous minerals stable in the mantle condition. One of the problems that some of these
studies faced was the limited sample volume. Because most of these DHMS minerals require
higher than 10 GPa to synthesize, and phase D and phase H even require more than 20 GPa
(Ohtani et al. 2014), the sample volume which can be acquired through high pressure syntheses
is limited to only a few micrograms. Some experimental techniques, such as neutron diffraction
and calorimetry, require at least tens of micrograms of sample to work. Germanate analogues of
DHMS can be used to circumvent this problem. With similar crystal structures and properties,
hydrous magnesium germanates (DHMG) minerals can be synthesized with much lower pressure
(Thomas et al. 2008). In Chapter VI, the stability of several DHMG minerals based on phase
equilibrium experiments are reported, one of which has been determined to be germanate
analogue of phase D. The acquired pressure and temperature stability map of those DHMG can
be the guide for future syntheses of DHMG.

7
References
Ague, J.J., and Nicolescu, S. (2014) Carbon dioxide released from subduction zones by fluid-
mediated reactions, Nature Geosciences, 7, 355-360.
Akella, J., Vaidya, S. N., and Kennedy, G. C., (1969) Melting of sodium chloride at pressures to
65 kbar. Physical Review, 185, 1135–1140.
Angel, R.J., Forst, D.J., Ross, N.L., and Hemley, R.J. (2001) Stabilities and equations of state of
dense hydrous magnesium silicates. Physics of the Earth and Planet Interiors,127, 181-
196.
Bindi, L., Nishi, M., Tsuchiya, J., and Irifune, T. (2014) Crystal chemistry of dense hydrous
magnesium silicates: The structures of phase H, MgSiH2O4, synthesized at 45 GPa and
1000 °C. American Mineralogist, 99, 1802-1805.
Clark, S. P. J. (1959) Effect of pressure on the melting points of eight alkali halides. Journal of
Chemical Physics, 31, 1526-1531.
Connlly J.A.D. (2005) Computation of phase equilibria by linear programming: a tool for
geodynamic modeling and its application to subduction zone decarbonation. Earth
Planetary Science Letters, 236, 524-541.
Dasgupta, R., Hirschmann, M.M., and Dellas, N. (2005) The effect of bulk composition on the
solidus of carbonated eclogite from partial melting experiments at 3 GPa, Contributions
to Mineralogy and Petrology, 149, 288-305.
Dasgupta, R., and Hirschmann, M. M. (2010) The deep carbon cycle and melting in Earth's
interior. Earth and Planetary Science Letters (Frontiers), 298, 1-13.
Forst, D.J., and McCammon, C.A. (2008) The redox state of the Earth’s mantle. Annual Review
of Earth and Planetary Sciences, 36, 389-420.
Gasparik, T. (1990) Phase relations in the transition zone. Journal of Geophysical Research, 95,
1575 l-15769.
Ghiorso, M.S. (2004) An equation of state for silicate melts. III analysis of stoichiometric liquids
at elevated pressure: shock compression data, molecular dynamics simulations and
mineral fusion curves. American Journal of Science, 304, 752-810.
Ghiorso M.S., Hirschmann, M.M, Reiners, P.W., and Kress, V.V. III (2002) The pMELTS: A
revision of MELTS for improved calculation of phase relations and major element
partitioning related to partial melting of the mantle to 3 GPa. Geochemistry Geophysics
Geosystems, 3, 10.1029/2001GC000217.

8
Irifune, T., Kubo, N., Isshiki, M., and Yamasaki, Y. (1998) Phase transformations in serpentine
and transportation of water into the lower mantle. Geophysical Research Letters, 25, 203-
206.
Jones, A.P., Genge, M., and Carmody, L. (2013) Carbonate melts and carbonatites. Reviews in
Mineralogy & Geochemistry, 75, 289-322.
Katsura, T., and Ito, E. (1990) Melting and subsolidus phase relations in the MgSiO3–MgCO3
system at high pressures: implications to evolution of the Earth’s atmosphere. Earth and
Planetary Science Letters, 99, 110–117.
Kerrick, D.M., and Connolly J.A.D. (2001) Metamorphic devolatilization of subducted marine
sediments and transport of volatiles into the Earth's mantle. Nature, 411, 293-296.
Kiseeva, E.S., Litasov K.D., Yaxley, G.M., Ohtani, E., and Kamenetsky, V.S. (2013) Melting
and phase relations of carbonated eclogite at 9-21 GPa and the petrogenesis of alkali-rich
melts in the deep mantle.
Kohlstedt, D. L., Keppler, H. & Rubie, D. C. (1996) Solubility of water in the α, β and γ phases
of (Mg,Fe)2SiO4. Contributions to Mineralogy Petrology, 123, 345–357.
Kudoh, Y., Finger, L.W., Hazen, R.M., Prewitt, C.T., Kanzaki, M., and Veblen, D.R. (1993)
Phase E: a high pressure hydrous silicate with unique crystal chemistry. Physics and
Chemistry of Minerals, 19, 357- 360.
Liu, L. (1986) Phase transformations in serpentine at high pressures and temperatures and
implications for subducting lithosphere. Physics of the Earth and Planetary Interiors, 42,
255-262.
Manning, C.E., Shock, E.L., and Sverjensky, D.A. (2013) The chemistry of carbon in aqueous
fluids at crustal and upper-mantle conditions: experimental and theoretical constraints.
Reviews in Mineralogy and Geochemistry, 75, 109-148.
Mao, Z., Lin, L., Jacobsen, S.D., Duffy, T.S., Chang, Y., Smyth, J.R., Forst, D.J., Hauri, E.H.,
Prakapenka, V.B. (2012) Sound velocities of hydrous ringwoodite to 16 GPa and 673 K.
Earth and Planetary Science Letters, 331-332, 112-119.
Nishi, M., Irifune, T., Tsuchiya, J. Tange, Y., Nishihara, Y. Fujino, K., and Higo, Y.
(2014) Stability of hydrous silicate at high pressures and water transport to the deep
lower mantle, Nature Geoscience, 7, 224-227.
Ohtani, E., Mizobata, H., and Yurimoto, H. (2000) Stability of dense hydrous magnesium silicate
phases in the systems Mg2SiO4-H2O at pressures up to 27 GPa, 27, 533-544.

9
Ohtani, E., Amaike, Y., Kamada, S., Sakamaki, T., and Hirao, N. (2014) Stability of hydrous
phase H MgSiO4H2 under lower mantle conditions. Geophysical Research Letters, 41,
8283-8287.
Pearson, D.G., Brenker, F.E., Nestola, F., McNeill, J., Nasdala, L., Hutchison, M.T., Matveev,
S., Mather, K., Silversmit, G., Schmitz, S., Vekemans, B., and Vincze, L. (2014) Hydrous
mantle transition zone indicated by ringwoodite included within diamond. Nature, 507,
221-224.
Pistorius, C. W. F. T. (1966) Effect of pressure on the melting points of the sodium halides.
Journal of Chemical Physics, 45, 3513-3519.
Poli, S., Franzolin, E., Fumagalli, P., and Crottini, A. (2009) The transport of carbon and
hydrogen in subducted oceanic crust: An experimental study to 5 GPa. Earth and
Planetary Science Letters, 278, 350-360.
Ringwood, A.E., and Major, A. (1967) High-pressure reconnaissance investigations in the
system Mg2SiO4-MgO-H2O Earth Planetary Science Letters, 2, 130-133.
Rohrbach, A., and Schmidt, M.W. (2011) Redox freezing and melting in the Earth’s deep mantle
resulting from carbon-rion redox coupling, Nature, 339, 456-458.
Rüpka, L.H., Mogan, J.P., Hort, M., and Connolly, J.A.D. (2004) Serpentine and the subduction
zone water cycle. Earth and Planetary Science Letters, 223, 17-34.
Sanchez-Valle, C., Sinogeikin, S.V., Smyth, J.R., and Bass, J.D. (2008) Sound velocities and
elasticity of DHMS phase A to high pressure and implications for seismic velocities and
anisotropy in subducted slabs. Physics of the Earth and Planetary Interiors, 170, 229-239.
Shieh, S.R., Mao, H., Hemley, R.J. and Ming, L. (2000) In situ X-ray diffraction studies of dense
hydrous magnesium silicates at mantle conditions. Earth Planetary Science Letters, 177,
69-80.
Stagno, V, Ojwang, D.O., McCammon, C.A., and Frost, D.J. (2013) The oxidation state of the
mantle and the extraction of carbon from Earth’s interior. Nature, 493, 84-88.
Smyth, J.R. (1987) Beta-Mg2SiO4 – a potential host for water in the mantle. American
Mineralogist, 72, 1051-1055.
Suzuki, A., Ohtani, E., and Kamada., T. (2000) A new hydrous phase δ-AlOOH synthesized at
21 GPa and 1000 °C. Physics and Chemistry of Minerals, 10, 689-693.
Thomas, S., Koch-Müller, M., Kahlenberg, V., Thomas, R., Ehede, D., Wirth, R., and Wunder,
B. (2008) Protonation in germanium equivalents of ringwoodite, anhydrous phase B , and
superhydrous phase B. American Mineralogist, 93, 1282-1294.

10
Thompson, A.B. (1992) Water in the Earth’s upper mantle. Nature, 358, 295-302.
Van Keken, P., Kiefer, B., and Peacock, S. (2002) High resolution models of subduction zones:
Implications for mineral dehydration reactions and the transport of water into the deep
mantle, Geochemistry Geophysics and Geosystems, 3, 1056.
Yang, H., Prewitt, C.T., and Frost D.J. (1997) Crystal structure of the dense hydrous magnesium
silicate, phase D. American Mineralogist, 82, 651-654.

11
Chapter II
High pressure melting temperature measurement through
electrical measurement of capacitive current
2.1 Introduction
Melting plays a critical role in planetary differentiation and dynamics. Knowledge of the
pressure-dependent melting temperatures of Earth materials is of fundamental importance for
constraining the Earth's thermal structure, understanding geochemical cycles, and interpreting
seismic observations (Boehler 1996). Many experimental methods have been developed to
investigate melting at high pressure. As a first order phase transition, melting is characterized by
the loss of long-range atomic order, which manifests as the disappearance of reflections from
lattice planes and appearance of diffuse scattering signal in X-ray diffraction patterns (Anzellini
et al. 2013). Melting is associated with significant changes in lattice dynamics, which lead to
vanishing Lamb-Mossbauer factor (Jackson et al. 2013). The latent heat of melting gives rise to
enhanced absorption of heating power (Boehler et al. 1997; Lord et al. 2010) and may be
detected through differential thermal analysis (DTA) (Akella et al. 1969). Furthermore, melting
results in loss of shear strength and precipitous reduction in viscosity, which can be detected
through textural change (Boehler 1997, Chen et al. 2008), from the sinking of a dense sphere
marker (Dobson et al. 1996), or from discontinuous change in electrical resistivity (Brand et al.
2006). Measuring the melting temperatures of materials at the pressure conditions of deep Earth

12
poses considerable technical challenges and consequently experimental data are limited and
often uncertain (e.g., Anzellini et al. 2013; Boehler 1996; Shen and Lazor 1995).
Of those techniques for measuring melting temperature at high pressure, in situ X-ray
diffraction is most widely used. In situ X-ray diffraction is able to combine with laser heated
diamond anvil cell for measuring melting temperature at lower mantle and core pressure (Shen et
al. 2001). However, it is limited by relatively large error in temperature determination
(Campbell, 2008). Melting detection through monitoring change in lattice dynamic only works
on materials containing Mossbauer active elements. In addition, its requirement for synchrotron
Mossbauer spectroscopy limits its use. Thermal differential analysis is sensitive over melting but
needs large amount of sample to have detectable thermal effect on the heating power, which
limits its use only in piston cylinder. Detecting melting though quenched texture and sinking
spheres provide the most direct and convicting results, but requires recovery of samples and
multiple experiments to bracket the melting temperature at one pressure, which demands a great
deal of work. Melting detection through visual observation of texture change within a diamond
anvil cell is prone to subjective judgment and false signals from other unknown pre-melting
effects (Cheng et al. 2003). For studying melting of minerals in upper mantle and transition zone
depth, which correspond to a pressure range of 0-23 GPa, an efficient, easily implemented, and
accurate high pressure melting temperature measurement technique is needed.
Except quartz, diamond, graphite and etc., the majority of geologic interesting minerals are
ionic crystals. Ionic crystals are consisted of cations and anions which are locked in the crystal
lattice and cannot move freely. Without charge carriers, ionic crystals are usually insulators at
room temperature. When ionic crystals are heated to melt, ions are freed and able to move freely
in the melt. These mobile ions can be charge carriers, and when an electrical field is applied on

13
the melt, cations and anions are moving in the electrical field, creating a current. So an ionic melt
is a conductor whose electrical conductivity is several orders of magnitude higher than that of its
solid form. With a pair of electrodes contacted with an ionic melt and a voltage on the electrodes,
the current in the circuit can be measured by an ammeter. When the voltage on the electrodes are
higher than the redox potentials of ions in the melt, the ions can be oxidized or reduced at the
surface of the electrodes, which generates a continuous current, called Faradic current. However,
if the voltage on the electrodes is below the redox potentials of any ions in the melt, the cations
and anions are attracted by the electrical field and move close to cathode and anode respectively
but without any redox reactions happening. This movement of ions will create a spontaneous
current, called capacitive current (Reiger, 1994). But because this separation of charges creates
an opposite direction electrical field counteracts the electrical field from electrodes, the
separation of ions and related capacitive current will eventually stop.
This dramatic electrochemical change associated with the melting of ionic crystal can be
used to detect melting. And because the electrical conductivity can be measured by a pair of
electrodes contacting with the sample, it is suitable for implementation in high pressure
experiment, such as piston cylinder, multi-anvil and diamond anvil cell. In a high pressure
experiment the electrical conductivity of the sample can be measured in situ by simple external
equipment while heating, so eliminating the need for limited accessible experiment facilities
such as synchrotron radiation.
In this study, a new high pressure melting temperature measurement technique based on
electrical measurement of capacitive current is developed, fine-tuned and implemented in multi-
anvil experiments.
2.2 Method

14
2.2.1 Ambient pressure tests
In the beginning of this study, a series of ambient pressure experiments were conducted to
test the best approach of detecting melting through electrical conductivity change during melting
of ionic crystal. These tests were done using a platinum crucible and two platinum wire
electrodes (Fig. 2.1). The 1st and 2
nd tests used NaCl as sample, and the 3
rd test used Na2CO3 as
sample. All 3 ambient temperature tests used a small art-clay furnace to heat the sample up to
1000°C, and the heating rate was 20°C/min. The sample was heated until melting happened,
which was visually checked, then the sample was cooled and heated again if necessary.
Temperature was recorded using a type K thermocouple. The conductivity change was measured
using different functions of a Fluke 289 multimeter. The data was recorded every 1 second. In
the 1st test, the sample was NaCl and the conductivity through the melt was measured use the
ohmmeter function of the multimeter. In the 2nd
test, a DC 10V voltage was applied on
electrodes, and the current through the melt was recorded using the ammeter function of the
multimeter. To prevent current overloading the multimeter, a resistor rated at 100 ohms was
added to the circuit. In the 3rd
experiment, an AC 11.6V voltage was applied on electrodes and
the voltammeter function of the multimeter was used to monitor the voltage drop on the melt
during melting. In the 2nd
and 3rd
experiments the electrodes were fixed in an alumina 4 bole.
15
Figure 2.1 Schematic diagrams showing the experiment setups of the resistance, current and
voltage measurement tests at ambient pressure.

16
2.2.2 High pressure tests
High pressure tests were conducted after gaining basic insights from ambient pressure
experiment. High pressure experiments were conducted using a 1000-ton Walker-style multi-
anvil apparatus at the University of Michigan. Fansteel tungsten carbide cubes with 8-mm
truncation edge length (TEL) and octahedron-shaped pressure medium casted from Aremco 584
old-style material (Walker 1991) were used in these experiments (Fig. 2.2). The relation between
the sample pressure and applied ram pressure was established using the Bi I-II, II-III and III-V
transitions at room temperature (Decker et al. 1972) and the known phase boundaries at 1473 K
including quartz-coesite-stishovite (Bohlen and Boettcher 1982; Zhang et al. 1996), CaGeO3
garnet-perovskite (Susaki et al. 1985) and forsterite-wadsleyite- ringwoodite transitions (Katsura
and Ito 1989). The sample pressure (P) is calculated from the ram force (p) according to the
following formulae:
P (GPa) = -0.03 + 3.21•10-2
•p (US ton) - 1.40•10-5
•p2 (8mm TEL)
The precision in pressure calibration is estimated at ±5% on the basis of duplication experiments.
High temperature was generated using cylindrical-shaped foil of rhenium, with a thickness
of 0.0015 inch. A standard type-C thermocouple (W26%Re and W5%Re, 0.005 inch or 0.127
mm in diameter) was used to monitor the temperature. The uncertainty in the measured
temperature is estimated at ±1% for experiments up to 10 GPa and 2200 K, which includes the
precisions in the thermocouple calibration and the positioning of the thermocouple junction
relative to the sample (Li et al. 2003) and does not include the effect of pressure on the
electromotive force (emf).
The sample used in these tests was reagent CaCO3 from Aldrich (99.99%). The sample was
dried in a vacuum oven at ~ 400 K for more than one week before being packed inside a Pt

17
tubing, which served as the sample container and helped to reduce the temperature gradient. The
complete assembly was dried in the vacuum oven at 400 K for at least 24 hours before loading
into the multi-anvil apparatus. In a typical high-pressure experiment, the ram pressure was
increased at the rate of 100 US ton per hour during compression, and decreased at the rate of 35
US ton per hour during decompression. Data were acquired at target pressure. At target pressure
the assembly was heated at the rate of 60 K per minute until melting was detected, and then
cooled rapidly to 1000 K and heated again at the same rate of 60 K per minute to replicate
melting detection if necessary.
For the electrical measurements, both 74%W-26%Re (from type C thermocouple) and
platinum wires were tested and evaluated as electrodes. The pair of 200 μm-thick wires were
inserted into a four-bore alumina holder and used as the electrodes (Fig. 2.2). Two different AC
voltages, 11.6V and later 0.1V, were tested and evaluated as probing voltage applied on
electrodes to induce current through the sample. In several experiments the positions of the
thermocouple junction and electrode tips were purposely manipulated to investigate the influence
of thermal gradient on the results (Fig. 2.2). The detailed running conditions of each experiment
were listed in Table 2.1.
18
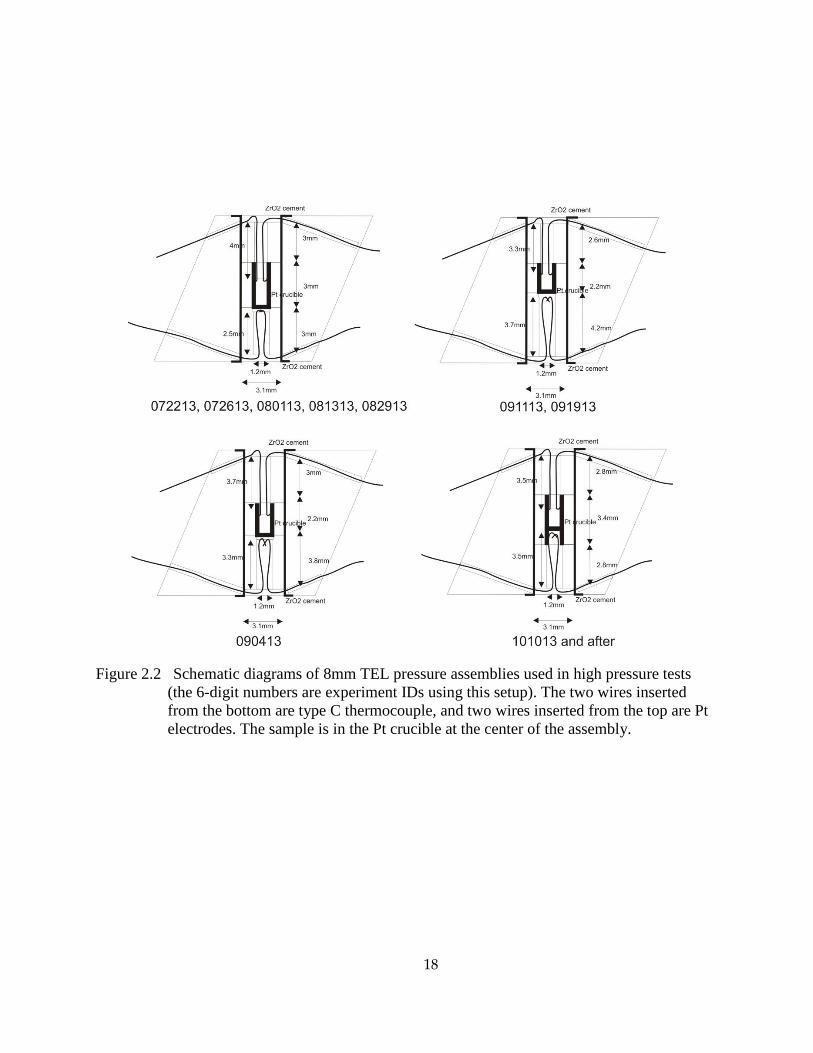
Figure 2.2 Schematic diagrams of 8mm TEL pressure assemblies used in high pressure tests
(the 6-digit numbers are experiment IDs using this setup). The two wires inserted
from the bottom are type C thermocouple, and two wires inserted from the top are Pt
electrodes. The sample is in the Pt crucible at the center of the assembly.

19
Table 2.1 summary of experiment conditions of high pressure tests
Experiment ID Target Pressure,
GPa
Probing voltage,
V
Electrode
material
072213 2.7 AC* 11.6 76%W-24%Re
072613 8.0, 10.0 AC 11.6 76%W-24%Re
080113 2.7, 6.0, 8.0 AC 11.6 76%W-24%Re
081313 2.7 AC 11.6 Pt
082913 2.7, 4.5, 7.2, 9.0 AC 0.1 Pt
090413 2.7, 4.5, 6.3, 7.2,
8.1, 9.0
AC 0.1 Pt
091113 1.8, 2.7, 4.5, 6.3,
7.7, 9.0
AC 0.1 Pt
091913 1.8, 2.7, 4.5, 6.3,
7.7, 9.0
AC 0.1 Pt
101013 4.5, 6.4, 8.6 AC 0.1 Pt
111513 2.7, 4.1, 5.4, 6.8,
7.7 , 9.0
AC 0.1 Pt
112513 2.7, 4.1, 5.4, 6.8,
7.7 , 9.0
AC 0.1 Pt
121813 2.7, 4.1, 5.4, 6.8,
7.7 , 9.0
AC 0.1 Pt
* AC-Alternating current

20
2.3 Results and discussion
2.3.1 Ambient pressure tests
The 1st ambient pressure test using ohmmeter to measure the resistance of NaCl sample
showed generally decreasing resistance over increasing temperature, but with several turbulences
on the curves at around 200-300 °C and 400-700 °C (Fig. 2.3). At around 800 °C (melting
temperature of NaCl), there was no large drop in resistance. However, there were two suspicious
resistance drops at around 750°C and 840 °C which might indicate melting, but with all the other
turbulences these small drops were too indistinct. Using an ohmmeter directly to measure
resistance did not work well was probably due to the polarization of electrodes. When the
ohmmeter functions, the ohmmeter itself gives a small DC probing voltage, but the DC voltage on
the electrodes is too small to induce Faradic current but only polarize the electrodes immersed in
ionic melt immediately. There was no continuous current going through the melt, thus the
ohmmeter cannot read the resistance of the melt. The probing voltage of this ohmmeter (Fluke
289) was found to be adjusting automatically between 1.8V-5.1V, and this adjusting under the
hood might cause the turbulences appearing on the curves.

21
Figure 2.3 Resistance versus temperature relationship of NaCl during heating in the ambient
pressure test using an ohmmeter.
22
The 2nd
ambient pressure test used constant DC 10V as probing voltage and an ammeter to
record current through NaCl sample. The recorded current versus temperature curve showed a
clear current jump when melting happened (Fig. 2.4). The increase of current upon melting was
sharp and more than 2 order of magnitude, which told melting temperature precisely. Visually
checking of the molten sample and electrodes found that tiny liquid metal droplets escaping from
the anode and floating to the surface of NaCl melt, which were supposed to be metal sodium from
electrolysis reaction on the anode. After melting happens, the current was oscillating between 50
and 125 mA, which might be caused by metal sodium percolating and escaping from the surface
of the electrodes disturbing the contacting area of electrodes

23
Figure 2.4 Current versus temperature relationship of NaCl during heating in the ambient
pressure test using DC 10V and an ammeter.

24
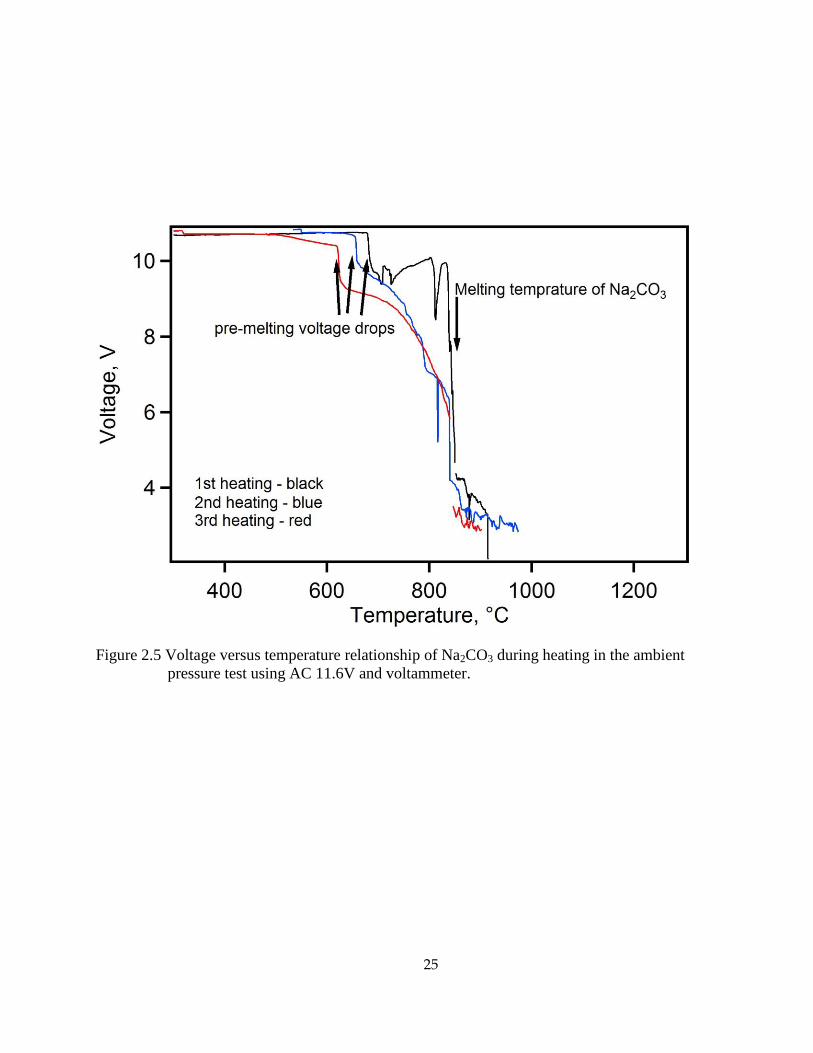
The 3rd
ambient pressure test used AC 11.6V probing voltage and a voltmeter to record the
voltage drop on Na2CO3 sample. The recorded voltage versus temperature curve successfully
detected melting (Fig. 2.5). In the 1st heating cycle, when melting happens (~850°C for
Na2CO3), the voltage fraction on the sample dropped from ~10 V to ~2V, but there was a small
voltage drop of 1-2 V starting from 680°C before melting. After melting, the sample was cooled
until solidified and then heated 2 more times. Pre-melting voltage drops also happened at the 2nd
and 3rd
heating cycles and were in greater magnitude. In the 3rd heating cycle, the pre-melting
voltage drop was difficult to tell from the drop resulted from melting. The pre-melting voltage
drops were likely caused by solid ionic conduction (West, 1995), and the sodium metal from
electrolysis reaction probably contaminated the sample close to electrodes and enhanced the
ionic conduction in 2nd
and 3rd
heating cycles.
25
Figure 2.5 Voltage versus temperature relationship of Na2CO3 during heating in the ambient
pressure test using AC 11.6V and voltammeter.
26
In summary, these ambient pressure tests proved the feasibility of detecting melting through
conductivity change. Both AC and DC voltages can induce Faradic current through the melt
which can be detected directly through an ammeter or by voltage drop on the sample thought a
voltammeter. But the product from electrolysis reactions associated with Faradic current might
contaminate the sample, which will lead degradation of melting signal in laser heating cycles.
2.3.2 High pressure tests
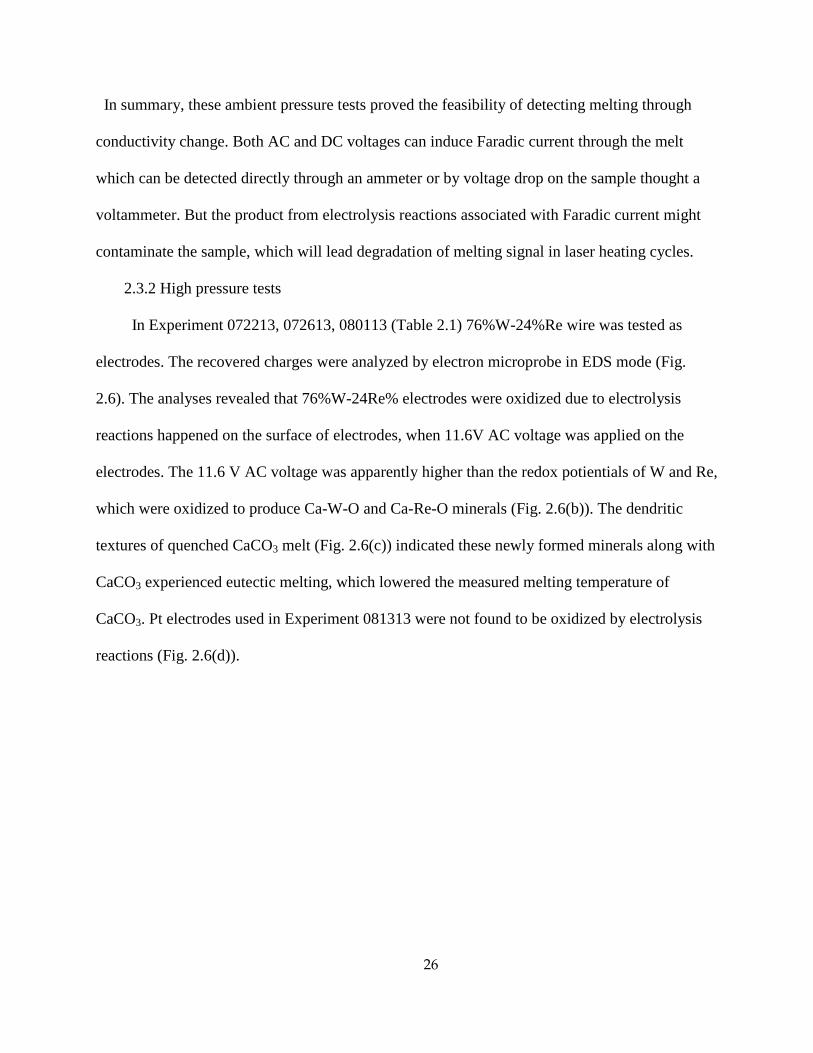
In Experiment 072213, 072613, 080113 (Table 2.1) 76%W-24%Re wire was tested as
electrodes. The recovered charges were analyzed by electron microprobe in EDS mode (Fig.
2.6). The analyses revealed that 76%W-24Re% electrodes were oxidized due to electrolysis
reactions happened on the surface of electrodes, when 11.6V AC voltage was applied on the
electrodes. The 11.6 V AC voltage was apparently higher than the redox potientials of W and Re,
which were oxidized to produce Ca-W-O and Ca-Re-O minerals (Fig. 2.6(b)). The dendritic
textures of quenched CaCO3 melt (Fig. 2.6(c)) indicated these newly formed minerals along with
CaCO3 experienced eutectic melting, which lowered the measured melting temperature of
CaCO3. Pt electrodes used in Experiment 081313 were not found to be oxidized by electrolysis
reactions (Fig. 2.6(d)).

27
(a) (b)
(c) (d)
Figure 2.6 (a) SEM image of recovered charge of Experiment 072613 (the area in the yellow box
was enlarged and shown in (c);
(b) An enlarged image showing electrodes (EDS results: a-76%W-24%Re, b-
CaWxOy , c-CaRezOw , d-Al2O3, e-CaCO3, f-Pt);
(c) Magnified image showing dendrites (EDS results: g-CaCO3, h-CaWxOy);
(d) SEM image of recovered Experiment 081313, whose Pt electrodes were not
affected by electrolysis reactions.
28
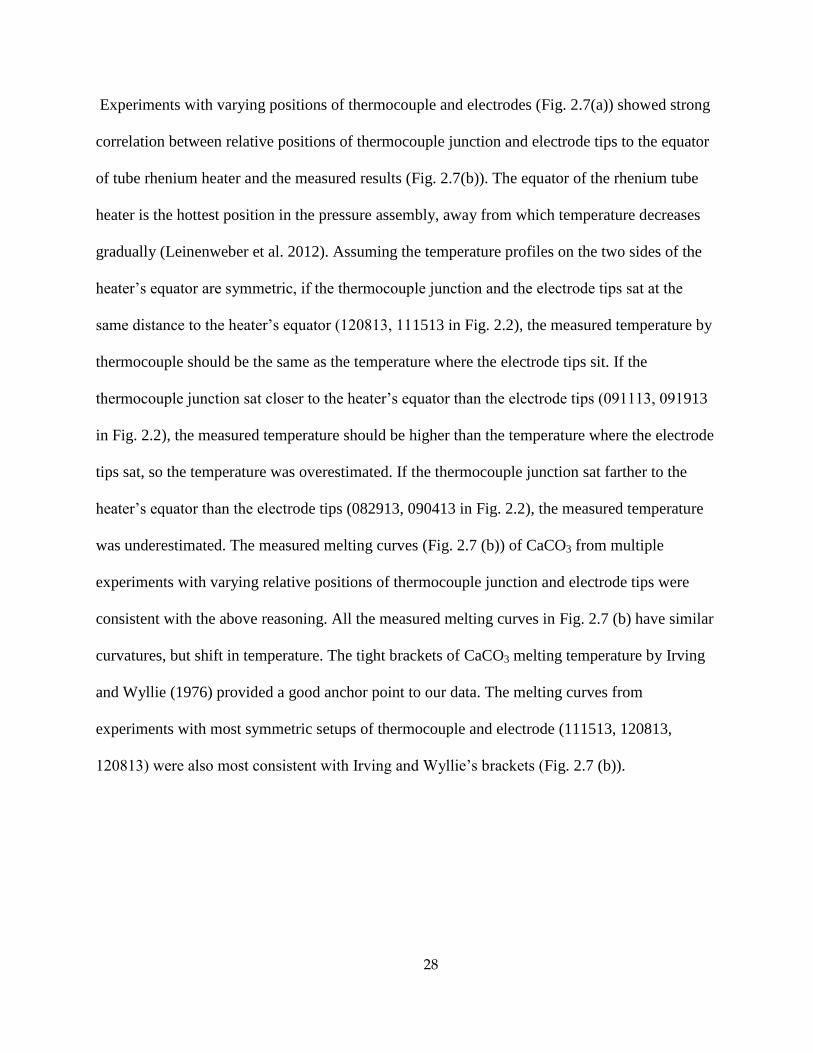
Experiments with varying positions of thermocouple and electrodes (Fig. 2.7(a)) showed strong
correlation between relative positions of thermocouple junction and electrode tips to the equator
of tube rhenium heater and the measured results (Fig. 2.7(b)). The equator of the rhenium tube
heater is the hottest position in the pressure assembly, away from which temperature decreases
gradually (Leinenweber et al. 2012). Assuming the temperature profiles on the two sides of the
heater’s equator are symmetric, if the thermocouple junction and the electrode tips sat at the
same distance to the heater’s equator (120813, 111513 in Fig. 2.2), the measured temperature by
thermocouple should be the same as the temperature where the electrode tips sit. If the
thermocouple junction sat closer to the heater’s equator than the electrode tips (091113, 091913
in Fig. 2.2), the measured temperature should be higher than the temperature where the electrode
tips sat, so the temperature was overestimated. If the thermocouple junction sat farther to the
heater’s equator than the electrode tips (082913, 090413 in Fig. 2.2), the measured temperature
was underestimated. The measured melting curves (Fig. 2.7 (b)) of CaCO3 from multiple
experiments with varying relative positions of thermocouple junction and electrode tips were
consistent with the above reasoning. All the measured melting curves in Fig. 2.7 (b) have similar
curvatures, but shift in temperature. The tight brackets of CaCO3 melting temperature by Irving
and Wyllie (1976) provided a good anchor point to our data. The melting curves from
experiments with most symmetric setups of thermocouple and electrode (111513, 120813,
120813) were also most consistent with Irving and Wyllie’s brackets (Fig. 2.7 (b)).

29
(a)
(b)
Figure 2.7 (a) Reflected light microscopic images of recovered experiment charges. The solid
yellow line marks the positions of rhenium tube heater’s equator, the upper dashed
lines mark the positions of electrode tips in each charge and the lower dashed lines
mark the positions of thermocouple junctions.
(b) Measured melting curves of CaCO3 from corresponding experiments in (a).

30
2.4 Conclusions
Through ambient pressure and high pressure experiments, the best combination of probing
voltage and electrode material were found as AC 0.1V and platinum. This voltage stays below
the thresholds of oxidizing or reducing the ions at the electrodes, so an ionic melt can support
capacitive current, with ions move back and forth between the two electrodes, resembling the
charging and discharging of a capacitor (Rieger 1994). Compared with the existing methods
(e.g., Anzellini et al. 2013; Jackson et al. 2013; Boehler et al. 1997; Chen et al., 2008; Akella et
al. 1969), the capacitive current approach is characterized by its high signal/noise ratio and high
efficiency. The experimental procedure only generates non-destructive capacitive current
through the sample so that the sample can be melted more than 20 times before failure because
of electrodes shorting in a single experiment to yield results that are reproducible within ±5 K at
a given pressure. By using this approach, we can repeat measurements at each pressure and
collect data at multiple pressures in each experiment.
31
References
Akella, J., Vaidya, S. N., and Kennedy, G. C., (1969) Melting of sodium chloride at pressures to
65 kbar. Physical Review, 185, 1135–1140.
Anzellini, S., Dewaele, A., Mezouar, M., Loubeyre, P., and Morard, G. (2013) Melting of iron at
Earth’s inner core boundary based on fast X-ray diffraction. Science, 340, 464-466.
Boehler, R. (1996) Melting temperature of the Earth’s mantle and core: Earth’s thermal structure.
Annual Review of Earth Planetary Sciences, 24, 15-40.
Boehler, R., Ross, M., and Boercker, D.B. (1997) Melting of LiF and NaCl to 1 Mbar:
systematics of ionic solids at extreme conditions. Physical Review Letters, 78, 4589-
4592.
Bohlen, S.R., and Boettcher, A.L. (1982) The quartz ⇆ coesite transformation: a precise
determination and the effects of other components. Journal of Geophysical Research:
Solid Earth, 87(B5), 7073-7078.
Brand, H., Dobson, D.P., Vočadlo L. and Wood, I.G. (2006) Melting curve of copper measured
to 16 GPa using a multi-anvil press. High pressure research, 26(3), 185-191.
Campbell, A.J. (2008) Measurement of temperature distributions across laser heated samples by
multispectral imaging radiometry. Review of Scientific Instruments, 79, 015108.
Chen, B., Gao, L., Leinenweber, K., Wang, Y., Sanehira, T., and Li, J. (2008) In situ
investigation of high-pressure melting behavior in the Fe-S system using synchrotron X-
ray radiography. High Pressure Research, 28(3), 315-326.
Cheng, X., Liu, Z., Cai, L., and Zhang, F. (2003) Simulated melting curve of NaCl up to 200
kbar. Chinese Physics Letters, 20, 2078-2080.
Decker, D.L., Bassett, W.A., Merrill, L., Hall, H.T., and Barnett, J.D. (1972) High-pressure
calibration: A critical review. Journal of Physical and Chemical Reference Data, 1, 773–
835.
Dobson, D. P., Jones, A.P., Rabe, R., Sekine, T., Kurita, K., Taniguchi, T., Kondo, T., Kato, T.,
Shimomura, O., and Urakawa, S. (1996) In-situ measurement of viscosity and density of
carbonate melts at high pressure. Earth and Planet Science Letters, 143, 207–215.
Jackson, J.M., Sturhahn, W., Lerche, M., Zhao, J., Toellner, T.S., Alp, E.E., Sinogeikin, S.V.,
Bass, J.D., Murphy, C.A., and Wicks, J.K. (2013) Melting of compressed iron by
monitoring atomic dynamics, Earth and Planetary Science Letters, 362, 143-150.
Katsura, T., and Ito, E. (1989) The system Mg2SiO4-Fe2SiO4 at high pressures and temperatures:
precise determination of stabilities of olivine, modified spinel and spinel. Journal of
geophysical Research, 94, 15663–15670.

32
Leinenweber, K.D., Tyburczy, J.A., Sharp, T.G., Soignard, E., Diedrich, T., Petuskey, W.B.,
Wang, Y., and Mosenfelder, J.L. (2012) Cell assemblies for reproducible multi-anvil
experiments (the COMPRES assemblies). American Mineralogist, 97, 353-368.
Li, J., Hadidiacos, C., Mao, H., Fei, Y., and Hemley, R. (2003) Behavior of thermocouples under
high pressure in a multi-anvil apparatus. High Pressure Research, 23 (4), 389-401.
Lord, O.T., Walter, M.J., Dobson, D.P., Armstrong, L., Clark, S.M., and Kleppe, A. (2010) The
FeSi phase diagram to 150 GPa, Journal of Geophysical Research: Solid Earth, 115,
B06208.
Reiger, P.H. (1994) Electrochemistry 2nd ed., Chapman & Hall, 180pp.
Susaki, J., Akaogi, M., Akimoto, S., and Shimomura, O. (1985) Garnet-perovskite
transformation in CaGeO3: in-situ X-ray measurements using synchrotron radiation.
Geophysical Research Letters, 12, 729-732.
Shen, G., and Lazor, P. (1995) Measurement of melting temperatures of some minerals under
lower mantle pressures. Journal of Geophysical Research, 100(B9), 17699-17713.
Shen, G., Rivers, M.L., Wang, Y., and Sutton, S.R. (2001) Laser heated diamond cell system at
the Advanced Photon Source for in situ X-ray measurements at high pressure and
temperature. Review of Scientific Instruments, 72(2), 015130.
Walker, D. (1991) Lubrication, gasketing and precision in multianvil experiments. American
Mineralogist, 76, 1092-1100.
West, A.R. (1995) Crystalline solid electrolytes I: General considerations and the major
materials, Solid State Electrochemistry, Cambride University Press, 7pp.
Zhang, J., Li, B., Utsumi, W., and Liebermann, R.C. (1995) In situ X-ray observations of the
coesite-stishovite transition: reversed phase boundary and kinetics. Physics and
Chemistry of Minerals, 23, 1-10.

33
Chapter III
Melting curve of NaCl to 20 GPa from electrical
measurements of capacitive current
3.1 Introduction
As a simple ionic compound, sodium chloride (NaCl) has been investigated extensively in
an attempt to gain insights into its melting mechanism and melt structure (e.g., Clark 1959;
Boehler et al. 1997; An et al., 2006). In high-pressure research, NaCl is widely used as a thermal
insulating material and pressure marker in diamond-anvil cell (DAC) experiments, and therefore
knowledge of its melting curve helps to assess its applicable ranges of pressure and temperature
(e.g., Shen et al. 2001). Furthermore, monitoring the melting of NaCl offers an appealing
alternative for pressure calibration of large-volume apparatus such as the piston-cylinder
apparatus and multi-anvil press (e.g., Leinenweber et al. 2012), with several advantages
including 1) melting occurs much more rapidly than solid-state phase transition; 2) melting can
be readily recognized using a sinking marker such as a Pt sphere; 3) high-purity NaCl is readily
available and less expensive than gold, the melting curve of which has been used for pressure
calibration.
Earlier studies have determined the melting curve of NaCl to 6.5 GPa using the piston-
cylinder apparatus and DTA method (Clark 1959; Pistorius 1966; Akella et al. 1969). The
pressure coverage was subsequently extended to 100 GPa using the diamond anvil cell technique
(Boehler et al. 1997). On the other hand, molecular dynamics (MD) calculations have been

34
performed to constrain the high-pressure melting curve of NaCl (e.g., Belonoshko and
Dubrovinsky 1996; Vočadlo and Price 1996; Chen et al. 2004; Cheng et al. 2003; An et al.
2006). At 20 GPa the calculated melting temperatures from MD simulations exceed the
measured values by as much as 25% and the discrepancies were attributed to superheating and
surface melting effects (An et al. 2006; Vočadlo and Price 1996).
We aimed to establish the melting curve of NaCl up to ~ 20 GPa using the multi-anvil
apparatus and the capacitive current based measurement. The previous results up to 6.5 GPa
(Clark 1959; Pistorius 1966; Akella et al. 1969) can be good standards to test validity and
estimate error of our newly developed technique discussed in Chapter II. The new data above
6.5 GPa can be used to examine if the Simon equation (Simon 1929), the Kraut-Kennedy
equation (Kraut and Kennedy 1966), and the Gilvarry-Lindemann equation (Gilvarry 1956,
1966; Poirier 2000) can adequately describe the melting behavior of ionic compounds at high
pressures.
3.2 Method
The high pressure experiments used in this study is similar as those in Chapter II. However,
besides 8 mm TEL experiments, for experiments at pressures up to 21 GPa we used Toshiba-
Tungaloy F-grade tungsten carbide cubes with 5-mm TEL and the COMPRES 10/5 assembly
(Leinenweber et al. 2012), which was modified for the electrical measurements (Fig. 3.1(a)). The
relation between the sample pressure and applied ram pressure was established using the Bi I-II,
II-III and III-V transitions at room temperature (Decker et al. 1972) and the known phase
boundaries at 1473 K including quartz-coesite-stishovite (Bohlen and Boettcher 1982; Zhang et
al. 1996), CaGeO3 garnet-perovskite (Susaki et al. 1985) and forsterite-wadsleyite- ringwoodite

35
transitions (Katsura and Ito 1989). The sample pressure (P) is calculated from the ram force (p)
according to the following formulae:
P (GPa) = 5.65•10-2
•p (US ton) - 3.80•10-5
•p2 for 5-mm TEL.
The precision in pressure calibration is estimated at ±5% on the basis of duplication experiments
and does not include the effect of temperature, which will be discussed later.

36
Figure 3.1 Experimental configurations for NaCl melting detection using capacitive current
method.
(a) Schematic configuration of the 5-mm assembly used in this study.
(b) Illustrations of the platinum electrodes in four-bore alumina in opaque and
translucent views.
(c) Reflected light microscopic images of recovered charges of Run 021314 (left)
showing symmetric placement of the electrode tips and thermocouple (TC) junction
(circles) with respect to the mid-length of the heater (horizontal line), and the Run
071614 (right), showing that the TC junction is located further away from the mid-
length of the heater than the electrode tips

37
High temperature was generated using cylindrical-shaped foil of rhenium, with a thickness
of 0.0015 inch or 0.038 mm for 8-mm experiments and 0.0025 inch or 0.064 mm for 5-mm
experiments. A standard type-C thermocouple (W26%Re and W5%Re, 0.005 inch or 0.127 mm
in diameter) was used to monitor the temperature. The uncertainty in the measured temperature
is estimated at ±1% for experiments up to 15 GPa and 2600 K, which includes the precisions in
the thermocouple calibration and the positioning of the thermocouple junction relative to the
sample (Li et al. 2003) and does not include the effect of pressure on the electromotive force
(emf), which will be discussed later.
For the electrical measurements, a pair of 200 μm-thick Pt wires were inserted into a four-
bore alumina holder and used as the electrodes (Fig. 3.1 (b)). The electrode tips and
thermocouple junction were placed along the rotational axis of the cylindrical-shaped heater and
at the same distance to the equator of the heater, in order that the thermocouple measured the
same temperature where the electrode tips sit, and they were kept within the middle third of the
heater length, where the temperature variation was expected to be less than 100 K (Leinenweber
et al. 2012). The measurement circuit consisted of a Mastech variac power supply, which
converted 110 V, 60 Hz AC voltage from the wall outlet to 0.1 to 1 V, 60 Hz AC voltage, and a
Fluke 289 multi-meter, which recorded the current through the sample. For most measurements,
the AC voltage was set to 0.1 V to prevent electrolysis reactions and irreversible changes in
sample composition. In order to avoid the electromagnetic perturbation from the heating current
and the motor for pressure control, the voltage was occasionally raised to 1 V, which was found
to be still below the threshold for electrolysis reactions.
Powder of NaCl from Aldrich (99.99%, #38,886-0) was dried in a vacuum oven at ~ 400 K
for more than one week before being packed inside a Pt tubing, which served as the sample

38
container and helped to reduce the temperature gradient. The complete assembly was dried in the
vacuum oven at 400 K for at least 24 hours before loading into the multi-anvil apparatus. In a
typical high-pressure experiment, the ram pressure was increased at the rate of 100 US ton per
hour during compression, and decreased at the rate of 35 US ton per hour during decompression.
Data were acquired at several target pressures along the compression path. At each target
pressure the assembly was heated at the rate of 60 K per minute until melting was detected, and
then cooled rapidly to 1000 K and heated again at the same rate of 60 K per minute to replicate
melting detection at least once. At the highest pressure and temperature of each run, we
quenched the sample by turning off the power. The run products were recovered and inspected
for the positioning of the electrode tips and thermocouple junctions with a Zeiss microscope with
the reflected light and 10x magnification objective lens. A number of run products were
examined for chemical contamination through semi-quantitative energy-dispersive spectroscopy
analyses using the CAMECA SX100 electron microprobe at the University of Michigan.
To test the validity of the in situ electrical measurements, we performed two experiments
using Pt sphere markers, one quench experiment at the University of Michigan and another
synchrotron radiography experiment at GSECARS, the Advanced Photon Source at the Argonne
National Laboratory. The quench experiment used the 8-mm configuration and was run at 6 GPa
and 1923 K, following similar pressure and temperature paths as described above. The
synchrotron experiment used the COMPRES 10/5 on-line design with graphite-filled linear slots
in the lanthanum chromite sleeve as windows for X-ray diffraction and radiography
measurement (Chen et al. 2008; Leinenweber et al. 2012). The experiment was compressed at
room temperature to the target oil load and then heated to 750 K at the rate of 60 K per minute,
where an X-ray diffraction pattern was collected on crystalline NaCl sample for in situ pressure

39
determination. During further heating at the rate of 60 K per min, we monitored the X-ray
radiograph until the Pt marker sank and then quenched the experiment by turning off the power.
3.3 Results and discussion
The melting temperatures of NaCl were determined between 1.8 and 21 GPa (Table 3.1). In
a typical experiment, we saw a rise in the current during heating from a few µA at temperatures
below 1000 K to a few hundred µA upon melting (Fig. 3.2). Assuming that melting leads to the
sharpest rise in the measured current, we took the starting point of the steepest segment of the
current-temperature curve as the melting point. As the heating cycle was repeated multiple times
in the same experiment, melting was detected within ±5 K. The measured melting temperatures
from duplicate experiments at the same condition agree within ±30 K. At pressures below 4 GPa,
the measured melting temperature sometimes shifted up by 10 to 40 K during the first two or
three heating cycles, which may result from thermal relaxation of internal stress in the assembly.
In these cases heating cycles were repeated until the melting temperature reached a stable value,
except at 1.8 GPa where the electrodes failed shortly after melting during the first heating cycle
(Fig. 3.2). The current-temperature relation was reversed upon cooling at up to 20 K lower in
temperature (Fig. 3.2). The hysteresis between the heating and cooling cycle can be attributed to
super-cooling, which is caused by kinetic barrier in nucleation, but there is not a counterpart
effect upon melting (Galiński et al. 2006), so the melting temperatures in the study were all
picked up from heating ramps.

40
Table 3.1 Experimental condition and results
Experiment ID Pressure, GPa Melting T, K
071614_51 5.0
4 1738 ± 40
5
9.0 1963
12.0 2064
15.0 2129
18.0 2181
21.0 2215
070114_5 5.0 1789
9.0 2027
12.0 2058
15.0 2130
021314_5 9.0 2031
12.0 2140
15.0 2205
17.0 2233
19.0 2268
100313_82 3.6 1552
4.5 1719
5.4 1791
6.3 1850
7.2 1911
8.1 1955
9.0 1993
092613_8 1.8 1348
Synchrotron Pt marker
T1103
4.4 at 300 K
4.2 at 780 K 1643 to 1648
Quench Pt marker
012411_83 6 1923
1Data from this experiment were not used for fitting because the
thermocouple junction was located at a significantly colder position than
the electrode tips. 2At 3.6 GPa, the melting temperature is taken from the second heating
cycle and it is higher than that from the first heating cycle by 40 K. 3The marker sank at this temperature.

41
4 The pressure uncertainty can be 2 GPa at maximum at ~20 GPa and
generally smaller than 2 GPa at lower pressure; 5
The temperature error applies for all temperature data in this table and
includes the error caused by pressure shift during heating;
Figure 3.2 Representative current-temperature curves at selected pressures. Melting is located the
abrupt take-off point of each blue curve (Run 021314), or as the starting point of the
steepest segment for each yellow curve (Run 100313). The black curve represents
data collected along the cooling path at 15 GPa in Run 021314. The down-going part
of the red curve (Run 092613) indicates instability of the electrodes before they failed
by contacting each other or with adjacent Pt capsule.

42
Electron microprobe analyses of several recovered samples showed no contamination from
the four-bore alumina, which was in direct contact with the sample, or from any other
components in the assembly, which might diffuse into the sample. Optical inspection of the
experimental products revealed that in Experiment 071614 the thermocouple junction was
positioned further away from the center of the heater than the electrode tips (Fig. 3.1 (c)). As a
result, the measured temperatures from this experiment shifted systematically to lower values
(Table 3.1). These data were not included in the fitting of melting equations.
The melting temperature of NaCl was found to increase continuously with pressure from ~
1100 K at 1.8 GPa to ~ 2300 K at 19 GPa (Table 3.1, Fig. 3.1 (a)). In the synchrotron
radiography experiment (Experiment T1103), melting was detected between 1643 and 1648 K at
4.2 GPa, whereas the quench sinking sphere experiment (Experiment 012411) indicated that
melting occurred below 1923 K at 6.0 GPa. These results are consistent with the in situ electrical
measurements.
As mentioned earlier, our measurements are subject to uncertainties arising from the effect
of pressure on the emf of thermocouple, which is poorly known and hence not corrected. Limited
data suggest that the type C thermocouple underestimates the temperature with a systematic error
that generally increases with pressure and temperature and could amount to tens of degrees or
even more than 100 K at 15 GPa and above 2000 K (Li et al. 2003). Consequently, our melting
temperatures may need to be corrected upwards by tens to 100 K, especially at high pressures.
Another source of uncertainty in the data may result from pressure drift during heating.
Recent synchrotron experiments showed that the sample pressure at constant applied ram
pressure drifted upwards or downwards as temperature increased from 1473 to 2273 K (Fei et al.
2004a, 2004b; Leinenweber et al. 2012). The direction and magnitude of the pressure drift varied

43
with the TEL, configuration, temperature, pressure and heating history in a complicated manner,
making it difficult to correct for the effect of temperature on pressure calibration. For the
COMPRES 10/5 assembly, on which our experiments were based, available data showed that
upon heating from 1473 K to 1800 K the sample pressure drifted downwards by 0.2 GPa at 20
GPa, and by 1 GPa at 15 and 17 GPa. On the other hand, the sample pressure was found to drift
upwards by 2 GPa when heated from 1473 K to 2273 K at 23 GPa after experiencing a previous
heating cycle (Fei et al. 2004a). Synchrotron experiments may be more susceptible to pressure
drifts because the cell configurations were modified to allow X-ray access to the sample, which
introduced additional heat sinks and mechanical weakness. In this study, the melting temperature
at 3.6 GPa was found 30 K higher in the second heating cycle, probably because the sample
pressure shifted up by about 0.3 GPa. On the other hand, experiments above 4 GPa yielded
consistent melting temperatures (within ±5 K) among multiple heating cycles, indicating little
pressure drift. For these reasons, we expect that the sample pressures in this study deviate from
the calibration curve at 1473 K by less than 1 GPa at 15GPa and by less than 2 GPa at ~20 GPa,
no greater than synchrotron experiments mentioned above. At low pressures where the melting
temperature increases rapidly with pressure at a rate of ~200 K per GPa, any pressure drift would
lead to large errors in the measured melting temperature. Fortunately, pressure drift generally
scales with temperature (e.g., Fei et al. 2004b), and therefore smaller pressure drifts are expected
at lower pressures where the melting temperatures are lower. At high pressures where the rate
drops to 20 K per GPa at ~15 GPa and 10 K per GPa at ~20 GPa, a pressure drift of ±1 GPa at 15
GPa or ±2 GPa at 20 GPa would introduce an additional error of ±20 K. The combined
uncertainties in the measured melting temperature, including the precision of the type C
thermocouple, the reproducibility within a single experiment and among duplicate experiments,

44
and the pressure drift at high temperature, are estimated at ±40 K, assuming that the sources of
uncertainties are random and independent.
Comparison with existing data
The melting curve of NaCl determined in this study agrees well with the existing
experimental results at pressures up to 6.5 GPa and is marginally consistent with those at higher
pressures (Fig. 3.1 (a)). The results reproduced the existing data from piston-cylinder
experiments (Akella et al. 1969) within ±20 K, suggesting that emf correction and melting
temperature change caused by pressure drift are smaller than ±20 K within the relevant pressure
and temperature ranges, unless the two effects cancel out. At pressures above 12 GPa, the
melting temperatures determined in this study exceed the DAC results (Boehler et al. 1997) by
100 K to 200 K. The discrepancies between the two sets of data, however, generally fall within
the estimated uncertainty of ±40 K in this study and the reported uncertainties of ±50 K up to 15
GPa and ±100 K up to 20 GPa in the DAC study. Heating-induced pressure drifts in the positive
direction would bring our results into better agreements with the DAC data, whereas emf
corrections and pressure drifts in the negative direction are expected to do the opposite. Further
studies are necessary to quantify the effect of pressure on emf and to reduce the uncertainties in
sample pressure, for example, by using an internal pressure marker. Vočadlo and Price (1996)
suggested that DAC measurements tend to underestimate the melting temperature because of
observational biases under extreme conditions. If corrected upwards by about 10% to account for
surface melting effect (Cheng et al. 2003), the DAC data would agree well with the results of this
study.
Compared with the latest theoretical results (An et al. 2006), the melting temperatures
reported here are in agreement at 5 GPa, 100 K lower at 10 GPa, and 150 K lower at 20 GPa
45
(Fig. 3.1 (a). Earlier results from MD simulations exceed that from DAC experiments by as
much as 500 K at 20 GPa, well beyond the estimated uncertainty of ±100 K using the supercell
methodology (Vočadlo and Price, 1996). Cheng et al. (2003) proposed that the melting
temperature from simulation should be corrected downward by about 20% to account for
superheating effect resulting from small system size and short time scale. More recent MD
simulation (An et al. 2006) yielded substantially lower melting temperatures for NaCl, which
requires no more than 5% correction for superheating to match the melting temperature at 20
GPa determined in this study.
Fitted melting equations
The empirical Simon equation has been widely used to fit pressure-dependent melting
temperature in the form of (T/T0)c = (P-P0)/A + 1, where A and c are constants with values ≥1,
T0 and T are the melting temperatures at the reference pressure P0 and P, respectively. The
Simon equation stands out in its simplicity and has the advantage of not requiring any knowledge
of the equation-of-state (EoS) of the solid phase. It has the drawbacks that the fitting parameters
A and c have no clear meanings and that they correlate with each other. Consequently, the
equation works well for interpolation but cannot be used for extrapolating melting temperatures
beyond the experimental pressure range. Indeed, the parameters that fitted data up to 6.5 GPa
(Akella et al. 1969) differ considerably with that of this study (Table 2) and the melting curve
extrapolated from the low-pressure fitting over-predicts the data by nearly 100 K at 20 GPa (Fig.
3a).
The Kraut-Kennedy melting equation describes how the melting temperature scales with
volume and it can be written in the form of T/T0 = C•V/V0 + 1, where V = V0 - V is the volume
reduction of the solid resulting from compression, T and T0 are the melting temperatures at V and
46
V0 respectively, C is a constant that relates to the vibrational Grüneisen parameter 0 at V0 and it
equals to 2•(0 - 1/3). In this equation V and V0 refer to the 300 K volumes of the solid phase at a
given pressure and 0 GPa, respectively. For NaCl, we used the EoS parameters from Birch
(1986) to calculate V from V0 and found that 0 is 2.52±0.05. These values are in general
agreement with existing results (Table 2). For example, by using the EoS parameters from
Bridgman (1940), Akella (1969) reported a 0 value of 2.78, which is similar to the fitted value of
2.62±0.02 using the EoS parameters from Birch (1986).
Lindemann's law (1910) provides a semi-empirical scaling relation to fit discrete
measurements of melting temperatures for interpolation, and in the absence of data it is often
used together with an equation of state to predict Tm at high pressures (Poirier, 2000). Given that
Lindemann (1910) only used the equation to calculate the vibrational frequency of a solid from
its melting point, and that Gilvarry (1956, 1966) developed the theory of melting from
Lindemann's law, we will call it Gilvarry-Lindemann melting equation. The equation takes the
form Tm ~ 0.00321•M•f2•D
2•V
2/3, where M (the molar mass in grams) and f (the critical
Gilvarry-Lindemann factor) are independent of pressure, and D (the Debye temperature) varies
with V (the molar volume in cubic centimeter). The volume dependence of D can be described
by the vibrational Grüneisen parameter = -∂lnD/∂lnV. It is commonly assumed that itself
scales with volume in the form /0 = (V/V0)q, where and 0 are the Grüneisen parameters at V
and V0, respectively, and q is a constant that is usually assumed to be one in shock wave data
reduction (Fei et al. 2004b). The equation can then be expressed as Tm ~
1.689•f2•0
2•(V0/V)(2
0·(V0/V)-q
- 1/3), where 0 is the Debye temperature at V0. In this form, the
equation has four fitting parameters (f, 0, 0, q), all of which may be obtained from or compared

47
with independent measurements, and an isothermal EoS at 300 K is used to calculate the volume
at a given pressure.
By using the EoS parameters from Birch (1986), two sets of fitting parameters were
obtained: one for a fixed q at 1, and the other allowing q to be fitted by the data (Table 2). The
parameters f and 0 correlate with each other and cannot be uniquely fitted. With 0 fixed at 302
K (Poirier, 2000), the fitted Gilvarry-Lindemann factor f ~ 0.08 is lower than the known value of
0.11 for alkali halides (Martin and O'Connor, 1977). If f is fixed at 0.11, the fitted 0 value is 228
K, which is closer to 279±11 K, which is cited in Decker (1971). We found that holding q at 1
failed to reproduce the curvature of the melting curve between 0 and 20 GPa, whereas a good fit
is obtained when q is allowed to vary. Recent experimental and theoretical studies on MgO
demonstrated that variable q is required to satisfy the high P-T static and shock wave data (Fei et
al. 2004b). For NaCl, a volume-dependent q value may be needed to describe the thermoelastic
behavior, or it may indicate that extending the Gilvarry-Lindemann melting equation to ionic
crystals does not work well because the Debye-Waller theory is limited to monoatomic solids
(Gilvarry, 1956).
As widely recognized the Kraut-Kennedy melting equation can be derived from the
Lindemann equation by assuming that the volume dependence of melting temperature is constant
and equals to the value at V0 (e.g. Akella et al. 1969). This approximation does not apply at
higher pressures, where the measured melting temperatures deviated from the fitted curve
towards lower temperatures due to the volume dependence of gamma (Akella et al. 1969). In our
study, the measured melting temperature began to deviate from a linear trend at pressures above
14 GPa, where the Grüneisen parameter is expected to be higher because of the reduced volume.
48
3.4 Implications
The melting temperatures of NaCl between 0 and ~20 GPa, determined using a newly
developed in situ capactive current method and the multi-anvil apparatus and, reproduce existing
data up to 6.5 GPa but show considerable discrepancies with both diamond-anvil-cell and
theoretical results at higher pressures. The discrepancies suggest that superheating effect in
molecular dynamic calculations may be as much as 150 K at about 20 GPa. Alternatively, the
discrepancies may originate from pressure effect on the emf of type C thermocouple, which was
expected to underestimate the melting temperatures and are uncertain at pressures above 4 GPa
(e.g., Li et al. 2003; Fei et al. 2004b). In high-pressure experiments, temperatures are commonly
measured with a thermocouple or spectral radiometry. While the thermocouple method is subject
to poorly constrained pressure effect on emf, the spectral radiometry also suffers from limited
knowledge of wavelength dependent emissivity and optical aberration (Shen et al., 2001),
leading to errors that are more than 100 K (Campbell, 2008). An independent evaluation of the
pressure effect on emf remains a challenge.
The capacitive current method can be applied to determine the melting temperatures of ionic
compounds at high pressures. This method uses Pt as the electrodes and sample container and is
applicable below the melting point of Pt, which increases from 2042 K at 0 GPa to 2600 to 2900
K at 20 GPa (Belonoshko and Rosengren 2012). Compared with the existing methods (e.g.,
Anzellini et al. 2013; Jackson et al. 2013; Boehler et al. 1997; Chen et al., 2008; Akella et al.
1969), the capacitive current approach is characterized by its high signal/noise ratio and high
efficiency. The experimental procedure has been optimized to generate non-destructive
capacitive current through the sample so that it can be melted more than 20 times before failure
because of electrodes shorting in a single experiment to yield results that are reproducible within

49
±5 K at a given pressure. By using this approach, we can repeat measurements at each pressure
and collect data at multiple pressures in each experiment. The melting curve of NaCl may be
used for hot pressure calibration of piston cylinder and multi-anvil apparatus up to about 7 GPa.
At higher pressures, the melting slope becomes rather shallow, increasing by only 20 K per GPa
at 15 GPa. Considering the weak dependence of melting temperature on pressure and significant
uncertainties the melting temperature of NaCl, the melting curve of NaCl does not appear to be a
good candidate for pressure calibration above 10 GPa.
In this study the frequency of the test voltage is 60 Hz, which is readily available and
adequate for detecting melting. In impedance spectroscopy studies, a wide range of frequencies
from 1 Hz to 1 MHz have been used (e.g., Gaillard et al. 2008; Yoshino et al. 2010). The
signal/noise ratio may improve at higher frequencies that match ionic relaxation more closely. In
future development, a waveform generator may be used to optimize the frequency of the test
voltage. The design of the pressure assembly can also be modified to further reduce the random
errors in temperature by improving the positioning precision and minimizing the size of the
thermocouple junction. Finally, this approach may be integrated with other high-pressure devices
such as diamond anvil cells to extend the pressure coverage.

50
(a)
(b)
(c)
Figure 3.3 Fittings of NaCl experimental data to melting equations. Results from this study
(Table 3.1) are shown as narrow diamonds for 8-mm experiments 092613 (red) and
100313 (blue), regular diamonds for 5-mm experiments 021314 (red) and 070114
(black), and solid triangles for the experiments using Pt sphere markers. Open
triangles and circles represent experimental data from Akella et al. (1969) and
Boehler et al. (1997), respectively.Bars and pounds represent theoretical results from
Belonoshko and Dubrovinsky (1996) and An et al. (2006), respectively.
(a) Simon’s equation fittings for data from this study (black thick solid curve) and for
those of Akella et al. (1969) (gray thin solid curve).The melting curve of platinum
(Pt) is shown as the dashed line (Belonoshko and Rosengren, 2012).

51
(b) Kraut-Kennedy equation fittings for data from this study (black thick solid line),
for those of Akella et al. (1969) (gray thin solid curve), and those of Boehler et al.
(1997) (gray thin dashed line).
(c) Gilvarry-Lindemann equation fittings for data from this study with q fitted by the
data (black thick solid line) or q fixed at 1 (gray thick solid line), for those of
Akella et al. (1969) (gray thin solid curve), and those of Boehler et al. (1997) (gray
thin dashed line)
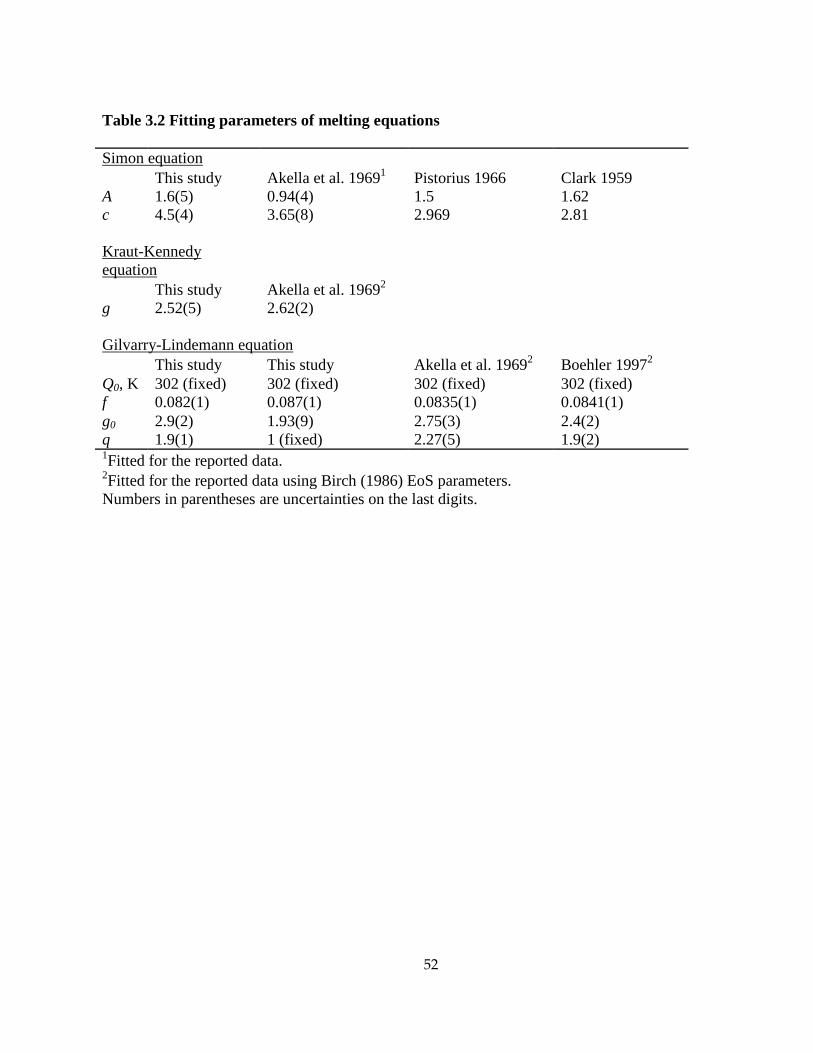
52
Table 3.2 Fitting parameters of melting equations
Simon equation
This study Akella et al. 19691 Pistorius 1966 Clark 1959
A 1.6(5) 0.94(4) 1.5 1.62
c 4.5(4) 3.65(8) 2.969 2.81
Kraut-Kennedy
equation
This study Akella et al. 19692
g 2.52(5) 2.62(2)
Gilvarry-Lindemann equation
This study This study Akella et al. 19692 Boehler 1997
2
Q0, K 302 (fixed) 302 (fixed) 302 (fixed) 302 (fixed)
f 0.082(1) 0.087(1) 0.0835(1) 0.0841(1)
g0 2.9(2) 1.93(9) 2.75(3) 2.4(2)
q 1.9(1) 1 (fixed) 2.27(5) 1.9(2) 1Fitted for the reported data.
2Fitted for the reported data using Birch (1986) EoS parameters.
Numbers in parentheses are uncertainties on the last digits.
53
References
Akella, J., Vaidya, S. N., and Kennedy, G. C., (1969) Melting of sodium chloride at pressures to
65 kbar. Physical Review, 185, 1135–1140.
An, Q., Zheng, L., Fu, S., Ni, S., and Luo, S. (2006) Solid-liquid transitions of sodium chloride
at high pressures. The Journal of Chemical Physics, 125, 154510.
Anzellini, S., Dewaele, A., Mezouar, M., Loubeyre, P., and Morard, G. (2013) Melting of iron at
Earth’s inner core boundary based on fast X-ray diffraction. Science, 340, 464-466.
Belonoshko, A.B., and Dubrovinsky, L.S. (1996) Molecular dynamics of NaCl (B1 and B2) and
MgO (B1) melting: Two-phase simulation. American Mineralogist, 81, 303-316.
Belonoshko, A.B. and Rosengren, A. (2012) High-pressure melting curve of platinum from ab
initio Z method. Physics Review B, 85, 174104.
Birch, F. (1939) Thermoelectric measurement of high temperature in pressure apparatus. Review
of Scientific Instruments, 10, 137-140.
Birch, F. (1986) Equation of state and thermodynamic parameters of NaCl to 300 kbar in the
high-temperature domain. Journal of Geophysical Research, 91, B5, 4949-4954.
Boehler, R., Ross, M., and Boercker, D.B. (1997) Melting of LiF and NaCl to 1 Mbar:
systematics of ionic solids at extreme conditions. Physical Review Letters, 78, 4589-
4592.
Bohlen, S.R., and Boettcher, A.L. (1982) The quartz ⇆ coesite transformation: a precise
determination and the effects of other components. Journal of Geophysical Research:
Solid Earth, 87(B5), 7073-7078.
Campbell, A.J. (2008) Measurement of temperature distributions across laser heated samples by
multispectral imaging radiometry. Review of Scientific Instruments, 79, 015108.
Chen, B., Gao, L., Leinenweber, K., Wang, Y., Sanehira, T., and Li, J. (2008) In situ
investigation of high-pressure melting behavior in the Fe-S system using synchrotron X-
ray radiography. High Pressure Research, 28(3), 315-326.
Chen, Q., Cai, L., Duan, S., and Chen, D. (2004) Melting and Grüneisen parameters of NaCl at
high pressure. Chinese Physics, 13(07), 1091-1095.
Cheng, X., Liu, Z., Cai, L., and Zhang, F. (2003) Simulated melting curve of NaCl up to 200
kbar. Chinese Physics Letters, 20, 2078-2080.
Clark, S. P. J. (1959) Effect of pressure on the melting points of eight alkali halides. Journal of
Chemical Physics, 31, 1526-1531.

54
Decker, D. L. (1971), High-pressure equation of state for NaCl, KCl, and CsCl, Journal of
Applied Physics, 42(8), 3239-3244.
Decker, D.L., Bassett, W.A., Merrill, L., Hall, H.T., and Barnett, J.D. (1972) High-pressure
calibration: A critical review. Journal of Physical and Chemical Reference Data, 1, 773–
835.
Fei, Y., Li, J., Hirose, K., Minarik, W., Van Orman, J., Sanloup, C., Van Westrenen, W.,
Komabayashi, T., and Funakoshi, K. (2004a) A critical evaluation of pressure scales at
high temperatures by in situ X-ray diffraction measurements. Physics of the Earth and
Planetary Interiors, Vol. 143-144, 515-526.
Fei, Y., Van Orman. J., Li, J., Van Westrenen, W., Sanloup, C., Minarik, W., Hirose, K.,
Komabayashi, T., Walter, M., and Funakoshi, K. (2004b) Experimentally determined
postspinel transformation boundary in Mg2SiO4 using MgO as an internal pressure
standard and its geophysical implications. Journal of Geophysical Research: Solid Earth,
109(B2), B2305.
Gaillard, F., Malki, M., lacono-Marziano, G., Pichavant, M., and Scaillet, B. (2008) Carbonatite
melts and electrical conductivity in the asthenosphere. Science, 322, 1363-1365.
Galiński, M., Lewandowski, A., and Stępniak, I. (2006) Ionic liquids as electrolytes.
Electrochimica Acta, 51, 5567-5580.
Gilvarry, J.J. (1956) The Lindemann and Grüneisen laws. Physical Review, 102, 308-316.
——— (1966) Lindemann and Grüneisen laws and a melting law at high pressure. Physical
Review Letters, 16, 1089-1091.
Jackson, J.M., Sturhahn, W., Lerche, M., Zhao, J., Toellner, T.S., Alp, E.E., Sinogeikin, S.V.,
Bass, J.D., Murphy, C.A., and Wicks, J.K. (2013) Melting of compressed iron by
monitoring atomic dynamics, Earth and Planetary Science Letters, 362, 143-150.
Katsura, T., and Ito, E. (1989) The system Mg2SiO4-Fe2SiO4 at high pressures and temperatures:
precise determination of stabilities of olivine, modified spinel and spinel. Journal of
geophysical Research, 94, 15663–15670.
Kraut, E.A., and Kennedy G.C. (1966) New melting law at high pressures. Physical Review
Letters, 16, 608-609.
Lindemann, F.A. (1910) The calculation of molecular vibration frequencies. Physikalische
Zeitschrift, 11, 609-612.
Leinenweber, K.D., Tyburczy, J.A., Sharp, T.G., Soignard, E., Diedrich, T., Petuskey, W.B.,
Wang, Y., and Mosenfelder, J.L. (2012) Cell assemblies for reproducible multi-anvil
experiments (the COMPRES assemblies). American Mineralogist, 97, 353-368.

55
Li, J., Hadidiacos, C., Mao, H., Fei, Y., and Hemley, R. (2003) Behavior of thermocouples under
high pressure in a multi-anvil apparatus. High Pressure Research, 23 (4), 389-401.
Martin, C.J., and O’Connor, D.A. (1977) An experimental test of Lindemann’s melting law.
Journal of Physics C: Solid State Physics, 10, 3521-3526.
Pistorius, C. W. F. T. (1966) Effect of pressure on the melting points of the sodium halides.
Journal of Chemical Physics, 45, 3513-3519.
Poirier, J-P. (2000) Introduction to the Physics of the Earth’s interior, 2nd ed., Cambridge
University Press, 312pp.
Shen, G., Rivers, M.L., Wang, Y., and Sutton, S.R. (2001) Laser heated diamond cell system at
the Advanced Photon Source for in situ X-ray measurements at high pressure and
temperature. Review of Scientific Instruments, 72(2), 015130.
Simon, F.E., and Glatzel, G. (1929) Fusion-pressure curve. zeitschrift fur anorganische und
allgemeinechemie, 178, 309-312.
Stixrude, L., Koker, N.D., Sun, N., Mookherjee, M., and Karki, B.B. (2009) Thermodynamics of silicate
liquids in the deep Earth. Earth and Planetary Science Letters, 278, 226-232.
Susaki, J., Akaogi, M., Akimoto, S., and Shimomura, O. (1985) Garnet-perovskite
transformation in CaGeO3: in-situ X-ray measurements using synchrotron radiation.
Geophysical Research Letters, 12, 729-732.
Vočadlo, L., and Price, G.D. (1996) The melting of MgO – computer calculations via molecular
dynamics. Physics and Chemistry of Minerals, 23, 42-49.
Walker, D. (1991) Lubrication, gasketing and precision in multianvil experiments. American
Mineralogist, 76, 1092-1100.
Yoshino, T., Laumonier, M., Mcisaac, E., and Katsura, T. (2010) Electrical conductivity of
basaltic and carbonatite melt-bearing peridotites at high pressures: implications for melt
distribution and melt fraction in the upper mantle. Earth and Planetary Science Letters,
295, 593-602.
Zhang, J., Li, B., Utsumi, W., and Liebermann, R.C. (1995) In situ X-ray observations of the
coesite-stishovite transition: reversed phase boundary and kinetics. Physics and
Chemistry of Minerals, 23, 1-10.

56
Chapter IV
Melting temperature of calcium carbonate up to 22 GPa and
implications for carbon cycle in the mantle
4.1 Introduction
Carbon is one of the most important volatile elements in the Earth’s mantle, which plays a
key role in mantle magmatism. Carbon exists mostly as CO2, CH4 fluids in the shallow
lithosphere, as carbonates in the upper mantle and as diamonds and carbides in the lower mantle
(Dasgupta and Hirschmann 2010). Carbon enters the mantle mainly as carbonates through
subduction (Alt et al. 2012) and can go back to the surface through partial melting of carbonated
silicate as carbonatitic and kimberlitic melts (Jones et al. 2013). Carbonates may sink into the
deep mantle with subducted slabs and sometimes recycled back to upper mantle through mantle
upwelling, during which the carbonates might experience redox freezing and melting depends on
the local oxygen fugacity (Rohrback and Schmidt, 2011). The knowledge of melting of
carbonates can help us understand the origin of carbonate melt such as carbonatitic and
kimberlitic melts and the pathways of carbon cycle in the mantle. Previous experiments on
melting of carbonates focused on the melting of complex system such as CaO-MgO-Al2O3-SiO2-
CO2 (e.g. Dalton and Presnall,1998; Canil and Scarfe,1990; Keshav et al. 2011) and CaO-MgO-
Al2O3-SiO2-Na2O-K2O-CO2 (e.g. Dasgupta and Hirschmann, 2006; Litasov and Ohtani, 2009;
Ghosh et al. 2009) up to 26 GPa, but these results had large discrepancies up to 400 K, which
were probably due to the variance in the starting materials. These large discrepancies lead to
57
different scenarios for the process and influence of carbonate induced melting in the mantle,
especially in the transition zone. Another approach to studying melting of carbonated mantle
rock is thermodynamic modeling (Ghiorso, 2004), which requires complete thermodynamic
parameters (such as heat capacity, enthalpy of fusion, molar volume and its pressure
dependence) of every species in the melting system.
The CaCO3 will experience a series of metastable phase transitions with cold compression:
calcite I to calcite II, calcite II to calcite III (Fiquet et al. 1994), calcite III to calcite VI (Merlini
et al. 2011). However, calcite I/calcite V will transform to aragonite at 1-8 GPa depending on
different temperature (Suito et al. 2001). Aragonite will transform to post-aragonite at around 40
GPa (Ono et al. 2005). Calcite I will transform to calcite IV at ~985 K and then calcite V at
~1240 K when heated at ambient pressure, and calcite V has a unique structure that the oxygen
triangles of the CO3 group do not sit still at specified positions in the space group R -3 m, but
migrate along the undulated circular orbital about carbon (Ishizawa et al., 2013). However, the
solid phase transitions of CaCO3 below 20 GPa have not been fully resolved. The phase
boundary between calcite and aragonite phases was inconsistent among several studies (Irving
and Wyllie, 1973; Mirwald, 1976; Suito et al., 2001) and the pressure and temperature of the
invariant point of calcite V, aragonite and melt or the existence of other high pressure polymorph
of CaCO3 above 8 GPa is not known.
CaCO3 does not melt but decompose to CaO and CO2 around 900 °C, but with only 0.1 GPa
pressure, it is stabilized and melt congruently (Wyllie and Boettcher, 1969). The melting
temperature of CaCO3 under high pressure has been studied by Irving and Willey (1975) in a
piston cylinder and by Suito et al. (2001) in a multi-anvil apparatus. Irving and Willey checked
melting by observing the quenched texture in a recovered sample and bracketed the melting

58
temperatures of CaCO3 in a small range up to 3 GPa. Suito et al. combined in situ X-ray
diffraction and X-ray diffraction on retrieved sample to bracket the melting temperatures up to 9
GPa, but the results did not constrain the melting temperature tightly which will results in a large
range of possible volume of CaCO3 melt. In addition more data needed to tell the melting
behavior of CaCO3 to the transition zone and even lower mantle pressure, which is crucial for
understanding deep carbon cycle.
In this chapter, the melting curve of pure CaCO3 to the transition zone pressure (up to ~ 22
GPa) is reported, which revealed the unique melting behavior of CaCO3 and its possible
influence on carbonated mantle rock. The melting curve of CaCO3 also helps resolve the solid
phase diagram of CaCO3 below 22 GPa and calculate the density of CaCO3 melt. The in situ
electrical method described in Chapter II and III was used to determine the melting temperature
of CaCO3.
4.2 Method
The high pressure experiment used in this study is identical to the experiment in Chapter III
(Fig. 4.1). The sample is 99.99% CaCO3 powder from Alfa Aesar (Stock # 43073, Lot # J15N26)
and was dried in vacuum oven at 120 °C for more than 1 week before experiment. After loading
the sample into the assembly, the assemblies were dried in the vacuum oven at 120°C for 24
hours before experiments. 3 control group experiments with their samples exposed in controlled
70% relative humidity environment were conducted to investigate the influence of moisture to
the results (Table 4.1).

59
Figure 4.1 Experimental configurations for CaCO3 melting detection using capacitive current
method.
(a) Schematic configuration of the 5-mm assembly used in this study.
(b)Reflected light microscopic images of recovered charges of Experiment 110113
showing symmetric placement of the electrode tips and thermocouple (TC) junction
(circles) with respect to the equator of the heater (horizontal line) and the sample
position (box).

60
After experiments, the run products were recovered and inspected for the positioning of the
electrode tips and thermocouple junctions with a Zeiss petrographic microscope. A number of
run products were semi-quantitatively examined for chemical contamination using the CAMECA
SX100 electron microprobe in energy dispersive mode at the University of Michigan.
4.3 Results and discussions
The melting temperatures of CaCO3 were determined between 2.7 and 22 GPa (Table 4.1,
4.2). In a typical experiment, we saw a rise in the current during heating from a few μA at
temperatures below 1000 K to a few hundred μA upon melting (Fig. 4.2). Assuming that melting
leads to the sharpest rise in the measured current, we took the starting point of the steepest
segment of the current-temperature curve as the melting point. As the heating cycle was repeated
multiple times in the same experiment, melting was detected within ± 5 K. The measured
melting temperatures from duplicate experiments at the same condition agree within ± 30 K. The
error resulted from the pressure shift upon heating should be equal or smaller to that of NaCl
experiments described in Chapter III, because the melting curve of CaCO3 is flat over 4-20 GPa,
so a maximum 2 GPa pressure shift (Fei et al. 2004a, 2004b; Leinenweber et al. 2012) only cause
a temperature shift of 10-15 °C, smaller than that of NaCl experiments. The combined
uncertainties in the measured melting temperature, including the precision of the type C
thermocouple, the reproducibility within a single experiment and among duplicate experiments,
and the pressure drift at high temperature, are estimated at ±40 K, assuming that the sources of
uncertainties are random and independent.

61
Figure 4.2 Representative current-temperature curves of CaCO3 at selected pressures. Melting is
located the abrupt take-off point of each curve. Red curves are data collected from
Experiment 110113; blue curves are from Experiment 042414; the green curve is
from Experiment 110113. All color curves are along heating path. The black curve
represents data collected along the cooling path at 4 GPa in Experiment 110113.
62
The current-temperature relation was reversed upon cooling at up to 20-30 K lower in
temperature (Fig. 4.2). The hysteresis between the heating and cooling cycle can be attributed to
super-cooling, which is caused by kinetic barrier in nucleation, but there is not a counterpart
effect upon melting (Galiński et al. 2006), so the melting temperatures in the study were all
picked up from heating ramps. Electron microprobe analyses of several recovered samples
showed no contamination from the four-bore alumina, which was in direct contact with the
sample, or from any other components in the assembly, which might diffuse into the sample.
Results from 8mm TEL and 5 mm TEL experiments (Fig. 4.3) show the melting temperature
of CaCO3 increases continuously from 2.7 GPa to ~7 GPa, where the melting curve gradually
flattens out. After reaching a peak of 1760 °C at ~7 GPa, the melting temperature starts to
decrease at a rate of -7.5 °C/GPa until 15 GPa, where a sharp turn makes the melting temperature
turn from decreasing to increasing again at a rate of 15 °C/GPa till our highest experiment
pressure 22 GPa. The 3 control group experiments with humid samples all had melting at 200-
300 °C lower than experiments with carefully dried sample, and all of them failed quickly after
melting because of sample leaking out of capsule, which suggests the presence of water
decreases the viscosity of CaCO3 melt.
The results agree well with Irving and Wyllie (1975)’s measurements (Fig. 4.3), with the
melting curve closely going through their brackets. Irving and Wyllie’s experiments used the
piston cylinder which bears much smaller temperature and pressure error than the multi-anvil
apparatus, and their brackets of melting temperatures were narrow as well, so the agreement of
our data with theirs demonstrated the accuracy and validity of our experimental method and
measurements. Our melting curve also goes through most of the brackets of Suito et al. (2001)’s,
and only 30°C higher than their upper bound at 6.1 GPa, which is within the experimental errors

63
of both experiments. Considering Suito et al. had only one data point to bracket the upper bound
of melting temperature at 6.1 GPa but we have repeated measurements, our measurement should
be more convincing.
Table 4.1 Experimental conditions and results
Experiment ID Pressure, GPa Melting
Temperature, °C
Note
042414_5 9.01 1744 ± 40
2
10.5 1739
13.5 1706
14.3 1699
15.1 1694
16.0 1706
17.0 1720
18.0 1732
19.0 1741
20.0 1756
21.0 1765
031414_53
9.0 1452 Sample leak after melting
032214_53 9.0 1357 Sample leak after melting
032514_53 9.0 1410 Sample leak after melting
15.0 1671
17.0 1697
19.0 1717
121813_8 2.7 1596
4.1 1679
5.4 1726
6.8 1740
7.7 1745

64
9.0 1733
112513_8 2.7 1592
4.1 1694
5.4 1744
6.8 1760
7.7 1758
9.0 1746
110113_5 9.0 1757
12.0 1739
15.0 1712
19.0 1766
22.0 1795 1
The pressure uncertainty can be 2 GPa at maximum at ~20 GPa and generally smaller than 2
GPa at lower pressure; 2
The temperature error applies for all temperature data in this table and includes the error caused
by pressure shift during heating; 3 The samples were exposed in 70% relative humidity air for 2 days.

65
Figure 4.3 Melting curve and related phase diagram of CaCO3. The diamonds represent melting
temperatures collected from 8mm TEL experiments, and the squares represent
melting temperatures collected from 5mm TEL experiments. Red, black, green, blue
and pink colors of diamonds and squares indicate data from multiple experiments.
Upward and downward triangles represent melting temperature brackets from Irving
and Wyllie (1975) (light purple) and Suito et al. (2001) (light green). Solid curves
represent phase boundaries, and the dotted curve represents proposed phase boundary.
The calcite V/aragonite boundary is adapted from Suito et al. (2001) and the calcite
IV/calcite V boundary is adapted from Redfern et al. (1989).

66
The flattened melting curve at ~7 GPa reflected the relative change of solid and melt
volume. When the pressure is smaller than 7 GPa, the slope of the melting curve, which is also a
Clapeyron slope, is positive, indicating the volume of the melt is smaller than that of solid.
However, when the pressure is between 7 GPa and 15 GPa, the negative melting slope reflected a
higher density of melt than the solid. A denser melt than its solid form is most likely caused by a
higher compressibility of the melt than that of the solid (calcite V). With a higher compressibility
the melt reduces the volume difference with the solid with increasing pressure and eventually
catches up with calcite V in density at ~7 GPa and exceed the solid between 7 and 15 GPa.
Another possibility is that a liquid-liquid transition, possibly caused by coordination number
change of the melt, happens in the melt which decreases the volume of the melt around 7 GPa.
But without any further evidence to support this hypothesis, the first explanation is more
possible. The sharp change of the slope from negative to positive at 15 GPa suggests a sudden
filp of volume of melt versus solid, which is mostly likely caused by solid phase transition.
Considering CaCO3 will experience calcite I or calcite V→ aragonite transition between 2-9 GPa
depends on temperature (Suito et al. 2001), and aragonite → post-aragonite transition around 40
GPa (Ono et al. 2004), the most possible solid phase transition at 15 GPa close to melting is
calcite V → aragonite transition. If the phase boundary determined by Suito et al. (2001) is
extrapolated to higher temperature, it can reach the melting curve of CaCO3 at around 15 GPa
(Fig. 4.3), which forms a invariant point of calcite, aragonite and melt. The density jump
associated with calcite → aragonite phase transition can cause the deflection of the melting curve
at 15 GPa.
The high melting temperature of calcite V around 7 GPa forms a ‘bump’ (Fig. 4.3) on the
melting curve, which may be caused by the unique structure of calcite V (Ishizawa et al. 2013).

67
The rotational disorder probably increases the stability of calcite structure, so the melting
temperature of calcite V can be even higher than aragonite between 15-20 GPa.
The local melting temperature minimum at 15 GPa found in this study coincides in pressure
(Fig. 4.4) with the dips in the solidus curves of CMS-CO2 and CMAS-CO2 found by Keshva et
al. (2011). But the dips were not found in CMASN-CO2 system (Ghosh et al. 2009; Litasov and
Ohtani, 2009). A further examination of results of these studies (Keshva et al. 2011; Ghosh et al.
2009; Litasov and Ohtani, 2009) revealed that an increase of calcium composition around 15-20
GPa (Fig. 4.4) in the melt also coincides with the local melting temperature minimum of CaCO3
around 15 GPa. The low melting temperature of CaCO3 may cause the dips in solidus curves of
CMS-CO2 and CMAS-CO2 (Keshva et al. 20011) and the high calcium composition in the melt
also indicates the low melting point of CaCO3 around 15 GPa promotes calcium go into the melt
preferentially. The absence of dips in the solidus curves in the CMASN-CO2 system may be
caused by alkaline contents. Na2CO3 and K2CO3 prefer more strongly going to melt than CaCO3,
so they will form the first melt when partial melting happens, covering the effect of CaCO3 on
solidus.

68
Figure 4.4 Melting curve of CaCO3 (black diamonds and curves) and solidus curves of simplified
carbonated peridotite (grey symbols and curves) and calcium number of melts from
melting experiments of simplified carbonated peridotite (red symbols and doted
curves). Black diamonds represent the best estimated melting temperatures from this
study. The light blue shade highlights the pressure correlation between the melting
temperature minimum of CaCO3 around 15 GPa and the dips of solidus curves from
Keshav et al. (2001) and the increased calcium number. CMS, CMAS, CMSN,
CMASN represent the ingredients of simplified peridotite (C—CaO, M—MgO, A—
Al2O3, S—SiO2, N—Na2O).

69
4.4 Implications
The melting curve of CaCO3 (Fig. 4.5) along with solidus curves of carbonated mantle rock
(Fig. 4.4) are much higher than the geotherm in a ‘hot’ subduction system (Schilling, 1991),
which may indicate little or none carbonate melting along with subduction. Thus carbonates may
enter into transition zone and lower mantle through subduction. If we consider the influence of
possible low oxygen fugacity of the lower mantle (McCammon, 1997), the carbonates in the
subduction slab may be reduced to diamond in the lower mantle (Rohrbach and Schmidt, 2011),
by which carbon is stabilized in the lower mantle. The melting temperature of CaCO3 keeps in a
narrow range between 1700 and 1800 °C in a large pressure range of 4-22 GPa because of high
melting temperature of calcite V and a minimum melting temperature around 15 GPa. This flat
segment of melting curve is likely to cross over a hot mantle geotherm (Fig. 4.5 Tp=1550°C),
such as upwelling regions like mantle plumes or hotspots. Because the melting temperature of
CaCO3 can be viewed as the upper limit of solidus temperature of carbonated peridotite, so the
partial melting of carbonated peridotite in the upwelling system is very likely. In the case of
upwelling mantle, carbonate induced melting likely happened at around 660 km where diamonds
in the lower mantle enters the transition zone and experience redox melting (Rohrbach and
Schmidt, 2012). If the geotherm is a normal one (Fig. 4.5, Tp=1350°C), melting may not happen
intermediately when diamonds get oxidized to carbonates above 660 km depth, but likely
continue ascending and melt around 410 km depth where the solidus of carbonated peridotite has
a minimum temperature (Keshav et al. 2011). Recent seismic observations of low velocity zones
around 410 km (Tauzin et al. 2010) and 660 km (Schmandt et al. 2014) are mostly explained as
caused by dehydration melting due to lower water storage capacity of mantle minerals above and
below transition zones (Bercovici and Karato, 2003; Schmandt et al. 2014), however at these

70
depth carbonate induced melting can be alternate explanations. The water filter model restricts
the depth of melting around 410 km and 660 km depth, however, there are low S-wave velocity
areas within the transition zone (Ritsema et al. 2011) which are mostly associated with hotspots.
These low velocity areas cannot be explained by water filter model, but may be caused by
carbonate induced melting.

71
Figure 4.5 Comparison of the melting curve of CaCO3 (red curve), with various geotherms
(dotted lines): hot subduction is after Bina et al. 2001; the adiabat for a normal mantle
with a potential temperature (Tp) of 1350 °C and a plume adiabat for a potential
temperature of 1550 °C (Schilling, 1991), both with a gradient of 10 °C/GPa (Katsura
et al., 2009).

72
References
Alt, J. C., and D. A. H. Teagle (1999), The uptake of carbon during alteration of ocean crust,
Geochim. Cosmochim. Acta, 63(10), 1527-1535.
Bercovici, D., and Karato, S. (2003), Whole mantle convection and transition-zone water filter,
Nature, 425, 39-44.
Bina, C.R., Stein S., Marton F.C., and Van Ark, E.M. (2001) Implications of slab mineralogy for
subduction dynamics. Phys Earth Planet Inter, 127,51–66.
Boettcher, A.L., and Wyllie, P.J. (1969) Liquidus phase relationships in the system CaO-CO2-
H2O to 40 kilobars pressure with petrological applications. American Journal of Science,
267, 489-508.
Dalton, J.A., and Presnall, D.C. (1998) The continuum of primary carbonatitic-kimberlitic melt
compositions in equilibrium with lherzolite: data from the system CaO-MgO-Al2O3-
SiO2-CO2 at 6 GPa. Journal of Petrology, 39, 1953–1964.
Dasgupta, R., and Hirschmann, M.M. (2006) Melting in the Earth’s deep upper mantle caused by
carbon dioxide: Nature, 440, 659–662.
Dasgupta, R. and Hirschmann, M. M. (2010). The deep carbon cycle and melting in Earth's
interior. Earth and Planetary Science Letters (Frontiers) 298, 1-13.
Fiquet, G., Guyot, F., and Itié, J.-P. (1994) High-pressure X-ray diffraction study of carbonates:
MgCO3, CaMg(CO3)2, and CaCO3. American Mineralogist, 79, 15-23.
Fei, Y., Li, J., Hirose, K., Minarik, W., Van Orman, J., Sanloup, C., Van Westrenen, W.,
Komabayashi, T., and Funakoshi, K. (2004a) A critical evaluation of pressure scales at
high temperatures by in situ X-ray diffraction measurements. Physics of the Earth and
Planetary Interiors, Vol. 143-144, 515-526.
Fei, Y., Van Orman. J., Li, J., Van Westrenen, W., Sanloup, C., Minarik, W., Hirose, K.,
Komabayashi, T., Walter, M., and Funakoshi, K. (2004b) Experimentally determined
postspinel transformation boundary in Mg2SiO4 using MgO as an internal pressure
standard and its geophysical implications. Journal of Geophysical Research: Solid Earth,
109(B2), B2305.
Galiński, M., Lewandowski, A., and Stępniak, I. (2006) Ionic liquids as electrolytes.
Electrochimica Acta, 51, 5567-5580.
Ghiorso, M.S. (2004) An equation of state for silicate melts. III analysis of stoichiometric liquids
at elevated pressure: shock compression data, molecular dynamics simulations and
mineral fusion curves. American Journal of Science, 304, 752-810.

73
Ghosh, S., Ohtani, E., Litasov, K.D., Terasaki, H. (2009) Solidus of carbonated peridotite form
10 to 20 GPa and origin of magnesiocarbonatite melt in the Earth’s deep mantle.
Chemical Geology, 262, 17-28.
Irving, A. J., and Wyllie P. J. (1975), Subsolidus and melting relationships for calcite, magnesite
and join CaCO3-MgCO3 to 36 kb, Geochim. Cosmochim. Acta, 39(1), 35-53.
Irving, A.J., and Wyllie P.J. (1973) Melting relationships in CaO-CO2 and MgO-CO2 to 36
kilobars with comments on CO2 in the mantle. Earth and Planetary Science Letters, 20,
220-225.
Ishizawa, N., Setoguchi, H., and Yanagisawa, K. (2013) Structural evolution of calcite at high
temeperatures: Phase V unveiled. Nature Scientific Reports, 3, 2832.
Jones, A.P., Genge, M., and Carmody, L. (2013) Carbonate melts and carbonatites. Reviews in
Mineralogy & Geochemistry, 75, 289-322.
Katsura T., Shatskiy A., Manthilake G., Zhai S., Fukui H., Yamazaki D., Matsuzaki T., Yoneda
A., Ito E. Kuwata A., Ueda A., Tange Y., Nozawa A., and Funakoshi K. (2009) Thermal
expansion of forsterite at high pressures determined by in situ X-ray diffraction: The
adiabatic geotherm in the upper mantle, Physics of the Earth Planetary Interior, 174, 86 –
92.
Keshav S., Gudfinnsson Gudmundur H., Presnall Dean (2011) Melting Phase Relations of
Simplified Carbonated Peridotite at 12-26 GPa in the Systems CaO-MgO-SiO2-CO2 and
CaO-MgO-Al2O3-SiO2-CO2: Highly Calcic Magmas in the Transition Zone of the Earth,
Journal Of Petrology, vol. 52 p.2265-2291.
Leinenweber, K.D., Tyburczy, J.A., Sharp, T.G., Soignard, E., Diedrich, T., Petuskey, W.B.,
Wang, Y., and Mosenfelder, J.L. (2012) Cell assemblies for reproducible multi-anvil
experiments (the COMPRES assemblies). American Mineralogist, 97, 353-368.
Litasov, K.D., and Ohtani, E. (2009) Solidus and phase relations of carbonated peridotite in the
system CaO-Al2O3-MgO-SiO2-Na2O-CO2 to the lower mantle depths: Physics of the
Earth and Planetary Interiors, 177, 46–58,
McCammon, C. (1997) Perovskite as a possible sink for ferric iron in the lower mantle, Nature,
387, 694-696.
Merlini, M. Crichton, W., Handfland, M., and Crichton, W. (2012) CaCO3-III and CaCO3-VI,
high-pressure polymorphs of calcite: possible host structures for carbon in the Earth’s
mantle. Earth and Planetary Sciences Letters, 333, 265-271.
Mirwald, P.W. (1976) A differential thermal analysis study of the high-temperature
polymorphism of calcite at high pressure. Contributions to Mineralogy and Petrology, 59,
33-40.

74
Ono, S., Kikegawa, T., Ohishi, Y., and Tsuchiya, J. (2005) Post-aragonite phase transformation
in CaCO3 at 40 GPa. American Mineralogist, 90, 667-671
Redfern, S.A.T., and Angel, R.J. (1999) High-pressure behavior and equation of state of calcite,
CaCO3. Contributions to Mineralogy and Petrology. 134, 102-106.
Ritsema, J. van Heijst, H.J., Deuss, A., and Woodhouse, J.H. (2011) S40RTS: a degree-40 shear-
velocity model for the mantle from new Rayleigh wave dispersion, teleseismic
traveltimes, and normal-mode splitting function measurements, Geophysical Journal
International, 184, 1223-1236.
Rohrback, A., and Schmidt M.W. (2011) Redox freezing and melting in the Earth's deep mantle
resulting from carbon-iron redox coupling. Nature, 472, 209-212.
Schilling, J. G., (1991) Fluxes and excess temperatures of mantle plumes inferred from their
interaction with migrating midocean ridges, Nature, 352, 397-403.
Schmandt, B., Jacobsen, S.D. and Becker, T.W. and Liu, Z., and Dueker, K.G. (2014)
Dehydration melting at the top of the lower mantle. Science, 344, 1265-1268.
Suito, K., et al. (2001), Phase relations of CaCO3 at high pressure and high temperature, Am.
Miner., 86(9), 997-1002.
Tauzin, B., Debayle, E. and Wittingger, G. (2010) Seismic evidence for a global low-velocity
layer within the Earth’s upper mantle. Nature Geoscience, 3, 718-721.

75
Chapter V
Melting curves and phase diagrams of Na2CO3 and K2CO3
up to 20 GPa
5.1 Introduction
Alkaline carbonates are important carbonate species that promote melting processes in the
mantle. Experiments have demonstrated that even a small amount of alkaline content
significantly lowers the solidus temperature of carbonated peridotite or eclogite (e.g. Dasgupta
and Hirschmann, 2006; Ghosh et al., 2009; Litasov and Ohtani, 2009). The near solidus melt of
carbonated mantle rock would be alkaline enriched and may be the origin of carbonatitic and
kimberlitic melt (Jones et al. 2013). Alkaline carbonates are also important agents for
metasomatism (Green and Wallace 1988) and crucial for the diamond formation (Schrauder and
Navon 1994). Previous studies about alkaline carbonates were mostly on alkaline-bearing
carbonated mantle rocks or binary carbonates (e.g. Dalton and Presnall, 1998; Shatskiy et al.
2013a, 2013b; Litasov et al. 2013). However, melting behaviors and high pressure mineral
phases of pure Na2CO3 and K2CO3 are unclear yet. So it is important to study the melting
behaviors from end member Na2CO3 and K2CO3.
In this chapter melting curves of Na2CO3 and K2CO3 were measured up to 20 GPa. The high
pressure polymorphs of K2CO3 were investigated as well.

76
5.2 Method
5.2.1 Melting curve measurement
The melting curves of Na2CO3 and K2CO3 were measured by the capacitive current based
measurement described in Chapter II, III and IV. The high pressure experiments were identical to
those in Chapter III and IV. Different from experiments in Chapter II, III and IV, only 10 mm
TEL modified COMPRES assemblies (Leinenweber et al. 2012) were used for the entire
pressure range from ~ 3 GPa to 20 GPa. The relationship between pressure and ram force can be
found in Chapter IV.
The samples were 99.99% Na2CO3 and 99.9% K2CO3 from Alfa Aesar. Because both
Na2CO3 and K2CO3 are highly hydroscopic, extra carefulness were taken to ensure the samples
were dry. Before experiments, samples and half-finished pressure assemblies were kept in a
vacuum oven at 120 °C for 2-3 weeks. When the samples were loaded into the platinum capsule
(see chapter II and III), the capsule and sample were heated up to 500 °C for 10 min in a furnace.
Then the capsule was quickly put into the pressure assembly. Then the pressure assembly was
closed and kept in the vacuum oven at 120 °C for a week before experiments. During
experiments, the pressure-temperature path was the same with those in Chapter III and Chapter
IV. At one pressure, the melting measurements were repeated at least once. After experiments,
the sample was mounted into epoxy and oil grounded. The samples were inspected for the
positioning of the electrode tips and thermocouple junctions with a Zeiss petrographic
microscope.
5.2.2 In situ X-ray diffraction
To further investigate the high pressure phase transitions of K2CO3, angular dispersive X-ray
diffraction experiments on K2CO3 under high pressure with double-sided laser-heated symmetric

77
diamond anvil cell (with cutlet size of 300 µm) (Fig. 5.1) were conducted at Beamline 16-ID-B
of HPCAT, the Advanced Photon Source at the Argonne National Lab. X-ray was
monochromatized to a wavelength of 0.4066 µm and focused to an area of 5 µm by 10 µm.
Diffraction images were recorded over 5s with a Pilatus-1M pixel array detector and were
integrated and corrected for distortions using the FIT2D software (Hammersley et al. 1996). The
sample detector distance was 218.7318 mm.
K2CO3 mixed with 4% wt platinum power was loaded in Rhenium gaskets with a pressure
chamber of 180 µm in diameter and 40 µm thick. The sample has been dried in vacuum oven at
120 °C for 1 week before loaded. After loaded, the diamond anvil cell was half-closed and put in
the vacuum oven for 24 hours. Platinum power was added to enhance the heat adsorption of the
sample and as pressure standard. To maximize the signal, no other pressure medium and thermal
insulator were added, and K2CO3 itself was used as the pressure transmitting medium and
thermal insulator besides as the sample.
K2CO3 samples were in situ double-sided laser-heated using the laser-heating system at
HPCAT consisting of two identical Nd:YLF lasers (λ = 1053 nm). Temperatures were
determined by fitting the thermal radiation to the black body radiation function, and the
measurement had an accuracy of ±100 K (Errandonea et al. 2003). The pressure was determined
by the diffraction lines of platinum in the sample chamber based on Fei et al.’s EOS (2007). The
pressure error was ±1 GPa based on the standard deviation of the lattice parameter.

78
Figure 5.1 Schematic diagram of in situ X-ray diffraction with double-sided laser heating (photo
courtesy of S.-H. Dan Shim).

79
5.3 Results and discussions
5.3.1 Melting curve of Na2CO3
The melting curve of Na2CO3 was determined between 3 and 18 GPa. Similarly with
phenomena (Fig. 4.2) happened with melting of CaCO3, we saw a rise in the current during
heating from a few μA at temperatures below 1000 K to a few hundred μA upon melting.
Assuming that melting leads to the sharpest rise in the measured current, we took the starting
point of the steepest segment of the current-temperature curve as the melting point. As the
heating cycle was repeated multiple times in the same experiment, melting was detected within ±
5 K. The measured melting temperatures from duplicate experiments at the same condition agree
within ± 35 K. With a steeper melting curve than NaCl at 18 GPa, the error resulted from the
pressure shift upon heating should be larger than that of NaCl experiments described in Chapter
III, so a maximum 2 GPa pressure shift (Fei et al. 2004a, 2004b; Leinenweber et al. 2012) cause
a temperature shift of 25-30 K. The combined uncertainties in the measured melting temperature,
including the precision of the type C thermocouple, the reproducibility within a single
experiment and among duplicate experiments, and the pressure drift at high temperature, are
estimated at ± 45 K, assuming that the sources of uncertainties are random and independent.
The melting curve of Na2CO3 is rather smooth over the measured pressure range and its
slope becomes smaller with increasing pressure. The in situ X-ray diffraction experiments of
Shatskiy et al. (2013) showed that β-Na2CO3 is the stable high pressure phase up to ~ 10 GPa.
Cancarevic et al. (2006) predicted based on simulation that Na2CO3 would have a phase
transition from β-Na2CO3 (C2/m) to a phase with space group P -62 m at 16 – 19 GPa. However,
the smoothness of Na2CO3’s melting curve suggests no phase transitions happens and β-Na2CO3

80
is probably stable up to 18 GPa. The melting temperature of Na2CO3 keeps low over the entire
upper mantle pressure range compared with other carbonates (Fig. 5.6).
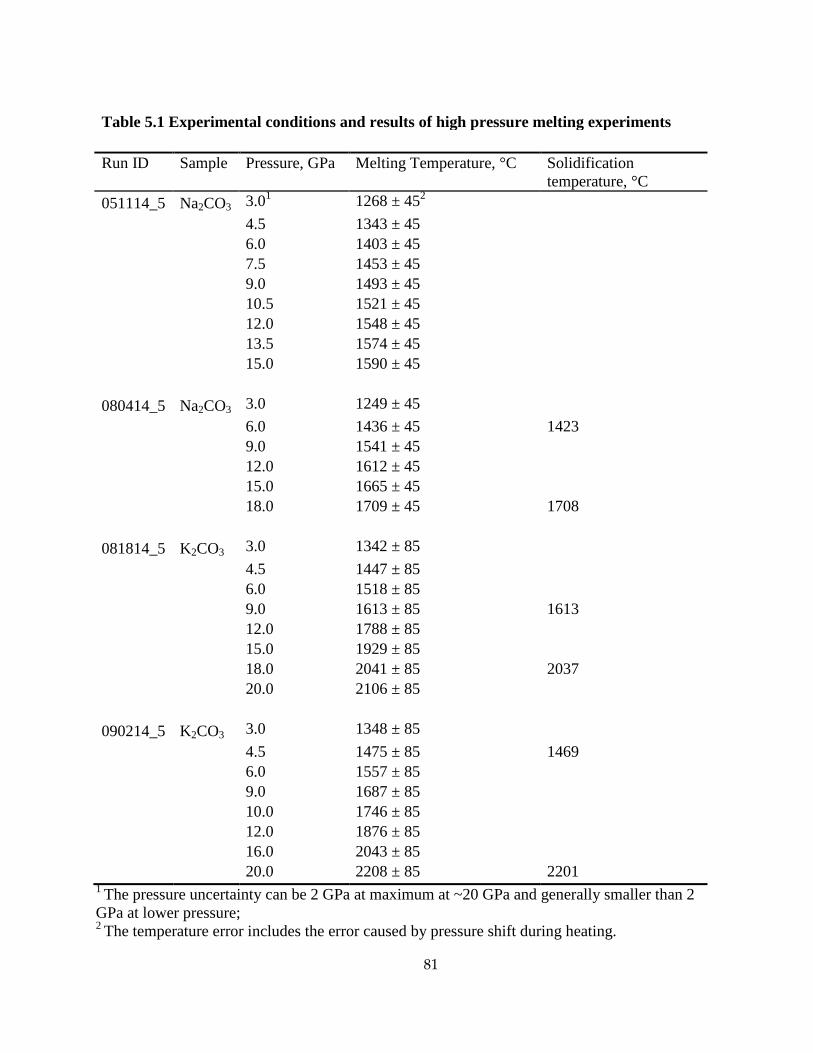
81
Table 5.1 Experimental conditions and results of high pressure melting experiments
Run ID Sample Pressure, GPa Melting Temperature, °C Solidification
temperature, °C
051114_5 Na2CO3 3.01 1268 ± 45
2
4.5 1343 ± 45
6.0 1403 ± 45
7.5 1453 ± 45
9.0 1493 ± 45
10.5 1521 ± 45
12.0 1548 ± 45
13.5 1574 ± 45
15.0 1590 ± 45
080414_5 Na2CO3 3.0 1249 ± 45
6.0 1436 ± 45 1423
9.0 1541 ± 45
12.0 1612 ± 45
15.0 1665 ± 45
18.0 1709 ± 45 1708
081814_5 K2CO3 3.0 1342 ± 85
4.5 1447 ± 85
6.0 1518 ± 85
9.0 1613 ± 85 1613
12.0 1788 ± 85
15.0 1929 ± 85
18.0 2041 ± 85 2037
20.0 2106 ± 85
090214_5 K2CO3 3.0 1348 ± 85
4.5 1475 ± 85 1469
6.0 1557 ± 85
9.0 1687 ± 85
10.0 1746 ± 85
12.0 1876 ± 85
16.0 2043 ± 85
20.0 2208 ± 85 2201 1
The pressure uncertainty can be 2 GPa at maximum at ~20 GPa and generally smaller than 2
GPa at lower pressure; 2
The temperature error includes the error caused by pressure shift during heating.
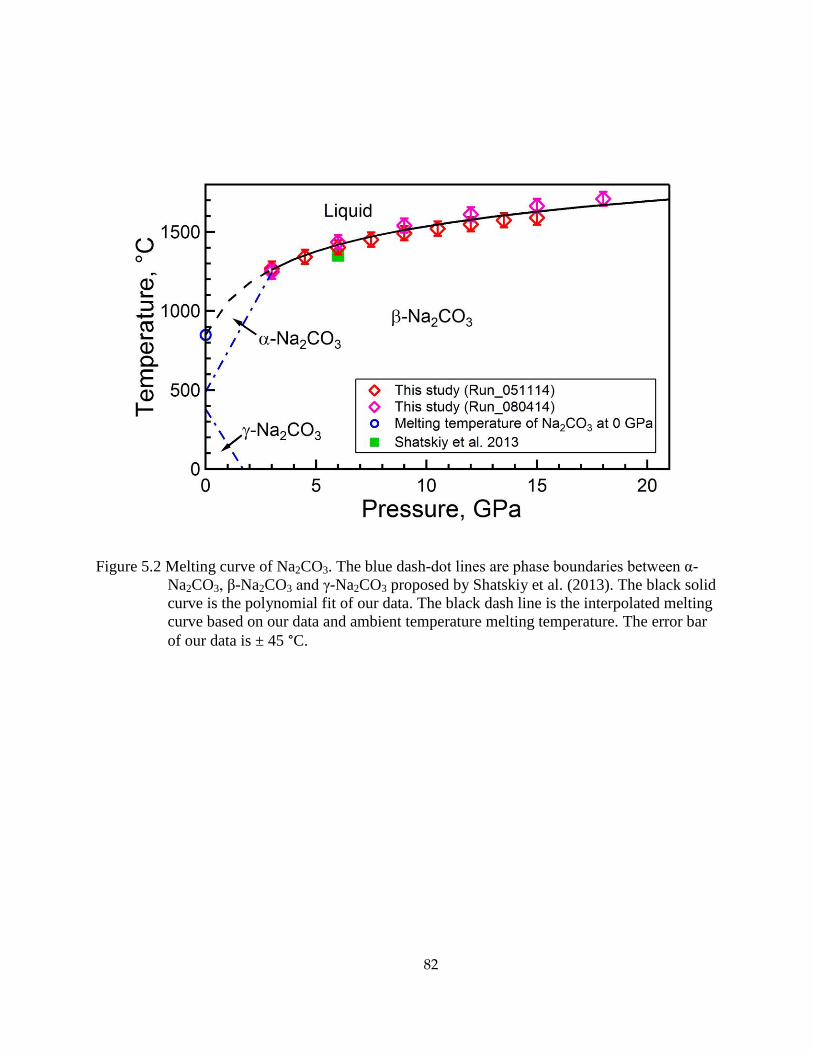
82
Figure 5.2 Melting curve of Na2CO3. The blue dash-dot lines are phase boundaries between α-
Na2CO3, β-Na2CO3 and γ-Na2CO3 proposed by Shatskiy et al. (2013). The black solid
curve is the polynomial fit of our data. The black dash line is the interpolated melting
curve based on our data and ambient temperature melting temperature. The error bar
of our data is ± 45 °C.

83
5.3.2 Melting curve of K2CO3
The melting temperatures of K2CO3 were determined between 3 and 18 GPa (Table 5.1).
Also similar with phenomena (Fig. 4.2) happened with melting of CaCO3 and Na2CO3, melting
led a sharp rise in the measured current, we took the starting point of the steepest segment of the
current-temperature curve as the melting point. As the heating cycle was repeated multiple times
in the same experiment, melting was detected within ± 5 K. The measured melting temperatures
from duplicate experiments at the same condition agree within ± 45 K. The melting curve of
K2CO3 is much steeper than NaCl, so the error resulted from the pressure shift upon heating
should be larger that of NaCl experiments described in Chapter III, so a maximum 2 GPa
pressure shift (Fei et al. 2004a, 2004b; Leinenweber et al. 2012) cause a temperature shift up to
75 K. The combined uncertainties in the measured melting temperature, including the precision
of the type C thermocouple, the reproducibility within a single experiment and among duplicate
experiments, and the pressure drift at high temperature, are estimated at ± 85 K, assuming that
the sources of uncertainties are random and independent.
The melting temperature of K2CO3 is similar to that of Na2CO3 below 9 GPa. However,
above 9 GPa, the slope of the melting curve of K2CO3 becomes rather steep, which is most likely
caused by a high pressure phase transition of K2CO3 at 9 GPa. Based on Clapeyron equation, a
prominent volume reduction of solid K2CO3 is associated with the phase transition (Walker et al.
1988). Around 15 GPa, the melting temperature of K2CO3 has exceeded that of MgCO3. This
high melting temperature of K2CO3 above 15 GPa indicates a fast increase of eutectic
temperature of K2CO3 with MgCO3 and CaCO3 above 9 GPa. Shatskiy et al. (2013a, 2013b)
found almost identical binary phase diagrams for Na2CO3+MgCO3 and K2CO3+MgCO3, which
is not surprise at 6.5 GPa, because K2CO3 and Na2CO3 have similar geochemical behavior and

84
melting temperature. But above 9 GPa, the melting temperature of K2CO3 increases much faster
than Na2CO3, so the eutectic melting behavior of K2CO3 should be differentiated from that of
Na2CO3. It would be expected above 9 GPa, sodium would be more strongly partitioned into the
melt than potassium. Actually, Litasov et al. (2013) found that solidus and stability field of
potassium bearing carbonates become much higher in temperature than sodium bearing
carbonates above 15 GPa. Along with a single melting temperature measurement of Shatskiy
(2013b) at 6.5 GPa, our results were ~180 °C higher than results of Liu et al. (2007) at 3 GPa,
and the melting curve of Liu’s seems already flattened at 3 GPa. This discrepancy is most likely
caused by a phase transition around 3 GPa, as we have demonstrated later. The phase transition
increases the slope of the melting curve above 3 GPa. Liu et al. may just measure the melting
temperature before the phase transition, and we with Shatskiy et al. (2013b) measured the
melting temperature after the phase transition.

85
Figure 5.3 Melting curve of K2CO3. The black curves are piece-wise polynomial fits of our data
at 3-9 GPa and 9-20 GPa. The error bar of our data is ± 85 °C.
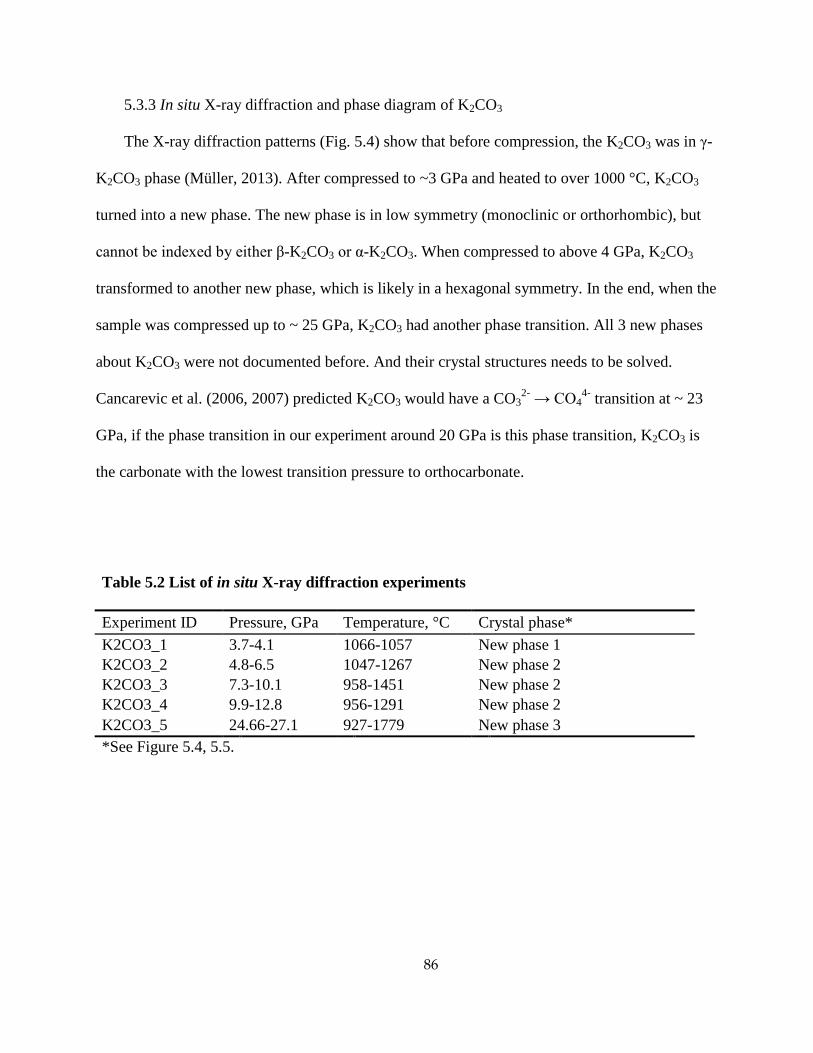
86
5.3.3 In situ X-ray diffraction and phase diagram of K2CO3
The X-ray diffraction patterns (Fig. 5.4) show that before compression, the K2CO3 was in γ-
K2CO3 phase (Müller, 2013). After compressed to ~3 GPa and heated to over 1000 °C, K2CO3
turned into a new phase. The new phase is in low symmetry (monoclinic or orthorhombic), but
cannot be indexed by either β-K2CO3 or α-K2CO3. When compressed to above 4 GPa, K2CO3
transformed to another new phase, which is likely in a hexagonal symmetry. In the end, when the
sample was compressed up to ~ 25 GPa, K2CO3 had another phase transition. All 3 new phases
about K2CO3 were not documented before. And their crystal structures needs to be solved.
Cancarevic et al. (2006, 2007) predicted K2CO3 would have a CO32-
→ CO44-
transition at ~ 23
GPa, if the phase transition in our experiment around 20 GPa is this phase transition, K2CO3 is
the carbonate with the lowest transition pressure to orthocarbonate.
Table 5.2 List of in situ X-ray diffraction experiments
Experiment ID Pressure, GPa Temperature, °C Crystal phase*
K2CO3_1 3.7-4.1 1066-1057 New phase 1
K2CO3_2 4.8-6.5 1047-1267 New phase 2
K2CO3_3 7.3-10.1 958-1451 New phase 2
K2CO3_4 9.9-12.8 956-1291 New phase 2
K2CO3_5 24.66-27.1 927-1779 New phase 3
*See Figure 5.4, 5.5.

87
Figure 5.4 X-ray diffraction patterns of K2CO3 at different temperature and pressure conditions.
The temperature and pressure of every pattern are indicated in the figure. The pattern
at the bottom has been identified as that of γ-K2CO3. And the other 3 pattern are the 3
new high pressure K2CO3 phases. (Pt-Platinum; γ-γ K2CO3; N1-new phase 1; N2-new
phase 2; N3-new phase 3)

88
Figure 5.5 Phase diagram based on in situ X-ray diffraction experiments. All solid symbols
represent the pressure and temperature conditions of an X-ray diffraction
measurement, and the different shapes of the solid symbols denote different high
pressure phases of K2CO3 identified from X-ray diffraction patterns. All open
symbols are temperature measurements (Liu et al. 2007; Klement and Cohen, 1975).
The dashed lines are the proposed phase boundaries of K2CO3.

89
5.4 Implications
Compared with melting curves of other carbonates (Fig. 5.6), the melting curves of Na2CO3
and K2CO3 are lower than those of MgCO3 and CaCO3, similar to that of FeCO3. This is
consistent with the experimental results (Ghosh et al., 2009) that adding K2CO3 and Na2CO3
lowers the solidus of carbonated peridotite and produces alkaline-rich melt in low degree partial
melting. However, the melting temperature of K2CO3 exceeds that of MgCO3 above 15 GPa,
which indicates K2CO3 would not partition into melt so easy in the depth of the transition zone.
Even there seem no stable silicate minerals to host potassium in the transition zone, with such a
high melting temperature potassium maybe exist as carbonate form in the transition zone. If
some K2CO3 can survive the decarbonation during subduction, these K2CO3 would become more
and more stable with increasing pressure. Reversely, if some K2CO3 in the transition zone rises
with upwelling mantle, their eutectic melting temperature may decrease rapidly with decreasing
pressure, which will lead to a speeded melt above a certain depth. Experiments to measure
eutectic melting temperatures of potassium bearing carbonated mantle rock above 15 GPa can
test this scenario.

90
Figure 5.6 Comparison of melting curves of MgCO3 (Irving and Wyllie 1975; Katsura and Ito,
1990), CaCO3 (Chapter IV), FeCO3 (Tao et al. 2013), Na2CO3 and K2CO3. The
Black curve is the solidus of dry peridotite (Herzberg et al., 2000).

91
References
Cancarevic, Z.P., Schon, J.C., and Jansen, M. (2006) Alkali metal carbonates at high pressure.
Zeitschrift für anorganische und allgemeine Chemie. 632, 1437–1448.
Cancarevic, Z.P., Schon, J.C. and Jansen, M. (2007) Possible existence of alkali metal
orthocarbonates at high pressure. Chemistry – A European Journal, 13, 7330–7348.
Dasgupta, R., and Hirschmann, M.M. (2006) Melting in the Earth’s deep upper mantle caused by
carbon dioxide: Nature, 440, 659–662.
Errandonea, D., Somayazulu, M., and Häusermann, D., and Mao, H.K. (2003) Melting of
tantalum at high pressure determined by angle dispersive X-ray diffraction in adouble-
sided laser-heated diamond-anvil cell. Journal of Physics: Condensed Matter, 15, 7635-
7649.
Fei, Y., Li, J., Hirose, K., Minarik, W., Van Orman, J., Sanloup, C., Van Westrenen, W.,
Komabayashi, T., and Funakoshi, K. (2004a) A critical evaluation of pressure scales at
high temperatures by in situ X-ray diffraction measurements. Physics of the Earth and
Planetary Interiors, Vol. 143-144, 515-526.
Fei, Y., Van Orman. J., Li, J., Van Westrenen, W., Sanloup, C., Minarik, W., Hirose, K.,
Komabayashi, T., Walter, M., and Funakoshi, K. (2004b) Experimentally determined
postspinel transformation boundary in Mg2SiO4 using MgO as an internal pressure
standard and its geophysical implications. Journal of Geophysical Research: Solid Earth,
109(B2), B2305.
Fei, Y., Ricolleau, A., Frank, M., Mibe, K., Shen, G., and Prakapenka, V. (2006) Toward an
internally consistent pressure scale, Proceedings of the National Academy of Sciences of
the United States of America, 104, 9182-9186,
Green, D.H., and Wallace, M.E. (1988) Mantle metasomatism by ephemeral carbonatite melts.
Nature, 336, 459–462.
Ghosh, S., Ohtani, E., Litasov, K.D., Terasaki, H. (2009) Solidus of carbonated peridotite form
10 to 20 GPa and origin of magnesiocarbonatite melt in the Earth’s deep mantle.
Chemical Geology, 262, 17-28.
Hammersley, A.P., Svensson, S.O., Hanfland, M., Fitch, A.N., and Hausermann, D. (1996) Two-
dimensional detector software: from real detector to idealized image or two-theta scan.
High Pressure Research, 14, 235.
Irving, A. J., and P. J. Wyllie (1975), Subsolidus and melting relationships for calcite, magnesite
and join CaCO3-MgCO3 to 36 kb, Geochim. Cosmochim. Acta, 39(1), 35-53.

92
Jones, A.P., Genge, M., and Carmody, L. (2013) Carbonate melts and carbonatites. Reviews in
Mineralogy & Geochemistry, 75, 289-322.
Katsura, T., and Ito, E. (1990) Melting and subsolidus phase relations in the MgSiO3-MgCO3
system at high pressures – Implications to evolution of the Earth’s atmosphere. Earth and
Planetary Science Letters, 99, 110-117.
Klement, W., and Cohen, L.H. (1975) Solid–solid and solid–liquid transitions in K2CO3, Na2CO3
and Li2CO3—investigations to greater than – 5 kbar by differential thermal analysis—
thermodynamics and structural correlations. Ber Bunsenges 79, 327–334.
Leinenweber, K.D., Tyburczy, J.A., Sharp, T.G., Soignard, E., Diedrich, T., Petuskey, W.B.,
Wang, Y., and Mosenfelder, J.L. (2012) Cell assemblies for reproducible multi-anvil
experiments (the COMPRES assemblies). American Mineralogist, 97, 353-368.
Liu, Q., Tenner, T.J., and Lange, R. (2007) Do carbonate liquids become denser than silicate
liquids at pressure? Constraints from fusion curve of K2CO3 to 3.2 GPa. Contributions to
Mineralogy and Petrology, 153, 55-66.
Litasov, K.D., and Ohtani, E. (2009) Solidus and phase relations of carbonated peridotite in the
system CaO-Al2O3-MgO-SiO2-Na2O-CO2 to the lower mantle depths: Physics of the
Earth and Planetary Interiors, 177, 46–58,
Müller, U. (2013) Symmetry relationships between crystal structures: applications of
crystallographic group theory in crystal chemistry. Cambridge University Press, 160pp.
Schrauder, M., and Navon, O. (1994) Hydrous and carbonatitic mantle fluids in fibrous
diamonds from Jwaneng, Botswana. Geochimica et Cosmochimica Acta, 58, 761–771.
Shatskiy, A., Gavryushkin, P.N., Sharygin, I.S., Litasov, K.D., Kupriyanov, I.N., Higo, Y.,
Borzdov, Y.M., Funakoshi, K., Palyanov, Y.N., Ohtani, E. (2013a) Melting and
subsolidus phase relations in the system Na2CO3–MgCO3±H2O at 6 GPa and the stability
of Na2Mg(CO3)2 in the upper mantle. American Mineralogist, 98, 2172–2182.
Shatskiy, A., Sharygin, I.S., Gavryushkin, P.N., Litasov, K.D., Borzdov, Y.M., Shcherbakova,
A.V., Higo, Y., Funakoshi, K., Palyanov, Y.N., and Ohtani, E. (2013b) The system
K2CO3–MgCO3 at 6 GPa and 900–1450 °C. American Mineralogist, 98, 1593–1603.
Tao, R., Fei, Y., and Zhang, L. (2013) Experimental determination of siderite stability at high
pressure. American Mineralogist, 98, 1565-1572.
Walker, D., Agee, C.B. and Zhang, Y. (1988) Fusion curve slope and crystal/liquid buoyancy.
Journal of Geophysical Research, 93, 312-323.

93
Chapter VI
Phase relations of dense hydrous germanates (DHMG)
6.1 Introduction
Dense hydrous magnesium silicates (DHMS) are a group of minerals that contain chemical
bound water and can be stable in mantle pressure temperature conditions. They include a series
of minerals with alphabet names, such as phase A, phase B (Ringwood and Major, 1967), phase
superhydrous B (Gasparik, 1990), phase D (Liu, 1986), phase E (Kudoh et al. 1993), phase H
(Nishi et al. 2014) and δ phase (Suzuki et al. 2000) and etc. These DHMS can carry water in
their crystal structures and survive the dehydration associated with subduction. They can take
water all the way to the lower mantle (Ohtani et al. 2014). The nominally anhydrous minerals,
wadsleyite and ringwoodite, were found to able to contain up to a few weight percent H2O in
their structures (Smyth, 1987; Kohlstedt et al. 1996). The role of DHMS in mantle hydrogen
cycle was studied through their phase equilibrium (e.g. Irifune et al. 1998; Ohtani et al. 2000;
Shieh et al. 2000; Angel et al. 2001), crystal structures (e.g. Yang et al. 1997; Bindi et al., 2014)
and physical properties (e.g. Sanchez-Valle et al. 2008; Mao et al. 2012). However, studies about
rheology, calorimetry and neutron diffraction of DHMS are limited by current technology in
which these experiments require large sample volume (Dupas-Bruzek et al., 1998; Rubie and
Ross II, 1994; Klotz, 2013). Syntheses of most DHMS require more than 10 GPa pressure, which
inevitably limits the sample volume to a few mm3. The recently discovered phase H (Nishi et al.

94
2014) requires up to 40 GPa to synthesize, so the studies of this phase are limited in only a few
labs.
One way to circumvent this limited volume problem is to use germanium instead of silicon.
Germanates are widely used as analogues of silicates in studies of high pressure mineral phases
because germanium has similar chemical characteristics with silicon, but its larger ionic radius
makes germanates the lower pressure analogues of their silicate equivalents. Dachille and Roy
(1959) used Mg2GeO4 to study the olivine → spinel transition. More recently Hirose et al. (2005)
used MgGeO3 to study perovskite → post-perovksite transition. In these cases germanate
analogues can be synthesized under considerable lower pressure and in large volume, and their
properties can be adequately projected to those equivalent silicates.
Hydrous germanantes have been used to imitate DHMS. Blanchard et al. (2005a, 2005b)
modeled OH defects in germanium ringwoodite and suggested using germanium analogues to
study the protonation of nominally anhydrous minerals. Thomas et al. (2008) synthesized
germanium analogues of anhydrous B and superhydrous B to study the protonation of dense
hydrous magnesium silicates (DHMS). To date only germanium anhydrous B (e.g., Von Dreele
et al. 1970), germanium ringwoodite containing 5 to 10 ppm water by weight (Hertweck and
Ingrin, 2005) and germanium superhydrous B (Thomas et al. 2008) have been synthesized and
phase relations among germanium analogues of DHMS are not clear. The lack of knowledge
limits the applications of germanium analogues of DHMS. So it is necessary to study the phase
relations of germanium analogues of DHMS over a large pressure and temperature domain. The
knowledge about germanium analogues of DHMS will contribute fundamental knowledge to
future studies using the germanium analogues of DHMS, and will provide insight into the effect

95
of Ge-Si substitution of structural transformations in an important group of silicate phases in the
Earth's mantle.
In this chapter, results from in situ X-ray diffraction experiments with hydrothermal
diamond anvil cells on hydrous germanates are reported. The phase diagram of Mg2GeO4+H2O
is proposed based on X-ray diffraction results.
6.2 Method
Angular dispersive X-ray diffraction experiments on Mg2GeO4+H2O under high pressure
with resistively heated hydrothermal diamond anvil cell (with cutlet size of 300 µm) were
conducted at Beamlines 16-ID-B and 16-BM-D of HPCAT, the Advanced Photon Source at the
Argonne National Lab (Table 6.2). X-ray was monochromatized to a wavelength of 0.4066 µm
(16-ID-B) or 0.4246 µm (16-BM-D) and focused to an area of 5 µm by 10 µm. Diffraction
images were recorded over 0.1s with a Pilatus-1M pixel array detector or 1-10s with a MarCCD
and were integrated and corrected for distortions using the FIT2D software (Hammersley et al.
1996).
The sample Mg2GeO4 was synthesized by multi-anvil apparatus at 6 and 9 GPa, 800 °C
(Table 6.1, Fig. 6.3) with a starting material of GeO2 + Mg(OH)2. The Mg2GeO4from high
pressure syntheses were 200-500 µm euhedral crystals and their compositions were checked by
electron microprobe at the EMAL of the University of Michigan. Mg2GeO4 was loaded into
rhenium gaskets with a pressure chamber of 180 µm in diameter and 40-50 µm thick. Excess
amount of water and a small amount of gold power were loaded as well.
Hydrothermal diamond anvil cells used in this study were round Bassett-type (Bassett et al.
1993). Samples were resistively heated by two heaters attached onto the diamonds. Temperatures

96
were determined by two type-K thermocouples attached to two diamonds. The pressure was
determined by the diffraction lines of gold powder in the sample chamber based on Fei et al.’s
EOS (2007). The pressure error was ±1 GPa based on the standard deviation of the lattice
parameter.
In a typical experiment, the sample was compressed to a target pressure and then
temperature was raised at a rate of 10-20 °C/min. On route of heating, X-ray diffractions were
taken every 50-100 °C.
6.3 Results and disscusions
From the X-ray diffraction patterns (Fig. 6.1, Fig. 6.2), reactions and phase transitions of
Mg2GeO4+H2O system were found. The phase diagram about the stability region of DHMG
minerals is presented in Fig. 6.3.
Before heating, X-ray diffraction pattern indicated Mg2GeO4 sample was in ringwoodite
(spinel) structure (Dachille and Roy, 1959). Upon heating to 300 – 400 °C, the first reaction
happened: the diffraction peaks of germanium ringwoodite disappeared and new diffraction
peaks emerged (Fig. 6.1, Fig. 6.2). The new diffraction peaks included two doublets at ~ 5.8 and
6.7 ° two-theta angles, which were similar with the X-ray diffraction pattern of germanium
superhydrous B at ambient condition(Thomas et al. 2008), but this new phase was not persevered
after heating to higher temperature, further composition analysis of this phase cannot be done.
The boundary between ringwoodite and the possible germanium superhydrous B almost overlaps
with the phase boundary between ice VII and H2O fluid (Fig. 6.3). This is possibly because H2O
fluid is much easier than ice VII to react with germanium ringwoodite to form hydrous phases.
Heated to 500 – 600 °C, the sample experienced two different phase transitions depending
on pressure. When the pressure was below 8 GPa, the sample had an phase transition and turned

97
into germanium phase D (Fig. 6.1). It was the first time that germanium phase D was discovered.
X-ray diffraction peak indexing by Jade® 5.0 suggested that germanium phase D had the same
space group P-31m with silicate phase D (Yang et al. 1993), and its lattice parameter was
a=4.818 , c=4.164 (Å). A crystal structure refinement on germanium phase D needs to be done to
get its accurate atom coordinates. When the pressure was above 8 GPa, at 500 – 600 °C, the
possible germanium superhydrous B had another phase transition and became another new phase
(Fig. 6.2). This new phase had similar diffraction peaks with the newly discovered silicate phase
H (Nishi et al. 2014), but cannot be indexed by similar lattice parameters of silicate phase H.
This is probably because the possible germanium phase H has a distorted structure of silicate
phase D.
Table 6.1 List of high pressure synthesis experiments
Experiment
ID
Starting materials Pressure
, GPa
Temperature
, °C
Heating
duration,
hour
Products
091911_8 Mg(OH)2+GeO2 6.0 800 24 MgGeO3(illmenite),
GeO2(rutile), H2O
102611_8 2Mg(OH)2+GeO2
+3H2O
6.0 800 24 Mg2GeO4(ringwoodite)
, MgGeO3(illmenite),
Mg(OH)2(brucite), H2O
041412_8 2Mg(OH)2+GeO2 9.0 800 24 Mg2GeO4(ringwoodite)
, MgGeO3(illmenite),
Mg(OH)2(brucite), H2O
052512_8 2Mg(OH)2+GeO2
+ excess H2O
9.0 600 24 MgGeO4H2(phase H?),
Mg(OH)2(brucite), H2O

98
Table 6.2 Conditions and results of high pressure phase equilibrium experiments
on dense hydrous germanates
Experiment
ID
Starting materials Pressure,
GPa
Temperature, °C Final equilibrium
phases
MgGeOH_P1 Mg2GeO4+H2O 0-3.8 25-600 phase D +
brucite
MgGeOH_S1 Mg2GeO4+H2O 4.0-7.4 25-600 phase D +
brucite
MgGeOH_S2 Mg2GeO4+H2O 2.1-18.5 25-500 Ringwoodite +
H2O
MgGeOH_S3 Mg2GeO4+H2O 8.9-10.7 25-600 phase H(?)
+brucite
MgGeOH_S4 Mg2GeO4+H2O 9.3-14.6 30-570 phase H(?)
+brucite
MgGeOH_S5 Mg2GeO4+H2O 5.0-10.5 30-623 phase H(?)
+brucite
MgGeOH_S6 Mg2GeO4+H2O 2.7-8.9 23-615 phase D +
brucite
MgGeOH_S7 Mg2GeO4+H2O 0.78-8.9 25-611 superhydrous
B(?)
MgGeOH_S8 Mg2GeO4+H2O 11.1-36.0 30-592 ringwoodite +
H2O

99
Figure 6.1 X-ray diffraction patterns of Mg2GeO4+H2O system below 8 GPa. ( Br-brucite, Rw-
germanium ringwoodite, PhD-germanium phase D, Au-gold, IceVII-ice VII, SuB-
germanium superhydrous B)

100
Figure 6.2 X-ray diffraction patterns of Mg2GeO4+H2O system above 8 GPa. (Br-brucite, Rw-
germanium ringwoodite, PhH-germanium phase H, Au-gold, SuB-germanium
superhydrous B)
101
All the experiments stopped around 600 °C because softening of the rhenium gaskets at
this temperature caused pressure drops. The samples were quenched by turning off the power.
Both germanium phase D and possible germanium phase H can be quenched to ambient pressure
and temperature. The multi-anvil syntheses by us and Thomas et al. (2008) had starting materials
with similar bulk compositions, but at temperatures ≥ 800 °C (Fig. 6.3) the products of these
syntheses were Mg2GeO4 ringwoodite and liquid water. However, a multi-anvil synthesis by us
at 9 GPa and 600 °C produced the possible germanium phase H. This indicates germanium phase
D and possible phase H are only stable below 800 °C. Above 800 °C, they will lose water and
turn to Mg2GeO4 ringwoodite.
The germanium phase D and possible phase H has the same phase transition sequence as
silicate phase D and phase H (Ohtani et al. 2014), but at much lower pressure (Fig. 6.4).
Germanium phase D only requires at most 6 GPa to be synthesized, comparing with at least 20
GPa of silicate phase D. With only 6 GPa, germanium phase D can synthesized in 0.1 -1 gram
quantity, which opens a lot of experimental possibilities, such as neutron diffraction, accurate
composition analysis, calorimetry, etc.

102
Figure 6.3 Phase diagram of Mg2GeO4+H2O under high pressure and temperature. The cross
denotes multi-anvil synthesis of Thomas et al. (2012); the stars denote multi-anvil
syntheses of this study; the green dashed line is the phase boundary between ice VII
and fluid (Fei et al. 1993).

103
Figure 6.4 Comparison of stability ranges of dense hydrous magnesium germanates (DHMG)
and dense hydrous magnesium silicates (DHMS). Red dotted lines draw stability
boundary for DHMS (Ohtani et al. 2014); blue solid lines draw for DHMG. (Rw-
ringwoodite; SuB-superhydrous B; phD-phase D; PhH-phase H; Pv-perovskite)

104
References
Angel, R.J., Forst, D.J., Ross, N.L., and Hemley, R.J. (2001) Stabilities and equations of state of
dense hydrous magnesium silicates. Physics of the Earth and Planet Interiors,127, 181-
196.
Bassett, W.A., Shen, A.H., Bucknum, M., and Chou, I. (1993) A new diamond anvil cell for
hydrothermal studies to 2.5 GPa and from -190 to 1200 °C. Review of Scientific Instruments, 64, 2340-2345.
Bindi, L., Nishi, M., Tsuchiya, J., and Irifune, T. (2014) Crystal chemistry of dense hydrous
magnesium silicates: The structures of phase H, MgSiH2O4, synthesized at 45 GPa and
1000 °C. American Mineralogist, 99, 1802-1805.
Blanchard, M., Wright, K., and Gale, J.D. (2005a), Atomistic simulation of Mg2SiO4 and
Mg2GeO4 spinels: A new model. Physics and Chemistry of Minerals, 32, 332–338.
——— (2005b), A computer simulation study of OH defects in Mg2SiO4 and Mg2GeO4 spinels.
Physics and Chemistry of Minerals, 32, 585–593.
Dachille, D., and Roy, R. (1959) The spinel–olivine inversion in Mg2GeO4, Nature,183, 1257.
Dupas-Bruzek, C., Tingle, T.N., Green II, H.W., Doukhan, N., and Doukhan, J.-C. (1998), The
Rheology of Chem Minerals, 25, 501-514.
Fei, Y., Mao, H.K., and Hemley, R.J., 1993. Thermal expansivity, bulk modulus, and melting
curve of H2O-Ice VII to 20 GPa. Journal of Chemical Physics 99, 5369–5373.
Fei, Y., Ricolleau, A., Frank, M., Mibe, K., Shen, G., and Prakapenka, V. (2006) Toward an
internally consistent pressure scale, Proceedings of the National Academy of Sciences of
the United States of America, 104, 9182-9186,
Hammersley, A.P., Svensson, S.O., Hanfland, M., Fitch, A.N., and Hausermann, D. (1996) Two-
dimensional detector software: from real detector to idealized image or two-theta scan.
High Pressure Research, 14, 235.
Hertweck, B. and Ingrin, J. (2005) Hydrogen incorporationin a ringwoodite analogue: Mg2GeO4
spinel. Mineralogical Magazine, 69, 337–343.
Herzberg, C., Raterron, P., Zhang, J., 2000. New experimental observations on the anhydrous
solidus for peridotite KLB-1. Geochemistry Geophysics Geosystem, 1, 11.
doi:10.1029/2000GC000089.
Hirose, K., Kawamura, K., Ohishi, Y.,Tateno, S., and Sata, N. (2005) Stability and equation of
state of MgGeO3 post-perovskite phase, American Mineralogist, 90, 262-265.
105
Gasparik, T. (1990) Phase relations in the transition zone. Journal of Geophysical Research, 95,
1575 l-15769.
Irifune, T., Kubo, N., Isshiki, M., and Yamasaki, Y. (1998) Phase transformations in serpentine
and transportation of water into the lower mantle. Geophysical Research Letters, 25, 203-
206.
Klotz, F. (2013) Techniques in High Pressure Neutron Scattering. CRC Press, 60pp.
Kohlstedt, D. L., Keppler, H. & Rubie, D. C. (1996) Solubility of water in the α, β and γ phases
of (Mg,Fe)2SiO4. Contributions to Mineralogy Petrology, 123, 345–357.
Kudoh, Y., Finger, L.W., Hazen, R.M., Prewitt, C.T., Kanzaki, M., and Veblen, D.R. (1993)
Phase E: a high pressure hydrous silicate with unique crystal chemistry. Physics and
Chemistry of Minerals, 19, 357- 360.
Liu, L. (1986) Phase transformations in serpentine at high pressures and temperatures and
implications for subducting lithosphere. Physics of the Earth and Planetary Interiors, 42,
255-262.
Mao, Z., Lin, L., Jacobsen, S.D., Duffy, T.S., Chang, Y., Smyth, J.R., Forst, D.J., Hauri, E.H.,
Prakapenka, V.B. (2012) Sound velocities of hydrous ringwoodite to 16 GPa and 673 K.
Earth and Planetary Science Letters, 331-332, 112-119.
Nishi, M., Irifune, T., Tsuchiya, J. Tange, Y., Nishihara, Y. Fujino, K., and Higo, Y.
(2014) Stability of hydrous silicate at high pressures and water transport to the deep
lower mantle, Nature Geoscience, 7, 224-227.
Ohtani, E., Mizobata, H., and Yurimoto, H. (2000) Stability of dense hydrous magnesium silicate
phases in the systems Mg2SiO4-H2O at pressures up to 27 GPa, 27, 533-544.
Ohtani, E., Amaike, Y., Kamada, S., Sakamaki, T., and Hirao, N. (2014) Stability of hydrous
phase H MgSiO4H2 under lower mantle conditions. Geophysical Research Letters, 41,
8283-8287.
Ringwood, A.E., and Major, A. (1967) High-pressure reconnaissance investigations in the
system Mg2SiO4-MgO-H2O Earth Planetary Science Letters, 2, 130-133.
Rubie, D.C., and Ross II, C.R. (1994) Kinetics of the olivine-spinel transformationin subducting
lithosphere: experimental constraintsand implications for deep slab processes, Physics of
the Earth and Planetary Interiors, 86, 223-241.
Sanchez-Valle, C., Sinogeikin, S.V., Smyth, J.R., and Bass, J.D. (2008) Sound velocities and
elasticity of DHMS phase A to high pressure and implications for seismic velocities and
anisotropy in subducted slabs. Physics of the Earth and Planetary Interiors, 170, 229-239.

106
Shieh, S.R., Mao, H., Hemley, R.J. and Ming, L. (2000) In situ X-ray diffraction studies of dense
hydrous magnesium silicates at mantle conditions. Earth Planetary Science Letters, 177,
69-80.
Suzuki, A., Ohtani, E., and Kamada., T. (2000) A new hydrous phase δ-AlOOH synthesized at
21 GPa and 1000 °C. Physics and Chemistry of Minerals, 10, 689-693.
Smyth, J.R. (1987) Beta-Mg2SiO4 – a potential host for water in the mantle. American
Mineralogist, 72, 1051-1055.
Thomas, S., Koch-Müller, M., Kahlenberg, V., Thomas, R., Ehede, D., Wirth, R., and Wunder,
B. (2008) Protonation in germanium equivalents of ringwoodite, anhydrous phase B , and
superhydrous phase B. American Mineralogist, 93, 1282-1294.
Von Dreele, R.B., Bless, P.W., Kostiner, E., and Hughes, R.E. (1970), The crystal structure of
magnesium germanate: A reformulation of Mg4GeO6 as Mg28Ge10O48. Journal of Solid
State Chemistry, 2, 612–618.
Yang, H., Prewitt, C.T., and Frost D.J. (1997) Crystal structure of the dense hydrous magnesium
silicate, phase D. American Mineralogist, 82, 651-6

107
Chapter VII
Conclusions and Future Directions
In the past two decades, advances from ocean drillings and high pressure experiments have
revealed the exchange path way and flux between surface carbon and deep carbon. The
developments of high pressure techniques and spectroscopy have led to discoveries of numerous
high pressure mineral phases that are potentially carbon carriers in the Earth’s mantle and core
(Oganov et al. 2013). This dissertation focuses on the problems related to carbonate melting in
the upper mantle. It addresses the issues of how to accurately measure melting temperature at
high pressure and how the unique melting behaviors of pure end member carbonates influence
the overall carbonate melting and carbon storage in the upper mantle. Below I summarize how
my findings impact broad issues of mantle geochemical and geophysical studies and point out
directions for future work on nature and dynamics of deep carbon.
7.1 Measure melting temperature at high pressure
The new experimental technique described in Chapter II and III provides an
unprecedentedly accurate and efficient way to measure melting temperature in the pressure range
of the upper mantle. In addition the technique used simple instruments, an AC power source and
an ammeter which every laboratory can afford to have. This capacitive current based
measurement can be combined with other high pressure technique, such as piston cylinder and
diamond anvil cell, to further extend its working pressure range and increase its accuracy. With

108
this technique, the melting curve of a mineral can be measured over a large pressure range easily,
and much information can be deduced from the melting curve. As described in Chapter IV and
V, solid phase transitions can be identified from abnormal changes of melting curve slope, which
supplements the conventional way to determine solid phase boundary by in situ X-ray
diffraction, especially when X-ray diffraction patterns of crystals become weak at a temperature
close to melting. The slope of the melting curve can also be used to estimate or calculate the
density of melt under high pressure, which is difficult to measure directly. Based on Clapeyron
equation, the density difference between solid and melt along melting curve is equal to the
entropy change of melting multiplied by the melting curve slope. With an accurate density of the
solid from X-ray diffraction experiments, a relatively accurate melt density can be calculated.
The melt density upon high pressure is valuable information for building and testing theories of
melt structure (Wang et al. 2014) and thermodynamic modeling of deep magma generation
(Ghiorso et al. 2002).
The capacitive current based measurement can be further developed to extend the
compositional and pressure range of its application. In this dissertation, all studied subjects were
single pure carbonates. However, in principle this technique should also work on silicates, which
are ionic crystals as well. Due to relative high viscosities of some acid silicates, the capacitive
current through these silicate melts is expected to be lower than that of carbonate melts and the
hysteresis of melting temperatures upon melting and cooling is also expected to be larger than
that of carbonates. Similar experiments can be done on semiconductors such as iron carbides and
iron sulfides to test whether this technique also works on semiconductors. Another direction of
development is towards measuring the eutectic temperature of multiple component system and
liquidus/solidus temperatures of solid solution. For a real mantle melting system, melting always

109
happens as partial melting controlled by eutectic and/or liquidus/solidus temperatures. The
interactions between multiple components decide these eutectic and liquidus /solidus
temperatures. However, these interactions cannot be predicted well yet. Being able to measure
eutectic and liquidus/solidus temperatures provides a more direct way to study mantle melting
and is also crucial for studying those interactions affecting partial melting phenomena. In this
dissertation, the melting curves of CaCO3, Na2CO3 and K2CO3 have been precisely determined.
With other works on FeCO3 (Tao et al. 2013) and MgCO3 (Katsura and Ito, 1990), the melting
behaviors of major carbonates under the upper mantle pressure have been figured out. There
were also studies about melting of binary and ternary carbonate systems such as MgCO3-
CaCO3(Boub et al. 2006), Na2CO3-MgCO3 (Shatskiy et al. 2013a), K2CO3-MgCO3(Shatskiy et
al. 2013b) and etc., but these studies were limited at one pressure due to the requirement of
enormous non-in-situ experiments to cover large pressure range. Our in situ technique can
significantly reduce the number of experiments to study the eutectic and liquidus/solidus
temperatures over a large pressure range. However, there are still a few expected problems. For
example, the partial melting usually results in segregation of different components, which may
render the repeated experiments inaccurate, so a way to rehomogenize the sample may be needed
before repeated experiments on the same sample. Another problem may be how to distinguish
solidus and liquidus temperatures from the capacitive current curve.
7.2 Melting behaviors of carbonates
The new data on melting curves of CaCO3, K2CO3 and Na2CO3 described in Chapter V and
VII show their unique melting behaviors, which will prompt us to rethink the distributions of
110
different carbonate species in the mantle. CaCO3 shows a relatively low melting curve with small
variations over 5-20 GPa (Fig. 5.6), which suggests melting in the transition zone.
Low velocity zones and areas from geophysical observations (Ritsema et al. 2011) may be
caused by melting of carbonates, but cannot rule out other explanations such as dehydration
melting (Bercovici and Karato, 2003; Schmandt et al. 2014), segregated basalt, metastability,
underplating and interaction of the seismic waves with phase changes (Anderson, 2007). Another
way to study melting in the transition zone is through the electrical structure by magnetotelluric
measurements (e.g. Baba et al. 2006). Gaillard et al. (2008) has demonstrated the electrical
structure of asthenosphere is best explained by carbonate melt. The development of
magnetotelluric measurement is needed to probe deeper to the transition zone.
However, the melting curve of K2CO3 displays opposite behavior: its melting temperature
rises very fast above 9 GPa and even catches up with the solidus temperatures of volatile free
peridotite around 15 GPa (Fig. 5.6). The melting of carbonates and silicates are usually eutectic
melting (Katsura and Ito, 1990). Normally the solidus temperatures of carbonated silicate rocks
and partial melt composition are essentially controlled by melting phase relations in carbonates
because the melting temperature of carbonates are usually much lower than those of silicates,
resulting in a solidus temperature close to the melting temperature of carbonates and a eutectic
melt composition dominated by carbonates (Fig. 7.1). However, the melting curve of K2CO3
indicates melting of K2CO3 in the transition zone depth may shift from K2CO3 dominated partial
melting to silicate dominated, which suggests deep storage of K2CO3. The change of K2CO3
melting curve slope at 9 GPa may be caused by a phase transition as described in Chapter V.
Because first principle calculations predicted a carbon atom coordination number change from 3
to 4 happens at around 10-20 GPa for K2CO3 (Cancarevic et al. 2007). This phase transition at 9-

111
25 GPa may be associated with carbon atom coordination change. A recent study have
discovered the coordination number change in (Mg,Fe)CO3 at around 80 GPa (Boulard et al.
2015). If this phase transition of K2CO3 is indeed related to the carbon atom coordination number
change, the K2CO3 would be the carbonate requiring the lowest pressure to have this change, and
this coordination change may be the cause of the high melting temperature of K2CO3. Other
carbonates may also increase their melting temperatures after their carbon atom coordination
change. Because X-ray diffraction does not work well for light carbon atom, infrared
spectroscopy and first principle calculations are needed to find the evidence of CO4 bounding
and possible crystal structure (Boulard et al. 2015).
Figure 7.1 Eutectic melting of carbonated silicates (L-liquid, S-silicate, C-carbonate).

112
With a possible deep storage of K2CO3 in the transition zone or even the lower mantle, our
understanding of geochemistry and thermal structure of the transition and lower mantle may be
changed. Before, only hollandite II was known to be a stable potassium carrier in the lower
mantle (Hirao et al. 2007), but how much its precursor K-feldspar can be subducted into the
lower mantle was questionable. However, K2CO3 is a mineral that exists in subducted slabs and
can be subdcuted into the lower mantle, so it is more likely a potassium host in the transition
zone and lower mantle. 40
K is a major heat source of the Earth’s lower mantle. If relatively large
amount of heat is produced in the lower mantle due to the presence of K2CO3, the geodynamo
model, the core formation model and the thermal history of the mantle and core need to be
revised. The deep storage of K2CO3 may also be the cause of ultra-potassic rocks. Ultra-potassic
rocks include kimberlite, lamprolite, lamprophyres, which are all deeply originated. The high
potassium over sodium reflects the enrichment of potassium over sodium in their sources (Foley
and Peccerillo 1992). And these rocks are all also rich in CO2, which indicates that the source of
potassium may be K2CO3.
References
Anderson, D.L. (2007) New Theory of the Earth. Cambridge University Press , New York. ISBN
9780521849593
Baba, K., Tarits, P., Chave, A.D., Evan, R.L. Hirth, G., and Mackie, R.L. (2006) Electrical
structure beneath the northern MELT line on the East Pacific Rise at 15°45’S.
Geophysical Research Letters, 33, L22301.
Bercovici, D., and Karato, S. (2003) Whole mantle convection and transition-zone water filter.
Nature, 425, 39-44.

113
Boulard, E., Pan, D., Galli, G. Liu, Z., and Wendy, W.L. (2015) Tetrahedrally coordinated
carbonates in Earth’s lower mantle. Nature Communications, 6, 6311.
Buob, A., Luth, R.W., Schmidt, M.W., and Ulmer, P. (2006) Experiments on CaCO3–MgCO3
solid solutions at high pressure and temperature. American Mineralogist, 91, 435–440.
Cancarevic, Z.P., Schon, J.C. and Jansen, M. (2007) Possible existence of alkali metal
orthocarbonates at high pressure. Chemistry – A European Journal, 13, 7330–7348.
Foley, S. and Peccerillo, A. (1992) Potassic and ultrapotassic magmas and their origin. Lithos,
28,181-185.
Gaillard, F., Malki, M., Iacono-Marziano, G., Pichavant, M. and Scaillet, B. (2008) Carbonatite
melts and electrical conductivity in the asthenosphere. Science, 322, 1363–1365.
Ghiorso M.S., Hirschmann, M.M, Reiners, P.W., and Kress, V.V. III (2002) The pMELTS: A
revision of MELTS for improved calculation of phase relations and major element
partitioning related to partial melting of the mantle to 3 GPa. Geochemistry Geophysics
Geosystems, 3, 10.1029/2001GC000217.
Hirao, N., Ohtani, E., Kondo, T., Sakai, T., and Kikegawa, T. (2007) Hollandite II phase in
KAlSi3O8 as a potential host mineral of potassium in the Earth’s lower mantle. Physics of
the Earth and Planetary Interiors, 166, 97-104.
Katsura, T., and Ito, E. (1990) Melting and subsolidus phase relations in the MgSiO3-MgCO3
system at high pressures – Implications to evolution of the Earth’s atmosphere. Earth and
Planetary Science Letters, 99, 110-117.
Oganov, A.R., Hemley, R.J., Hazen, R.M., and Jones, A.P. (2013) Structure, bonding and
mineralogy of carbon at extreme conditions. Reviews in Mineralogy & Geochemistry, 75,
47-77.
Ritsema, J. van Heijst, H.J., Deuss, A., and Woodhouse, J.H. (2011) S40RTS: a degree-40 shear-
velocity model for the mantle from new Rayleigh wave dispersion, teleseismic
traveltimes, and normal-mode splitting function measurements, Geophysical Journal
International, 184, 1223-1236.
Schmandt, B., Jacobsen, S.D. and Becker, T.W. and Liu, Z., and Dueker, K.G. (2014)
Dehydration melting at the top of the lower mantle. Science, 344, 1265-1268.
Shatskiy, A., Gavryushkin, P.N., Sharygin, I.S., Litasov, K.D., Kupriyanov, I.N., Higo, Y.,
Borzdov, Y.M., Funakoshi, K., Palyanov, Y.N., Ohtani, E. (2013a) Melting and
subsolidus phase relations in the system Na2CO3–MgCO3±H2O at 6 GPa and the stability
of Na2Mg(CO3)2 in the upper mantle. American Mineralogist, 98, 2172–2182.

114
Shatskiy, A., Sharygin, I.S., Gavryushkin, P.N., Litasov, K.D., Borzdov, Y.M., Shcherbakova,
A.V., Higo, Y., Funakoshi, K., Palyanov, Y.N., and Ohtani, E. (2013b) The system
K2CO3–MgCO3 at 6 GPa and 900–1450 °C. American Mineralogist, 98, 1593–1603.
Tao, R., Fei, Y., and Zhang, L. (2013) Experimental determination of siderite stability at high
pressure. American Mineralogist, 98, 1565-1572.
Wang, Y., Sakamaki, T., Skinner, L.B., Jing, Z.,Yu, T., Kono, Y., Park, C., Shen, G., Rivers,
M.L. and Sutton, S.R. (2014) Atomistic insight into viscosity and density of silicate melts
under pressure. Nature Communications, 5, 3241.