MEHOS: A neural networks-based method for adaptive …anikov/publ/MEHOS-Nikov.pdf ·...
40
MEHOS-AE-5-pict.doc 1 of 40 MEHOS: A neural networks-based method for adaptive human factors quality evaluation of hospital services Abbreviated running title: MEHOS: Method for adaptive human factors quality evaluation of hospital services Alexander Nikov a, ,* , Selim Zaim a , Mehves Tarim b a Fatih University, 34500 Buyukcekmece, Istanbul, Turkey b Department of Healthcare Management, Marmara University, 34865 Cevizli, Kartal, Istanbul, Turkey Abstract A method for adaptive human factors evaluation of hospital service quality (MEHOS) is proposed. It is based on a SERVQUAL checklist tool using a neural networks-based evaluation model. This method enables the adaptive determination of the most important human factors criteria and of the generation of recommendations for improving the hospital service quality. This method is illustrated and validated by a case study in a Turkish hospital. Data from hospital patients are collected by the checklist tool. Then human factors evaluations are calculated using categorical regression, ordered regression and MEHOS method. The last one showed significantly better performance. Based on MEHOS the most important human factors criteria that affect service quality in the health care industry were determined. Relevant recommendations and measures for improving the hospital service were proposed. After their implementation the health service quality index of the hospital rose by 51%. The advantages, drawbacks and further developments of MEHOS are discussed. Keywords: Human factors evaluation; Hospital service quality; Neuro-fuzzy model 1. Introduction Today, service industries are preponderant and account for 60 or 70 percentage of the total worldwide GNP (Franklin, 1997). One of the fastest growing industries in the service sector is * Corresponding author: Tel.: +90-5427893211; fax: +90-212-8890906. E-mail address: [email protected] (A. Nikov)
-
Upload
truongdang -
Category
Documents
-
view
216 -
download
0
Transcript of MEHOS: A neural networks-based method for adaptive …anikov/publ/MEHOS-Nikov.pdf ·...
MEHOS-AE-5-pict.doc 1 of 40
MEHOS: A neural networks-based method for adaptive human factors quality evaluation
of hospital services
Abbreviated running title: MEHOS: Method for adaptive human factors quality evaluation of
hospital services
Alexander Nikova,,* , Selim Zaima, Mehves Tarimb
aFatih University, 34500 Buyukcekmece, Istanbul, Turkey
bDepartment of Healthcare Management, Marmara University, 34865 Cevizli, Kartal, Istanbul, Turkey
Abstract
A method for adaptive human factors evaluation of hospital service quality (MEHOS) is
proposed. It is based on a SERVQUAL checklist tool using a neural networks-based evaluation
model. This method enables the adaptive determination of the most important human factors
criteria and of the generation of recommendations for improving the hospital service quality.
This method is illustrated and validated by a case study in a Turkish hospital. Data from hospital
patients are collected by the checklist tool. Then human factors evaluations are calculated using
categorical regression, ordered regression and MEHOS method. The last one showed
significantly better performance. Based on MEHOS the most important human factors criteria
that affect service quality in the health care industry were determined. Relevant
recommendations and measures for improving the hospital service were proposed. After their
implementation the health service quality index of the hospital rose by 51%. The advantages,
drawbacks and further developments of MEHOS are discussed.
Keywords: Human factors evaluation; Hospital service quality; Neuro-fuzzy model
1. Introduction Today, service industries are preponderant and account for 60 or 70 percentage of the total
worldwide GNP (Franklin, 1997). One of the fastest growing industries in the service sector is
* Corresponding author: Tel.: +90-5427893211; fax: +90-212-8890906. E-mail address: [email protected] (A. Nikov)

MEHOS-AE-5-pict.doc 2 of 40
the health care industry. While all hospitals provide basically the same types of services, they
do not provide the same quality of service (Puay and Nelson, 2000). Since 1980 the role of
hospital service quality (HSQ) has been widely recognized as a critical determinant for the
success and survival of a hospital in today’s competitive environment. Any decline in patient
satisfaction due to poor service quality would be a matter of concern (O’Keeffe and O’Sullivan,
1997).
In the health care industry, the rising technological developments as well as quality
standards have had an important impact on medical care, surgical techniques, drugs,
equipment, and the organization and delivery of health care (Kunst and Lemmink, 2000; Lee et
al., 2000). Despite the improvements in the health care industry, it is still very difficult for the
patients to evaluate the quality of service received either before or after its delivery. In choosing
a hospital, patients usually seek information on indicators of medical competence and
assurance. They especially seek evidences indicative of the hospital’s quality such as
certificates, quality awards, or other evidences of the physicians’ and staffs’ qualifications and
the utilization of most recent medical developments and techniques.
Service quality in the health care can be defined in various ways depending on who the
evaluators are; e.g. practitioners, patients. However, the patient’s perspective is increasingly
being viewed as the most meaningful indicator of health care service quality (Rust and Oliver,
1994; McAlexander et al., 1994). From this perspective the health care service quality is a result
of the comparison that patients make between their expectations about a service and their
perception of the way the service has been performed. Hence service quality is often
conceptualized as the comparison of service expectations with actual performance perceptions
(Brady and Cronin, 2001; Brady et al., 2002; Koerner, 2000; Parasuraman et al.,1985, 1988;
Rust et al., 2002). The research on service quality is dominated by the SERVQUAL checklist
tool, which is based on the so-called “gap” model (Bloemer, 1999).
There are numerous studies measuring service quality in the health care industry using
SERVQUAL. Usually in these studies different types of mathematical and statistical methods
are used such as exploratory factor analysis (Andaleeb, 2001; Babakus and Mangold, 1992;
Carmen, 1990; Walbridge and Delene, 1993), confirmatory factor analysis (Brady et al., 2002;
MEHOS-AE-5-pict.doc 3 of 40
Taylor and Cronin, 1994), structural equation modeling (Kathleen, 2002; Cloe et al., 1995; Lytle
and Mokwa, 1992; Kara et al., 2002, 2005), regression analysis (Kara et al., 2002, 2003; Peyrot
et al., 1993), discriminant analysis (O’Conner et al., 1994), conjoint analysis (Carman, 2000),
and gap analysis (Fayek et al., 1996; Yavas and Donald, 2001).
The increases in computer power, on the one hand, and the decrease in computer costs, on
the other hand have stimulated the research on Artificial Neural Network (ANN). Recently many
ANN models have been applied in service industry (Rao and Jafar, 2002; Castillo et al., 2001;
Goss and Vozikis, 2002; Lisboa, 2002). Many ANN applications in health care industry use ANN
models as an alternative to multivariate statistical methods such as logistic regression analysis.
They attempt to show that ANN models have better predictive power than multivariate statistical
methods.
Goss and Vosikis (2002) used ANN approach to measure the likelihood of intensive care unit
recovery and compared it with logistic regression model. This study showed that ANN approach
predicts mortality rate in intensive care units more correctly than the statistical technique. Goss
and Ramchandani (1998) evaluated the survival prediction accuracy in the intensive care units
using ANN approach comparing it with binary logistic regression model. The study concluded
that ANN outperforms binary logistic regression model. Morrison et al. (1997) employed ANN
technique to predict total health care costs of Medicaid recipients.
There are various studies in the health care, which employed ANN techniques with
supervised learning to measure hospital performance or to predict health care costs in the
hospital. However, we could not find any study that uses ANN methods to evaluate health care
service quality by SERVQUAL-based patient’s survey. We found only a few studies using ANN
methods and SERVQUAL questionnaire instrument in other service industries. For example,
Tsaur et al. (2001) employed backpropagation neural networks model for analyzing the guest
loyalty toward international tourist hotels. They compared ANN approach with logistic regression
model. The ANN model outperforms regression models in overall model fitting. Davies et al.
(1996) used backpropagation neural network model to measure ATM user attitudes. Behara et
al. (2002) employed ANN technique to evaluate service quality of auto dealerships in the
Netherlands using SERVQUAL based customer survey.
MEHOS-AE-5-pict.doc 4 of 40
There are many methods for HSQ evaluation. Their drawback is that they do not provide
recommendations for improving HSQ. Here we propose a neuro-fuzzy-based method for
adaptive human factors quality evaluation of hospital services (MEHOS), which also generates
improvement recommendations for health care services. Based on a case study MEHOS
supports better understanding of consumers’ perceptions of hospital service quality and its
improvement.
2. Description of MEHOS Method
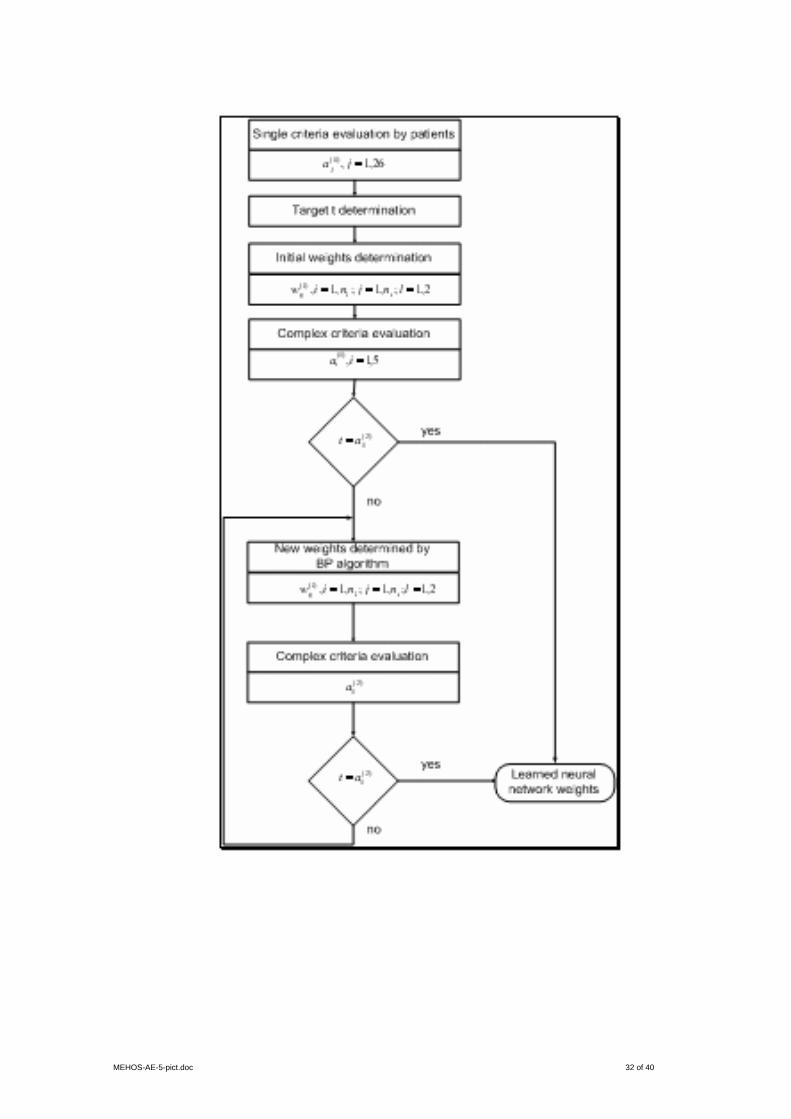
The individual steps of the MEHOS method are shown on Fig.1. Principal purposes of this
method are: 1) aggregating the hospital service data for quantitative human factors evaluations;
2) selection of important HSQ evaluation criteria for the generation of human factors
recommendations and measures for HSQ improvements.
Step 1: Knowledge base design
For human factors evaluation and design of HSQ, a knowledge base including the following
evaluation criteria: tangibility, reliability, responsiveness, assurance and courtesy can be
developed (see Fig.2). MEHOS is based on the adapted SERVQUAL (Parasuraman et al.,
1985, 1988, 1991) service quality checklist tool (cf. Appendix). Carman (1990) applied this tool
to several types of services and adapted it for the hospital industry. The MEHOS checklist tool
consists of two parts. The first one contains 26 questions that identify HSQ evaluation criteria for
tangibility, reliability, responsiveness, assurance and courtesy. These questions are asked to
patients under treatment at the hospital for measuring their perceptions of the service quality
performance of the hospital. In the second part of the checklist tool, a single question regarding
patients’ overall evaluation of hospital service quality is asked. For the above criteria a criteria
hierarchy is defined (see Fig.3). To each criterion, a weight is associated by expert estimates.
Each weight represents the relative importance of each sub-criteria within their category.
Step 2: Data collection
During this step the patients’ evaluations of the single criteria at the lowest first layer of the
criteria hierarchy are determined.
Step 3: Criteria hierarchy learning

MEHOS-AE-5-pict.doc 5 of 40
During this step of the MEHOS method the initial weights of criteria hierarchy are trained.
Because of the strong nonlinear correlation between evaluation criteria we chose a nonlinear
evaluation model: the backpropagation (BP) algorithm (Garson 1998). It carries out supervised
learning of neural network weights using training data as inputs and known output minimizing
the mean square error. In this study, patients’ perception related to pre-specified HSQ criterion
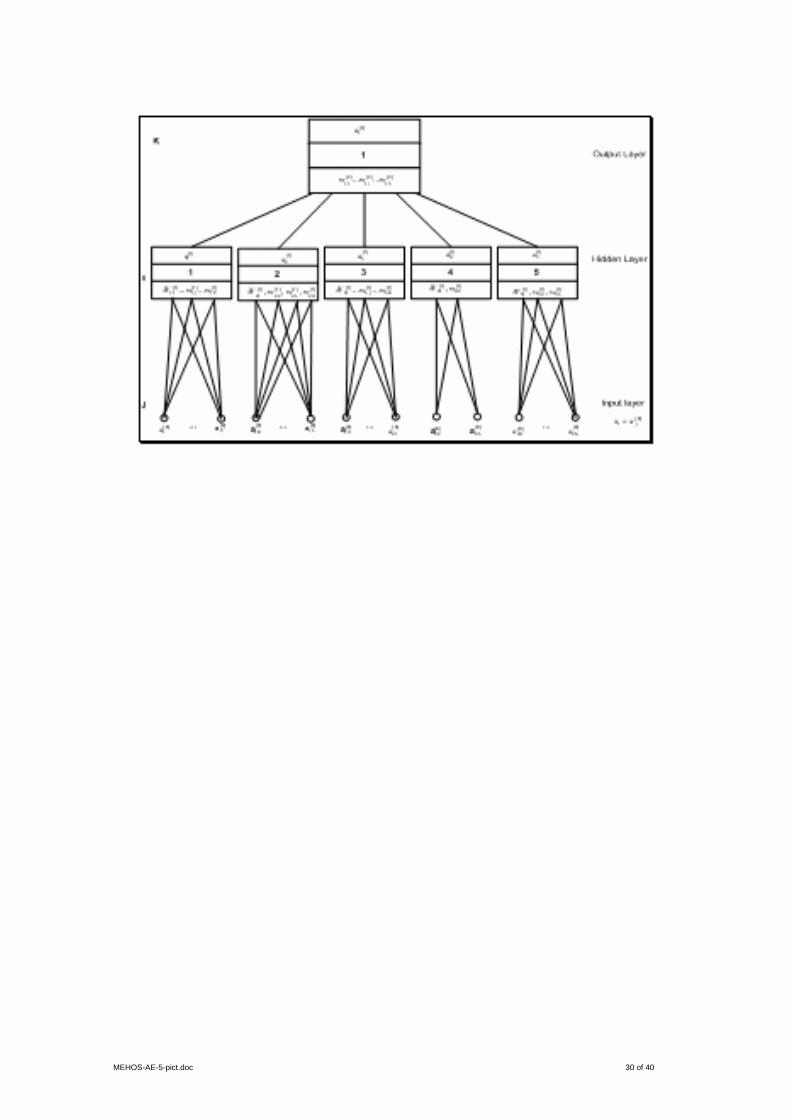
is paired with overall HSQ evaluation. During the training process, the neural network (cf. Fig.5)
learns the relationship between output and input criteria. The network arcs connect the
processing units -the neurons. With each neuron input a weight is associated, which represents
its relative importance in the set of neurons inputs. The inputs of each neuron from other
neurons are aggregated. Its net value represents a weighted combination of the neuron inputs.
The hierarchy is coded in a hierarchical neural network, where each neuron corresponds to a
criterion. The single criteria correspond to the network inputs. The complex criteria correspond
to the neurons at hidden layer and to the output neuron. The net function of the neural network
is used as an evaluation function. The BP algorithm is a gradient algorithm, which minimizes the
average square error between the current output and the target value by modification of the
network weights. We consider a neural network with 26 inputs, five hidden neurons and an
output neuron (cf. Fig.4).
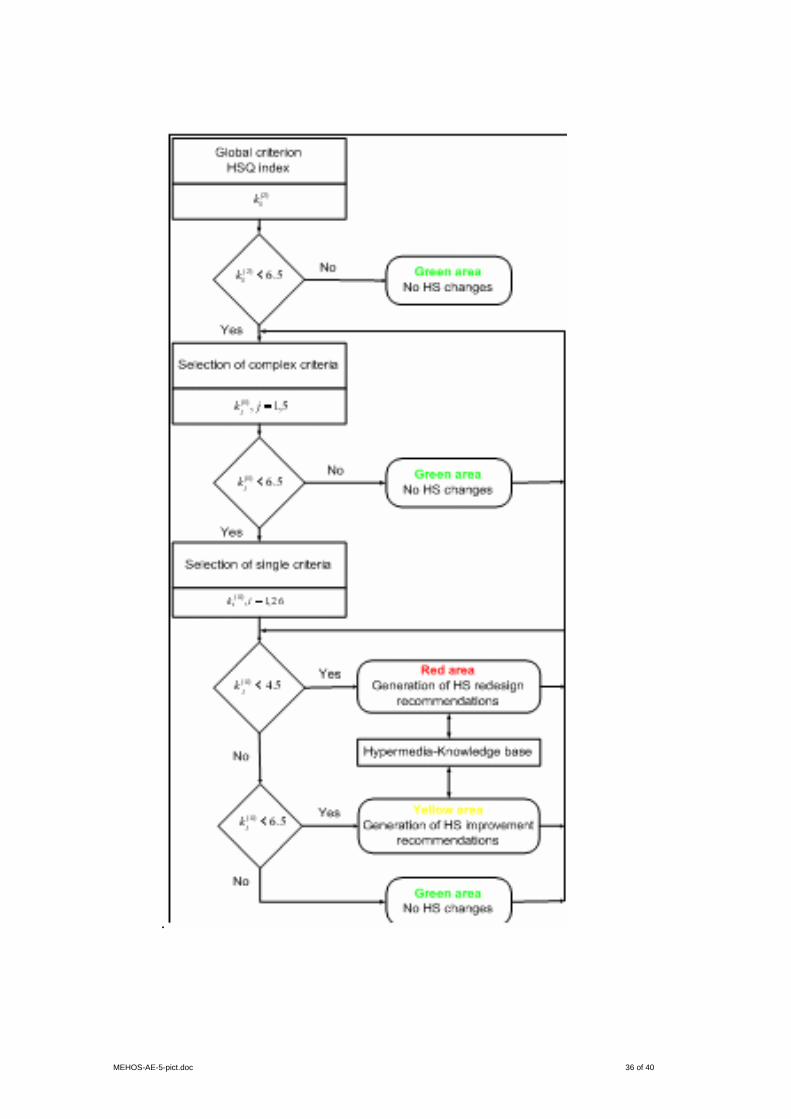
Step 4: Lack analysis
A goal of MEHOS method is to support the lack analysis. This is accomplished by
determining the most important single criteria at input layer whose improvement will lead to the
most significant increase of the HSQ index.
The lack analysis consists in sequential computation of HSQ indices ( )ljK ∗ for the criteria of
each network layer as follows:
For the criterion j an index ( )K jl
is calculated, which characterizes the quality of criterion lja
from human factors viewpoint.
For input layer

MEHOS-AE-5-pict.doc 6 of 40
( ) ( ) 10** )0(*
0*
0* ijjj waK = ,
where the standardization of every ( )0ja and )0(
ijw in the interval [ ]1,0 is accomplished as follows:
( ) ( )
( ) ( )00
00)0(
*minmax
min
jj
jjj aa
aaa
−
−= and
( ) ( )
( ) ( )00
00)0(
*minmax
min
ijij
ijijj ww
www
−
−=
For indices ( )ljK ∗ of all criteria three fuzzy sets are defined (see Fig.6). They represent the
values of the linguistic variable hospital service quality determined by clustering analysis and
experts:
• Good HSQ ( ) [ ]10,5.6∈∗ljK : green area
• Acceptable HSQ ( ) [ )5.6,5.4∈∗l
jK : yellow area and
• Bad HSQ ( ) [ )5.4,0∈∗l
jK : red area.
Starting from output network layer to input network layer the indices ( )ljK ∗ of all criteria are
computed. Top down for the next layer are computed indices only for these criteria, which are
successors of criteria with indices ( ) 5.6<∗l
jK . This procedure continues similar up to the input
layer inclusively. The following decision rules for selection of single criteria at input layer are
formulated:
• When ( ) 5.65.4 ≤∗< ljK , an HSQ improvement is recommended;
• When ( ) 5.4<∗l
jK , a redesign of hospital service is required.
Both decision rules activate a hypermedia-based support (cf. Fig.7), which uses a
hypermedia knowledge base. It consists of knowledge components in the form of tables, data,
graphics, speech/tone, animation, recommendations, etc. The sequence of the presentation of
these knowledge components to the user is system-controlled (automated) or user-controlled
(manually).
Step 5: Improvement/redesign recommendations

MEHOS-AE-5-pict.doc 7 of 40
A team of experts discusses the results at the previous step. Thus, improvement/redesign
recommendations are generated by the MEHOS software tool (cf. Fig.7).
3. Case study
For illustrating and validating of MEHOS method a case study in an Istanbul hospital for civil
servants and their families was carried out.
In the data collection step particular attention was paid to the pre-testing of the
questionnaire: Data for this study were gathered using a SERVQUAL-based questionnaire (cf.
Appendix) that was distributed to 200 patients in the hospital. 139 usable questionnaires were
returned giving a response rate of 69.5 percent, which was considered satisfactory for the
subsequent analysis. Each checklist item was rated on a seven-point Likert scale anchored at
the verbal statement “Strongly Disagree” to which is associated a value of 1and the verbal
statement “Strongly Agree” valued at 7.
3.1 Comparison of MEHOS method with conventional evaluation methods
The MEHOS method was compared with other known evaluation models. We selected
categorical regression (Agresti, 1990) and ordered regression (Hosmer and Lemeshow, 2000)
because the data was measured in the ordinal scale.
The MEHOS neural network consists of 26 nodes at input layer, of 5 nodes at hidden layer,
and of a node at output layer. The single criteria at input layer were scaled to the unit interval
[0,1]. As activation function at hidden layer the sigmoid function was chosen. For neural network
learning at MEHOS step 3 a generalized delta rule was applied.
By the BP algorithm we divided the data in training and test samples and in data set 1 and
data set 2. Data set 1 consists of a training sample of 110 patients and a test sample of 29
patients. Data set 2 consists of a training sample of 100 patients and a test sample of 39
patients. The results (cf. Fig.8) showed that the best method for both data sets is MEHOS. For
data set 1 it has the lowest mean squared error: 0.22 for the training sample and 0.15 for the
test sample. The ordered regression ranks at second place with respective mean squared errors
of 0.48 and 0.49; and categorical regression takes the last place with respective mean squared
errors of 0.87 and 0.86. Similar are the results for data set 2 (cf. Fig.8).
MEHOS-AE-5-pict.doc 8 of 40
3.2 Lack analysis and generation of improvement/redesign recommendations
The current service quality of the hospital was analyzed according to MEHOS steps 4 and 5.
Relevant improvement and redesign recommendations were generated. The evaluation of
current service quality was carried out using a 10-point scale. It was evaluated and improved in
the following three stages. If the score of service quality is less than 4.5, the HSQ is allocated to
the red area indicating that the health care service should be redesigned. If the score of service
quality is in the interval 4.5–6.5, the HSQ is allocated to the yellow area signifying that the
health care service needs some improvement. If the score of service quality is greater than or
equal to 6.5 the HSQ is allocated to the green area. In this case the health care service does
not need to be improved. At the first stage the overall service quality (HSQ index) was
determined. Then at the second stage, each criterion was evaluated and based on this
evaluation a decision was taken as to which criterion should be improved or redesigned. As
mentioned above the overall service quality presents a combination of tangible and intangible
criteria. The intangible criteria are reliability, responsiveness, assurance and courtesy. At the
third stage considering the criteria scores that were calculated at second stage, redesign and
improvement plans were developed.
At the first stage the score of the current overall service quality (HSQ index) of the hospital
was 4.97. Since this value is in the interval 4.5–6.5 the overall service quality belongs to the
yellow area. Hence, it does not need any redesign; improvement will suffice. At the second
stage, during the top-down procedure, each criterion score was calculated. assurance,
reliability, and courtesy all received scores below 4.5 (0.0, 2.02, and 3.42, respectively) and thus
were placed in the red area. On the other hand, responsiveness and tangibility scores were,
respectively, 8.10 and 10 and hence were placed in the green area, having scored above the
6.5 limit. Consequently, the former three criteria require redesign while the latter two does not
need any urgent improvement. As shown in Table 1, among the complex criteria assurance
ought to receive the first priority, reliability the second, and courtesy the third.
As mentioned above, assurance has the lowest score as a complex criterion, and belongs
to the red area. Therefore, this criterion should be considered by managers of the hospital as
the most important criterion to be redesigned. Assurance refers to employees’ knowledge and
MEHOS-AE-5-pict.doc 9 of 40
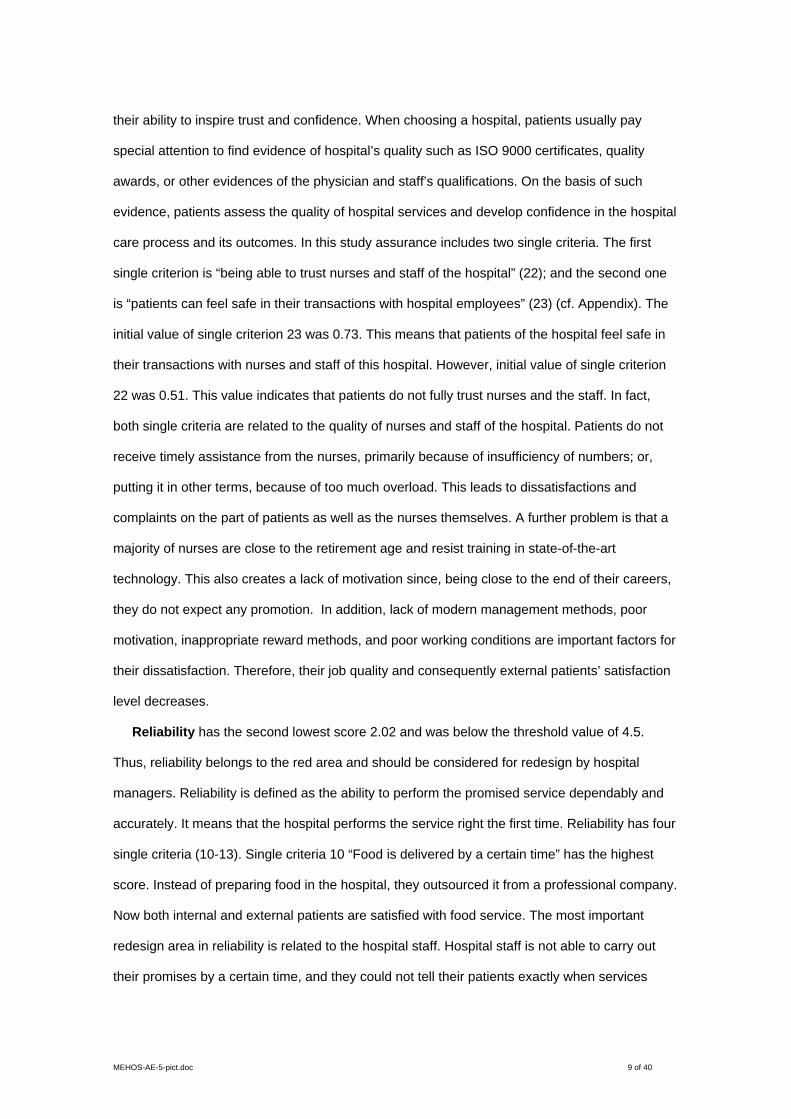
their ability to inspire trust and confidence. When choosing a hospital, patients usually pay
special attention to find evidence of hospital’s quality such as ISO 9000 certificates, quality
awards, or other evidences of the physician and staff’s qualifications. On the basis of such
evidence, patients assess the quality of hospital services and develop confidence in the hospital
care process and its outcomes. In this study assurance includes two single criteria. The first
single criterion is “being able to trust nurses and staff of the hospital” (22); and the second one
is “patients can feel safe in their transactions with hospital employees” (23) (cf. Appendix). The
initial value of single criterion 23 was 0.73. This means that patients of the hospital feel safe in
their transactions with nurses and staff of this hospital. However, initial value of single criterion
22 was 0.51. This value indicates that patients do not fully trust nurses and the staff. In fact,
both single criteria are related to the quality of nurses and staff of the hospital. Patients do not
receive timely assistance from the nurses, primarily because of insufficiency of numbers; or,
putting it in other terms, because of too much overload. This leads to dissatisfactions and
complaints on the part of patients as well as the nurses themselves. A further problem is that a
majority of nurses are close to the retirement age and resist training in state-of-the-art
technology. This also creates a lack of motivation since, being close to the end of their careers,
they do not expect any promotion. In addition, lack of modern management methods, poor
motivation, inappropriate reward methods, and poor working conditions are important factors for
their dissatisfaction. Therefore, their job quality and consequently external patients’ satisfaction
level decreases.
Reliability has the second lowest score 2.02 and was below the threshold value of 4.5.
Thus, reliability belongs to the red area and should be considered for redesign by hospital
managers. Reliability is defined as the ability to perform the promised service dependably and
accurately. It means that the hospital performs the service right the first time. Reliability has four
single criteria (10-13). Single criteria 10 “Food is delivered by a certain time” has the highest
score. Instead of preparing food in the hospital, they outsourced it from a professional company.
Now both internal and external patients are satisfied with food service. The most important
redesign area in reliability is related to the hospital staff. Hospital staff is not able to carry out
their promises by a certain time, and they could not tell their patients exactly when services

MEHOS-AE-5-pict.doc 10 of 40
would be performed. The number of doctors (surgeons) of the hospital is much more than the
number of nursing staff in this hospital. Operating loads per doctor is not high compared to
nurses’ operating loads. The next improvement area in this criterion was keeping patient's
records accurately. It may be pointed out that hospitals generally do not maintain an appropriate
recent keeping system. Causes of this problem are deficiencies in staff quality, education and
management information system.
The third criterion is courtesy. It involves politeness, respect, consideration, and friendliness
of contact personnel. Courtesy refers to attitude and behavior of the hospital employees toward
the patients and their families. Since its score is 3.42, courtesy belongs to red area. Therefore,
this criterion should be redesigned as well. Courtesy has three single criteria. Criterion 26
“Hospital visitors are treated well” has the lowest score among these three single criteria. The
second redesign should be carried out in nurses’ behavior toward patients. The causes of these
problems are the lack of adequate quality and quantity of nurses and staff. Although nurses’
attitudes toward patients and their visitors are at an acceptable level, inadequacy of their
numbers makes it impossible to render the desired levels of services. Therefore, this hospital
needs to recruit new staff and train the existing staff and nurses.
Responsiveness is the fourth improvement criterion. It refers to the prompt service in the
discharging process, the admission process, and at the transactional operations such as
punctual services when needed. In addition, responsiveness refers to explanations about
treatments, and any procedure in the hospital. According to the findings, responsiveness has a
score of 8.10 and belongs to the green area. Therefore, there is no need to do anything about
responsiveness.
The tangibility was found as the most efficient criterion in the service quality model. There is
no need to indulge in any immediate improvement in this area. Tangibility refers to the whole
range of assets in the hospital including updating the assets, cleaning the room, etc. Analysis
results indicate that this hospital does not have any problem about tangibility.
In this case study, if the above mentioned recommendations are applied in the assurance,
reliability and courtesy areas and the requisite redesigns are implemented (that is, if the single
assurance criterion 22 was raised from 0.51 to 1.00, the single reliability criteria 11,12 and 13

MEHOS-AE-5-pict.doc 11 of 40
were raised from, respectively, 0.61, 0.65, and 0.49 to 1.00, and the single courtesy criteria 25
and 26 were raised from 0.48 and 0.38 to 1.00), the HSQ index would rise by 51%; that is from
4.97 to 7.5 as shown in figure 9. In other words, the overall service quality which was in the
yellow area will now be in the green area.
4. Conclusions
The health care providers need a better understanding of the key dimensions constituting
health care quality and valid approaches to their measurement. There is considerable
discrepancy regarding health care service quality: what to measure and how to measure. In this
study, to alleviate some of these difficulties, a method for adaptive human factors quality
evaluation of hospital services was proposed. It is based on a SERVQUAL checklist tool using a
neural networks-based evaluation model. This method enables the adaptive determination of
the most important human factors criteria and of the generation of recommendations for
improving the hospital service quality. This method is illustrated and validated by a case study
with 139 patients in a non-profit Istanbul hospital. The most important criteria for measuring
health care service quality and improvement and redesigning areas were determined. For
delivering a high quality service, health care providers must concentrate on intangible factors
such as reliability and assurance. According to the evaluation of these two factors, nursing care
was found to be the most important criterion. Therefore, to improve and redesign nursing
department, the most significant effort must be devoted to modern managerial practices such as
recruiting new nursing staff, training them in both technical and interactive skills, compensating
them, empowering them, promoting teamwork, developing internal processes and supporting
technology, and treating employees as internal customers. After implementation of such
redesign recommendations, the health service quality index of the hospital was increased by
51%.
Advantages, disadvantages and further developments of MEHOS are presented below.
4.1 Advantages
• This method enables the adaptive determination of the most important human factors
criteria and of the generation of recommendations for improving the hospital service quality.

MEHOS-AE-5-pict.doc 12 of 40
• MEHOS showed significantly better performance (much lower error rate) in comparison to
other evaluation methods such as categorical regression and ordered regression. MEHOS
neural network modeled better non-linear dependencies characterizing the health service
quality data.
• By MEHOS, not only the critical factor and related improvement areas regarding the service
quality in a hospital can be ascertained, but also the degree to which the service quality can
be improved after taking corrective actions by hospital managers.
• Hospital managers can measure by MEHOS their hospitals’ service quality from the
customer’s viewpoint.
• Using the lack analysis, hospital managers can formulate their management strategies to
redesign and to improve their service delivery system.
• The result of the evaluation can assist in the appropriate allocation of the annual budget and
of other management resources.
4.2 Disadvantages
• The costs of improvement and redesign activities and their impact on hospital profitability
are not considered.
• Service quality improvement and redesigning activities were carried out under non-
restricted constraints.
4.3 Further Developments
• MEHOS conceptual domain can be extended by measuring the relationship between
service quality and patient satisfaction, loyalty and its influence on performance of the
hospital.
• This study can be applied in profit-oriented hospitals and customer profile can be evaluated
and compared with patients of non-profit hospitals.
MEHOS-AE-5-pict.doc 13 of 40
• The evaluation of current service quality was carried out according to the service recipients’
perception. It will be very valuable to add physicians’ perception of service quality when
designing and improving the health care delivery system.
• MEHOS did not consider expectations of patients. It could be further developed to consider
expectations of patients and measure how expectation effects overall service quality.
• MEHOS performance could be increased by using fuzzy backpropagation model (Nikov and
Stoeva, 2001; Stoeva and Nikov, 2000).
5. References
Agresti, A., 1990. Categorical data analysis, Wiley, Inc., New York.
Andaleeb, S. S., 2001. Service quality perceptions and patient satisfaction: A study of hospitals
in the developing country. Social Science & Medicine 52, 1359-1370.
Babakus, E., Mangold, G. W., 1992. Adapting the SERVQUAL scale to hospital services: an
empirical investigation. Health Services Research 26 (6), 797-786.
Behara, S. R., Fisher, W. W., Lemming, G.A.M. J., 2002. Modeling and evaluating service
quality measurement using neural networks. International Journal of Operations & Production
Management 22 (10), 1162-1185.
Bloemer, J., Ruyter, de Ko, Wetzels, M., 1999. Linking perceived service quality and service
loyalty: a multi-dimensional perspective. European Journal of Marketing 33 (11/12), 1082-1106.
Brady, K. M., Cronin, J. Jr., 2001. Some new thoughts on conceptualizing perceived service
quality: A hierarchical approach. Journal of Marketing 65 (July), 34-49.
Brady, K. M., Cronin, J. Jr., Brand, R. R., 2002. Performance-only measurement of service
quality: a replication and extension. Journal of Business Research 55, 17-31.
Brady, K. M., Cronin, J. Jr., Brand, R. R., 2002. Performance – only measurement of service
quality: a replication and extension. Journal of Business Research 55, page 17-31.
Carman, J.M., 2000. Patient perceptions of service quality: combining the dimensions. Journal
of Services Marketing 14 (4), 337-352.

MEHOS-AE-5-pict.doc 14 of 40
Carman, J.M., 1990. Consumer perceptions of service quality: an assessment of the
SERVQUAL dimensions. Journal of Retailing 69 (1), 33-55.
Castillo, E., Hadi, S. A., Gutierrez, J. M., Lacruz, B., 2001. Some application of functional
networks in statistics and engineering. Technometrics 43 (1), 10-24.
Clow, E. K., Fischer, K. A., O’Bryan, D., 1995. Patient expectations of dental services: Image
affects expectations, and expectations affect perceived service quality. Journal of Health Care
Marketing 15 (3), 23-31.
Cronin, J. Jr., Brady, K. M., Hult, M. G. T., 2000. Assessing the effects of quality, value, and
customer satisfaction on consumer behavioral intentions in service environments. Journal of
Retailing 76 (2), 193 – 218.
Davies, F., Moutinho, L., Curry, B., 1996. ATM user’s attitudes: A neural network analysis.
Marketing Intelligence & Planning 14 (2), page 26-32.
Fayek, N. Y., Dean, N., Bovaird, T., 1996. Health care quality in NHS hospitals. International
Journal of Health Care Quality Assurance 9 (1), 15-28.
Franklin, C. J., 1997. Industry output and employment projections to 2006. (Employment
outlook: 1996 – 2006). Monthly Labor Review 120 (11), 39.
Garson, G. D., 1998. Neural network an introductory guide for social scientists. Sage
publications, London.
Goss, E. P., Ramchandani, H., 1998. Survival prediction in the intensive care unit: a
Comparison of neural networks and binary regression. Socio – Economy and Planning Science
Vol 32 (3), 189 – 198.
Goss E. P., Vozikis, S. G.,2002. Improving health care organizational management through
neural network learning. Health Care Management Science 5, 221 – 227.
Hosmer, D. W., Lemeshow, S., 2000. Applied logistic regression. Wiley, Inc., New York.
Kara, A., Tarim, M., Zaim, S., 2003. A low performance – low quality trap in the non – profit
healthcare sector in Turkey and a solution. Total Quality Management & Business Excellence
14 (10), 1131 – 1141.

MEHOS-AE-5-pict.doc 15 of 40
Kara, A., Tarim, M., Zaim, S., 2005. A paradox of service quality in Turkey. European Business
Review, forthcoming .
Kara, A., Tarim, M., Zaim, S., 2002. A dynamic model and empirical examination of
performance and customer satisfaction in a non-profit health care sector in Turkey. Proceedings
of International Management Development Association Conference, 519-526.
Kara, A., Tarim, M., Zaim, S., 2002. Expectation and performance based determinants of
service quality: A special case at a non-profit hospital in Turkey. Proceedings of International
Management Development Association Conference, 556-562.
Kathleen, N L., 2002. Health services research: An evolving definition of the field. Health
Services Research, 37 (1), 7.
Koerner, M. M., 2000. The conceptual domain of service quality for inpatient nursing services.
Journal of Business Research 48, 267 – 283.
Kunst, P., Lemmink, J., 2000. Quality management and business performance in hospitals: A
search for success parameters. Total Quality Management & Business Excellence 11 (8), 1123-
1133.
Lee, H., Delene, M. L., Bunda, A. M., Kim, C., 2000. Methods of measuring health care service
quality. Journal of Business Research 48, 233 – 246.
Lisboa P.J.G., 2002. A review of evidence of health benefit from artificial neural networks in
medical intervention. Neural Networks 15, 11 -39.
Lytle, S. R., Mokwa, P. M., 1992. Evaluating health care quality: the moderating role of
outcomes. Journal of Health Care Marketing 12 (1), 4-14.
McAlexander, H. J., Kaldenberg, O. D., Koenig, F. H., 1994. Service quality measurement.
Journal of Health Care Marketing 14 (3), 34-39.
Morrison, R. J., Johnson, D. J., Barnes, H. J., Summers, K., Szinbach, L. S., 1997. Predicting
total health care costs of Medicaid recipients: An artificial neural systems approach. Journal of
Business Research 40, 191 – 197.
Nikov, A., Stoeva S., 2001. Quick fuzzy backpropagation algorithm. Neural Networks 14 (2),
231-244.
MEHOS-AE-5-pict.doc 16 of 40
O’Conner, J. S., Shewchuk, M. R., Carney, W. L., 1994. The great gap: Physicians’ perceptions
of patient service quality expectations fall short of reality. Journal of Health Care Marketing 14
(2), 32-39.
O’Keeffe, M., O’Sullivan, D., 1997. Service quality in the Irish health service. Total Quality
Management & Business Excellence 8 (5), 293 – 303.
Parasuraman, A., Zeithaml, V. A., Berry, L. L., 1985. A conceptual model of service quality and
its implications for future research. Journal of Marketing 49, 41-50.
Parasuraman, A., Zeithaml, V. A., Berry, L. L., 1988. SERVQUAL: A multiple item scale for
measuring customer perceptions of service quality. Journal of Retailing 64, 12-40.
Parasuraman, A., Zeithaml, V. A., Berry, L. L., 1991. Refinement and reassessment of the
SERVQUAL scale. Journal of Retailing 67, 420-450.
Peyrot, M., Cooper, D. P., Schnapf, D., 1993. Consumer satisfaction and perceived quality of
outpatient health services. Journal of Health Care Marketing winter, 24-33.
Puay, C. L., Nelson, K.H. T., 2000. The development of a model for total quality healthcare.
Managing Service Quality 10 (2), 103-111.
Rao, C. P., Jafar, A., 2002. Neural network model for database marketing in the new global
economy. Marketing Intelligence & Planning 20 (1), 35-43.
Rust, R. T., Moorman, C., Dickson R. P., 2002. Getting return on quality: revenue expansion,
cost reduction, or both?. Journal of Marketing 66, 7 – 24.
Rust, R. T., Oliver, R. L., 1994. Service Quality: “Insights and managerial implications from the
frontier, “ in Rust R. T. and Oliver R.L. (Eds), Service Quality: New Directions in Theory and
Practice. Thousand Oaks, CA: Sage Publications, 1 – 19.
Stoeva, S., Nikov, A., 2000. A fuzzy backpropagation algorithm. Fuzzy Sets and Systems 112
(1), 27-39.
Taylor, A. S., Cronin, J. J., 1994. Modeling patient satisfaction and service quality. Journal of
Health Care Marketing 14 (1), 34-44.
Sheng-Hshiung, T., Yi-Chang, C., Chung-Huei, H., 2001. Determinants of guest loyalty to
international tourist hotels – a neural network approach. Tourism Management 1-9.

MEHOS-AE-5-pict.doc 17 of 40
Walbridge W. S., Delene M. L., 1993. Measuring physician attitudes of service quality. Journal
of Health Care Marketing winter, 6-15.
Yavas, U., Donald, J. S., 2001. Modified importance-performance analysis: an application to
hospitals. International Journal of Health Care Quality Assurance 14 (3), 104-110.
Appendix
Checklist (Carman, 2000) about patient’s perception of the service quality of the hospital.
Tangibility
1. Hospital has up to date equipment and technology.
2. Physical facilities in hospital are visually appealing.
3. Bathrooms are very clean in hospital.
4. Rooms of the hospital are very clean.
5. Hospital meals are attractive.
6. Hospital food has right temperature.
7. Nurses of the hospital respect to privacy.
8. Hospital rooms are quiet.
9. Parking in hospital is convenient.
Reliability:
10. Food is delivered by a certain time in hospital.
11. When hospital staff promises to do something by a certain time, they do it.
12. They keep patients' records accurately in hospital.
13. They tell their customer exactly when services will be performed.
Responsiveness:
14. Patients who will be discharged have prompt service from employees of the Hospital for the
discharging operations.
15. Patients are delivered prompt services from nurses when the patient needs to them.
16. Patients who come to hospital get prompt service from employees of hospital for the
admission operation.
17. Employees of hospital are always willing to help their patients.
18. Employees of hospital explain appropriately customer' question about discharging process.

MEHOS-AE-5-pict.doc 18 of 40
19. Employees of hospital explain customer' question appropriately about the any procedure.
20. Treatment is explained to the patient very clearly in hospital.
21. Discharging process is explained to the patients' family.
Assurance
22. Customers trust nurses of hospital.
23. Patients can feel safe in their transactions with hospitals' employees.
Courtesy
24. Hospital employees are polite during admissions procedure.
25. Nurses are cheerful.
26. Hospital visitors are treated well.
Overall HSQ
27. Overall quality of hospital service.

MEHOS-AE-5-pict.doc 19 of 40
Table 1
Complex criteria, their evaluations, and relevant areas and actions

MEHOS-AE-5-pict.doc 20 of 40
Complex criteria Evaluations Areas Actions
Assurance 0.00 Red To be redesigned
Reliability 2.02 Red To be redesigned
Courtesy 3.42 Red To be redesigned
Responsiveness 8.10 Green No need for improvement
Tangibility 10.00 Green No need for improvement

MEHOS-AE-5-pict.doc 21 of 40
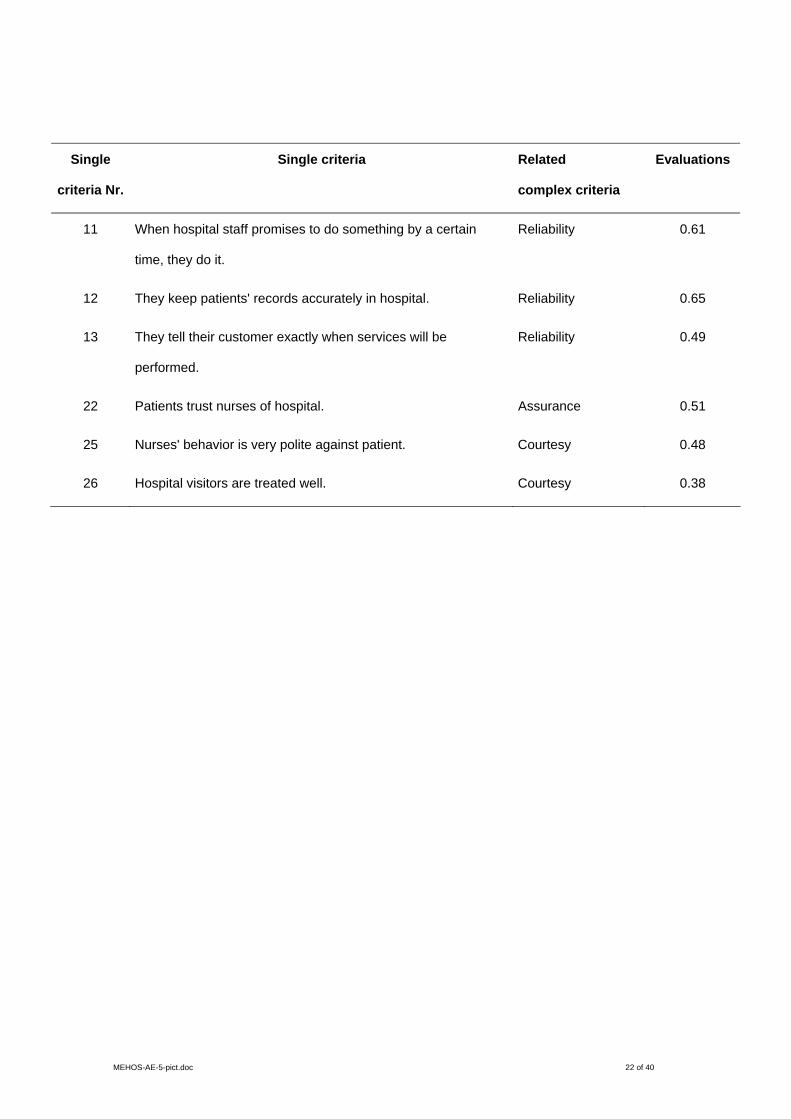
Table 2
Single criteria, relevant complex criteria and evaluations
MEHOS-AE-5-pict.doc 22 of 40
Single
criteria Nr.
Single criteria Related
complex criteria
Evaluations
11 When hospital staff promises to do something by a certain
time, they do it.
Reliability 0.61
12 They keep patients' records accurately in hospital. Reliability 0.65
13 They tell their customer exactly when services will be
performed.
Reliability 0.49
22 Patients trust nurses of hospital. Assurance 0.51
25 Nurses' behavior is very polite against patient. Courtesy 0.48
26 Hospital visitors are treated well. Courtesy 0.38

MEHOS-AE-5-pict.doc 23 of 40
Fig. 1. MEHOS sequence of steps

MEHOS-AE-5-pict.doc 24 of 40

MEHOS-AE-5-pict.doc 25 of 40
Fig. 2. HSQ evaluation criteria

MEHOS-AE-5-pict.doc 26 of 40

MEHOS-AE-5-pict.doc 27 of 40
Fig. 3. HSQ evaluation criteria hierarchy

MEHOS-AE-5-pict.doc 28 of 40

MEHOS-AE-5-pict.doc 29 of 40
Fig.4. Neural network based hierarchy of HSQ evaluation criteria
MEHOS-AE-5-pict.doc 30 of 40

MEHOS-AE-5-pict.doc 31 of 40
Fig.5. Criteria weights learning
MEHOS-AE-5-pict.doc 32 of 40

MEHOS-AE-5-pict.doc 33 of 40
Fig. 6. Membership functions µ k of the fuzzy sets good, satisfying and bad

MEHOS-AE-5-pict.doc 34 of 40
0
1
0 1 2 3 4 5 6 7 8 9 10
badacceptablegood
( )K jl
µk

MEHOS-AE-5-pict.doc 35 of 40
Fig.7. Adaptive generation of improvement/redesign recommendations
MEHOS-AE-5-pict.doc 36 of 40
.

MEHOS-AE-5-pict.doc 37 of 40
Fig.8. Comparison of evaluation methods

MEHOS-AE-5-pict.doc 38 of 40
00,20,40,60,8
11,21,41,61,8
2
1sttraining
sample n=110
1st testsample
n=29
2ndtraining
sample n=100
2nd testsample
n=39
Categorical regressionOrdered regressionMEHOS

MEHOS-AE-5-pict.doc 39 of 40
Fig. 9. Global HSQ index before and after HSQ improvements

MEHOS-AE-5-pict.doc 40 of 40
7,48
4,97
0 1 2 3 4 5 6 7 8 9 10
initial HSQ index
improved HSQ index
global HSQ index