Megacities: Emissions, urban, regional and Global ...megapoli.dmi.dk/nlet/MEGAPOLI_NewsLet10.pdf ·...
10
NewsLetters of the FP7 EC MEGAPOLI Project 1 Issue 10, March 2011 Content 1 Editorial, Latest News 2 EU and Megacities Baseline Scenarios 3 EU Emission Data with Nested Megacity Emissions 4 Paris – Revised Building- Block Heights 5 Evaluation Methodologies for Exposure Analysis 6 Developments in Source Apportionment Modelling 7 Exposure Maps for Selected Megacities 8 Framework for Integrating Modelling Tools 9 Influence of Vilnius Urban Area on Meteorology 10 MEGAPOLI Project Office Coming Presentations, Publications, Conferences Latest News Coming soon – workshop on "Planetary Boundary Layer (PBL): Science, Education and Urban Applications" organized by the FP7 EU MEGAPOLI, Russian MEGAPOLIS, EU TEMPUS and FP7 EU PBL-PMES projects (30 Apr - 3 May 2011; Dubrovnik, Croatia) Coming soon – special MEGAPOLI, CityZen, MILAGRO session “Megacities: Air Quality and Climate Impacts from Local to Global Scales” and Splinter Meeting with sister FP7 EC CityZen project at the EGU-2011 General Assembly (3-8 Apr 2011; Vienna, Austria) 21 Feb 2011 – starting submission of MEGAPOLI related papers to 2 special issues of the Atmospheric Chemistry and Physics (ACP) Journal 5 Feb 2011 – MEGAPOLI project presented by the European Commission DG Science for Environment Policy, News Alert Issue 227, Feb 2011 23-27 Jan 2011 – MEGAPOLI project presented (invited talk) at the AMS 91st Annual Meeting (Seattle, USA) and working meetings with MEGAPOLI US collaborators 13 Jan 2011 – 6 th MEGAPOLI WP Leaders telephone conference Dec 2010 – Second Year MEGAPOLI Dissemination Report is publicly available Welcome to the 10th issue of the Newsletter Editorial The MEGAPOLI consortium is pleased to present the 10th issue of the MEGAPOLI Newsletter. Short contributions from Partners and Collaborators, as well as Research Teams introductions are given here. Details on the project progress can be found in public documents available at the project website (www.megapoli.info ). The purpose of the newsletters is to inform about activities, progress, and achievements of the MEGAPOLI project as well as to establish a dynamic communication link with the Partners, Collaborators, and Users Community, to monitor the project activities and to exchange input and experiences. For these reasons your contributions to newsletters and news at the web-site as well as comments are always welcome (send to [email protected]). March 2011 Issue: 10 M egacities: E missions, urban, regional and G lobal A tmospheric POL lution and climate effects, and I ntegrated tools for assessment and mitigation MEGAPOLI project presented by the European Commission DG Science for Environment Policy, News Alert Issue 227; Source: http://ec.europa.eu/environment/integration/research/newsalert/pdf/227na2.pdf “The project is organised into several WPs in which there have been the following developments: • The project has integrated emission inventories from local administrations into larger datasets. This has built connections between existing information and bridges between the air quality and climate change research communities. • Researchers have developed a classification of megacity features, such as land use, and features of the atmosphere above the city. • Using measurements from Paris, the project has characterised different aerosols (tiny airborne particles) and their behaviour above megacities. Results indicate that a large cloud of pollution is still well-defined more than 100km from its source in Paris, providing a spatial framework for future study of aerosols. • New methods have been developed to model local and urban scale impacts of megacity emissions on air quality and on the feedback loops between air quality and climate change. The results indicate that urban aerosols affect several weather conditions, such as temperature and rainfall. • Progress has been made in developing modelling tools at the continental and global scale and findings indicate that megacities contribute about 2 to 5 % to total global fluxes of emissions caused by humans. • Finally, the results of modelling are being used to estimate the financial impact of megacity emissions on human health, ecosystems and climate change. Using this information, various mitigation options will be evaluated.” Theme FP7-ENV-2007.1.1.2.1: Megacities and regional hot-spots air quality and climate MEGAPOLI-NL10-11-03 Annual NO 2 exposure (ug·s/m 3 ) for the Greater London area, year 2001 (Del 4.5) Concentration difference map for average PM 10 (ug/m 3 ) for the Paris metropolitan area between baseline and zero-traffic emission cases, 13-15 Jul 2009 (Del 4.6)
Transcript of Megacities: Emissions, urban, regional and Global ...megapoli.dmi.dk/nlet/MEGAPOLI_NewsLet10.pdf ·...
NewsLetters of the FP7 EC MEGAPOLI Project
1 Issue 10, March 2011
Content
1 Editorial, Latest News
2 EU and Megacities Baseline Scenarios
3 EU Emission Data with Nested Megacity Emissions
4 Paris – Revised Building-Block Heights
5 Evaluation Methodologies for Exposure Analysis
6 Developments in Source Apportionment Modelling
7 Exposure Maps for Selected Megacities
8 Framework for Integrating Modelling Tools
9 Influence of Vilnius Urban Area on Meteorology
10 MEGAPOLI Project Office Coming Presentations, Publications, Conferences
Latest News Coming soon – workshop on "Planetary Boundary Layer (PBL): Science, Education and
Urban Applications" organized by the FP7 EU MEGAPOLI, Russian MEGAPOLIS, EU TEMPUS and FP7 EU PBL-PMES projects (30 Apr - 3 May 2011; Dubrovnik, Croatia)
Coming soon – special MEGAPOLI, CityZen, MILAGRO session “Megacities: Air Quality and Climate Impacts from Local to Global Scales” and Splinter Meeting with sister FP7 EC CityZen project at the EGU-2011 General Assembly (3-8 Apr 2011; Vienna, Austria)
21 Feb 2011 – starting submission of MEGAPOLI related papers to 2 special issues of the Atmospheric Chemistry and Physics (ACP) Journal
5 Feb 2011 – MEGAPOLI project presented by the European Commission DG Science for Environment Policy, News Alert Issue 227, Feb 2011
23-27 Jan 2011 – MEGAPOLI project presented (invited talk) at the AMS 91st Annual Meeting (Seattle, USA) and working meetings with MEGAPOLI US collaborators
13 Jan 2011 – 6th MEGAPOLI WP Leaders telephone conference
Dec 2010 – Second Year MEGAPOLI Dissemination Report is publicly available
Welcome to the 10th issue of the Newsletter
Editorial
The MEGAPOLI consortium is pleased to present the 10th issue of the MEGAPOLI Newsletter. Short contributions from Partners and Collaborators, as well as Research Teams introductions are given here. Details on the project progress can be found in public documents available at the project website (www.megapoli.info). The purpose of the newsletters is to inform about activities, progress, and achievements of the MEGAPOLI project as well as to establish a dynamic communication link with the Partners, Collaborators, and Users Community, to monitor the project activities and to exchange input and experiences. For these reasons your contributions to newsletters and news at the web-site as well as comments are always welcome (send to [email protected]).
March 2011 Issue: 10
Megacities: Emissions, urban, regional and Global Atmospheric POLlution and climate effects, and Integrated tools for assessment and mitigation
MEGAPOLI project presented by the European Commission DG Science for Environment Policy, News Alert Issue 227; Source: http://ec.europa.eu/environment/integration/research/newsalert/pdf/227na2.pdf
“The project is organised into several WPs in which there have been the following developments: • The project has integrated emission inventories from local administrations into larger datasets. This has
built connections between existing information and bridges between the air quality and climate change research communities.
• Researchers have developed a classification of megacity features, such as land use, and features of the atmosphere above the city.
• Using measurements from Paris, the project has characterised different aerosols (tiny airborne particles) and their behaviour above megacities. Results indicate that a large cloud of pollution is still well-defined more than 100km from its source in Paris, providing a spatial framework for future study of aerosols.
• New methods have been developed to model local and urban scale impacts of megacity emissions on air quality and on the feedback loops between air quality and climate change. The results indicate that urban aerosols affect several weather conditions, such as temperature and rainfall.
• Progress has been made in developing modelling tools at the continental and global scale and findings indicate that megacities contribute about 2 to 5 % to total global fluxes of emissions caused by humans.
• Finally, the results of modelling are being used to estimate the financial impact of megacity emissions on human health, ecosystems and climate change. Using this information, various mitigation options will be evaluated.”
Theme FP7-ENV-2007.1.1.2.1: Megacities and regional hot-spots air quality and climate
MEGAPOLI-NL10-11-03
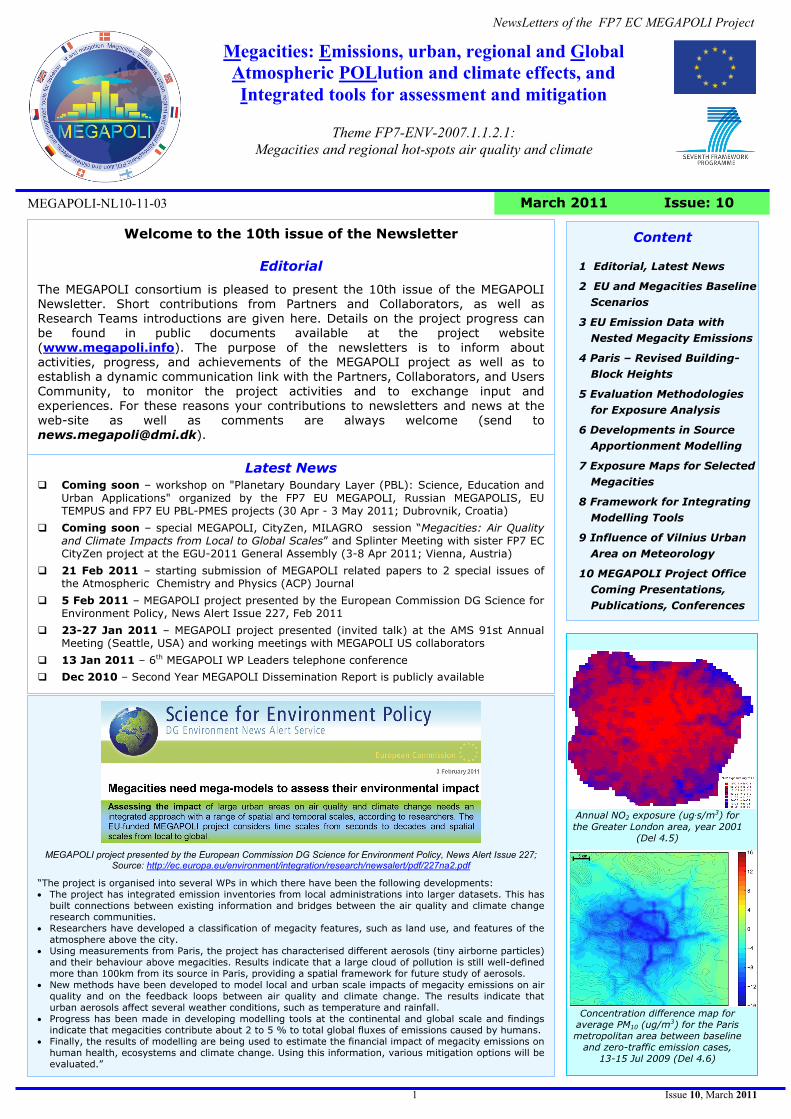
Annual NO2 exposure (ug·s/m3) for the Greater London area, year 2001
(Del 4.5)
Concentration difference map for average PM10 (ug/m3) for the Paris metropolitan area between baseline
and zero-traffic emission cases, 13-15 Jul 2009 (Del 4.6)

NewsLetters of the FP7 EC MEGAPOLI Project
2 Issue 10, March 2011
comparison to 1990 GHG emissions has been assumed. That means we assumed a moderate climate policy, which give options of applying further mitigation strategies. The model-intrinsic policies have mainly impacts on the activities (e.g. fuel use) in our model. The assumptions include the use of more air conditioning, which means an increase in electricity demand. They do not explicitly estimate a reduced energy demand for heating (room heating and water heating), although the demand for heating is decreasing in our data due to improved insulation. We however estimate that the effect would be small and partly or fully compensated by the rebound effect (increase of required indoor temperature). The emission factors are based on assumptions from several sector specific data bases and models (TREMOVE, GAINS) and own assumptions. The development of the emission factors is mainly driven by technical developments and air quality policies. The emission factors for 2050 have been mainly projected from 2030 to 2050 assuming them as constant or taking into account a technological or/and efficiency development.
Results In Figure 2 the future development of NOx emissions from 2005 to 2050 in Europe is shown. The main reduction of NOx emissions are expected between 2005 and 2020 due to current legislation (e.g. Euro 5 / 6) in the transport sector. After 2020 emissions will increase slightly due to assumed growing activities.
Figure 2: Development of the European NOx emissions in the
European baseline scenario Megacities specific scenarios
A survey about the availability of megacity specific scenario information has been conducted in the four 1st level MC. It showed that assumptions about the development of future emissions until 2050 are only available for London (Williams, 2007). For the Po valley emission projections until 2020 exist on base of the GAINS-Italy model (http://www.pbl.nl/images/RAINS_ Italy_Project tcm 60-21207.pdf). Thus, the emission scenarios for future years for the 1st level MC have been generated by downscaling the emissions to the city areas from the European data base. References
Blesl M., T. Kober, D. Bruchof, R. Kuder (2010): Effects of climate and energy policy related measures and targets on the future structure of the European energy system in 2020 and beyond. Energy Policy, 38, 6278-6292.
Williams M.L. (2007): UK air quality in 2050-synergies with climate change policies. Environmental Science and Policy, 10 (2), pp. 169-175.
European and Megacity Baseline Scenarios for 2020, 2030 and 2050
(MEGAPOLI Del 1.3)
Jochen Theloke1, Markus Blesl1, Tatjana Kampffmeyer1, Konstantin Schenk1, Susanne Wagner1, Ulrike Kugler1, Rainer Friedrich1, Hugo Denier
van der Gon2, Dick van den Hout2 1 USTUTT, Institute of Energy Economics and Rational Use of Energy
(IER), Stuttgart, Germany 2 TNO, Environment Health and Society, Utrecht, The Netherlands
Introduction The development of a baseline emission scenario is a crucial basis for the assessment of mitigation and policy options to efficiently reduce health effects and climate change impacts caused by releases of substances to air in megacities. The aim of Work Package 1.3 is therefore to provide a baseline scenario for Europe and the MegaCities (MC) for the years 2020, 2030, and 2050. Scenarios have been provided for air pollutants (CO, NH3, NMVOC, NOx, PM10, PM2.5 and SO2) and greenhouse gases, GHG (CO2, CH4 and N2O).
Methodology The scenarios have been compiled on base of a consistent European Energy model, which models the development of energy related sectors. In addition the development of non-energy related sectors has been assessed on base of the GAINS model (http://gains.iiasa.ac.at) and other assumptions. The demand of energy was determined by application of the Pan-European TIMES energy system model (Blesl et al., 2010). The Pan-European TIMES energy system model (short TIMES PanEU) is an energy model of 30 regions which contains all countries of EU-27 as well as Switzerland, Norway and Iceland. The model covers on a country level all sectors connected to the energy supply and demand, for example the supply of resources, the public and industrial generation of electricity and heat and the industrial, commercial, household and transport sectors. Figure 1 shows the development of the total final energy consumption for EU-30 in the baseline scenario from the TIMES-Energy Model.
0
10000
20000
30000
40000
50000
60000
Total final energy consumption [PJ]
Others (Methanol,Hydrogen)
Waste
Renewables
Heat
Electricity
Gas
Petroleum products
Coal
Figure 1: Final energy Consumption in EU 27 + Norway + Switzerland.
A climate policy for the European countries with a mitigation of GHG gases of about 50% until 2050 in
Jochen Theloke
E-mail: [email protected] USTUTT, Institute of Energy Economics and Rational Use of Energy (IER), Stuttgart, Germany

NewsLetters of the FP7 EC MEGAPOLI Project
3 Issue 10, March 2011
Table 1: Ratio of the MC emission from the Regional European scale inventory over the local MC emission inventory.
NOx PM10 PM2.5 NH3 SO2NMVOC CO
London 1.6 3.9 na na 9.4 1.5 3.6
Paris 1.1 3.0 3.2 2.2 1.9 1.9 4.1
Rhine Ruhr 0.9 1.6 1.2 1.6 1.1 2.4 0.7
Po Valley 0.9 0.9 na 1.0 1.2 0.8 1.4na = not available
Since the MC domains were accurately defined (see MEGAPOLI NewsLetter N4) we can “cut-out” the MC emission from the regional inventory and compare them to the local MC emission estimates (Tab.1). The differences can be quite dramatic. The discrepancy for NOx is limited but not for uncertain pollutants like PM, NMVOC and CO. For example, the PM10 emission allocated to London or Paris by the down-scaled regional inventory is a factor 3-4 higher than the local inventories. The smaller the domain, the larger the discrepancies are. The 10 fold overestimating of SO2 emission from London (Tab.1) was due to uncertainties of the exact location of some point sources. Such misplacements can be understood and repaired but some more complex discrepancies need further study.
Figure 1: The AirParif inventory for Ile-de-France (including Paris)
nested in the TNO 2005 emission inventory (example emission density of NOx).
Conclusions The unique emission data base was made. It consists of a regional scale emission grid (~ 7 x 7 km) with nested higher resolution MC inventories (Fig.2). The European scale inventory is consistent with official reported national emissions but local-national-regional scale inventories were not consistent. In general, the megacity inventories have more detailed local information and a cause of discrepancy is the spatial distribution of emissions in the down-scaled regional inventory. Since the discrepancies are large, especially for an important pollutant like PM10, the predicted concentrations and population exposure may be significantly different when using a local EI. Modelling combined with observational data may help to validate the emission estimates, confirm distribution patterns and/or identify gaps in emission inventories.
Acknowledgements We thank the local Megacity Emission inventory authorities in Paris (Airparif), London, Rhine-Ruhr and Po Valley for their cooperation.
References Kuenen J., H. Denier van der Gon, A. Visschedijk, H. van der Brugh, S. Finardi, P.
Radice, A. d’Allura, S. Beevers, J. Theloke, M. Uz-basich, C. Honoré, O. Perrussel (2010): A Base Year (2005) MEGAPOLI European Gridded Emission Inventory (Final Version). Deliverable D1.6, MEGAPOLI Scientific Report 10-17, MEGAPOLI-20-REP-2010-10, 39p, ISBN: 978-87-993898-8-9 http://megapoli.dmi.dk/publ/MEGAPOLI_sr10-17.pdf
European Emission Data with Nested Megacity Emissions
(MEGAPOLI Del 1.6)
Hugo Denier van der Gon1, Sean Beevers3, Alessio D’Allura2, Sandro Finardi2, Cécile Honoré5, Jeroen Kuenen1, Olivier Perrussel5, Paola Radice2, Jochen Theloke4, Melinda Uzbasich4, Antoon Visschedijk1
1 TNO, Environment Health and Safety, Utrecht, The Netherlands 2 Arianet, Milano, Italia
3 King's College London, London, United Kingdom. 4 University Stuttgart, IER, Stuttgart, Germany
5 AirParif, Paris, France
The first critical step in improving our understanding of how megacities impact air quality, atmospheric composition and climate on different scales is the development of high-quality emission inventories (EI) of relevant gases and aerosols and their precursors. The generation of a European EI with nested high resolution EIs for selected European megacities is one of the main deliverables of MEGAPOLI WorkPackage 1. In the first year of MEGAPOLI the focus was on preparing gridded emission maps for the base year 2005. This “default” base year EI was delivered to project partners in 2009. The next step was nesting local high resolution inventories in the European emission inventory in a consistent way (Fig.1).
Figure 1: Gridded PM10 emissions (ton/year) for TNO European (a) and Po Valley high resolution (c) emission inventories. High/low resolution emission scales are different to match emission flux intensity. Note the
difference in emission intensity for Milan (red boundaries).
Comparison of the down-scaled and bottom-up inventories MEGAPOLI has a pyramidal structure of megacities in focus. The 1st level cities have a MEGAPOLI WP1 partner as counterpart: Paris (CNRS), London (KCL), Rhine-Ruhr (IER) and Po Valley (ARIANET).
Hugo Denier van der Gon
E-mail: [email protected] TNO, Environment Health and Safety, Utrecht, The Netherlands http://www.tno.nl/emissions

NewsLetters of the FP7 EC MEGAPOLI Project
4 Issue 10, March 2011
Method The block heights are retrieved using a multi-baseline approach based on an algorithm for automatic Digital Elevation Model(DEM) reconstruction (Ferretti et al., 1997). The height of each pixel in a single complex interferogram is considered as arandom variable. Using the information from multipleobservations at different perpendicular baselines, for each pixela Probability Density Function (PDF) for the height can becomputed from interferometric phase difference and coherence.Mean and standard deviation of this PDF give the estimatedheight value of the pixel and an estimate for the reliability ofthe result. Both a height map and a height error map for theParis region of interest were obtained.
Results A Digital Surface Map of central Paris, providing the roof-top height, has been generated. The height map in slant rangecoordinates is shown in Figure 1. Some errors in low coherenceareas are visible, which still need to be masked out. Thecorresponding height error is presented in Figure 2. Thestandard deviation of the height PDF does not exceed 1 m,which yields a height error of less than 2 m with 95%confidence interval, in most of the central Paris area. The unwrapped phase image was transformed from slant-range to ground-range coordinates and re-projected into UTM geo-coordinates (as seen in Figure 3).
Figure 3: (top) Paris urban area (extracted from MS Virtual Earth) and
(bottom) Paris height projected to UTM geo-coordinates.
Conclusion In this study, good and reliable estimates for the roof-top elevation of most building-blocks in the Paris urban area were obtained. In a case of very tall blocks no elevation is found dueto the effect of multiple phase wraps and strong layover. Toobtain the block heights over ground a Digital Terrain Map(DTM) needs to be subtracted. Generation of a DTM from thesame data by finding scatterers at street level will be the nextstep in the on-going study.
References Luckman A. and Grey W. 2003: Urban block Height Variance From
Multibaseline ERS Coherence. IEEE Transactions on Geoscience andRemote Sensing, September 2009, Vol. 41, No 9.
Rosich B. 2002: ASAR IMS & WVI products quality (VV polarisation). Proceedings of the Envisat Calibration Review, November 2002, Special Publication SP-520.
Ferretti A., Prati C., Rocca F. and Monti Guarnieri A. 1997: Multibaseline SAR Interferometry for Automatic DEM Reconstruction.http://earth.esa.int/workshops/ers97/papers/ferretti/123c.htm#MARKER-9-7
Paris Urban Area – Revised Building-Blocks Height
(MEGAPOLI Del 2.1)
Tack A.1, Koskinen J. 1, Hellsten A. 2
1 – SAR Interferometry, Finish Meteorological Institute 2 – Air quality Modeling, Finish Meteorological Institute
The multi-baseline coherence method (Luckman and Grey, 2003) used to generate a previous version of the building-block height layer in the morphological database for the Paris metropolitan area was based on assumptions that do not fully hold for surface scattering caused by urban topography. Generation of a revised version of the database using radar interferometry is currently on-going. Images produced by the Advanced Synthetic Aperture Radar (ASAR) on environmental satellite ENVISAT are used for this study.
Instrument The ASAR is a C-band Synthetic Aperture Radar (SAR). In Image Mode (IM), the ASAR provides images in single polarisation (VV or HH) at multiple incidence angles (from IS1 to IS7). Coverage ranges from 100 km (IS1) to 56 km (IS7) at an azimuth resolution from 4 to 5 meters and a range resolution from 9 to 18 meters (Rosich, 2002).
Data In this study, the Single Look Complex (SLC) IS2 images are used. 13 images of the Paris urban area were available for this study. Using the InSAR processor DORIS, developed by the Delft University of Technology, 27 complex interferograms with perpendicular baselines ranging from 8 to 337 meters were generated. For each interferogram phase difference and coherence were computed. Observations were taken in the period from 16 December 2006 to 29 May 2010.
Figure 1: Digital Surface Map of the Paris central area.
Figure 2: Standard deviation map of the height estimate.
Andreas Tack E-mail: [email protected] Finish Meteorological Institute, Air Quality Unit http://www.fmi.fi

NewsLetters of the FP7 EC MEGAPOLI Project
5 Issue 10, March 2011
Figure 1: Correction factor for total exposures for PM2.5 at the
Helsinki Metropolitan Area as function of effective grid resolution (m).
i. traffic exposure is the most sensitive component, and the maximum correction factor for PM2.5
exposures was found out to be 10%; ii. total exposure the correction factor was ~4 %.
This lower sensitivity to resolution can be explained by the negative correlation of home locations and high-concentration areas, which counters the effect of stronger and opposite resolution dependence of traffic exposure;
iii. PM2.5 exposures are expected to be much less sensitive to resolution changes, as the spatially smoothly distributed PM2.5 background concentrations dominate the exposures;
iv. temporal resolution can also have a major effect on the relative contributions
The results of the small scale exposure modeling studies seem to be very much in line with the large scale correction factor analyses, although the small scale studies are based on one specific city area and one specific pollutant, and it is to be expected that in other cities and for other pollutants the exact values for correction factors may differ from this case study. However, we have demonstrated here a simple method for estimating these resolution effects in smaller scales, which can be readily utilized in any city and for every pollutant.
The methodology described and implemented here accounts for the SGV of concentrations and their spatial correlation with population distribution. This enables improved estimates of the population weighted concentrations, which are used in long term health impact studies. The potential of the method is that large grid sizes, i.e. low resolution models, can be used for fast multiple scenario or sensitivity calculations whilst retaining their ability to calculate population exposure. The only requirement in regard to input data to the parameterisation is that emission data must be available at a suitably high resolution. Since the parameterisation includes the emission population covariance any changes in emission, or population, distributions in future scenarios will be implicitly included in the parameterisation.
References Karvosenoja, Niko, Leena Kangas, Kaarle Kupiainen, Jaakko Kukkonen,
Ari Karppinen, Mikhail Sofiev, Marko Tainio, Ville-Veikko Paunu, Pauliina Ahtoniemi, Jouni T. Tuomisto, Petri Porvari, (2010): Integrated modeling assessments of the population exposure in Finland to primary PM2.5 from traffic and domestic wood combustion on the resolutions of 1 and 10 km. Air Qual. Atmos. Health. DOI 10.1007/s11869-010-0100-9.
Karppinen A., Kangas L., Riikonen K., Kukkonen J., Soares J., Denby B., Cassiani M., Finardi S., Radice P., (2010): Evaluation of Methodologies for Exposure Analysis in Urban Areas and Application to Selected Megacities. Deliverable D4.4, MEGAPOLI Scientific Report 10-18, MEGAPOLI-21-REP-2010-11, 29p.
Evaluation of Methodologies for Exposure Analysis in Urban Areas and
Application to Selected Megacities (MEGAPOLI Del 4.4)
Denby B. 2, Kangas L.1, Karppinen A. 1, Kukkonen K. 1, Finardi S.3, Cassiani M. 3, Radice P. 3
1 – Finnish Meteorological Institute 2 – Norwegian Institute for Air Research
3- National Agency for New Technologies, Energy and Sustainable Economic Development
Any modeling analysis has a number of limitations and uncertainties. An example of these limitations is the resolution inadequacy of the modelled air concentrations. A study has been carried out to quantify the effect of sub-grid variability (SGV) of concentrations and population on exposure. The discretized population weighted concentration (Cpw,j) over any defined area Aj
for a given period of time can be written as (Karppinen et al., 2010):
( ) )1(1 ,, jCPjjpw COVCC += Where: Cj is mean concentration for each grid square j
and COVcp,j is the correction factor. COVcp,j was assessed and parameterised based on empirical data, applying spatial statistical methods. The method was applied to nitrogen dioxide (NO2), coarse particulate matter (PM10) and the ozone (O3) indicator SOMO35 using data from the year 2006. The SGV and its impact on European scale indicate that significant errors in the population weighted concentrations can occur due to the use of finite grid sizes: i. NO2 COVcp,j is more strongly dependent on grid
resolution than is the PM10 factor. This is due to the relatively high correlation between NO2 concentrations and population density;
ii. PM10 COVcp,j shows a weak dependence on grid resolution. This is due to the spatial homogeneity of PM10 concentrations;
iii. SOMO35 shows a negative correlation, likely due to NOx titration in urban areas, and as such O3 exposure estimates will be overestimated by 15% when finite grids of 50 km or more are used.
Karvosenoja et al. (2010) assessed population exposure caused by the emissions of primary fine particulate matter (PM2.5) originated from road traffic and domestic wood combustion in Finland in 2000 and 2020.Their general implication was that the exposure values evaluated using integrated assessment models can be sensitive to the methodology, especially these can substantially increase with an increasing spatial resolution. This study led us to conclude that:
Table 1: The relative change in exposures calculated using hourly vs. daily temporal resolution, by cross-correlating concentrations measured
at downtown locations and activities.
work home traffic Centre 17 % -8 % 12 % Traffic/bg 10 % -6 % 17 % Residential -6 % 0 9 %
Joana Soares E-mail: [email protected] Finnish Meteorological Institute Air Quality Division http://www.fmi.fi

NewsLetters of the FP7 EC MEGAPOLI Project
6 Issue 10, March 2011
Figure 2. NMF factor loadings obtained from concentration time-series calculated for the Aubervillers station using the full-emissions (left) and
zero-traffic (right) scenarios.
During May 2008, the model predicted a relatively flat average diurnal profile in London, Athens, Po Valley and Ruhr area, and a strong diurnal variation of OA concentrations in Paris. The predicted source contributions to OA in Paris showed a strong diurnal variation of fresh POA with increases during the rush hours and relatively flat profiles for the other OA components. During the winter period a more distinct diurnal variation was predicted in most of the cities following the diurnal variation of emission rates mainly due to combustion. The second part of the investigation has focused on exploring and improving upon existing receptor modelling methodologies, which are essentially based on statistical evaluations of ambient concentration measurements at different times and locations. As established practice, Chemical Mass Balance (CMB) models are applied when emission sources are known and detailed information on source profiles is available, whereas in case the sources are unknown or information on source profiles is limited, the Principal Component Analysis (PCA), Positive Matrix Factorisation (PMF) or Nonnegative Matrix Factorisation (NMF) methods are usually preferred. A known limitation of receptor modelling techniques is the difficulty in identifying the resulting factors and loadings with specific source types. The proposed method aims to deal with this issue by supplementing the factor analysis of measurements with results of dispersion simulations. Concentration fields calculated using variable emissions source strengths (Figure 1) were analysed in parallel with measurements providing a more accurate identification of factor contributions and enabling their interpretation as specific source types. The approach was tested using a zero-out method for traffic emissions in the Paris metropolitan area where the relative contributions of the two principal factors (leftmost bars in Figure 2), identified as traffic and secondary pollutant emissions, respectively, was accurately determined. A key benefit of the use of this approach is that it can be applied with a limited computational cost as the runs required for a successful interpretation need only cover limited time periods. Further validation will be required to investigate the suitability of the approach in the analysis of diverse measurement datasets in conjunction with different model configurations.
References Karydis, V. A., Tsimpidi, A. P., Fountoukis, C., Nenes A., Zavala, M., Lei,
W., Molina, L. T. and Pandis, S. N., 2010: Simulating the fine and coarse inorganic particulate matter concentrations in a polluted megacity. Atmospheric Environment, 44, 608-620.
Moussiopoulos N., Douros J., Tsegas G. (Eds), 2010: Evaluation of Source Apportionment Methods. Deliverable D4.6, MEGAPOLI Scientific Report 10-22, MEGAPOLI-25-REP-2010-12, 54p, ISBN: 978-87-92731-03-6
Developments in Source Apportionment Modelling
(MEGAPOLI Del 4.6)
Moussiopoulos N.1, Tsegas G.1, Douros I.1, Pandis S.2, Fountoukis C.2
1 Aristotle University Thessaloniki (AUTH), Laboratory of Heat Transfer
and Environmental Engineering, Thessaloniki, Greece 2 Institute of Chemical Engineering and High Temperature Chemical Processes (ICE-HT), Foundation for Research and Technology Hellas
(FORTH), Patras, Greece
An efficient air quality management policy should aim to ensure that legal pollution limits are not exceeded and that the economical and social costs of poor air quality are controlled and minimised. A prerequisite for the successful application of mitigation measures and the development of efficient pollution abatement strategies is the accurate identification of pollution sources and of their individual contributions to ambient pollutant concentrations. As part of the MEGAPOLI WP4 activities, project partners have been involved in Task 4.4 on source apportionment and the identification and quantification of relevant source contributions. Several modelling methodologies have been reviewed and tested in the apportionment of ambient pollutants, including receptor-based models, methods based on advanced chemical dispersion modelling, as well as a combination of both. In addition, a comprehensive review of source apportionment modelling methodologies as used in the EU member states has led to an assessment of current state-of-play regarding source apportionment efforts as well as the emerging trends and shortcomings in current research, with the aim of suggesting possible courses towards the general objectives set out by the task. The first part of the survey involved the application by the FORTH team of the latest version of PMCAMx, a detailed chemical transport model (CTM), introducing a state-of-the-art organic aerosol (OA) module based on the volatility basis set framework which treats both primary and secondary organic components as semivolatile and photochemically reactive. PMCAMx-2008 was applied to simulations of mass concentration and chemical composition of particulate matter (PM) during the periods of May 2008 and February-March 2009 (Karydis et al, 2010). The model revealed that much of the traditionally thought as primary OA (POA) emissions is actually evaporating to produce low-volatility organic vapours which are the source (through photochemical aging) of a substantial amount of oxygenated OA. PMCAMx results were used further to explore the predicted contributions of various sources to total organic aerosol concentrations at specific cities.
Figure 1. Difference map for O3 concentrations in the Paris metropolitan area, calculated with baseline and the zeroed out traffic emissions.
Nicolas Moussiopoulos E-mail: [email protected] Aristotle University Thessaloniki (AUTH), Laboratory of Heat Transfer and Environmental Engineering, Greece http://lhtee.meng.auth.gr
NewsLetters of the FP7 EC MEGAPOLI Project
7 Issue 10, March 2011
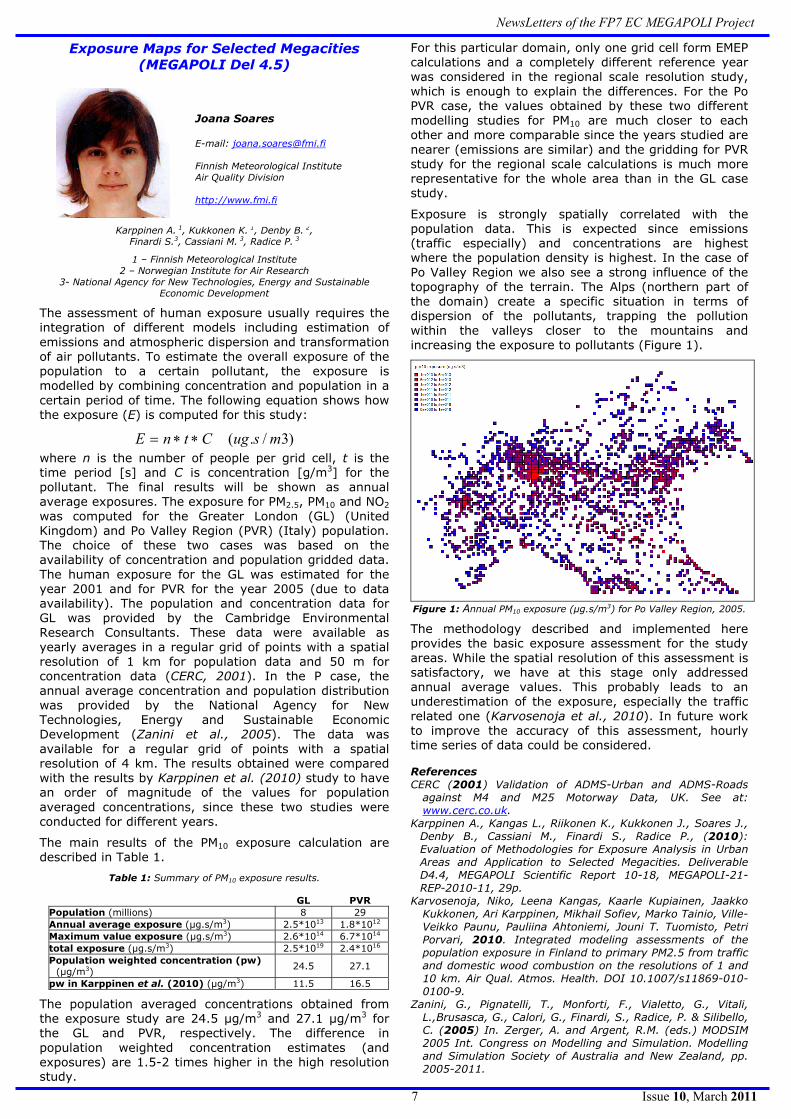
For this particular domain, only one grid cell form EMEP calculations and a completely different reference year was considered in the regional scale resolution study, which is enough to explain the differences. For the Po PVR case, the values obtained by these two different modelling studies for PM10 are much closer to each other and more comparable since the years studied are nearer (emissions are similar) and the gridding for PVR study for the regional scale calculations is much more representative for the whole area than in the GL case study.
Exposure is strongly spatially correlated with the population data. This is expected since emissions (traffic especially) and concentrations are highest where the population density is highest. In the case of Po Valley Region we also see a strong influence of the topography of the terrain. The Alps (northern part of the domain) create a specific situation in terms of dispersion of the pollutants, trapping the pollution within the valleys closer to the mountains and increasing the exposure to pollutants (Figure 1).
Figure 1: Annual PM10 exposure (µg.s/m3) for Po Valley Region, 2005.
The methodology described and implemented here provides the basic exposure assessment for the study areas. While the spatial resolution of this assessment is satisfactory, we have at this stage only addressed annual average values. This probably leads to an underestimation of the exposure, especially the traffic related one (Karvosenoja et al., 2010). In future work to improve the accuracy of this assessment, hourly time series of data could be considered. References CERC (2001) Validation of ADMS-Urban and ADMS-Roads
against M4 and M25 Motorway Data, UK. See at: www.cerc.co.uk.
Karppinen A., Kangas L., Riikonen K., Kukkonen J., Soares J., Denby B., Cassiani M., Finardi S., Radice P., (2010): Evaluation of Methodologies for Exposure Analysis in Urban Areas and Application to Selected Megacities. Deliverable D4.4, MEGAPOLI Scientific Report 10-18, MEGAPOLI-21-REP-2010-11, 29p.
Karvosenoja, Niko, Leena Kangas, Kaarle Kupiainen, Jaakko Kukkonen, Ari Karppinen, Mikhail Sofiev, Marko Tainio, Ville-Veikko Paunu, Pauliina Ahtoniemi, Jouni T. Tuomisto, Petri Porvari, 2010. Integrated modeling assessments of the population exposure in Finland to primary PM2.5 from traffic and domestic wood combustion on the resolutions of 1 and 10 km. Air Qual. Atmos. Health. DOI 10.1007/s11869-010-0100-9.
Zanini, G., Pignatelli, T., Monforti, F., Vialetto, G., Vitali, L.,Brusasca, G., Calori, G., Finardi, S., Radice, P. & Silibello, C. (2005) In. Zerger, A. and Argent, R.M. (eds.) MODSIM 2005 Int. Congress on Modelling and Simulation. Modelling and Simulation Society of Australia and New Zealand, pp. 2005-2011.
Exposure Maps for Selected Megacities (MEGAPOLI Del 4.5)
Karppinen A. 1, Kukkonen K. 1, Denby B. 2, Finardi S.3, Cassiani M. 3, Radice P. 3
1 – Finnish Meteorological Institute 2 – Norwegian Institute for Air Research
3- National Agency for New Technologies, Energy and Sustainable Economic Development
The assessment of human exposure usually requires the integration of different models including estimation of emissions and atmospheric dispersion and transformation of air pollutants. To estimate the overall exposure of the population to a certain pollutant, the exposure is modelled by combining concentration and population in a certain period of time. The following equation shows how the exposure (E) is computed for this study:
)3/.( msugCtnE ∗∗= where n is the number of people per grid cell, t is the time period [s] and C is concentration [g/m3] for the pollutant. The final results will be shown as annual average exposures. The exposure for PM2.5, PM10 and NO2 was computed for the Greater London (GL) (United Kingdom) and Po Valley Region (PVR) (Italy) population. The choice of these two cases was based on the availability of concentration and population gridded data. The human exposure for the GL was estimated for the year 2001 and for PVR for the year 2005 (due to data availability). The population and concentration data for GL was provided by the Cambridge Environmental Research Consultants. These data were available as yearly averages in a regular grid of points with a spatial resolution of 1 km for population data and 50 m for concentration data (CERC, 2001). In the P case, the annual average concentration and population distribution was provided by the National Agency for New Technologies, Energy and Sustainable Economic Development (Zanini et al., 2005). The data was available for a regular grid of points with a spatial resolution of 4 km. The results obtained were compared with the results by Karppinen et al. (2010) study to have an order of magnitude of the values for population averaged concentrations, since these two studies were conducted for different years.
The main results of the PM10 exposure calculation are described in Table 1.
Table 1: Summary of PM10 exposure results.
GL PVR Population (millions) 8 29 Annual average exposure (µg.s/m3) 2.5*1013 1.8*1012 Maximum value exposure (µg.s/m3) 2.6*1014 6.7*1014 total exposure (µg.s/m3) 2.5*1019 2.4*1016 Population weighted concentration (pw)
(µg/m3) 24.5 27.1
pw in Karppinen et al. (2010) (µg/m3) 11.5 16.5
The population averaged concentrations obtained from the exposure study are 24.5 µg/m3 and 27.1 µg/m3 for the GL and PVR, respectively. The difference in population weighted concentration estimates (and exposures) are 1.5-2 times higher in the high resolution study.
Joana Soares E-mail: [email protected] Finnish Meteorological Institute Air Quality Division http://www.fmi.fi

NewsLetters of the FP7 EC MEGAPOLI Project
8 Issue 10, March 2011
The following levels of integration and orders of complexity (temporal and spatial scales and ways of integration) are considering: • Level 1 – Spatial: One way (Global -> regional -> urban -> street); Models: All. • Level 2 – Spatial: Two way (Global <=> regional <=> urban); Models: ECHAM5/MESSy, MATCH-MPIC, UM-WRF-CMAQ, SILAM, M-SYS, FARM. • Level 3 – Time integration: Time-scale and direction; Direct and Inverse modelling (Fig. 2). • Order A – off-line, meteorology / emissions -> chemistry; Models: All. • Order B – partly online, meteorology -> chemistry & emission; Models: UKCA, DMAT, M-SYS, UM-WRF-Chem, SILAM. • Order C – fully online, meteorology <=> chemistry & emissions; Models: UKCA, WRF-Chem, Enviro-HIRLAM, ECHAM5/MESSy.
Figure 2: Scheme of environmental risk assessment and mitigation
strategy optimization basing on forward/inverse modelling.
Where required new or improved interfaces for coupling (direct links between emissions, chemistry and meteorology at every time step) are developing. Common formats for data exchange (such as GRIB, netCDF formats) is defined to ease the implementation and to help combine the different models via agreed data exchange protocols. The current chemistry schemes (tropospheric, stratospheric and UTLS) are examined as to their suitability for simulating the impact of complex emissions from megacities. The coupled model systems are applied to different European megacities during the development phases of the project. The framework will be used and demonstrated for selected models including UKCA (MetO), WRF-Chem (UH-CAIR), Enviro-HIRLAM (DMI), STEM/FARM (ARIANET), M-SYS (UHam) and ECHAM5/MESSy on different scales. This part of the work is linked to the requirements and use of simpler tools for assessing air quality impacts within megacities (OSCAR - UH-CAIR, AIRQUIS - NILU, URBIS - TNO). The D7.1 report was realised within the MEGAPOLI WP7 Task 7.2: Formulation and development of an integration framework in a close collaboration with the COST Actions 728 and ES0602. It is also linked with a new COST Action ES1004: European framework for on-line integrated air quality and meteorology modelling (EuMetCHem). References Baklanov A. (Ed.) (2010): Framework for Integrating Tools. Deliverable
D7.1, MEGAPOLI Scientific Report 10-11, MEGAPOLI-14-REP-2010-03, 68p, ISBN: 978-87-993898-4-1.
Baklanov, A. (2010): Chemical Weather Forecasting: A New Concept of Integrated Modelling, Adv. Sci. Res., 4, 23–27.
Baklanov, A., Mahura, A., and Sokhi, R. (Eds.) (2011): Integrated Systems of Meso-Meteorological and Chemical Transport Models, Springer, ISBN:978-3-642-13979-6, 186 p..
Baklanov, A., Lawrence, M., Pandis, S., Mahura, A., Finardi, S., Moussiopoulos, N., Beekmann, M., Laj, P., Gomes, L., Jaffrezo, J.-L., Borbon, A., Coll, I., Gros, V., Sciare, J., Kukkonen, J., Galmarini, S., Giorgi, F., Grimmond, S., Esau, I., Stohl, A., Denby, B., Wagner, T., Butler, T., Baltensperger, U., Builtjes, P., van den Hout, D., van der Gon, H. D., Collins, B., Schluenzen, H., Kulmala, M., Zilitinkevich, S., Sokhi, R., Friedrich, R., Theloke, J., Kummer, U., Jalkinen, L., Halenka, T., Wiedensholer, A., Pyle, J., and Rossow, W. B., (2010): MEGAPOLI: concept of multi-scale modelling of megacity impact on air quality and climate, Adv. Sci. Res., 4, 115-120, doi:10.5194/asr-4-115-2010.
Grell, G. and A. Baklanov (2011): Integrated Modeling for Forecasting Weather and Air Quality: A Call for Fully Coupled Approaches. Atmospheric Environment, doi:10.1016/j.atmosenv.2011.01.017.
Kukkonen, J., Balk, T., Schultz, D. M., Baklanov, A., Klein, T., Miranda, A. I., Monteiro, A., Hirtl, M., Tarvainen, V., Boy, M., Peuch, V.-H., Poupkou, A., Kioutsioukis, I., Finardi, S., Sofiev, M., Sokhi, R., Lehtinen, K., Karatzas, K., San José, R., Astitha, M., Kallos, G., Schaap, M., Reimer, E., Jakobs, H., and Eben, K., (2011): Operational, regional-scale, chemical weather forecasting models in Europe, Atmos. Chem. Phys. Discuss., 11, 5985-6162, doi:10.5194/acpd-11-5985-2011.
Framework for Integrating Modelling Tools (MEGAPOLI Del 7.1)
Processes involving nonlinear interactions and feedbacks between emissions, chemistry and meteorology require coherent and robust approaches using integrated/online methods. This is particularly important where multiple spatial and temporal scales are involved with a complex mixture of pollutants from large sources, as in the case of megacities. The impacts of megacities on the atmospheric environment are tied directly to anthropogenic activities as sources of air pollution. These impacts act on street, urban, regional and global scales. Previously there were only limited attempts to integrate this wide range of scales for regional and global air quality and climate applications. Indeed, progress on scale and process interactions has been limited because of the tendency to focus mainly on issues arising at specific scales. However the interrelating factors between megacities and their impacts on the environment rely on the whole range of scales and thus should be considered within an integrated framework bringing together the treatment of emissions, chemistry and meteorology in a consistent modelling approach. Numerical weather and air pollution prediction models are now able to approach urban-scale resolution, as detailed input data are becoming more often available. As a result the conventional concepts of down- (and up-) scaling for air pollution prediction need revision along the lines of integration of multi-scale meteorological and chemical transport models. MEGAPOLI aims at developing a comprehensive integrated modelling framework usable by the research community which will be tested and implemented for a range of megacities within Europe and across the world to increase our understanding of how large urban areas and other hotspots affect air quality and climate on multiple scales. The integration strategy in MEGAPOLI (Fig. 1) is not focused on any particular meteorological and/or air pollution modelling system. The approach considers an open integrated framework with flexible architecture and with a possibility of incorporating different meteorological and chemical transport models.
Air Quality
Forcing
Climate
Emissions
Local/urban ~1-102 km
Regional ~ 103 km
1 s - 1 hr Days - weeks Years-decades
Global ~104 km
Connections
Processes
Impacts
Mitigation
Feedbacks
Scales
Megacities
Chemical Transformations
Boundary Layer Processes and Chemical
Transformations
Urban Features and Characteristics
Figure 1: Schematic showing the main linkages between megacities, air quality and climate. The connections and processes are the focus of
MEGAPOLI. In addition to the overall connections between megacities, air quality and climate, the figure shows the main feedbacks, ecosystem,
health and weather impact pathways, and mitigation routes which will be investigated in MEGAPOLI. The relevant temporal and spatial scales are
additionally included.
Alexander Baklanov E-mail: [email protected] Danish Meteorological Institute, Research Department, Copenhagen, Denmark http://www.dmi.dk

NewsLetters of the FP7 EC MEGAPOLI Project
9 Issue 10, March 2011
Table 1: Definition of computed experiments.
Case Date Domain Modifications LT1-0129C None LT1-0129I AHF 100W/m2 LT1-0129II
2009 - 01.29 LT1
AHF 200W/m2 LT3-0314C None LT3-0314I AHF 100W/m2 LT3-0314II
2009 - 03.14
AHF 200W/m2 LT3-0623C None LT3-0623I AHF 100W/m2 LT3-0623II
2009 – 06.23
LT3
AHF 200W/m2
Figure 2: Temperature at 2 m difference (vertical axis, °C) between
control and modified runs /solid line – LT3-0314II run and dashed line - LT3-0314I run/.
Figure 3: Wind speed at 10 m difference (vertical axis, m/s) between control and modified runs /solid line – LT3-0623II run and dashed line
- LT3-0623I run/.
Conclusions • The modifications of the surface parameters within the
urban territories, such as the Vilnuis metropolitan area, have impact on formation of meteorological fields that affect air pollution dispersion.
• The temperature at 2 m height is typically higher in urbanized simulation runs.
• The difference in wind speed between two types of runs can be up to 2.7 m/s.
• The impact of urban territories in simulations is of more local scale, i.e. up to 2.8 km from heavily urbanized territories and up to 40 m in height.
• To study the sensitivity of meteorological fields to modifications of every single surface parameter a more detailed study should be carried out. The effect of simultaneously combined modifications can give different feedback (positive/ negative) depending on dominating influence mechanisms.
References Korsholm U. S., Baklanov A., Gross A., Mahura A., Sass B. H., Kaas E.,
2008: Online coupled chemical weather forecasting based on HIRLAM – overview and prospective of Enviro-HIRLAM, HIRLAM Newsletter no 54, 151-168
Noilhan J., J. Mahfouf, 1996: The ISBA land surface parameterization scheme. Global and Planetary Change,Vol. 13, Issues 1-4, 145-159
Savijärvi H., 1989: Fast Radiation Parameterization Schemes for Mesoscale and Short-Range Forecast Models, Journal of Applied Meteorology, 437–447
Influence of Urban Territories on Meteorological Parameters:
Vilnius Case Study
The surface of urban areas differs from other territories in many parameters. These differences impact the boundary layer meteorological parameters which are especially important for dispersion of air pollutants. This study concentrates on main meteorological parameters (which are important for air pollution dispersion processes) sensitivity to urban areas surface parameters such as albedo, surface roughness and anthropogenic heat flux. The Vilnius agglomeration was selected because it is the largest urban area in Lithuania. The cases when air pollution dispersion conditions are good (i.e. high speed winds), poor (i.e. calm conditions), quick removal (i.e. heavy precipitation), and long stay in boundary layer (i.e. stable stratification of the atmosphere) are of importance in this study.
Methodology The research version of numeric weather prediction (NWP) model Enviro-HIRLAM (Korsholm et al., 2008) was used in this study. The aerosol module was switched off to exclude the aerosols’ effects on meteorological fields. Different modeling domains were selected with the Vilnius urban area in the center of domain areas): LT1 (250 x 150 grids along longitude x latitude, and 1.4 x 1.4 km resolution) and LT3 (298 x 220 grids along longitude x latitude, and 2 x 2 km resolution). The NWP urbanization included modifications (in the ISBA surface scheme; Noilhan & Mahfouf, 1996) of roughness, albedo and anthropogenic heat flux only for grid cells having non-zero urban fractions. Note that all modified runs had same settings for roughness (2 m) and albedo (0.15).
Results and analysis Two fields: air temperature at 2 m (Fig. 1) and wind speed at 10 m were compared and differences between control and modified runs had been estimated. The provided graphs (Figs. 2-3; see Tab. 1) illustrate the difference in temperature and wind speed at the urban grid cell of Vilnius city (measurement station is placed in the Žvėrynas urban district) where the urban fraction was the highest. Due to anthropogenic heat flux (AHF) the air temperature can increase, due to higher roughness the wind speed can become low. Even a small change in wind speed could lead to large changes in concentrations of air pollutants, and temperature changes might led also to changes in chemistry.
Figure 1: Example of the Enviro-HIRLAM control (top) vs. urbanized
(bottom) run: air temperature at 2 m at 17 UTC on 29 Jan 2009.
Adomas Mažeikis E-mail: [email protected] Nature Research Center, Institute of Geology and Geography, Vilnius, Lithuania http://www.geo.lt

NewsLetters of the FP7 EC MEGAPOLI Project
10 Issue 10, March 2011
MEGAPOLI Project Office WWW ADDRESS http://www.megapoli.info POSTAL ADDRESS MEGAPOLI Project Office Danish Meteorological Institute (DMI) Research Department Lyngbyvej 100 DK-2100 Copenhagen DENMARK
COORDINATOR Prof. Alexander Baklanov E-mail: [email protected] Phone: +45 3915-7441 Fax: +45 3915-7400
VICE-COORDINATORS Dr. Mark Lawrence E-mail: [email protected] Phone: +49-6131-305331 Fax: +49-6131-305511 Prof. Spyros Pandis E-mail: [email protected] Phone: +30-2610-969510 Fax: +30-2610-990987
MANAGER Dr. Alexander Mahura E-mail: [email protected] Phone: +45 3915-7423 Fax: +45 3915-7400
SECRETARY Britta Christiansen E-mail: [email protected] Phone: +45 3915-7405 Fax: +45 3915-7400
EC Scientific Officer Dr. Jose M. Jimenez Mingo E-mail: jose.jimenez-mingo ec.europa.eu Phone: +32-2-2976721 Fax: +32-2-2995755
IMPORTANT NOTICE
If you do not wish to receive this newsletter, send an e-mail to the following address - [email protected] - and you will be removed from the mailing list. We apologise for any inconvenience caused.
Coming and Recent Presentations and Publications
Dear colleagues, please, pay your attention to presentations and publications related to the MEGAPOLI Project:
• Baklanov A., Mahura A. (Eds) (2010): Second Year MEGAPOLI Dissemination Report. Deliverable 9.4.2, MEGAPOLI Scientific Report 10-21, 89p, MEGAPOLI-24-REP-2010-12, http://megapoli.dmi.dk/publ/MEGAPOLI_sr10-21.pdf
• Moussiopoulos N., Douros J., Tsegas G. (Eds) (2010): Evaluation of Source Apportionment Methods. Deliverable D4.6, MEGAPOLI Scientific Report 10-22, MEGAPOLI-25-REP-2010-12, 53p, http://megapoli.dmi.dk/publ/MEGAPOLI_sr10-22.pdf
• Karvosenoja N., L. Kangas, K. Kupiainen, J. Kukkonen, A. Karppinen, M. Sofiev, M. Tainio, V.-V. Paunu, P. Ahtoniemi, J.T. Tuomisto, P. Porvari, (2010): Integrated modeling assessments of the population exposure in Finland to primary PM2.5 from traffic and domestic wood combustion on the resolutions of 1 and 10 km. Air Qual. Atmos. Health., DOI 10.1007/s11869-010-0100-9
• Galmarini S., Vinuesa J.F., Cassiani M., Denby B., Martilli A., (2011): Evaluation of Sub-Grid Models with Interactions between Turbulence and Urban Chemistry. Recommendations for Emission Inventories Improvement. Deliverable D2.6, MEGAPOLI Scientific Report 11-01, MEGAPOLI-27-REP-2011-01, 41p, http://megapoli.dmi.dk/publ/MEGAPOLI_sr11-01.pdf
• Butler T., H.A.C. Denier van der Gon, J. Kuenen (2011): The Base Year (2005) Global Gridded Emission Inventory used in the EU FP7 Project MEGAPOLI (Final Version). MEGAPOLI Scientific Report 11-02, MEGAPOLI-28-REP-2011-01, 24p, http://megapoli.dmi.dk/publ/MEGAPOLI_sr11-02.pdf
• Kukkonen, J., Balk, T., Schultz, D. M., Baklanov, A., Klein, T., Miranda, A. I., Monteiro, A., Hirtl, M., Tarvainen, V., Boy, M., Peuch, V.-H., Poupkou, A., Kioutsioukis, I., Finardi, S., Sofiev, M., Sokhi, R., Lehtinen, K., Karatzas, K., San José, R., Astitha, M., Kallos, G., Schaap, M., Reimer, E., Jakobs, H., and Eben, K., (2011): Operational, regional-scale, chemical weather forecasting models in Europe, Atmos. Chem. Phys. Discuss., 11, 5985-6162
• See more MEGAPOLI Publications/ Presentations at http://megapoli.info
Coming Conferences
Dear colleagues, please, pay your attention to conferences you might be interested to attend and/or present MEGAPOLI Project results and findings:
• European Geosciences Union (EGU-2011) General Assembly Vienna, Austria, 3-8 Apr 2011
(special MEGAPOLI, CityZen, MILAGRO session) http://meetings.copernicus.org/egu2011
• MUSCATEN et al. Summer School on “Integrated Modelling of Meteorological and Chemical Transport Processes / Impact of Chemical Weather on Numerical Weather Prediction and Climate Modelling” Odessa, Ukraine, 3-9 July 2011 http://atmos.physic.ut.ee/~muscaten/YSSS/1info.html
• Urban Air Quality and Climate Change Workshop (UAQCC) Hamburg, Germany, 16-18 Aug 2011 contact: Heinke Schluenzen, UHam ([email protected])
• European Meteorological Society (EMS-2011) Annual Meeting Berlin, Germany, 12–16 Sep 2011 http://www.emetsoc.org/news_meetings/news_meetings.php
• 3rd Annual MEGAPOLI Project Meeting/ Workshop Paris, France, 26-28 Sep 2011 contact: Matthias Beekmann, CNRS-LISA ([email protected])
• 14th International Conference on Harmonisation within Atmospheric Dispersion Modelling for Regulatory Purposes
Kos Island, Greece, 2-6 Oct 2011 http://www.harmo.org/harmo14