Kinking the Coiled Coil Negatively Charged Residues at the ...

URI 989_42.
~ Thsmania Department of Mines-Report 1989/42
Mega-kinking in the Mathinna Beds, north-east Tasmania. by B. D. Goscombe andR. H. Findlay.
Abstract
Detailed analysis of cleavage trends in the Mathinna Beds in the south-east part of the Alberton Quadrangle has identified mega-scale (up to 9 km wavelength) kink bands and kink folds. These formed during and after the profuse development of outcrop-scale kink bands. Sinistral kink bands of all scales trend approximately 0320 and predominate in number over the approximately E-W trending dextral kink bands. The geometry of outcrop-scale kink bands defines a NNW -trending principal compressive stress during kinking. Microscopic over-printing criteria confirm that outcrop-scale kink bands formed after Middle to Late Devonian granite-granodiorite (Scottsdale Batholith) emplacement and the crystallisation of metamorphic minerals in the thermal aureole. Published cleavage data from throughout NE Tasmania has been collated, and the mega-kinks of this entire region are presented. Mega-kinking in NE Tasmania occured under essentially the same principal compressive stress and at the same time as mega-kinks in the Lachlan Fold Belt.
INTRODUCTION
This tectonic analysis of regionally-developed small-scale kinking in the Alberton Quadrangle was developed by the senior author (B. D. Goscombe) as a result of discussions arising out of mapping during 1988 and 1989 (R. H. Findlay) and further detailed mapping by B. D. Goscombe (1989). The kinks described constitute the second deformation, and kinking on scales of centimetres, metres and kilometres has been documented and studied in detail. This preliminary study has found many similarities in geometry and stress fields associated with kinking and the tectonic history in general, between Tasmanian Devonian turbidites and Late Ordovician sequences of the Lachlan Fold Belt (Powell et al., 1985). Of more local interest, this study collates all published data relevant to late-stage kinking on all scales from throughout NE Tasmania. Re-orientation of structural domains by late-stage mega-kinking must be taken into account with any analysis of the earlier deformational events experienced by the Mathinna Beds. Thus this study forms a useful basis for analysis of the earlier folding experienced in NE Tasmania. Furthermore, this study on its own forms an integral part of our understanding of the tectonic history of NE Tasmania.
REGIONAL GEOLOGY AND TECTONIC FRAMEWORK
The oldest rocks occurring in NE Tasmania are known as the Mathinna Beds (see Burrett and Martin, 1989, p.489). These rocks consist of all the folded sedimentary sequences older than the unconformably overlying rocks of the St Marys Porphyrite (Turner et al., 1986). The beds
REPORT 1989/42
have yielded Early Ordovician fossils west of Pipers River (Banks and Smith, 1968), whereas Early Devonian fossils have been recorded elsewhere (Rickards and Banks, 1979). Diagnostic Silurian fossils have not been found.
A summary of the interpreted sequence of structural events experienced by the Mathinna Beds in the Alberton Quadrangle is presented in Table 1. The Mathinna Beds have been tightly folded (Pl) around a NW to NNW axis. Fl folding produced an approximately fold axial planar penetrative cleavage (Sl) which is the predominant structural surface present throughout the whole of NE Tasmania. Throughout most of NE Tasmania Sl is very steep, particularly in the Alberton Quadrangle, but it is shallowly inclined to the west in the most north-west exposures of Mathinna Beds. Fl folds have been shown to have experienced further tightening subsequent to both Sl cleavage and later kink band development (Williams, 1970). Phyllosilicate phases developed and aligned within Sl are of sub-greenschist facies grade.
Four broad episodes of quartz vein development have been isolated in the Alberton Quadrangle. Very thin « 1 em) bedding-parallel veins are boudinaged and off-set by planes of high strain associated with S 1 (i.e. C-planes), and so pre-date Fl folding. Syn-Fl veins form either as radiating low angle wedges around the outer arc of folded sandstone beds, or as conjugate sets of sygmoidal tension gashes. There are at least two episodes of post -S 1 veining; both have steep inclinations and very wide ranges in trends. These are identified in the field as earlier-formed laminated veins or veins with a median suture, and as later-formed, more common massive quartz veins. Statistically these two types of veins have distinctly different average trends; laminated veins trendN to NNW, and massive veins trend NW to NNW. All quartz veins are thought to pre-date kink band formation; this is established later.
The Mathinna Beds were intruded and contact metamorphosed by granite-granodiorite batholiths during the Middle to Late Devonian (Cocker, 1982). Post-intrusion deformation is indicated by flattening around porphyroblasts (cordierite, mica clots) in the thermal aureole, crenulation cleavage development (TurnerinMcClenaghanetal., 1982), and mylonitic shear zones in granites (Gee and Groves, 1974). Discrete kink bands (P2) on all scales from millimetres to kilometres are developed in the Mathinna Beds at some time subsequent to granite emplacement (this timing is established later). The deformational episode associated with kink band development (D2) is the topic of this report.
The multiply-deformed Mathinna Beds were uplifted and glaciated prior to deposition of the Parmeener Supergroup over the period 300-210 Ma. The Parmeener sediments progress from predominantly glaciomarine to freshwater
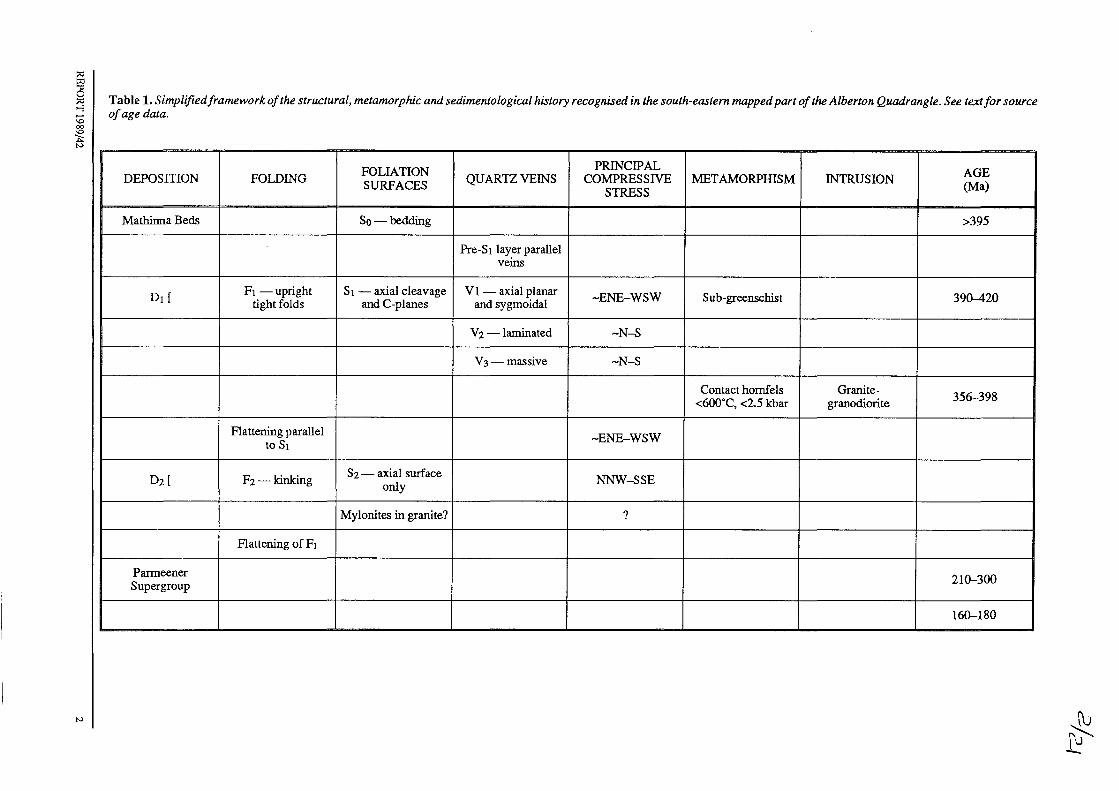
Table 1. Simplified framework of the structural, metamorphic and sedimentological history recognised in the south-eastern mapped part of the Alberton Quadrangle. See text for source of age data.
FOLIATION PRINCIPAL AGE DEPOSITION FOLDING SURFACES QUARTZ VEINS COMPRESSIVE MET AMORPHISM INTRUSION (Ma) STRESS
Mathinna Beds So- bedding >395
Pre-S 1 layer parallel veins
Dd F1 -upright SI - axial cleavage Vl- axial planar -ENE-WSW Sub-greenschist 390-420 tight folds and C-planes and sygmoidal
V z -laminated -N-S
V3-massive -N-S
Contact hornfels Granite-356-398 <6OO·C, <2.5 kbar granodiorite
Flattening parallel -ENE-WSW to SI
Dz[ F2- kinking S2 - axial surface
NNW-SSE only
Mylonites in granite? ?
Flattening of F1
Parmeener 210-300 Supergroup
160-180

sequences. The Parmeener Supergroup was intruded by dolerite sills in the Middle Jurassic (Schmidt and McDougall,1977).
MESOSCOPIC KINKING (D2)
Mesoscopic kink-band morphology
In outcrop all kinking possesses monoclinic kink band geometry. Kink bands are planar with sub-parallel fold axial planes. Where observed, kink bands are terminated by the low-angle convergence of the fold axial planes, thus forming a very elongate lenticular morphology. In thin section the axial surface is far from planar (fig. 1), and is also rarely bifurcate (fig. 2, 5). The fold axial surface is also commonly offset to form a hinge zone consisting of a set of discontinuous fold axial planes inclined consistently to each other (fig. 3). Fold hinges appear angular in outcrop and fold axial planes are labelled Sz (fig. 4). However in thin section the hinges of kinks are not perfectly angular but slightly rounded, and form a hinge zone of typically <1 mm width (fig. 2,3 & 5). More rounded hinges with a wider hinge zone (up to 3 mm) are rarely observed in the field.
Minor ductile displacement parallel to the fold axial plane of the kink was interpreted from thin sections (fig. 5). This fold axial planar shearing is consistent with the overall rotation experienced in the kink band. Kink bands in outcrop are often terminated by strike-slip micro-faults. These small scale offsets «2 mm) appear to be brittle in nature. Micro-fault planes propagate (for up to 20 mm) as a single plane from the lateral termination of lenticular kink bands, and both kink and micro-fault have consistent shear sense. Similar features have been described by Kimura et al. (1989) from the Mariana and Yap trenches.
In outcrop, both sinistral and dextral kink bands range in width from 1 mm to 200 mm and average 11 mm (fig. 6). Kink bands have been traced for up to two metres in length. These dimensions are of the same order as those described by Lennox (1980) from the Ben Lomond Quadrangle. Second-order kink bands on a 1-10 m scale are inferred, in scattered locations within domain C (fig. 7), on the basis of Sl re-orientation between successive outcrops.
Rotation of the internal foliation with respect to the fold axial plane is quantified as the angle p (fig. 4). Average p from different structural domains (fig. 7) ranges between 59° and 68° (fig. 8, table 2). The orientation of the fold axial plane with respect to the external foliation is defined by the angle a. (fig. 4). Average a. from each structural domain ranges from 66° to 77.5" in sinistral kink bands and 55° to 59° in dextral kink bands (fig. 9, table 2). a. systematically increases from structural domains which have a more N-S external Sl trace ("steep" domains) to
domains with a more E-W Sl trend ("shallow" domains) (fig. 7 and 9).
a. and p data plot as a wide scatter either side of the constant volume (a. = P) line (fig. 10). The majority of data is scattered towards a. > p. Such a geometry differs from the natural and experimental kink bands of Paterson and Weiss (1962, 1966) and Anderson (1964). a. > pkinkband morphology has been observed by Kimura et al. (1989), and was thought to be due to post-kink rotation of the kink band, this being accommodated by cleavage-parallel shear in the external foliation. Assuming such a model for the kink band geometry in the Mathinna Beds, the maximum shear strain associated with late-stage rotation of the kink band can be estimated. a. angles range from a median value of 66° on the a. = P line to samples with <1.=90° off the a. = P line. Thus the maximum rotation experienced by the kink band (8) is 24°. Rotation of 24° corresponds to a shear strain (y) of 0.45 by the relationship; tan 8 = Y (Ramsay, 1967) for simple shear.
In thin section, phyllosilicates defining the Sl cleavage in meta-mudstone and meta-siltstone are kinked, thus derming kinking as later than Fl. No mineral phases are aligned with the fold axial planes of the kink bands, and no new mineral growth is seen to be associated in any way with kinking.
Quartz veining genetically associated with kinking is not observed on outcrop scale. However, on a microscopic scale two distinct geometries of veinlet formation associated with kinking are observed.
(1) Short discontinuous lenticular veinlets form within and at consistently inclined low angles to the fold axial plane (fig. 2, 3). These have ragged edges, indicating pull apart at a high angle to the Sl cleavage. Such veinlets are thought to be a feature of brittle fracture and dilation in the hinge of kinks.
(2) Less commonly, long (up to 5 mm) but very thin planar quartz veinlets and trains of lenticular veinlets occur throughout the internal volume of the kink band (fig. 2). These are oriented near-perpendicular to slightly clockwise (in sinistral kink bands) of the kink fold axial plane. The orientation and dilation associated with these planar veinlets is consistent with the sense of shear of the kink band, if such is considered a zone of simple shear (fig. 2).
Mesoscopic kink-band orientation
Sinistral kink bands are tightly constrained in trend throughout the region mapped (032°) (fig. 11). All are steep to vertical (dip 70-90°) and display no asymmetry in inclination (fig. 12). The average sinistral Sz trend in each domain ranges between 031° and 045". Dextral kink
Table 2. Average geometry of kink bands and principal compressive stress tensor estimates for individual domains and groups of domains (jig. 7).
Domain Sz Sz a. a. P p <p 01 01 sin dext sm dext sin dext Gay Ramsay
A 32 96 66.2 55.4 66 33 9 166 156 B 31 none 77.5 59 30 143 C 31 80 69.5 59.3 68 80 15 156 145 D none 104 E 45 none F 35.7 none G 41 81 75 68.5 26 181 152.4 D,E,F 38.1 104 76 57.5 27 179 161
REPORT 1989/42 3
3/2./

Figure 1. Tracing from thin section of a kink in meta-mudstone. Note un-planar nature offold axial surface (dashed line). Solid line is Sl cleavage defined by phyllosilicates.
5cm
Figure 2. Tracing from thin section of quartz veinlet (black) distribution infoliated phyllosilicate-dominated meta-mudstone (with minor quartz). Solid lines are S J -cleavage trace. dashed lines are thefold axial plane of sinistral kink band. Present planar quartz vein extension axis (E2) is un-rotated to original extension axis (EI) (see inset). EI orientation is consistent with the sense of shear of the kink band if the veins formed early in kinking and were rotated to E2 by the kink band.
Figure 3. Tracing of thin section of the uppermost hinge line (dashed line) of sinistral kink band in mela-s iltstone-mudstone. Black areas are quartz veins; note vein/tts inclined to aJ1d associated with the kink hinge. Stippled area represents silts tone-fine sandstone layers. Majority of the rock is dominated by aligned (Sl) phyllosilicates (solid line). The extension axis of the quartz vein/ets is consistent with the sense of shear of the kink band (see inset) .
REPORT1989/42
I I
I
/
,
o
I
2 mm
~ [ 2
2 mm
----1-1 ~ I
\ I
~ .. ~
>
7
o
mm
4

cr,
" ~ Fa fold "" ("'Sa)
" y
Figure S. Simplified tracing a/features in thin section 0/ a portion of a kink in contacl aureole meta-peUte. Stippled areas are poikiloblastic cordie rite porphyroblasts, internalfeatures ignored. Dashed lines oUlline left-most hinge of a dextral kink band. Solid lines are the foliatian defined by strongly aligned muscovite and biotite which crystallised during contact metamorphism. Cordierite growth was synchronous with biotite-muscovite growth and jlaJtening ofthefaliation conlilWed aftercordierite growth. Note that the pressure shadow beards and the contact metamorphic foliation was kinked.
14
12
1 III 01 .!: 8 '0 a ~ 6 -o 4 o z
2
o
REPORT1989/42
DSinistral
~Dextral
2 3 4 Width (em)
5
Figure 4. Geometry of idealised kink band and definition of nomenclature and symbols.
axial plane
6
Scm
Figure 6. Histogram summarising all kink band width (fig. 4) data from the south-east portion of the Alberton Quadrangle. All widths greater than 10 em are not included.
5

24
22
20
18
16
14
12
TN o 3 4 Ian MN --==--==--==--==
, + \ +' , +' + ? • + + + + + +
0
62 64 66 68 70
Figure 7. Structural trend map ofSt cleavage in th£ Mathinna Bedsfrom th£ SE portion ofth£ Alberton Quadrangle. All faults (F) are entirely interpretive, the Permian outcrop distribution could equally be interpreted as due to landscape unconformities (C. R. Calver,peTs. comm.).
REPORT 1989/42 6
? •
72 74
D -r+++l ~
Alluvium
Basalt
Permian sediments and overlying dolerite
Granite - granodiorite, post-S I (366 - 390 Ma)
Mathinna Beds
Mathinna Beds, no S I -cleavage readings
Lithological boundary, inferred, (Faults (F) entirely inferred)
Strike of S I -cleavage readings (1200-B.G. and 64 R.H.F)
Average trace of S I-cleavage
Mega- kink domain boundary, inferred, labelled
+ + +
? •
76 78
5cm
I I
I
80
I I
I I
? •
I I
\ + +r-~-+ + \+ +, "'-, +
\ + I I
82
\ I 1 +
\ / " + " I , + , ,+ , ,+ ,
,+ , ,+ , ,+ , ,+ ,
+
? •
+
? •

o
o rn
~: !tl5 "". o e:: J r.l 11)2 )!
~' o
o
o o
~ Sinistral
mI DextraJ.
Averaae P for individual domain.
10 20 30 50
(3
Domain A
Domain B
60 70 80 90
Figure 8. Distribution of all P measurements and the average ~ in each domain from the SE portion of the Alberton Quadrangle.
o-t~----------------------------~--~~~--~~-I
Domain C
EL:2ZJ Sinilltral
(;.;::-:,·::,,·::::·:1 Dextral
----- Average lIinisLral for individual
I I I I I
domains 1
- - - Averaae dextral for individual domains
Domain D
Domain E
Domain F
Domain G
o "
REPORT 1989/42 Scm
Figure 9. Distribution of all (l measurements and the average a in each domain from the SE portion of the Alberton Quadrangle .
7

i 1 j
90~----------------------~~----~---.---------------, • • , • • •
I • • 6 • • •
•
o 30
O~----~------.-----~------.-----~----~ 180 150 120 90 60 30 o
Figure 10. Plot of (X versus ~ data from outcrop-scale kink bands in the SE portion of the Alberton Quadrangle (plot modified after Suppe, 1985). Solid dot is sinistral data, open circle is dextral data.
All Dextral $2 N ,..!:.----l--.-.. '. 0.
• •• •
•
", n52 = 19 nL2 • 5
Poles to 52,or contoured 14 al
• L2
REPORT1989/42 Scm
1--
Figure 11. Lower hemisphere equal area stereo plots of the total outcrop-scale kink band orientation data/rom the SE portion of the Alberton Quadrangle.
bands are very steep to vertical (85-90·) but have a significant range in trend throughout the area (48-127"). The average dextral S2 trend is 96· (fig. II). Dextral S2 trends in domain C trend north of east, whereas dextral S2 trends in all the "steeper" domains are south of east. This suggests (if there is only one generation of dextral kink bands) that the dextral kink bands were rotated in sympathy with the rotation due to mega-kinking (fig. 7). Consequently dextral kink bands are potentially earlier-formed than the sinistral mega-kinks. However, the above argument cannot be considered very confident because of the paucity of dextral data (n=19).
The proportion of sinistral to dextral kink bands varies between structural domains. For example only sinistral kink bands are found in the "shallow" domain B (fig. 7). "Intermediate" domain C has the next highest proportion of sinistral kink bands, and the average of all "steep" domains (A, D, E, F and G) has the lowest proportion of sinistral kink bands (table 3). These data suggest that within the sinistral mega-kink band (domain C) the rocks have experienced a greater amount of outcrop-scale sinistral rotation than dextral rotation with respect to the adjacent "steep" structural domains.
Table 3. The number and proportion of individual sinistral to dextral kink bands in different structural domains (fig . 7) .
Domain Sinistral Dextral Sinl(Sin+Dext)
A 21 3 0.875 B 2 1.0 C 117 12 0.907 D 3 0.0 E 4 1.0 F 3 1.0 G 4 2 0.667 A+D+E+F+G 32 8 0.80
8
-I
BEDDING ISO' poles to SO. contoured
tJ. pole to profile plane
0, STRUCTURES poles to 5,. contoured
o F, fold axis
+ L~ intersection lineation
SINISTRAL KINK BANDS 152'
poles to 51. contoured
o F2 fold axis
DEXTRAL KINK BANDS 152'
poles to 52
o F 2 fold axis
POST 5, aUARTZ VEINS
poles to V,. contoured
3"
DOMAIN A
\ \ \
o
.. \ . , '0 \ \ ~\ . \
\ \
\
,. , , . , o 0/
o • 0 .;>-/
l / <, 0 .., .,
o
DOMAIN 8 DOMAIN C
6.
i . ,
.--;"'--..
. ... """J ,.. .. . I'.no! 0-----______ e 0
..
DOMAIN D
.' 0 0
\
\ ..... \ . , \ . \lo. \~
\ \ \ \ \ \ ..
--'0
Figure 12. Lower hemisphere equal area projections of structural data in each domain (fig. 7)from the area mapped in the SE portion of the Alberton Quadrangle. All planes plotted as poles. Contouring done by STEREONET program on Macintosh personal computer (Allmendinger).
REPORT 1989/42 9
DOMAIN E
\
\'14. \ ., \ \ \~
\ . \ \ \ \ \ \
DOMAIN F
7
o
DOMAIN G
\
\,." \ ., \ \ \t,
\ . o \
\ \ \
Scm
\ \
!
"
DOMAIN H
.' . ... ..
DOMAIN
.'
"
"\

The spatial density of sinistral kink: bands per metre along sections parallel to SI has been recorded from 16 localities. The range is 0.33-4 m in domain C, and 2-3.5 min domain A. The averageindomainC is 1.45 m (n:13), and in domain A is 2.94 m (n:3). However some outcrops have no kink bands (especially in domain A), thus for the whole mapped region these data only give an indication of the maximum spatial density of sinistral kink: bands.
MAP·SCALE MEGA· KINKING (D2)
Mega-kinking mDrphology.
A very high density of SI readings in the Mathinna Beds was obtained from the south-east portion of the Alberton Quadrangle. These data were sufficient to accurately outline a series of kilometre-scale and 100 m-scale kink bands (fig. 7). Kink band boundaries are defined by relatively sharp changes in SI orientation. The kinks have angular monoclinic geometry. The structural domains, bounded by the fold axial plane of the mega-kinks, are characterised by very constant SI orientation, typically within ± 11-20° of the average SI orientation (fig. 12). The structural domains have been divided into three groups on the basis of their average SI trend; "steep" domains are the closest to N-S trends (150-157"), "intermediate" domains have trends between that of the other domains (approximately 140°); and "shallow" domains are closest to E-W trends (113-116°). Which of these domains constitute the mega-kink band and which are the regional (pre-kinking) un-rotated domains could only be defined by analysis of SI trends on a far larger scale including the whole of NE Tasmania (see later discussion and Figure 13).
Sinistral outcrop-scale kink bands are essentially constant in trend between different domains, except in domains E and G where S2 trends more easterly. Despite the paucity of data, dextral kink bands from each domain show trends which are sympathetic with their being rotated with the mega-kinking. This suggests that dextral kink bands pre-date sinistral kinking. Post-SI massive quartz veins similarly show average orientations which are sympathetic with the rotation of the respective domain by mega-kinking (fig. 12). Thus the massive quartz veins are thought to pre-date kinking on all scales, though no definitive over-printing criteria were found in outcrop. An ENE-trending axis of dilation during massive quartz veining is consistent with the NNW 01 trend during D2 (table 2) and thus these veins may be near synchronous with kinking (see later discussion on 01).
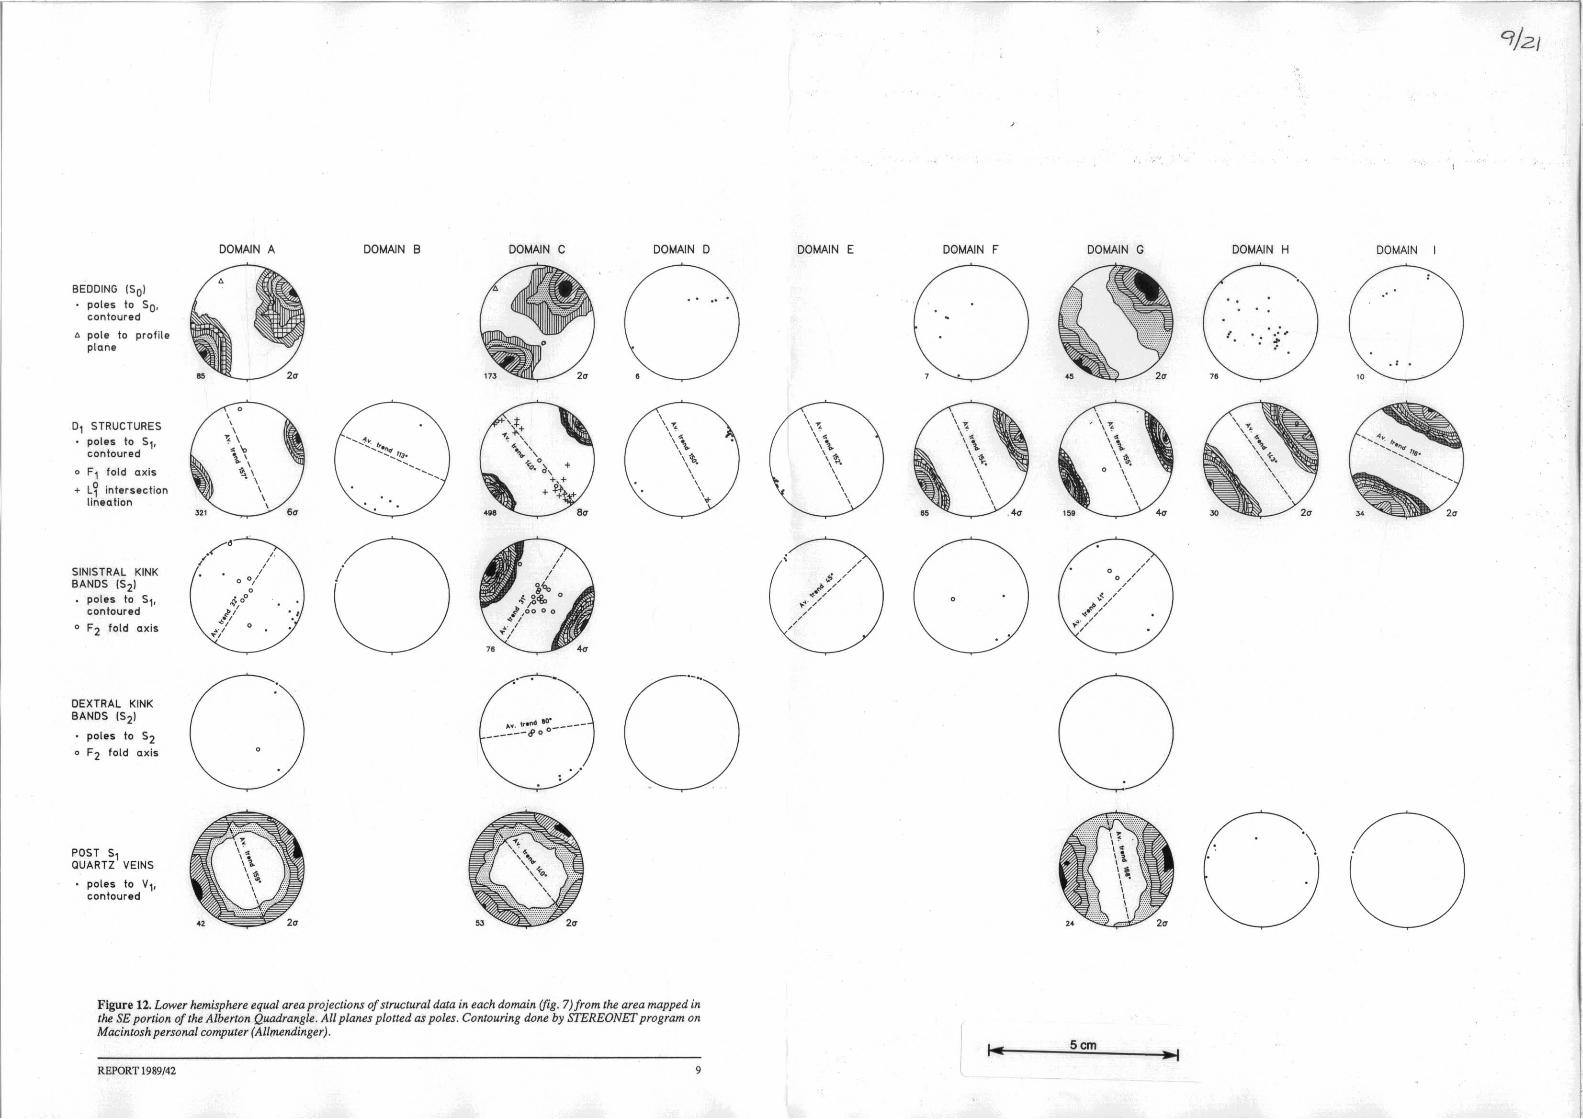
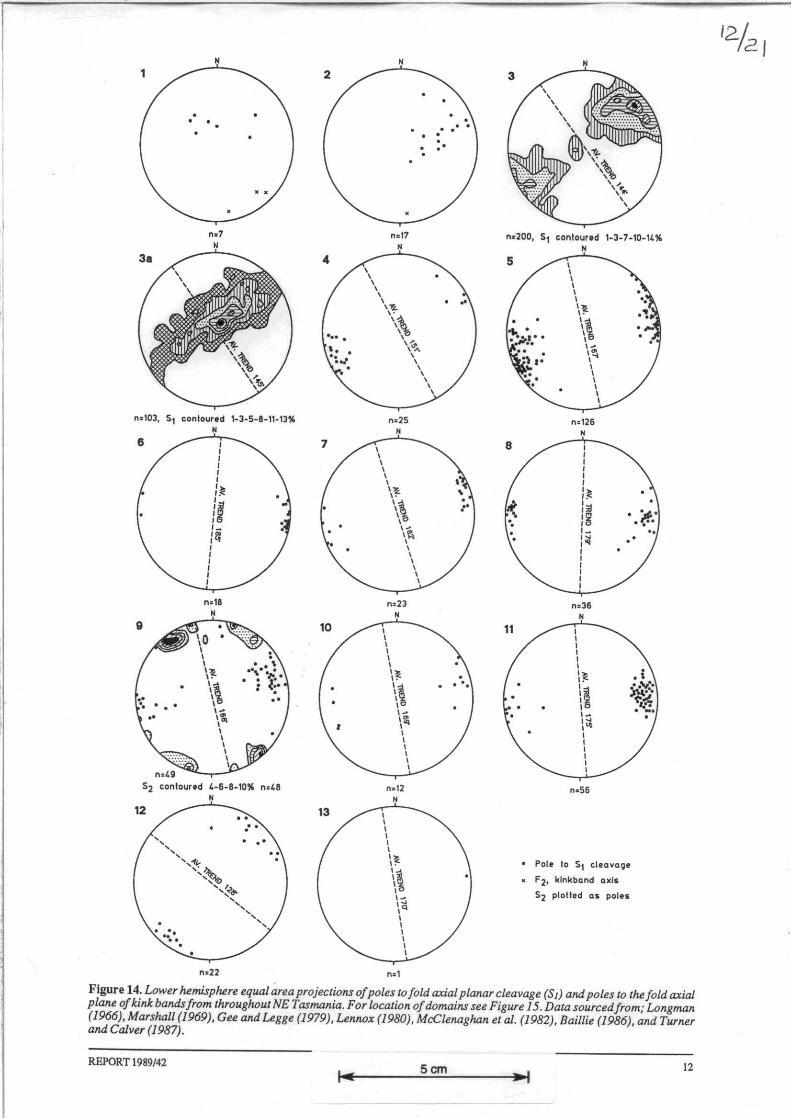
S irnilar scale mega -kinks have been documented from the Ringarooma (Turner in McClenaghan et al., 1982) and St Marys (Turner and Calver, 1987) Quadrangles. All published S 1 cleavage data from the Mathinna Beds of NE Tasmania have been collated and summarised on a map (fig. 13) and as stereo plots (fig. 14). This information clearly defines large regions of reasonably constant SI orientation. These regions are bounded by what appears to be sharp zones across which the SI orientation has rotated between 12° and 42.5", the average being 20·. As such, these zones would define the hinge lines of mega-kinks. These hinge lines are interpreted to be continuous for as far as 35 km. Furthermore, hinge lines of mega-kinks with the same rotation sense and trend can be matched up by extrapolation through the granite-granodiorite batholiths for up to 70 km (fig. 13).
Pre-kinking structural trend
To accurately study the earlier tight folding (FI) of the Mathinna Beds the late-stage F 2 kinking must be unfolded.
REPORT 1989/42
Unfolding of monoclinic kinks can only be done if the domains which remained unrotated, and those which were rotated during kinking, can be established. Such information would serve the dual purpose of defining the mega-scale kink bands of NE Tasmania. The "steep" domains are shown to be the unrotated structural domains in NE Tasmania by the following arguments:
(1) The average trend of outcrop-scale sinistral kink bands (032°) (fig. 11) is identical to the overall trend of domain C (fig. 7), which likewise displays sinistral rotation with respect to the adjacent structural domains. Thus mega-scale sinistral rotation of domain C relative to the "steep" domains is consistent with the small-scale structures, and domain C is thus defined as a mega-kink band labelled as kink band C (fig. 16).
(2) Kink band B (fig. 16) has experienced dextral rotation relative to the adjacent "steep" domains. Similarly with the most southern outcrops of Mathinna Beds in NE Tasmania (mega-kink band D). Both these domains are interpreted as dextral mega-kink bands, and the adjacent "steep" domains remained unrotated.
(3) Shortening due to kinking
Shortening across the four major kink bands in the central N-S section of NE Tasmania (fig. 16) was calculated, by at first assuming that all shortening was the result of mega-kink rotation only (fig. 16), using the following relationship:
component of shortening experienced: y - (y.cos '1') where: '1': 180 - (a. + P) (fig. 4)
y: the distance across the kink band along the internal S 1 trace.
This relationship is simplified to a shortening ratio (%) by assuming an arbitrary length scale (i.e. for y: 1);
shortening (%) : (1 - cos '1').100
The shortening across mega-kink bands is calculated to be 6-15% (fig. 16). This is of the same order of shortening by mega-kinks at Bermagui, N.S.W. (7%) (Powell et al., 1985). Mega-kink bands only comprise 48% of the central N-S section in NE Tasmania, thus total shortening of NE Tasmania is in the vicinity of 3-8%.
The above is a minimum shortening estimate because outcrop-scale kink bands were not considered. Average shortening across an individual outcrop-scale sinistral kink band is of the order of 9%. However, total shortening along the central N-S strip (120 km long) of Mathinna Beds cannot be estimated without an accurate estimate of the spatial density and width of outcrop-scale kink bands in all structural domains. Average spatial density of 1.73 kink bands per metre along aN -S section, with an average width of 1.7 cm (see earlier sections), gives rise to an average N -S shortening by outcrop-scale kink bands of only 0.3%. Estimates using the presently available data are considered here to be not accurate enough to constrain a total shortening component for NE Tasmania by outcrop-scale kinks. Shortening by outcrop-scale kink bands in the Lachlan Fold Belt has been estimated by Cudahy (1983) to average 2-5% in individual localities and to be only 1-3% over a regional extent (Powell et al., 1985). Thus shortening by mesoscopic kinks possibly contributes ::;1 % of N -S shortening in NE Tasmania.
Kink bands of all scales in NE Tasmania are very steeply inclined, consequently the crustal shortening associated with kinking did not necessarily involve any crustal
10
•
I" 5cm .-1
Figure 13.
Structural trend map of SJ-e/eavage in the Mathinna Beds from throughout NE Tasmania. Data was drawn from the following 1 :50 000 and 1 :63 360 map sheets: Noland Bay, Boobyal/a, Eddystone, Blue Tier, Ringarooma, Pipers River, Launceston, Ben Lomond, St Helens, SI Marys, and preliminary datafrom Snow Hill (f. L. Everard,pers. comm.).
REPORT 1989/42 PAGE 11
49
48
47
46
45
44
43
42
41
40
39
38
z E
~ "-'" "
TN MN
~$
+ + + + + + + + j:.
..-"-+
+ II
Post-granite-granodiorite cover (Permian to Recent)
Granite - granodiorite. post-Sl (366-390 Ma)
Mathinna Beds. average trace of S 1 cleavage indicated
..-+ +...- ...-
+t)'+ // ? + + + + +
.J ? + I
+ + +
+ + + ..-+ ..-
+ + ..-..-+ /+ / +
/ /
[1J Mathinna Beds, S 1 cleavage orientation unknown
Lithological boundary
S 1 cleavage trace, subsurface trend inferred
S 1 clea.vage strike rea.ding
---- Mega-kink domain boundary, inferred + .. ........ II
Outline of detailed map of Mathinna region (Fig. 7) ... ...... .
+ II Corner of 1:50 000 map sheets
..-
550000 mE 51 52 53 54 55
+
+ ++
+ ...--+ ..-
+ + + + + + + + + +
+
+ + + +
+ + + + + + + + +
+~+ +
+ ++ ++
+ +
+ + +
+ + +
10 20 km i_MM_MMM __ _
56 57 58 59 60 61
N
1
n.103, 5, contoured 1-3-5-8-11-13" N
6
12
I I I I I I I~ I",
11 I-II; I I I I I I
contoured 4-6-8-10" n=48 N
n~22
2
4
7
10
13
I I
N
" .. 17 N
n:o:25 N
I I I I ,-" I·
\\ 1-
\~ I I
I I
n",n N
I
I
I I I
'-.. ,. \\ ,0 1-\~ I , I I I I
",,12 N
I , , I I
'-.. ,. \l
, 0
1-,~ , q
I ,
"=1
I I , ,
I I I I
~ ' ..
n.,200,
5
8
11
5, contoured 1-3-1-10-14 " N
I I I , , , '-.. I.
\\ I ,-\'?t I , I I I I
n=126 N
I I I I I I I,
'" '~ 12 10 1-I~ I~ . I I I I I I
n,.36 N ,
I I I I 1
\~
\~ , 0 1-I~ ,~
I I 1 1 1 1
n.56
Pole to 5, cleavage
F2• klnkband oxlli
52 plotted as polu
.
Figure 14. Lower hemisphue equal ~rea projections of poles to fold axial planar cleavage (SI) and poles to the fold axial plane of kink bands from throughout NE Tasmania. For location of domains see Figure 15. Data sourced/rom; Longman (1966), Marshall (1969), Gee and Legge (1979), Lennox (1980), McClenaghan et al. (1982), Baillie (1986), and Turner and Calver (1987).
REPORT 1989/42 Scm 12

..
..
"
..
1
TN MN
t:::::::::::::::j Wathlnna lied.
)le,a-klnk boundal')". extrapolated
II II Approximate domain bound.rie.
r········, ! !}.rea mapped In delaU ~ ......... :
Figure 15. Simplified map of the distribution of Mathinna Beds in NE Tasmania. The approximate outline of structural domains referred to in the text and Figure 14 are outlined.
5cm
REPORT 1989/42 13

Kinkbond (B) 15°
N
Kinkbond(D) 7%
' ... . . . ...
Ron~e in unfo ded 0"1
Scm
O~!!!!!Iiiiiiiiiiiiil!!!!!!!!!!!!!!3 0 k m
. ' .. . . '
1:7°
Figure 16. Simplified map of kink boundaries in NE Tasmania wilh Ihe major mega-kink bands oullined (slippled) and labelled. Estimales of Ihe minimum shorlening (see lexl), by mega-kinking rOlalion only, are presenledfor Ihese kink bands. The given range in the principal compressive stress tensor is derived from outcrop-scale kink bands from the SE porlion oflhe Alberlon Quadrangle ifig. 19, Table 2). Angle ofrolalion by kink hinge is given (circled) .
REPORT 1989/42 14

I
~ 1 I
I I
thickening (asswning no extension along the F, fold axis). Shortening must then have been accommodated by ENE-WSW crustal extension in a horizontal plane.
TIMING OF SMALL- SCALE AND MEGA-SCALE KINK BANDS
Review of lhe literature
The three earliest reports of kink-bands in the Mathinna Beds (Threader, 1967; Williams, 1970; Lennox, 1980) point out that they follow the penetrative St-c1eavage development, but are not constrained with respect to the time of granite emplacement. All published 1 :50 000 map explanatory notes, except St Marys, Ringarooma and Beaconsfield. do not recognise discrete kink bands. A NE-trending, outcrop-scale kink hand was reported in the Ringarooma Quadrangle but no timing with respect to granite emplacement was given (furner in McClenaghan el al., 1982).
Map-scale kinking of St has been recognised in the Ringarooma Quadrangle (Turner in McClenaghan el al., 1982) and immediately north of Piccaninny Point in the St Marys Quadrangle (Turner and Calver, 1987). In both these cases, buckling was perceived to pre-date granite emplacement, although definitive over-printing criteria were not presented. Turners' interpretation was based principally on the absence of synthetic buckling of the granit~Mathinna Beds contacts. Mega-kinking in the St Marys Quadrangle was due to WNW to NW-trending sinistral faulting before or during granite emplacement.
Over-printing crileria
Small-scale kink bands in the aureole of the Scottsdsle Batholith, in the mapped portion of the Alberton Quadrangle, kink both biotite and muscovite laths and the mica-dominated beards abutting cordierite porphyroblasts (fig. 5). These micas and cordierite only form in the contact aureoles. Flattened cordierite porphyroblasts are gently folded around rounded arcs in the hinge zone of kink bands. These features define kinking as post-dating granite intrusion and contact metamorphism of the Mathirma Beds. In addition there are many expressions of post-intrusion defonnation in the granite-granodiorite bodies and contact aureoles. However these structures cannot necessarily be correlated with the stress field which gave rise to kinking. Post-intrusion defonnation include the following:
(I) The dominant foliation in the Mathinna Beds, defmed by contact metamorphic mineral paragenesis. is flattened around poikiloblastic cordierite porphyroblasts, and in some cases there is relative rotation between porphyroblast and the foliation (Turner in McClenaghan el al., 1982, Turner and Calver, 1987). These features may be the result of flattening in the aureole during intrusion (Turner in McClenaghan el aI., 1982).
(2) Two sets of thin (1-40 mm) mylonitic shear zones occur within the Piccaninny Creek Adamellite (Gee and Groves, 1974). Sinistral shear zones here have NW to NNW trends, and dextral zones have approximately E-W trends. These are thought to have formed by WNW-ESE shortening (Gee and Groves 1974). The mylonitic shear zones developed in the granite-granodiorite plutons of NE Tasmania could potentially be an expression of deformation of the granite bodies while under the same stress system experienced during kinking in the Mathinna Beds. This hypothesis can be tested by fault analysis, by the
REPORT t989/42
method of Angelierel al. (1982) and Angelier (1984), using a large population of movement vectors from these mylonites to define the 0'1 stress tensor.
Finally, the following argument is by no means considered defmitive but does offer support for post-granite kinking. On a regional scale the granite-Mathirma contact is roughly orientated in sympathy with the rotation resulting from the mega-kinks (fig. 13). TItis may not neccessarily be the result of whole-scale kinking of entire granite batholiths, which would seem implausible for such large and competent bodies. Deformation of the granite is envisaged to be more localised in nature. The regional scale change in pluton morphology is more likely to be the result of internal deformation of the granite body by populations of discrete shear zones.
Mega-kinking versus outcrop-scale kink. bands
The relative timing of mega-kinking and outcrop-scale kinks can only be postulated on geometric arguments. The tightly constrained range in sinistral S2 orientation and a in most domains suggests that they fonned prior to and not during mega-kink rotation, after the argument of Powell el aI. (1985). However conversely, the average S2 orientation does not vary much between different structural domains which may have been rotated by up to 26' with respect to each other (fig. 16). This is not supportive of late-stage mega-kinking, and is best explained by kink bands of all scales forming at the same time. Outcrop-scale dextral kink bands and the sinistral kink bands in the "steep" domains E, F and G have orientations consistent with late-stage rotation by mega-kinking (fig. 12). Furthermore, the large range in outcrop-scale dextral kink band orientation may be the result of synchronous rotation by mega-kinking as the outcrop-scale kink bands formed. Although not well constrained these relationships are largely suggestive of outcrop-scale kink bands forming early and continuing to form (particularly dextral kink bands) synchronous with, and to be rotated by, mega-kinks. This interpretation is supported by the variation in trend of the 01 tensor between different structural domains (see later discussion). Progressive kinking up in scale was also postulated by Powell el al. (1985) for the Lachlan Fold Belt.
Absolute liming
The maximum limiting age of kinking in NE Tasmania is constrained by the overprinting criteria with respect to the Scottsdale Batholith; this is <356-392Ma (Cocker, 1982). The only minimwn age constraint available is that the kinks pre-date the oldest sediments of the Parmeener Supergroup (approximately 300 Ma). This is argued because these sediments show no evidence for 3-8% N-S shortening. An identical minimum age is offered for kinking of the Lachlan Fold Belt (Powell el al., 1985) which forms the basement of the <300 Ma Sydney Basin. The maximum age limit of mega-kinks in the Lachlan Fold Belt is <340-350 Ma (Powell el al., 1985).
On the basis of the similar timing and 0'1 tensor (see later) of kinking in both the Lachlan Fold Belt and the Mathinna Beds, kinking in these regions is correlated. Powell el al. (1985) correlate mid-Carboniferous kinking with the N-S directed compression associated with the Alice Springs Orogeny in central Australia. However crustal shortening and overthickening in central Australia occurred significantly earlier than kinking in eastern Australia, at some time before 400 Ma (Goscombe, 1989). This conflict arises because geochronological ages from Alice Springs Orogeny shear zones have been incorrectly interpreted in
15
u o
600
500
400
Estimated thermal peak
g~o~een/lice~:.\/~ I
K/Ar (horn) I
r {lo , ,bio 1 musc
I- 300 Rb/Sr (bio) ,"=~/¥-----< K/Ar(bio) ~
200 Fission trock (musc) ~
100 Fissi on track (apatite 71
100 200 300 400 500 Ma
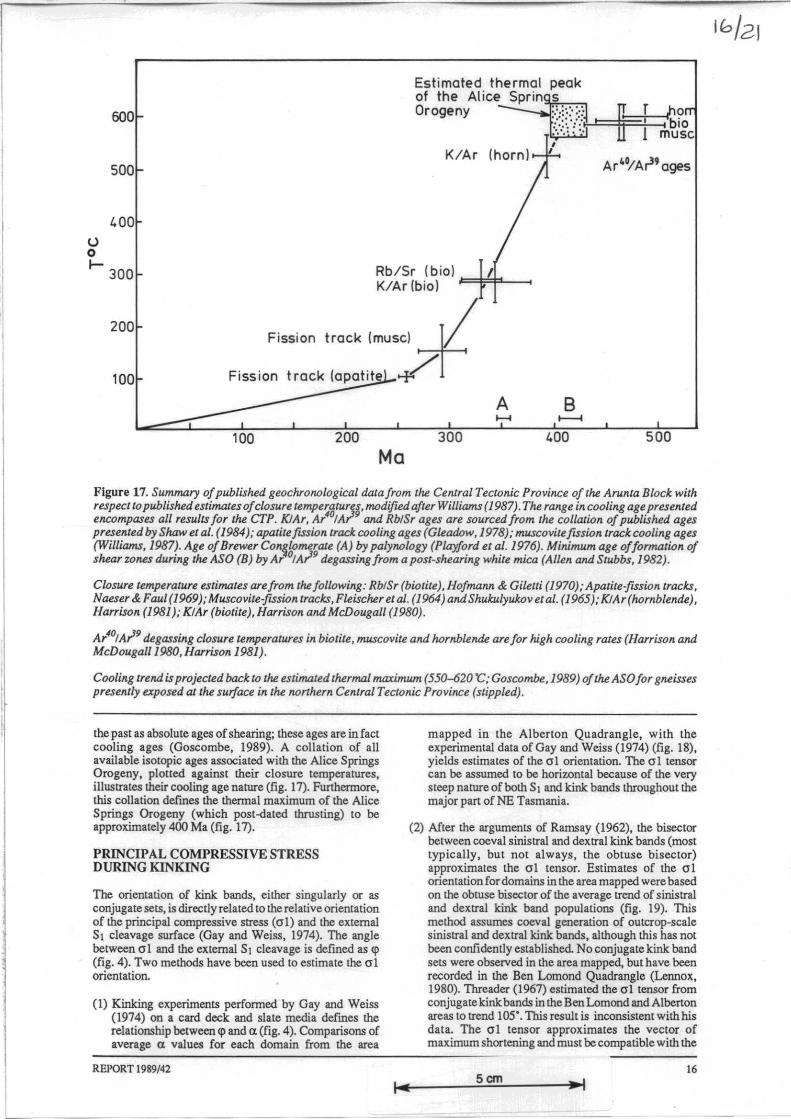
Figure 17. Summary of published geochronological data from the Central Tectonic Province of the Arunta Block with respect to published estima/esofclosure temperature§, modified after Williams (1987). The range in cooling age presented encompases all results for the CTP. KlAr, A/OIAI and RblSr ages are sourced from the collation of published ages presented by Shaw et al. (1984); apatite[lSsion track cooling ages (Gleadow,1978); muscovite[lSsion track cooling ages (Williams, 1987). Age of Brewer Con~lomerate (A) by palynology (Playford et al. 1976). Minimum age offormatwn of shear zones during the ASO (B) by Ar °IAI9 degassing from a post-shearing white mica (Allen and Stubbs,1982).
Closure temperature estimates arefrom thefollowing: RblSr (bwtite), Hofmann & Giletti (1970); Apatite-[lSsion tracks, Naeser & Faul (1969); Muscovite-[lSSion tracks, Fleischer et al. (1964) andShukulyukov et al. (1965); KlAr(hornblende), Harrison (1981); KIAr (biotite ), Harrison and McDougall (1980).
Ar"°IAI9 degassing closure temperatures in biotite, muscovite and hornblende are for high cooling rates (Harrison and McDougall 1980, Harrison 1981).
Cooling trend is projected back to the estimated thermal maximum (55()..{j20 'C; Goscombe, 1989) of the ASO for gneisses presently exposed at the surface in the northern Central Tectonic Province (stippled).
the past as absolute ages of shearing; these ages are in fact cooling ages (Goscombe, 1989). A collation of all available isotopic ages associated with the Alice Springs Orogeny, plotted against their closure temperatures, ilIuslrates their cooling age nature (fig. 17). Furthermore, this collation dermes the thennal maximum of the Alice Springs Orogeny (which post-dated thrusting) to be approximately 400 Ma (fig. 17).
PRINCIPAL COMPRESSIVE STRESS DURING KINKING
The orientation of kink bands, either singularly or as conjugate sets, is directly related to the relativeorientation of the principal compressive slress (a1) and the external S, cleavage surface (Gay and Weiss, 1974). The angle between a1 and the external S, cleavage is defined as cp (fig. 4). Two methods have been used to estimate the a1 orientation.
(1) Kinking experiments perfonned by Gay and Weiss (1974) on a card deck and slate media dermes the relationship between cp and a (fig. 4). Comparisons of average a values for each domain from the area
REPORT 1989/42
mapped in the Alberton Quadrangle, with the experimental data of Gay and Weiss (1974) (fig. 18), yields estimates of the 01 orientation. The al tensor can be assumed to be horizontal because of the very steep nature of both St and kink bands throughout the major part of NE Tasmania.
(2) After the arguments of Ramsay (1962), the bisector between coeval siniSlral and deXlral kink bands (most typically, but not always, the obtuse bisector) approximates the a1 tensor. Estimates of the a1 orientation for domains in the area mapped were based on the obtuse bisector of the average trend of sinistral and deXlral kink band populations (fig. 19). This method assumes coeval generation of outcrop-scale sinistral and dexlral kink bands, although this has not been confidently established. No conjugate kink band selS were observed in the area mapped. but have been recorded in the Ben Lomond Quadrangle (Lennox, 1980). Threader (1967) estimated the a1 tensor from conjugate kink bands in the Ben Lomond and Alberton areas to trend 105-, This result is inconsistent with his data. The 0'1 tensor approximates the vector of maximum shortening and must be compatible with the
16 Scm
I
ex
90
80
0 0
n .. 70. ".
7089. , ,." ,." ,. ...
60 'V 50 f'
,. ,." ,."
40 I-
30 I-
... 20 I- c
'0 E 0
0
10 l-
I I
,," ,." "".".".
,."
/ ,." ;/
,.,,' ,." ,." ,.
,."
... '0 C 0
w c '0 E
u " 0 !II 0
c c c '0 '0 -.-o 0 E E . g 0 0 0 0 ~o
[I I 0 • 15 28 27 30 o 20
,. ,.'
, 40
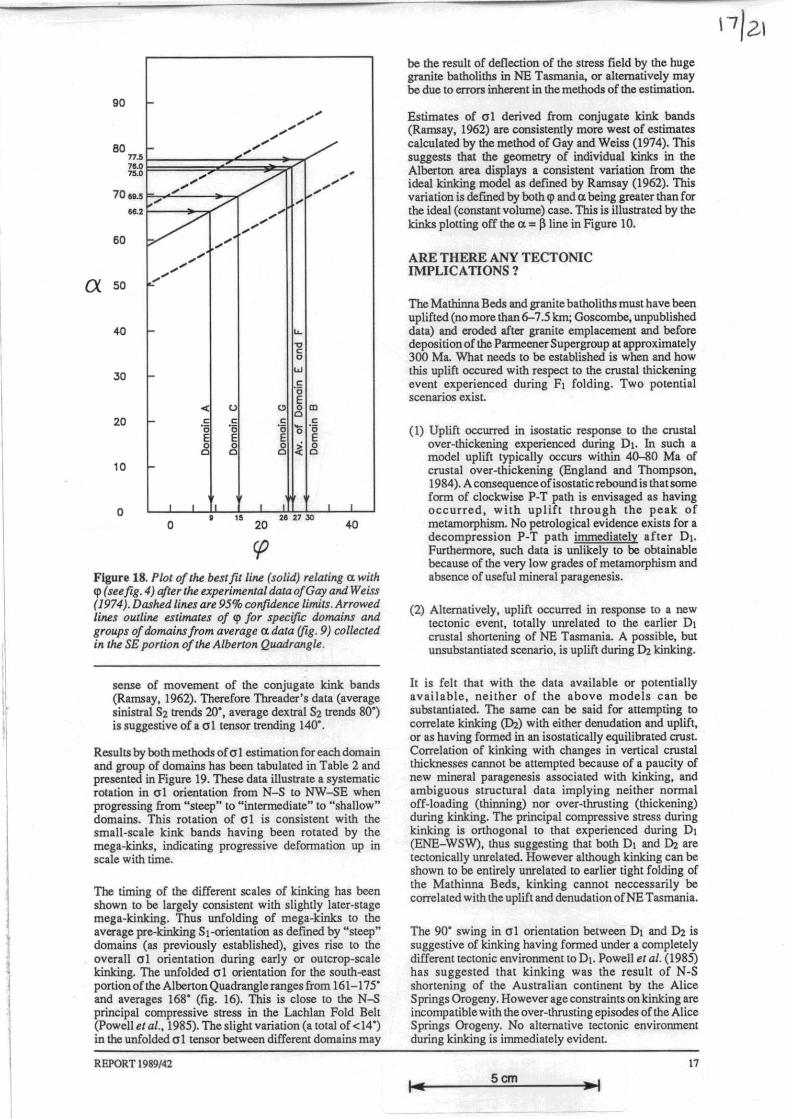
Figure 18. Plot of the bestfitline (solid) relating (l with cp (see fig. 4) after the experimental data of Gay and Weiss (1974). Dashed lines are 95% confidence limits. Arrowed lines outline estimates of <p for specific domains and groups of ""mainsfrom average (l data (fig . 9) collected in the SE portion of the Alberton Quadrangle.
sense of movement of the conjugate kink bands (Ramsay, 1962). Therefore Threader's data (average sinistral S2 trends 20· , average dextral S2 trends 80·) is suggestive of a a 1 tensor trending 140·.
ResullS by both methods of 01 estimation for each domain and group of domains has been tabulated in Table 2 and presented in Figure 19. These data illustrate a systematic rotation in 01 orientation from N-S to NW-SE when progressing from "steep" to "intermediate" to "shallow" domains. This rotation of 01 is consistent with the small-scale kink bands having been rotated by the mega-kinks, indicating progressive defonnation up in scale with time.
The timing of !he different scales of kinking has been shown to be largely consistent with slightly later-stage mega-ltinking. Thus unfolding of mega-kinks to the average pre-kinking S,-orientation as defined by "steep" domains (as previously established), gives rise to the overall 01 orientation during early or outcrop-scale ltinking. The unfolded 01 orien'ation for the south..,ast portion of the Alberton Quadrangle ranges from 161-175" and averages 168· (fig. 16). This is close '0 the N-S principal compressive stress in the Lachlan Fold Belt (Powell et al., 1985). The slight variation (a ,otal of <14·) in the unfolded 01 tensor between different domains may
REPORT1989/42
be the result of deflection of the stress field by the huge grartite batholiths in NE Tasmartia, or alternatively may be due to errors inherent in the methods of the estimation.
Estimates of 01 derived from conjugate ltink bands (Ramsay, 1962) are consistently more west of estimates calculated by the method of Gay and Weiss (1974). This suggeslS that the geometry of individual 1tinks in the Alberton area displays a consistent variation from the ideal kinking model as defmed by Ramsay (1962). This variation is defmed by both cp and (l being greater than for the ideal (constant volume) case. This is illustrated by the 1tinks plotting off the (l = ~ line in Figure 10.
ARE THERE ANY TECTONIC IMPLICATIONS?
The Mathinna Beds and granite batholiths must have been uplifted (no more than 6-7.5 km; Goscombe, unpublished data) and eroded after granite emplacement and before deposition of the Pamteener Supergroup at approximately 300 Ma. What needs to be established is when and how this uplift occured with respect to the crustal thickening event experienced during Fl folding . Two potential scenarios exist
(I) Uplift occurred in isostatic response to the crustal over-thickening experienced during Dl. In such a model uplift typically occurs within 40-80 Ma of crustal over-thickening (England and Thompson, 1984). A consequence of isostatic reboWld is that some form of clockwise P-T path is envisaged as having occurred, with uplift through the peak of metamorphism. No petrological evidence exists for a decompression P-T path immediately after D,. Furthennore, such data is unlikely to be obtainable because of the very low grades of metamorphism and absence of useful mineral paragenesis.
(2) Alternatively, uplift occurred in response to a new tectonic event, totally unrelated to the earlier Dl crustal shortening of NE Tasmania. A possible, but unsubstantiated. scenario. is uplift during D:l kinking.
It is felt that with the data available or potentially available, neither of the above models can be substantiated. The same can be said for attempting to correlate kinking (1)2) with either denudation and uplift, or as having fonned in an isostatically equilibrated crust. Correlation of kinking with changes in vertical crustal thicknesses cannot be attempted because of a paucity of new mineral paragenesis associated with kinking, and ambiguous structural data implying neither normal off-loading (thinning) nor over-thrusting (thickening) during ltinking. The principal compressive stress during kinking is orthogonal to that experienced during Dl (ENE-WSW), thus suggesting that both DI and D2 are tectonically unrelaled. However although kinking can be shown to be entirely unrelated to earlier tight folding of the Mathinna Beds. kinking cannot neccessarily be correlated with the uplift and denudation ofNE Tasmania.
The 90· swing in 01 orientation between DI and D2 is suggestive of ltinking having formed under a completely different tectonic environment to D,. Powell et al. (1985) has sugges'ed that kinking was the result of N-S shortening of the Australian continent by the Alice Springs Orogeny. However age constraints on kinking are incompatible with the over-thrusting episodes of the Alice Springs Orogeny. No alternative tectonic envirorunent during kinking is immediately evident.
17
Scm

I. ,{ k
.. i" TN '" ... 0 :':l ;0 ~
" 22
'" , . \
.\
2.
i~ . , . \ ,. .\ .\ .\ . : . : . . : . . : ,. .: .: .: .: . :
+/ • ..
12
I • ~ • ~ • ... """"" . ,
MN
~ .. . . .
0< •• •• 7 • 72
D AlluYium.
C1 (+""+'+1 l!....!..!.I
Permian lediment.. and overlying dolerite
GranJte - Jl'anodlorlle. post-Sl (366-390 lia)
Wat.hinD.a Bed., with boundary ot megakinJu and leDeTal 5 1- cleavage. \.rends in each domain
- .......... 0"1 derived from ImalJ kink bandl(Gay&Wei •• '74)
~ 0"2 derived from small kink band.(Ramsay '62)
Insel of the avera,. geometriC: relationships of small leale sini.tral and dexlrlll kink band.. (de..sbed), lolId Un •• - 5 t. Labelled by the domains that data WIU drawn (rom .
+ + + + +
7. 7 • ..
\+ + + + \+ .,'---.... +... ..
\+/ j+ " ,+
.2
, , ,. , , . , ,. , ,. , ,. , , . , ,. '.
Figure 19. Summary map afthe average relationships between sinistral and dextral aU/crop-scale kink bands and estimates a/the 01 stress tensor in each structural domain. Map only ;; covers the SE portion of the Alberton Quadrangle.
5cm

EAST OF SCOTTSDALE N n=39
b r
n~4 [
2 0
WEST OF SCOTTSDALE N n=13
\2<-' ~ i i :
4 3 2 0
RELEVANCE TO TIMING OF GOLD MINERALISATION
This report has established the DI and 0, stress fields as being essentially orthogonal. Such a relationship can potenlially be used to constrain the timing of quartz veining associated with gold mineralisation. This can only be done to the extent of illustrating quartz veining to be consistent with either Dl or D2 stress fields. or inconsistent with both.
The strike of gold-mineralised quartz veins in NE Tasmania are plotted on a rose diagram (fig. 20). This dermes the average trend of major groupings to be: 97-(group a); 160' (group b); 32' (group c); and 70' (group d). The spatial variation in vein trends throughout NE Tasmania does not appear to be the result of rotation by the mega-kink bands that have been outlined by this report.
By considering the most simple case, a pure shear model, the axis of maximum extension in a vein is considered to
REPORT1989/42
2
i 2
c n-19
J
",
i 3
D, a,
~
4
'\ i 4
d n-3
d n-7
I-scm
Figure 20. Rose diagrams (5' intervals) of trends of gold·hosting quartz veins from NE Tasmania. Dala sourced from "Mineral Deposits and Metallogenic Map of Tasmania" (J :500 000 scale, Department of Mines Tasmania) . Approximate estimate of O} stress tensor for DJ andD2 are given. alforD} is assumed to be perpendicular to lhe Sl cleavage which was not rotaled by D2 mega-kinking.
be orthogonal to 0'1 . Thus 0'1 will approximately coincide with the length of the vein, if planar (and steep, thus being related to a sub-horizontal 0'1). Within such a model,group a and d are closest only to being consistent with the Dl stress field. Group b is very much consistent with the Dz stress field. However group c (approximately 38% of all data) cannot be correlated with either DI or 0,. It is noted that the average trend of group c is exactly parallel to the average fold axial plane of sinistral kink bands. Accordingly this group of veins could potentially have formed by dilation in kink band hinges, similar to the veinlets illustrated in Figures 2 and 3. Consequently gold-bearing quartz veins potentially formed throughout both DI and 0,.
CONCLUSIONS
A major contribution of this report is the additional constraints offered for the relative timing of the defonnational events in NE Tasmania. as presented in Table 1. Many aspects of kinking in NE Tasmania have been defmed; these include the following.
19
-I
(1) Mega-kink bands have been accurately defined for all of NE Tasmania, and these are correlated with the profuse outcrop-scale kink bands.
(2) Kinking post-dates Middle to Late Devonian granite-granodiorite batholiths and pre-dates the Parmeener Supergroup (i.e. between 300 and 356-398 Ma).
(3) Kinking occurred in response to a 1680 ±7° trending principal compressive stress.
(4) Shortening within individual mega-kink bands was no more than 7-15%, andN-S shortening experienced by the whole of NE Tasmania as a result of kinking on all scales is estimated to be approximately 3-8%.
(5) NNW -S SE crustal shortening by such steep kink bands must have been accommodated by ENE-WSW crustal extension with no crustal thickening.
(6) There is some evidence for progressive kinking both up in scale and to later-stage kinking being dominated by dextral kink bands.
(7) All of the above features are shared in common and may be correlated with those of the Lachlan Fold Belt (Powell et al., 1985).
REFERENCES
40 39 ALLEN, A. R.; STUBBS, D. 1982. An Arl Ar study of polymetamorphic complex in the Arunta Block, Central Australia. Contrib. Mineral. Petrol. 79:319-332.
ALLMENDINGER. STEREONET version 2.6, computer program.
ANDERSON, T. B. 1964. Kink-bands and related geological structures. Nature. 202:272-274.
ANGELIER, 1. 1984. Tectonic analysis of fault slip data sets. f. Geophys. Res. 89:5835-5848.
ANGELIER, 1.; TARANTOLA, A; VALEITE, B.; MANOUSSIS, S. 1982. Inversion of field data in fault tectonics to obtain the regional stress; I, Single phase fault populations: a new method of computing the stress tensor. Geophys. f. R . Astr .. Soc. 69:607-621.
BAILLIE, P. W. 1986. Geological atlas 1:50000 series. Sheet 25 (8516S). Eddystone. Explan. Rep. geol. Surv. Tasm.
BAILLIE, P. W.; POWELL, C. M.; BANKS, M. R.; HILLS, P. B. 1989. The Eastern Tasmania Terrane, in: BURREIT, C. F.; MARTIN, E. L. (eds.). Geology and mineral resources of Tasmania. Spec. Publ. geol. Soc. Aust. 15:234-237.
BANKS, M. R. 1962. Silurian and Devonian systems, in: SPRY, A; BANKS, M. R. The geology of Tasmania. f. geol. Soc. Aust.9(2):177-187.
BANKS, M. R.; SMITH, E. A 1968. A graptolite from the Mathinna Beds, north eastern Tasmania. Aust. 1. Sci. 31(3):118-119.
BURRETT, C. F.; MARTIN, E. L. (eds.). 1989. Geology and mineral resources of Tasmania. Spec. Publ. geol. SocAust. 15.
COCKER, 1. D. 1982. Rb-Sr geochronology and Sr isotopic composition of Devonian granitoids, eastern Tasmania. f. geol. Soc. Aust. 29: 139-158.
REPORT 1989/42
CUDAHY, T. 1. 1983. The Bermagui megakink and associated structures. B.Sc. (Hons) thesis, Macquarie University, Australia.
ENGLAND, P. C.; THOMPSON, A. B. 1984. Pressuretemperature-time paths of regional metamorphism. 1. Heat transfer during the evolution of regions of thickened continental crust. f. Petrol. 25:894-928.
FLEISCHER, R. L.; PRICE; P. B.; SYMES; E. M.; MILLER, D. S. 1964. Fission-track ages and track-annealing behaviour in some micas. Science. 143:349-351.
GAY, N. C.; WEISS, L. E. 1974. The relationship between principal stress directions and the geometry of kinks in foliated rocks. Tectonophysics. 21:287-300.
GEE, R. D.; GROVES, D. I. 1974. Contact structures at a granodiorite intrusion, Piccaninny Point, north east Tasmania. Pap. Proc. R. Soc. Tasm. 107:47-52.
GEE, R. D.; LEGGE, P. J. 1979. Geological atlas one mile series. Sheet 30 (8215N). Beaconsfield (Second Edition). Explan. Rep. geol. Surv. Tasm.
GLEADOW,A J. W.1978. Comparison of fission tracks dating methods: effects of anisotropic etching and accumulated alpha-damage, in: ZARTMAN, R. E. (ed.). Short papers of the fourth international conference, geochronology, cosmochronology, isotope geology. Open File Rep. U. S. geol. Surv. 78-701:143-145.
GOSCOMBE, B. D. 1989. Structure and metamorphism of the northeast Strangways Range, N.T. Ph.D. thesis, University of Melbourne.
HARRISON, T. M. 1981. Diffusion of 40Ar in hornblende. Contrib. Mineral. Petrol. 78:324-331.
HARRISON, T. M.; MCDOUGALL, 1. 1980. Investigations of an intrusive contact, northwest Nelson, New Zealand-1. Thermal, chronological and isotopic constraints. Geochim. Cosmochim.Acta.44:1985-2004.
HOFMANN, A. W.; GILETTI, B. 1. 1970. Diffusion of geochronologically important nuclides in minerals under hydrothermal conditions. Eclogae Geol. Helv. 63:141-150.
KIMURA, G.; KOGA, K.; FunoKA, K. 1989. Deformed soft sediments at the junction between the Mariana and Yap Trenches. f. Struct. Geol. 11:463-472.
LENNOX, P. G. 1980. Ben Lomond sheet Mathinna Beds. Unpubl. Rep. Dep. Mines Tasm.
LONGMAN, M. J. 1966. Geological atlas one mile series. Zone 7 Sheet 39. Launceston. Explan. Rep. geol. Surv. Tasm.
MARSHALL, B. 1969. Geological atlas 1 mile series. Zone 7 Sheet 31 (8315N). Pipers River. Explan. Rep. geol. Surv. Tasm.
MCCLENAGHAN, M. P.; TuRNER, N. J.; BAILLIE, P. W.; et al. 1982. Geology of the Ringarooma-Boobyalla area. Bull. geol. Surv. Tasm. 61.
NAESER, C. W.; FAUL, H. 1969. Fission track annealing in apatite and sphene. f. Geophys. Res. 74:705-710.
PATERSON, M. S.; WEISS, L. E. 1962. Experimental folding in rocks. Nature. 195:1046-1048.
20

PATERSON, M, S,; WEISS, L. E. 1966. Experimental deformation and folding in phyllite. Bull. geol. Soc. Am. 77:343-374.
PLAYFORD, G.; JONES, B. G.; KEMP, E. M. 1976. Palynological evidence for the age of the synorogenic Brewer Conglomerate, Amadeus Basin, central Australia. Alcheringa 1 :235-243.
POWEll, C. McA.; COLE; J. P.; CUDAHY, T. J. 1985. Megakinking in the Lachlan Fold Belt, Australia. 1. Struct. Geol.7:281-300.
RAMSAY,J. G.1962. The geometry of conjugate fold systems. Geol. Mag. 99:516-526.
RAMSAY; J. G. 1967. Folding and fracturing of rocks. McGraw-Hill Book Company: New Yark.
RICKARDS, R. B.; BANKS; M. R. 1979. An Early Devonian monograptid from the Mathinna Beds, Tasmania. Alcheringa.3:307-311.
SCHMIDT, P. W.; McDOUGALL, I. 1977. Palaeomagnetic and potassium-argon dating studies of the Tasmaniandolerites. 1. geol. Soc. Aust. 24:321-328.
SHAW, R. D.; STEWART,A J.; BLACK, L. P.1984. The Arunta Inlier: a complex ensialic mobile belt in central Australia. Part 2: tectonic history. Aust. 1. Earth Sci. 31:457-484.
SHUKULYUKOV, Yu. A; KRYLOV, I. N.; TOLSTIKHIN, I. N.; OVCIDNNIKOVA, G. V. 1965. Tracks of uranium fission fragments in muscovite. Geochem. Int. 2:202-211.
REPORT 1989{42
SUPPE, J. 1985. Principles of structural geology. Prentice-Hall: New Jersey. 336-340.
SWAGER, N. 1985. Solution transfer, mechanical rotation and kink-band boundary migration during crenulation-c1eavage development. 1. Struct. Geol. 7:421-429.
THREADER, V. M. 1967. The geology of the ManganaWaterhouse goldfields with particular referenec to structure and mineralisation. M.Sc. thesis, University of Tasmania.
TuRNER, N. J.; BLACK, L. P.; HIGGINS, N. C. 1986. The St Marys Porphyrite and related dykes-a Devonian intra-caldera ignimbrite and its feeder. Aust. 1. Earth. Sci. 33:201-218.
TURNER, N. J.; CALVER, C. R. 1987. Geological atlas 1:50000 series. Sheet 49 (8514N). StMarys. Explan. Rep. geol. Surv. Tasm.
WILLIAMS, A 1987. Fission track dating in micas. B.Sc. (Hans) thesis, University of Melbourne.
WILLIAMS, E. 1970. Kink-bands developed during folding of sandstone layers at Stony Head, Tasmania. Tectonophysics. 10:433-457.
[28 November 1989)
21