1 Making Home Affordable April 2009 | Making Home Affordable.

Annual AffordableHousing TargetsReport for FY 2013
Meeting the AffordableHousing Challenge:
DEPARTMENT OF COMMUNITY PLANNING,HOUSING AND DEVELOPMENT

HOUSING PRINCIPLES
1. Affordable housing should be a County priority.
2. Market rate affordable housing should be the primary means of providing affordable housing.
The County should continue to support efforts to maintain and preserve that affordable housing
supply and the surrounding neighborhoods.
3. A range of housing choices should be available throughout the County to accommodate
households of all income levels, sizes and needs.
4. In providing housing assistance, priority should be targeted to the lowest-income households –
low income households with children and low income households with members who are elderly
or have disabilities.
5. Affordable housing should be used to help prevent homelessness and promote a diverse
community.
6. Equal housing opportunity should be a reality. Housing discrimination should not exist in
Arlington.
7. Households with children should never be homeless.
HOUSING GOALS
The County Board is striving to achieve the following goals in full partnership with the state and
federal governments and with the expectation that these partners will place a priority on funding
affordable housing programs.
1. Balance support for the elderly and persons with disabilities with a transitional safety net for
working families with children.
2. Prevent and end homelessness.
3. Ensure through all available means that all housing in Arlington County is safe and decent.
4. Ensure that consistent with Arlington’s commitment to sustainability, the production, conversion
and renovation of committed affordable housing is consistent with goals set by the County to
reduce greenhouse gas emissions in Arlington County. 5. Permit no net loss of committed affordable housing, and make every reasonable effort to
maintain the supply of affordable market rate housing.
6. Reduce the number of households in serious housing need (defined as those earning below 40%
of median income who pay more than 40% of their income in rent).
7. Increase the number of housing units with two or more bedrooms in order to match the needs of
households with children.
8. Distribute committed affordable housing within projects, within neighborhoods and throughout
the County.
9. Increase the rate of home ownership throughout the County, and increase homeownership
opportunities for low and moderate income households.
10. Ensure, through all available means, that housing discrimination is eliminated.
11. Provide housing services effectively and efficiently.
Revised Goals Adopted by the Arlington County Board
March 12, 2011
TABLE OF CONTENTS Housing Principles and Goals ...................................................................................................... Inside Front Cover Executive Summary .................................................................................................................................................. 1 Housing Market Indicators ....................................................................................................................................... 3 Goal 1: Balanced Assistance .................................................................................................................................. 6 Goal 2: Homelessness ........................................................................................................................................... 10 Goal 3: Safe and Decent Housing ......................................................................................................................... 13 Goal 4: Sustainability ............................................................................................................................................. 16 Goal 5: No Net Loss of Committed Housing ......................................................................................................... 17 Goal 6: Serious Housing Need .............................................................................................................................. 22 Goal 7: Family-Sized Units .................................................................................................................................... 25 Goal 8: Distribution of Committed Housing ......................................................................................................... 27 Goal 9: Homeownership ........................................................................................................................................ 29 Goal 10: Housing Discrimination .......................................................................................................................... 32 Goal 11: Quality Service ........................................................................................................................................ 34 Glossary................................................................................................................................................................... 35 Appendix 1: 2013 Rent and Vacancy Survey ........................................................................................................ 40 Appendix 2: Update on the Affordability of the Rental Stock ............................................................................... 42

EXECUTIVE SUMMARY
Arlington currently has eleven Affordable Housing Goals, each with numerical Targets. The Annual Affordable Housing Targets Report for FY 2013 begins with an overview of housing market indicators and follows with a section for each goal, presenting baseline data, FY 2013 data, and notes on performance for each Target. Background: The Targets establish a vision of where the County would like to be and provide a quantitative way to measure progress. Success should be measured from where we start as well as to where we want to go. Many of the Targets are interrelated and some conflict with each other at times. For example, creating more family-sized housing units may result in a lower overall number of units created. In addition to the baseline, “stretch” Targets have been established for some goals and “aggressive” targets for others, the latter reflecting a more ideal outcome. The ability to achieve stretch and aggressive targets depends on resources, opportunities and overall economic conditions. Revision to the Targets: The Goals and Targets originally established the County’s objectives and outcome measures for affordable housing until FY 2010. In March of 2011, the County Board approved revisions to the County’s goals and targets, which extended most of the targets to 2015, added two new goals, the prevention/ending of homelessness and sustainable development, and adopted targets to meet those goals. Revisions to the Goals and Targets for 2015 adopted by the Board include:
• Preventing and ending homelessness: o Reduce the number of unsheltered homeless by half o Create a comprehensive homeless service center, including up to 50 year—round
shelter beds o Increase the number of homeless individuals and families moving into permanent
housing, increasing supply of permanent supportive housing units to 425 o Permanent housing for at least 95% of sheltered homeless elders and families with
children and for 65% of sheltered homeless persons with disabilities • Sustainability in producing, converting and renovating committed affordable units (CAFs)
o Reduce total energy use by an average of 15% in total supply of CAF multi-family properties
o Track electric, gas and water utilities in 50% of all CAF rental properties o Reduce total water use by average of 10% in total supply of CAF multi-family
properties • Minimize involuntary displacement of low- and moderate-income households in complexes
being renovated, converted or redeveloped with County assistance. For committed affordable units (CAFs), strive to house 60% of households onsite or nearby.
• Link at least 50% of persons in shelters, transitional or supportive housing to training, employment or enrollment in public assistance benefits.
• Strive to provide rental assistance (including Housing Grants) to 100% of the eligible households requesting rental assistance.
The County Board endorsed a charge for an affordable housing study in December 2012. The purpose of the study is to create a shared community vision of Arlington’s affordable housing as a key component of community sustainability. The study, which will be completed in 2015, will establish priorities in addressing housing need through updated principles, goals and targets. Citizen participation is an important component throughout the study; a citizen Working Group has been appointed by the County Manager to advise and provide input into the study. The Working Group has been meeting regularly, has updated a draft of the County’s housing principles, and is developing draft recommendations for revising several targets. The County completed a Preliminary Data Report and
1

hosted a community forum to receive feedback on the draft housing principles. In FY 2014, a consultant will perform a housing needs survey and housing needs analysis that will inform results and recommendations.
Progress toward Targets: In FY 2013, the County made significant progress in meeting some targets and less in others as highlighted below: Targets that had improved progress in FY 2013 include: The County made significant strides in meeting the new Targets for preventing and ending
homelessness. The Point in Time Survey found that there was a 35% reduction in the unsheltered homeless individuals from 2010 to 2013, well on the way to reducing the number by half by 2015. (Target 2A) Additionally, a building at 2010 14th Street North was purchased by the County to house the year-round Homeless Services Center on the first two floors, and is now under renovation. The Homeless Services Center is scheduled to open in the fall of 2014. (Target 2B)
Over half of the rental CAF units (79%) added in FY 2013 were family-sized. Between FY 2001
and FY 2013, the County has exceeded its target of ensuring that half of the rental committed affordable housing units added are family-sized. (Target 7B)
The County conducted fair housing testing in FY 2013 with a re-test percentage of 5%. The re-
tests did not show any indications of discrimination. (Target 10) Targets that were not achieved in FY 2013 include: The number of homeless families leaving shelters and moving into permanent housing was 74%,
short of the Target of 95%. There are numerous factors that limit families’ ability to obtain permanent housing which include poor credit history; limited number of slots in transitional programs; mental health and/or substance abuse issues; underemployment/unemployment and lack of job skills or readiness. (Target 2D)
A total of 55 Committed Affordable Units (CAFs) were added during FY 2013 compared to the
Target of adding 400 new units per year. The average annual number added from the base year of FY 2003 through FY 2013 is 272. The number of new CAFs in any one year relates to opportunities in the market. (Target 5B)
The Target for 25% of new CAFs to serve households with incomes below 40% of area median
income (AMI) in new CAFs was not met. No units serving this very low income were added in FY 2013. There will be 8 units at Pierce Queen dedicated as supportive housing units for persons earning very low incomes, at or below 40% of AMI. Many of the CAF units added will ultimately be made affordable to lower-income households through the use of project based rent assistance. (Target 6B)
The County fell below its target of assisting 50 low income households to become homeowners,
helping only 2 home buyers with a Moderate Income Purchase Assistance Program (MIPAP) loan. An additional 8 households were served through County facilitated Virginia Housing Development Authority (VHDA) loans. (Target 9B)
2

OVERVIEW: FY 2000-2013 HOUSING MARKET INDICATORS
Rental Housing
The 2013 Countywide average rent increased by $51 per month to $1,934, an increase of 2.7% over the 2012 average. The average rent for elevator building units increased 4.7%, while the average rent for all garden apartments units increased 0.1%.
Data Note: Figures shown are average rents from County Rent and Vacancy Surveys.
The 2013 County Rent and Vacancy Survey found a total of 45,361 units; this is a net increase of 1,047 units over 2012.
The overall vacancy rate for apartments increased from 1.1% in 2012 to 2.5% in 2013. In 2000 a unit at the average rent required an income of 52% of median; in 2013, this
increased to 72% of median income.
From 2008 to 2013, 2,846 units then affordable at 60% of AMI have become unaffordable to that population, a 45% reduction in that affordable rental stock.
3

Owner Housing
Sales prices have increased compared to prices in FY 2012. The median sales price for the time period of August 2012 to July 2013 was $740,000 for a single-family home and $388,000 for a condo1, compared to $690,000 and $375,000 respectively for the time period from August 2010 to July 2011.
Jobs and Housing
New jobs in the region continue to outpace new housing construction.
Based on the trends of the last 25 years, Stephen Fuller, an economist with George Mason University, found that one housing unit is needed for every 1.6 new jobs. A jobs-to-housing ratio of 1.6 represents balance between employment and housing growth.
In 2010, Arlington County had 214,500 jobs (civilian and armed forces) and 105,170 housing
units, which creates a jobs-to-housing ratio of 2.0. Between 2010 and 2015, there will be over 23,1002 new jobs created, but only 9,791 new housing units, which will result in a ratio of 2.1. This means that the number of jobs is increasing faster than the number of housing units needed to serve them.
New jobs increase the number of people competing for housing and scarcity of units drives up
prices.
1 Median home price data is from the Housing Division analysis of data from the County’s Real Estate Records. 2 CPHD - Planning Division: Urban Design and Research, Major Statistics 2005-2030
New Jobs Growing Faster than Housing
214,500
237,600
105,170114,961
50,000
100,000
150,000
200,000
250,000
2010 2015
JobsHousing
4

Foreclosure Issue
Arlington County has the lowest foreclosure rate in the Washington, DC region.
Arlington County Foreclosures Year Number of Foreclosures 2006 28 2007 139 2008 305 2009 300 2010 192 2011 135 2012 77 January to September 2013 43
As of September 2013 there was an average of 5 foreclosures per month in 2013 (compared
to an average of 6 per month in 2012). County and nonprofit homeownership staff have taken numerous steps to address the
foreclosure issue including the following: conducting homeownership and financial literacy classes; performing outreach at community events; providing direct loss mitigation counseling; providing initial intake information to individuals facing foreclosure; and making referrals to foreclosure prevention counselors.
5

GOAL #1: BALANCED ASSISTANCE
Balance support for the elderly and persons with disabilities with a transitional safety net for families with children.
Target 1A: Provide assistance to priority households in the following proportions by FY
2015: 65% to families with children 20% for the elderly, and 15% for persons with disabilities.
This is a 15-year target (2000-2015). It focuses on increasing the share of affordable housing
units and subsidies to families and persons with disabilities. Elders have received a higher share of housing benefits over time relative to the target.
Graph 1 above combines units and households and attempts to eliminate duplications (i.e.
Section 8 or County Housing Grants recipients living in Committed Affordable Units). Prior year’s Goals and Targets reports used a 2004 analysis that showed around 20% of
housing grant recipients and 50% of Section 8 households were being housed in CAF units. A new review conducted in 2012 showed that the percentage of rental assistance recipients (both Section 8 and Housing Grants) living in CAF units increased significantly, to approximately 80%. This new data was used to produce an unduplicated count of households receiving housing assistance.
Graph 1
6

Graphs 2 and 3 provide the data in a different format from the graph on the previous page.
These distinguish the affordable units from the owner and rental subsidies. Note that a unit captured in graph 2 could be occupied by a person who received a subsidy captured in graph 3.
Separating the data on units and subsidies facilitates identifying where variations from the
target balances exist. Graph 2 displays the proportions of committed affordable units (CAFs) that are family-sized,
elderly-only, and accessible or supportive housing units. This graph shows that the proportion of family-sized units is 62%, as compared to the Target of 65%. The percentage of elderly-only and accessible units is slightly higher than targeted.
Table 1: Rental and Owner Housing Assistance for Priority Households Elderly Disabled Families Rental CAF units* 453 48 2,003 Owner CAF units 3 16 525 Supportive Housing** 642 Real Estate Tax Relief 1,021 32 HOPWA 6 Section 8 414 262 705 Housing Grants 406 434 338 Total 2,297 1,440 3,571 FY 2013 31.4% 19.7% 48.9% FY 2015 Target 20% 15% 65% *These numbers exclude the Section 8 and Housing Grants recipients living in elderly, accessible or family-sized CAF units. It also subtracts the four 2-bedroom Milestones units which are also CAFs but are counted in the supportive housing unit count. Due to the large number of disabled households receiving Section 8 or Housing Grants and living in CAF units, it is assumed that a quarter of the accessible CAFs are occupied by disabled Section 8/Housing Grants households. ** This number is a sum of all permanent supportive housing units (i.e. those at Mary Marshall Assisted Living Residence, Columbia Grove, Gates of Ballston, and Views at Clarendon; Milestones I, II, III; Project Hope; CAFs designated for Project-Based rent assistance) Transitional Housing Grants; and group home beds for persons with mental illness, intellectually disabled or physical disabilities. Source: Arlington DHS and DCPHD
Graph 2
7
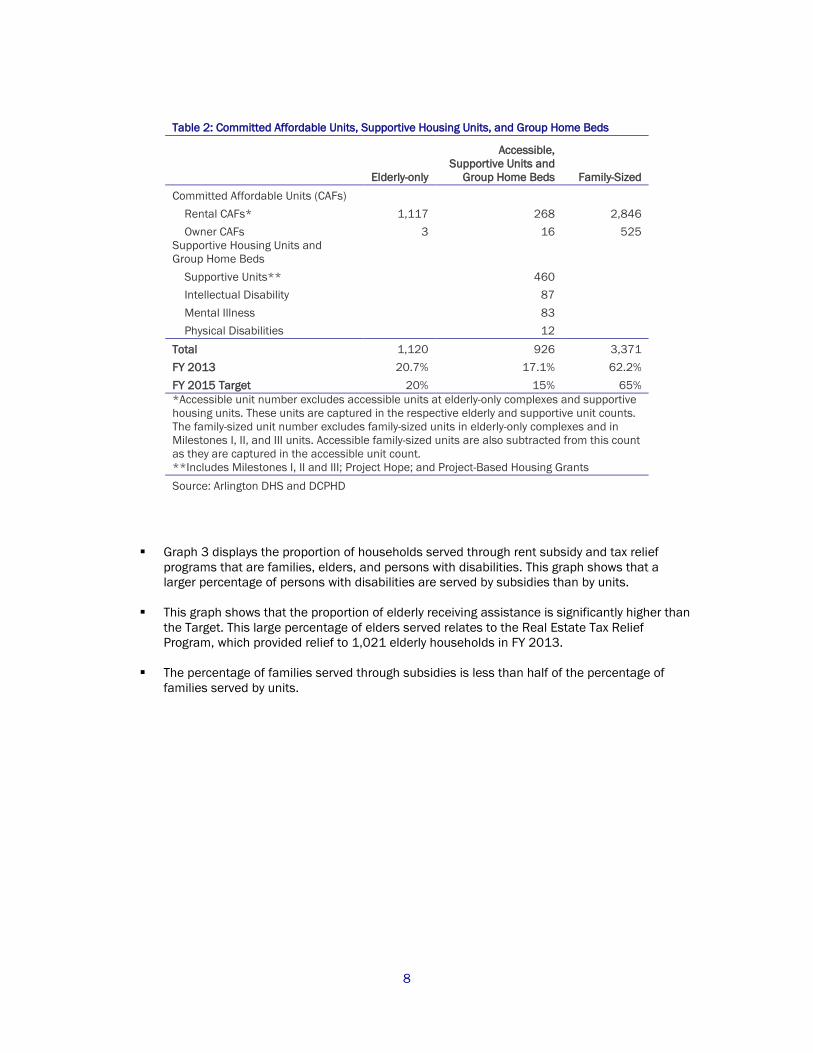
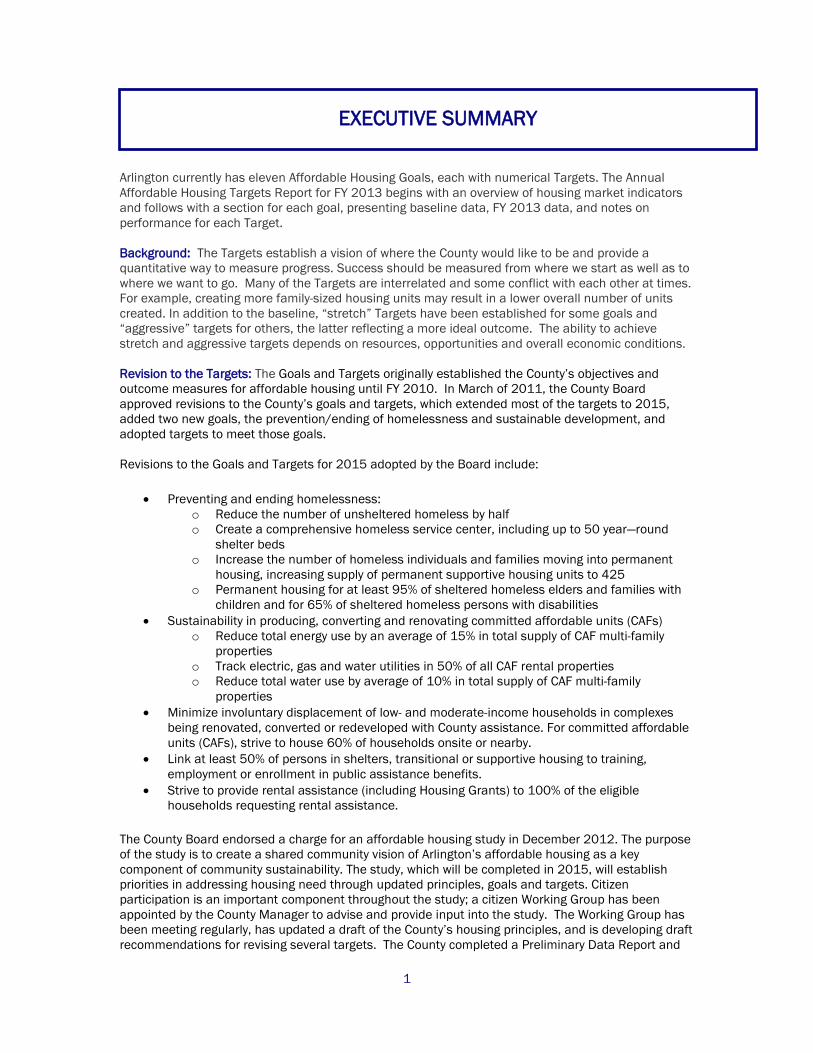
Table 2: Committed Affordable Units, Supportive Housing Units, and Group Home Beds
Elderly-only
Accessible, Supportive Units and
Group Home Beds Family-Sized Committed Affordable Units (CAFs) Rental CAFs* 1,117 268 2,846 Owner CAFs 3 16 525 Supportive Housing Units and Group Home Beds Supportive Units** 460 Intellectual Disability 87 Mental Illness 83 Physical Disabilities 12 Total 1,120 926 3,371 FY 2013 20.7% 17.1% 62.2% FY 2015 Target 20% 15% 65% *Accessible unit number excludes accessible units at elderly-only complexes and supportive housing units. These units are captured in the respective elderly and supportive unit counts. The family-sized unit number excludes family-sized units in elderly-only complexes and in Milestones I, II, and III units. Accessible family-sized units are also subtracted from this count as they are captured in the accessible unit count. **Includes Milestones I, II and III; Project Hope; and Project-Based Housing Grants Source: Arlington DHS and DCPHD
Graph 3 displays the proportion of households served through rent subsidy and tax relief
programs that are families, elders, and persons with disabilities. This graph shows that a larger percentage of persons with disabilities are served by subsidies than by units.
This graph shows that the proportion of elderly receiving assistance is significantly higher than
the Target. This large percentage of elders served relates to the Real Estate Tax Relief Program, which provided relief to 1,021 elderly households in FY 2013.
The percentage of families served through subsidies is less than half of the percentage of
families served by units.
8
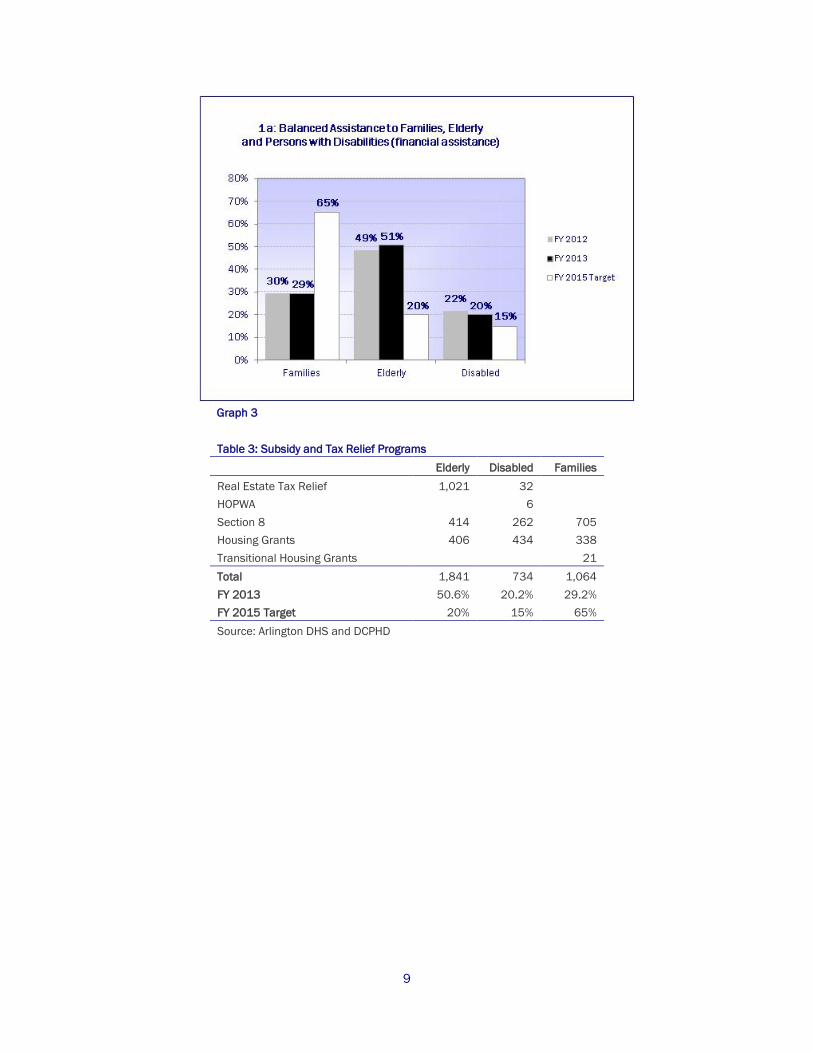
Table 3: Subsidy and Tax Relief Programs Elderly Disabled Families Real Estate Tax Relief 1,021 32 HOPWA 6 Section 8 414 262 705 Housing Grants 406 434 338 Transitional Housing Grants 21 Total 1,841 734 1,064 FY 2013 50.6% 20.2% 29.2% FY 2015 Target 20% 15% 65% Source: Arlington DHS and DCPHD
Graph 3
9
GOAL #2: HOMELESSNESS
Prevent and End Homelessness. Target 2A: Reduce the number of unsheltered homeless by half by 2015.
Unsheltered Homeless Individuals
FY 2010
FY 2011
FY 2012
FY 2013
% Change
223 137 131 146 -35%
The Point in Time Survey found that there were 146 unsheltered homeless individuals in FY 2013, a 35% decrease from 2010.
Target 2B: Create a Comprehensive Homeless Service Center to serve homeless
individuals by 2015, to include up to 50 year-round shelter beds that employ best practices to move homeless people to permanent housing.
The seven-story building at 2010 14th Street North, purchased by the County to house a
number of County uses and the year-round Homeless Services Center on the first two floors, is now under renovation. The Homeless Services Center is scheduled to open in the fall of 2014 making this the final winter season for the Emergency Winter Shelter located at 2049 15th Street North. The new Homeless Services Center will operate 50 beds of emergency shelter year round, 5 respite beds, and have capacity to provide 25 additional beds in the winter in case of extreme weather. Services will be provided to move shelter guests as quickly as possible to permanent housing and link individuals to the necessary services to be successful in housing.
Target 2C: Increase the number of homeless individuals and families moving into
permanent housing through housing grants and supportive housing, with an increase in the supply of permanent supportive housing units to 425 by FY 2015.
Number of Committed Permanent Supportive Housing Units
FY Available at beginning of FY Units coming available
during FY Total
2010 169 13 182 2011 182 16 198 2012 193* 38 230 2013 230 83 313 *The reduction reflects the decreased capacity in the Federal Milestones program of 5 units Source: DHS
From FY 2010 to FY 2013 there was a 72% increase in the total number of supportive housing units.
Total available units at the beginning of the year include units from County and non-profit permanent supportive housing programs.
Permanent supportive units coming available during FY 2013 include 25 new units at Arbor Heights, Arlington Mill, Larkspur, and Marbella and also includes 34 A-SPAN permanent supportive units, 3 New Hope Housing units, and 21 DHS Milestones units.
10
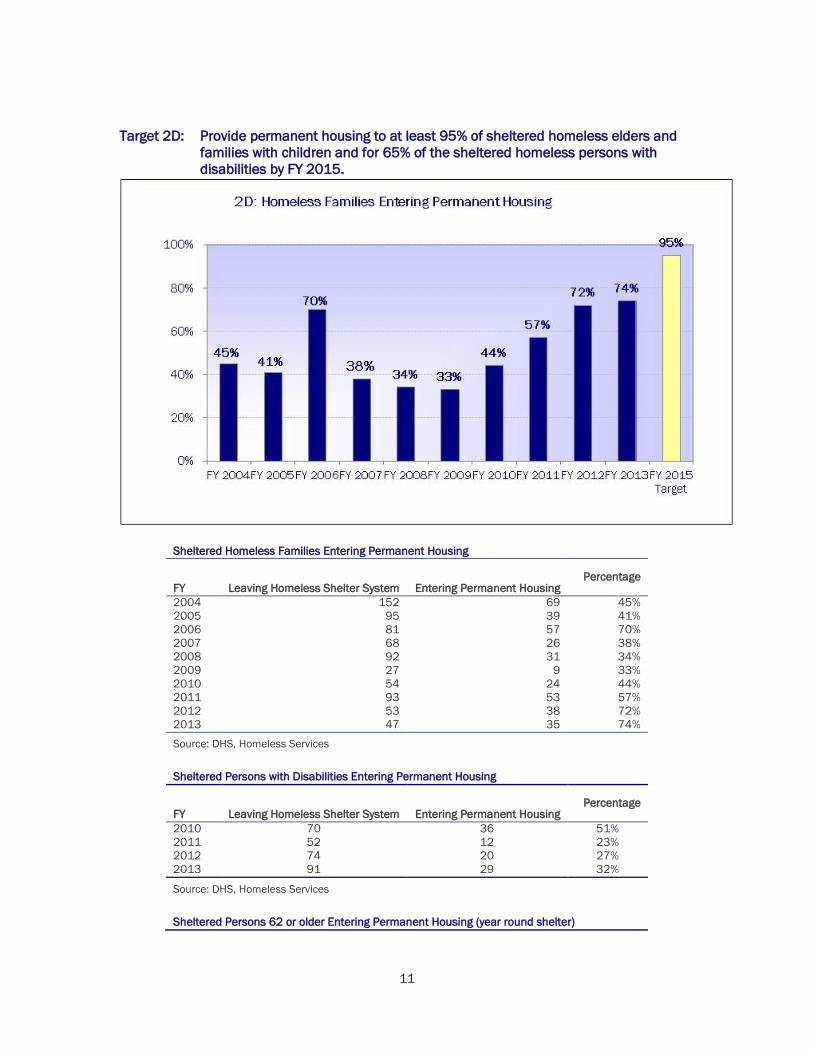
Target 2D: Provide permanent housing to at least 95% of sheltered homeless elders and
families with children and for 65% of the sheltered homeless persons with disabilities by FY 2015.
Sheltered Homeless Families Entering Permanent Housing
FY Leaving Homeless Shelter System Entering Permanent Housing Percentage
2004 152 69 45% 2005 95 39 41% 2006 81 57 70% 2007 68 26 38% 2008 92 31 34% 2009 27 9 33% 2010 54 24 44% 2011 93 53 57% 2012 53 38 72% 2013 47 35 74% Source: DHS, Homeless Services
Sheltered Persons with Disabilities Entering Permanent Housing
FY Leaving Homeless Shelter System Entering Permanent Housing Percentage
2010 70 36 51% 2011 52 12 23% 2012 74 20 27% 2013 91 29 32%
Source: DHS, Homeless Services
Sheltered Persons 62 or older Entering Permanent Housing (year round shelter)
11

FY Leaving Homeless Shelter System Entering Permanent Housing Percentage
2011 7 2 29% 2012 4 3 75% 2013 7 7 100% Source: DHS, Homeless Services
Factors limiting persons’ ability to obtain permanent housing include, but are not limited to:
Low and moderate income coupled with high housing costs. Housing barriers that include poor credit history, and for some, a criminal history that
make it difficult to be approved for rental housing. Mental health and/or substance abuse issues that prevent the individual from following
through with the activities and using the supports needed to gain and maintain housing.
12

GOAL #3: SAFE AND DECENT HOUSING
Ensure through all available means that all housing in Arlington County
is safe and decent. Target 3A: Ensure that 100% of multi-family rental housing units have no major violations
that are not corrected within the standard time permitted by the appropriate code enforcement agency by FY 2015.
All major violations were corrected or remediated within the time frame prescribed by the
inspectors. Due to the severity of these violations—often including life-safety issues—inspectors work aggressively to ensure compliance in the timeframe given. For example, with lack of heat in winter, either the heat was restored or the tenants were provided space heaters or relocated to suitable facilities.
Target 3B: Conduct annual common area inspections3 of all multi-family rental complexes
over 20 years old. Target 3C: Reduce the rates4 of major violations5 in [common area inspections of] multi-
family rental housing by 10% each year.
Common Area Inspections
3 Common Area Inspections: Inspections of common areas in rental projects include inspections of all exterior grounds, trash areas, hallways, stairways, laundry rooms and mechanical rooms. The areas are inspected for violations of the Virginia Uniform Statewide Building Code/Part III. Maintenance of Existing Structures (International Property Maintenance Code), the International Fire Code, the Arlington Zoning Ordinance, the Arlington Condition of Private Property ordinance (formerly the Care of Premises ordinance), and the Arlington Abandoned/Junk Vehicle ordinance.” 4 Rate of major common area housing code violations is defined as: Number of major common area housing violations found __ Number of multi-family rental complexes over 20 years old inspected
Data Note: The FY 2013 Target is equal to a 10% decrease in the FY 2012 rate of 0.46
13

Common Area Inspections
FY Total # of Complexes 20 Years & Older
# of Complexes Inspected Percentage
2006 340 88 26% 2007 344 46 13% 2008 331 72 22% 2009 342 141 41% 2010 346 123 36% 2011 345 166 48% 2012 325 124 38% 2013 346 174 50% Source: CPHD, Code Enforcement Office and Housing Division’s Housing Database.
Common Area Inspections: Major Violations
FY # of Complexes inspected
# of Major Violations Rate
2006 130 36 0.28 2007 122 38 0.31 2008 200 68 0.34 2009 503 146 0.27 2010 541 153 0.28 2011 739 354 0.50 2012 616 286 0.46 2013 868 396 0.46 Source: CPHD, Code Enforcement Office and Housing Division’s Housing Database.
The increase in the number of major violations is due to increased inspections and more vigorous
enforcement as well as a decrease in maintenance staff at most apartment complexes. The common area inspections program is intended to both provide an indicator of the condition of
older complexes for year-to-year comparisons and serve as a deterrent to poor maintenance.
The rate of major violations5 for common area inspections is slightly above the Target set for FY 2013. It should be noted that different complexes may be inspected in any given year.
Target 3C: Reduce the rates6 of major violations5 in [full code inspections of] multi-family
rental housing by 10% each year. Target 3D: Conduct annual full code inspections7 on 5% of all multi-family rental units over
30 years old.
5 Major violations are defined as life-safety issues that may include a range of fire hazards (such as no functioning smoke detector), lack of heat or hot water, lack of adequate plumbing facilities, overcrowding, accumulation of rubbish, infestation (e.g., by rats), cracks in exterior walls, problems with the roof or drainage and hazards affecting stairways, decks, porches or balconies. 6 Rate of major housing code violations in full code inspections is defined as:
Number of major violations (common area and unit) from full code inspections___ Number of units inspected in full code inspections
7 Full code inspections are comprehensive inspections by Community Code, Building and Fire Inspectors of: 1) all common areas and 2) either 100% of the units of small projects (70 or fewer units) or 50% of the units at larger complexes. Additional units may be inspected if warranted.
14
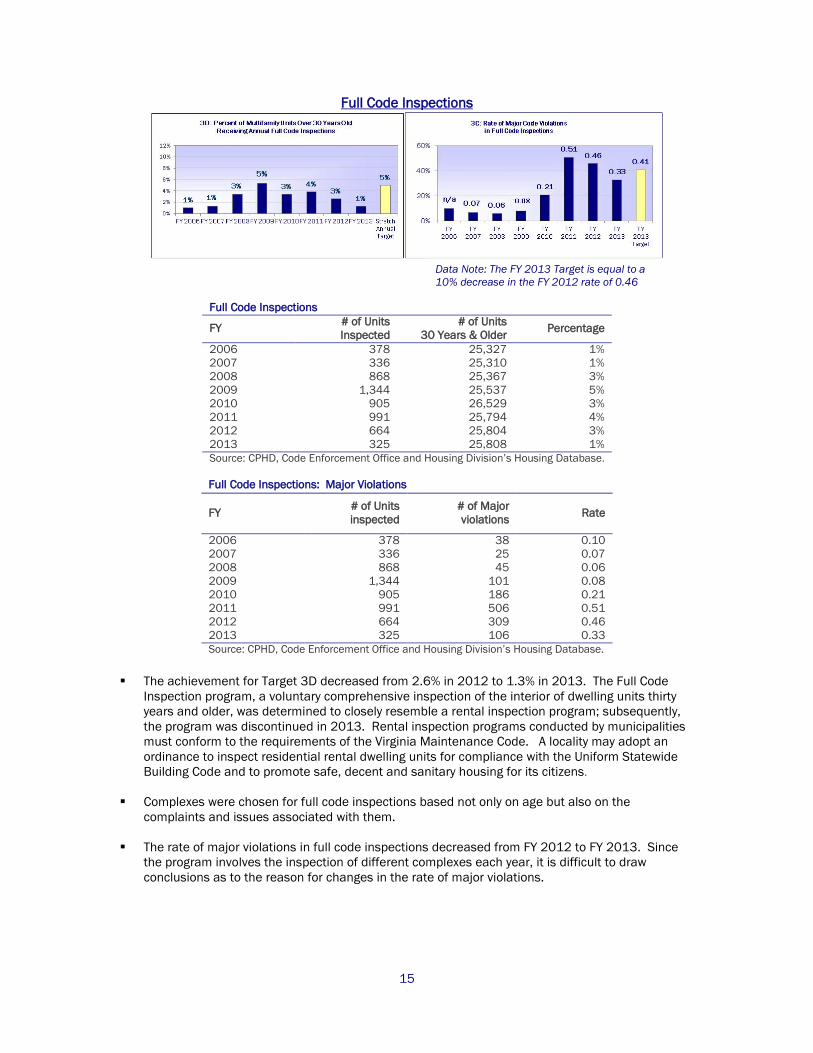
Full Code Inspections
Full Code Inspections: Major Violations
FY # of Units inspected
# of Major violations Rate
2006 378 38 0.10 2007 336 25 0.07 2008 868 45 0.06 2009 1,344 101 0.08 2010 905 186 0.21 2011 991 506 0.51 2012 664 309 0.46 2013 325 106 0.33 Source: CPHD, Code Enforcement Office and Housing Division’s Housing Database.
The achievement for Target 3D decreased from 2.6% in 2012 to 1.3% in 2013. The Full Code
Inspection program, a voluntary comprehensive inspection of the interior of dwelling units thirty years and older, was determined to closely resemble a rental inspection program; subsequently, the program was discontinued in 2013. Rental inspection programs conducted by municipalities must conform to the requirements of the Virginia Maintenance Code. A locality may adopt an ordinance to inspect residential rental dwelling units for compliance with the Uniform Statewide Building Code and to promote safe, decent and sanitary housing for its citizens.
Complexes were chosen for full code inspections based not only on age but also on the complaints and issues associated with them.
The rate of major violations in full code inspections decreased from FY 2012 to FY 2013. Since
the program involves the inspection of different complexes each year, it is difficult to draw conclusions as to the reason for changes in the rate of major violations.
Full Code Inspections
FY # of Units Inspected
# of Units 30 Years & Older Percentage
2006 378 25,327 1% 2007 336 25,310 1% 2008 868 25,367 3% 2009 1,344 25,537 5% 2010 905 26,529 3% 2011 991 25,794 4% 2012 664 25,804 3% 2013 325 25,808 1% Source: CPHD, Code Enforcement Office and Housing Division’s Housing Database.
Data Note: The FY 2013 Target is equal to a 10% decrease in the FY 2012 rate of 0.46
15

GOAL #4: SUSTAINABILITY
Ensure that consistent with Arlington’s commitment to sustainability, the production,
conversion and renovation of committed affordable housing is consistent with goals set by the County to reduce greenhouse gas emissions in Arlington County.
Target 4A: Distribute the Fresh AIRE multi-family toolkit signage and information to 100%
of all CAF rental properties by FY 2013. Target 4B: Track electric, gas, and water utilities in 50% of all CAF rental properties using a
free utility tracking software by FY 2015. Target 4C: Reduce total energy use by an average of 15% in the total supply of CAF multi-
family properties between FY 2011 and FY 2015. Target 4D: Reduce total water use by an average of 10% in the total supply of CAF multi-
family properties between FY 2011 and FY 2015. The County has made significant progress this year toward the 2015 Housing Targets in support of County energy goals. Staff expanded on previous efforts to engage the committed affordable (CAF) multifamily residents, property owners, and managers. Staff also worked directly with residents in several CAF properties to help them take action in their homes that save energy and water. Outreach programs such as Energy Jeopardy, Energy Bingo, and action-oriented discussions in English and Spanish were added to community outreach this year. These programs reached both adults and kids in a fun and interactive manner. Educational signage about energy efficiency, water conservation, recycling, and transit were disseminated to all CAF properties. This action helped to achieve goal 4A and increase tenant awareness. In 2013, staff worked in partnership with Arlingtonians for a Clean Environment (ACE) to help weatherize homes and install high performance water fixtures. These actions helped with resident education, utility cost reduction, and provided needed changes in their homes that directly support goals 4B, 4C, and 4D. Staff met with APAH and AHC to discuss utility tracking and asset management. Staff provided in-person training and resources to encourage managers of these properties to actively manage their assets, make efficiency upgrades, and see the results. Affordable housing providers should proactively track utilities to make progress toward goal 4B. In response to concern about moisture and energy issues in Arlington’s affordable housing stock, staff facilitated a half-day training on healthy buildings. The event was attended by many affordable housing providers in the County. Staff plans to continue efforts to support CAF properties to reduce utility costs and increase occupant comfort in 2014. Target 4E: Each new or rehabilitation project will be in compliance with EarthCraft, LEED or
other comparable certification if the developer receives Low Income Housing Tax Credits.
All projects that received Low Income Housing Tax Credits in FY 2013 will be in compliance with EarthCraft.
Pierce Queen – EarthCraft
16

GOAL #5: LOSS OF AFFORDABLE HOUSING
Permit no net loss of committed affordable housing, and make every reasonable effort
to maintain the supply of affordable market rate housing. Target 5A: Any CAFs lost should be replaced as a priority. During FY 2013 there was no loss of CAF units. No CAF units are scheduled to expire before
FY 2015, however if a situation arises such as a refinancing or sale of a CAF property, then the County will make it a priority to ensure that the CAF units remain committed.
Target 5B: Help maintain the supply of affordable housing by assisting an
average of 400 net new committed affordable housing units per year, especially the preservation of existing affordable housing through partnerships with nonprofit housing providers, while meeting the Targets
for goals 6, 7, 8 and 9.
New Committed Affordable Units Added by Fiscal Year
FY Complex Total Units New Committed Affordable Units
2003 1,137 748 2004 372 139 2005 2,030 284 2006 797 295 2007 1,217 472 2008 642 207
17

2009 56 56 2010 492 136 2011 911 303 2012 920 293 2013 Rental
Pierce Queen (50 units counted previously) 193 26
Bergmann’s 202 11 Crystal City Post Office 198 16
Owner Miscellaneous owner programs 2 2
FY 2013 Total 595 55 FY 2003 – 2013 Average Net New Committed
Affordable Units (CAFs) 272
Source: CPHD, Housing Division Data Note: Site plans by for-profit developers are shown as “Committed Affordable Units” when construction begins so some projects approved by the County Board during FY 2013 do not appear above.
The County has added an average of 272 new committed affordable units (CAFs) annually
between FY 2003 and 2013, compared to the Target of adding 400 new CAFs annually.
Of the 55 CAFs added in FY 2013, 53 were rental and 2 were owner CAFs. The total CAF rental supply as of the end of FY 2013 was 6,638 units.
County Allocates over $10 Million for Affordable Housing Development The Affordable Housing Investment Fund (AHIF), is comprised of HOME funds, local general revenues, and 1% of recordation tax received by the County (typically about $1 million each year). Established in 1985 as a revolving loan fund, it now has loan repayments and Affordable Dwelling Unit Ordinance contributions from developers of approximately $2-$4 million annually. The County Board has made extraordinary efforts over the past year to further affordable housing in Arlington County.
18

Target 5C: In residential site plan projects, ensure developers comply with the Affordable Housing Ordinance to provide a cash contribution or affordable housing units. If the density bonus is used, target 20% with a stretch target of 50% of the total bonus units, bedrooms or gross floor area as affordable.
Three residential site plan projects were approved in FY 2013 (shown in table below).
An additional three commercial site plans were approved that will provide an affordable housing
cash contribution of approximately $3.5 million.
In December 2005, the County Board approved amendments to the County’s Zoning Ordinance that include affordable housing requirements for site plan projects. This action concluded six -months of meetings and negotiations through the Arlington Affordable Housing Roundtable, which was chaired by County Board member Jay Fisette (then chairman) and included participants from the development community, civic groups, housing advocates and the Planning and Housing Commissions.
The requirements of the Affordable Housing Ordinance are designed to foster creation of affordable housing and to streamline the approval process. The developer chooses whether to provide:
5% of the Gross Floor Area (GFA) as on-site affordable units; 7.5% of the GFA as affordable units off-site nearby; 10% of the GFA as affordable units anywhere in Arlington County; or Cash contributions: $1.81/sq. ft. of GFA for first 1.0 FAR; $4.83/sq. ft. from 1.0 to 3.0
FAR for residential; $9.67/sq. ft. of GFA above 3.0 for residential; and $4.83/sq. ft. above 1.0 FAR in commercial8.
Developers agree to fulfill the affordable housing requirement at the time of site plan approval. However, they do not need to declare which of the four options they choose until they file for a Certificate of Occupancy for the project. Some projects, because of increases in density, agree to provide units at the time of approval. The potential performance toward this Target is shown on the following table using the GFA formulas to estimate the number of units or amount of contributions which might result.
Potential Benefits from New Residential Site Plans Approved under the Affordable Housing Ordinance (For-Profit Developers)
FY 2013 Approved Site Plans
Total Project
Units
Alternative Benefits from Affordable Housing Ordinance
Additional Benefit
Units if 5% of GFA
Units if 7.5% of GFA
Contribution Option
On-Site Units Option
Contribution Option
Rosslyn Gateway 273 38 57 $6,000,000 0 0 Bergmann’s 202 1 2 $231,349 10 0 Crystal City Post Office 198 6 9 $460,233 16 0 FY 2013 Total 681 45 68 $6,691,582 26 0
8 Cash contribution amounts are indexed to the Consumer Price Index for Housing in the Washington-Baltimore MSA. These are the 2013 figures.
19

Approved Bonus Density for Affordable Housing (For-Profit Developers)
FY
Number of Bonus
Units
Number of CAFs in
Bonus
CAFS as Percent
of Bonus 2004 97 35 36.1% 2005 66 27 40.9% 2006 47 31 66.0% 2007 249 100 40.2% 2008 95 48 50.5% 2009 0 0 0% 2010 0 0 0% 2011 0 0 0% 2012 27 6 22.2% 2013 Bergmann’s 33 8 24.2% 2013 Total 33 8 24.2% Source: CPHD, Housing Division
The density bonus for rental affordable housing, as originally implemented, used the income from the additional market rate units to offset the cost of the affordable units and, in the baseline year FY 2002, resulted in projects with roughly 29% of the bonus units being affordable.
While the aggressive Target aims for 50% of bonus units as affordable, the recent focus has aimed for 50% of the Gross Floor Area (GFA) as affordable. This allows for flexibility in unit mix; for example, getting fewer units but larger ones.
Bergmann’s was the only project in FY 2013 that took advantage of the bonus density, however
the Crystal City Post Office project provided 16 CAF units because they were provided additional density through the Crystal City Sector Plan. The goal of the Plan is for 20% of the additional density to be committed as on-site affordable.
Total ADU % of Add'lProject Units on-site Density
Crystal City Post Office 198 16 20%
20
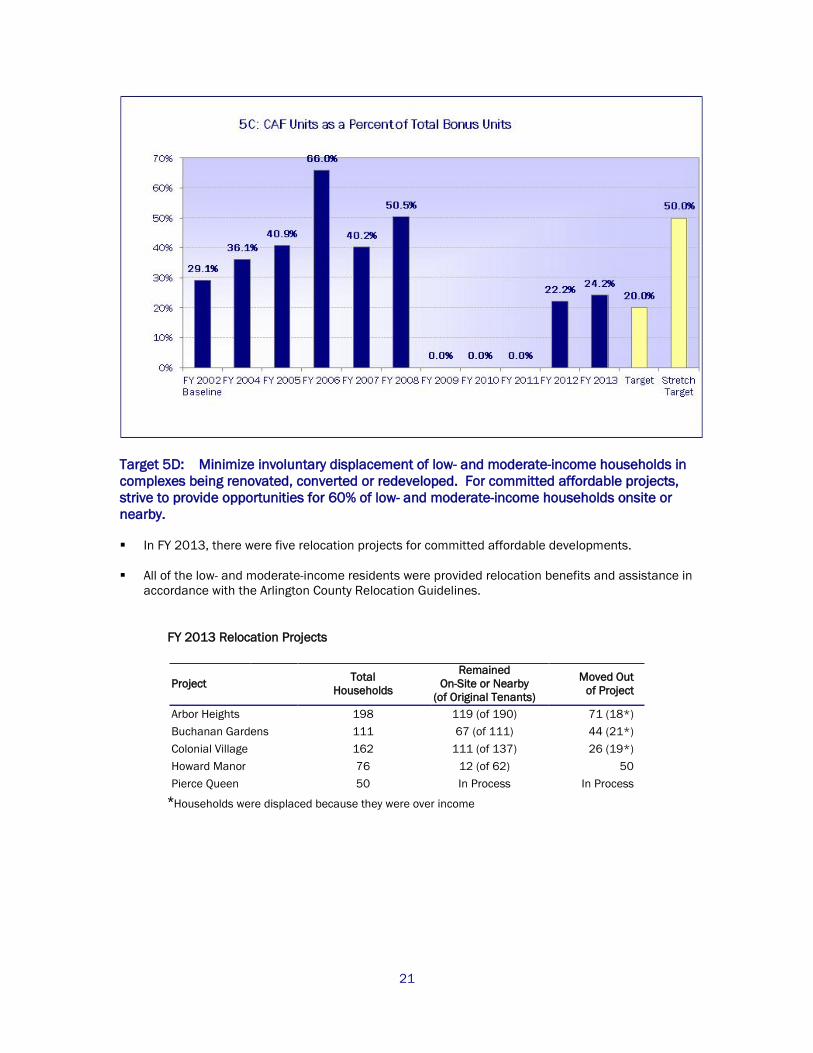
Target 5D: Minimize involuntary displacement of low- and moderate-income households in complexes being renovated, converted or redeveloped. For committed affordable projects, strive to provide opportunities for 60% of low- and moderate-income households onsite or nearby. In FY 2013, there were five relocation projects for committed affordable developments.
All of the low- and moderate-income residents were provided relocation benefits and assistance in
accordance with the Arlington County Relocation Guidelines.
FY 2013 Relocation Projects
Project Total Households
Remained On-Site or Nearby
(of Original Tenants)
Moved Out of Project
Arbor Heights 198 119 (of 190) 71 (18*) Buchanan Gardens 111 67 (of 111) 44 (21*) Colonial Village 162 111 (of 137) 26 (19*) Howard Manor 76 12 (of 62) 50 Pierce Queen 50 In Process In Process
*Households were displaced because they were over income
21

GOAL #6: SERIOUS HOUSING NEED
Reduce the number of households in serious housing need
(defined as those earning below 40% of median income who pay more than 40% of their income for rent).
Target 6A: Strive to provide rental assistance (including Housing Grants) to 100% of the
eligible households requesting rental assistance.
Housing Grants: The program remained open in FY 2013. Any Arlington renter interested in the program is offered the chance to apply. Households are assessed and those meeting eligibility criteria are enrolled in the program. Housing Choice Voucher (Section 8) This ability to serve households is limited by the funding received from the federal government. With this limitation, Arlington has not been able to serve all potentially eligible households.
Rental Assistance
FY 2007 FY 2008 FY 2009 FY 2010 FY 2011 FY 2012 FY 2013 Section 8, Housing Vouchers, and project- based Section 8 (administered or monitored by County) 1,566 1,461 1,461 1,461 1,511 1,546 1,468* Other Section 8 and Section 202 (not administered or monitored by County) 785 855 855 855 855 855 855
Housing Grants** 710 871 934 1,122 1,182 1,383 1,327 Housing Opportunities for Persons with AIDS (HOPWA) 10 10 4 6 6 6 6
22
Milestones 19 18 18 20 19 19 19 Project HOPE - Program for Assertive Community Treatment (PACT) 5 5 5 1 1 1 0 Total 3,095 3,220 3,277 3,465 3,574 3,810 3,675 Source: DHS and CPHD * 1546 is the allocation from HUD, due to sequestration the allocation was decreased by 5% to 1468 **Housing Grant number includes Transitional Housing Grants and Project Based Housing Grants
The increase in Section 8 Housing Vouchers in FY 2012 represents the conversion of 36 project-
based units to regular vouchers and in FY 2011 the increase was due to an award of an allocation and funds for 50 additional vouchers under HUD's Family Unification Program.
Department of Human Services staff has seen demand and growth over the past four years in the Housing Grant program that exceeded expectations, which is attributed to the downward turn in the economy. The increase in FY 2006 and FY 2007 over FY 2005 reflects two new County-funded programs, Transitional Housing Grants and Project-Based Housing Grants.
Project-based Housing Grants: Some committed affordable units are designated to serve persons with disabilities, including homeless, needing permanent supportive housing. This program assures affordability for these very low income persons.
Transitional Housing Program: This rent subsidy program serves households with issues such as mental illness or domestic abuse who are leaving shelters and entering transitional programs.
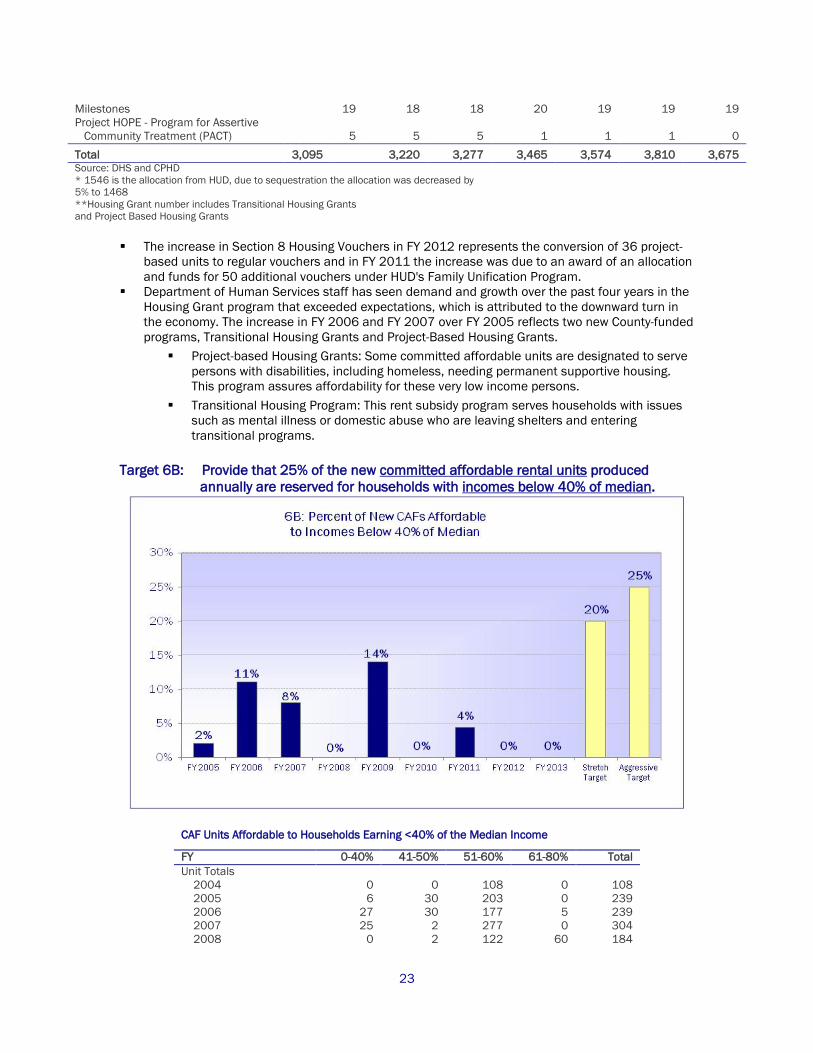
Target 6B: Provide that 25% of the new committed affordable rental units produced
annually are reserved for households with incomes below 40% of median.
CAF Units Affordable to Households Earning <40% of the Median Income
FY 0-40% 41-50% 51-60% 61-80% Total Unit Totals 2004 0 0 108 0 108 2005 6 30 203 0 239 2006 27 30 177 5 239 2007 25 2 277 0 304 2008 0 2 122 60 184
23

2009 5 6 25 0 36 2010 0 11 121 0 132 2011 13 37 245 0 295 2012 0 59 233 0 292 2013 0 39 64 0 1034 Percentages 2004 0% 0% 100% 0% 100% 2005 2% 13% 85% 0% 100% 2006 11% 13% 74% 2% 100% 2007 8% 1% 91% 0% 100% 2008 0% 1% 66% 33% 100% 2009 14% 17% 69% 0% 100% 2010 0% 8% 92% 0% 100% 2011 4% 13% 83% 0% 100% 2012 0% 20% 80% 0% 100% 2013 0% 38% 62% 0% 100% Source: CPHD, Housing Division
4 Since Pierce Queen was a total renovation and the income requirements of the units reconfigured, the total unit count of 76 was used.
There will be 8 units at Pierce Queen dedicated as supportive housing units for persons earning
very low incomes, at or below 40% of AMI.
The percent of new CAFs affordable to households earning 40% and below has averaged 4% from FY 2004 to FY 2013. The majority of those served in both the supportive housing units and the Milestones
programs will be persons with disabilities who have incomes below 20% of median income. (The Milestones program is not counted here but serves 20 households.) Typically the source of income will be Supplemental Security Income (SSI) which provides incomes below $7,000 (under 11% of median income).
Target 6C: Place at least 50% of persons in shelters, transitional and supportive housing
with skills training, employment placement or enrollment in public assistance benefits.
Arlington Employment Center Homeless Program
Number Served Number Placed Percentage Served Average Wage of those Placed
FY 2011
28
17
61%
$9.00/hour
FY 2012 35 21 60% $10.37/hour FY 2013 32 21 65% $12.90/hour
Enrollment in Benefits
FY 2011 FY 2012 FY 2013 Total households leaving transitional, shelter, and supportive housing programs
219
190
205
Total number of households leaving with at least one "non-cash benefit"
155 135 179
Number of benefits received compared with number of households leaving the programs.
71% 71% 87%
24

GOAL #7: FAMILY-SIZED UNITS
Increase the number of housing units with two or more bedrooms in order to match the needs of households with children.
Target 7A: Increase the number of family-sized units in the County to 61,000 by FY 2015. This is a 15-year Target. According to information from the U.S. Census Bureau 2006-2010
American Community Survey 5-Year Estimates, this target has been achieved, and will be reevaluated the next time the targets are reviewed.
Total Family-Sized Units, 1990-2010
CY* Total Units Total Family-Sized Units
1990 84,847 53,292 2000 90,426 54,676 2010 102,156 65,048 *CY means calendar year. Source: Data for 1990 and 2000 are from the U.S. Census. The 2010 is from the 2006-2010 American Community Survey 5-Year Estimate.
Target 7B: Provide that half of the rental committed affordable housing units added
between FY 2001 and FY 2015 are family-sized, of which 25% would be greater than two bedrooms.
25
Number of New CAF Rental Units
FY Number of Bedrooms Total Total Percent
2 3 4+ Family-Sized CAFs Family-Sized
2001 145 23 7 175 332 53%
2002 31 6 0 37 113 33%
2003 290 25 0 315 723 44%
2004 39 7 0 46 108 43%
2005 79 23 0 102 239 43%
2006 111 44 3 158 239 66%
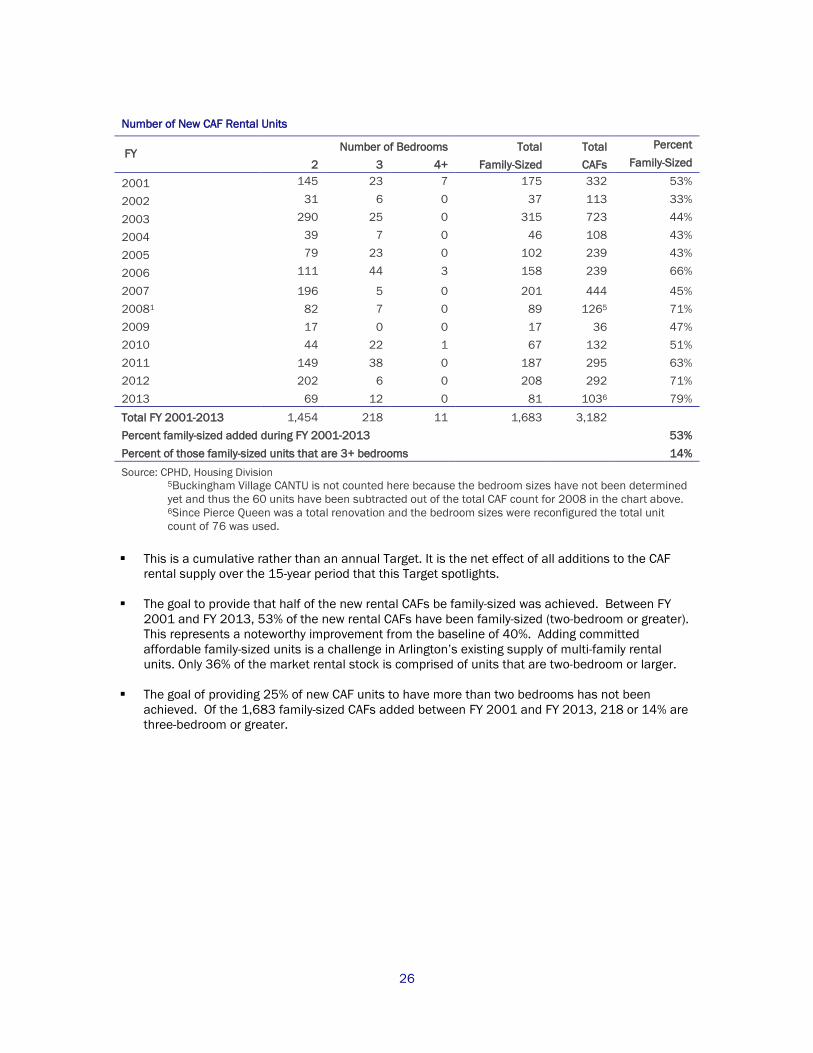
2007 196 5 0 201 444 45% 20081 82 7 0 89 1265 71% 2009 17 0 0 17 36 47% 2010 44 22 1 67 132 51% 2011 149 38 0 187 295 63% 2012 202 6 0 208 292 71% 2013 69 12 0 81 1036 79% Total FY 2001-2013 1,454 218 11 1,683 3,182 Percent family-sized added during FY 2001-2013 53% Percent of those family-sized units that are 3+ bedrooms 14% Source: CPHD, Housing Division
5Buckingham Village CANTU is not counted here because the bedroom sizes have not been determined yet and thus the 60 units have been subtracted out of the total CAF count for 2008 in the chart above. 6Since Pierce Queen was a total renovation and the bedroom sizes were reconfigured the total unit count of 76 was used.
This is a cumulative rather than an annual Target. It is the net effect of all additions to the CAF
rental supply over the 15-year period that this Target spotlights. The goal to provide that half of the new rental CAFs be family-sized was achieved. Between FY
2001 and FY 2013, 53% of the new rental CAFs have been family-sized (two-bedroom or greater). This represents a noteworthy improvement from the baseline of 40%. Adding committed affordable family-sized units is a challenge in Arlington’s existing supply of multi-family rental units. Only 36% of the market rental stock is comprised of units that are two-bedroom or larger.
The goal of providing 25% of new CAF units to have more than two bedrooms has not been achieved. Of the 1,683 family-sized CAFs added between FY 2001 and FY 2013, 218 or 14% are three-bedroom or greater.
26
GOAL #8: DISTRIBUTION OF COMMITTED HOUSING
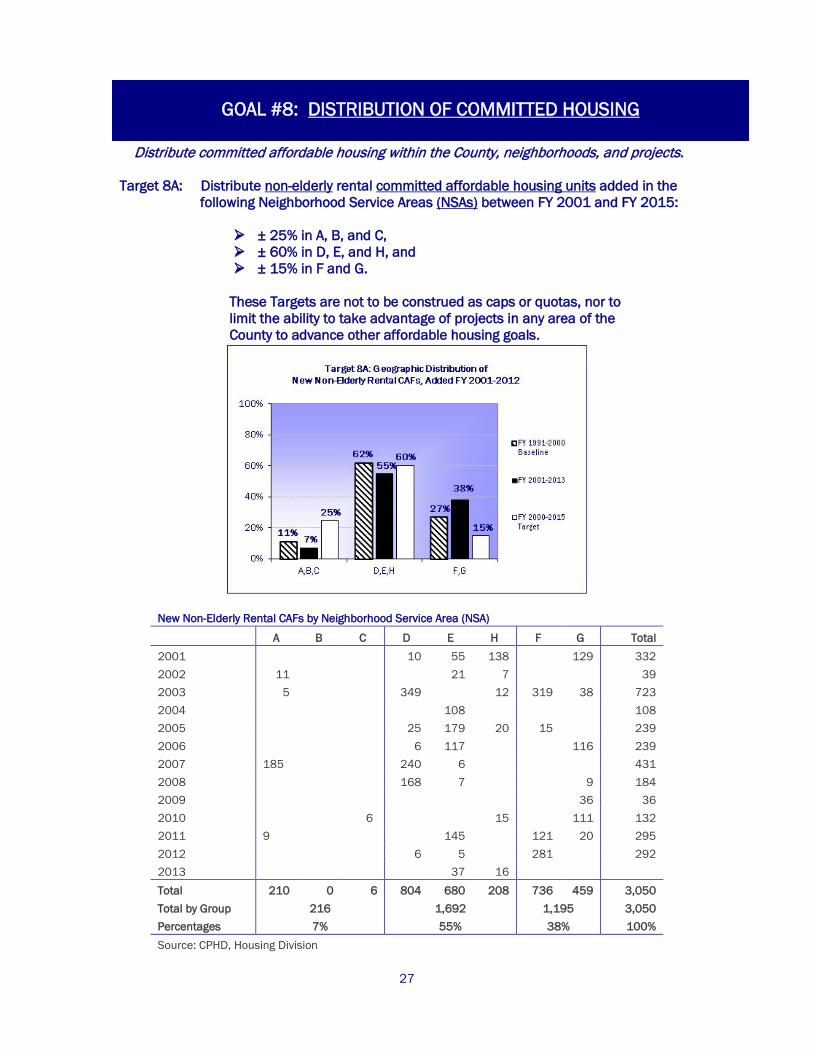
Distribute committed affordable housing within the County, neighborhoods, and projects. Target 8A: Distribute non-elderly rental committed affordable housing units added in the
following Neighborhood Service Areas (NSAs) between FY 2001 and FY 2015:
± 25% in A, B, and C, ± 60% in D, E, and H, and ± 15% in F and G.
These Targets are not to be construed as caps or quotas, nor to limit the ability to take advantage of projects in any area of the County to advance other affordable housing goals.
New Non-Elderly Rental CAFs by Neighborhood Service Area (NSA)
A B C D E H F G Total 2001 10 55 138 129 332 2002 11 21 7 39 2003 5 349 12 319 38 723 2004 108 108 2005 25 179 20 15 239 2006 6 117 116 239 2007 185 240 6 431 2008 168 7 9 184 2009 36 36 2010 6 15 111 132 2011 9 145 121 20 295 2012 6 5 281 292 2013 37 16 Total 210 0 6 804 680 208 736 459 3,050 Total by Group 216 1,692 1,195 3,050 Percentages 7% 55% 38% 100% Source: CPHD, Housing Division
27

A
B
CD
F
G
E
H
Major Roads
Neighborhood Service Area Boundary
I-66
I-66
Rte 50
Rte 50
George Washington Pkwy
I-395
I-395
The performance towards this Target as of the FY 2012 Annual Targets Report was 7% in A, B,
and C; 54% in D, E, and H; and 39% in F and G.
All of the CAFs added in FY 2013 were in NSA E and H, which increased the percentage to 55% in compared to 54% in 2012.
28

GOAL #9: HOME OWNERSHIP
Increase the rate of homeownership throughout the County, and increase homeownership
education and opportunities for low and moderate income households.
Target 9A: Increase the homeownership rate from 46.4% to 47% with a stretch goal of 50% throughout the County by 2015.
Source: CPHD, Housing Division and Department of Management and Finance, Division of Real Estate Assessments
Data Note: Data used to compute the homeownership rate came from two sources: 1) the Department of Real Estate Assessments for owner-occupied and renter-occupied single family units (includes condominiums, cooperative, townhouses and detached); and 2) the Housing Division’s housing database for the total number of multifamily renter units.
The homeownership rate calculated by the County as noted above decreased slightly from 45.6%
in 2012 to 45.0% in 2013 after surpassing the target of 47% in 2007. This is due in large measure to the shift from condominiums to rental projects in many of the newer projects coming online in the past few years.
For purposes of comparison, the 2010 Census found that the percentage of owner-occupied units in Arlington was 43.3%. For 2012 American Community Survey census data can be obtained for 1-year, 3-year and 5-year estimates. The ownership rate differs (as well as the margin of error) as follows:
Method Owner- occupied MofE 1-year 42.0% +/-2.0 3-year 44.3% +/-1.3 5-year 45.9% +/-1.0
29

Target 9B: Provide homeownership education to 700 households with incomes below 80% of median and annually assist 50 households with incomes below 80% of median to become homeowners.
For FY 2013, nonprofit partner Arlington Homeownership Made Easier (AHOME) provided 24 sessions of the six-hour Virginia Housing and Development Authority’s homeownership education course for 219 households with incomes below 80%. The workshops are conducted in both English and Spanish. AHOME is the only housing counseling agency in Virginia that offers a regularly scheduled monthly course offering in Spanish.
Previously, VHDA required prospective homebuyers to take the course in person, but now clients can also take the course on-line, in both English and Spanish. Accordingly, a good number of households are now taking advantage of this option. Also, clients who want to purchase in Arlington County can take the course at any other location in Virginia, such as the monthly course conducted by the Northern Virginia Association of Realtors.
Additionally, County homeownership staff conducted 422 individual homeownership counseling
sessions for prospective first time homebuyers in FY 2013.
30

The County provided direct down payment and closing cost assistance to two low or moderate
income households in FY 2013.
An additional 8 middle income households were served through Virginia Housing Development Authority (VHDA) programs which have higher income limits.
The County is currently working within a regional framework to address HUD/FHA issues that
present barriers to homeownership for lower income households. o Both FHA and VHDA limit the percentage of mortgages that they will finance for an
individual condominium project. FHA will fund up to 50% of the mortgages, while VHDA limits their mortgages to no more than 25% of condominium units.
o Once these limits are reached, the only option for most first time homebuyers is to purchase using conventional Fannie Mae/Freddie Mac mortgages. These mortgage products generally require higher credit quality and credit scores, and can require larger down payments from the purchasers as well.
o All condominiums with FHA, VHDA, or conventional mortgages require FHA approval of the
condominium complex as a whole. This generally means that the complex must certify that they have less than 50% renters or investors, have sufficient capital reserves, and have very few condominium owners who are delinquent on their monthly condominium dues. FHA approval must be renewed every two years.
o The Arlington homeownership program has developed a Condominium Initiative to
educate condo owners on FHA approval, teach the basics of condominium management and governance, and provide education on energy and sustainability. The first condominium workshop was held in May 2013, with the full program to be implemented in FY 2014.
Target 9C: Increase the homeownership rate for minority households from 24.2% to 30% by 2015. This is a 15-year Target and according to the 2010 Census, the homeownership rate for minority
households increased from 24.2% in 2000 to 28.8% in 2010.
In FY 2013, one of the two households that received MIPAP homeownership assistance was headed by a minority person.
The County conducts affirmative marketing to minorities for its homeownership programs.
Homeownership training is provided in multiple languages, e.g., Spanish, Vietnamese, and Korean.
Of approximately 600 households that attended the homeownership fair in 2013, approximately
50% were minorities.
31
GOAL #10: HOUSING DISCRIMINATION
Ensure, through all available means, that housing discrimination is eliminated.
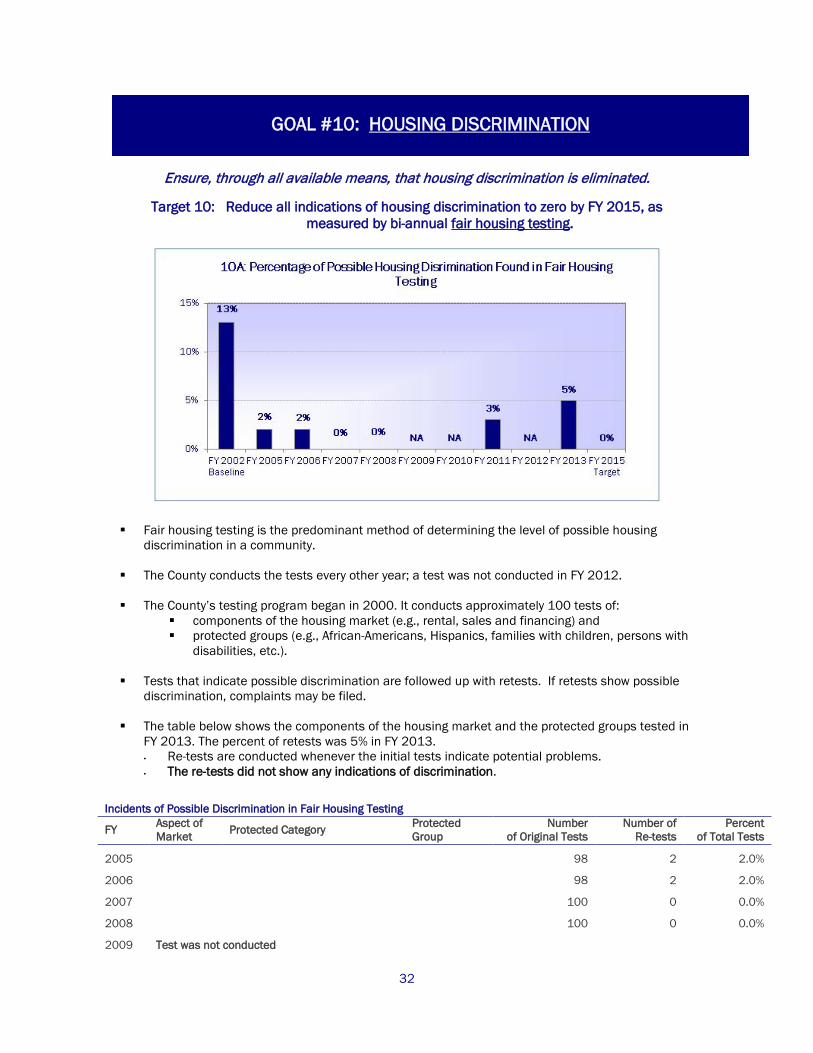
Target 10: Reduce all indications of housing discrimination to zero by FY 2015, as
measured by bi-annual fair housing testing.
Fair housing testing is the predominant method of determining the level of possible housing
discrimination in a community. The County conducts the tests every other year; a test was not conducted in FY 2012.
The County’s testing program began in 2000. It conducts approximately 100 tests of:
components of the housing market (e.g., rental, sales and financing) and protected groups (e.g., African-Americans, Hispanics, families with children, persons with
disabilities, etc.).
Tests that indicate possible discrimination are followed up with retests. If retests show possible discrimination, complaints may be filed.
The table below shows the components of the housing market and the protected groups tested in
FY 2013. The percent of retests was 5% in FY 2013. Re-tests are conducted whenever the initial tests indicate potential problems.
The re-tests did not show any indications of discrimination.
Incidents of Possible Discrimination in Fair Housing Testing
FY Aspect of Market Protected Category Protected
Group Number
of Original Tests Number of
Re-tests Percent
of Total Tests
2005 98 2 2.0%
2006 98 2 2.0%
2007 100 0 0.0%
2008 100 0 0.0%
2009 Test was not conducted
32

2010 Test was not conducted
2011 100 3 3.0%
2012 Test was not conducted
2013 Rental National Origin Hispanic 50 4 8%
Rental Race Black 50 1 2%
FY 2013 Total 100 5 5% Source: County Manager’s Office, Human Rights Office
33
GOAL #11: QUALITY SERVICES
Provide housing services effectively and efficiently.
Target 11A: Annual Housing Report: By December of each year, produce the County’s
annual affordable housing report for the fiscal year just completed. This FY 2013 Annual Report was completed in February 2014. Target 11B: The County’s Code Enforcement department will provide a publically available,
written, annual report on housing code inspections completed for the year by complex, listing full code inspections by complex, with a total of violations reported, corrected and pending. Findings will be shared annually in a presentation to the Tenant-Landlord Commission.
Code Enforcement staff is currently working on the 2013 report and it will be shared with the
Tenant-Landlord Commission and the Housing Commission when it is completed. Target 11C: Conduct a study of the various Tenant Assistance Funds (TAFs) and make
recommendations for a consistent, standard and County-wide program by 2012.
In December of 2013 the County Board adopted a Tenant Assistance Fund policy that ensures a
consistent, standard County-wide program. Target 11D: Create an annual report on the outreach, education and assistance to
households at risk of foreclosure.
Information on foreclosures has been included in the Annual Targets Report. Target 11E: Conduct an updated housing needs survey. The Arlington County Board endorsed the Affordable Housing Study Charge on December 11,
2012. The charge includes conducting a housing needs survey to determine the housing needs of current and projected County residents, broken down by existing and potential need categories. The survey will be completed in FY 2014.
34

GLOSSARY
Accessible Housing: New housing units covered under the Fair Housing Act Amendments Accessibility Guidelines [FHAAG] must meet the following specific accessibility criteria: 1] public and common use areas must be readily accessible to and usable by people with disabilities; 2] all doors "designed to allow passage into and within all premises are sufficiently wide to allow passage by handicapped persons in wheelchairs" [24 CFR 100.205]. These same properties must also meet additional features of adaptable design: accessible route into and through the dwelling unit; light switches, electrical outlets, thermostats and other environmental controls in accessible locations; reinforced bathroom walls to allow later installation of grab bars; and usable kitchens and bathrooms that allow enough space for wheelchair maneuverability. Affordable Housing Investment Fund (AHIF): This program, funded by both federal HOME money and local funds, provides financial assistance for the acquisition, development, or rehabilitation of affordable housing for low and moderate income households or for housing-related services assisting such households. This is a competitive program that requires matching funds. Area Median Incomes (AMI) for Families is the income at which half of the families of a particular household size have incomes higher and half have incomes lower. HUD estimated the median family income for a family of four for the Washington Metropolitan Area for 2013 was $107,300. The U.S. Department of Housing and Urban Development (HUD) computed median incomes by household size from that by formula.
HUD Area Median Incomes (AMI) for Families, 2013
Income Level
% of
Median
Family Size
1 2 3 4 5 6
80% $60,160 $68,720 $77,280 $85,840 $92,720 $99,600 60% $45,120 $51,540 $59,960 $64,380 $69,540 $74,700 50% $37,600 $42,950 $48,300 $53,650 $57,950 $62,250 CPHD: Department of Community Planning, Housing and Development COG: Metropolitan Washington Council of Governments Committed Affordable Units are units that: 1) are wholly owned by nonprofits, excepting any units planned to serve households with incomes above 80% of median family income; or 2) are guaranteed by agreement with the federal, state, or county government to remain affordable to low and moderate income households for a specified period of time through mechanisms such as site plan requirements, contracts with private owners, or Internal Revenue Service (IRS) regulations governing tax-exempt financing; or 3) received government subsidy to assist with the purchase. Common Area Inspections: Inspections of common areas in rental projects include inspections of all exterior grounds, trash areas, hallways, stairways, laundry rooms and mechanical rooms. The areas are inspected for violations of the Virginia Uniform Statewide Building Code/Part III. Maintenance of Existing Structures (International Property Maintenance Code), the International Fire Code, the Arlington Zoning Ordinance, the Arlington Condition of Private Property ordinance (formerly the Care of Premises ordinance), and the Arlington Abandoned/Junk Vehicle ordinance.”
35

Community Development Block Grant (CDBG): CDBG is a federal program providing localities with funds that may be used to address the needs of low and moderate income residents through a variety of housing, neighborhood improvement and economic development activities. Cooperative Forecast: The COG Regional Cooperative Forecast Program provides consistent forecasts for transportation, water resources, air and water quality, population, employment, housing, land use and energy planning for jurisdictions in the Washington area. The program produces forecast of population, households and employment in five-year increments for the region and for individual jurisdictions.
DHS: Department of Human Services Density Bonus: In 2001, the County added a 25% density bonus provision to its Zoning Ordinance. The bonus permits both market-rate and affordable units, with the income from the market-rate units designed to offset the cost of the subsidized units.
Disability: A person has a disability if he or she who is unable to independently carry out one or more of the major life activities of walking, ambulating, eating, sleeping, breathing, seeing, hearing or thinking. (Source: Americans with Disabilities Act)
-For Target 1B, the definition of “disability” has been broadened from the above to add the definition in the Housing Grants ordinance which includes “clients and patients of the Arlington County Mental Health, Mental Retardation, Substance Abuse Services, and Arlington Community Residents, Inc.”
Elderly Household: A family in which the head of the household or spouse is at least 55 years of age. FMR: Fair Market Rent FY: County Fiscal Year: July 1 to June 30 Fair Housing Testing is a method of comparing how two persons of different protected classes (e.g., of different races) are treated by a housing provider under similar circumstances, all other factors being held constant. Court decisions have held that tests done under properly controlled conditions can be used as evidence of discrimination. There are two types of testing, targeted testing and random testing. Targeted testing is conducted in order to investigate a fair housing complaint or to determine if an agency that previously discriminated is still engaging in discriminatory practices. Random testing involves testing a sample of housing providers. Fair Market Rents (FMR): The rent, including the cost of utilities (except telephone), as established by the Department of Housing and Urban Development for units of varying sizes (by number of bedrooms), that must be paid in the housing market area to rent privately owned, existing, decent, safe and sanitary rental housing of modest (non-luxury) nature with suitable amenities. Family: Two or more related persons occupying a housing unit. Family-sized units are units with two or more bedrooms. First Time Home Buyer: An individual or family who has not owned a home during the three-year period preceding the assisted purchase of a home that must be used as the principal residence of the homebuyer. Full code inspections are comprehensive inspections by Community Code, Building, and Fire Inspectors of: 1) all common areas, and 2) either 100% of the units of small projects (70 or fewer units) or 50% of the units at larger complexes. Additional units may be inspected if warranted. Gross Floor Area (GFA): The total of all floors of a building as measured to the outside surfaces of the exterior walls and including halls, stairways and elevator/mechanical shafts. This area excludes areas
36

within the building used for parking. In addition the County Board may exempt other areas and typically exempts storage in the basement and mechanical closets on balconies. HOME is the HOME Investment Partnerships Act (Federal law of 1990). HOME provides funds for programs involving: 1) acquisition, rehabilitation, and/or new construction of affordable housing; 2) rent assistance; and 3) homeownership assistance. Funds must be committed within specific time frames or HUD may recapture the money. HUD requires a match of 25-30% using local funds. HOPWA: Housing Opportunities for Persons with AIDS program. This program provides federal funds for rent assistance and emergency assistance, e.g., homeless prevention for this population. HUD: U.S. Department of Housing and Urban Development Homeowner: An owner-occupant of residential property who holds legal title to the property and who uses the property as his/her principal residence. Homeownership Rate: This is the percentage of all occupied housing units that are owner-occupied. Household: One or more persons occupying a housing unit.
Priority Households include families with children, elders and persons with disabilities. Non-priority Households are households with singles or related persons that include no children, no elders and no persons with disabilities.
Housing Assistance: Housing assistance includes both programs providing housing subsidies and programs providing housing units or beds. Housing subsidy programs include the locally-funded Real Estate Tax Relief and Housing Grants programs and the federally-funded Housing Choice Voucher program (formerly Section 8) and Housing Opportunities for Persons with AIDS (HOPWA). The housing units included are all renter and owner Committed Affordable Units. The housing beds are ones committed to serve persons with disabilities located in group homes or supervised apartments owned or leased by nonprofits. Housing Choice Vouchers (formerly Section 8 Rent Assistance) is a federally funded rent assistance program for low income households. Households must meet income eligibility criteria. Each pays a minimum of 30% of income for rent. Housing Grants Program is a County-funded rent assistance program serving low income working families, elderly persons and persons with disabilities. Rent subsidies typically reduce participant’s share of the rent to 40% of income. Housing Need: “Serious housing need” is defined in the County’s affordable housing goals as “those earning below 40% of median income who pay more than 40% of their income in rent.” “Housing need” is defined in the 2002 Housing Needs Survey as “households at any income level paying over 40% of income for housing (rent or mortgage).
Priority Households in Need are those families with children, elders and persons with disabilities at any income level who were paying over 40% of income for housing (rent or mortgage) in the Housing Needs Survey, 2002. Non-priority Households in Need are households at any income level with singles or related persons that include no children, no elders and no persons with disabilities who were paying over 40% of income for housing (rent or mortgage) in the Housing Needs Survey, 2002.
Housing Needs Survey, 2002: In early 2002 a consultant conducted a County-funded survey of 1,437 Arlington households to collect basic demographic information (e.g., household size, composition and
37
type, age, race, Hispanic origin, income and housing costs) in order to assess housing need in the County. Housing Reserve Fund (HRF): The HRF uses private developer donations to help finance the acquisition of units to mitigate displacement of low income tenants and for apartment banking. Housing Subsidies: Financial subsidies provided by government to assist households in paying their housing costs. Rent assistance programs in Arlington include the locally-funded Housing Grants program and the federally-funded Housing Choice Voucher program (formerly Section 8) and Housing Opportunities for Persons with AIDS (HOPWA). The Real Estate Tax Relief program assists low and moderate income homeowners through exemptions and/or deferral of real estate taxes. Housing Unit: An occupied or vacant house, apartment, or a single room that is intended as separate living quarters. Large non-elderly projects are defined all projects, not reserved for the elderly, of 50 or more units. Live Near Your Work programs are ones through which employers provide incentives for employees to live close to their jobs. MARKS: See “Market Affordable Units.” MFI: See “Median Family Income.” MIPAP: See “Moderate Income Purchase Assistance Program.” Market Affordable Units (MARKS) are lower rent units in the private market which receive no County assistance and for which the owners have made no commitment to retain as affordable in the future. Determining the number of market rate affordable units is complicated because affordability varies, depending on family size and income compared to unit size and rent. MARKS are "affordable" based on paying no more than 30% of income for rent. The County has calculated the number of Rental MARKS for four income levels: 80%, 60%, 50% and 40% of HUD median family income. Committed Affordable Units are excluded from the MARKS totals. Major violations are defined as life-safety issues that may include a range of fire hazards (such as no functioning smoke detector), lack of heat or hot water, lack of adequate plumbing facilities, overcrowding, accumulation of rubbish, infestation (e.g., by rats), cracks in exterior walls, problems with the roof or drainage and hazards affecting stairways, decks, porches or balconies. Median Family Income (MFI) is the income at which half of the families of a particular household size have incomes higher and half have incomes lower. HUD estimated the median family income for a family of four for the Washington Metropolitan Area was $107,300 for 2013. HUD computes median incomes by household size from that by formula. Minorities: Minorities includes Hispanic, African-American, Asian/Pacific Islander, Native American, Other Races and Multi-Racial households. Hispanics may be of any race. Moderate Income Purchase Assistance Program (MIPAP): This program provides financial assistance for down payments and/or closing costs for first-time homebuyers with incomes below 80% of median family income. NSAs are Neighborhood Service Areas. The County is divided into eight NSAs. Non-elderly projects are defined as all projects not reserved for the elderly. Owner Unit: A unit occupied by its owner.
38
Priority Households include families with children, elders and persons with disabilities. Rate of major common area housing code violations is defined as: Number of major common area housing violations found Number of multi-family rental complexes over 20 years old inspected Rate of major housing code violations is defined as:
Number of major violations (common area and unit) from full code inspections Number of units inspected in full code inspections Real Estate Tax Relief Program: This locally-funded program provides exemptions and deferrals of real estate taxes to income-eligible elderly and disabled households. Rent Assistance: Financial subsidies provided by government to assist households in paying their monthly rent. Rent assistance programs in Arlington include the locally-funded Housing Grants program and the federally-funded Housing Choice Voucher program (formerly Section 8) and Housing Opportunities for Persons with AIDS (HOPWA).
Renter Unit: Any occupied housing unit that is not owner occupied, including units rented for cash, and those occupied without payment of cash rent. Section 8 Rent Assistance: See “Housing Choice Vouchers.” Serious Housing Need: See “Housing Need.” Site Plan Projects are developments not currently allowed by right in the Zoning Ordinance and/or General Land Use Plan (GLUP) that undergo a major public review and decision-making process to get formally approved by the County Board.
39

Rent and Vacancy Survey for 2013
Appendix 1
This is a summary report of the 2013 Rent and Vacancy Survey. All the multi-family rental complexes with four or more units were included in the survey which requested information on the current market rent (i.e., rent charged to new tenants), and the number of units that were vacant and available for rent. This analysis excludes rent data from all Committed Affordable Units (i.e. units with either subsidized or controlled rents) and vacancy data from buildings undergoing change or in the initial lease-up period. 2013 Multi-Family Rental Stock • The 2013 survey found a total of 45,361 units; this is a net increase of 1,047 units over 2012. • The percentage of units by bedroom size remained nearly the same as in 2012.
Number of Units Efficiency 1 Bedroom 2 Bedroom 3 Bedroom 4+ Bedroom Total Percentage for 2013 9.6% 54.2% 32.3% 3.8% 0.04% 100% 2013 4,350 24,602 14,661 1,728 20 45,361 2012 4,200 24,056 14,347 1,691 20 44,314 2011 4,229 23,560 14,038 1,708 20 43,555 2010 4,127 23,101 13,516 1,523 19 42,286 2009 4,090 22,698 13,247 1,497 16 41,548 2008 4,055 22,398 13,018 1,582 17 41,070 2007 3,924 21,779 12,693 1,765 17 39,989 2006 3,883 21,576 12,570 1,572 17 39,618 Vacancy Rates • The vacancy rate increased to 2.5%.
Average Vacancy Rates Survey Year Efficiency 1 Bedroom 2 Bedroom 3 Bedroom Total
2013 1.8% 2.2% 3.3% 1.1% 2.5% 2012 0.9% 1.0% 1.2% 0.8% 1.1% 2011 2.3% 4.4% 5.6% 3.2% 4.6% 2010 2.3% 3.2% 4.1% 4.3% 3.4% 2009 2.2% 3.2% 3.0% 2.6% 3.0% 2008 3.3% 2.8% 2.5% 2.5% 2.8% 2007 1.7% 3.0% 3.2% 3.3% 2.9% 2006 1.8% 1.8% 2.8% 2.4% 2.2%
40

Changes in Rents • The County-wide average rent increased by $51 per month to $1,934, an increase of 3% over the
2012 average of $1,883. The average rent for elevator building units increased 5%, while the average rent for all garden apartments units increased 0.1%.
• Average rent per unit size and the percentage of change are shown in the tables below.
The Rent and Vacancy Survey is conducted annually by the Housing Division. Questions regarding the survey and report should be directed to Joel Franklin, Housing Planner, or Renee M. Willis, Chief, Housing Services Section. They can be contacted at 703-228-3760.
Average Rents - All Apartments Year Efficiency 1 Bedroom 2 Bedroom 3 Bedroom Total 2013 $1,503 6% $1,770 3% $2,255 2% $2,759 -1% $1,934 3% 2012 $1,422 6% $1,719 6% $2,218 8% $2,784 15% $1,883 7% 2011 $1,337 4% $1,615 4% $2,063 1% $2,421 -9% $1,768 2% 2010 $1,290 1% $1,546 1% $2,036 2% $2,660 3% $1,742 2% 2009 $1,277 1% $1,524 4% $1,997 3% $2,583 6% $1,711 4% 2008 $1,261 6% $1,465 4% $1,934 3% $2,421 6% $1,648 5% 2007 $1,191 6% $1,407 6% $1,874 10% $2,278 5% $1,576 6% 2006 $1,123 9% $1,332 8% $1,708 6% $2,160 12% $1,480 3% 2005 $1,027 6% $1,231 4% $1,606 6% $1,929 7% $1,432 9%
Average Rents - Garden Apartments Year Efficiency 1 Bedroom 2 Bedroom 3 Bedroom Total 2013 $1,197 -1% $1,369 0.4% $1,667 -1% $2,188 -3% $1,512 0.1% 2012 $1,212 6% $1,364 8% $1,677 10% $2,252 21% $1,510 9% 2011 $1,145 14% $1,263 5% $1,520 1% $1,866 -7% $1,385 2% 2010 $1,007 -4% $1,203 -0.1% $1,507 -0.7% $1,997 18% $1,352 0.1% 2009 $1,046 6% $1,204 6% $1,518 6% $1,697 4% $1,351 6% 2008 $986 4% $1,132 3% $1,423 -0.2% $1,628 -5% $1,264 1.5% 2007 $951 7% $1,104 6% $1,426 8% $1,719 7% $1,245 7% 2006 $888 18% $1,038 7% $1,317 3% $1,602 8% $1,168 5.5% 2005 $753 -8% $970 5% $1,282 11% $1,476 4% $1,107 7%
Average Rents - Elevator Apartments Year Efficiency 1 Bedroom 2 Bedroom 3 Bedroom Total 2013 $1,548 7% $1,927 5% $2,560 5% $3,087 3% $2,104 5% 2012 $1,448 6% $1,838 3% $2,448 2% $3,004 6% $2,010 3% 2011 $1,370 3% $1,785 5% $2,392 2% $2,846 -4% $1,959 2% 2010 $1,337 2% $1,705 2% $2,348 1% $2,971 0.5% $1,918 2% 2009 $1,314 0% $1,677 2% $2,314 2% $2,958 0% $1,883 2% 2008 $1,308 6% $1,644 6% $2,268 6% $2,963 17% $1,844 7% 2007 $1,231 6% $1,555 5% $2,145 9% $2,542 3% $1,727 6% 2006 $1,159 9% $1,474 6% $1,975 6% $2,471 10% $1,628 1% 2005 $1,067 6% $1,387 1% $1,855 1% $2,253 1% $1,525 2%
41
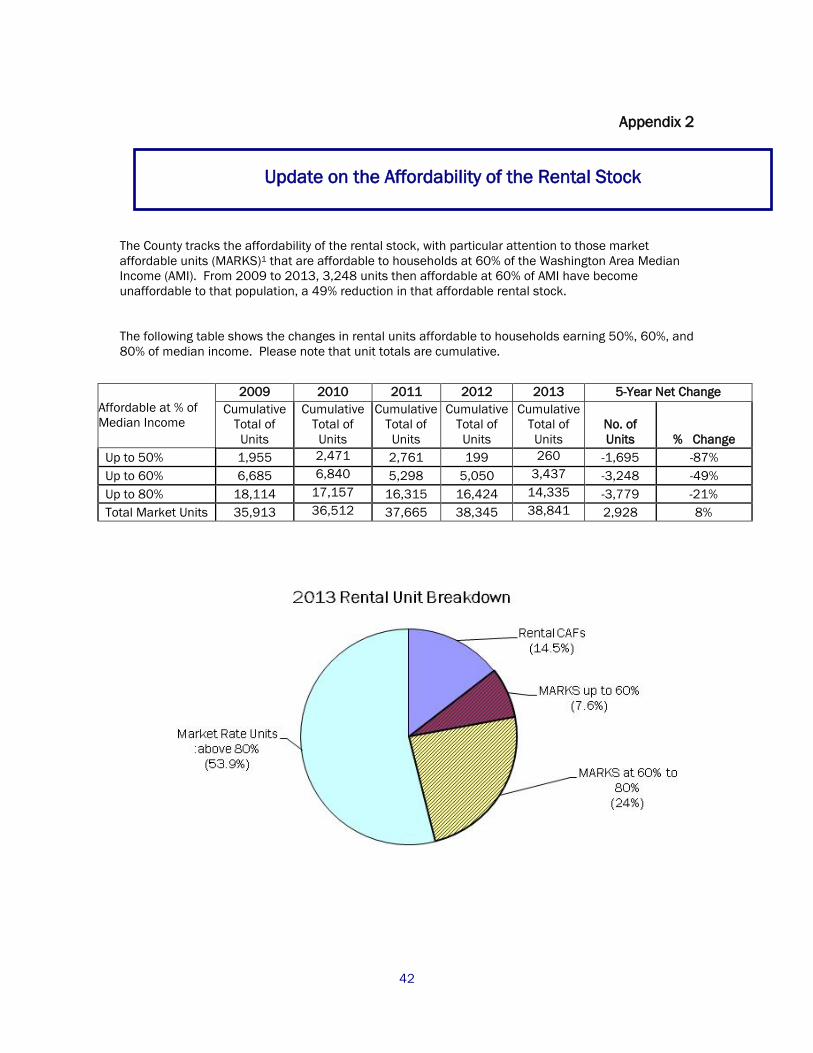
Update on the Affordability of the Rental Stock
Appendix 2
The County tracks the affordability of the rental stock, with particular attention to those market affordable units (MARKS)1 that are affordable to households at 60% of the Washington Area Median Income (AMI). From 2009 to 2013, 3,248 units then affordable at 60% of AMI have become unaffordable to that population, a 49% reduction in that affordable rental stock. The following table shows the changes in rental units affordable to households earning 50%, 60%, and 80% of median income. Please note that unit totals are cumulative.
Affordable at % of Median Income
2009 2010 2011 2012 2013 5-Year Net Change Cumulative
Total of Units
Cumulative Total of Units
Cumulative Total of Units
Cumulative Total of Units
Cumulative Total of Units
No. of Units % Change
Up to 50% 1,955 2,471 2,761 199 260 -1,695 -87% Up to 60% 6,685 6,840 5,298 5,050 3,437 -3,248 -49% Up to 80% 18,114 17,157 16,315 16,424 14,335 -3,779 -21% Total Market Units 35,913 36,512 37,665 38,345 38,841 2,928 8%
42

History of MARKS at 50% and 60% of Median Income from 2000 to 2013
Gain of Committed Affordable Units (CAFs): The County, working actively to preserve and create affordable units, has committed 808 rental units from FY 2009 to 2013 for long term preservation of affordability as Committed Affordable Units (CAFs). Committed affordable units are guaranteed to remain affordable for at least 30 years through non-profit ownership, site plan conditions, or government program requirements. 2012 Area Median Income (AMI) for Families is the income at which half of the families of a particular household size have incomes higher and half have incomes lower. HUD estimated the median family income for a family of four for the Washington Metropolitan Area for 2013 was $107,300. HUD computed median incomes by household size from that by formula. In 2009 a unit at the average rent required an income of 67% of median; in 2013, it requires an income of 72% of median.
Median Income for Families, 2013
Income Level
% of
Median
Family Size
1 2 3 4
Moderate 80% $60,160 $68,720 $77,280 $85,840 Low 60% $45,120 $51,540 $59,960 $64,380 Very Low 50% $37,600 $42,950 $48,300 $53,650
43


COUNTY MANAGER’S OFFICE
Barbara Donnellan, County Manager Gabriela Acurio, Assistant County Manager
Raul Torres, Assistant County Manager
DEPARTMENT OF COMMUNITY PLANNING, HOUSING AND DEVELOPMENT
Robert Brosnan, Department Director
David Cristeal, Housing Division Director Joel Franklin, Project Coordinator, Housing Planner
Robin Canty Melissa Cohen
Gary Greene Doug Myrick
DEPARTMENT OF HUMAN SERVICES
Susanne Eisner, Department Director Cynthia Stevens
Tony Turnage Amy Yorczyk
DEPARTMENT OF COMMUNITY PLANNING, HOUSING & DEVELOPMENT
2100 Clarendon Boulevard, Suite 700, Arlington, VA 22201 TEL (703)228-3760 FAX (703)228-3834 www.arlingtonva.us