Meeting Documents Audit Committee AC - 2 2018
212
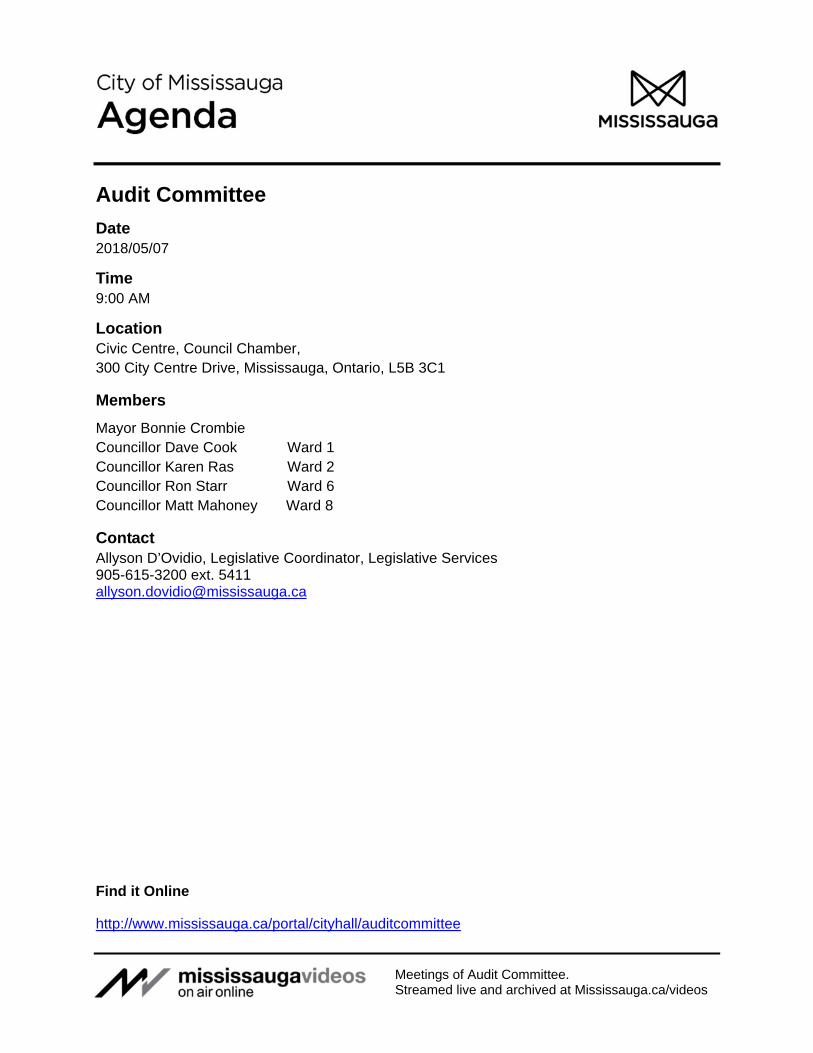
Find it Online http://www.mississauga.ca/portal/cityhall/auditcommittee Meetings of Audit Committee. Streamed live and archived at Mississauga.ca/videos Audit Committee Date 2018/05/07 Time 9:00 AM Location Civic Centre, Council Chamber, 300 City Centre Drive, Mississauga, Ontario, L5B 3C1 Members Mayor Bonnie Crombie Councillor Dave Cook Ward 1 Councillor Karen Ras Ward 2 Councillor Ron Starr Ward 6 Councillor Matt Mahoney Ward 8 Contact Allyson D’Ovidio, Legislative Coordinator, Legislative Services 905-615-3200 ext. 5411 [email protected]
Transcript of Meeting Documents Audit Committee AC - 2 2018
Find it Online
http://www.mississauga.ca/portal/cityhall/auditcommittee
Meetings of Audit Committee. Streamed live and archived at Mississauga.ca/videos
Audit Committee Date 2018/05/07
Time 9:00 AM
Location Civic Centre, Council Chamber, 300 City Centre Drive, Mississauga, Ontario, L5B 3C1
Members Mayor Bonnie Crombie Councillor Dave Cook Ward 1 Councillor Karen Ras Ward 2 Councillor Ron Starr Ward 6 Councillor Matt Mahoney Ward 8
Contact Allyson D’Ovidio, Legislative Coordinator, Legislative Services 905-615-3200 ext. [email protected]

Audit Committee 2018/05/07 2
1. CALL TO ORDER
2. APPROVAL OF AGENDA
3. DECLARATION OF CONFLICT OF INTEREST
4. MINUTES OF PREVIOUS MEETING
4.1. Audit Committee Meeting Minutes of March 5, 2018
5. DEPUTATIONS
5.1. Item 7.1. Anthony Hamer, Partner and Mike Varey, Partner, KPMG Canada with respectto the Proposed Performance Measures System.
5.2. Item 7.2. Jeff Jackson, Director, Finance with respect to the 2017 Audited FinancialStatements.
6. PUBLIC QUESTION PERIOD - 15 Minute Limit (5 Minutes per Speaker)
Pursuant to Section 42 of the Council Procedure By-law 0139-2013, as amended:The Audit Committee may grant permission to a member of the public to ask a question of Audit Committee, with the following provisions:
1. The question must pertain to a specific item on the current agenda and the speaker will state which item the question is related to.
2. A person asking a question shall limit any background explanation to two (2) statements, followed by the question.
3. The total speaking time shall be five (5) minutes maximum, per speaker.
7. MATTERS TO BE CONSIDERED
7.1. Report dated April 16, 2018 from the Commissioner of Corporate Services and ChiefFinancial Officer re: Proposed Performance Measures Program.
Recommendation
That the report titled “Proposed Performance Measures Program” dated April 16, 2018from the Commissioner of Corporate Services and Chief Financial Officer be receivedfor information.
Recommend Receipt

Audit Committee 2018/05/07 3
7.2. Report dated March 29, 2018 from the Commissioner of Corporate Services and Chief Financial Officer re: 2017 Audited Financial Statements.
Recommendation
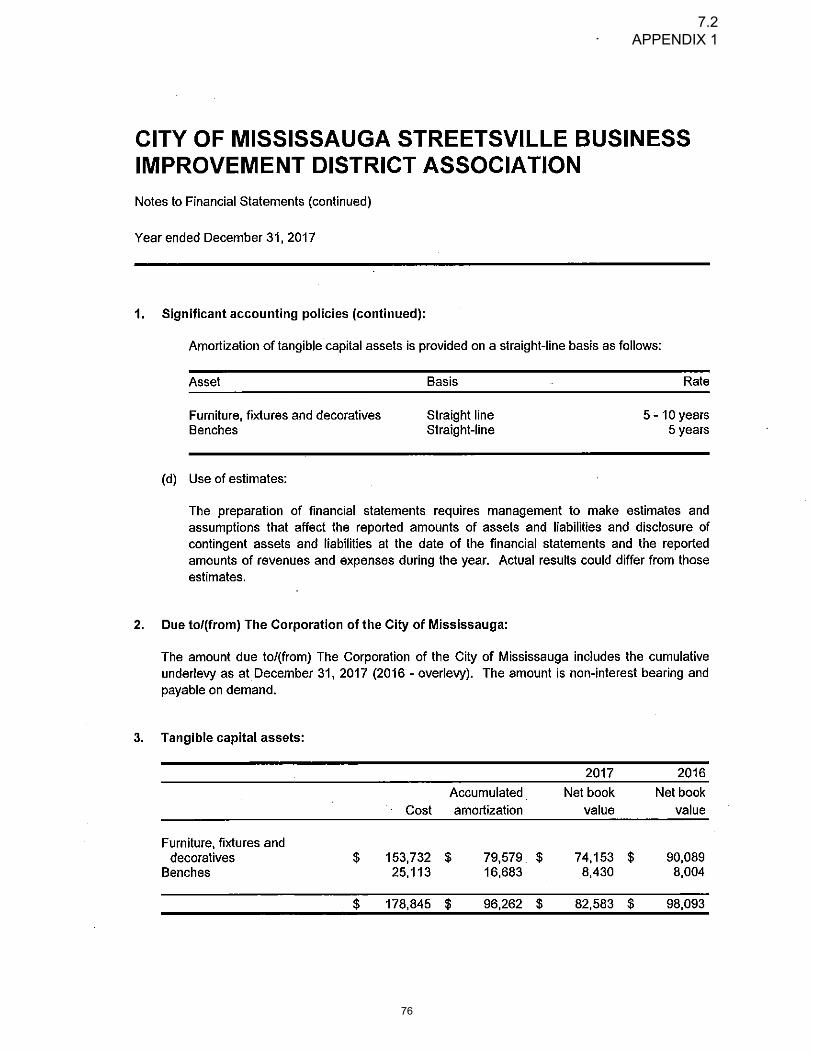
That the 2017 Audited Financial Statements for City of Mississauga (consolidated), City of Mississauga Public Library Board, City of Mississauga Trust Funds, Clarkson Business Improvement Area, Port Credit Business Improvement Area, Streetsville Business Improvement Area, Malton Business Improvement Area, and Enersource Corporation be received as information.
Recommend Receipt
7.3. Report dated April 19, 2018 from the Commissioner of Corporate Services and Chief Financial Officer re: 2017 External Audit Findings Report.
Recommendation
That the 2017 External Audit Findings Report dated April 19, 2018 from the Commissioner of Corporate Services and Chief Financial Officer, which includes the Audit Findings Report from KPMG for the fiscal year 2017 for the City of Mississauga (City), be received for information.
Recommend Receipt
7.4. Report dated April 23, 2018 from the Director of Internal Audit re: Final Audit Reports: 1. Corporate Services Department, Finance Division, Investments Section – 2017Investment Audit; and, 2. Corporate Services Department, Facilities and PropertyManagement Division – Capital Projects Contracts Audit.
Recommendation
That the report dated April 23, 2018 from the Director of Internal Audit with respect to final audit reports: 1. Corporate Services Department, Finance Division, Investments Section – 2017
Investment Audit, and,2. Corporate Services Department, Facilities and Property Management Division –
Capital Projects Contracts Auditbe received for information.
Recommend Receipt
Audit Committee 2018/05/07 4
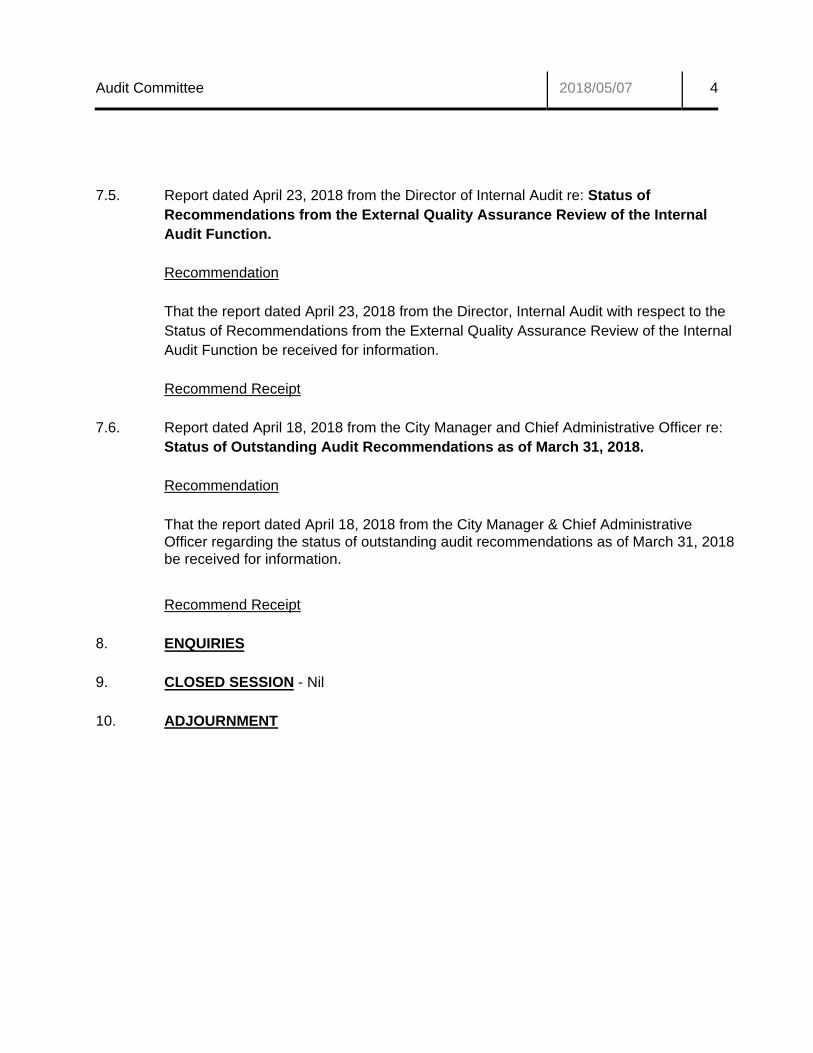
7.5. Report dated April 23, 2018 from the Director of Internal Audit re: Status of Recommendations from the External Quality Assurance Review of the Internal Audit Function.
Recommendation
That the report dated April 23, 2018 from the Director, Internal Audit with respect to the Status of Recommendations from the External Quality Assurance Review of the Internal Audit Function be received for information.
Recommend Receipt
7.6. Report dated April 18, 2018 from the City Manager and Chief Administrative Officer re: Status of Outstanding Audit Recommendations as of March 31, 2018.
Recommendation
That the report dated April 18, 2018 from the City Manager & Chief Administrative Officer regarding the status of outstanding audit recommendations as of March 31, 2018 be received for information.
Recommend Receipt
8. ENQUIRIES
9. CLOSED SESSION - Nil
10. ADJOURNMENT

Find it online
http://www.mississauga.ca/portal/cityhall/auditcommittee
Audit Committee
Date 2018/03/05
Time 9:03 AM
Location Civic Centre, Council Chamber, 300 City Centre Drive, Mississauga, Ontario, L5B 3C1
Members Present Mayor Bonnie Crombie Councillor Dave Cook Ward 1 Councillor Karen Ras Ward 2 Councillor Ron Starr Ward 6 Councillor Matt Mahoney Ward 8
Members Absent Nil
Staff Present Gary Kent, Commissioner, Corporate Services and Chief Financial Officer Jeff Jackson, Director of Finance and Treasurer Mark Beauparlant, Manager of Corporate Financial Services Al Steinbach, Director, Internal Audit Kevin M. Travers, Partner, KPMG, External Auditor Stephanie Smith, Legislative Coordinator, Office of the City Clerk Allyson D’Ovidio, Legislative Coordinator, Office of the City Clerk
4.1

Audit Committee 2018/03/05 2
1. CALL TO ORDER – 9:03 AM
2. APPROVAL OF AGENDA – Approved (Councillor Mahoney)
3. DECLARATION OF CONFLICT OF INTEREST - Nil
4. MINUTES OF PREVIOUS MEETING
4.1. Audit Committee Meeting Minutes of December 4, 2017 –
Approved (Councillor Ras)
5. DEPUTATIONS
5.1. Craig Emick, IT Auditor, presented the Internal Audit Corporate Risk Assessment notingthat the assessment is part of the Internal Audit 3-Year work plan.
Mr. Emick provided the following background information with respect to theassessment: the assessment was based on seven risk categories; this was aquantitative survey based on management’s assessment of “change”, “complexity” and‘inherent risk”; the assessment was conducted on a core services basis; the exerciseprovided a comparative risk analysis of core services between 2013 and 2017 andlastly, Internal Audit partnered with Communiations to deliver the 2017 Corporate RiskAssessment survey electronically.
Mr. Emick noted that the summary results of the 2017 Risk Assessment exercise on 135Core Services and 16 Service Areas was presented to the Leadership Team in January,2018. Mr. Emick identified the following seven (7) risk categories assessed by thebusiness units which included: Business Operations, Human Resources, Financial,Physical Assets, Technology, Confidentiality and Public Profile. Mr. Emick noted thehigh degree of change in management and persons most responsible since the lastassessment in 2013.
Mr. Emick spoke to the summary results and highlighted the following: increasing“change” in the areas of Business Operations, Technology and Human Resources;increasing “complexity” in the areas of Business Operations and Financial Componentsand lastly, an increase related to the “inherent risk” of the City’s human resources,largely due to retirements. Mr. Emick noted the results have also been presented backto the Leadership Teams of the business units.
In response to Mayor Crombie, Al Steinbach, Director, Internal Audit spoke about theeffects the results will have on future applications of the audit assessments and noted
4.1

Audit Committee 2018/03/05 3
they are becoming increasingly more complex.
In response to Councillor Ras’ inquiry with respect to the ongoing turnover of staff, Mr. Emick noted that the annual work plan and the frequency of surveys will be revisited as needed. Gary Kent, Commissioner of Corporate Services and Chief Financial Officer noted the trend will continue with staff turnover and further over the next 6 years, we may see another 30-40% of full time staff turnover. Mr. Kent noted the City has been investing in programs to prepare for this ongoing change for many years and has a succession management plan to allow internal candidates to move up as retirements of Leadership team members continue. Mr. Kent noted the City has invested in new technology solutions to keep up with change and further that the focus is on development to allow staff to grow their careers at the City. Mr. Emick noted the underlying results indicate 80% of the business units are experiencing change and increase in complexity over all.
In response to Councillor Starr, with respect to how to prepare for unknown change, Mr. Kent noted that we continue to modernize and transform our processes while upholding our values of trust, quality and excellence. Mr. Kent noted we continue to work with our teams and provide more engagement such as the new Diversity and Workforce Inclusion Strategy as well and the Employee Engagement Survey.
In response to Councillor Starr, Mr. Steinbach noted the risk assessments are generally conducted every 3-4 years; however, a discussion on frequency of assessments can be brought back to a future meeting of the Audit committee in the new term.
RECOMMENDATION AC-0001-2018 That the deputation on March 5, 2018 by Craig Emick, IT Auditor, entitled Internal Audit Corporate Risk Assessment Process, be received for information.
Received (Mayor Crombie)
6. PUBLIC QUESTION PERIOD - 15 Minute Limit (5 Minutes per Speaker) - Nil
Pursuant to Section 42 of the Council Procedure By-law 0139-2013, as amended:
The Audit Committee may grant permission to a member of the public to ask a questionof Audit Committee, with the following provisions:
1. The question must pertain to a specific item on the current agenda and the speakerwill state which item the question is related to.
4.1

Audit Committee 2018/03/05 4
2. A person asking a question shall limit any background explanation to two (2)statements, followed by the question.
3. The total speaking time shall be five (5) minutes maximum, per speaker.
7. MATTERS CONSIDERED
7.1. Internal Audit Quality Assurance Review
Amy Truong, Senior Internal Auditor provided background information on the AssuranceAssessment and its significance.
Ms. Truong identified the assessment types and noted the City chose to conduct a self-assessment with validation which reviews the conformance with Audit standards andgroups them into 4 categories: governance; management; staffing and process. Ms.Truong discussed the findings of BDO, the independent auditor hired to review the City’sself-assessment, noting overall the City conforms to requirements. Further that 66 of 72assessed Internal Audit standards and best practises were classified as moderate toleading levels of maturity. Areas that were requiring change resulted inrecommendations from BDO which will be consolidated and presented back to the AuditCommittee in May.
In response to Councillor Ras. Ms. Truong identified examples of the recommendationsfrom BDO, noting they would like the Internal Audit process to be more formalizedamongst auditees as well as review the way Internal Audit interacts with the AuditCommittee and Senior Management. In response to Councillor Ras, Ms. Truong notedthe KPI’s are specific to Internal Audit.
In response to Councillor Ras, Mr. Steinbach noted a variance report is conducted aftereach audit that identifies complexities in order to plan accordingly in the future.Councillor Ras noted her pleasure in reading the findings that the team has leadingpractices due to their unrestricted access to the City Manager.
Mayor Crombie noted she is very proud of the results and further that we are still leadingand improving.
4.1

Audit Committee 2018/03/05 5
RECOMMENDATION AC-0002-2018 That the report dated February 6, 2018 from Al Steinbach, Director, Internal Audit with respect to the Internal Audit Quality Assurance Review be received for information.
Received (Mayor Crombie) (4, 0, 0)
Recorded Vote YES NO ABSENT ABSTAIN Mayor B. Crombie X Councillor K. Ras X Councillor R. Starr X Councillor M. Mahoney X
7.2. 2018-2020 Internal Audit Multi-Year Work Plan Report
Al Steinbach, Director, Internal Audit presented the 2018-2020 Internal Audit Multi-Year Work Plan Report for review and approval. Mr. Steinbach noted 20% of available audit time is spent on reviewing/consulting and further Internal Audit identifies 10 audits per year which are subject to change based on request.
RECOMMENDATION AC-0003-2018 That the report dated February 5, 2018 from Al Steinbach, Director, Internal Audit, with respect to the 2018 to 2020 Multi-Year Internal Audit Work Plan be approved.
Approved (Councillor Ras) (4, 0, 0)
Recorded Vote YES NO ABSENT ABSTAIN Mayor B. Crombie X Councillor K. Ras X Councillor R. Starr X Councillor M. Mahoney X
8. ENQUIRIES - Nil
9. CLOSED SESSION - Nil
10. ADJOURNMENT – 9:37 A.M (Councillor Mahoney)
4.1

Corporate Performance Measures Assessment Audit Committee May 7, 2018
5.1

Overview
1. Project background
2. Description of Assessment Framework and Maturity Model
3. Findings of Performance Measures Assessment
4. Recommended future target state
5. Overview of proposed improvement actions
6. Recommended next steps
2
5.1

Project background
Objective
Scope
• Conducted an assessment of Mississauga’s corporateperformance measures (CPMs) based on an industry bestpractice framework (May-Nov 2017)
• Identified recommendations to improve CPMs
• The scope included about 220 CPMs within the City’s 15Service Area Business Plans
• We also reviewed about 400 operational measures usedby Service Areas to manage day-to-day operations
Approach • Used Framework (built on Municipal Reference Modeland Maturity Model) to determine how CPMs supported the City’s: customer, financial, service and strategic goals
3
5.1

What we did # Step Status 1 Confirm project plan and schedule with Project Manager
2 Develop assessment Framework using Municipal Reference Model and Maturity Model to map current and future states (D1)
3 Design Data Collection Tool to facilitate maturity self-assessment with Maturity Model (D2-5)
4 Service Areas complete self assessment using Data Collection Tool (D2-5)
5 Review, analyze and adjust data collected during self-assessments (D2-5)
6 Interviews with Service Areas to validate self-assessments and test improvement aspirations (D2-5)
7 Interviews with City Manager and Commissioners to discuss current state and improvement aspirations
8 Level set current state and improvement aspirations with directors (D7)
9 Benchmark performance measure use by five comparator cities to identify leading practices (D6)
10 Present findings and discuss future state/improvement actions with LT
11 Prepare and present final report (D8-10) 4
5.1

Municipal Reference Model (MRM) • A framework for understanding how performance measures relate to the
different components of a City’s business model
Vision / Mission
Customer Public Service
Program
Process / Activity /
Task
Resource
Internal Service
Strategic Focus
Management Focus
Operational Focus
Program Goal / Outcome
Service Output
Effectiveness
Effectiveness
Efficiency
Quality
Process Result Effectiveness
Efficiency
Quality
Resource Utilization Effectiveness
Efficiency
Quality
Service
Service Model Performance Component
Performance Indicator
5
5.1

Maturity Model
Category Key Focus
Accountability Is there a clear line of accountability for the CPM?
Customer Does the CPM help the City improve customer satisfaction?
Financial Does the CPM support the City’s financial planning needs?
Service Does the CPM help the City improve the efficiency or effectiveness of a service?
Strategic Does the CPM help the City achieve its Strategic Plan and meets its long term vision, goals and objectives?
• A tool to assess performance and identify opportunities for improvement acrossfive categories – not a score card
• Focus is how performance measures are used to improve City’s services• “1” is least mature and “5” is most mature
• Operational measures not part of maturity assessment• Municipal performance measure maturity relatively low across Canada
6
5.1

Definition of maturity and rating
• Accountability for CPM linked toService Area
• CPM effectiveness reviewed
• Accountability for CPMlinked to an individual
• CPM effectiveness reviewedregularly
• Accountability for CPM linked toan individual’s performance plan
• CPM associated with ServiceArea
• Used in Service Area planning
• CPM associated with anSA’s Strategic Plan
• Guidelines in place forCPM use in planning
• CPM aligned with ServiceArea’s strategic themes
• Some rules in place for CPMuse in planning
• CPM used to improveefficiency/effectiveness of aservice
• CPM linked to animprovement plan
• CPM linked to animplementation plan
• CPM helps determine output• Output used to forecast
demand
• CPM helps determine unitcost (UC)
• UC used to forecast nextyear’s UC
• Unit cost used to forecastservice demand
• Unit cost used to forecastservice cost
• CPM used to improve customersatisfaction
• CPM linked to animprovement plan
• CPM linked to animplementation plan
Accountability
Customer
Service
2.0 3.0 4.0
2.0 3.0 4.0
2.0 3.0 4.0
Financial 2.0 3.0 4.0
Strategy 2.0 3.0 4.0
• Not every maturity category applies to every measure
7
5.1

Current State CPM Maturity Assessment
Current state CPM maturity assessment* • Average Current State City Maturity is better than Canadian comparators• While all Service Areas have CPMs in place, some 43% of services have measures in place
and systems could generally be developed (i.e., 20% of CPMs collected monthly or better,about 60% of CPMs are collected through manual processes)
0 1 2 3 4 5
Accountability
Customer
Financial
Service
Strategy
2.0
2.1
1.7
2.3
2.4
*Does not include operational measures Canadian comparators 8
5.1

Current state CPM maturity by Service Area*
*KPMG-adjusted maturity across all five categories for each division. These scores do not includeoperational measures.
0.0
0.5
1.0
1.5
2.0
2.5
3.0
3.5
4.0
4.5
5.0
CPM Maturity City-wide Average
9
5.1

Recommended future state target
0 1 2 3 4 5
Accountability
Customer
Financial
Service
Strategy
2.0 3.0 4.0
2.1 3.0 4.0
1.7 3.0 4.0
2.3 3.0 4.0
2.4 3.0 4.0
Current State Stage 1: 2018-2019 Stage 2: 2020-Beyond
Future State CPM Maturity Aspirations
• Lift Divisions to a Level 3 by December 2019• Directors be able to speak about their Service Area
Performance like Miway
10
5.1

Overview of recommended actions # Action Lead Duration
(Months) Work (days) Outcome
1 Develop Program Charter CIO 1 20-40 LT agreement
2 Develop work plan CP&I/BPT 2-3 50-100 Work plan to achieve change
3 Confirm service catalogue CP&I, BPT 4-5 100-200 Inventory of City services
4 Create program catalogue CP&I, BPT 2-3 50-300 Inventory of City programs linked to Strategic Plan
5 Develop & implement perf. measure training plan CP&I, BPT 3-6 200-300 Selected employees trained to
develop, implement measures
6 Implement short-term IT improvements IT 5-6 200-300 Improved systems for perf. measure
use, collection, analysis
7 Confirm service & program measures
BPT/ Directors 2-3 50-100 Full suite of service and program
performance measures
8 Implement & review CP&I, BPT Ongoing Ongoing Review/Adjust Performance Measure Policy
9 Implement Level 3 supports Directors Ongoing Ongoing Level 3 maturity (all but financial)
11
5.1

- Commissioner of Corporate Services and CFO, DirectorInformation Technology and Chief Information Officerand Manager, Corporate Performance & Innovation totake Project Charter to LT with work scope and actionplan in Q1 2018
- Corporate Performance & Innovation and CorporateBusiness Planning continue to support the developmentand continuous improvement of City measures
- IT to provide the enabling technologies
Recommended next steps
12
5.1

City’s Response
5.1
Program Purpose To improve service delivery by strengthening our culture of results-based decision-making: 1. To inform operational decision-making by
monitoring service performance2. To justify service change requests to senior
management and Council3. To demonstrate the impact of services on
approved long range plans
5.1
Action Items Establish the Performance Measures program 1. Form a dedicated permanent Performance Measures
team2. Deliver a training program to increase knowledge
about operational and strategic measures3. Collaborate with staff to identify and use new
operational and strategic measures4. Coordinate with Information Technology to automate
the measures5. Provide periodic updates to Audit Committee and/or
Council on the progress of the program6. Attain ISO 37120 certification through WCCD
15
5.1

Date: 2018/04/16
To: Chair and Members of Audit Committee
From: Gary Kent, CPA, CGA, Commissioner of Corporate Services and Chief Financial Officer
Originator’s files:
Meeting date: 2018/05/07
Subject Proposed Performance Measures Program
Recommendation That the report titled “Proposed Performance Measures Program” dated April 16, 2018 from the
Commissioner of Corporate Services and Chief Financial Officer be received for information.
Report Highlights
KPMG was engaged in 2017 to assess the current maturity of performance measures
across the corporation
While the City is above average when compared to other municipal governments, there
are opportunities for improvement
A new performance measures program will address the barriers identified by KPMG,
adapt to the diverse divisional maturity results, and continuously improve the collection
and use of performance measures to support results-based decision-making
The city will pursue ISO 37120 Sustainable Development in Communities certification to
benchmark City services against cities from around the world.
Background
Residents expect the City to deliver services efficiently, effectively and economically. The City
measures service performance and annually report the results in the service area’s business
plans. The City wants to increase the robustness of the performance measures across the
organization to improve accountability and drive future continuous improvement efforts. To
assess the current maturity of performance measures across the organization and to identify
any barriers to continued growth of performance measures, an RFP was issued in March of
2017 and awarded to KPMG.
7.1

Audit Committee 2018/04/23 2
KPMG was provided a copy of the City’s Service Catalogue. This catalogue, built in compliance
with the Municipal Reference Model methodology, contains 350+ city services described from
the customer’s point of view. KPMG collected and analysed corporate performance measures
from each Division, discussed with each Director the current performance measures methods
and barriers for improving the collection and reporting of the measures, and evaluated the
overall maturity for each division and the corporation as whole.
While the City is above average (Level 2.1) compared with its Canadian peers (Level 2.0), there
is significant room for improvement, particularly given the relatively immature state of municipal
performance measurement in Canada. The Divisional maturity results have a diverse range
from a high of 3.3 for MiWay to a low of 1.0 for Internal Audit. These results reflect the level of
investment, the transactional nature of the business, and the need to demonstrate performance
results to the public.
KPMG identified five barriers that need to be addressed. The City does not have:
1. A consistent framework to identify what to measure, how to measure it and the
appropriate audience
2. A program layer, a core component of the Municipal Reference Model;
3. An automated approach to the collection and analysis of indicators;
4. A performance measures training plan; and
5 A City-wide performance measurement policy.
Additionally the World Council of City Data (WCCD), based at the University of Toronto,
presented the new ISO 37120 Sustainable Development in Communities to staff as a new
opportunity to benchmark city services against cities from around the globe. ISO 37120 defines
100 city performance measures organized in 17 themes. As an international standard
methodology, ISO 37120 allows cities to make “apples-to-apples” comparisons, share best
practices in service delivery, and rank their results relative to other cities.
Comments
In response to the KPMG report, Corporate Performance & Innovation was requested to
develop a new program to address the barriers and to further mature the development and use
of performance measures across the organization. This proposal is modelled on the successful
Lean program and builds upon work already undertaken on the Business Planning Balanced
Scorecards and Lean.
7.1

Audit Committee 2018/04/23 3
Program Purpose
To continually improve service delivery and strengthen the culture of results-based decision-
making by expanding staff knowledge of and access to service performance analytics:
1. To inform operational decision-making by monitoring service performance
2. To justify service change requests to senior management and Council
3. To demonstrate the impact and progress of services on approved or mandated
long range plans
Proposed Program Process
It will take time and resources to develop and automate measures for all services provided by
the City. To support the program, three new permanent positions are required: a Program
Manager, a Performance Measures Consultant, and a Performance Measures Coordinator.
Similar to the successful deployment of the Lean program, the performance measures program
will be deployed division by division, adapt to the level of maturity of each division, and
frequently report program progress to the Leadership Team and Council.
The program will use a four step process to engage each division in developing and maturing
their use of performance measures.
Step 1: Confirm Services
The City Services Catalogue was prepared by Corporate Performance & Innovation staff with
input from the Directors in the fall of 2016 and approved by the Leadership Team early in 2017.
This catalogue, built in compliance with the Municipal Reference Model methodology, is
intended to organize and document services and programs offered by the City with a focus on
understanding the value that these services deliver to our residents and how they align to the
strategic organizational priorities. The divisional management teams will confirm the catalogue
entries are accurate and completely describe the services the division is responsible for
delivering. The criteria deciding the order for developing performance measures for each of
these services will include; current maturity, service volume, service costs, and future
technology plans.
Step 2: Design Measures
The Performance Measure team will deliver training to the divisional management team on the
identification and interpretation of performance measures. Equipped with this knowledge, the
management team will participate in a series of workshops to identify and validate current and
proposed new measures.
7.1
Audit Committee 2018/04/23 4
Step 3: Automate the Measures
A critical success factor for the proposed Performance Measures Program is automating the
new measures in a timely manner. Different services utilize different software solutions which
are supported by a variety of technology teams. The performance measures team will
coordinate with the technology teams to include automating new measures into already planned
work.
Step 4: Using the Measures
Once the automated measures are available, management will receive additional coaching to
ensure they are using the new measures to monitor operational performance, justify service
changes, and report progress to Council and the public. In addition, this step will provide a link
into established performance improvement programs including Lean, Innovation, Project
Management Support, and Management Consulting services.
ISO 3710 Certification
“ISO 37120: Sustainable Development in Communities” establishes a set of standardized
measures to measure the performance of city services and the quality of life in cities. The
standard defines 100 city performance measures organized in 17 such as energy, environment,
finance, etc. The standard is based on a global definition of what services a city needs, as such;
the City’s submission will require data from the Region, the school boards, and Peel Police to
complete. Upon payment of the annual fee to WCCD, the City will be provided with the detailed
calculations. Staff will calculate the measures and submit the results to the World Council of City
Data. WCCD will provide the data to a third party for verification. Once the third party verifies
the calculations are correct, the City will be certified and added to the Global dashboard.
Canadian cities currently certified include Cambridge, Oakville, Toronto, Vaughan, Quebec City,
Saint-Augustin-de-Desmaures, Shawinigan and Surrey. The cities of Barrie and Ottawa are in
the process of being certified. All the municipalities within Durham Region and York Region will
be pursuing certification in the next 12 months.
Financial Impact
Proposed program budget is being considered as part of 2019 Business Plan
Conclusion
The KPMG performance measures assessment demonstrates the City’s maturity is comparable
to other municipalities and there is room for improvement. The proposed program addresses the
barriers identified by KPMG, is adaptable to the range of maturity across the corporation, and
leverages approved technology plans.
7.1

Audit Committee 2018/04/23 5
Attachments Appendix 1: KPMG Executive Summary
Appendix 2: KPMG Divisional Assessment Results
Appendix 3: ISO 3710 Performance Measures Themes
Gary Kent, CPA, CGA, Commissioner of Corporate Services and Chief Financial Officer
Prepared by: Robin Uba, Manager Corporate Performance & Innovation
7.1

Section 1Executive Summary
APPENDIX 1
7.1

5© 2017 KPMG LLP, a Canadian limited liability partnership and a member firm of the KPMG network of independent member firms affiliated with KPMG International Cooperative
(“KPMG International”), a Swiss entity. All rights reserved. The KPMG name and logo are registered trademarks or trademarks o f KPMG International.
This report has been prepared by KPMG LLP (KPMG) for internal use by the
City of Mississauga (the City or Mississauga) pursuant to the terms of our
engagement agreement with the City dated April 26, 2017.
This report is our 10th and final draft deliverable due, and it contains all other
nine deliverables due. The table overleaf summarizes each deliverable and
identifies its location in this report.
The findings and draft recommendations contained within this report were
developed jointly with the City’s Project Team and Project Steering Committee
and shared with the City’s Extended Leadership Team during their development.
They were also shared with, and broadly approved by, the City’s Leadership
Team on September 21, 2017.
Background
The City is seeking to improve its operational and strategic decision making by
improving how it measures its activities and performance.
In March 2017, we responded to RFP No. FA.49.091-17 from the City for a
Corporate Performance Measures Assessment and were awarded the contract.
The work was undertaken between May and October 2017. The objectives of
the engagement were to:
• Conduct an assessment of the current state of Mississauga’s Corporate
Performance Measures (CPMs);
• Benchmark the CPMs against other cities; and,
• Identify recommendations to improve the CPMs.
Scope
The scope of work was the City’s 221 CPMs, which are reviewed during the
City’s annual budget process. We also collected and analyzed information on
406 operational performance measures (OPMs) used by City’s Service Areas to
help manage day-to-day operations, although our review was largely restricted
to understanding their connectivity with the City’s CPMs and how the data used
to compile them are collected.
Methodology
The assessment framework was built on the Municipal Reference Model ( MRM)
and our performance measure maturity model. The MRM provided a broad view
on what to measure and how to measure it and the maturity model helped us to
understand how well the City uses performance measures and how this might
be improved. The maturity model has five categories, each with five different
levels of maturity with 1 being the least mature and 5 being the most mature.
The five categories are: Accountability, Customer (internal and external),
Financial, Service and Strategic. The full maturity model is included at Appendix
A.
Work Program
KPMG worked closely with the City’s Project Team and Project Steering
Committee through five phases of work.
The first phase focused on data collection and a CPM maturity self-
assessment. A data collection tool was distributed to the following Service
Areas:
Executive Summary
• City Manager’s Department;
• Fire & Emergency Services;
• Recreation;
• Parks & Forestry;
• Mississauga Library;
• Culture;
• Environment;
• Facilities & Property
Management;
• Information Technology;
• Legislative Services;
• Human Resources;
• Revenue & Materiel
Management;
• Finance;
• Communications;
• Corporate Performance &
Innovation;
• Land Development Services;
• MiWay;
• Roads;
• Regulatory Services; and,
• Stormwater.
7.1

6© 2017 KPMG LLP, a Canadian limited liability partnership and a member firm of the KPMG network of independent member firms affiliated with KPMG International Cooperative
(“KPMG International”), a Swiss entity. All rights reserved. The KPMG name and logo are registered trademarks or trademarks o f KPMG International.
Executive Summary - Deliverables
# Deliverable Location in this Report
1 Provide an assessment framework that the City can use to qualify
strategic operational measures
Appendix A includes the maturity model used to qualify strategic operational
measures
2 Assess alignment of City’s overall Business Plan with Service Area
missions and service delivery models using the assessment
framework
The strategic category of the performance measure maturity model was used to
assess the alignment of Service Area missions to the City’s overall Strategic Plan.
See the current state maturity assessment at Section 4 and Service Area
assessments at Appendix B
3 Review existing performance measures identified in the 15 Service
Area business plans based on four key measures: financial,
customers, employees and business process improvement
See the current state maturity assessment at Section 4 and Service Area
assessments at Appendix B
4 Identify and analyze barriers and provide recommendations on how
to address, reduce and eliminate
Barriers to improvement are identified at Section 4. Service area-specific barriers
are also identified at Appendix B
5 Evaluate and provide recommendations on the business processes,
systems and quality of data used to derive these measures
See the current state maturity assessment at Section 4, particularly the Additional
Current State Findings section at page 26
6 Benchmark the performance measure maturity level with
comparative public sector agencies and related sectors
The results of the benchmarking are included in the current state assessment at
Section 4 and the benchmarking overview at Section 5
7 Recommend action items to progress to the next maturity level,
including a list of quick wins, must DOs, longer term actions and
“nice to have” items
Quick Wins, Must Dos, Longer Term Actions and Nice to Have Items are identified
at Section 6. A more detailed description of improvement actions is included at
Appendix C
8 Provide a roadmap with proposed actions to progressively move
towards a level of performance measurement that will enhance
operational and strategic decisions.
The improvement roadmap is included at Section 6.
9 Provide level of effort needed to move to the desired maturity level
of performance measurements
The level of effort associated with each improvement action is identified at
Appendix C
10 Provide an assessment report and presentation to the City’s
Leadership Team of findings and recommendations, including
assessment ratings and rationale for each Service Area and
corporate-wide findings
This report is our final assessment report. A final presentation of this report to the
City’s Leadership Team will be scheduled by the City. City-wide findings are
included at Section 4. Service-area findings are included at Appendix B
This engagement included 10 deliverables. Each deliverable is described in the table below along with its location in this report or how it has otherwise been
provided.
7.1

7© 2017 KPMG LLP, a Canadian limited liability partnership and a member firm of the KPMG network of independent member firms affiliated with KPMG International Cooperative
(“KPMG International”), a Swiss entity. All rights reserved. The KPMG name and logo are registered trademarks or trademarks o f KPMG International.
Using the data collection tool, Service Areas completed a current state maturity
assessment of their CPMs. We also collected a wide variety of additional
information on each Service Area’s CPMs and OPMs, including:
• Indicator type (efficiency, effectiveness or quality);
• Indicator targets, target type (e.g., maximum or minimum) and target
maturity (using a similar five level maturity model);
• Collection frequency;
• Collection systems; and,
• Preparation effort.
Service Areas were also asked to link CPMs and OPMs to their corresponding
services using the City’s recently completed Service Catalogue as a reference
guide (see the Data Summary by Service provided at Appendix B).
The second phase focused on data verification and analysis. We reviewed and
compiled the data from the self-assessments, prepared summaries and
conducted interviews with representatives from 24 Divisions under 15 Service
Areas. We also conducted interviews with the City Manager and each of the
City’s four Commissioners.
During the third phase, we refined our initial analysis and developed draft
recommendations to help overcome the barriers to the effective measurement
and improvement of CPMs. We also conducted performance measure
benchmarking with five comparator municipalities.
The fourth phase focused on identifying City improvement aspirations and
testing our improvement recommendations. Two level setting workshops were
held with the City’s Extended Leadership Team to review our current state
maturity assessment, identify a future state and discuss improvement actions.
We shared draft recommendations with the Project Steering Committee and the
City’s Leadership Team.
The fifth and final phase incorporated all findings into the prioritized strategy
and roadmap included in this report.
Current State Maturity Assessment
Our current state CPM maturity assessment is shown in Figure 1 immediately
below.
Compared to similarly-sized Canadian municipalities, Mississauga’s CPM
maturity is above average. The stars in Figure 1 identify the maturity of
comparable Canadian cities obtained through the benchmarking process.
There is significant variation in maturity levels between Service Areas, from a
high of 3.3 to a low of 1.0. MiWay received the highest maturity assessment at
3.3., consistent with recent investments made in its performance management.
It is important to note that the maturity assessment was restricted to the City’s
CPMs. While information about OPMs was collected and analyzed, OPMs were
outside the scope of the maturity assessment.
Not only are there approximately twice as many OPMs as CPMs (406 v. 221),
OPMs are also collected much more frequently, reflecting their day-to-day use.
Nearly 60% of OPMs are collected monthly or daily, while only 20% of CPMs
are collected on a monthly or daily basis.
Executive Summary –Work Program and Current State Maturity Assessment
7.1

8© 2017 KPMG LLP, a Canadian limited liability partnership and a member firm of the KPMG network of independent member firms affiliated with KPMG International Cooperative
(“KPMG International”), a Swiss entity. All rights reserved. The KPMG name and logo are registered trademarks or trademarks o f KPMG International.
Alongside the maturity assessment, we identified a number of additional CPM
findings, including:
• CPM service coverage is low. Only 25% of services specified in the newly
developed and yet to be implemented Service Catalogue have CPMs in
place;
• Indicators are relatively immature, particularly the financial measures;
• CPMs are collected infrequently. 64% of CPMs are collected on an annual
basis; and,
• Collection procedures are highly manual. 59% of CPMs are collected
through manual processes.
Future State Maturity Aspirations
Through the level setting workshops, we worked with the City’s Extended
Leadership Team to identify a realistic, attainable CPM maturity future state.
Meeting the future state is a two-stage process. The first stage would be to
improve CPM maturity from a Level 2.1 to a Level 3.0 across all Service Areas
by the end of 2019. During the second stage, the City would re-evaluate its
performance measure program and consider the creation of a plan to increase
maturity to a Level 4.0. Moving from the current state to a Level 3.0 is the focus
of this report.
Benchmarking
We benchmarked the City’s performance measure maturity against five
comparator cities, three Canadian cities with populations of between 0.8-1.2m
and two American cities with populations of between 0.2-0.7m.
The focus of the benchmarking was to identify how well comparator cities use
performance measures, i.e., how indicators are used in decision making as well
as the policies, procedures and systems that support their use.
Through the benchmarking, we identified four key success factors that support
effective municipal performance measurement:
1. Secure support from senior city leadership;
2. Build strong connections between the performance measure team and the
Divisions collecting and analyzing performance measures data;
3. Focus effort, particularly at the beginning of a performance measurement
improvement project; and,
4. Regularly review the impact of performance measures to determine
whether the desired impact is being achieved.
Barriers to Improvement
While the City is above average compared with its Canadian peers, there is
significant room for improvement, particularly given the relatively immature state
of municipal performance measurement in Canada.
We identified five significant barriers to CPM maturity improvement. The City
does not have:
1. A City-wide performance measurement policy;
2. A consistent framework to identify what to measure, how to measure it and
the appropriate audience;
3. A program layer, a core component of the MRM;
4. An automated approach to the collection and analysis of indicators and
indicator-related; and
5. A performance measure training plan.
Executive Summary – Maturity Aspirations, Benchmarking and Barriers
7.1

9© 2017 KPMG LLP, a Canadian limited liability partnership and a member firm of the KPMG network of independent member firms affiliated with KPMG International Cooperative
(“KPMG International”), a Swiss entity. All rights reserved. The KPMG name and logo are registered trademarks or trademarks o f KPMG International.
This report identifies 11 improvement actions that will help the City improve its
current CPM maturity from a Level 2.1 to a Level 3.0 by the end of 2019.
The actions were identified through the level setting workshops as well as
discussions with the Project Team, the Project Steering Committee and the
City’s Leadership Team.
The improvement actions have been placed into four categories, as requested
by the City:
• Must Do (MD) - necessary for CPM maturity improvement;
• Longer Term (LT) - necessary for CPM maturity improvement,
implementation > six months;
• Quick Win (QW) - improves CPM maturity and implementation ≤ one month;
and,
• Nice to Have (NH) - not strictly necessary for CPM improvement but helpful.
The 11 improvement actions are:
1. Develop CPM Program Charter (MD)
2. Develop CPM Work Plan (MD)
3. Confirm Service Catalogue (MD)
4. Create Program Catalogue (MD)
5. Identify Interim Service-level Measures (QW)
6. Develop & Implement CPM Training Plan (MD)
7. Implement Short-term IT Improvements (MD)
8. Confirm Service & Program Measures (MD)
9. Implement & Review (MD)
10. Implement Level 3 Supports (LT)
11. Review Achievements and Next Steps (NTH)
Executive Summary – Improvement Actions
Next Steps
As an immediate next step, the City should review and prioritize the
improvement actions and draft implementation plan recommended in this report.
The draft implementation plan showing the relationship between the
improvement actions and an associated timeline is included at page 30 of this
report.
Following the identification of the confirmed improvement actions, the City
should proceed to develop a CPM Program Charter outlining the scope of work
and action plan to improve CPM maturity that also clearly outlines the
aspirations for and timing of the work.
7.1

Current state CPM maturity by Service
Area*
*KPMG-adjusted maturity across all five categories for each division. These scores do not include
operational measures.
0.0
0.5
1.0
1.5
2.0
2.5
3.0
3.5
4.0
4.5
5.0
CPM Maturity City-wide Average
9
APPENDIX 27.1

17themes
Economy
Education
Energy
Environment
Fire & Emergency Response
Governance
Health
Recreation
Safety
Solid Waste
Telecommunications
Transportation
Urban Planning
Wastewater
Finance Shelter Water & Sanitation
APPENDIX 37.1

Date: 2018/03/29
To: Chair and Members of Audit Committee
From: Gary Kent, CPA, CGA, Commissioner of Corporate Services and Chief Financial Officer
Originator’s files:
Meeting date: 2018/05/07
Subject 2017 Audited Financial Statements
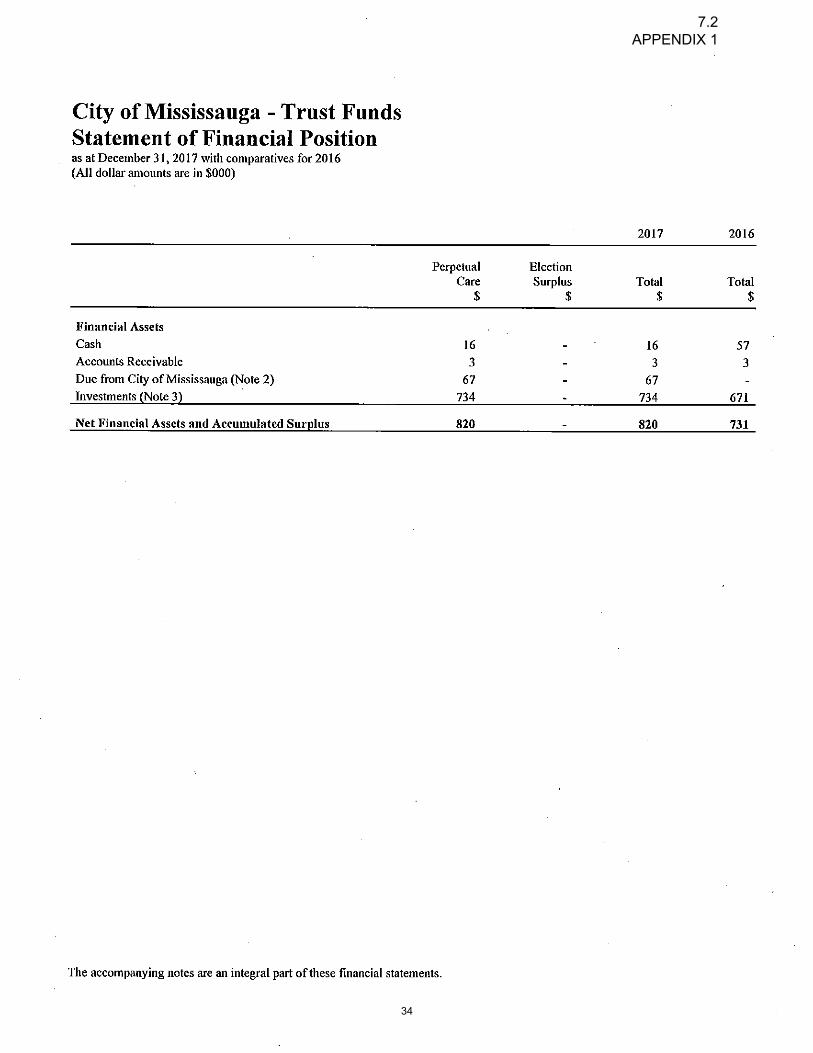
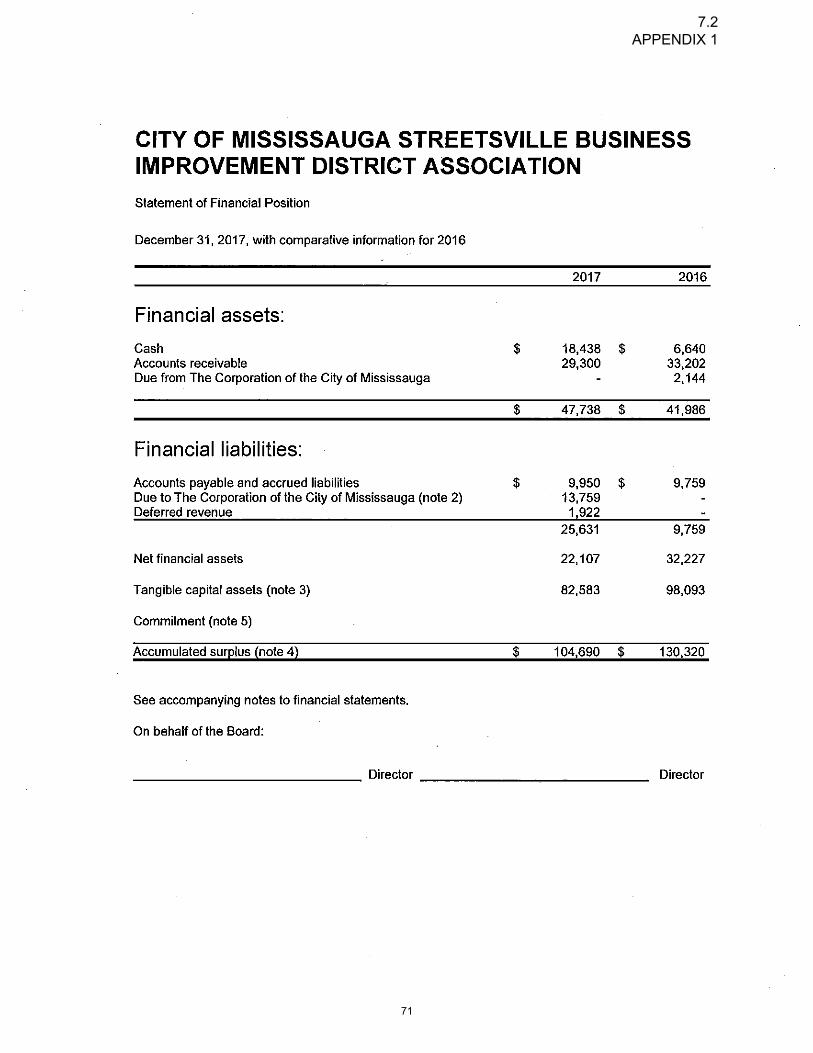
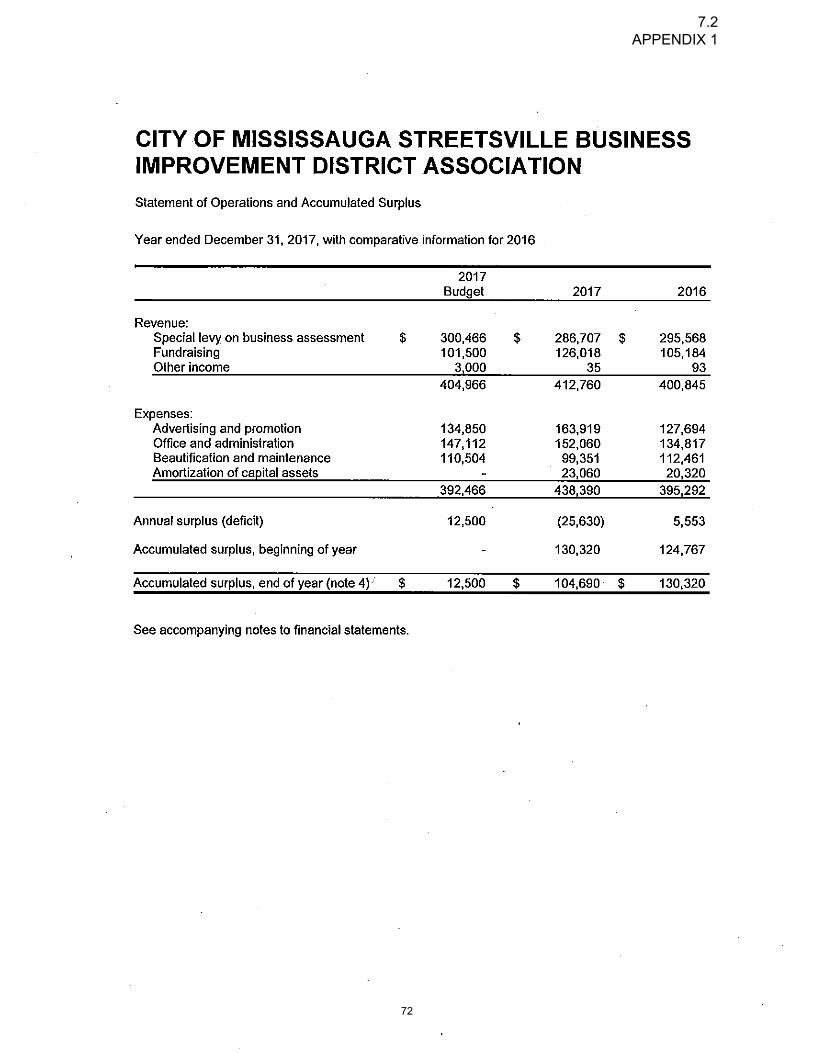
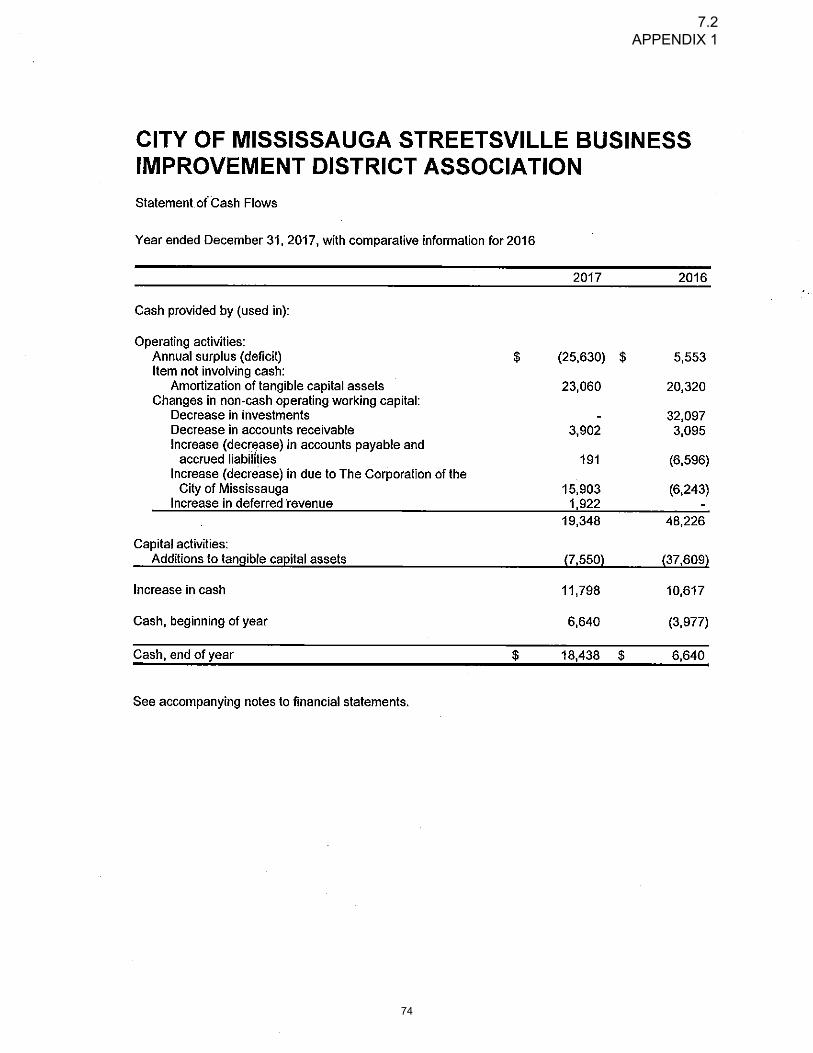
Recommendation That the 2017 Audited Financial Statements for City of Mississauga (consolidated), City of
Mississauga Public Library Board, City of Mississauga Trust Funds, Clarkson Business
Improvement Area, Port Credit Business Improvement Area, Streetsville Business Improvement
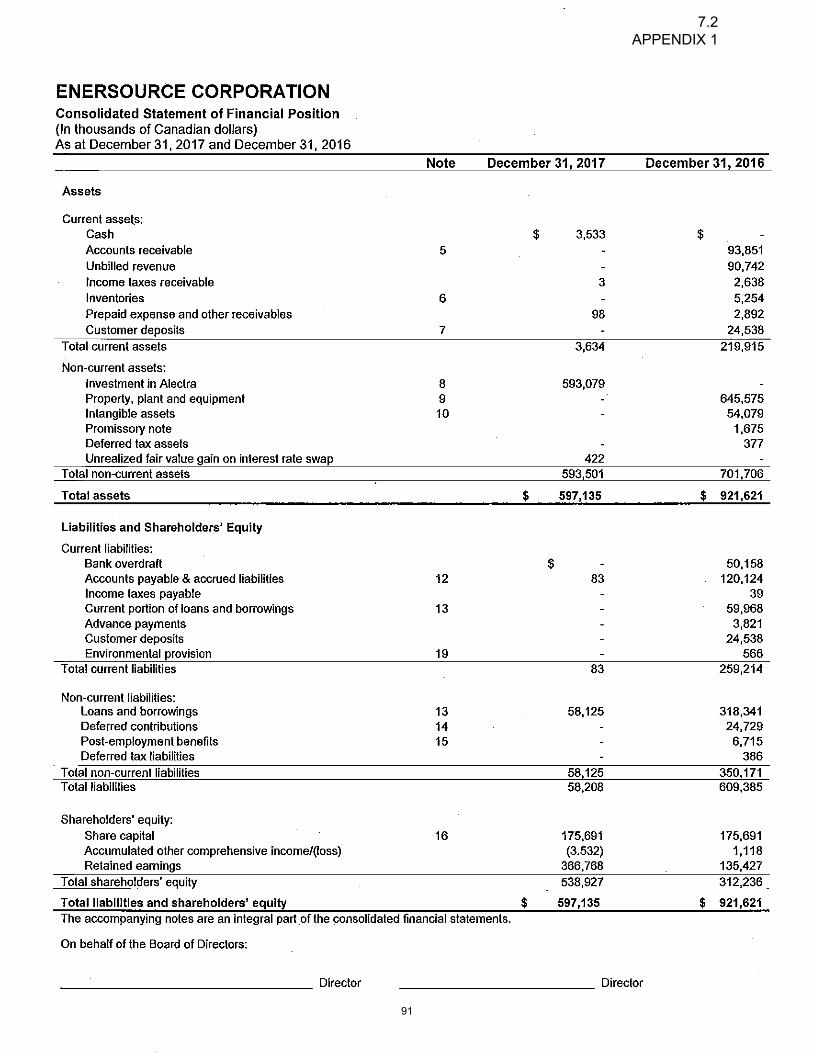
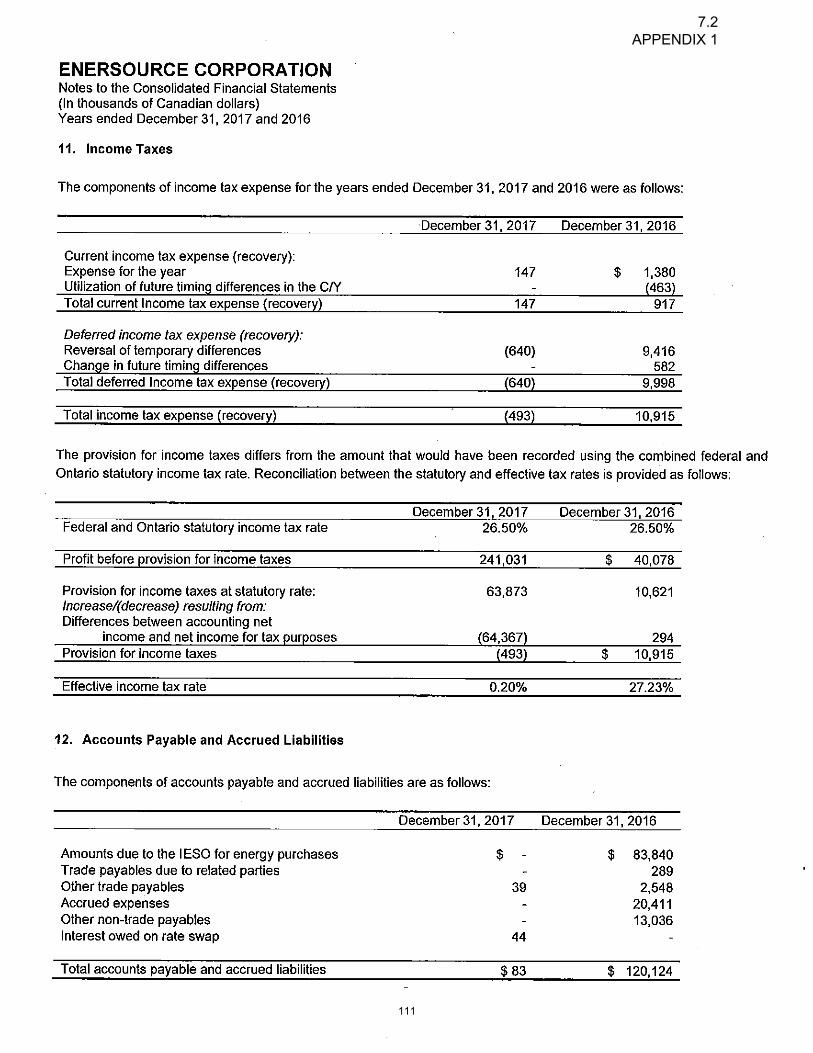
Area, Malton Business Improvement Area, and Enersource Corporation be received as
information.
Report Highlights
The audited financial statements have been reviewed and approved by the Director of
Finance and Treasurer, and the Commissioner of Corporate Services and Chief Financial
Officer.
One of the fiduciary responsibilities of the Audit Committee is to review the annual
financial statements and audit results.
This report presents the following 2017 Audited Financial Statements for:
City of Mississauga (consolidated)
City of Mississauga Public Library Board
City of Mississauga Trust Funds
Clarkson Business Improvement Area
Port Credit Business Improvement Area
Streetsville Business Improvement Area
Malton Business Improvement Area
Enersource Corporation
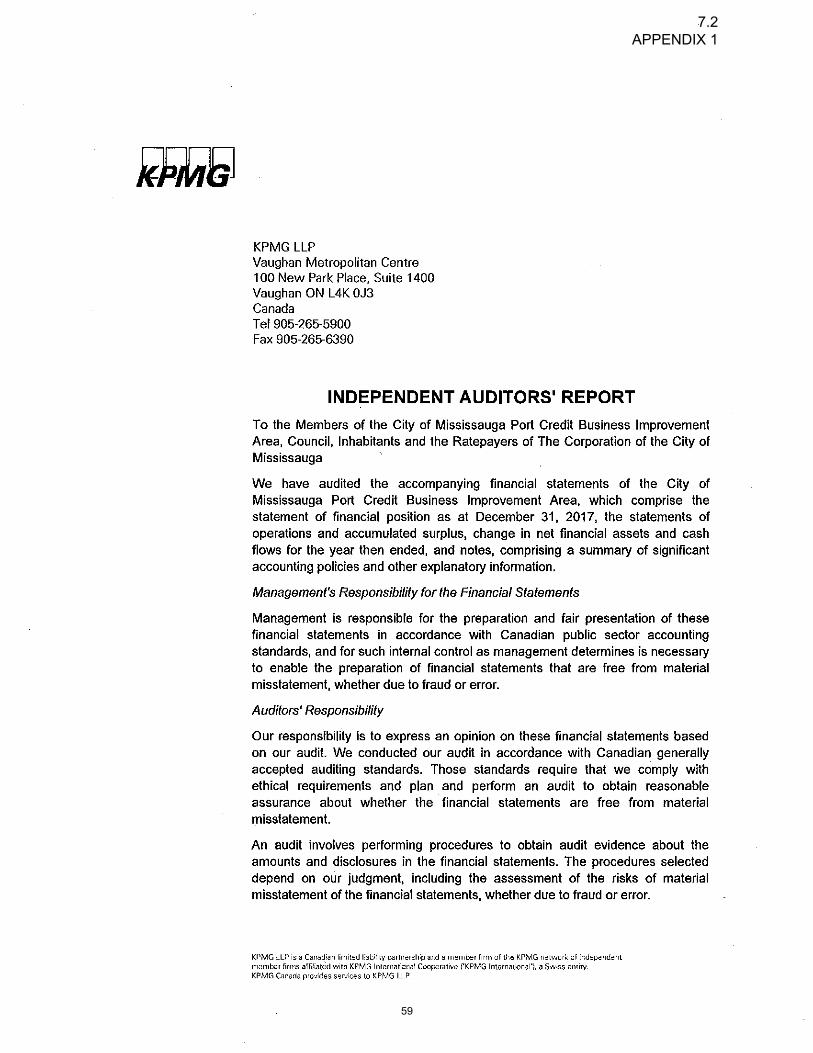
KPMG has provided an unqualified audit opinion on all financial statements which
attests to the integrity and quality of the financial statements.
7.2

Audit Committee 2018/03/29 2
Background
The statutory function of our auditors, KPMG LLP, is to report to Audit Committee by expressing
an opinion on the City’s annual financial statements. The auditors conduct their audit in
accordance with Canadian Generally Accepted Auditing Standards with the objective of
expressing an opinion whether the City’s annual financial statements present fairly, in all
material respects, the financial position, results of operations and the cash flows of the City.
Management is responsible for the preparation and fair presentation of the City’s annual
financial statements in accordance with the Public Sector Accounting Board (PSAB) financial
reporting framework.
One of the fiduciary responsibilities of the Audit Committee is to review the annual financial
statements and audit results.
KPMG LLP is in their third year of a five year contract (2015 to 2019).
Comments
The financial statements have been audited by the City’s external auditors, KPMG LLP. The
City’s financial statements follow the Public Sector Accounting Board (PSAB) recommendations
and comply fully with Canadian Generally Accepted Accounting principles.
The financial statements must provide information on the cost of all activities, how they were
financed, investing activities and the assets and liabilities of the government. The information is
to reflect the full nature and extent of the government’s financial affairs.
The Audited Financial Statements are a report card on the financial position, health and strength
of the City of Mississauga. The 2017 financial results continue to demonstrate Mississauga’s
legacy of strong leadership and excellence in financial planning and fiscal prudence.
The City of Mississauga consolidated financial statements are comprised of all organizations,
committees and local boards accountable to the City for the administration of their financial
affairs and resources and which are owned or controlled by the City.
The 2017 audited financial statements have been prepared on a different basis from the 2017
Annual Budget. Note 15 (Segmented by Service Area) within the financial statements reconciles
the actual revenues and expenses with the Service Areas adjusted budget. Note 18 (Budget
Data) also breaks down the approved budget with the adjusted budget reported in the audited
financial statments. A separate schedule within the Annual Financial Report will also breakdown
the Approved Budget with the adjusted Budget reported and actuals in the financial statements.
Refer to Appendix 2 (2017 Financial Year in Review) for detailed information and analysis on
the financial statements and results. To complement the audited financial statements, Finance
is currently preparing the 2017 Annual Financial Report and 2017 Annual Popular Report
(Financial Highights) which will be available on the City’s website.
7.2

Audit Committee 2018/03/29 3
For the 20th consecutive year, the Government Finance Officers Association (GFOA) of the
United States and Canada presented the City of Mississauga with the Canadian Award for
Financial Reporting for its 2016 Annual Financial Report in recognition of the City’s ability to
present financial information in a clear, concise and informative manner. This award program
encourages innovative financial reporting and maintains a high quality standard that is
recognized amongst peers.
For the first year in 2016 the Government Finance Officers Association (GFOA) of the United
States and Canada presented the City of Mississauga with the Canadian Award for Popular
Financial Reporting.The purpose of this report is to present highlights of the Annual Financial
Report to our citizens and other stakeholders in a clear and understandable format. We
understand the presentation of the budget and financial statements can be complex to
understand. This report does not contain all the financial information that is presented in the
Annual Financial Report. We have identified key highlights from the Annual Financial Report to
provide a high-level view of the City’s finances.
The 2017 Annual Financial and Popular Reports will continue to be prepared in electronic
format and will be available to all stakeholders on the City’s website. No print versions of the
Annual report will be produced for public and stakeholder distribution. A notice will be posted in
the Mississauga News advising residents and other stakeholders that the Annual Financial
Report will be posted and available on the City’s website, www.mississauga.ca/finance where it
can be printed or read at their convenience.
Financial Impact
The City’s year-end audit fees for the 2017 financial statements were $129,250 plus applicable
taxes. This audit included the City, Mississauga Public Library Board, Trust Funds, and four
Business Improvement Areas.
On February 1, 2017, through a series of transactions, Enersource Corporation became owner
of 31% of Alectra Inc. ("Alectra"), an entity created through the merger of certain hydro holding
companies. The transactions included Enersource Corporation exchanging all of its ownership
in its operating companies for this ownership in the newly created merged entity of Alectra.
Included in these transactions and as of the same date, the City entered into an arrangement to
provide loan guarantees to Enersource Corporation.
The City’s 90% interest in Enersource Corporation in 2017 was $485.0 million (2016
$281.0 million), an increase of $204 million and has been reported as a financial asset
on the Consolidated Statement of Financial Position. The $204 million increase relates
to a $202.7 million gain on Investment in Enersource Corporation through the February
2017 merger into Alectra Inc. plus share of net income from operations of Enersource
Corporation of $14.2 million less the dividend paid to City of $12.9 million. The $14.2 net
income was made up of $18.3 million net income less a $4.1 million Other
Comprehensive Income (OCI) loss. This income has been reported as revenue on the
City’s Consolidated Statement of Financial Activities.
7.2

Audit Committee 2018/03/29 4
Conclusion
The 2017 Financial Statements are a report on the stewardship of the City’s financial affairs and
the Auditor’s Reports attest that they present fairly our financial position as at December 31,
2017 and the results of operations for the year then ended.
There were no concerns identified with the 2017 audit or financial statements. The City financial
position remains healthy and strong through sound managment practices and fiscal prudence.
Attachments Appendix 1: 2017 Audited Financial Statements
Appendix 2: Financial Year In Review
Gary Kent, CPA, CGA, Commissioner of Corporate Services and Chief Financial Officer
Prepared by: Mark Beauparlant, Manager, Financial and Treasury Services
7.2

1
7.2 APPENDIX 1

2
7.2 APPENDIX 1

3
7.2 APPENDIX 1

4
7.2 APPENDIX 1

5
7.2 APPENDIX 1

6
7.2 APPENDIX 1

7
7.2 APPENDIX 1

8
7.2 APPENDIX 1

9
7.2 APPENDIX 1

10
7.2 APPENDIX 1

11
7.2 APPENDIX 1

12
7.2 APPENDIX 1

13
7.2 APPENDIX 1

14
7.2 APPENDIX 1

15
7.2 APPENDIX 1

16
7.2 APPENDIX 1

17
7.2 APPENDIX 1

18
7.2 APPENDIX 1

19
7.2 APPENDIX 1

20
7.2 APPENDIX 1

21
7.2 APPENDIX 1

22
7.2 APPENDIX 1

23
7.2 APPENDIX 1

24
7.2 APPENDIX 1

25
7.2 APPENDIX 1

26
7.2 APPENDIX 1

27
7.2 APPENDIX 1

28
7.2 APPENDIX 1

29
7.2 APPENDIX 1

30
7.2 APPENDIX 1

31
7.2 APPENDIX 1

32
7.2 APPENDIX 1
33
7.2 APPENDIX 1
34
7.2 APPENDIX 1

35
7.2 APPENDIX 1

36
7.2 APPENDIX 1

37
7.2 APPENDIX 1

38
7.2 APPENDIX 1

39
7.2 APPENDIX 1

40
7.2 APPENDIX 1

41
7.2 APPENDIX 1

42
7.2 APPENDIX 1

43
7.2 APPENDIX 1

44
7.2 APPENDIX 1

45
7.2 APPENDIX 1
46
7.2 APPENDIX 1

47
7.2 APPENDIX 1

48
7.2 APPENDIX 1

49
7.2 APPENDIX 1

50
7.2 APPENDIX 1

51
7.2 APPENDIX 1

52
7.2 APPENDIX 1

53
7.2 APPENDIX 1

54
7.2 APPENDIX 1

55
7.2 APPENDIX 1

56
7.2 APPENDIX 1

57
7.2 APPENDIX 1

58
7.2 APPENDIX 1
59
7.2 APPENDIX 1

60
7.2 APPENDIX 1

61
7.2 APPENDIX 1

62
7.2 APPENDIX 1

63
7.2 APPENDIX 1

64
7.2 APPENDIX 1

65
7.2 APPENDIX 1
66
7.2 APPENDIX 1

67
7.2 APPENDIX 1

68
7.2 APPENDIX 1

69
7.2 APPENDIX 1
70
7.2 APPENDIX 1
71
7.2 APPENDIX 1
72
7.2 APPENDIX 1

73
7.2 APPENDIX 1
74
7.2 APPENDIX 1

75
7.2 APPENDIX 1
76
7.2 APPENDIX 1

77
7.2 APPENDIX 1

78
7.2 APPENDIX 1

79
7.2 APPENDIX 1

80
7.2 APPENDIX 1

81
7.2 APPENDIX 1

82
7.2 APPENDIX 1

83
7.2 APPENDIX 1

84
7.2 APPENDIX 1

85
7.2 APPENDIX 1

86
7.2 APPENDIX 1

87
7.2 APPENDIX 1

88
7.2 APPENDIX 1

89
7.2 APPENDIX 1

90
7.2 APPENDIX 1
91
7.2 APPENDIX 1

92
7.2 APPENDIX 1

93
7.2 APPENDIX 1

94
7.2 APPENDIX 1

95
7.2 APPENDIX 1

96
7.2 APPENDIX 1

97
7.2 APPENDIX 1

98
7.2 APPENDIX 1

99
7.2 APPENDIX 1

100
7.2 APPENDIX 1

101
7.2 APPENDIX 1

102
7.2 APPENDIX 1
103
7.2 APPENDIX 1

104
7.2 APPENDIX 1

105
7.2 APPENDIX 1

106
7.2 APPENDIX 1

107
7.2 APPENDIX 1

108
7.2 APPENDIX 1

109
7.2 APPENDIX 1

110
7.2 APPENDIX 1
111
7.2 APPENDIX 1

112
7.2 APPENDIX 1

113
7.2 APPENDIX 1

114
7.2 APPENDIX 1

115
7.2 APPENDIX 1

116
7.2 APPENDIX 1

117
7.2 APPENDIX 1

118
7.2 APPENDIX 1

119
7.2 APPENDIX 1

120
7.2 APPENDIX 1

APPENDIX 2
2017 FINANCIAL YEAR IN REVIEW
The City of Mississauga’s consolidated financial statements have been prepared in accordance
with the Municipal Act and based on the reporting standards set by the Public Sector Accounting Board (PSAB) of CPA Canada.
There are four required consolidated financial statements: the consolidated statement of
financial position, the consolidated statement of operations, the consolidated statement of change in net financial assets, and the consolidated statement of cash flows. These
consolidated financial statements provide information on the cost of all the City activities, how they were financed, investing activities and the assets and liabilities of the City. The information
also reflects the full nature and extent of the City’s financial affairs similar to a private sector financial statement presentation.
The following is a high-level overview of the 2017 financial results of the City.
Consolidated Statement of Financial Position
The consolidated statement of financial position highlights four key figures that together
describe the financial position of a government:
(a) the cash resources of the government; (b) the net financial asset position, calculated as the
difference between financial assets and financial liabilities; (c) the non-financial assets that are
normally held for service provision such as tangible capital assets; and, (d) the accumulatedsurplus/deficit (or in private sector terms, retained earnings: not termed so by governments as
there are no shareholder contributions or distributions).
Although the City continues to manage its financial operations through various funds such as the Operating Fund, the Capital Fund, the Reserves and the Reserve Funds, in accordance with
Public Sector Accounting Board PSAB, these funds are no longer individually reported in the consolidated financial statements and have been replaced by Accumulated Surplus. The
Accumulated Surplus summarizes the Corporation’s consolidated equity which identifies the financial position, including all tangible capital assets and financial resources of the City.
Accumulated Surplus
The City’s accumulated surplus for fiscal year 2017 is $8.9 billion (2016 $8.5 billion). The City’s 2017 accumulated surplus (Note 9) is comprised of the following balances:
7.2

APPENDIX 2
Financial Assets
Financial assets in 2017 were $1.65 billion (2016 $1.35 billion), an increase of $300 million from the prior year.
($000s)
Item Ref.# 2017 Actual 2016 Actual $ change vs
prior year
% change
Cash 1 131,819 103,804 28,015 27%
Taxes receivable 2 33,978 36,611 (2,633) (7%)
Accounts receivable 3 130,051 74,129 55,922 75%
Loans and other receivables 4 550 600 (50) (8%)
Inventories for resale 5 225 284 (59) (21%)
Investments 6 872,367 856,942 15,425 2%
Investment in Enersource 7 485,034 281,012 204,022 73%
Total Financial Assets 1,654,024 1,353,382 300,643
References:
1. Cash
What it is: Cash is the money available on demand to pay for operational and capitalexpenses.
Why it’s important: Cash is used to fund the disbursements needed for daily operationssuch as payments for operating and capital purchases. The City manages cash to keep
just enough at hand for daily needs. The rest goes into investments to earn a higherreturn.
Difference between 2017 and 2016 ($28.0 million increase): As it does for individuals,the exact amount of cash on hand on a given day fluctuates based on the timing of bill
payments and investment needs. The amount of cash kept on hand is directly linked withthe level of accounts payable liabilities.
2. Taxes Receivable
What it is: Taxes receivable are any uncollected property taxes as at December 31. The
tax levy is applied in June with due dates in July, August, and September.
Why it’s important: Property tax is the single largest source of revenue for the
municipality. When collected, City property tax becomes the cash to fund dailydisbursements. The City has diligent collection practices and has historically achieved a
high rate of collection success (97-98 per cent).
Difference between 2017 and 2016 ($2.6 million decrease): this number varies year to
year based on when people pay their residential and commercial property taxes. Penaltyand interest charges are applied on all overdue accounts.
7.2

APPENDIX 2
3. Accounts Receivable
What it is: This category represents various types of receivables from across all City
operations, excluding the City portion of property taxes.
Why it’s important: In addition to property taxes, the City recovers funds from operations
fees and charges such as recreation and facility bookings, and from third parties torecover things like damage expenses and HST rebates.
Difference between 2017 and 2016 ($55.9 million increase): The current yearaccounts receivable balance is significantly higher than last year’s due to the timing
of collection and receipts. The major contributors to the increase were amounts duefrom school boards for property tax adjustments (approximately $13.5 million) and
recoverable amounts (approximately $46.3 million) from the Government of Ontariofor various capital funding programs.
4. Loans and Other Receivables
What it is: From time to time, the City enters into special contractual arrangements
approved by Council that may include loans. The City currently has one special purposeloan (20 year), made for the Vic Johnston Community Centre development project. This
loan is scheduled to be paid off in 2028.
Why it’s important: These receivables are categorized separately from other receivables
because they have been created by special arrangement.
Difference between 2017 and 2016: ($50,000 decrease): Each December, a payment of
$50,000 is applied against the original Vic Johnston Community Centre $600,000 loan.
5. Inventories for Resale
What it is: The value of owned items on hand intended for resale by various City serviceareas (e.g., snack bar items, beer and liquor, pro shop items) as at December 31.
Why it’s important: These items have value: their eventual sale yields cash for Cityoperations.
Difference between 2017 and 2016 ($59,000 decrease): This net decrease is due togeneral increases and decreases in inventory across all categories.
6. Investments
What it is: Cash that is not being used immediately for disbursements is invested to earna higher rate of return. Investments can be short-term or long-term.
Why it’s important: Investment yields a higher rate of interest than bank deposits.Investment income is the City’s fourth-highest source of revenue, and a critical
component of the City’s revenue base.
Difference between 2017 and 2016 ($15.4 million increase): Investment balances
fluctuate with cash flow requirements, and the timing of receipts and disbursements.
7. Investment in Enersource
What it is: The City is a 90 per cent shareholder in Enersource Corporation.Accordingly, this number represents 90 per cent of Enersource’s bottom line atDecember 31 (this calculation is called a modified equity consolidation). Enersource
in turn is a 31 per cent owner of Alectra and Enersource Corporation carries on no
7.2

APPENDIX 2
other business. Why it’s important: This investment elevates the City’s financial position. It also
generates dividend income, which helps support City operations and in that way helpsmoderate the property tax rate.
Difference between 2017 and 2016 ($204 million increase): The $204 million increaserelates to a $202.7 million gain on Investment in Enersource Corporation through theFebruary 2017 merger into Alectra Inc. plus share of net income from operations ofEnersource Corporation of $14.2 million less the dividend paid to City of $12.9 million.The $14.2 net income was made up of $18.3 million net income less a $4.1 million Other
Comprehensive Income (OCI) loss.
Financial Liabilities
Financial liabilities in 2017 were $922.4 million (2016 $854.9 million), an increase of $67.5 million from the prior year.
($000s)
Item Ref.# 2017 Actual 2016 Actual $ change vs prior year
% change
Accounts Payable and Accrued Liabilities
1 213,260 175,912 37,348 21%
Deferred revenue- general 2 9,742 9,013 729 8%
Deferred revenue-obligatory reserve funds
3 334,252 325,295 8,957 3%
Employee benefits and other liabilities
4 209,231 210,256 (1,025) (1%)
Long-term debt 5 155,895 134,447 21,448 16%
Total Financial Liabilities 922,380 854,923 67,457
References:
1. Accounts Payable and Accrued Liabilities
What it is: These are monies the City owes for goods, services, payroll, and/or third partytransfers as at December 31.
Why it’s important: These payables represent outstanding obligations as at December31. As payables are drawn down, the City’s cash position is also drawn down.
Difference between 2017 and 2016 ($37.3 million increase): The timing of payments andyear-end accruals affect these liabilities and the City’s cash position.
7.2

APPENDIX 2
2. Deferred Revenue – General What it is: Deferred revenues are payments received today that are to be recognized as
revenue when the related activity takes place in the future. Examples include recreationregistrations, facility bookings and transit advertising.
Why it’s important: Deferred revenues allow for payments to be received today for futureoperations.
Difference between 2017 and 2016 ($0.7 million increase): Normal, ongoing fluctuations– primarily in transit and recreation (memberships, recreation programs, facility
bookings) – are responsible for the increase. There were no extraordinary contributors tothis balance.
3. Deferred Revenue – Obligatory Funds
What it is: This liability is deferred revenue initially collected through special restrictiveagreements to be used for a purpose specified through agreement or legislation.
Examples of these types of funds include Development Charge funds, Parkland funds,Cash in Lieu of Parking, Bonus Zoning, provincial and federal public transit funds, and
provincial and federal gas tax funds.
Why it’s important: Generally these types of revenues are initially collected in dedicated
Reserve Funds and reclassified to deferred revenue – obligatory funds at year-end forfinancial statement reporting requirements. These deferred revenues are converted
into revenues when related capital expenses have been incurred.
Difference between 2017 and 2016 ($9.0 million increase): The growth in liability wasdue to growth in the balances of various obligatory Reserve Funds. This growth was
partially offset by a decrease in unspent development charge funds in capitalprojects. As the deferred revenue account reduces, corresponding revenue will showon the Statement of Operations (development contributions applied).
4. Employee benefits and other liabilities What it is: These are actuarial liability assessments for workers compensation, sick
leave benefits, disability benefits, vacation pay, and legal and insurance related items.
They represent future obligations but are reported in present value terms.
Why it’s important: This category represents future liabilities. Expenses for these
liabilities will incur in the future; however, they must be reported in the financialstatement to provide an accurate financial position for the City at a point in time. The City
engages in an external actuarial evaluation every three years to review these liabilities.The amount may be refreshed annually if there are any significant changes to the
membership program or legislation.
Difference between 2017 and 2016 ($1.0 million decrease): Increases in the actuarial
assessments for WSIB, vacation, sick leave, and early retirement were offset bydecreases in post-employment liabilities occurring because of changes in trends andclaims. Together, all resulted in a net decrease in this category.
5. Long Term Debt What it is: This is the amount of long-term debt being used to help fund investment in
capital infrastructure.
Why it’s important: Debt is one key way the City funds capital infrastructurerequirements. The City uses debt conservatively. The property tax base alone is not
7.2
APPENDIX 2
enough to support future capital infrastructure demands.
Difference between 2017 and 2016 ($21.4 million net increase): In 2017, $38.9 million ofnew debt was added. This new debt was partially offset by a pay down in prior year debtof $17.5 million.
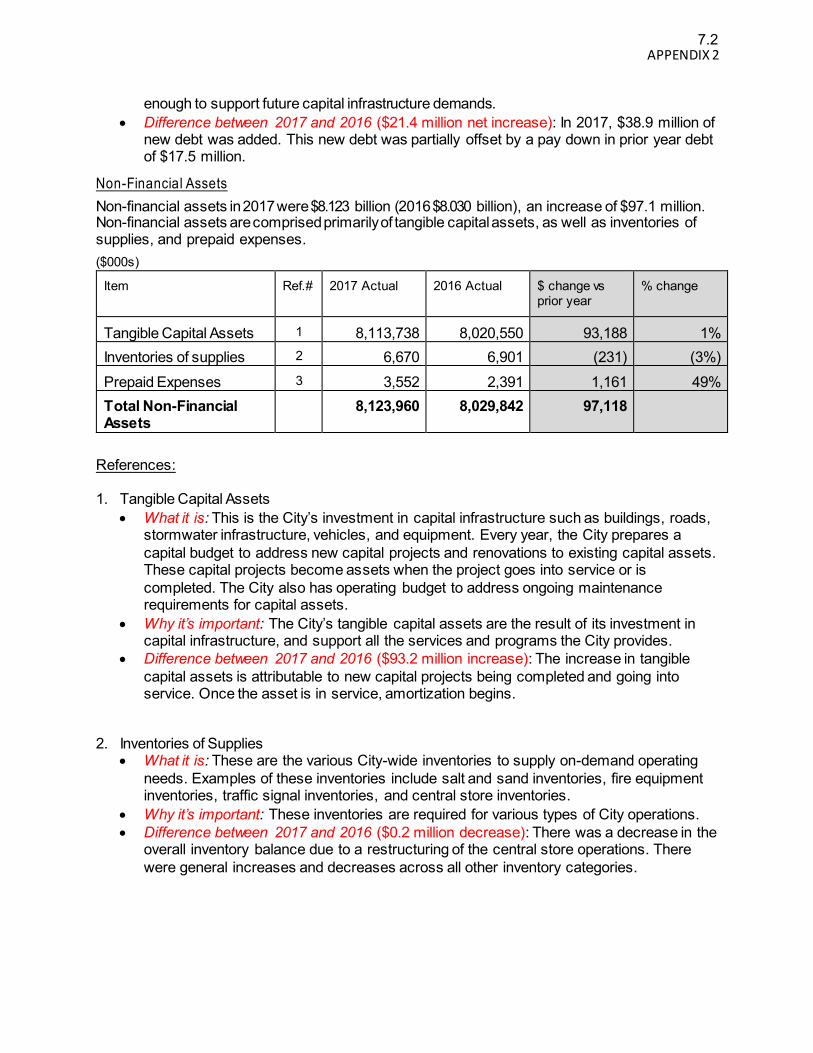
Non-Financial Assets
Non-financial assets in 2017 were $8.123 billion (2016 $8.030 billion), an increase of $97.1 million. Non-financial assets are comprised primarily of tangible capital assets, as well as inventories of supplies, and prepaid expenses.
($000s)
Item Ref.# 2017 Actual 2016 Actual $ change vs prior year
% change
Tangible Capital Assets 1 8,113,738 8,020,550 93,188 1%
Inventories of supplies 2 6,670 6,901 (231) (3%)
Prepaid Expenses 3 3,552 2,391 1,161 49%
Total Non-Financial Assets
8,123,960 8,029,842 97,118
References:
1. Tangible Capital Assets
What it is: This is the City’s investment in capital infrastructure such as buildings, roads,stormwater infrastructure, vehicles, and equipment. Every year, the City prepares a
capital budget to address new capital projects and renovations to existing capital assets.These capital projects become assets when the project goes into service or is
completed. The City also has operating budget to address ongoing maintenancerequirements for capital assets.
Why it’s important: The City’s tangible capital assets are the result of its investment incapital infrastructure, and support all the services and programs the City provides.
Difference between 2017 and 2016 ($93.2 million increase): The increase in tangible
capital assets is attributable to new capital projects being completed and going intoservice. Once the asset is in service, amortization begins.
2. Inventories of Supplies What it is: These are the various City-wide inventories to supply on-demand operating
needs. Examples of these inventories include salt and sand inventories, fire equipmentinventories, traffic signal inventories, and central store inventories.
Why it’s important: These inventories are required for various types of City operations.
Difference between 2017 and 2016 ($0.2 million decrease): There was a decrease in theoverall inventory balance due to a restructuring of the central store operations. There
were general increases and decreases across all other inventory categories.
7.2

APPENDIX 2
3. Prepaid Expenses What it is: Prepaid expenses are payments made in the current year that pertain to
future year expenses. Some of the major prepaid accounts include memberships, facilitybookings, prepaid investment interest, prepaid debt fees, and prepaid postage.
Why it’s important: Prepaid expenses allow for the matching of expenses with revenueswhen the event takes place. Prepaid expense balances are drawn down as related
revenues are received or the expense year has been met.
Difference between 2017 and 2016 ($1.2 million increase): The net increase resulted
from routine increases/decreases in prepaid expenses across all categories.
Consolidated Statement of Operations
The consolidated statement of operations reports the annual surplus/(deficit) from operations
during the accounting period. The statement shows the cost of providing the City’s services, the revenues recognized in the period and the difference between them.
The City’s annual budget is prepared on a cash basis for the purpose of calculating the property tax levy. The audited financial statements are prepared differently. The audited
financial statements are prepared on an accrual accounting basis under the Public Sector Accounting and Reporting Guidelines. To achieve accordance with generally accepted accounting principles (GAAP), there are certain budgeted revenues and expenses within the
financial statements that need to be eliminated for financial reporting purposes. To do this, a number of elimination entries such as transfers between funds, debt principal repayments, and dividend receipts are made. In addition to these eliminations, there are a few other non-
budgeted adjustments included to help align with actual numbers. Some of these non-budgeted adjustments include BIA consolidations, amortization of capital assets, and Reserve Fund interest.
Please refer to the Budget Overview section within this report for a reconciliation between the annual budget and audited financial statements.
7.2

APPENDIX 2
Revenues
Total revenues in 2017 were $1,173.2 million (2016 $885.9 million), an increase of $287.3 million.
($000s)
Item Ref.#
2017 Actual
2017
Adjusted
Budget
2016 Actual
$ change vs
Adjusted
Budget
% change
$ change vs prior
year
% change
Taxation 1 500,149 497,723 470,641 2,426 0.4% 29,508 6%
User charges 2 249,043 229,787 239,900 19,256 8% 9,143 4%
Recoveries from
third parties
3 48,874 38,145 11,157 10,729 28% 37,717 338%
Funding transfers
from other
governments
4 3,043 1,621 3,887 1,422 88% (844) (22%)
Development and other contributions
applied
5 90,547 0 69,217 90,547 21,330 31%
Investment income 6 37,628 27,963 34,903 9,665 35% 2,725 8%
Penalties and interest on taxes
7 9,133 8,120 8,444 1,013 12% 689 8%
Contributed assets 8 11,732 0 18,595 11,732 (6,863) (37%)
Other Revenues 9 6,099 1,321 2,292 4,778 361% 3,807 166%
Equity in income of Enersource
Corporation
10 14,194 0 26,855 14,194 (12,661)
Equity in gain on exchange of
Enersource Hydro
Mississauga
11 202,734 0 0 202,734 202,734
Total Revenues 1,173,176 804,680 885,891 368,496 287,285
Note re: Difference between Actual and Budget: where actual revenue exceeds budgeted revenue, the variance is described as a surplus against budget; where revenue is under budget, the variance is described as a deficit against budget.
References:
1. Taxation
What it is: Taxation refers to the City’s property taxation revenues. It included
property taxes and payments in lieu of taxes. Why it’s important: Property tax is the City’s single largest source of revenue.
Difference between 2017 and 2016 ($29.5 million increase): Two things influence this
7.2

APPENDIX 2
number: assessment growth, and the annual Business Plan & Budget. In 2017, assessment growth was 0.4 per cent (0.339 per cent in 2016). The 2017 Business
Plan & Budget Council adopted included a 4.9 per cent increase over 2016’s in total taxation revenue, which translated to an overall 1.6 per cent increase on the total residential tax bill. An increase ($1.3 million) in payments in lieu of taxes (PILT)
accounts for the rest of the change.
Difference between Actual and Budget ($2.4 million surplus): The budget anticipated all but 0.4 per cent of the year-over-year change.
2. User charges
What it is: User fees are associated with many City programs and services. Transit fares, recreation program fees, and the Stormwater program charge are three
examples. Council establishes fees via by-law annually. Revenue from enforcement activities (fines) are also accounted for here.
Why it’s important: User fees contribute significantly to covering service costs. User fees
are the second-largest source of City revenue in 2017.
Difference between 2017 and 2016 ($9.1 million increase): There were four key
contributors to this increase: general fees increased by $1.2 million; transit fares by $4.3 million; building permits by $2.2 million; and Provincial Offence fines by $1.2 million. Increases and decreases in other user fee categories accounted for the
balance of the net increase.
Difference between Actual and Budget ($19.2 million surplus): $17.0 million of this surplus relates to various City-wide general fees ($9.1 million); transit revenue ($2.5
million); licenses and permits ($2.1 million); by-law fines ($1.2 million); Provincial Offences Act fines ($1.7 million), and City-wide rents and concessions ($0.5 million). The remaining $2.2 million relates to non-budgeted transactions such as capital
projects user fees.
3. Recoveries from Third Parties
What it is: Occasionally there is City work a third party will ultimately pay for. For example, if the City and Region were involved together in a capital project (i.e., road construction) and the City were handling payments on the project, the Region would
repay the City for the Region’s share of the project’s capital costs. Why it’s important: From time to time, the City performs additional work on behalf of third
parties such as the Region of Peel, Metrolinx, or an insurance company. Any work
performed on behalf of third parties is recoverable by the City.
Difference between 2017 and 2016 ($37.7 million increase): This amount varies from
year to year based on the timing of capital work performed on behalf of third parties.
Difference between Actual and Budget ($10.7 million surplus): Higher than expected capital recoveries account for this surplus against budget.
4. Funding transfers from other governments
What it is: The City receives grants and funding from other levels of government for many types of services and initiatives.
Why it’s important: While these transfers represent a small portion of the overall City
revenue, it is valuable revenue that helps pay for City programs and services.
Difference between 2017 and 2016 ($0.8 million decrease): There was a modest
7.2

APPENDIX 2
decrease in some provincial-related grants in 2017.
Difference between Actual and Budget ($1.4 million surplus): Surpluses against budget
of $0.7 million occurred for grants for libraries, seniors, tourism, heritage andenvironment. The balance of the surplus ($0.7 million) relates to non-budgeted capitalgovernment funding.
5. Development and other contributions
What it is: In the year, if capital-related expenses are incurred that correspond todeferred revenue – obligatory funds that the City holds, dollars are brought into therevenue stream from those funds to offset those capital expenses.
Why it’s important: Development and other contributions help fund capital projects.
Difference between 2017 and 2016 ($21.3 million increase): Development
contributions increased in 2017 to pay for more capital project expenses. Thesemonies were drawn from the deferred revenue – obligatory reserve funds.
Difference between Actual and Budget ($90.5 million surplus): The entire amount in
this category shows as surplus because this category is not included in the budget.
6. Investment income:
What it is: This is interest income for both the Operating and Reserve Funds. Why it’s important: Investment income helps to grow City funds.
Difference between 2017 and 2016 ($2.7 million increase): Two factors impactinvestment income growth: the market interest rate and the City’s balances in the
investment portfolio. As the City draws down on its Reserves and Reserve Funds, it willhave a corresponding effect on interest earnings. In 2017, the City earned an average
interest rate of 3.51 per cent (2016 3.38 per cent) on the investment portfolio,contributing to the year-over-year growth that occurred.
Difference between Actual and Budget ($9.7 million surplus): There was a $9.7 millionsurplus in investment income from the Reserve Fund. The surplus relates to a higherrate of interest and higher Reserve Fund balances then projected.
7. Penalties and interest on taxes
What it is: This revenue results from penalties and interest charged on overdue
property tax accounts. Why it’s important: Penalties and interest on taxes help to offset any costs associated
with untimely property tax payment.
Difference between 2017 and 2016 ($0.7 million increase): There was a modestincrease in 2017 in penalty and interest revenues over those of 2016. Revenues are
dependent on the timing of payment of property taxes.
Difference between Actual and Budget ($1.0 million surplus): In 2017 there was asurplus of $1.0 million, a positive variance to the budget of 12.3 per cent.
8. Contributed assets
What it is: This revenue category includes assets assumed by the City (such as landunder roads, land under infrastructure and general infrastructure) throughdevelopment agreements.
Why it’s important: Contributed assets are important because they form part of the City’scapital infrastructure but the City does not pay for them. Developers have paid for these
assets through their development agreements.
7.2

APPENDIX 2
Difference between 2017 and 2016: ($6.9 million decrease): Contributed assets varyfrom year to year depending on the agreements reached and when the developertransfers the asset to the City through development agreements.
Difference between Actual and Budget ($11.7 million surplus): The entire amount inthis category shows as surplus because this category is not included in the budget.
9. Other Revenues
What it is: These are miscellaneous and one-time revenues received by the City. Why it’s important: Other revenues help support and fund City programs and services.
Difference between 2017 and 2016 ($3.8 million increase): This number routinely
fluctuates due to its miscellaneous nature. Generally these revenues are one-timerevenues and not sustainable.
Difference between Actual and Budget ($4.8 million surplus): The sale of City capitalassets accounted for $3.1 million of this variance. The balance relates to various City-wide increases and decreases.
10. Equity in income of Enersource Corporation
What it is: The City is a 90 per cent shareholder in Enersource Corporation. This
number represents 90 per cent of Enersource’s bottom line at December 31 (thiscalculation is called a modified equity consolidation). Enersource in turn is a 31 percent owner of Alectra and Enersource Corporation carries on no other business.
Why it’s important: Enersource income elevates the City’s financial position and therebymoderates the property tax rate.
Difference between 2017 and 2016: ($12.7 million decrease): Due to the merger ofEnersource Hydro Mississauga Inc. into Alectra Inc. in February 2017, there wereadditional merger related costs that impacted net income levels from Alectra Inc. whichflowed into Enersource Corporation for the year.
Difference between Actual and Budget ($14.2 million increase): The entire amountshows as a variance because equity income of Enersource Corporation is not abudgeted item.
11. Equity in gain on sale of Enersource Corporation
What it is: On February 1, 2017, through a series of transactions EnersourceCorporation became owner of 31 per cent of Alectra Inc., an entity created through the
merger of certain hydro holding companies. The transactions included EnersourceCorporation exchanging all its ownership in its operating companies for the ownership in
the newly created merged entity of Alectra.
Why it’s important: This transaction created a gain on the investments which is reflected
in the financial statements.
Difference between 2017 and 2016 ($202.7 million increase): Due to merger of
Enersource Hydro Mississauga Inc. into Alectra Inc. in February 2017, there wereadditional gains on investment in the new corporation.
Difference between Actual and Budget ($202.7 million surplus): Since this was a newtransaction in 2017, there was no 2016 budget data.
7.2

APPENDIX 2
Expenses
Expenses are broken down into major expense categories: labour and benefits, materials and supplies, contracted services, rents and financial expenses, transfer payments, and amortization.
Total expenses in 2017 were $845.9 million (2016 $826.6 million), an increase of $19.3 million.
($000s)
Item Ref.#
2017 Actual
2017 Adjusted
Budget
2016 Actual
$ change vs
Adjusted
Budget
% change
$ change vs prior
year
% change
Salaries, wages, and employee benefits
1 491,101 498,708 485,697 (7,607) (2%) 5,404 1%
Long-term debt interest and fees
2 3,015 3,369 2,751 (354) (11%) 264 10%
Materials and supplies
3 60,228 55,343 55,230 4,885 9% 4,998 9%
Contracted services
4 78,141 57,018 76,384 21,123 37% 1,757 2%
Rents and financial
expenses
5 70,085 69,644 68,728 441 1% 1,357 2%
External transfers to others
6 6,814 6,990 6,621 (176) (18%) 193 3%
Loss on disposal of tangible capital assets
7 2,544 0 1,074 2,544 1,470 136%
Amortization 8 133,945 135,136 130,113 (1,191) (1%) 3,832 3%
Total Expenses 845,873 826,208 826,598 19,665 19,275
Note re: Difference between Actual and Budget: where actual expenses exceed budgeted expenses, the variance is described as a deficit against budget (shown as a positive number); where actual expenses are under budget, the variance is described as a surplus against budget (shown as a negative number).
References:
1. Salaries, wages, and employee benefits
What it is: This figure represents salary, wage and benefit costs for all full-time, part-time and contract employees, plus the current year impacts for actuarial benefit
assessment of WSIB, sick leave, disability benefits and post-retirement benefits.
7.2

APPENDIX 2
Why it’s important: People are the number one resource required to deliver Cityservices, so this category has a corresponding size.
Difference between 2017 and 2016 ($5.4 million increase): This anticipated increasewas largely due to labour contract settlements, pay adjustments and increased benefit
and WSIB costs. Difference between Actual and Budget ($7.6 million surplus): An operating surplus of
$13.6 million occurred due to position vacancies and delays in new hires. This surplus waspartially offset by non-budgeted adjustments such as Public Sector Accounting Board(PSAB) benefit adjustments ($4.3 million) and non-capitalized labour expenses ($1.7million).
2. Long-term debt interest and fees
What it is: This figure represents all debt management and interest fees associatedwith the City’s debt.
Why it’s important: Debt is a source of funding for capital projects. Provincial legislation
allows municipalities to carry debt equivalent to 25 per cent of own-source revenue:Mississauga is substantially below this ceiling, at just 3 per cent in 2017.
Difference between 2017 and 2016 ($0.3 million increase): Some debt principal was paiddown in 2017 ($17.5 million) and some new debt was added ($38.9 million). The net
increase in debt is what drove the year-over-year increase in the long-term debt interestand fees category.
Difference between Actual and Budget ($0.4 million surplus): A surplus was generated inthis category because of the timing within the year between the budgeted and the actual
issuance of debt.
3. Materials and Supplies
What it is: Materials and supplies include vehicle fuel and all other general operationmaterials and supplies needed for service and program delivery.
Why it’s important: These materials are necessary to keep day-to-day operationsrunning without interruption.
Difference between 2017 and 2016 ($4.9 million increase): There were a few keycontributors to the net increase 2017 over 2016. Higher per-litre diesel fuel costs were
the main contributor to the increase ($3.3 million). Net increases and decreases inother City-wide material categories and non-capitalized expenses accounted for thebalance of the change.
Difference between Actual and Budget ($4.9 million deficit): The deficit in this categoryis largely the result of two opposing changes: increases in transportation related costs,including higher diesel fuel costs ($0.6 million) and non- budgeted non-capitalized
material expenses ($5.9 million);,and decreases in expenses for general materials andsupplies including those related to winter maintenance ($1.6 million). Other City-widedecreases accounted for the balance of the variance.
4. Contracted services
What it is: The City contracts with third parties for some professional and capitalproject management services.
Why it’s important: Contracted services can bring a level of expertise to the City that the
City may not have, or augment resources to support a specific initiative. The City can
7.2
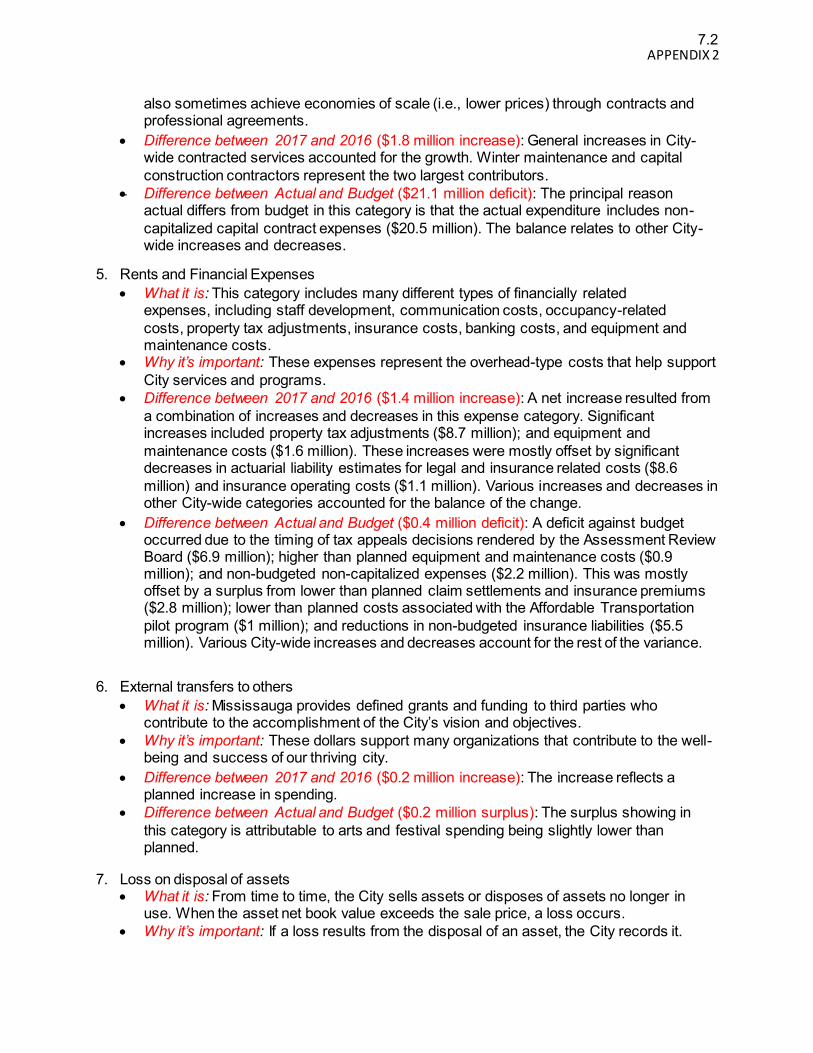
APPENDIX 2
also sometimes achieve economies of scale (i.e., lower prices) through contracts and professional agreements.
Difference between 2017 and 2016 ($1.8 million increase): General increases in City-wide contracted services accounted for the growth. Winter maintenance and capital
construction contractors represent the two largest contributors.
Difference between Actual and Budget ($21.1 million deficit): The principal reasonactual differs from budget in this category is that the actual expenditure includes non-
capitalized capital contract expenses ($20.5 million). The balance relates to other City-wide increases and decreases.
5. Rents and Financial Expenses
What it is: This category includes many different types of financially relatedexpenses, including staff development, communication costs, occupancy-related
costs, property tax adjustments, insurance costs, banking costs, and equipment andmaintenance costs.
Why it’s important: These expenses represent the overhead-type costs that help support
City services and programs.
Difference between 2017 and 2016 ($1.4 million increase): A net increase resulted from
a combination of increases and decreases in this expense category. Significantincreases included property tax adjustments ($8.7 million); and equipment and
maintenance costs ($1.6 million). These increases were mostly offset by significantdecreases in actuarial liability estimates for legal and insurance related costs ($8.6
million) and insurance operating costs ($1.1 million). Various increases and decreases inother City-wide categories accounted for the balance of the change.
Difference between Actual and Budget ($0.4 million deficit): A deficit against budgetoccurred due to the timing of tax appeals decisions rendered by the Assessment ReviewBoard ($6.9 million); higher than planned equipment and maintenance costs ($0.9million); and non-budgeted non-capitalized expenses ($2.2 million). This was mostlyoffset by a surplus from lower than planned claim settlements and insurance premiums($2.8 million); lower than planned costs associated with the Affordable Transportation
pilot program ($1 million); and reductions in non-budgeted insurance liabilities ($5.5million). Various City-wide increases and decreases account for the rest of the variance.
6. External transfers to others
What it is: Mississauga provides defined grants and funding to third parties whocontribute to the accomplishment of the City’s vision and objectives.
Why it’s important: These dollars support many organizations that contribute to the well-being and success of our thriving city.
Difference between 2017 and 2016 ($0.2 million increase): The increase reflects aplanned increase in spending.
Difference between Actual and Budget ($0.2 million surplus): The surplus showing in
this category is attributable to arts and festival spending being slightly lower thanplanned.
7. Loss on disposal of assets What it is: From time to time, the City sells assets or disposes of assets no longer in
use. When the asset net book value exceeds the sale price, a loss occurs.
Why it’s important: If a loss results from the disposal of an asset, the City records it.
7.2

APPENDIX 2
Difference between 2017 and 2016 ($1.5 million increase): Loss on disposal of assetsvaries from year to year depending on the identification and disposal of assets.
Difference between Actual and Budget ($2.5 million deficit): The full amount shows asa deficit against budget because loss on disposal of assets is not a budgeted item.
8. Amortization of tangible capital assets
What it is: Capital assets lose value over time. The expense of this loss is amortizedover the life of the asset. Different amortization percentages apply to different assetcategories, as their useful lives differ in length.
Why it’s important: Amortization allows the net value of assets (vs. their cost value) to berepresented on the financial statements.
Difference between 2017 and 2016 ($3.8 million increase): The total amortizationamount increases as the City’s capital assets grow.
Difference between Actual and Budget ($1.2 million surplus): Amortization is not
included in the annual operating budget: however, for the purpose of the financialstatements an estimate is included to match up against the expense. In this instance,the expenditure was slightly lower than the estimate due to the timing of capitalization
of expenses and unplanned disposals.
Consolidated Statement of Change in Net Financial Assets
The consolidated statement of change in net financial assets/(net debt) starts with the annual surplus/(deficit) and identifies changes in non-financial assets (i.e. tangible capital asset
acquisition, amortization) that will utilize or add to the surplus amount to derive a net change in financial assets.
Consolidated Statement of Cash Flows
The consolidated statement of cash flows reports changes in cash and short-term investments resulting from operations and shows how the City financed its activities during the year and met its cash requirements.
Tangible Capital Assets Overview
All City assets as at the end of 2017 have been inventoried, valued and recorded in an Asset Registry for accounting and reporting purposes.
The City’s net book value of tangible capital assets at the end of 2017 was $8.113 billion (2016 $8.020 billion). Refer to Note #9 in the financial statements for a detailed breakdown of tangible capital asset activity.
The annual amortization expense in 2017 was $133.9 million (2016 $130.1 million).
Reserves and Reserve Funds Overview
Although Reserves and Reserve Funds are not formally reported directly in the financial statements, they are key in the financial management and operations of the City. Reserves and Reserve Fund balances are consolidated within the Accumulated Surplus position on the Consolidated Statement
of Operations. Refer to Note #10 in the financial statements for more Reserve and Reserve Fund
7.2

APPENDIX 2
information.
Reserves and Reserve Funds are established by Council. These funds are set aside to help offset future capital needs, obligations, pressures and costs. They are drawn upon to finance specific-
purpose capital and operating expenditures as designated by Council to minimize tax rate fluctuations due to unanticipated expenditure and revenue shortfalls and to fund ongoing programs
(i.e., insurance and employee benefits).
Reserves and Reserve Fund balances at the end of 2017 totalled $393.8 million (2016 $393.5 million), an increase of $0.3 million from the prior year. The Reserves and Reserve Fund totals do not include development charges and senior government grants that are reported as deferred revenue-obligatory reserve funds on the Statement of Financial Position.
Reserves
Reserves, which are discretionary in nature, are generally used to offset major fluctuations in operating costs/revenues or to fund future contingent liabilities.
Total Reserves in 2017 were $71.3 million (2016 $66.2 million), an increase of $5.1 million.
Reserve Funds
Reserve Funds are non-discretionary, segregated and restricted to meet specific identified
purposes for the municipality.
Total Reserve Funds in 2017 were $322.5 million (2016 $327.3 million), a decrease of $4.8 million from the prior year.
The Reserve and Reserve Funds will help the City meet projected expenditure needs in the
upcoming years. However, draws on Reserve and Reserve Funds in future years to support our growing capital infrastructure and maintenance needs will reduce these balances and
therefore reduce the total accumulated surplus.
This future surplus reduction has been anticipated for many years, recognizing that as the City matured, infrastructure renewal would require increased funding. Additional funding
support is needed from senior levels of government, as well as ongoing increased annual contributions from the operating funds, in order to help sustain and invest in new and
replacement infrastructure.
7.2

Date: 2018/04/19
To: Chair and Members of Audit Committee
From: Gary Kent, CPA, CGA, Commissioner of Corporate Services and Chief Financial Officer
Originator’s files:
Meeting date: 2018/05/07
Subject 2017 External Audit Findings Report
Recommendation That the 2017 External Audit Findings Report dated April 19, 2018 from the Commissioner of
Corporate Services and Chief Financial Officer, which includes the Audit Findings Report from
KPMG for the fiscal year 2017 for the City of Mississauga (City), be received for information.
Report Highlights
The 2017 External Audit Findings Report provides an overview of the 2017 audit
process and findings and highlights those matters on which the Auditors wish to advise
the Audit Committee.
The Audit Committee is responsible for reviewing any reports and correspondence from
the External Auditor relating to the City and any local boards or agencies which may be
created
KPMG did not identify any adjustments that were communicated to management and
subsequently corrected in the financial statements.
KPMG did not identify any adjustments that remain uncorrected.
In 2017, there were no process improvement recommendations.
In 2016, KPMG recommended that management continue to work with and educate the
affected departments on tracking WIP additions more accurately and maintaining the
land inventory database on a timelier basis to minimize or eliminate future TCA
adjustments. This will be an ongoing process for Finance staff.
7.3

Audit Committee 2018/03/29 2
Background
The Audit Committee‘s Terms of Reference (Bylaw #0321-2010) establishes the role and
responsibilities of the Audit Committee. The assigned responsibilities of the Committee include
reviewing and making recommendations to Council regarding the external audit function,
internal audit function, financial reporting, internal controls, and compliance.
The Audit Committee is responsible for reviewing any reports and correspondence from the
External Auditor relating to the City and any local boards or agencies which may be created.
For fiscal year 2017, local boards and agencies include the Mississauga Public Library Board
and the four Business Improvement Area Associations.
Comments
KPMG have now completed the statutory audit for the fiscal year 2017 and have issued an Audit
Findings Report for information.
The 2017 External Audit Findings Report assists the Audit Committee in the review of the
consolidated financial statements and provides an overview and summary of the findings and an
assessment of the completed audit.
The report also provides information and comments regarding the following areas:
Significant audit, accounting and reporting matters
Any corrected or uncorrected audit items
Control deficiencies and business improvement observations
The Process Improvement Observations section provides auditor comments and
recommendations relating to the design or effectiveness of internal controls, and/or
enhancements to financial accounting and reporting.
2017 Process Improvement Recommendations
In 2017, there were no identified process improvement recommendations.
2016 Process Improvement Recommendations (Follow-up)
KPMG recommends that management continue to work with and educate the affected
departments on tracking WIP additions more accurately and maintaining the land inventory
database on a timelier basis to minimize or eliminate future TCA adjustments.
7.3

Audit Committee
2018/03/29 3
Management Response:
This will be an ongoing process with Finance staff due to the complexity for this area. Finance
staff continues to reinforce the requirements for tangible capital asset (TCA) inventorying,
accounting and reporting with all City staff through support and/or training. Finance, Geomatics,
Realty Services and Legal Services will continue to work collaboratively to ensure efficient and
timely reporting of land and other asset acquisitions, disposals, and adjustments.
KPMG confirmed their independence in the Audit Planning Report. As there is no change at
year end, they did not make a note related to independence in the Audit Findings Report. The
independence disclosure identifies any professional services provided by our external auditors,
KPMG, to the City during the year. It also identifies any relationships with the City that may
reasonably be thought to bear on auditor independence.
Financial Impact
There are no financial implications to the City from the Audit Findings Report.
Conclusion
The 2017 External Audit Findings Report is a by-product of the financial statement audit.
The 2017 External Audit Findings Report provides an overview of the 2017 audit process. The
report highlights any audit findings and/or audit observations and recommendations for the Audit
Committee’s review and consideration.
There were no audit concerns, process improvement recommendations or financial impacts as
a result of the audit.
Attachments Appendix 1: 2017 City Of Mississauga Audit Finding Report
Gary Kent, CPA, CGA, Commissioner of Corporate Services and Chief Financial Officer
Prepared by: Mark Beauparlant, Manager, Financial and Treasury Services
7.3

The Corporation of
The City of MississaugaAudit Findings Report For the year ended December 31, 2017
April 2018
kpmg.ca/audit
APPENDIX 1
7.3

City of Mississauga Audit Findings Report for the year ended December 31, 2017 2
Table of Contents Executive summary 3
Technology in the audit 4
Other matters 5
Adjustments and differences 7
Appendices 8
The contacts at KPMG in connection with this report are:
Kevin Travers Lead Audit Engagement Partner
Tel: 416-228-7994 [email protected]
Ana Chan Audit Senior Manager Tel: 416-224-4655 [email protected]
7.3

City of Mississauga Audit Findings Report for the year ended December 31, 2017 3
*This Audit Findings Report should not be used for any other purpose or by anyone other than the Audit Committee. KPMG shall have no responsibility or liability for loss ordamages or claims, if any, to or by any third party as this Audit Findings Report has not been prepared for, and is not intended for, and should not be used by, any thirdparty or for any other purpose.
Executive summary Purpose of this report* The purpose of this Audit Findings Report is to assist you, as a member of the Audit Committee, in your review of the results of our audit of the consolidated financial statements (the “financial statements”) of the City of Mississauga (the “City”) as at and for the year ended December 31, 2017.
This Audit Findings Report builds on the Audit Plan we presented to the Audit Committee on December 4, 2017.
Changes from the Audit Plan There have been no significant changes regarding our audit from the Audit Planning Report previously presented to you.
Adjustments and differences We did not identify any adjustments that were communicated to management and subsequently corrected in the financial statements.
Finalizing the audit As of date of this report, we have completed the audit of the financial statements and received evidence of approval of the financial statements from the City’s Treasurer (individual delegated authority to approve the financial statements).
Our audit report is dated the date of approval of the financial statements by the Treasurer, April 23, 2018.
Control and other observations We did not identify any control deficiencies that we determined to be significant deficiencies in ICFR.
Critical accounting estimates Overall, we are satisfied with the reasonability of critical accounting estimates.
The critical areas of estimates relate to the carrying value of tangible capital assets, provisions for accrued liabilities, obligations related to employee future benefits, self-insurance liability and provisions for liabilities arising from legal claims.
Other matters We have highlighted other significant matters that we would like to bring to your attention.
See pages 5 and 6.
.
7.3

City of Mississauga Audit Findings Report for the year ended December 31, 2017 4
Technology in the audit
As previously communicated in our Audit Planning Report, we have utilized Data & Analytics (D&A) and other technologies in order to enhance the quality and effectiveness of the audit.
We have summarized the areas of focus as follows:
Areas of focus D&A tools and routines Our results and insights Journal entry testing
• KPMG application software to evaluate the completeness of the journal entry population through a roll-forward of all accounts.
• Using technology in the audit to analyze journal entries and apply certain criteria to identify potential high-risk journal entries for further testing.
• KPMG noted no issues with respect to the completeness of the journal entry population.
• KPMG was satisfied with the results of our testing of specific relevant journal entries, which were identified for testing using the computer assisted auditing techniques.
• We shared the findings with management to enable to identify certain trends and efficiencies in their accounting processes with regards to manual journal entries.
Development charges – Unspent DCA
• Utilized D&A to evaluate the year-over-year change on all capital projects for which developer charges (“DC”) have been applied as funding. In particular, we analyzed projects whereby: - The total DC recognized into revenue
exceeded total project costs incurred; - Change in unspent DC for fiscal year
2016 and 2017 exceeded total projects costs incurred.
- Total projects costs incurred in 2017 compared to prior year.
• Based on the data analytics performed, we did not identify any material discrepancies.
Sharefile • KPMG application to share information, audit schedules and reconciliations electronically with City staff in a secured environment.
• The aligns with the City’s goals to reduce carbon footprint.
7.3
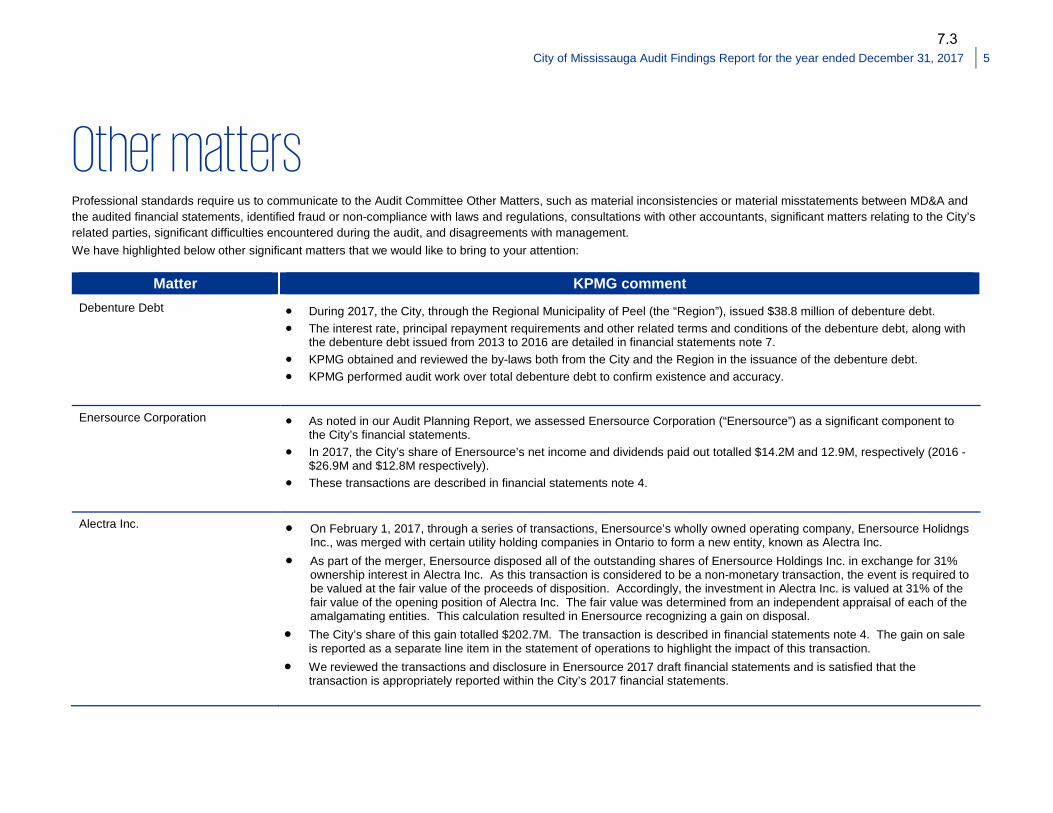
City of Mississauga Audit Findings Report for the year ended December 31, 2017 5
Other matters Professional standards require us to communicate to the Audit Committee Other Matters, such as material inconsistencies or material misstatements between MD&A and the audited financial statements, identified fraud or non-compliance with laws and regulations, consultations with other accountants, significant matters relating to the City’s related parties, significant difficulties encountered during the audit, and disagreements with management. We have highlighted below other significant matters that we would like to bring to your attention:
Matter KPMG comment Debenture Debt • During 2017, the City, through the Regional Municipality of Peel (the “Region”), issued $38.8 million of debenture debt.
• The interest rate, principal repayment requirements and other related terms and conditions of the debenture debt, along withthe debenture debt issued from 2013 to 2016 are detailed in financial statements note 7.
• KPMG obtained and reviewed the by-laws both from the City and the Region in the issuance of the debenture debt.• KPMG performed audit work over total debenture debt to confirm existence and accuracy.
Enersource Corporation • As noted in our Audit Planning Report, we assessed Enersource Corporation (“Enersource”) as a significant component tothe City’s financial statements.
• In 2017, the City’s share of Enersource’s net income and dividends paid out totalled $14.2M and 12.9M, respectively (2016 -$26.9M and $12.8M respectively).
• These transactions are described in financial statements note 4.
Alectra Inc. • On February 1, 2017, through a series of transactions, Enersource’s wholly owned operating company, Enersource HolidngsInc., was merged with certain utility holding companies in Ontario to form a new entity, known as Alectra Inc.
• As part of the merger, Enersource disposed all of the outstanding shares of Enersource Holdings Inc. in exchange for 31%ownership interest in Alectra Inc. As this transaction is considered to be a non-monetary transaction, the event is required tobe valued at the fair value of the proceeds of disposition. Accordingly, the investment in Alectra Inc. is valued at 31% of thefair value of the opening position of Alectra Inc. The fair value was determined from an independent appraisal of each of theamalgamating entities. This calculation resulted in Enersource recognizing a gain on disposal.
• The City’s share of this gain totalled $202.7M. The transaction is described in financial statements note 4. The gain on saleis reported as a separate line item in the statement of operations to highlight the impact of this transaction.
• We reviewed the transactions and disclosure in Enersource 2017 draft financial statements and is satisfied that thetransaction is appropriately reported within the City’s 2017 financial statements.
7.3

City of Mississauga Audit Findings Report for the year ended December 31, 2017 6
Matter KPMG comment Contingent Liabilities • The Chartered Professional Accountants Handbook PS3300 Contingent Liabilities requires that the City recognize a liability
when “it is likely that a future event will confirm that a liability has been incurred at the date of the financial statements; and the amount can be reasonably estimated.”
• At any point in time, the City is subject to a number of matters which could potentially result in the determination of a contingent liability as defined above, including, but not limited to matters such as collectibiltiy of certain accounts receivable, legal claims, contract settlement accruals etc.
• KPMG has reviewed the City’s assessments of contingent liabilities and the process employed to develop and record the related estimated liabilities. Where applicable, KPMG discussed with the individuals responsible for the process and is satisfied that the methodology used is rational, consistent with the approach taken in prior years and has been appropriately reviewed.
• As these items are resolved, it is possible that the final amounts recorded for these liabilities may change, however the amounts currently recorded represent management’s best estimates of exposure given the information presently available.
7.3

City of Mississauga Audit Findings Report for the year ended December 31, 2017 7
Adjustments and differences
Adjustments and differences identified during the audit have been categorized as “Corrected adjustments” or “Uncorrected differences”. These include disclosure adjustments and differences. Professional standards require that we request of management and the audit committee that all identified differences be corrected. We have already made this request of management.
Corrected adjustments We did not identify any adjustments that were communicated to management and subsequently corrected in the financial statements.
Uncorrected differences We did not identify differences that remain uncorrected
7.3

City of Mississauga Audit Findings Report for the year ended December 31, 2017 8
Appendices Appendix 1: Required communications
Appendix 2: Audit Quality and Risk Management
Appendix 3: Background and professional standards
Appendix 4: Audit trends
Appendix 5: Management representation letter
7.3

City of Mississauga Audit Findings Report for the year ended December 31, 2017 9
Appendix 1: Required communications In accordance with professional standards, there are a number of communications that are required during the course of and upon completion of our audit. These include: – Auditors’ report – the conclusion of our audit is set out in our auditors’
report. – Management representation letter – In accordance with professional
standards, copies of the management representation letter are provided to the Audit Committee.
7.3

City of Mississauga Audit Findings Report for the year ended December 31, 2017 10
Appendix 2: Audit Quality and Risk Management KPMG maintains a system of quality control designed to reflect our drive and determination to deliver independent, unbiased advice and opinions, and also meet the requirements of Canadian professional standards. Quality control is fundamental to our business and is the responsibility of every partner and employee. The following diagram summarises the six key elements of our quality control systems. Visit our Audit Quality Resources page for more information including access to our audit quality report, Audit quality: Our hands-on process.
Independence, integrity, ethics and objectivity
Personnel management
Acceptance & continuance of
clients / engagements
Engagement performance
standards
Independent monitoring
Other risk management
quality controls
– Other controls include:
– Before the firm issues its audit report, the Engagement Quality Control Reviewer reviews the appropriateness of key elements of publicly listed client audits.
– Technical department and specialist resources provide real-time support to audit teams in the field.
– We conduct regular reviews of engagements and partners. Review teams are independent and the work of every audit partner is reviewed at least once every three years.
– We have policies and guidance to ensure that work performed by engagement personnel meets applicable professional standards, regulatory requirements and the firm’s standards of quality.
– All KPMG partners and staff are required to act with integrity and objectivity and comply with applicable laws, regulations and professional standards at all times.
– We do not offer services that would impair our independence.
– The processes we employ to help retain and develop people include:
– Assignment based on skills and experience;
– Rotation of partners; – Performance evaluation; – Development and training; and – Appropriate supervision and
coaching.
– We have policies and procedures for deciding whether to accept or continue a client relationship or to perform a specific engagement for that client.
– Existing audit relationships are reviewed annually and evaluated to identify instances where we should discontinue our professional association with the client.
7.3

City of Mississauga Audit Findings Report for the year ended December 31, 2017 11
Appendix 3: Background and professional standards Internal control over financial reporting As your auditors, we are required to obtain an understanding of internal control over financial reporting (ICFR) relevant to the preparation and fair presentation of the financial statements in order to design audit procedures that are appropriate in the circumstances for the purpose of expressing an opinion on the financial statements, but not for the purpose of expressing an opinion on internal control. Accordingly, we do not express an opinion on the effectiveness of internal control.
Our understanding of ICFR was for the limited purpose described above and was not designed to identify all control deficiencies that might be significant deficiencies and therefore, there can be no assurance that all significant deficiencies and other control deficiencies have been identified. Our awareness of control deficiencies varies with each audit and is influenced by the nature, timing, and extent of audit procedures performed, as well as other factors.
The control deficiencies communicated to you are limited to those control deficiencies that we identified during the audit.
Documents containing or referring to the audited financial statements We are required by our professional standards to read only documents containing or referring to audited financial statements and our related auditors’ report that are available through to the date of our auditors’ report. The objective of reading these documents through to the date of our auditors’ report is to identify material inconsistencies, if any, between the audited financial statements and the other information. We also have certain responsibilities, if on reading the other information for the purpose of identifying material inconsistencies, we become aware of an apparent material misstatement of fact.
We are also required by our professional standards when the financial statements are translated into another language to consider whether each version, available through to the date of our auditors’ report, contains the same information and carries the same meaning.
7.3

City of Mississuaga Audit Findings Report for the year ended December 31, 2017 | 12
Appendix 4: Audit trends KPMG understands the wide range of challenges and evolving trends that you face as an audit committee of the City. We also understand that sometimes keeping up with critical issues as they emerge can be difficult.
As your auditors, it is incumbent upon us to provide you with any information that will help you further strengthen corporate governance, enhance your oversight and add greater value within your organization.
As such, KPMG's Audit Committee Institute (ACI) provides information, resources and opportunities for you to share knowledge with your peers. First, you are welcome to attend our Audit Committee Roundtable sessions, which are held in major cities across the country. In addition, you will also benefit from our monthly article series (Audit Point of View) and quarterly videos (FrontPage Video Series) that focus on the most pressing audit committee agenda items.
More information on all of these can easily be found at www.kpmg.ca/audit.
Our discussions with you, our audit opinion and what KPMG is seeing in the marketplace—both from an audit and industry perspective—indicate the following is specific information that will be of particular interest to the City. We would, of course, be happy to further discuss this information with you at your convenience.
Thought Leadership Overview
Benchmarking City Services This city benchmarking report examines the performance of city services around the world to uncover insights and help create real value. https://home.kpmg.com/xx/en/home/insights/2017/09/finding-the-courage-to-improve-benchmarking-city-services.html
7.3
City of Mississuaga Audit Findings Report for the year ended December 31, 2017 | 13
Appendix 5: Management representation letter
7.3

7.3

7.3

7.3

7.3
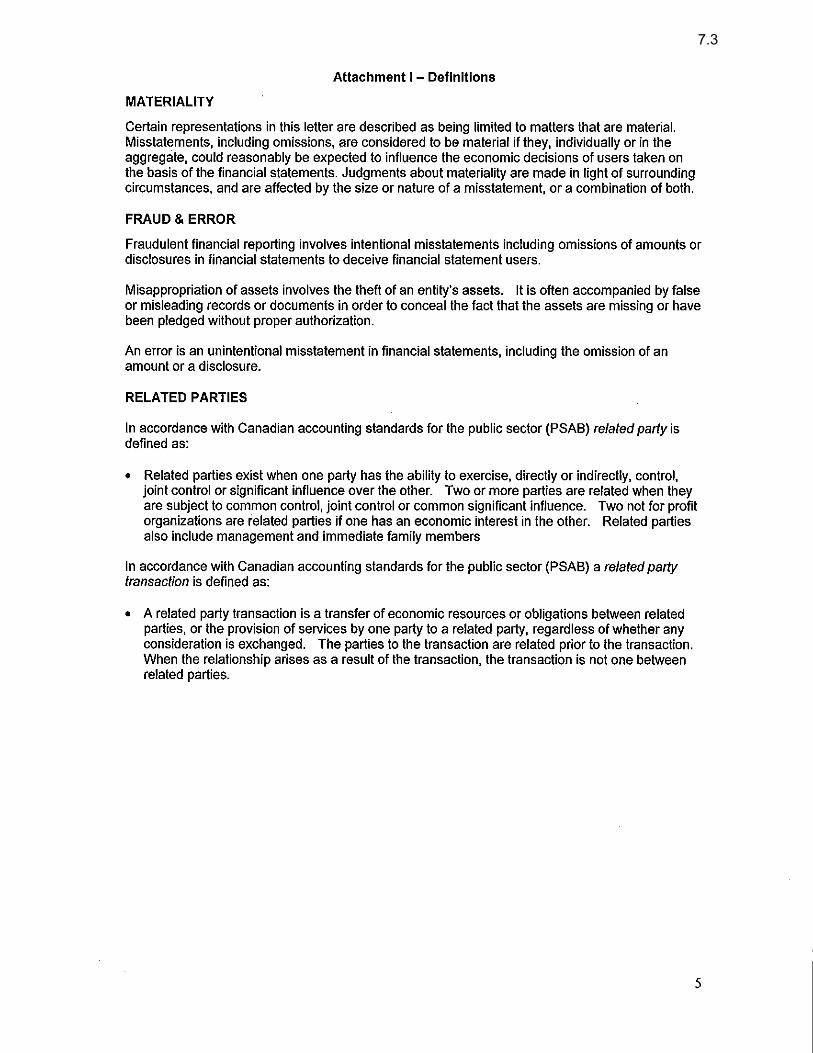
7.3

City of Mississuaga Audit Findings Report for the year ended December 31, 2017 | 14
KPMG LLP, an Audit, Tax and Advisory firm (kpmg.ca) and a Canadian limited liability partnership established under the laws of Ontario, is the Canadian member firm of KPMG International Cooperative (“KPMG International”).
KPMG member firms around the world have 174,000 professionals, in 155 countries.
The independent member firms of the KPMG network are affiliated with KPMG International, a Swiss entity. Each KPMG firm is a legally distinct and separate entity, and describes itself as such.
© 2017 KPMG LLP, a Canadian limited liability partnership and a member firm of the KPMG network of independent member firms affiliated with KPMG International Cooperative (“KPMG International”), a Swiss entity. All rights reserved.
kpmg.ca/audit
7.3
Date: 2018/04/23
To: Chair and Members of Audit Committee
From: Al Steinbach, CPA, CMA, CRMA Director, Internal Audit
Originator’s files:
Meeting date: 2018/05/07
Subject Final Audit Reports:
1. Corporate Services Department, Finance Division, Investments Section – 2017
Investment Audit; and,
2. Corporate Services Department, Facilities and Property Management Division –
Capital Projects Contracts Audit.
Recommendation That the report dated April 23, 2018 from the Director of Internal Audit with respect to final audit
reports:
1. Corporate Services Department, Finance Division, Investments Section – 2017
Investment Audit, and,
2. Corporate Services Department, Facilities and Property Management Division – Capital
Projects Contracts Audit
be received for information.
Background
In accordance with the Terms of Reference for the Audit Committee (By-law 0069-2015), the
Committee is responsible for “reviewing reports from the Director of Internal Audit identifying
audit issues and the steps to resolve them [and] reviewing the adequacy of the management
responses to audit concerns, having regard to the risks and the costs involved.”
Comments Internal Audit has completed finalization of two audits, being:
1. Corporate Services Department, Finance Division, Investments Section – 2017
Investment Audit, and,
2. Corporate Services Department, Facilities and Property Management Division – Capital
Projects Contracts Audit.
7.4

Audit Committee 2018/04/23 2
Originators f iles:
The report for the Capital Projects Contracts Audit is separately bound and is hereby submitted
to the Audit Committee for consideration.
Internal Audit has also completed the 2017 Investment Audit. The audit was conducted in
accordance with the International Standards for the Professional Practice of Internal Auditing.
Investment audits are performed annually and transactions are tested over the course of the
year. The 2017 Investment Audit covered activities from January 1 to December 31, 2017. The
objectives of the audit were:
A. Investments are in compliance with legislation, Council By-laws and Corporate Policy
and Procedures 04-06-02;
B. Return on investment is reasonable, having regard to constraints imposed by legislation,
Council By-laws and City policy;
C. There are proper controls over the investment process;
D. Investment commitments do not interfere with the required cash flow and that sufficient
working funds are maintained;
E. Audit recommendations from the previous investment audit report, if any, were
implemented or the issues identified were resolved.
Based on the audit work performed, we found that the objectives stated above were met and
there were no concerns or recommendations resulting from the 2017 Investment Audit.
Financial Impact Not applicable.
Conclusion The final reports for Corporate Services Department, Finance Division, Investments Section –
2017 Investment Audit, and Corporate Services Department, Facilities and Property
Management Division – Capital Projects Contracts Audit are now complete and are submitted
for consideration by the Audit Committee.
Attachments Appendix 1: Corporate Services Department, Facilities and Property Management Division –
Capital Projects Contracts Audit
7.4
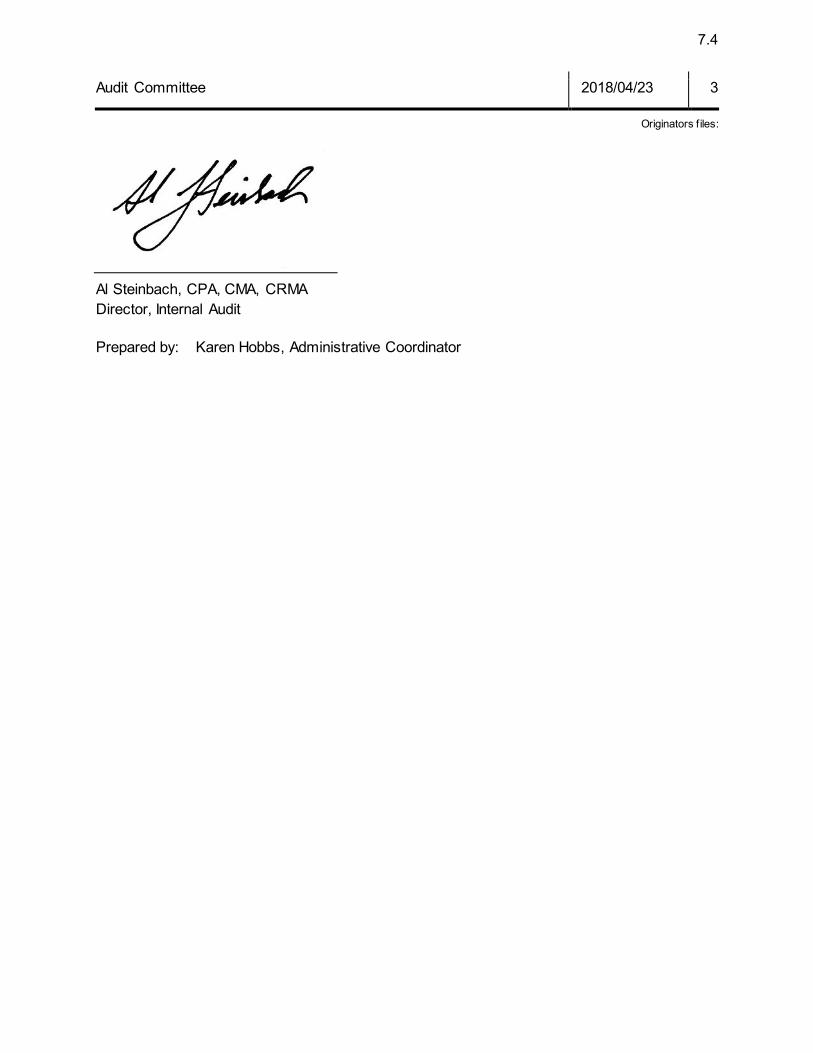
Audit Committee 2018/04/23 3
Originators f iles:
Al Steinbach, CPA, CMA, CRMA
Director, Internal Audit
Prepared by: Karen Hobbs, Administrative Coordinator
7.4

Date: 2018/04/23
To: Chair and Members of Audit Committee
From: Al Steinbach, CPA, CMA, CRMA Director, Internal Audit
Originator’s files:
Meeting date: 2018/05/07
Subject Status of Recommendations from the External Quality Assurance Review of the Internal
Audit Function
Recommendation That the report dated April 23, 2018 from the Director, Internal Audit with respect to the Status
of Recommendations from the External Quality Assurance Review of the Internal Audit Function
be received for information.
Report Highlights The Standards for the Professional Practice of Internal Auditing of the Institute of Internal
Auditors (IIA) requires the internal audit activity to “develop and maintain a quality
assurance and improvement program” which “includes periodic internal and external
quality assessments and ongoing internal monitoring.”
In October 2017, Internal Audit completed a self-assessment and found that the internal
audit activities of the City “generally conform” to the Standards, Code of Ethics and the
City’s Internal Audit Charter (By-law 0065-2013).
BDO Canada LLP, a qualified independent reviewer, was subsequently engaged to
conduct an external quality assessment to validate the results of Internal Audit’s
assessment.
The independent validation confirmed Internal Audit’s self-assessment results and found
that the City’s Internal Audit function is “positioned to assist management in evaluating the
risks and challenges of the City’s operations.”
Background The International Standards for the Professional Practice of Internal Auditing of the Institute of
Internal Auditors (IIA) requires the development and maintenance of a quality assurance and
improvement program which includes periodic internal and external quality assessments. An
7.5

Audit Committee 2018/04/23 2
Originators f iles:
external assessment was completed in January 2018 by BDO Canada LLP and confirmed that
the Internal Audit Division of the City operates in accordance with the IIA’s Professional
Standards and Code of Ethics, as well as the City’s Internal Audit Charter. Results of the
assessment were presented at the March 5, 2018 Audit Committee meeting.
As part of the report of the External Quality Assessment Review, the consultant presented 17
recommendations to Internal Audit for consideration to enhance the audit process.
Comments Appendix 1 details the Recommendations, Rating and Status of Implementation. In summary,
13 of the 17 recommendations have been completed, and of the four (4) remaining, one (1) will
be completed by May 31, 2018 and the remaining three (3) prior to September 30, 2018.
Financial Impact None.
Conclusion Implementation of the recommendations offered by the independent consultant as part of the
External Quality Assessment Review of the Internal Audit Division is progressing. Thirteen of
the recommendations have been implemented and progress continues for the remaining four.
All recommendations will be addressed by September 30, 2018.
Attachments Appendix 1: Status of Recommendations from External Quality Assessment Review
Al Steinbach, CPA, CMA, CRMA
Director, Internal Audit
Prepared by: Amy Truong, Senior Internal Auditor
7.5
Appendix 1 Status of Recommendations from the 2017 External Quality Assurance Review
Current State of the IAD Observation and Recommendation
Rating1 Internal Audit Comment/Status Due Date
1 In 2017, the Internal Audit Division identified the need to solicit feedback from auditees to gain a deeper understanding of the quality of services provided. A client feedback survey has been developed and implemented in early 2018.
To achieve leading practices in performance, it is recommended that Internal Audit seek formal feedback from their auditees in the form of surveys post audit completion.
Moderate Internal Audit is now soliciting feedback from auditees regarding the services provided. In addition, an annual survey will be conducted with both the Audit Committee and Leadership Team to obtain their valued opinion of the quality of services provided by IA.
Completed
2 Internal Audit has established informal KPI’s for the Division and is transitioning to formal KPI’s.
KPI’s (Key Performance Indicators) for Internal Audit are not formally defined. It is recommended that formal KPI’s be developed and defined for monitoring effectiveness.
Moderate Internal Audit has volunteered to participate in the performance measures pilot program initiated by the City’s Corporate Performance & Innovation Team. This will provide the foundation to develop formal KPI’s within our division.
May 31, 2018
3 There is an established expectation that key steps are undertaken during audits including documentation as part of the audit working papers.
Each auditor should summarize the work program and test steps for every audit.
Moderate This expectation has been reinforced with all auditors and during review of working papers; review notes will reflect areas where additional reinforcement is required.
Completed
4 The Internal Audit procedures manual is comprehensive but our self-assessment identified the need for formalizing documentation regarding requirements for consulting engagements.
Internal Audit should document detailed requirements, criteria, objectives and status tracking for consulting engagements to ensure these assignments follow a prescribed set of procedures and adhere to defined standards as required for assurance engagements.
Moderate We agree and will update the Internal Audit Manual to reflect the requirements for consulting engagements.
September 30, 2018
5 Internal Audit as a matter of business practice tracks all outstanding recommendations and formally reports on the status semi-annually. The reporting and sign-off process has recently been streamlined.
Develop a master listing of all recommendations from each audit engagement to track and monitor the status of management’s implementation plan.
Low The current outstanding recommendations follow-up and reporting process meets the requirements for this recommendation.
Completed
6 Internal Audit staff turnover has been very low. Established corporate termination and recruitment processes are followed when turnover occurs.
That the Internal Audit Procedures Manual includes procedures for transition when staff turn over.
Low We will continue to adhere to the standard protocols established by Corporate Human Resources related to terminations and recruitment. Going forward, more audits will be conducted by more than one auditor in order to ensure continuity of assignments.
Completed
7 The control environment is assessed within each audit against the risks
Control maturity is not assessed within each process/cycle. It is
Low The internal audit work plan does not operate cyclically (i.e. audits are not performed on a
Completed
7.5

Appendix 1 Status of Recommendations from the 2017 External Quality Assurance Review
Current State of the IAD Observation and Recommendation
Rating1 Internal Audit Comment/Status Due Date
associated with the absence or ineffectiveness of controls.
recommended that a control maturity assessment be completed to evaluate the control environment for each cycle.
rotational schedule) since audit assignments are determined based on a risks assessment. An effective control maturity model requires a periodic comparison to evaluate progression within a process.
We determined that our current process of examining control risks and its effectiveness is more valuable to the corporation than assessment of the control’s maturity.
8 Although rare, we are aware of the appropriate protocol to follow if there are errors and omissions.
Internal Audit Procedures Manual does not address how to handle errors and omissions. It is recommended to have a standardized procedure documented to ensure that these situations are handled timely.
Low Errors and omissions would follow the protocol prescribed by the Clerk’s office. The Director, Internal Audit is charged with the responsibility to amend any material errors or omissions.
Completed
9 Internal Audit does not employ an overall rating system for each audit. Ratings are applied to individual recommendations and categorized as: a) Operational Control and Financial Reporting, b) Compliance with and Clarification of Corporate Requirements, c) Safeguarding of Assets and Information, and, d) Efficiency/Effectiveness.
An overall reporting rating system does not exist. It is recommended that a reporting rating system be implemented to communicate new audit findings and to assist in prioritizing their implementation.
Low Internal Audit has considered an overall report rating system in the past but has determined that the subjectivity in the rating scales may cause management to concentrate on the rating rather than the observations and recommendations made. Internal Audit will continue with the current rating system.
Completed
10 All auditors are required to conclude on each objective of their audit as to whether the audit objectives and accompanying audit criteria were met.
There is a lack of consistency in addressing objectives in each audit. An improvement to consider is to increase the consistency across working papers and to conclude on each objective of the audit.
Low This recommendation is already an audit requirement and we believe this is a training opportunity. We will address the observation as part of the individual audit working paper review.
Completed
11 Internal Audit considers risks in setting the Annual Audit Work Plan relying on the Corporate Risk Assessment, interviews with senior management and gauging previous audits and reviews.
To achieve leading practices, it is recommended that Internal Audit attempt to reintroduce the Enterprise Risk Management (ERM) program to link audit findings back to the CRA assessment risks.
Moderate As Internal Audit resources are limited, we will communicate with the Project Management Support Office to gauge the corporate appetite for the reintroduction of the ERM program.
Completed
7.5

Appendix 1 Status of Recommendations from the 2017 External Quality Assurance Review
Current State of the IAD Observation and Recommendation
Rating1 Internal Audit Comment/Status Due Date
12 Training programs are currently based on individual staff and audit program needs. Internal Audit does strive to offer training elements such as workshops, conferences and webinars that benefit individual and group staff needs.
It is recommended that a formal training process be developed to ensure staff have appropriate knowledge to carry out their audits and provide consistent quality in services.
Low Internal Audit offers an effective training program for all Internal Audit staff that considers budgetary and resource allocation constraints.
Completed
13 Career paths are based on individual goals.
To enhance the career progression for Internal Audit staff and reach leading practice, career plans can be structured and include a career path for staff to have careers within Internal Audit or that lead to opportunities elsewhere within the organization (including placements in departments or help with process implementations).
Low Careers plans are discussed and documented for individual staff members as part of the Performance Management Program (PMP) and staff development process.
Completed
14 Through a visioning exercise we have identified a shared vision and developed action items to achieve IAD’s objectives.
While employees are appraised against personal objectives, performance and achievement of Internal Audit’s work plan, defining KPI’s will foster a clearer alignment of staff and departmental objectives to achieve leading practices in this area.
Low We intend to identify and implement a more robust and formally defined set of KPI’s for our Division.
September 30, 2018
15 Certain components of the Field Work of the Audit (Section IV Internal Audit Manual) are documented and included in the working papers.
To ensure consistency across all audits, providing examples of documentation that meets the desired quality can ensure that all audits are completely and accurately documented. In addition, the system of auditors shadowing experienced auditors will assist in enhancing the quality of working papers.
Moderate Agreed. The Director, Internal Audit will ensure consistency and quality of working papers through ongoing file review.
Completed
16 The outstanding recommendations log is utilized to track active issues and recommendations.
Creation of an active log of issues and recommendations is not formalized.
Low We believe that we have an effective log of issues and recommendations as identified through the outstanding recommendations log and follow-up process. Through our Sharepoint site we will endeavour to track all issues and recommendations identified through the course of our audits and reviews.
Completed
7.5
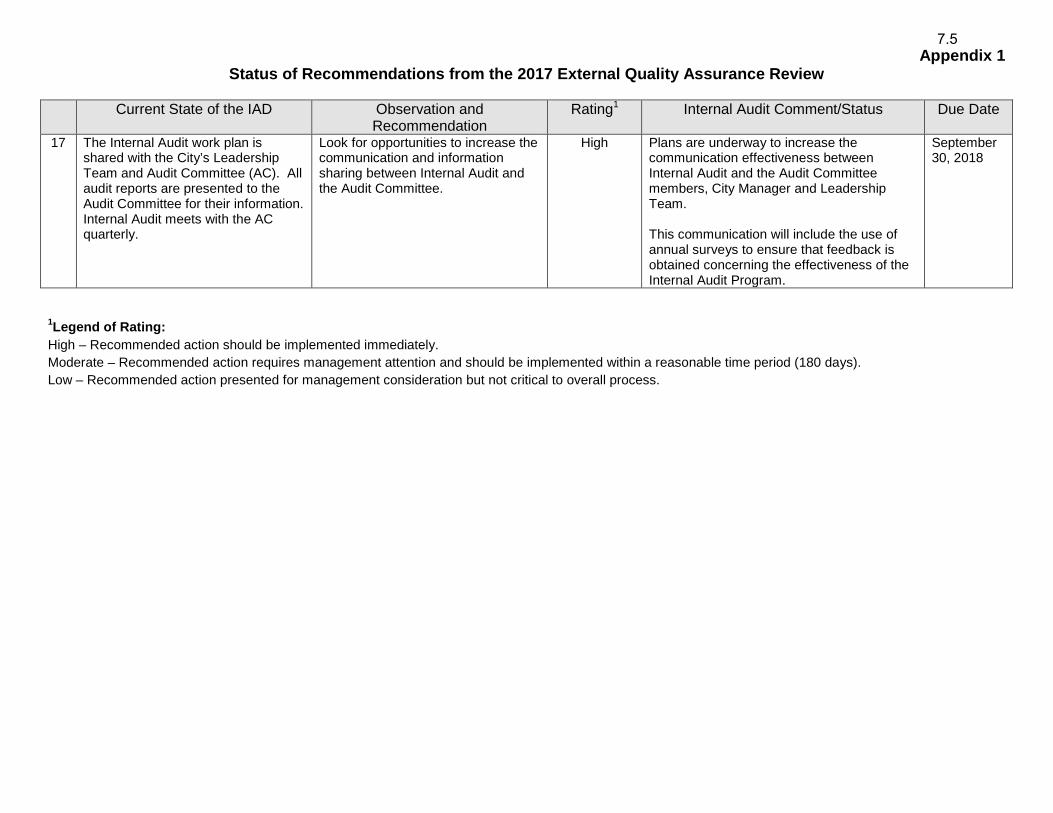
Appendix 1 Status of Recommendations from the 2017 External Quality Assurance Review
Current State of the IAD Observation and Recommendation
Rating1 Internal Audit Comment/Status Due Date
17 The Internal Audit work plan is shared with the City’s Leadership Team and Audit Committee (AC). All audit reports are presented to the Audit Committee for their information. Internal Audit meets with the AC quarterly.
Look for opportunities to increase the communication and information sharing between Internal Audit and the Audit Committee.
High Plans are underway to increase the communication effectiveness between Internal Audit and the Audit Committee members, City Manager and Leadership Team.
This communication will include the use of annual surveys to ensure that feedback is obtained concerning the effectiveness of the Internal Audit Program.
September 30, 2018
1Legend of Rating: High – Recommended action should be implemented immediately. Moderate – Recommended action requires management attention and should be implemented within a reasonable time period (180 days). Low – Recommended action presented for management consideration but not critical to overall process.
7.5

Date: 2018/04/18
To: Chair and Members of Audit Committee
From: Janice Baker, FCPA, FCA City Manager and Chief Administrative Officer
Originator’s files:
Meeting date: 2018/05/07
Subject Status of Outstanding Audit Recommendations as of March 31, 2018
Recommendation That the report dated April 18, 2018 from the City Manager & Chief Administrative Officer
regarding the status of outstanding audit recommendations as of March 31, 2018 be received
for information.
Background The terms of reference for the Audit Committee (By-law 0069-2015) requires the submission of
an annual report from the City Manager & Chief Administrative Officer indicating progress made
in addressing recommendations which were made by Internal Audit and by the City’s External
Auditor. At the November 2011 Audit Committee meeting, members requested that a bi-annual
progress update be submitted. The current report shows the status as of March 31, 2018.
Comments A summary of recommendations which were outstanding as of September 30, 2017 (the
effective date of the previous status report to the Audit Committee) and new recommendations
which were scheduled for completion from October 1, 2017 to March 31, 2018 is attached as
Appendix 1.
Twelve (12) of the twenty (20) recommendations which were previously outstanding as at
September 30, 2017 have since been completed and implementation of these
recommendations has been verified by Internal Audit. Detailed comments and status for the
eight (8) recommendations that are still outstanding are attached in Appendix 2. Of the eight (8)
recommendations, three (3) entail documentation of business processes. The remainder of the
outstanding recommendations, five (5), involve review and updating of business processes
which are in progress.
7.6

Audit Committee 2018/04/18 2
Originators f iles:
Forty-five (45) new recommendations that were due between October 1, 2017 and March 31,
2018 were added to the list. Sixteen (16) have been completed and implementation of these
recommendations has been verified by Internal Audit. The remaining twenty-nine (29)
recommendations are in various stages of implementation. In addition, one (1) recommendation
due after March 31, 2018 has been completed ahead of the scheduled due date.
Financial Impact None.
Conclusion In summary, sixty-five (65) recommendations were scheduled for implementation prior to March
31, 2018 (effective date of this report). Twelve (12) of the recommendations that were
outstanding from the previous status report of September 30, 2017 and sixteen (16) with due
dates between October 1, 2017 and March 31, 2018 were completed. An additional one (1)
recommendation with a due date after March 31, 2018 was completed ahead of schedule. Work
continues with implementation of the thirty-seven (37) recommendations that were outstanding
as at March 31, 2018 and will be closely monitored to ensure timely implementation.
Attachments Appendix 1: Status of Outstanding Audit Recommendations as at March 31, 2018
Appendix 2: Status of Audit Recommendations Outstanding as at October 1, 2017 and Still in
Progress as of March 31, 2018
Janice Baker, FCPA, FCA
City Manager and Chief Administrative Officer
Prepared by: Tara Zammit, Senior Internal Auditor
7.6

STATUS OF OUTSTANDING AUDIT RECOMMENDATIONSAS AT MARCH 31, 2018
Appendix 1
(1) (2) (3) (4) (5) (6) (7)Audit Date
Issued (MM/YY)
Outstanding September 30,
2017 *
New ** Implemented/ Resolved
In Progress March 31, 2018
Due After March 31, 2018 and completed ***
Mississauga Transit Union Payroll 08/14 2 0 1 1 0Animal Services E3 Review 12/14 1 0 1 0 0Business Continuity and Disaster Recovery Plan Review
02/15 2 0 2 0 0
F&PM Current Maintenance Contracts 10/15 2 0 0 2 0Rental and Lease Agreements 10/15 2 0 1 1 0Mississauga Sport Zone Cash Handling 01/16 1 0 0 1 0Corporate Fleet 04/16 1 0 1 0 0POA Revenue and Cash Handling 08/16 4 0 1 3 0Mississauga Spectator Arena Complex Management Agreement
09/16 1 0 1 0 0
Administrative Penalty System 11/16 3 0 3 0 0Meadowvale Theatre 11/16 0 2 0 2 0F&PM Capital Maintenance Contracts 02/17 0 2 0 2 0MFES Building and Fleet Maintenance 04/17 0 7 1 6 0CLASS Facilities Rental 08/17 0 7 2 5 0Works Operations Payroll 08/17 1 5 3 3 0MiWay Transit Maintenance Audit 11/17 0 12 3 9 0Food Services Audit 11/17 0 10 8 2 1TOTAL 20 45 28 37 1* This column includes recommendations which were originally scheduled for implementation on or prior to September 30, 2017 (effective date of theprevious status report to Audit Committee).
** This column includes recommendations which were originally scheduled for implementation between October 1, 2017 and March 31, 2018 (effective date of the current status report to Audit Committee).*** This column indicates recommendations which were originally scheduled to be implemented after March 31, 2018 but have already been completed.
7.6

Appendix 2 STATUS OF AUDIT RECOMMENDATIONS
OUTSTANDING AS OF SEPTEMBER 30, 2017 AND STILL IN PROGRESS AS OF MARCH 31, 2018
Page 1 of 1
Audit No. of Recommendations
Comments/Status
Business Process Documentation 2016 POA Revenue and Cash Handling Audit
3 Completion of the recommendations has been delayed. The manager in the business area is new and is working on the recommendations. These recommendations are expected to be completed by December 31, 2018.
Review and Update of Business Processes 2014 Mississauga Transit Payroll 1 The HR and Operations manual is complete. The new Maintenance Manager is
currently reviewing the current processes; once the review is completed a Maintenance procedure manual will be completed. Expected to be completed by November 30, 2018.
2015 F&PM Current Maintenance Contracts
2 Business area is reviewing the option to set up contracts and labour rates in the Enterprise Infor system. Additionally, for managing work schedules and work completed electronically, IT is working on a solution which has a revised completion date of June 2018.
2015 Rental and Lease Agreements
1 Working with an Agreement Abstract to clearly define roles and responsibilities regarding the agreements. Realty is working on identifying stakeholders and informing them with the requirement to collect. Approximately 60% of this process has been completed. Expected to be completed by end of 2018.
2016 Mississauga Sport Zone Cash Handling
1 The initial stage of the policy is in development. Handling of electronic devices is outstanding and team is working to resolve. Expected to be completed by end of 2018.
Total 8
7.6