Medium-Term Debt Management Strategy
29
ROYAL GOVERNMENT OF BHUTAN Medium-Term Debt Management Strategy (FY2020/21 to FY2022/23) Department of Macroeconomic Affairs Ministry of Finance 30 March 2021
Transcript of Medium-Term Debt Management Strategy

ROYAL GOVERNMENT OF BHUTAN
Medium-Term Debt Management Strategy
(FY2020/21 to FY2022/23)
Department of Macroeconomic Affairs
Ministry of Finance
30 March 2021
Foreword

Table of Contents
1 Introduction .................................................................................................................................. 1
2 Debt management objective and the scope of the MTDS ......................................................... 2
2.1 Debt management objective .................................................................................................... 2
2.2 Scope of this MTDS ................................................................................................................ 2
2.3 Legal and policy framework for the MTDS ............................................................................ 2
3 Analysis of existing debt portfolio ............................................................................................... 3
3.1 Summary of total PPG debt ..................................................................................................... 3
3.2 External debt by hydro and non-hydro .................................................................................... 3
3.3 External debt by currency composition ................................................................................... 4
3.4 External debt by creditors ....................................................................................................... 5
3.5 Repayment profile of existing debt ......................................................................................... 5
3.6 Cost and risk of existing debt .................................................................................................. 6
4 Evaluation of the last MTDS and other developments ............................................................. 7
5 Medium-term macroeconomic outlook ...................................................................................... 9
5.1 GDP growth............................................................................................................................. 9
5.2 Current account balance .......................................................................................................... 9
5.3 Primary balance ..................................................................................................................... 10
5.4 Medium-term macro-fiscal risks ........................................................................................... 11
6 Potential Funding Sources ......................................................................................................... 12
6.1 External sources .................................................................................................................... 12
6.2 Domestic sources................................................................................................................... 13
7 Modelling MTDS ........................................................................................................................ 15
7.1 Key assumptions ................................................................................................................... 15
7.2 Description of alternative financing strategies ...................................................................... 15
7.3 Description stress tests .......................................................................................................... 18
7.4 The outcome of the strategy simulation ................................................................................ 18
7.5 Preferred strategy and the rationale ....................................................................................... 20
7.6 MTDS in summary ................................................................................................................ 20
8 Planned activities for the development of a domestic debt market ....................................... 21
9 Revision of the MTDS ................................................................................................................ 22
10 Conclusion ................................................................................................................................... 22
11 Glossary ....................................................................................................................................... 23

Table 1. Summary of PPG Debt Hydro ................................................................................................. 3
Table 2. External Debt by Hydro Debt and Non-hydro Debt ................................................................ 3
Table 3. Cost and Risk Indicator of existing Public Debt ...................................................................... 6
Table 4. Potential Financing Sources ................................................................................................... 12
Table 5. Key macro-fiscal assumptions in this MTDS ........................................................................ 15
Table 6. Exchange Rate assumptions................................................................................................... 15
Table 7. Strategy 1(Baseline) ............................................................................................................... 16
Table 8. Strategy 2: External concessional borrowings to meet 80% of GFN .................................... 16
Table 9. Strategy 3: External concessional borrowings and domestic borrowing each to meet 50% of
the GFN ................................................................................................................................................ 17
Table 10. Strategy 4: External concessional borrowings to meet 10% of the GFN ............................ 17
Table 11. The Cost and Risk Indicators of the four strategies ............................................................. 19
Figure 1. External Debt by currency composition ................................................................................. 4
Figure 2. External Debt by Creditor ...................................................................................................... 5
Figure 3. Repayment Profile of existing Debt ....................................................................................... 5
Figure 4. GDP growth outlook .............................................................................................................. 9
Figure 5. Current Account Balance outlook .......................................................................................... 9
Figure 6. Primary Balance Outlook (percent of GDP) ........................................................................ 10
Figure 7. Simulation Outcome: External Debt to GDP ....................................................................... 18
Figure 8. Simulation Outcome: PV of Debt to GDP ........................................................................... 18
Figure 9. Simulation Outcome: Debt Service to GDP ......................................................................... 18
Figure 10. Simulation Outcome: External Debt Service to International Reserves ............................ 18

List of abbreviations and acronyms
ADB Asian Development Bank
ATM Average Time to Maturity
ATR Average Time to Refixing
BoBL Bank of Bhutan Limited
CC Convertible Currency
DMD Debt Management Division
DMEA Department of Macroeconomic Affairs
DPA Department of Public Accounts
FYP Five-year Plan
GDP Gross Domestic Product
GFN Gross Financing Need
GoI Government of India
IDA International Development Association
IFAD International Fund for Agriculture Development
INR Indian Rupee
JICA Japan International Cooperation Agency
LDC Least Developed Countries
MEF Macroeconomic Framework
MoF Ministry of Finance
MTDS Medium-term Debt Management Strategy
NPPF National Pension and Provident Fund
Nu. Ngultrum
PHP-I Punatshangchu Hydroelectric Project-I
PPG Public and Publicly Guaranteed
PV Present Value
RGoB Royal Government of Bhutan
RMA
SCF
Royal Monetary Authority
Standby Credit Facility
T-Bills Treasury Bills

1
1 Introduction
The Public Debt Policy 2016 requires the government to formulate a Medium-Term Debt
Management Strategy (MTDS) that lays out “the roadmap to achieve the objectives of public
debt management set out in the debt policy”. The objectives of public debt management set out
in the policy are as follows:
1) Meeting the public sector’s financing needs and timely servicing of debt, at the lowest
possible cost at a prudent degree of risks in the medium to long run.
2) Supporting the development of an efficient domestic capital market in the long run.
Thus, this MTDS outlines financing strategies to achieve the debt management objectives
articulated in the Public Debt Policy 2016. Though, it would be challenging to fully achieve
both the objectives in the medium term, the government will strive towards achieving them by
instituting appropriate fiscal and monetary measures.
During MTDS period (FY 2020/21 to FY 2022/23), to help achieve the two debt management
objectives, government will maximize the external concessional borrowing to meet the gross
financing need (GFN), while also meeting some portion of GFN from the domestic market
through issuance of T-Bills and bonds1.
The larger proportion of external concessional borrowings will reduce the government’s
financing cost because of lower interest rate for the concessional loans. On the other hand, the
financing from domestic sources through issuance of T-Bills and bonds would activate the
primary and secondary debt markets, thus contributing towards developing an efficient capital
market in the country.
This MTDS also presents a brief analysis of existing debt portfolio, and updates on
developments in debt management area after the last MTDS (FY 2013/14 to FY 2017/18) was
adopted. The potential funding sources— with their benefits and risks— have also been
identified. After that, a summary of country’s medium-term macroeconomic outlook is
provided, which is followed by modelling of financing strategies to be pursued during this
MTDS period.
Finally, based on the analysis, the optimal financing strategy—the one that lowers the financing
cost and has the potential to contribute towards developing domestic capital market— has been
selected that the government will implement during this MTDS period. In addition, the
document lists several activities that the Ministry of Finance will pursue to facilitate
development of domestic debt market.
1 This strategy was selected based on the MTDS Analytical Tool (MTDS AT), an excel-based tool developed by
the World Bank and the IMF.

2
2 Debt management objective and the scope of the MTDS
2.1 Debt management objective
The Public Debt Policy 20162 sets out two objectives of the public debt management, as
follows:
1) Meet the public sector’s financing needs and debt service obligations at timely manner
at the lowest possible cost, consistent with a prudent degree of risks.
2) Support the development of an efficient domestic capital market in the long run.
Since the policy is still effective and operational, the financing strategy during this MTDS
period will be targeted towards achieving these two debt management objectives. However,
the primary debt management objective in the medium term will be minimizing the
government’s financing cost, while also trying to facilitate the development of efficient
domestic capital market.
The government will facilitate gradual development of efficient capital market, by first
focusing on the development of government bond market in medium term. The development
of efficient government bond market will be critical in the medium term, given the projected
increase in resource gap due to high fiscal deficit during the period.
2.2 Scope of this MTDS
This MTDS covers public and publicly guaranteed (PPG) debt and spans three financial years
(from FY 2020/21 to FY 2022/23). PPG debt is defined in the Public Debt Policy 2016 as “the
debt of the public sector (i.e., of the Royal Government of Bhutan, the Royal Monetary
Authority of Bhutan (RMA) and Public Corporations).” However, the debt servicing for the
corporate debt and the RMA are excluded in the calculation of GFN since the debt servicing is
made directly by the corporation and RMA and does not affect the government’s cash flow.
2.3 Legal and policy framework for the MTDS
The Public Debt Policy 2016 requires the government to prepare an MTDS that lays out “the
roadmap to achieve the objectives of public debt management set out in the policy.” The debt
policy also requires an annual update of the strategy. However, unlike in some other countries,
there is no law requiring the government to formulate and publish the MTDS.
The formulation of this MTDS is a step towards fully operationalizing the debt policy, which
can help ensure that the “government’s financing decisions are prudent and public debt is
maintained at a sustainable level”— the main objective of the Public Debt Policy 2016.
2 https://www.mof.gov.bt/wp-content/uploads/2014/07/PublicDebtPolicy2016.pdf
3
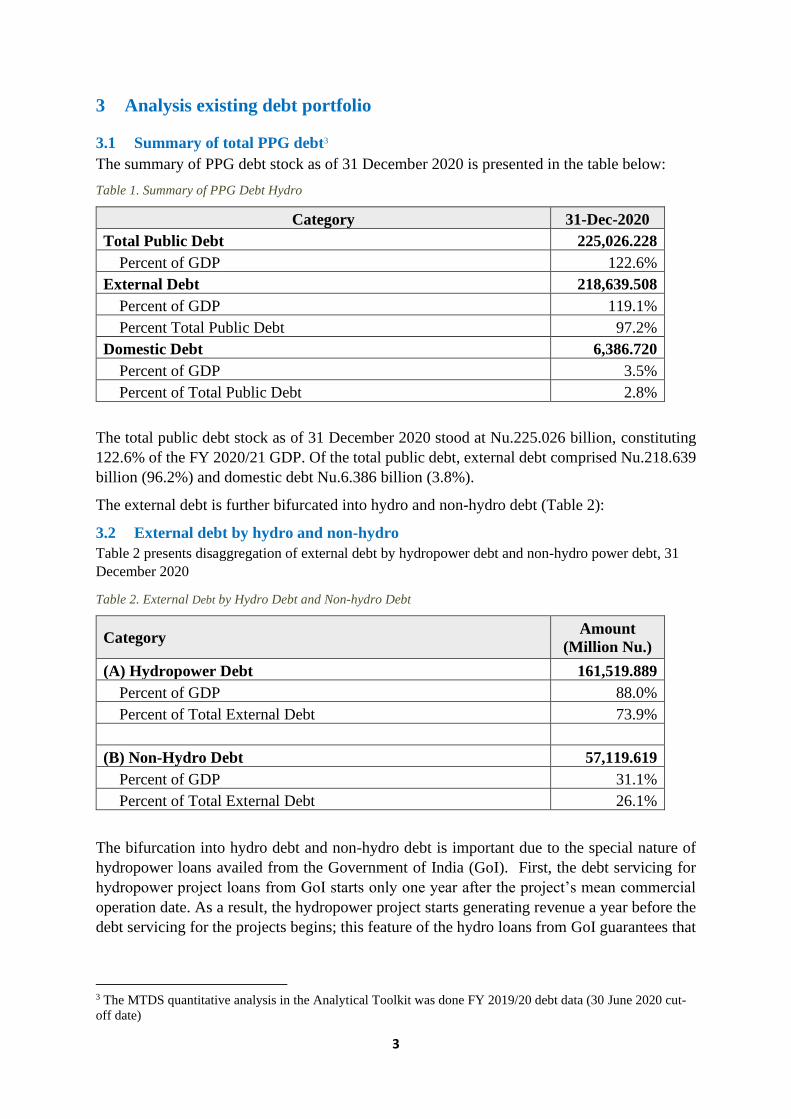
3 Analysis existing debt portfolio
3.1 Summary of total PPG debt3
The summary of PPG debt stock as of 31 December 2020 is presented in the table below:
Table 1. Summary of PPG Debt Hydro
Category 31-Dec-2020
Total Public Debt 225,026.228
Percent of GDP 122.6%
External Debt 218,639.508
Percent of GDP 119.1%
Percent Total Public Debt 97.2%
Domestic Debt 6,386.720
Percent of GDP 3.5%
Percent of Total Public Debt 2.8%
The total public debt stock as of 31 December 2020 stood at Nu.225.026 billion, constituting
122.6% of the FY 2020/21 GDP. Of the total public debt, external debt comprised Nu.218.639
billion (96.2%) and domestic debt Nu.6.386 billion (3.8%).
The external debt is further bifurcated into hydro and non-hydro debt (Table 2):
3.2 External debt by hydro and non-hydro
Table 2 presents disaggregation of external debt by hydropower debt and non-hydro power debt, 31
December 2020
Table 2. External Debt by Hydro Debt and Non-hydro Debt
Category Amount
(Million Nu.)
(A) Hydropower Debt 161,519.889
Percent of GDP 88.0%
Percent of Total External Debt 73.9%
(B) Non-Hydro Debt 57,119.619
Percent of GDP 31.1%
Percent of Total External Debt 26.1%
The bifurcation into hydro debt and non-hydro debt is important due to the special nature of
hydropower loans availed from the Government of India (GoI). First, the debt servicing for
hydropower project loans from GoI starts only one year after the project’s mean commercial
operation date. As a result, the hydropower project starts generating revenue a year before the
debt servicing for the projects begins; this feature of the hydro loans from GoI guarantees that
3 The MTDS quantitative analysis in the Analytical Toolkit was done FY 2019/20 debt data (30 June 2020 cut-
off date)

4
the hydropower company has revenue inflows, and the central bank has adequate INR reserve
for debt servicing to the GoI.
Second, the GoI has guaranteed to buy the country’s surplus electricity, ensuring a market
certainty for electricity generated from GoI-financed projects in Bhutan. Besides, India’s
growing energy demand assures a stable market for Bhutan’s surplus power.
Third, the price for electricity export to India is fixed at cost plus a margin. This means if a
project’s cost increases – which proportionately increases the loan financing – the export price
also increases. This price-fixing model ensures that higher debt servicing cost due to the
escalation of the project cost is mitigated by a higher export revenue.
Till now the hydropower revenue has been able to meet the hydro debt servicing cost without
much difficulty. For example, in the last 15 years, the average annual debt service coverage
ratio of all the hydropower companies combined was 3.53. Looking forward, from 2021 to
2040, the average annual debt service coverage ratio is expected to be about 2.6.
Risks from non-hydro debt are relatively low because non-hydro debts are mostly concessional
loans from multilateral development banks such as ADB, IDA, and IFAD. These loans are
highly concessional with a long grace period (from 8 to 10 years), low-interest rate (from 0.75%
to 1.5%), and long repayment periods (from 24 to 30 years).
3.3 External debt by currency composition
Figure 1 present external debt by currency composition:
Figure 1. External Debt by currency composition
The largest portion of the external was denominated in INR, followed by SDR and
then USD.
SDR20%
USD6%
EUR1%
JPY2%
INR71%

5
3.4 External debt by creditors
Figure 2 below presents external debt by major creditors as of 31 December 2020.
Figure 2. External Debt by Creditor
GoI is Bhutan’s largest creditor, followed by ADB and IDA. The debt owed to GoI is mainly
on account of the loan availed for developing hydropower projects in the country: the
hydropower debt made up 95.5% of the total debt owed to the GoI, and the standby credit
facility (SCF), which availed due to the INR shortage in FY 2011/12, made up the rest.
3.5 Repayment profile of existing debt
Figure 3 presents the projection of principal repayment of the existing debt, disaggregated by
currencies of the denomination:
Figure 3. Repayment Profile of existing Debt
The largest proportion of principal repayment will be in INR to GoI for the hydropower debt.
The rest are repayments in other foreign currencies (mainly US$) for loans availed for
financing budgetary programs and projects from multilateral development banks, such as the
ADB and World Bank.
The repayment is projected to increase significantly from FY 2025/26 with the start of the
repayment for the Punatsangchhu-I hydroelectric project (PHP-I). By then, the repayments for
all the ongoing hydropower projects would have been started. However, despite the significant
rise in repayment, the electricity export revenue would be able to adequately cover the hydro
loan repayments.
ADB14% IDA
11%
IFAD1%
GOA1%
JICA2%
SDF0.4%
GoI71%
0.0020.0040.0060.0080.00
100.00120.00140.00160.00180.00
In M
illo
n U
SD
USD EUR JPY INR BTN

6
3.6 Cost and risk of existing debt
Table 3 summarizes the cost and risks indicators of the existing debt portfolio as of 31
December 2020.
Table 3. Cost and Risk Indicator of existing Public Debt
Cost & Risk Indicators External Domestic Total
Nominal Debt (Million Nu.)
218,639.508
6,386.720
225,026.228
Nominal Debt as percent of GDP 119.1% 3.5% 122.6%
Weighted Average Interest Rate 7.2% 4.0% 7.3%
Refinancing
Risks
Average Time to
Maturity (Years) 11.7 2.3 11.4
Debt Maturing in 1 Year
(% of Total) 1.7% 47.2% 5.1%
Interest Rate
Risks
Average Time to
Refixing (Years) 11.2 2.3 11.0
Debt Refixing in 1 Year
(% of Total) 6.1% 47.2% 9.3%
Fixed Rate Debt (% of
Total) 95.5% 100.0% 98.4%
Forex Risk CC Debt (% of Total) 28.6%
Short-term CC Debt (% of Gross Reserve) 0.0%
Refinancing risk: The refinancing risks of the external debt remains low with the average time
to maturity (ATM) of 11.7 years and debt maturing in one year constituting only 5.1% of the
total debt stock. However, the refinancing risk for domestic debt is comparatively higher as
47.2% of the existing domestic debt is expected to mature in one year.
Interest rate risk: Likewise, the interest rate risk for external debt remains low with the fixed-
interest debt making up 95.5% of the total external debt, and the debt subject to interest rate
refixing in one year at 6.1%. Nonetheless, the interest rate risk for domestic debt is high as
47.2% of the domestic would be subject to a new interest rate within one year.
Exchange rate risks: The exchange rate risk is low as only 28.6% of the total debt are
denominated in foreign currencies (CC-denominated debt) other than INR. While nearly all the
PPG debt is denominated in foreign currency, the foreign exchange rate risk is limited as the
bulk of public debt comes from hydropower-related loans from India.
External debt servicing of hydropower loans is covered by revenues from hydropower exports
to India, which offsets the financing needs created by the loans. The arrangement reduces
currency risk because streams of assets (electricity export receipts) and liabilities (hydropower
debt) are both denominated in INR, to which the Bhutanese currency (Ngultrum) is pegged.

7
4 Evaluation of the last MTDS and other developments
Bhutan’s first MTDS with a five-year time horizon was prepared in 2013. The primary
objective of the last MTDS was to “maximize concessional borrowings from multilateral and
bilateral creditors” to minimize the borrowing cost. However, unlike the current MTDS, the
previous MTDS did not include a financing strategy based on quantitative analysis.
The strategy included targets on several debt indicators to be achieved by the end of FY
2017/18, which were all achieved due to stability of the portfolio and prudent management of
the public debt4. The previous MTDS also focused on organizational strengthening, improving
cash management, developing the domestic debt market, and improving debt reports.
The Cabinet issued the first Public Debt Policy in 2016
The Public Debt Policy 2016 was approved by the Cabinet in August 2016. The main objective
of the policy was “to ensure that financing decisions are prudent and public debt maintained at
a sustainable level”. The policy provides a broad guiding principle for raising domestic and
external debt, categorized by types of liability (direct or contingent), and sector of the borrower.
The policy also lays out different types of institutional arrangements for efficient debt
management, and the kind and frequency of risk assessment and monitoring that should be
performed to achieve the objectives of the policy.
Prepared “Debt Market Development Strategy” in 2014
The ‘Debt Market Development Strategy’ was published by the Department of Public Accounts
in April 2014. The strategy was prepared by the Ministry of Finance, with technical assistance
from the ADB.
The document sets forth the policies that the Ministry of Finance and the RMA will adopt to
develop deep and liquid markets for government debt. Further, the document sets forth
strategies to achieve the objective of developing deep and liquid markets for government debt.
One of the milestones to be achieved due after this strategy as follows:
▪ DPA started publishing the T-Bills auction calendar at the beginning of the fiscal year.
▪ RSEBL issued and adopted rules on Clearing and Settlement
▪ RMA has initiated the development of the T-Bills auction system.
▪ T-Bill auction conducted using multiple price systems as per the strategy to reduce reliance
on captive investors.
▪ Monthly cash forecasting started; earlier, the cash forecasting was done quarterly.
▪ Quarterly debt report was further refined to include cost and risks of debt stock and other
portfolio analysis.
These milestones have helped in gradually developing the government securities market, especially
the primary market for the T-Bills.
4 Indicator included the Average Time to Maturity (ATM), Average Time to Re-fixing, CC-denominated debt (percent of total), debt maturing in 1 year (percent of total), and fixed-interest debt (percent of total).

8
Developed Long-term Bond Issuance Strategy, and Rules and Regulation for Issuance of
Government Bond
Ministry of Finance, in collaboration with the RMA, prepared a long-term bond issuance
strategy. The strategy lays out the types of bonds and tenors of bonds to be issued, how coupons
would be determined, and the strategy to ensure a broad-based ownership of the government
bond.
The Ministry of Finance also approved the Rules and Regulation on the issuance of government
bonds in June 2020. The rules provide detailed procedures on the issuance of government
bonds, including the method of issuance, payment of coupon and principal, issuance calendar,
and the listing of government bonds.
Based on the strategy and the Rules, the first government bond of Nu.3 billion was issued in
September 2020, with an overwhelming investor response (the bond was oversubscribed by 3
times). The second government bond of 10-year maturity were issued in February 2021 on a
yield-based auction. The bid-to-cover ratio was 3.14, indicating strong demand for government
bond in the market.

9
5 Medium-term macroeconomic outlook
5.1 GDP growth
In 2019, the economy grew by 5.5%, up from 3.1% in 2018. GDP growth is expected to contract
by -6.8% due to disruption of economic activities in the country after the COVID-19 pandemic.
The two nation-wide lockdowns and other stringent containment measures further exacerbated
the economic disruption in 2020.
Figure 4. GDP growth outlook
The covid-19 pandemic devasted the country’s service sector, the hardest hit being the tourism
and allied businesses. The pandemic also severely disrupted the industry sector, especially the
construction and mining activities due to a shortage of labor and materials
However, economic growth is projected to rebound to 3.3% and 6.2% in FY 2021/22 and
FY2022/23 (the final two fiscal years of the 12th five-year plan), due to expected rebound
tourism and allied businesses, and the industry sector, especially the construction sector.
5.2 Current account balance
The current account deficit is expected to narrow in FY 2020-21, with the reduction in imports
due to the Covid-19 pandemic. Despite the pandemic, the economy managed to continue with
a certain level of trade to support the flow of essential goods and services.
Figure 5. Current Account Balance outlook
3.1
5.5
-6.8
3.3
6.2
2018 2019 2020 2021 2022
GDP Growth
-21.1%
-12.2%
-8.8%-11.0%
-0.6%
2018/19 2019/20 2020/21 2021/22 2022/23
Current account balance to GDP(%)

10
The current account deficit is expected to improve from 12.2% of GDP in FY 2019/20 to 8.8%
in FY 2020/21. The narrowing of the current account deficit in 2020/21 compared to FY
2019/20 is mainly due to improvement in the goods and services trade, from a deficit of Nu.21.9
billion in 2019 to Nu. 13.8 billion in 2020.
The current account balance is projected to improve significantly in FY 2022/23, reflecting an
increase in hydropower exports after the commissioning of Punatshangchu Hydroelectric
Project-II (PHP-II) in December 2022.
5.3 Primary balance
The disruption of economic activities due to the recent lockdown will invariably impact the
implementation of capital works and lead to deterioration in the revenue position.
Figure 6. Primary Balance Outlook (percent of GDP)
The Covid-19-induced pandemic has disrupted businesses in the country, which has severely
reduced the government’s tax revenue. The deferment of the business income tax exacerbated
the drop in tax revenue. As a result, the primary balance is projected to deteriorate in the
medium term.
The primary deficit to GDP is estimated to deteriorate to 4.5% in FY2020/21 and to worsen
further to a deficit of 8.1% in FY 2021/22. The worsening of the primary deficit in FY 2020/21
reflects a decline in revenue from all major sources except the hydropower sector. The tax
revenue is projected to decline by almost 19% (year-on-year) in FY 2020/21 compared to the
FY before.
The primary deficit is expected to increase to -8.1% of GDP in FY 2021/22 due to a large
increase in capital expenditure without a commensurate increase in revenue. Capital
expenditure is projected to increase by 68% (year-on-year), while revenues are expected to
increase only by 19% (year-on-year).
However, the primary deficit is projected to improve to -0.2% in FY 2022/23 as capital
expenditure tapers off at the end of the 12th five-year plan. In FY 2022/23.
-0.7%
-2.7%
-4.5%
-8.1%
-0.2%
2018/19 2019/20 2020/21 2021/22 2022/23

11
5.4 Medium-term macro-fiscal risks
1. Downside risk to growth: The economy has been severely affected by COVID-19.
Recovery from the recession could be delayed further given the unpredictability of the
pandemic’s course. The most severe risk to the outlook is a scenario of a large-scale
community transmission with prolonged mobility restrictions that would result in
substantial social and economic costs.
2. Inflationary Pressure: Inflationary pressures have increased with the onset of the
pandemic. As inflationary pressure builds up in India, domestic inflation has also been on
the rise since 52 percent of the CPI basket is imported. Domestic food prices remain
elevated due to disruption in the supply chains.
3. External Risk: A slower recovery globally and in India could impact Bhutan’s external
trade and financing because of strong linkages between tourism and trade. Weaker demand
from India could adversely impact production and exports from non-hydro industries. The
revival of tourism is also dependent on the external environment given the international
travel restrictions and changing consumer behavior.
4. Fisk risks: While domestic resources have decreased significantly due to the disruption in
economic activities, the current expenditure has remained at pre-COVID levels. As a result,
it will be challenging to cover current expenditures from the domestic resources, as
mandated by the constitution, Art. 14.

12
6 Potential Funding Sources
This section provides a brief overview of the government’s potential funding sources and the
cost and risks associated with various financing sources.
6.1 External sources
The government currently avails concessional financing from multilateral development
partners such as IDA, ADB, International Fund for Agricultural Development (IFAD), and
Japan International Cooperation Agency (JICA) for financing budgetary programs and
projects. On the other hand, for large capital investment, such as hydropower development, the
financings are mainly from the GoI.
The external concessional financing from ADB, IDA, and IFAD will still remain the
government’s preferred financing source for a foreseeable future, since financing from these
institutions are cost effective and long-term. The high concessional terms(low fixed interest
rate, long grace period, and long repayment period) of loans from these sources help mitigate
refinancing risks and interest rate risks.
The cost and risk characteristics of potential funding sources are briefly stated in Table 6 below.
Table 4. Potential Financing Sources
Funding
Source
Financing terms Benefits and potential risks
1. External Sources
World Bank
(IDA
Regular)
Maturity period: 40 years
Grace period: 10 years
Interest rate: 0.75%
Benefit: highly concessional; lowers financing
cost; receive technical assistance with the
financing
Risk: exchange rate risks since financing is in
foreign currency
ADB (OCR) Maturity period: 32 years
Grace period: 8 years
Interest rate: 1% during grace
period; 1.5% after grace period
Benefit: highly concessional; lowers financing
cost; receives technical assistance with the
financing
Risk: exchange rate risks since financing is in
foreign currency period
IFAD Maturity period: 40 years
Grace period: 10 years
Interest rate: 0.75%
Benefit: highly concessional; lowers financing
cost; receives technical assistance with the
financing
Risk: exchange rate risks since financing is in
foreign currency period
JICA Maturity period: 40 years
Grace period: 10 years
Interest rate: 0.1%
Benefit: highly concessional; lowers financing
cost; receives technical assistance with the
financing
Risk: exchange rate risks since financing is in
foreign currency period
EIB Maturity period: 25 years
Grace period: 5 years
For Borrowings in EURO
Fixed Interest rate: 1.2% -1.5%
1 Benefit: highly concessional; lowers
financing cost; technical assistance with the
financing
Risk: exchange rate risks since financing is in
foreign currency period; higher interest

13
For borrowing in USD
Fixed interest rate: 2.7%-3%
compared to other concessional financing
sources
Domestic Sources
T-Bills 1 month – 1 year
Discount rate: 1%- 2.8%
Benefit: lower cost (discount rate) compared to
other domestic financing instruments.
Risk: higher refinancing risks due to lower
maturity period
Bonds 3- year to 10 years
Expected coupon rate: 4%- 7%
Benefit: help diversify funding sources for the
government; facilitate the development of the
domestic capital market; develop benchmark
yield curve for the market.
Risks: Limited available financing.
Weaken government’s fiscal position due to
higher interest cost
6.2 Domestic sources
Currently, domestic funding is limited. The government resorts to domestic financing only if
the financing from external concessional windows is inadequate since the financings from
concessional windows are much cheaper. However, in the medium term, the domestic
financing is expected to increased due to gross financing need.
Therefore, the MoF has been striving to develop the government securities market in the
country. This started with the adoption of Operations Guidelines for Treasury Bills in 2009,
and revision of the guidelines in 2014 to incorporate auction method for the sale of T-Bills.
Currently, the MoF issues T-Bills every month through competitive auction; the Department
of Public Accounts also publishes an auction calendar for T-Bills on the MoF website.
In June 2020, the MoF approved Rules and Regulation for Issuance of Government, which
culminated in the issuance of the first government bond in September 2020. The first issuance
of followed by the issuance of a 10-year government bond in February 2021 using a yield-
based auction. Both the issuance received an overwhelming response from investors, indicating
a strong appetite for government securities in the market.
However, the domestic bond market is still in the infant stage of development. Though there
are several corporate bonds listed in the stock market, there is hardly any trading in the
secondary market. Thus, enhancing liquidity in the bond market will be important stoke to the
development of domestic bond market in the country. And government bond issuances can
play a critical role in increasing activities in both the primary and secondary market, thus
boosting the development of an efficient capital market in the country.

14
Box 1 – Topics related to the Domestic Market
The focus on market development efforts should be on the primary market and conditional to the
current economic situation and the existing market structure. Market development improvements
will likely happen gradually and the MoF should experiment with the instrument being issued and how
they are issued, and openly discuss potential initiatives with market participants.
Coordination with cash management is key. For market development purposes, borrowing decisions
must be not only driven by cash needs, but that broader market development objectives are taken into
account when deciding what and when to issue (regular presence – whether there is a cash need or not –
will be a requirement for any meaningful market development strategy).
Monetary policy is focused on keeping the peg to the Indian rupee and is implemented through
changes in reserve requirements. The current monetary policy toolkit implies that RMA effectively
creates demand for government securities, partly explaining the very low-interest rates (the annual
interest rate on T-Bills is currently below 1.7 percent). The monetary policy framework was recently
reviewed, and bills with maturities shorter than three months were re-introduced. Interbank activity to
even out liquidity among banks is extremely limited and no secondary market exists.
Overdraft from the central bank has diminished with the increase of T-Bill issuances. Cash
management contributes to market uncertainty and uncertainty about issuance volume since the
government has recourse to overdrafts from RMA and Bank of Bhutan (BoB). The latter is especially
important, since the interest rate the government pays on overdrafts in BoB in periods of cash shortage
distorts the behavior of the largest bidder (BoB) in the auctions, preventing a ‘true’ market-clearing price.
The investor-base is very narrow comprising 5 banks of uneven size and 2 non-banks (pension and
insurance). The dominating bank in the T-bill auctions is BoB, which is 80 percent government-owned
and the holder of the government accounts outside of RMA. The National Public Pension Fund (NPPF)
has large and growing investment needs, but in the absence of government securities, mainly rely on
member loans to generate investment returns. NPPF does not currently participate in T-bill auctions due
to the low-interest rates. Looking forward and taking into account that NPPF will continue growing over
the next decades, there is a potential and constant demand for long-term securities. This will be important
from the governments’ perspective since demand is expected to be high and constant. On the other hand,
since NPPF will be a ‘hold-to-maturity investor, they will likely only contribute to market development
at the margin. No regular meetings are held with the market participants.
Clearing and settlement are undertaken through the stock exchange. The market infrastructure
appears to be working well, but would, in its current set-up, not support active market trading or an
effective repo-market. Efforts to de-materialize securities are ongoing.
The first government bond of 3-year maturity of Nu 3 billion was issued in September 2020. The
coupon rate was fixed administratively at 6.5%, and the issue was offered for public subscriptions. The
RMA received subscriptions for Nu. 9.109 billion against the offered amount of Nu. 3 billion
(subscription-to-cover ratio of 3.04). The second government bond (10-year bond of Nu. 700 million)
was issued through competitive bidding, using a yield-based auction in February 2021. The cut-off yield
stood at 3.98%, with a bid-to-cover ratio of 4.14.

15
7 Modelling MTDS
7.1 Key assumptions
The following table presents the key baseline macro-fiscal assumptions in the simulation of the
strategies:
Table 5. Key macro-fiscal assumptions in this MTDS
Million Nu. FY 2020/21
FY
2021/22 FY 2022/23
Revenue & Grant 45,768.79 54,460.66 47,546.69
Primary Expenditure 54,367.87 64,654.50 54,221.82
Budgeted Interest Payment 2,027.70 3,205.08 3,159.52
International Reserve (Million US $) 1,391.61 1,451.15 1,792.87
GDP 183,550.80 197,508.61 217,112.61
Source: MEF, MFCTC
Further, the Ngultrum is depreciated against all three major convertible currencies in which
Bhutan’s public debt is denominated. It is assumed that the current policy of pegging the
Ngultrum to Indian Rupee at par will remain unchanged for the foreseeable future.
Table 6. Exchange Rate assumptions
FY 2020/21 FY 2021/22 FY 2022/23
USD 5.19% 3.75% 3.61%
EUR 4.1% 2.2% 2.1%
JPY 1.4% 12.5% 15.8%
7.2 Description of alternative financing strategies
The government has to meet its GFN either from external or domestic sources, depending on
the government’s cost and risk tolerance.
For this MTDS, the cost and risks simulation is based on four alternative financing strategies-
different combinations of the external borrowings and the domestic borrowings. The strategy
that leads to the lowest cost and risk combination will be pursued. However, the MTDS will
be updated, or reviewed annually to ensure that appropriate strategy is selected for achieving
the debt management objective.
It is assumed that 100% of the external borrowings are from concessional fixed-rate windows
from multilateral development banks, such as the ADB, IDA, and IFAD. This is in line with
the Government’s past and recent external borrowings pattern and preferences.

16
The four alternative strategies are briefly described below.
Strategy 1(S1): Baseline
The proportion of external borrowing in this strategy is based on the indicative concessional
lending from multilateral development banks, such as the ADB, the World Bank, and the IFAD.
The strategy assumes that the financing needs that cannot be met from concessional borrowings
are met from domestic sources through the issuance of T-Bills and long-term bonds.
The external and domestic financing proportion is presented in the table below:
Table 7. Strategy 1(Baseline)
Strategy 1(S1) FY 2020/21 FY 2021/22 FY 2022/23
External Financing (% of GFN) 49% 30% 21%
The instrument-wise proportion of domestic
financing
T-Bill 90% 80% 60%
3-Year Bond 10% 20% 20%
5-Year Bond 20%
Strategy 2(S2): External concessional borrowings to meet 80% of GFN
The strategy envisages meeting 80% of the GFN through external borrowings, and the balance
from the domestic market through the issuance of T-Bills and bonds of varying maturities.
Table 8. Strategy 2: External concessional borrowings to meet 80% of GFN
S2
FY
2020/21
FY
2021/22
FY
2022/23
External Financing (% of GFN) 80% 80% 80%
The instrument-wise proportion of domestic financing
T-Bill 90% 50% 20%
3-Year Bond 10% 30% 30%
5-Year Bond 20% 50%
A higher proportion of external concessional borrowings will reduce costs. This strategy
gradually reduces the issuance of T-Bills, while increasing the issuance of medium-term bonds.
This strategy also introduces 5-year bonds from the second year and increases the proportion
of 5-year bonds over the years; this is mainly aimed at gradually lengthening the maturity of
the benchmark bonds.

17
Strategy 3(S3): External concessional borrowings and domestic borrowing each to
meet 50% of the GFN
In strategy 3, the external borrowing is set to meet 50% of the GFN, and domestic borrowings
to meet the other half of the GFN, as shown below:
Table 9. Strategy 3: External concessional borrowings and domestic borrowing each to meet 50% of the GFN
S3 FY 2020/21 FY 2021/22 FY 2022/23
External Financing (%) 50% 50% 50%
The instrument-wise proportion of domestic
financing
T-Bill 90% 50% 30%
3-Year Bond 10% 30% 30%
5-Year Bond 20% 30%
7-Year Bond 10%
In this strategy, the maturity of the domestic debt portfolio is further lengthened by issuing 7-
year bonds from FY 2022/23 to meet 10% of the domestic financing requirement.
Strategy 4(S4): External concessional borrowings to meet 10% of the GFN
S4 builds an extreme case, where 90% of GFN are met from domestic sources using five
maturities of government securities.
Table 10. Strategy 4: External concessional borrowings to meet 10% of the GFN
S4 FY 2020/21
FY
2021/22 FY 2022/23
External Financing (%) 10% 10% 10%
The instrument-wise proportion of domestic
financing
T-Bill 90% 10% 0%
3-Year Bond 10% 30% 20%
5-year Bond 0% 30% 30%
7-Year Bond 0% 30% 40%
10-Year Bond 0% 0% 10%
This strategy was introduced for analytical purposes only, to illustrate changes in cost and risk
parameters if domestic borrowing became more important in the future.

18
7.3 Description stress tests
The robustness of each candidate strategy is evaluated by applying interest rate and exchange
shocks as described below:
● Shock 1: A one-time Ngultrum depreciation of 30% is introduced in FY 2021/22,
which is similar to the exchange rate shock in the Debt Sustainability Analysis (DSA).
● Shock 2: A depreciation rate of 5% is introduced in FY 2021/22 in combination with
the interest rate shock. The depreciation rate was derived by taking the average annual
depreciation rate of the past 20 years plus one standard deviation.
Stress testing with an exchange rate shock is important for gauging the variability of cost and
risks of external debt under the worst-case scenario to enable the debt managers make
appropriate choice between external and domestic financing
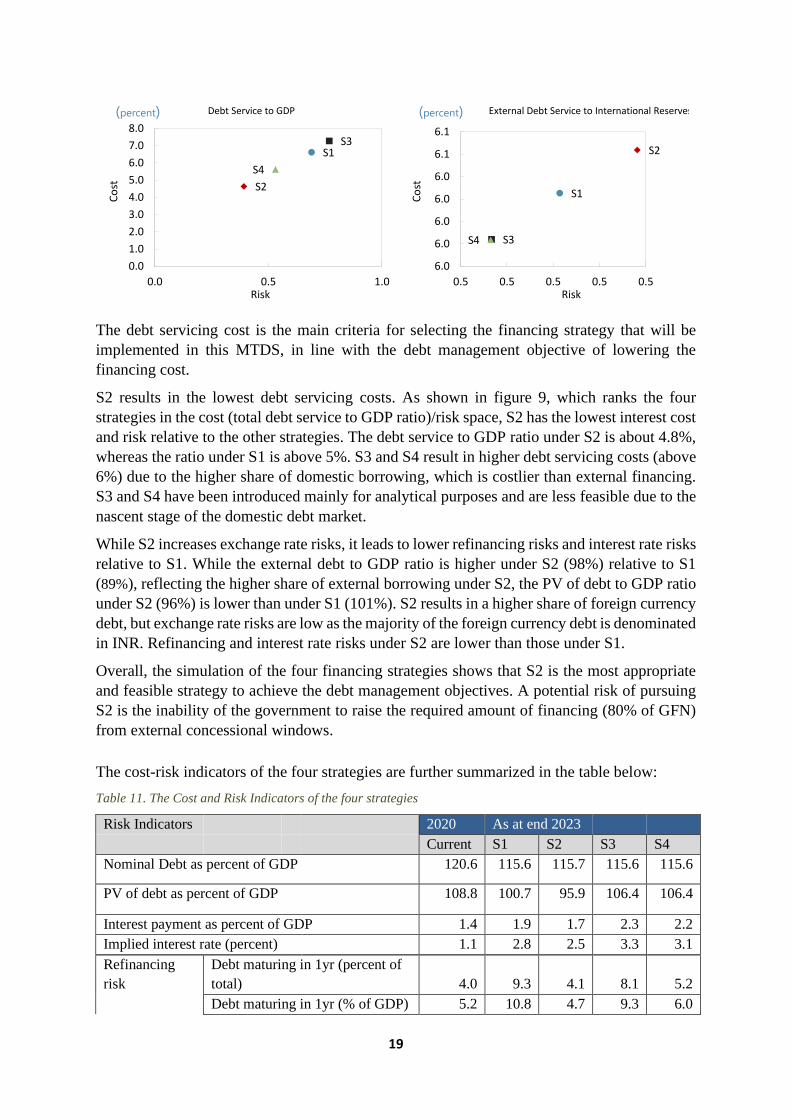
7.4 The outcome of the strategy simulation
The figure below illustrates the performance of the four strategies based on four cost-risk
indicators: (i) present value (PV) of debt to GDP ratio, (ii) interest-to-GDP ratio, (iii) interest-
to-revenue ratio; and (iv) external debt service to international reserves ratio, at the end of
MTDS period (as at end of 2022/23).
Figure 7. Simulation Outcome: External Debt to
GDP
Figure 8. Simulation Outcome: PV of Debt to GDP
Figure 9. Simulation Outcome: Debt Service to GDP
Figure 10. Simulation Outcome: External Debt
Service to International Reserves
S1
S2
S3S491.0
92.0
93.0
94.0
95.0
96.0
97.0
98.0
99.0
5.0 5.5 6.0
Co
st
Risk
External Debt to GDP(percent)
S1
S2
S3S4
86.0
86.5
87.0
87.5
88.0
88.5
89.0
89.5
90.0
3.8 4.0 4.2 4.4 4.6 4.8
Co
st
Risk
PV of Debt to GDP(percent)
19
The debt servicing cost is the main criteria for selecting the financing strategy that will be
implemented in this MTDS, in line with the debt management objective of lowering the
financing cost.
S2 results in the lowest debt servicing costs. As shown in figure 9, which ranks the four
strategies in the cost (total debt service to GDP ratio)/risk space, S2 has the lowest interest cost
and risk relative to the other strategies. The debt service to GDP ratio under S2 is about 4.8%,
whereas the ratio under S1 is above 5%. S3 and S4 result in higher debt servicing costs (above
6%) due to the higher share of domestic borrowing, which is costlier than external financing.
S3 and S4 have been introduced mainly for analytical purposes and are less feasible due to the
nascent stage of the domestic debt market.
While S2 increases exchange rate risks, it leads to lower refinancing risks and interest rate risks
relative to S1. While the external debt to GDP ratio is higher under S2 (98%) relative to S1
(89%), reflecting the higher share of external borrowing under S2, the PV of debt to GDP ratio
under S2 (96%) is lower than under S1 (101%). S2 results in a higher share of foreign currency
debt, but exchange rate risks are low as the majority of the foreign currency debt is denominated
in INR. Refinancing and interest rate risks under S2 are lower than those under S1.
Overall, the simulation of the four financing strategies shows that S2 is the most appropriate
and feasible strategy to achieve the debt management objectives. A potential risk of pursuing
S2 is the inability of the government to raise the required amount of financing (80% of GFN)
from external concessional windows.
The cost-risk indicators of the four strategies are further summarized in the table below:
Table 11. The Cost and Risk Indicators of the four strategies
Risk Indicators 2020 As at end 2023
Current S1 S2 S3 S4
Nominal Debt as percent of GDP 120.6 115.6 115.7 115.6 115.6
PV of debt as percent of GDP 108.8 100.7 95.9 106.4 106.4
Interest payment as percent of GDP 1.4 1.9 1.7 2.3 2.2
Implied interest rate (percent) 1.1 2.8 2.5 3.3 3.1
Refinancing
risk
Debt maturing in 1yr (percent of
total) 4.0 9.3 4.1 8.1 5.2
Debt maturing in 1yr (% of GDP) 5.2 10.8 4.7 9.3 6.0
S1
S2
S3
S4
0.0
1.0
2.0
3.0
4.0
5.0
6.0
7.0
8.0
0.0 0.5 1.0
Co
st
Risk
Debt Service to GDP(percent)
S1
S2
S3S4
6.0
6.0
6.0
6.0
6.0
6.1
6.1
0.5 0.5 0.5 0.5 0.5
Co
st
Risk
External Debt Service to International Reserves(percent)

20
ATM External Portfolio (years) 11.3 10.9 11.9 9.3 9.3
ATM Domestic Portfolio (years) 1.7 1.6 2.7 2.6 3.6
ATM Total Portfolio (years) 11.2 10.0 11.7 8.0 8.2
Interest rate
risk
ATR (years) 10.7 9.6 11.4 7.7 7.9
Debt refixing in 1yr (percent of
total) 8.9 12.9 7.7 11.8 8.9
Fixed rate debt incl T-bills
(percent of total) 94.9 96.1 96.1 96.1 96.1
T-bills (percent of total) 0.6 5.2 0.2 3.6 0.7
FX risk FX debt as % of total 99.0 89.2 97.7 79.7 79.6
ST FX debt as % of reserves 7.1 6.1 6.1 6.1 6.1
Overall, the simulation of the four financing strategies shows that S2 is the most appropriate
and feasible strategy to achieve the debt management strategy: the S2 leads to the lowest
financing cost without enhancing the risks much compared to other strategies. Through S2
increases the foreign currency debt, which increases exchange rate risks, S2 leads to lower
refinancing risks and interest rate risks.
However, much of the foreign currency debt is denominated in Indian Rupee, to which
Bhutanese Ngultrum is pegged at par. Therefore, although pursuing S2 would accumulate a
higher level of foreign currency debt, the exchange rate risks arising from implementing S2.
7.5 Preferred strategy and the rationale
S2 is the preferred strategy to achieve the stated debt management objective of lowering the
financing cost and facilitating the development of an efficient domestic capital market. While
the higher proportion of external concessional financing (80%) under S2 lowers the cost with
some elements of risk, the financing of 20% of the GFN from the domestic market through the
issuance of bonds is expected to facilitate the development of the domestic debt market.
Given that 80% of the GFN are financed from external sources, the exposure to exchange rate
risks is projected to increase under S2. Therefore, it will be critical to monitor exchange rate
movements and design a hedging strategy to mitigate exchange rate risks.
7.6 The MTDS in summary
In general, the government’s MTDS for the next three fiscal years can be summarized as
follows:
i. Maximize concessional borrowings from multilateral and bilateral creditors to
minimize the government’s financing cost and risks;
ii. Meet some portion of the government’s total financing requirement through the
issuance of T-Bills and varying maturity bonds to facilitate the development of
domestic debt market in the country; and
iii. Maintain the external debt burden indicators within the thresholds prescribed by the
Public Debt Policy 2016.

21
Following are the broad set of targets to be achieved within this MTDS period:
i. Meet 60%-80% of the gross financing need (GFN) from the external concessional
windows;
ii. Meet 20%-40% of the GFN from domestic sources, mainly through the issuance of
medium and long-term bonds;
iii. Maintain fixed-rate debt above 95% of the total debt to mitigate interest rate risks;
iv. Gradually reduce the issuance of T-Bills for deficit financing; Use T-Bills primarily for
the management of short-term revenue shortfall;
v. Gradually develop the domestic market. Adopt auction as the primary method for the
sale of government bonds;
vi. Broaden the investor base - use the retail debt market.
8 Planned Initiatives for the development of a domestic debt market
For domestic borrowing through the issuance of T-Bills and Bonds, the following systems and
initiatives will be carried out.
Develop Government Securities Issuance System: The Ministry of Finance in collaboration
with RMA will develop an online system to receive bond subscriptions/bids and allot the bond,
to make it easier for the investors to buy government securities. Besides, a credible, transparent
system would make the issuance process more secure, boosting investor confidence in the
process.
Initiate consultation meetings with investors: The Ministry of Finance will initiate
consultation meetings with government securities investors. The main objective of such
meetings would be to discuss investor’s preferences in terms of bond tenor and size to gain
market knowledge to formulate a better issuance strategy.
Introduce bond issuance calendar: The Ministry of Finance would work towards publishing
a bond issuance calendar to reduce uncertainty and encourage more participation. The issuance
calendar would contain general information about the planned issuance, such as the issue date,
the tenor of the bond, and the tentative issue amount.
Produce education materials on government bonds: Although the financial institutions know
about investing in government bonds, the retail investors and the public are less familiar with
government bonds. To broaden the investor base for government bonds, the Ministry of
Finance in collaboration with the RMA will develop educational material on government
bonds, such a brochures/pamphlets and short videos covering the basics of government bond,
including issuance process, coupon payment process, and risks and benefits of investing in a
government bond.

22
9 Revision of the MTDS
Although the financing strategy could vary from year to year based on the government’s cost
and risk preferences, the broad objectives of debt management are expected to remain
unchanged as articulated in the Public Debt Policy 2016.
The MoF will review the strategy annually to incorporate changes in macro-fiscal position and
government’s cost and risk preferences.
10 Conclusion
This MTDS covering three fiscal years (from FY 2020/21 to FY 2022/23) fulfills one of the
requirements for risks assessment and monitoring stipulated in the Public Debt Policy 2016.
As required by the public debt policy, this MTDS has outlines financing strategy, based on
rigorous cost and risks analysis, to help achieve the objectives of public debt management.
The financing strategy during medium term is designed at meeting a major share of the
government’s financing needs from external concessional sources to minimize financing
costs— the primary objective for debt management in the medium term.
To facilitate the development of the efficient capital market, the strategy envisages financing
some portion of gross financing need (GFN) from domestic market through regular issuance
of bonds and T-Bills. The implementation of this strategy is expected activate the primary and
secondary market, thus facilitating broader capital market development in the country.
This MTDS will not be a static document. The MoF will review the strategy annually to ensure
that current strategy holds true under changing fiscal and monetary situation in the country.

23
11 Glossary
Average Time to Maturity The weighted average time of maturity of all the principal
repayments in the portfolio.
Average Time to Refixing The weighted average time until all the principal payments in the
debt portfolio become subject to new interest rate
Bid-to-Cover Ratio The total bids received are divided by bid accepted and allotted.
In the case of a bond auction, the ratio indicates how strong the
demand for the government bond is.
Bond A debt instrument that gives the holders the unconditional right
to fixed payments or contractually determined variable payments
on a specified date or date.
Concessional Loans Loans that are extended on terms substantially more generous
than market loans.
Convertible Currency
(CC) Debt
External debt is other than those denominated in Indian Rupee.
Debt Service The payments in respect of both principal and interest.
Exchange rate risks The risk of an investment or instrument changing in value due to
changes in exchange rates
Grace period The period from which the loan agreement is signed to the first
repayment of principal.
Gross Financing Need The fiscal deficit, plus repayments, plus any other transactions
that require financing.
Interest rate risks The vulnerability of funding costs to higher interest rates, for
example, when variable rates are reset and/or fixed rate debt
needs to be refinanced.
The present value of debt The discounted sum of all the future debt services at a given
interest rate.
Public Debt The debt of the public sector (i.e., RGoB, RMA, and Public
Corporations).
Rollover/Refinancing risks The possibility that the Government(borrower) cannot refinance
by borrowing to repay the existing debt that matures.
Treasury Bills The short-term debt instruments issued by the RGoB. Treasury
bills are zero-coupon securities and pay no interest. They are
issued at a discount and redeemed at the face value at maturity.

24