MEDIUM TERM BUDGET POLICY STATEMENT 2012 - 2015 · PDF fileThe 2011 Western Cape Medium Term...
73
Western Cape Government Provincial Treasury MEDIUM TERM BUDGET POLICY STATEMENT 2012 - 2015
Transcript of MEDIUM TERM BUDGET POLICY STATEMENT 2012 - 2015 · PDF fileThe 2011 Western Cape Medium Term...

Western Cape Government Provincial Treasury
MEDIUM TERM BUDGET POLICY STATEMENT 2012 - 2015

Provincial Treasury Budget Management Private Bag X9165 15 Wale Street Cape Town tel: +27 21 483 5618 fax: +27 21 483 6601 www.westerncape.gov.za Afrikaans and isiXhosa versions of this publication are available on request. Email: [email protected] PR 301/2011 ISBN 978-0-621-40465-4

Foreword
The 2011 Western Cape Medium Term Budget Policy Statement (WC MTBPS) outlines the current economic environment, labour market prospects and selected socio-economic realities facing the people of our Province. In so doing, it provides the basis upon which we will assign the provincial budget in the years to come. The allocations that we will make must also speak directly to our goal of delivering an open, opportunity society for all.
In these times of economic hardship and uncertainty, we will assign funding to programmes that achieve the most impact for the most people, whilst recognising that we are not only building a province for today, but also for the future.
We will allocate resources to those areas of highest priority, and to programmes that make the Western Cape Government more efficient and effective in achieving results. Amongst others, we will strengthen our investment in health and education services, invest in key infrastructure projects to create the environment for economic growth, and maximise delivery by co-ordinating our efforts with national and local government and the private sector.
The 2011/12 Adjustments Budget and processes and the engagements leading up to the proposed adjustments were aimed at crafting a sustainable 2012 MTEF Budget for the Province.
In all our endeavours, we recognise that we stand a far greater chance of achieving success if we undertake them with a sense of collective responsibility. By working together toward a common goal, we can create better lives for all.
Alan Winde Minister of Finance, Economic Development and Tourism 23 November 2011


CONTENTS
i
Contents
Chapter 1 Economic Overview 1
Developments in the global economy 2
Medium term economic outlook for South Africa 3
Performance and outlook for the Western Cape economy 4
Labour market trends 6
Implications for budget policy 9
Conclusion 10
Chapter 2 Budget policy response 13
Introduction 13
Budget Policy Framework 14
Partnerships 18
Medium Term Expenditure Priorities 18
Conclusion 39
Chapter 3 The resource envelope and financing issues 43
Provisional transfers from National 44
Provincial own receipts 50
Conclusion and impact on services 54
Chapter 4 Expenditure trends 55
2010/11 Expenditure outcomes 55
2011/12 Mid-year estimates 56
2011 Adjusted Budget 56
Conclusion 58
Annexure A Provincial Strategic Objectives and National Outcomes 59
Glossary 63

MEDIUM TERM BUDGET POLICY STATEMENT 2012 - 2015
ii
Tables Chapter 1: Economic Overview
1.1 Macro-economic projections: 2008 – 2014 4
1.2 Economic performance and outlook for the Western Cape (%) growth in GDP-R
5
1.3 Labour market aggregates, 2008 and 2011 6
1.4 Recent Labour Market Trends, 2010Q3 to 2011Q3 8
Chapter 3: The resource envelope and financing issues
3.1 Fiscal framework of the Western Cape 44
3.2 Phasing in of Equitable Share over the 2012 MTEF 47
3.3 Estimated revisions to conditional grant baseline allocations for the 2012 MTEF
50
3.4 Summary of provincial own receipts by vote 51
3.5 Western Cape own receipts by source 2011/12 – 2014/15 51
Chapter 4: Expenditure trends
4.1 Expenditure by votes, 2010/11 - 2011/12 financial years 55

CONTENTS
iii
Abbreviations
BBBEE Broad Based Black Economic Empowerment
BER Bureau for Economic Research
CBD Central Business District
CNDC Community Nutrition and Development Centres
COP17 17th United Nations Framework Convention on Climate Change Conference of the Parties
CPI Consumer Price Index
CSP Community, Social and Personal Services
DBSA Development Bank of South Africa
ECD Early Childhood Development
EPWP Expanded Public Works Programme
FET Further Education and Training
GDP Gross Domestic Product
GDP-R Gross Domestic Product per Region
GMT Government Motor Transport
HCT HIV Counseling and Testing
ICTs Information and communication technologies
IDC Industrial Development Corporation
IMF The International Monetary Fund
IWRMAP Integrated Water Resource Management Action Plan
MOD Mass Opportunity and Development
MTBPS Medium Term Budget Policy Statement
MTEF Medium Term Expenditure Framework
MVLF Motor vehicle licence fees
NGOs Non-governmental organisations
NHI National Health Insurance
OSD Occupational Specific Dispensation
PES Provincial Equitable Share
PFMA Public Finance Management Act

MEDIUM TERM BUDGET POLICY STATEMENT 2012 - 2015
iv
PGWC Provincial Government of the Western Cape
PRP Provincial Regeneration Programme
PRTs Professional Resource Teams
PSDF Provincial Skills Development Forum
PSOs Provincial Strategic Objectives
PSP Provincial Strategic Plan
PTB Pulmonary tuberculosis
PTMS Provincial Transversal Management System
QLFS Quarterly Labour Force Survey
RAF Road Accident Fund
SA South Africa
saar seasonally adjusted annualised (growth) rate
SETAs Sector Education and Training Authorities
StatsSA Statistics South Africa
U-AMP User Asset Management Plans
UPFS Uniform Payment Fee Schedule
WC MTBPS Western Cape Medium Term Budget Policy Statement
WCARF Western Cape Agricultural Research Forum

1
1
Economic Overview
The pace of economic recovery from what was the worst yet post-war global recession has been moderate, with the economic outlook clouded by risks emanating from the European sovereign debt crisis and slower than anticipated recovery in the US economy. As such, global economic growth forecasts have been downgraded, in line with the current uncertainties.
As an emerging economy, South Africa’s growth prospects are moderate, although more optimistic. The possibility of rising inflation however remains a risk going forward. The Provincial economy is expected to perform at an average annual growth rate of 4.2 per cent between 2011 and 2015, but it remains exposed to global economic uncertainty and volatility via our export markets.
Labour market trends in the Western Cape show higher growth in the provincial working age population than nationally. Employment has remained relatively stable at around 1.8 million individuals over the past year. Increasing the levels of employment will therefore continue to be the single most pressing challenge facing the Province.
Young people between the ages of 15 to 24 and those with incomplete secondary school attainment have a relatively higher unemployment rate when compared to the average unemployment rate for the Province.
The narrow unemployment rate has proven less stable over the past year, but remains similar to the unemployment rate of 12 months earlier at 23.3 per cent. The observed decreasing gap between national and provincial narrow unemployment rates can be explained by the declining discouraged workseeker numbers in the Western Cape relative to the increasing number of discouraged workseekers in the country as a whole.
MEDIUM TERM BUDGET POLICY STATEMENT 2012 - 2015
2
Developments in the global economy
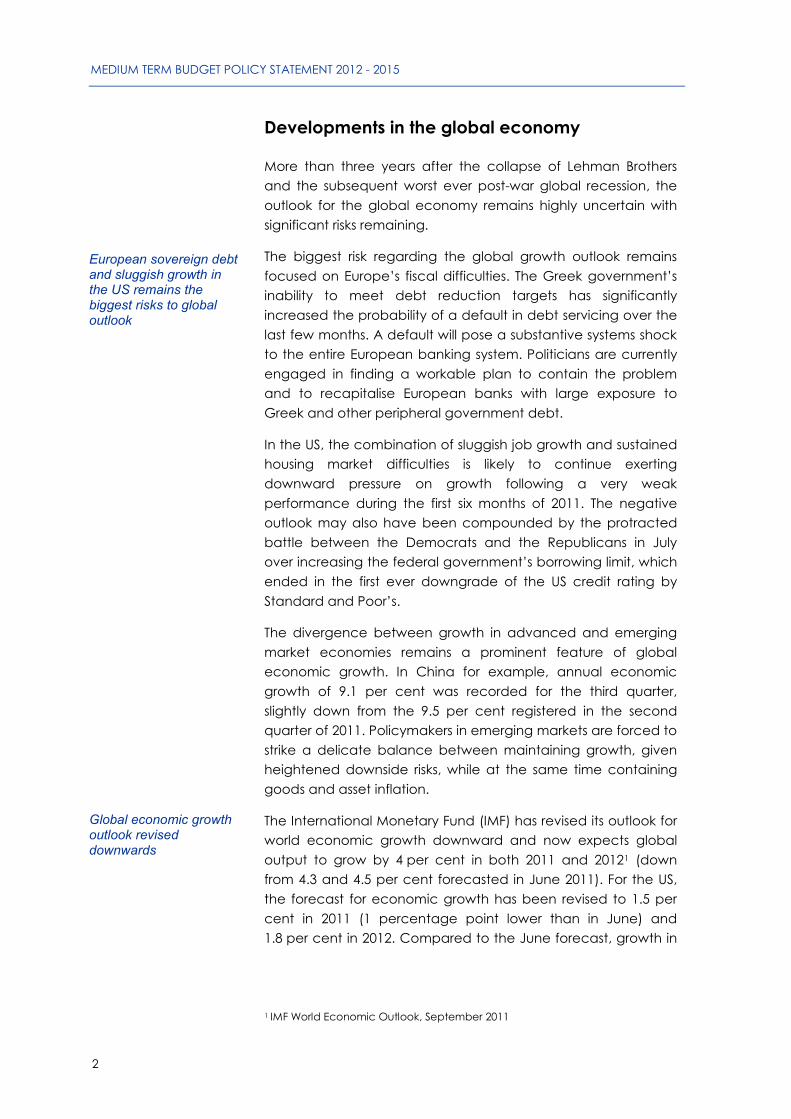
More than three years after the collapse of Lehman Brothers and the subsequent worst ever post-war global recession, the outlook for the global economy remains highly uncertain with significant risks remaining.
The biggest risk regarding the global growth outlook remains focused on Europe’s fiscal difficulties. The Greek government’s inability to meet debt reduction targets has significantly increased the probability of a default in debt servicing over the last few months. A default will pose a substantive systems shock to the entire European banking system. Politicians are currently engaged in finding a workable plan to contain the problem and to recapitalise European banks with large exposure to Greek and other peripheral government debt.
In the US, the combination of sluggish job growth and sustained housing market difficulties is likely to continue exerting downward pressure on growth following a very weak performance during the first six months of 2011. The negative outlook may also have been compounded by the protracted battle between the Democrats and the Republicans in July over increasing the federal government’s borrowing limit, which ended in the first ever downgrade of the US credit rating by Standard and Poor’s.
The divergence between growth in advanced and emerging market economies remains a prominent feature of global economic growth. In China for example, annual economic growth of 9.1 per cent was recorded for the third quarter, slightly down from the 9.5 per cent registered in the second quarter of 2011. Policymakers in emerging markets are forced to strike a delicate balance between maintaining growth, given heightened downside risks, while at the same time containing goods and asset inflation.
The International Monetary Fund (IMF) has revised its outlook for world economic growth downward and now expects global output to grow by 4 per cent in both 2011 and 20121 (down from 4.3 and 4.5 per cent forecasted in June 2011). For the US, the forecast for economic growth has been revised to 1.5 per cent in 2011 (1 percentage point lower than in June) and 1.8 per cent in 2012. Compared to the June forecast, growth in
1 IMF World Economic Outlook, September 2011
European sovereign debt and sluggish growth in the US remains the biggest risks to global outlook
Global economic growth outlook revised downwards

CHAPTER 1: ECONOMIC OVERVIEW
3
the Euro area has also been downwardly adjusted to 1.6 and 1.1 per cent for 2011 and 2012 (from 2.0 and 1.7 per cent previously). The IMF forecasts are however fairly optimistic when compared to those of private sector forecasters.
Medium term economic outlook for South Africa
After recording negative economic growth in 2009, the South African (SA) economy partially recovered during 2010, managing to post growth of 2.8 per cent. The expansion continued at a brisk pace during the first quarter of 2011 with economic activity registering a 4.5 per cent quarter-on-quarter (q-o-q) seasonally adjusted annualised (growth) rate (saar). However, in line with global economic developments, the second quarter of 2011 saw economic growth hit a “soft patch” as growth slowed to 1.3 per cent q-o-q (saar).
Real consumer spending increased by an annual rate of 4.9 per cent during the second quarter of 2011, largely unchanged from the 5 per cent in the first quarter of 2011. However, the q-o-q number revealed a marked slowdown in the growth momentum, with growth decelerating from 5.2 per cent q-o-q (saar) in the first quarter of 2011 to 3.8 per cent during the second quarter of 2011. On the other hand, real fixed investment outlays came in better than expected in the second quarter of 2011 as the public sector put in an improved performance. Overall real fixed investment increased by 1 per cent q-o-q, which resulted in the year-on-year growth rate accelerating to 2.4 per cent, from 1.7 per cent during the first quarter of 2011.
According to the National Treasury, economic growth is expected to accelerate to 3.1 per cent in 2011 and 3.4 and 4.1 per cent in 2012 and 2013 respectively. The Bureau for Economic Research (BER) also expects economic growth to accelerate to 3.1 per cent in 2011, but, in contrast to the National Treasury, expects growth to moderate to 2.8 per cent in 2012 before picking up to 3.6 per cent in 2013.
Moderate economic growth for South Africa expected over the medium term

MEDIUM TERM BUDGET POLICY STATEMENT 2012 - 2015
4
Table 1.1 Macro-economic projections: 2008 – 2014 2008 2009 2010 2011 2012 2013 2014
Percentage change unless otherwise indicatedFinal household consumption 2.2 -2.0 4.4 4.3 3.7 4.4 4.5 Final government consumption 4.7 4.8 4.6 4.4 4.1 4.1 4.1 Gross fixed capital formation 14.1 -2.2 -3.7 2.9 4.5 5.7 6.3 Gross domestic expenditure 3.4 -1.7 4.2 4.1 3.8 4.6 4.6 Exports 1.8 -19.5 4.5 4.0 6.9 7.1 8.0 Imports 1.5 -17.4 9.6 7.6 7.8 8.2 8.4 Real GDP growth 3.6 -1.7 2.8 3.1 3.4 4.1 4.3 GDP inflation 8.9 7.2 8.1 6.7 5.8 6.4 6.0 GDP at current prices (R billion) 2 274.1 2 396.0 2 664.3 2 931.8 3 208.2 3 555.0 3 930.5 Headline CPI inflation 9.9 7.1 4.3 5.0 5.4 5.6 5.4 Current account balance (% of GDP) -7.1 -4.1 -2.8 -3.4 -3.8 -4.0 -4.2
Calendar year Actual Estimate Forecast
Headline SA consumer inflation remains on an upward trend, rising to 5.7 per cent year-on-year in September 2011 – the highest level since early 2010 - since reaching a trough of 3.2 per cent year-on-year 12 months ago. The National Treasury expects CPI inflation to average 5 per cent in 2011 and to be slightly higher in 2012 at 5.4 per cent. The risk of higher inflation remains; as illustrated by the BER’s forecast which sees inflation rise to 6 per cent (higher than the National Treasury estimates) in 2012, from 5 per cent in 2011.
The downbeat global outlook sketched above holds important downside risks for the SA economy, particularly with respect to the performance of exports. Despite the fact that a larger share of our exports now go to fast growing economies such as China and India, customs data shows that approximately a third of SA exports were destined for the EU and US during the first seven months of 2011.
Performance and outlook for the Western Cape economy
Historically, the Western Cape economy has outperformed the national economy in terms of economic growth. This has mainly been as a result of robust growth within the services sector of the economy, with the finance, insurance, real estate and business services as well as the transport, storage and communication sectors in particular, performing well. The Western Cape contracted along with the global and national economies during 2009. However, the contraction of 1.4 per
Risk of rising inflation

CHAPTER 1: ECONOMIC OVERVIEW
5
cent recorded in the Western Cape was slightly less than the 1.5 per cent recorded nationally2.
According to Quantec/BER estimates, the provincial economy returned to positive economic growth in 2010 following the contraction in 2009. Growth for the region is estimated at 2.4 per cent compared to 2.8 per cent for the national economy in 2010. The relatively lower growth of the Western Cape is linked to the structure of the regional economy, in particular the relatively small contribution of the mining sector in the Western Cape, which fared well during the initial phases of the recovery. Other factors such as base effects - the contraction in the Western Cape economy was less pronounced, therefore the “bounce-back” is likely to be more contained - may also have played a role.
Table 1.2 Economic performance and outlook for the Western Cape (%) growth in GDP-R
Description 2009 2010e 2011(f) 2012(f) 2013(f) 2014(f) 2015(f)
Agriculture, forestry & fishing -5.5 0.7 3.1 2 2.7 3.3 3.5 Mining & quarrying 0.5 -8.8 4.4 1 0.9 1.1 1.1 Manufacturing -8.9 3.9 3.5 3.5 3.5 3.6 3.4 Electricity, gas & water 0.5 3.2 1.3 3.3 3.2 3.3 3.2 Construction 6.1 1.6 2.1 5 6.2 6.5 6.7 Wholesale & retail trade, catering & accommodation -2.8 2.6 4.2 3.7 4.1 4 4 Transport, storage & communication 0.7 3 5.3 5.4 5.8 5.8 5.5 Finance, insurance, real estate & business services 0.5 1.9 4.5 5 4.8 5.1 5.2 Community, social & personal services -0.5 0.6 3.2 2.8 3 3 3.1 General government 3.9 2.4 2.2 2.3 2.4 2 2
Total -1.4 2.4 3.9 4.1 4.2 4.3 4.3
Source: Quantec/BER, July 2011 (e = estimate; f = forecast) The medium term prospects for the Western Cape economy are relatively more upbeat. An annual average growth rate of 4.2 per cent is forecast between 2011 and 2015, with Gross Domestic Product per Region (GDP-R) increasing by 4.3 per cent in the outer years of the forecast (2014 and 2015). Growth over the forecast period is likely to be boosted by the services sector with the finance, insurance, real estate and business services as well as the transport, storage and communication sectors again growing robustly.
The downside risks to the regional economic outlook have become more pronounced over the past few months given the continued deterioration in global economic conditions, 2 At basic prices
Provincial economy expected to grow on average by 4.2 per cent between 2011 and 2015
Risk to provincial economy via export market exposure

MEDIUM TERM BUDGET POLICY STATEMENT 2012 - 2015
6
especially with Europe and the US representing a bigger portion of the Western Cape’s export markets than is the case for the rest of South Africa.
Labour market trends
While the South African economy has recovered from the recession, (year-on-year growth in real gross domestic product (GDP) has been positive since the first quarter of 2010), the labour market shows no real sign of recovery. Nationally, the number of individuals unemployed according to the expanded definition has grown by nearly 7 per cent per annum since 2008 and totalled 6.6 million by early 2011.
The reason for this rapid growth is traced back to the surge in the number of discouraged workseekers, which has grown by nearly 25 per cent per annum over the last three years. Around half a million individuals in the Western Cape were unemployed in the first quarter of 2011, up from just under 400 000 in 2008, representing growth of 9.1 per cent per annum over the three-year period. Importantly, discouragement is relatively rare in the Province: while discouraged workseekers are a significant proportion of the expanded labour force nationally (11.3 per cent), they constitute less than one per cent of the Province’s expanded labour force.
Table 1.3 Labour market aggregates, 2008 and 2011
2008Q1 2011Q1 Change Thousands Thousands Thousands Per cent
Western Cape Working Age Population 3 273 3 450 178 1.8 p.a. Employment 1 816 1 789 -26 -0.5 p.a. Narrow Unemployment 393 510 117 9.1 p.a. * Narrow Labour Force 2 209 2 300 91 1.4 p.a. Expanded Unemployment 438 530 92 6.5 p.a. Expanded Labour Force 2 254 2 319 66 1.0 p.a. Discouraged Workseekers 45 19 -26 -24.4 p.a. * South Africa Working Age Population 30 963 32 520 1 557 1.6 p.a. Employment 13 778 13 145 -633 -1.6 p.a. † Narrow Unemployment 4 222 4 365 144 1.1 p.a. Narrow Labour Force 18 000 17 510 -490 -0.9 p.a. Expanded Unemployment 5 400 6 588 1 188 6.9 p.a. * Expanded Labour Force 19 178 19 733 555 1.0 p.a. Discouraged Workseekers 1 179 2 223 1 044 23.6 p.a. *
Note: An asterisk (*) denotes a statistically significant change between 2008 and 2011 at the 95 per cent level of confidence, while a dagger (†) indicates a statistically significant change at the 90 per cent level of confidence.
Source: Own calculations, Statistics South Africa (2008; 2011)
Lower levels of discouraged work seekers in the Western Cape

CHAPTER 1: ECONOMIC OVERVIEW
7
Although not confirmed in terms of statistical significance, it appears that the labour force continues to shift towards higher educational attainment over time, a trend observed both provincially and nationally. Indeed, the only statistically significant changes observed in the structure of the provincial labour force are the decline in the number of individuals with no formal education (falling from around 40 000 in the first quarter of 2008 to under 20 000 three years later) and the rise in the number with degrees (growing by an average annual rate of 10.7 per cent per annum). Those with incomplete secondary education (Grade 8 through Grade 11) account for 38 per cent of the labour force, while matriculants account for a further 29.6 per cent.
The primary sector is the smallest of the three major sectors, accounting for around 8 per cent of formal employment in the Western Cape. Approximately 25 per cent of employment is located within the secondary sector, while the tertiary sector employs two-thirds of the formal workforce. The dominance of the services sector within national and provincial employment means that three of the four largest employment sectors fall within the tertiary sector. The Community, Social and Personal (CSP) services industry is the largest industry in terms of employment, employing roughly 25 per cent of the formal workforce. It is followed by wholesale and retail trade (around 20 per cent of formal employment), manufacturing (18 per cent) and financial and business services (15 per cent).
The informal sector is relatively small in South Africa and even more so in the Western Cape. Just 11.1 per cent of provincial employment is within the informal sector, compared to around one-quarter nationally. The informal sector in the Province is dominated by men, those under the age of 45 years, and those without matric.
The key national patterns of labour market disadvantage – by race, gender, age and education – are generally evident within the provincial labour market. Relative to their shares of the working age population or the labour force in the Western Cape, Africans are over-represented in unemployment and under-represented in employment. Conversely, Whites are over-represented in employment and under-represented in unemployment. As a result, unemployment rates are highest amongst Africans, followed by Coloureds and then by Whites. The disadvantaged positions of young people and of those with poor education within the labour market remain: unemployment amongst 15 to 24 year olds is twice the
Decline in number of individuals with no education
Community, social and personal services industry largest employer of formal workforce
Higher unemployment rates amongst youth and those with primary or incomplete secondary education

MEDIUM TERM BUDGET POLICY STATEMENT 2012 - 2015
8
provincial average, while being a third higher than the provincial average amongst those with primary or incomplete secondary education.
The most recent labour market statistics estimate employment in the Western Cape at 1.8 million in the third quarter of 2011, a level marginally higher than a year ago. Nationally, employment has increased by 340 000 since the third quarter of 2010, to reach just over 13.3 million. Much of this increase occurred during the past quarter (the third quarter of 2011). In the 12 month period to the second quarter of 2011 there had been little employment response to recent expansions in output. The number of narrowly unemployed individuals in the Province increased slightly over the period to reach 550 000 individuals, with the unemployment rate now standing at 23.3 per cent. This is similar to the national rate of 25 per cent.
Table 1.4 Recent Labour Market Trends, 2010Q3 to 2011Q3
2010Q3 2010Q4 2011Q1 2011Q2 2011Q3 Change Absolute Relative
Western Cape Aggregates (Thousands) Working Age Population 3 390 3 403 3 417 3 430 3 444 54 1.6 Employment 1 754 1 772 1 784 1 805 1 806 52 3.0 Narrow Unemployed 527 498 510 504 550 23 4.4 Narrow Labour Force 2 281 2 271 2 295 2 309 2 356 75 3.3 Broad Unemployed 565 522 529 538 580 15 2.7 Broad Labour Force 2 319 2 294 2 313 2 343 2 386 67 2.9 Discouraged Workseekers 38 24 19 34 30 -8 -21.1 Rates (per cent) Narrow Unemployment 23.1 21.9 22.2 21.8 23.3 0.2 percentage points Broad Unemployment 24.4 22.8 22.9 23.0 24.3 -0.1 percentage points Narrow LFPR 67.3 66.7 67.2 67.3 68.4 1.1 percentage points Broad LFPR 68.4 67.4 67.7 68.3 69.3 0.9 percentage points South Africa Aggregates (Thousands) Working Age Population 32 072 32 193 32 314 32 435 32 555 483 1.5 Employment 12 975 13 132 13 118 13 125 13 318 343 2.6 Narrow Unemployed 4 396 4 137 4 364 4 538 4 442 46 1.0 Narrow Labour Force 17 371 17 269 17 482 17 663 17 760 389 2.2 Broad Unemployed 6 429 6 287 6 587 6 745 6 646 217 3.4 Broad Labour Force 19 404 19 419 19 705 19 870 19 964 560 2.9 Discouraged Workseekers 2 033 2 150 2 223 2 207 2 204 171 8.4 Rates (per cent) Narrow Unemployment 25.3 24.0 25.0 25.7 25.0 -0.3 percentage points Broad Unemployment 33.1 32.4 33.4 33.9 33.3 0.2 percentage points Narrow LFPR 54.2 53.6 54.1 54.5 54.6 0.4 percentage points Broad LFPR 60.5 60.3 61.0 61.3 61.3 0.8 percentage points
Note: Figures presented here may differ slightly from those published in the Provincial Economic Review and Outlook (PERO) 2011 due to the fact that Statistics South Africa defines the working age population as those aged 15 to 64 years, while the analysis in the PERO 2011 included 65 year olds as part of the working age population.
Source: Own calculations, Quarterly Labour Force Survey (2010Q2 - 2011Q2)
Provincial unemployment rate of 23.3 per cent

CHAPTER 1: ECONOMIC OVERVIEW
9
A key difference in the provincial and national labour markets remains the relative lack of discouraged workseekers within the Western Cape. The Quarterly Labour Force Survey (QLFS) data estimates fewer than 40 000 discouraged workseekers in the Province in each quarter presented in the table, while nationally there were 2.2 million in the third quarter of 2011, up 8.4 per cent over the period. This translates into significantly different broad unemployment rates between the Western Cape and the country as a whole. In the third quarter of 2011, broad unemployment is estimated at 25 per cent in the Province compared to 33.3 per cent nationally.
Implications for budget policy
The current moderate economic growth rates and stagnant employment levels are indicative of the structural imbalance between employment growth and economic growth. Facilitating the country and the Province’s development needs requires faster economic growth and higher levels of labour absorption. Improving competitiveness of industries through partnerships with business and labour is key in this regard.
The Province has a revealed comparative advantage in a number of sectors (e.g. finance and insurance, business services, wholesale and retail trade and tourism). The tertiary sectors are again leading the economic recovery and benefit from prevailing macro-economic conditions (favourable terms of trade, strong currency, buoyant domestic market and low inflation and interest rates). However, the regional manufacturing sector should not be neglected with the constraints holding them back and possibilities for growth to be better identified and to be systematically followed through.
We need to unlock the real growth potential of the export market (currently dominated by agricultural produce and the food value chain which together represent 37 per cent of Western Cape exports). Support for the agriculture value chain must be maintained and even expanded, but it is also necessary to recognise the need to diversify the export base of the Western Cape by growing exports of tradable services and manufactures.
Improving competitiveness of industries through partnerships with business and labour is key

MEDIUM TERM BUDGET POLICY STATEMENT 2012 - 2015
10
As government, special attention needs to be paid to linkages within and across promising sectors, to acknowledge good business results and systematically develop skills and infrastructure where it will have the greatest impact. Also, it is critical to address the high levels of youth unemployment. The Province therefore needs to continually improve education outcomes and capitalise on its Expanded Public Works Programme (EPWP) and jobs fund applications.
As a concomitant action, government can play a role in reducing constraints on the formal sector and the informal sector. The informal sector in the Western Cape is shown to be relatively small (QLFS data shows under 200 000 people employed in the informal sector). However, support for this sector may encourage its growth, providing gainful employment and access to wage income for the unemployed. Barriers to entry include infrastructure, access to basic facilities, credit and lack of business skills.
One of the strategies to assist a struggling economy is to direct government expenditure to areas where it could have an impact. These relate to the procurement of Goods and Services.
The Western Cape Provincial Government spends approximately R10 billion annually on the procurement of Goods and Services. Efforts will be directed to improve the development and inclusion of service providers to benefit from government procurement initiatives.
Conclusion
The recent global economic downturn has emphasised interconnectedness of economies across the globe. Moderate global economic growth, coupled with the risks embodied in the European sovereign debt crisis, casts greater uncertainty on growth forecasts going forward.
The South African economy is expected to grow moderately over the medium term, with greater optimism towards the outer years. The risk of higher inflation however remains.
While the impact of the recession on the Provincial economy was substantial, forecasts point to an optimistic outlook for the regional economy. The provincial economy nonetheless remains exposed to the risks plaguing the global economy via the export market channel.

CHAPTER 1: ECONOMIC OVERVIEW
11
In order to take advantage of the more optimistic conditions within emerging market economies, the regional economy should look towards increasing the labour absorptive capacity of the economy whilst pursuing growth in industries with an identified comparative advantage. The regional economy should therefore look towards greater competitiveness, more diversity in the basket of export products and new export destinations. Partnerships, particularly at the local level, will have to play an increasingly important role in economic development activities.


13
2
Budget policy response
Introduction
A review of the socio-economic conditions in the Province serves as a reference point in determining budget policy and its priorities. Compared to the rest of South Africa, the Western Cape population is relatively better-off in terms of certain socio-economic indicators such as average income, health status and municipal services. However, compared to other developing countries this is not the case and many people are still poor, the quality of education is a barrier to economic growth and there are a number of social ills that require Government’s attention. Some of these challenges are already receiving the appropriate attention and efforts to address them are on-going.
Government departments, public entities, municipalities, the private sector and communities all have a role to play in addressing the most pressing socio-economic challenges facing the Province.
Leadership, concomitant funding, effective stewardship of resources and supportive administrative processes and systems are amongst the most important ingredients in response to the economic environment and other key socio-economic challenges.
At the national level, the adoption of the 12 National Outcomes aims to focus government efforts at all three spheres. While the further evolvement of the Provincial Strategic Objectives have also been on-going, with some good progress in the further development of strategic directives and formation of workgroups to action delivery and monitor progress towards achieving its intended objectives.1
1 Both the 12 National Outcomes and the Provincial Strategic Objectives are
set out in Annexure A.

MEDIUM TERM BUDGET POLICY STATEMENT 2012 - 2015
14
The Province’s budget policy priorities aim to address the current socio-economic challenges facing the Western Cape, and are reflected in the key spending plans of the Province over the medium term. The Western Cape Government has prioritised support to economic growth that will address poverty and create jobs, investment in infrastructure such as schools, health facilities and roads as well as support and co-funding of catalytic infrastructure, which include the telecommunications infrastructure and other projects. Efforts are also directed towards improvements in education and health, increasing safety, reducing poverty and promoting social inclusion. Further efforts aim to ensure the sustainability and the optimal use of the Province’s natural resources.
Budget Policy Framework
Given the economic environment, the counter-cyclical fiscal policy stance previously adopted in South Africa will continue to be enforced. South Africa’s countercyclical policy is designed to steady the economy and protect core social and economic programmes from unnecessary volatility. In practice, at a national level, a government that pursues a countercyclical policy should run a surplus when the economy is doing well in order to spend more and run a deficit when the economy is faltering. A higher fiscal deficit was an appropriate response during the downturn. However, as the economy’s growth rate increases, the rate of growth in government spending needs to moderate. Government will therefore need to reduce the level of borrowing in the years ahead.
Although recovery is on track for the South African economy, it is insufficient to increase aggregate expenditure allocations. Therefore a key message from the National Medium Term Budget Policy Statement 2011 is that there will be a fiscal tightening over the 2012 Medium Term Expenditure Framework (MTEF) period.
Government expenditure is funded through tax revenues and all indications are that tax revenue is expected to be R13 billion less than the R729 billion estimate, when the National Minister for Finance tabled the National Budget in February 2011. Government spending, at a national level, between 2002/03 and 2009/10, as a share of GDP has however increased from 27.2 per cent to 33.8 per cent. It is also expected that Government expenditure, for the first time in 2012/13, would surpass the R1 trillion level.
Province’s budget policy priorities aim to address the current socio-economic challenges
Fiscal tightening over the 2012 Medium Term Expenditure Framework (MTEF) period

CHAPTER 2: BUDGET POLICY RESPONSE
15
Government debt is set to rise to about 40 per cent of GDP by 2015, after which it should stabilise and decline. Over the next three years, government’s share of GDP will need to moderate to avoid an unwarranted and unsustainable future debt burden. The budget deficit rises to 5.5 per cent in 2011/12 as a result of lower than projected revenue, and moderates towards 3 per cent by 2014/15.
The key message from the current economic environment is that serious reprioritisation within baselines and between institutions within a function that contribute to particular outcomes, is thus the only mechanism available to fund government priorities more extensively.
Therefore the expenditure plans that will be taken up in Budget 2012 will have to be crafted within the constraints of the restricted fiscal space as the focus now is on fiscal consolidation to reduce government deficits.
Over the medium term, fiscal consolidation will be accompanied by shifts in the composition of public expenditure from growth of the wage bill and recurrent expenditure towards infrastructure investment and economic development. Public infrastructure backlogs are a constraint to faster growth, and the fiscal stance therefore has to allow for stronger growth in public sector capital formation and improved maintenance of infrastructure.
The focus is therefore on prioritising spending that strengthens the productive base of the economy with increased expenditure on capital and maintenance infrastructure. Expenditure on social services, mainly health and education will be maintained and the focus is really on improving the efficiency and effectiveness of that expenditure.
Protecting social services expenditure needs to be balanced with expenditure that will have a greater impact on the capacity of the economy and impact on the community.
The performance of the public sector is also a crucial element to improve the socio-economic situation and so efforts to improve value for money are of the utmost importance. Provincial departments have been requested to identify savings on non-core service delivery activities/items to ensure that funds are directed on an on-going basis to fund service delivery, rather than non-essential spending.
Reprioritisation of funding in baselines is the only viable mechanism to extensively fund government priorities
MEDIUM TERM BUDGET POLICY STATEMENT 2012 - 2015
16
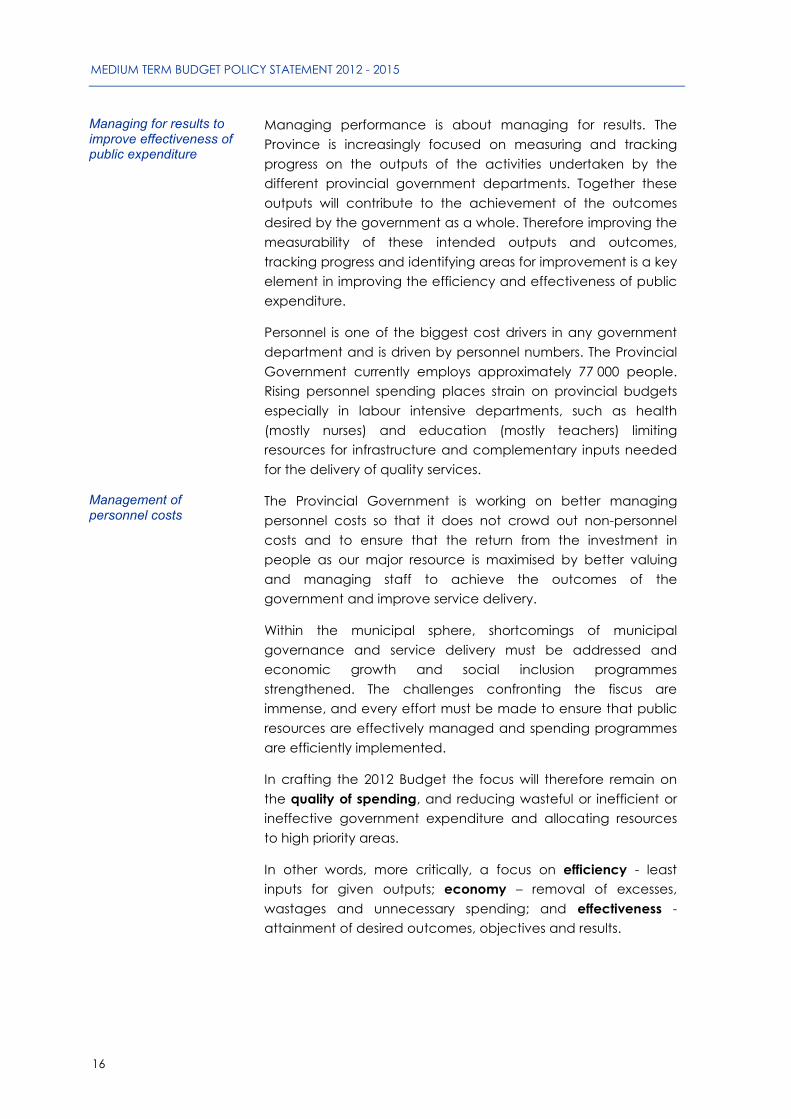
Managing performance is about managing for results. The Province is increasingly focused on measuring and tracking progress on the outputs of the activities undertaken by the different provincial government departments. Together these outputs will contribute to the achievement of the outcomes desired by the government as a whole. Therefore improving the measurability of these intended outputs and outcomes, tracking progress and identifying areas for improvement is a key element in improving the efficiency and effectiveness of public expenditure.
Personnel is one of the biggest cost drivers in any government department and is driven by personnel numbers. The Provincial Government currently employs approximately 77 000 people. Rising personnel spending places strain on provincial budgets especially in labour intensive departments, such as health (mostly nurses) and education (mostly teachers) limiting resources for infrastructure and complementary inputs needed for the delivery of quality services.
The Provincial Government is working on better managing personnel costs so that it does not crowd out non-personnel costs and to ensure that the return from the investment in people as our major resource is maximised by better valuing and managing staff to achieve the outcomes of the government and improve service delivery.
Within the municipal sphere, shortcomings of municipal governance and service delivery must be addressed and economic growth and social inclusion programmes strengthened. The challenges confronting the fiscus are immense, and every effort must be made to ensure that public resources are effectively managed and spending programmes are efficiently implemented.
In crafting the 2012 Budget the focus will therefore remain on the quality of spending, and reducing wasteful or inefficient or ineffective government expenditure and allocating resources to high priority areas.
In other words, more critically, a focus on efficiency - least inputs for given outputs; economy – removal of excesses, wastages and unnecessary spending; and effectiveness - attainment of desired outcomes, objectives and results.
Managing for results to improve effectiveness of public expenditure
Management of personnel costs
CHAPTER 2: BUDGET POLICY RESPONSE
17
National policy environment
The National Planning Commission has identified poverty and inequality as the two main deterrents to achieving a better South Africa for all who live in it. In its task to set a vision for the Country and subsequently to develop a plan to achieve this vision by 2030, the Planning Commission identified nine challenges that need to be addressed in order for South Africa to tackle poverty and reducing the inequality. These areas include:
1. Eliminating poverty and reducing inequality;
2. Poor education outcomes and too few South African’s employed;
3. Poorly located and inadequate infrastructure limits social inclusion and faster economic growth;
4. South Africa’s growth path is highly resource-intensive and unsustainable;
5. Spatial challenges continue to marginalise the poor;
6. Public health system confronts a massive disease burden;
7. Performance of the public service is uneven;
8. Corruption undermines state legitimacy and service delivery; and
9. South Africa remains a divided society.
The Commission presented its National Development Plan for South Africa on 11 November 2011. The Plan amongst other envisions a South Africa in 2030 and the efforts required to address the nine challenges highlighted above. It highlights that South Africa would have to create 11 million more jobs and also estimates that paying for investment into infrastructure, should ultimately result in increased charges in the short and medium term to make services more financially stable. The Plan recommends that Government should provide for greater certainty in the mining and agricultural sectors so as to attract much needed Foreign Direct Investment; and that the economy must become more labour intensive in the interim, while bolstering the skills levels of the workforce in the long term.
The Western Cape through its provincial departments and entities, have identified amongst others the same nine elements or challenges that are bedeviling the reduction of poverty and reducing inequality. Their responses are taken up in the
Poverty and inequality as the two main deterrents to achieving a better South Africa
National Development Plan envisions a South Africa in 2030
MEDIUM TERM BUDGET POLICY STATEMENT 2012 - 2015
18
Provincial Strategic Objectives. The provincial budget and spending plans therefore reflect the provincial response to these and the desired National outcomes.
Partnerships
The establishment of partnerships with stakeholders, which include the other two spheres of government (local and national), private sector, labour and civil society is crucial to the sustainability and success of Government programmes. Partnerships with communities are also important to enhance community programmes and empower communities to take greater responsibility for their improving their situation.
To find synergy through partnerships, the three spheres of government and amongst provincial departments, have already progressed with improved intergovernmental relations. These synergies are in the main through the interface between the provincial and local governments within the Province and aim to achieve common objectives to improve service delivery for the people of the Western Cape. The partnership between the Province, the City of Cape Town and other municipalities are important in order to locate and direct services and infrastructure spatially so as to achieve the desired impact.
The introduction and implementation of a system to integrate and coordinate strategic engagements and align national delivery obligations to Provincial Strategic Objectives and priorities are through the Provincial Transversal Management System.
Medium Term Expenditure Priorities
Economic growth and job creation
For the country and the Province to facilitate its development needs, it requires faster economic growth and higher levels of labour absorption. This would require improving the competiveness of industries through partnerships with business and labour.
The Province needs to address the structural imbalance between employment growth and economic growth. Whereas the real economy in terms of regional GDP expanded by close to 45 per cent between 2001 and 2010, the regional workforce only grew by close to 16 per cent over this period.
Faster economic growth and higher levels of labour absorption is required

CHAPTER 2: BUDGET POLICY RESPONSE
19
The mismatch that arises in the labour market from growth being concentrated in the skills-intensive services industries rather than in the semi- and unskilled labour absorbing primary and secondary industries has so far proven to be a difficult conundrum to fix.
The South African expansionary monetary and fiscal policy environment has provided some cushioning to the effects of the recent recession and contributed to the revival of the domestic economy in the latter part of 2009. These effects, such as increased public debt levels and higher unemployment, will however continue to challenge growth prospects in future years.
In response to the high unemployment, the Provincial Strategic Objective of creating opportunities for growth and jobs recognises that economic growth is the foundation for development. Unemployment will be addressed and poverty reduced through creating an investor and growth friendly environment; creating an enabling environment, providing demand led, private sector driven support to growth sectors; and developing the skills required by the growth sector capitalising on labour absorption through amongst others, the Expanded Public Works Programme and Jobs fund, albeit of a temporary nature to cushion the effects of unemployment. The Provincial Strategic Objective of creating opportunities for growth and development in rural areas is to contribute to this goal.
It is accepted that higher economic growth objectives can be achieved from infrastructure investment in regions of economic agglomeration. Faster economic growth in provinces will generate faster growth and more fiscal resources for the whole economy.
The Diagnostic Overview of South Africa developed by the National Planning Commission indicated that poorly located and inadequate infrastructure limits social inclusion and faster economic growth. Successful countries generally invest at high rates and are continually modernising public infrastructure to suit their economic, settlement and trade patterns. South Africa has effectively missed a generation of infrastructure modernisation.
Public investment in both new and existing infrastructure falls far short of what is needed to meet the country’s economic and social requirements. The hurdles in economic infrastructure are complex, partly because of the cost of modernising
Creating opportunities for growth and jobs

MEDIUM TERM BUDGET POLICY STATEMENT 2012 - 2015
20
infrastructure while also helping to shift the production structure to suit the needs of an economy. The Province therefore has to expand infrastructure to suit its specific activities while at the same time investing in the facilities required for a more labour-absorbing, knowledge intensive economy.
Overall, public infrastructure backlogs in the Western Cape continue to be a constraint on faster growth and the fiscal stance is to allow for stronger growth in public sector capital formation and improved maintenance of infrastructure. Furthermore, improved alignment with local government is required to address shortcomings in municipal infrastructure delivery, and feedback into contributions to poverty reduction programmes.
Recent research on the “Role of Provinces in Economic Development” has concluded that:
• Government should embrace spatial asymmetry as a dynamic force towards accelerated economic growth and the reduction of structural poverty for the country. Spatial asymmetry or ‘uneveness’ is inherent to economic growth – asymmetry can refer to geographical factors or may refer to spatial asymmetry of skills, economic infrastructure and institutions that are pre-requisites for accelerated economic growth; and
• Cities and regions within a country are the growth engines and that this does not hold true for an entire country. Regions that already have some economic success are more likely to grow faster than other regions, because successful regions have individuals, firms and industries with the ability to learn. Cities and regions may grow where the conditions, such as those outlined above are present.
The provincial economic sector departments consisting of the Department of Transport and Public Works, Agriculture, Environmental Affairs, Economic Development and Tourism and Human Settlements have established five workgroups developing action plans to grow the economy and create employment. Amongst these are establishing the Western Cape Economic Development Partnership; facilitating skills development; promoting and coordinating the Expanded Public Works Programme; investing in provincial and municipal bulk infrastructure and generally creating an enabling economic environment.
Public infrastructure backlogs in the Western Cape continue to be a constraint
Provincial economic sector departments to develop action plans to grow the economy and create employment

CHAPTER 2: BUDGET POLICY RESPONSE
21
Expanded Public Works Programme and the Jobs Fund
Coordination, monitoring and evaluation of the Expanded Public Works Programme (EPWP) in the Province reside within the ambit of the Department of Transport and Public Works. The nationally set target of 40 599 EPWP 100-day work opportunities for 2010/11 was exceeded overall in the Province, with the achievement of 51 700, 100-day work opportunities, due to an increased level of participation of municipalities in the programme.
The National Jobs Fund (R9 billion) was introduced this year and the call for funding requests raises opportunities to co-finance public and private sector projects that will significantly contribute to job creation. The Fund is aimed at supporting initiatives that pilot new and up-scale existing innovative approaches to employment creation while targeting the youth to acquire skills while being productively employed.
The Department of Transport and Public Works will continue to invest in amongst others: infrastructure that will enable economic growth and development and efforts that will facilitate improved access to economic opportunity. The Department will position itself as coordinator and facilitator of the public transport strategy and the championing of a safe and efficient integrated transport system in the Province.
Infrastructure
Health infrastructure
User Asset Management Plans (U-AMP) address infrastructure requirements for the full continuum of health care services through a network of hospitals, clinics, community health centres, mental health facilities, forensic pathology facilities and the Emergency Medical Services facilities.
Various new community health centres are under construction and planned for construction over the MTEF.
The Department of Health is progressing well with the construction of both the Khayelitsha (to come on stream by January 2012) and the Mitchell’s Plain Hospitals, while the revitalisation of the George, Worcester and Paarl Hospitals continues. Various new community health care centres are under construction or are planned for construction over the MTEF period.
A total number of eighteen Forensic Pathology Laboratories are planned which include two M6 laboratories at Salt River and

MEDIUM TERM BUDGET POLICY STATEMENT 2012 - 2015
22
Tygerberg Hospital and five M3 laboratories at Paarl, George, Worcester, Stellenbosch and Oudtshoorn.
Education infrastructure
The Province faces serious backlogs in terms of maintenance of their current educational facilities. According to the draft User Asset Management Plan (June 2011) it is estimated that more than R700 million per annum is required over the next three financial years to address maintenance backlogs, but only about R120 million per year is available, which leaves a substantial gap. The Department of Education intends to re-look the total funding available for infrastructure and if possible to reprioritise away from capital spending (new infrastructure) to maintenance. The intention is also to, in collaboration with the Department of Transport and Public Works (the implementing department for infrastructure), work smarter in order to obtain better value for the investment in maintenance. Furthermore, the plan is also to design strategies that will optimise the labour component in infrastructure investment and to maximise EPWP opportunities to assist with the creation of jobs and so addressing some of the unemployment in the Province.
Although huge backlogs also exist in term of new infrastructure requirements the Department is to set-up key infrastructure planning tools to progressively move to more credible and robust U-AMPs in the future. The Department will also pilot the process of mapping school infrastructure school infrastructure provision which will allow the testing, modification and ultimate adoption of Interim Planning Guidelines (norms and standards) as well as several other aspects of the planning process (procurement strategies, expansion at existing well performing schools rather than complete new schools, etc.). These initiatives should enable the Department to respond to infrastructure needs more efficiently and cost effectively in the future and optimising the investment in educational facilities.
Maintenance
Although the intention is to allocate additional maintenance funding, it will not be sufficient to address the existing maintenance backlogs. However, the replacement of the most dilapidated facilities should assist in addressing the maintenance backlog. It remains a challenge to strike an optimal balance between the demand/need for new infrastructure against the maintenance of existing assets.
Need to strike an optimal balance between the need for new infrastructure and maintenance of existing assets

CHAPTER 2: BUDGET POLICY RESPONSE
23
Investment in preventative maintenance extends the lifespan of government assets, improves legislative compliance and also has the potential to substantially contribute to Government’s socio-economic objectives.
The maintenance of infrastructure can also contribute to urban regeneration as most infrastructure is situated in the urban areas. Infrastructure spending provides opportunities to use Government procurement to advance transformation of the economy, particularly as it relates to improvement in the country’s skills base, contractor development, Broad Based Black Economic Empowerment (BBBEE), the Expanded Public Works Programme, etc.
The particular focus will be on labour intensive infrastructure maintenance programmes that will contribute to creating job opportunities.
The maintenance of infrastructure includes: day-to-day operations to maintain functionality; preserving facilities and their components to prevent failure or mitigate deterioration, and; the rebuilding or restoring of facilities through additions, upgrades or alterations.
Roads Infrastructure
Roads infrastructure maintenance also provides opportunities to improve the economic prospects of the country and Province and contribute to the many socio-economic benefits, which they may hold.
These opportunities include transformation in the procurement and delivery methods through preferential procurement, contractor development and graduation of contractors, skills development and employment.
The Department of Transport and Public Works continuously strives towards improving the condition of the surfaced road as well as the gravel road networks.
The Department has prioritised maintenance in an attempt to start addressing remaining backlogs. The emphasis on the backlog improvements follows the strategic thrust of reducing the road condition backlogs by 2014. The focal areas include keeping busy roads in good condition but also to improve those that are in a poor and very poor condition, but that have socio-economic significance.
Labour intensive infrastructure maintenance programmes

MEDIUM TERM BUDGET POLICY STATEMENT 2012 - 2015
24
A number of Gravel Road Upgrade Projects in the rural portions of the proclaimed road network have been identified from local economic, street network and integrated transport plans for those regions, and will form the basis of a focused response to the National Rural Access Framework.
The identification of the Municipal Main Road Projects for rehabilitation forms part of an intensive collaborative process of decision-making which involves local authorities, district municipalities and Provincial Government.
An amount of R300 million has been set aside particularly for additional expenditure on roads infrastructure with demonstrable economic impacts.
One of the biggest initiatives proposed by the Western Cape Government has been the Provincial Regeneration Programme (PRP). Funding of R400 million, for this purpose has been provided in the 2011 MTEF, with the understanding that this would be leveraged with the other spheres of government and private sector.
Some of the broad objectives of this project aim to maximise the socio-economic footprint in terms of inner city renewal, bring about synergy with other mooted projects within the broader inner city precinct and have an added advantage of minimising the burgeoning rental costs for office accommodation.
Although the original intention was to focus on the Central Business District (CBD) or inner City the PRP expands beyond the CBD. The PRP aims to: activate the re-development of the designated precincts (and others that may be identified from time to time) by using provincial properties as strategic catalysts to mobilise new investments, amongst other, into the city centre by key stakeholders, but with special reference to the private sector and state-owned enterprises.
Corresponding projects that are being considered by the Province include the Somerset precinct redevelopment, expansion of the Cape Town International Convention Centre and Founders Garden precinct. These projects are potential partnerships with the private sector and City of Cape Town.
In this regard a number of role-players are collaborating in the development of detailed project proposals for the upgrade of the Government Office Accommodation Precinct, taking into account potential socio-economic, spatial and costing implications and benefits.
Provincial Regeneration Programme to mobilise new investments

CHAPTER 2: BUDGET POLICY RESPONSE
25
The Provincial Regeneration Programme is advancing as a flagship programme for the Provincial Government Western Cape and has expanded from the 8 identified precincts in the CBD to 18 precincts in the Province. These towns comprise of, but are not limited to, Worcester, George, Beaufort West, and Paarl.
Human settlements
The Western Cape Department of Human Settlements estimated the housing backlog in the Province at around 426 711 units in 2010. Current and future delivery targets will focus on providing an increasing number of well-directed and inclusive housing opportunities and upscaling the provision of basic services and implementation of serviced sites.
An improved service delivery model is to be introduced which includes appointing human settlement Professional Resource Teams (PRTs) to assist the Department and municipalities. These PRTs will address capacity gaps and skills scarcity in specialised areas at the provincial and local spheres of government and will improve governance and planning by ensuring that a pipeline of properly inevitable projects are ready for expenditure and implementation. The Department has also established a Programme Management Office to provide a central hub for all project-related information, to develop and maintain standard operating procedures, and to ensure the application of appropriate project management methodologies.
Creating an Enabling economic environment
The Department of Economic Development and Tourism is committed to creating an enabling environment for stimulating trade and investment and establishing and expanding businesses geared towards growing the economy and creating employment opportunities.
The Department together with the conceived Western Cape Economic Development Partnership will continue to work towards the development of an economic development vision and strategy for the Province.
The Province has adopted a dual approach sector development. Priority sectors include the high growth propulsive sectors that would generate considerable new economic growth opportunities (such as the oil, gas and marine industries, information and communications technology business
Western Cape Economic Development partnership to be established
MEDIUM TERM BUDGET POLICY STATEMENT 2012 - 2015
26
processing, the green economy and financial services). At the same time, sectors that would be able to provide a foundation for sustained employment in industries such as fashion, textiles and agro processing will also prioritised.
A number of initiatives have been identified to improve competitiveness within the Province. For 2012/13 this approach, in partnership with Special Purpose Vehicles, will embark on business assessments aimed at identifying turnaround solutions (where applicable) and introducing productivity improvement processes to improve competitiveness and capacity of local suppliers. The strategy includes the reduction of Red Tape and the strengthening of clustering initiatives to enhance competitiveness, business efficiency and economic performance.
Together with agencies such as Wesgro and other parastatals, including the Industrial Development Corporation (IDC) and Development Bank of South Africa (DBSA), feasibility studies and further research is to be conducted on the funding and implementation of large-scale catalytic projects for the region. Amongst these catalyst projects being considered are the Saldanha Industrial Development Zone, Cape Town Port, Health Technology Park and Hout Bay harbour development. These projects, although initiated in the Province, would require resources from the national and local government as well as the private sector to be implemented fully.
Further plans are to develop a coherent provincial telecommunications infrastructure strategic framework and implementation plan to assist municipalities and provincial departments to foster greater economic growth in the region, and to assist in achieving greater effectiveness and efficiencies in government service delivery in the Province.
Tourism marketing will remain an important area to further develop and implement a coordinated tourism marketing strategy within the Province.
A further objective centres on the skills needed by industry and ensuring that these are in place. This endeavour is coordinated via the Provincial Skills Development Forum (PSDF) with programmes leveraging off the existing interactions of the Provincial Government with Further Education and Training (FET) colleges, Sector Education and Training Authorities (SETAs) and other institutions of learning. Areas singled out include artisan training and unemployed youth, with specific reference to
Large scale catalyst projects include the Saldanha Industrial Development Zone
Plans to improve telecommunications infrastructure
Skills development initiatives to focus on artisan training and unemployed youth
CHAPTER 2: BUDGET POLICY RESPONSE
27
projects in rural areas with which to provide young people with work place experience.
Growing the agricultural sector
The agricultural sector requires that the Department of Agriculture considers and responds to land reform, particularly land redistribution programmes for agricultural development; the climate change phenomenon and its impact on the agricultural sector; escalating food prices and food security at regional and household level; skills availability and the overall competitiveness of the agricultural sector.
Five key thrusts are aimed at increasing agricultural production; research and technology; market access; rural development and revitalisation of extension services.
Research is one of the cornerstones to underpin agrarian economic growth and to ultimately address food security, job creation and rural development. A newly formed Western Cape Agricultural Research Forum (WCARF) is to better coordinate and optimise agricultural research efforts and the associated human and infrastructure research and development capacity.
Another commitment is the development of alternative markets for the provincial agricultural sector, continuing to seek partnerships with commodity organisations and also to enhance support to land reform projects. To date the market access programme established various export linkages including wine export agreements with EU countries and supporting 49 producers to access domestic and foreign markets. Included in this initiative is a programme to assist farmers to cope with the stringent barriers to trade and to diversify its export products and mix.
The emerging and re-emerging trade sensitive animal diseases and trade restrictions pose new threats and negatively affect exports of animals and products of animal origin. New crop and animal disease risk assessment and mitigation strategies and contingency plans continue to respond to these challenges.
Rural development is an important vehicle for rural economic growth, an imperative that must create jobs, reduce the skills deficit and grow the rural economy. The Department of Agriculture continues to build on progress made with the implementation of various infrastructure and social upliftment
Agricultural research is critical to address growth in the sector
Developing alternative markets for the provincial agricultural sector
Rural development through government and community platforms

MEDIUM TERM BUDGET POLICY STATEMENT 2012 - 2015
28
projects in rural nodes. However, the socio-economic environment in rural nodes remains challenging and requires well-structured platforms where joint planning and continuous dialogue have to take place.
Ensuring sustainable growth
In ensuring a growth path that is resource efficient and sustainable, the Department of Environmental Affairs and Development Planning focuses on the improvement of pollution and solid waste management, the protection of biodiversity, and fostering provincial, regional and local spatial planning. The Department also promotes associated environmental and land development management, coastal management as well as law enforcement and monitoring.
CapeNature’s mission, as the Department’s main implementing agent, remains “the establishment of biodiversity conservation as the foundation of a sustainable economy in the Western Cape”.
A revised and updated Provincial Spatial Plan is planned for completion by the end of the 2012/13 financial year. This Plan will indicate areas for development as well as provide predictability to investors as to where the best development opportunities are, and in so doing serve as an instrument to achieve better co-ordination and sustainability of such investment.
The Western Cape continues to display significant milestones in developing climate change and sustainable energy policies and strategies. The Provincial Government will be participating in the 17th United Nations Framework Convention on Climate Change Conference of the Parties (COP17) scheduled to take place in Durban, KwaZulu-Natal during the latter part of November and the preceding weeks of December 2011. The participation at COP17 will serve as a platform from which to draw information to further advance capacity building and awareness of the climate change agenda.
The climate change phenomenon will challenge the use of natural resources, particularly in the agricultural sector as it impacts on the availability of water and ultimately food security. Through strategic intervention, the Department of Environmental Affairs and Development Planning initiated the development of an Integrated Water Resource Management Action Plan (IWRMAP) for the Western Cape that is scheduled for finalisation and approval within the 2012/13 financial year.
Advancing capacity building and awareness of the Climate Change Agenda
CHAPTER 2: BUDGET POLICY RESPONSE
29
Improving Education Educational performance in the Western Cape is relatively higher than in other provinces but the quality of education still lags that of developed countries. Many primary school children do not reach the requisite performance norms in the Annual National Assessment. Although literacy rates and numeracy rates are improving, they are still low by international standards.
An important and positive trend in terms of educational attainment is the rapid decline in the number of economically active individuals with no formal education in the Province. In terms of all key labour market aggregates – employment, unemployment, the labour force, and the unemployment rate – the numbers of individuals with no formal education declined in the Province over the period.
The disadvantaged position of young people and of those with poor education within the labour market however remains: unemployment amongst 15 to 24 year olds is about 46 per cent which is approximately twice the provincial average of about 22 per cent.
The expansion in learner enrolment numbers has had an impact on teaching staff, infrastructure provision and resourcing. Increasing learner numbers are also due to immigration. School data show that there are about 25 000 annual transfers to Western Cape schools from other provinces (about 2.8 per cent of learners), especially concentrated in Grades 1, 6 and 8.
A serious problem is also the high drop-out rates that persist for school learners between Grades 10 and 12.
Unsatisfactory education outcomes remain a major deterrent to South Africans in not achieving their full potential, hindering economic growth and employment. In response to this and other education challenges, systematic measures by the Western Cape Education Department (WCED) to improve education outcomes will be towards providing quality education, improving reading, writing and numeracy in Grades 1 – 6, increasing the matric pass rate (with exemptions) emphasising mathematics and science, and reducing under-performing high schools.
In addition to improvements in the Province’s literacy and numeracy rates, current progress shows that the Grade 12 (matric) pass rate increased to 76.8 per cent in 2010, thereby reversing the five year decline from 2004 to 2009. This was an improvement on the 75.7 per cent pass rate recorded in 2009.
Literacy and numeracy rates are improving
High drop-out rates for learners is a serious concern
Grade 12 pass rate is improving
MEDIUM TERM BUDGET POLICY STATEMENT 2012 - 2015
30
There was also a reduction in the number of underperforming high schools (schools with less than 60 per cent Grade 12 pass rate), from 85 in 2009 to 78 in 2010. Sixteen of the 78 schools are new in this category while 23 of the 85 schools of 2009 progressed well enough to score a greater than 60 per cent pass rate in 2010.
The Department has identified a number of strategic levers for improvement towards a turnaround in education outcomes. This involves a multi-pronged approach starting with strengthening of accountability within the education system through:
• Knowledgeable and caring officials;
• Upgrading and improving content knowledge;
• Enhancing the pedagogical skills of teachers through the recruitment, deployment, training and supporting of teachers and school managers;
• Building managerial skills and accountability of principals and ensuring that quality teaching and learning takes place for the right number of hours a day;
• Providing quality text materials, equipment and technology to support learning and ensuring proper use;
• Promoting access and redress; and
• Addressing the infrastructure backlog by providing proper and sufficient facilities for learning.
The Western Cape Department of Education intends to increase Grades 3, 6 and 9 literacy and numeracy levels by at least 10 per cent between 2010 and 2012. Increasing the matric pass rate from its current 76.8 per cent to 80 per cent in 2011 is another key target for the Department. In addition, plans are afoot to reduce the number of schools with a less than 60 per cent pass rate from 78 to 35 in 2011 and 20 in 2012.
Improving Health According to the Western Cape Department of Health, an estimated 78 per cent of the population is uninsured. The large proportion of the population that is uninsured highlights the load placed on the public health sector to provide public health services.
This point is also reiterated in the National Health Insurance (NHI) policy paper which indicates that “a larger part of the financial
Reduction in the number of underperforming high schools

CHAPTER 2: BUDGET POLICY RESPONSE
31
and human resources for health is located in the private health sector serving a minority of the population. Medical schemes are the major purchasers of services in the private sector which covers 16.2 per cent of the population. The public sector is under-resourced relative to the size of the population and the burden of disease that it has to serve. The public sector has disproportionately less human resources than the private sector, yet it has to manage significantly higher patient numbers”.
The health status of a population is the result of a variety of factors, ranging from economic conditions, sanitation, water, housing and education, with health services playing only a limited, yet important role in health outcomes.
A common health indicator is life expectancy. The life expectancy at birth for the Western Cape, as estimated by Statistics South Africa (StatsSA) for the period 2006 – 2011, is 65.8 years for females and 59.9 years for males. Although relatively higher than in the rest of the country, Western Cape life expectancy is low by international standards and compared to other developing countries.
Reasons for the latter include the high prevalence of diseases related to poverty (e.g. TB and diarrhoea in infants) and those associated especially with a more affluent lifestyle (e.g. stroke, heart disease, diabetes). HIV/AIDS is also a leading cause of mortality as well as high levels of deaths related to trauma (e.g. homicides, road accidents, drowning and death from fires). Infant and under-5 mortality is declining, but remains higher than in other middle-income countries.
Deaths from inter-personal violence are a serious issue and are particularly high amongst male youths and young men in the Province. Almost 2 500 homicides occur annually, many perpetrated on acquaintances.
In addressing the high disease burden, the Department of Health is rolling out strategies for key health programmes such as immunisation, provincial HIV Counseling and Testing [HCT] plan, and to address harmful effects of substance and alcohol abuse.
Building on earlier gains, the Department of Health’s Healthcare 2020 strategy aims to further improve health outcomes in the Province by increasing wellness amongst all citizens.
Currently tabled as a Green Paper, the Healthcare 2020 strategy is targeted at delivering a quality patient experience via a patient-centered approach concentrating on identified
Western Cape life expectancy is low by international standards
Focus on improvements in the efficiency of healthcare expenditure

MEDIUM TERM BUDGET POLICY STATEMENT 2012 - 2015
32
health outcomes; a strengthened district health system model; strategic partnerships with non-profit and community-based organisations, academia and the private sector (particularly in respect of the upstream factors of the burden of disease) and further improvements in the efficiency of healthcare resource utilisation (as it relates to medicines, personnel, operational etc.).
Primary health care remains at the frontline of managing the burden of disease in the Province. Approximately 16.2 million patient visits were logged at primary healthcare centres in 2010/11, setting the average number of visits per person at 2.7 for the year.
Between March 2010 and June 2011 over 1 million people were tested for HIV. Approximately 104 000 people currently receives anti-retroviral therapy, with plans in place to increase this to over 133 000 in 2012/13. HIV/TB co-infection remains a risk. The continued implementation of the Integrated HIV/TB plan will therefore realise further testing for TB and HIV as part of the provincial HIV counseling and testing campaign.
The TB cure rate, which is the percentage of new smear positive pulmonary tuberculosis (PTB) cases cured at first attempt, was recorded at 80.5 per cent for 2010/11 – the highest in the country. The Health department was able to further expand existing and maintain prevention, treatment and care initiatives for HIV & AIDS during the year.
Reducing the under 5 year mortality to 30 per 1 000 live births by 2015 and reducing the maternal mortality ratio to 27 per 100 000 live births by 2015 are strategic objectives of the Department of Health. The under 5 mortality rate is currently recorded at 36.6 and institutional maternal mortality ratio at 77.3 per 100 000 live births.
Core interventions aimed at improving child health outcomes, remain a priority and have been proven to affect educational outcomes later in life, such as child immunisation and nutrition programmes. In the current financial year the Department anticipates immunising over 100 000 children under the age of 1 year. Basic antenatal care services will be further extended to more primary health care facilities in an effort to improve maternal health, identify complicated pregnancies earlier and reduce maternal mortality.
The Department will continue to provide a specialised and comprehensive multi-disciplinary in-patient rehabilitation service to persons with disabilities. These include the provision of
Over a million people tested for HIV last year. Further expansion of anti-retroviral therapy programme contemplated
Reducing child and maternal mortality
Improving child health outcomes remain a priority
CHAPTER 2: BUDGET POLICY RESPONSE
33
mobility and other assistive devices, including orthotics/ prosthetics. An outcomes approach is followed, which demonstrates the positive impact of the service on re-integrating disabled clients back into their homes and where appropriate a return to productive activity and for children to realise their true potential.
Further efforts to address the burden of disease include coordinated interventions across provincial government departments to promote safety and reduce (road traffic) injuries and promote healthy lifestyles. Strategic partnerships with non-profit organisations and community-based organisations are also anticipated to aid in addressing many of the upstream factors contributing to the burden disease in the Province, such as alcohol and substance abuse.
A major policy shift nationally has been the proclaimed implementation of the National Health Insurance (NHI). With its release as a Green Paper in September 2011, the Policy is currently up for public discussion and debate. The national Department of Health already intends piloting the system at 10 sites across the country.
Promoting social inclusion and reducing poverty
The Province’s population is estimated at 5 287 863 people with the majority residing in the Cape Metro. The number of persons aged 80 years and above in the Province is growing and will continue to grow over the next decade. By implication this means that the number of persons who would require frail care, assistance and support has grown and is estimated to grow by more than 100 per cent over the next decade.
The 2011 provincial mid-year population estimates indicate that 508 010 children are between 0 and 4 years old and those between 0 and 19 years old, 1 992 810. These numbers for the 0 - 19 year olds, indicate development, care and protection needs for almost 38 per cent of the population.
Better socio-economic conditions in the Province can be ascribed to the large urban population, higher average incomes and less inequality than in other provinces. However, high poverty and inequality still exist and are manifested in social disintegration. Looking at the 2007 Community Survey and a poverty line set at R5 350 per person per year, 24 per cent of the Western Cape population would be considered to be poor. Inequality, as measured in the survey by the Gini coefficient, was high at 0.694.
Inter-sectoral co-operation and strategic partnerships towards improved health outcomes

MEDIUM TERM BUDGET POLICY STATEMENT 2012 - 2015
34
Pervasive social ills exist in the Western Cape and includes inter-personal violence, a high homicide rate, widespread alcohol and substance abuse, abuse of women exceeding national rates, and high prevalence of child abuse, family break-up and neglect of children that impacts negatively on current and future generations. A better understanding of the actual root causes of social disintegration is required to deal with these social ills.
To help address the challenge of divided communities the Province is promoting social inclusion programmes which includes: an afterschool care programme (2 pm to 6 pm); integrated food security programmes; services which foster functionality and prevents vulnerability in families; and programmes to promote an appreciation of the arts, cultural and heritage sites, museums and archives.
The Mass Opportunity and Development (MOD) centres is a response by the Western Cape Government to expose children in poorer communities to a more holistic development regime. The programme enables youth to participate in sporting and cultural activities after normal school hours (2 pm to 6 pm). The intention is to further support the working and expansion of MOD centres.
The Department of Social Development will therefore continue to provide sustainable welfare services to the poor and vulnerable. Similarly, the Department will also provide community development services in partnership with non-governmental organisations (NGOs) and community based organisations.
The emphasis ahead will be on achieving greater value for money, internal integration, better co-ordination with partners, standardising professional and management best practices, as the well as closer monitoring of outcomes.
A total of 224 community based care and support centres assisting older persons are supported with improved access to quality social developmental services to about 15 738 poor and vulnerable older persons in the Province.
There remains a need for residential care facilities for frail older persons, despite the relatively high costs. In order to provide for remaining needs in communities where these services do not exist, alternative care and support models will continue to be supported and gradually expanded on.
An understanding of the actual root causes of social disintegration is required to deal with the current social ills
Focus on greater value for money and better co-ordination with partners

CHAPTER 2: BUDGET POLICY RESPONSE
35
The treatment of clients and support to substance abuse treatment centres will allow greater accessibility of services, especially through the expansion of outpatient care.
Services to persons with disabilities and their families will continue to drive efforts to mainstream disabilities, increase universal access and strengthen relations with all service providers and training and capacity building programmes.
The Department of Social Development is further committed to expanding access to Early Childhood Development (ECD) opportunities for children between 0 and 4 years old. This programme will provide access to almost 90 000 children. There are currently about 1 099 registered partial care sites operational in the Province of which 1 026 ECD centres and 61 partial care facilities have been funded. By the end of March 2011, 72 327 children were accommodated in registered and funded ECD partial care sites.
Continued support to victims of violence and crime, including their families will be given, whilst sustaining and improving shelters to enhancing quality of services to victims of crime.
A range of family preservation services, including family counseling, marriage preparation, enrichment and support for families in crisis are initiatives undertaken by the Department. In addition, services are provided to support vulnerable young mothers and single parents’ calls for innovative approaches and programmes to equip them with knowledge, skills and options to in turn assist them in making informed choices and decisions.
The Community Nutrition and Development Centres (CNDC) provided nutritional meals and developmental programmes to 74 700 people of which 230 beneficiaries were in income generating programmes during the 2010/11 financial year. These centres will continue promoting meals to the vulnerable in society.
The Department of Cultural Affairs and Sport will offer the main institutional platform for the after-school care programmes at the MOD centres, offering access to a basket of social development services and programmes, involving life skills development and educational/awareness activities. The basket of social development, sports and cultural programmes complements the efforts of the Western Cape Education Department as a means of incentivising young people to remain in school.
Expanding access to Early Childhood Development to almost 90 000 children between 0 and 4 years old
MEDIUM TERM BUDGET POLICY STATEMENT 2012 - 2015
36
The Department of Cultural Affairs and Sport also plans to increase participation and develop excellence in sport, recreation, arts and culture.
Greater access will be promoted at the 340 public libraries (only a quarter of the Western Cape population is registered members of libraries), museums and language and heritage services. The active development of partnerships with a number of stakeholders will be key over the medium-term.
Over the medium-term the Department aims to increase the reach of the Wheelie Wagons project to allow rural areas to access libraries where current infrastructure does not allow for the sustainability of such a service. The rural library connectivity project will continue to connect rural communities in the Western Cape to the internet.
Library services at the provincial level are shared by provincial government and municipalities. The Provincial Government, as it relates to community libraries is responsible for: the selection, funding, ordering and processing of library material; the provision of an information service; and the promotion and use of library materials and libraries.
Municipalities employ staff, fund libraries (except books), manage the operations of libraries and the maintenance of library buildings. There are also occasions where maintenance work is carried out by the Province. Additional funding for library services over the medium term is geared towards assisting 15 of the most vulnerable (B3) municipalities in the Province to effectively deliver the library function.
The Department will continue support for cultural organisations empowering people in arts, culture and heritage.
In response to high crime levels, the Department of Community Safety coordinates increasing safety initiatives and advocates the concept of making safety everyone’s responsibility. Four key initiatives include more effective civilian oversight; shaping a safety approach for the Western Cape; optimising road safety and improving the security contribution of the Province’s institutions, assets and people.
Civilian oversight over the police and other law enforcement agencies is critical to effective policing and ultimately reduced crime levels. The police are to be held accountable for the proper and effective use of their enforcement powers over the inhabitants of the Western Cape. To bolster the process of civilian oversight the Department of Community Safety is in the
Increased access to library services in rural communities
Focus on effective policing

CHAPTER 2: BUDGET POLICY RESPONSE
37
process of preparing legislation that will address all ambiguities in this regard.
The increasing safety objective is aimed at reducing road accidents, fatalities and serious injuries; reducing drug related crime, social and overall levels of crime; creating a heightened awareness of road traffic safety issues; inculcating good road user behaviour and encouraging voluntary compliance.
Increased efforts such as weekend alcohol blitzes and road blocks held, have already contributed to a 23 per cent reduction in road fatalities in the Western Cape during the 2010/11 financial year. The Department will continue to use its traffic law enforcement capacity in such a manner that allows traffic officials to contribute to a safer society by also enforcing other relevant laws. Much success has been achieved to combat drug trafficking, abalone poaching and assisting in the apprehension of other criminals and even those who absconded on their parental maintenance responsibilities.
The Department further aims to shape a safety approach for the Western Cape. This entails coordinating all direct security spend by the PGWC to maximise safety and minimise opportunities for crime within all Government properties and activities. Opportunities and mechanisms will also be created to allow the general public, private business (including private security), non-governmental organisations and other stakeholders to, in the spirit of the whole of society approach to increasing safety, participate in making the Western Cape a safe place to live, work and play.
Improving governance
Through a public service institutional lens, the National Planning Commission in its institutional and governance diagnostic overview argues that South Africa requires a “capable state” that is sufficiently capable and effective to enable people to broadly have faith in the services it delivers.
Aligned to this ideal are the two Provincial Strategic Objectives that relate to integrating service delivery and building the best-run regional government, i.e. systematic and comprehensive efforts to improve public sector performance.
The Departments of the Premier, Provincial Treasury and Local Government will be individually and collectively responsible for the maintenance and progressive improvement of the Western Cape’s governance and operational efficiency over the medium-term.
Aim to reduce road accidents and fatalities
Whole of society approach to increasing safety
Targeting progressive improvements in governance in the Province

MEDIUM TERM BUDGET POLICY STATEMENT 2012 - 2015
38
This includes efficient and transparent institutional governance; sound financial and people management; expansion of E-Government; citizen-centric service delivery and management for results. All of these are to be benchmarked against international standards.
Oversight on corruption will be strengthened through strengthened financial governance practices, improved risk management and control environment, and dealing with corruption cases decisively and swiftly.
The Provincial Treasury has as task conformance of all provincial departments, public entities and municipalities to the rules and practices of good financial management and internal controls, as well as improved fiscal performance management. This includes support in respect of advising on and recommending appropriate and adequate financial management structures, systems and processes required for effective and efficient financial management performance and effective resource utilisation towards sustainable socio-economic impacts.
More specifically, efforts by the Provincial Treasury will realise, amongst others, better planning, efficiency and value for money in spending, improvement in the quality and integrity of financial accounting and reporting. Other objectives include a heightened awareness of revenue and cash flow management, improvements in the sustainability and credibility of provincial, municipal and public entity budgets and expenditure management, and continued improvement in in-year performance monitoring, evaluation and reporting.
The Department of the Premier is responsible for coordinating the process of the development of the composite Provincial Strategic Plan (PSP), which entails the collation of the twelve Provincial Strategic Objectives (PSOs).
The Department is co-ordinating the Western Cape Provincial Transversal Management System (PTMS) as the operational mechanism for the Provincial Strategic Objectives. The aim is to integrate the plethora of national, provincial and local planning processes and to align these within the PTMS and thereby ensure that the information flow can be efficiently integrated and managed.
Effective and efficient financial management performance
Improving the quality and integrity of financial accounting and reporting

CHAPTER 2: BUDGET POLICY RESPONSE
39
The Province will also focus on people management to ensure that its people are valued and managed in a way that the Province realises its outcomes together with its people. The goal is to provide a highly capable workforce, create an enabling workplace and develop leadership that enables employee engagement and optimal service delivery.
Developments in ICT have redefined the relationship between government and citizen. E-Government provides a mechanism for the citizen to hold government accountable and ensure transparency. A priority area is therefore the sustainable use of information and communication technologies (ICTs) to enable improved information and service delivery as well as encouraging citizen participation in decision-making.
The Department of Local Government will work towards its vision of developmental and well-governed municipalities with integrated, sustainable and empowered communities by strengthening capacity building interventions and providing provincial support and oversight.
The Department’s capacity building framework for municipal support aims to improve governance and administrative capabilities. Support to municipalities will continue, including advisory services deployed from a pool of experts and ensuring skills transfer.
Further support initiatives include strengthening public participation at municipalities and improving active citizen participation in the IDP processes with a view towards achieving 100 per cent functional ward committees by 2014.
A further initiative is integrated service delivery through the Community Development Worker and Thusong Service Centre Programmes. These are to facilitate greater access to government services.
District municipalities will continue to be supported with bulk infrastructure planning and implementation, towards better municipal service delivery in local municipalities.
Conclusion
This Western Cape Medium Term Budget Policy Statement (WC MTBPS) outlines the socio-economic realities facing communities living within the Western Cape Province and thereby outlines key challenges that this government needs to respond to. The social challenges include amongst others: less than optimal education outcomes and relative skills shortages;
Better people management
Emphasis on improving financial and administrative capabilities of municipalities

MEDIUM TERM BUDGET POLICY STATEMENT 2012 - 2015
40
sub-optimal health status; substance abuse and youth unemployment. These are all in addition to the challenges posed by the current uncertain economic environment.
The WC MTBPS deals with the Provincial Government’s medium term objectives and outcomes it wishes to achieve by setting out the policy framework within which this government operates. The WC MTBPS forms the basis from which fiscal and budget policies for the medium term are derived and contain indications of revenue, aggregate allocations and the medium term spending priorities.
The realities of the economic environment call for increasing the efficiency of public services, and fiscal consolidation. In crafting the 2012 Budget the focus will therefore remain on quality spending, and reducing wasteful or inefficient or ineffective government expenditure and allocating resources to high priority areas. Reprioritisation between and within departmental baselines is critical as is strengthening the focus on the performance of the public sector in achieving results.
Responsible fiscal management and stewardship of the provincial economy will support and enhance vital services for the citizens of the Western Cape over difficult economic times.
Therefore strategies adopted by the Western Cape Government aims to affirm that economic development is key to addressing many of the challenges facing the Province. The development of the Provincial Strategic Objectives amongst others includes growing the economy and job creation. Therefore to support the economy and support families and communities, the composition of expenditure needs to shift in support of infrastructure investment whilst maintaining key social services in health and education.
In doing so government has identified actions to create an enabling environment for business to flourish, invest in infrastructure such as schools, health facilities, roads and other substantive infrastructure projects that would have a catalytic effect on economic growth. Government also needs to invest in communities so that people are empowered to take charge of their development and reverse the effects of social disintegration.
CHAPTER 2: BUDGET POLICY RESPONSE
41
The key message of the 2012 Western Cape Medium Term Budget Policy Statement is to improve the performance of the State, particularly in times of economic hardship though maintaining and strengthening key social services in health and education, investing in the capacity of the economy to grow through infrastructure investment, improving the efficiency and effectiveness of government expenditure and integration and co-ordination with national and local government and the private sector to improve outcomes.


43
3
The resource envelope and financing issues The 2012 fiscal framework has been formulated in an exceptionally challenging economic environment. Uncertainty regarding prospects for the Euro zone recovery, sluggish economic growth in the United States together with building inflationary pressures in several countries pose risks for the South African economy and fiscus.
In responding to the financial crisis that began in 2008, South Africa adopted an accommodative fiscal stance whereby government expenditure has assisted in cushioning the impact of deteriorating business activity. This countercyclical fiscal stance is expected to continue in the year ahead. In addition to funding current expenditure, government is obliged to ensure that the fiscus can sustainably finance future expenditure needs. Over the medium term, government needs to limit spending growth in line with the capacity of the economy to generate revenue.
Fiscal consolidation will be accompanied by shifts in the composition of public expenditure from growth of the wage bill and recurrent expenditure towards infrastructure investment and expenditure that is supportive of economic growth and competitiveness. Priority will be given to spending that strengthens the asset base of the economy with increased expenditure on capital investment, maintenance and refurbishment. The baseline of social expenditure will be maintained in real terms.
Efforts to improve value for money by redirecting spending towards frontline services, and to reduce non-core and ineffective expenditure remain a key priority and become ever more important as projected spending growth moderates over the MTEF. Furthermore, provincial governments have been requested to identify savings in non-essential expenditure in
Government spending has cushioned the economy through the recession and continues to do so into recovery

MEDIUM TERM BUDGET POLICY STATEMENT 2012 - 2015
44
their existing budgets to fund core programmes, particularly in health and education. Rising personnel spending together with increases in administrative prices places additional strain on the provincial budgets especially in labour intensive departments, limiting resources for infrastructure and complementary inputs needed for the delivery of quality services.
Over the 2012 MTEF, provincial expenditure remains mostly dependent on national transfers (which includes the provincial equitable share (PES) and conditional grants) contributing approximately 95 per cent with provincial own receipts (taxes and fees/user charges) contributing around 5 per cent.
Table 3.1 Fiscal framework of the Western Cape
2011/12 2012/13 2013/14 2014/15 TotalAdjusted Budget 2012 MTEF
Transfers from National 35 316 760 37 524 067 40 408 680 43 007 963 120 940 710Equitable share 27 052 442 28 768 086 30 795 532 32 718 024 92 281 642Conditional grants 8 264 318 8 755 981 9 613 149 10 289 938 28 659 068
Own receipts 1 858 962 1 910 090 1 935 925 1 935 925 5 781 940Asset Financing Reserve 273 749 3 000 3 000PRF Financing 64 466 Total 37 513 937 39 437 157 42 344 605 44 943 888 126 725 650PercentagesTransfers from National 94.14% 95.15% 95.43% 95.69% 95.44%
Equitable share 72.11% 72.95% 72.73% 72.80% 72.82%Conditional grants 22.03% 22.20% 22.70% 22.90% 22.62%
Own receipts 4.96% 4.84% 4.57% 4.31% 4.56%Asset Financing Reserve 0.73% 0.01% 0.00% 0.00% 0.00%PRF Financing 0.17% 0.00% 0.00% 0.00% 0.00%Total 100.00% 100.00% 100.00% 100.00% 100.00%
Changes to baseline
Equitable Share - 262 683 451 033 552 855 1 266 571 Conditional Grants (estimated) - 8 625 33 410 135 415 177 449 Own Receipts - - - - - Total - 271 308 484 442 688 270 1 444 021
SourceR'000 Medium Term Estimates
Provisional transfers from National
National transfers to all provinces are set to increase by R20.2 billion over the 2012 MTEF. This is a significant decrease relative to the R40.1 billion addition in the 2011 MTEF. These transfers include R13.4 billion or a 66 per cent share channelled through the equitable share with R6.9 billion or 34 per cent coming from conditional grants over the next three years. The greater part of these additions is in the later years of the MTEF. Within the provincial equitable share additions, R2.8 billion is added in 2012/13, R4.8 billion in 2013/14 and R5.8 billion in 2014/15. In the case of conditional grant additions, R1.3 billion is

CHAPTER 3: THE RESOURCE ENVELOPE AND FINANCING ISSUES
45
added in 2012/13, R2 billion in 2013/14 and R3.6 billion in 2014/15.
Provincial equitable share additions are to provide for the carry-through costs of higher-than-anticipated wage agreements in 2011/12 and for targeted policy priorities to improve the quality and spread of education and social development delivery.
The Western Cape receives a proportional share of the national adjustments to the PES and conditional grants.
Provincial Treasury’s own calculations in Table 3.1 show the net estimated national transfers to the Western Cape which are adjusted by R1.4 billion over the MTEF. The aggregate net adjustment in the provincial equitable share baseline to the Province amounts to R1.3 billion over the MTEF.
The preliminary calculations for the PES and Conditional Grant allocations to the Western Cape are expected to grow at an annual average of 6.5 per cent and 7.6 per cent, respectively.
The new overall PES allocations of the Western Cape amount to R28.8 billion, R30.8 billion and R32.7 billion in 2012/13, 2013/14 and 2014/15, respectively. The increase in the provincial equitable share is also partially attributed to the phased inclusion of the Forensic Pathology Services Conditional Grant into the PES (from 2012/13) as well as the partial inclusion of the Hospital Revitalisation Conditional Grant (from 2013/14) which is already included in the baselines.
The 2011 MTEF saw the introduction of a number of changes to the PES. A new health component was introduced and the weights of the health, education and basic components were revised for the 2011 Division of Revenue.
The components of the new health formula capture all major expenditure components of the health sector including previous add-ons for salary increases and primary health care. However, 2012/13 is the last year that the provincial equitable share includes Occupational Specific Dispensation (OSD) add-ons. As from 2013/14 OSD add-ons will be distributed as part of the overall health share of the PES formula.
A detailed education component was developed in 2010 and 2011 but has as yet not been finalised. The preliminary detailed component utilises a costed norms type of approach using school enrolment data, income quintiles and data on the distance learners need to travel to access schools. This will be used to estimate weights for learners with which to calculate a
Additions to PES cater for the higher wage bill and improvements in education and social development
Over the 2012 MTEF, the PES grows annually on average by 6.5 per cent and conditional grants by 7.6 per cent

MEDIUM TERM BUDGET POLICY STATEMENT 2012 - 2015
46
province’s share of the PES for education. In order to have more reliable enrolment data, it was agreed that 2011 Census data, which will hopefully be available for the 2013/14 financial year, will be utilised to update the education component.
The 2012 PES was updated with data from the 2011 Mid-year Estimates, 2011 School Realities Survey, the 2009 Gross Domestic Product per Region (GDP-R), the 2005 Income and Expenditure Survey, data on people without medical insurance from the 2010 General Household Survey and output data from the health sectors. The impact of these data updates on the PES will be phased-in over three years (2012/13 to 2014/15).
Minor upward revisions have been made to the Western Cape’s share of the Education and Health PES components, as a result of data updates. School enrolment data updates indicate an increase in school enrolment for the Western Cape from 1 000 616 in 2010 to 1 015 038 learners in 2011. The health component is adjusted based on changes to the Provinces’ health risk profile, proportion of the population without medical aid insurance and patient load data comprised of primary health care visits and visits to tertiary hospitals.
The Western Cape’s share of the Basic and Poverty components remain unchanged. Revisions to the mid-year population estimates indicate a slight increase of 64 000 in the population of the Western Cape to 5 287 863. The Western Cape’s share of the national population defined as poor, i.e. persons who fall in quintiles 1 and 2 drawn from the 2005 Income and Expenditure Survey, remains unchanged at 6 per cent.
The Province’s share of the Economic Activity component is based on its GDP-R. The Western Cape’s share has declined marginally from 14.3 per cent to 14 per cent as a result of a relative decline in economic activity as measured between GDP-R for 2008 and GDP-R for 2009.
The data updates that inform the PES allocation to provinces are affected annually. These updates result in revisions to the relative PES allocated to provinces. The Budget Council, to avoid shocks that particularly decreases to the PES could have on individual provinces, has agreed that revisions to the PES allocations be phased-in over a three-year period. This in practice has resulted in annual data updates with continuous phasing-in of the target share and quite possibly an indefinite timeline to reach the ultimate PES target shares.
WC share of PES marginally increase as a result of data updates

CHAPTER 3: THE RESOURCE ENVELOPE AND FINANCING ISSUES
47
The data updates over the 2011 and 2012 MTEF have resulted in increases to the relative PES share allocated to the Western Cape. Table 3.2 shows the target shares communicated in the 2011 and 2012 MTEFs and the relative shares in each of the MTEF years.
Table 3.2 Phasing in of Equitable Share over the 2012 MTEF*
MTEF Years 2011/12 2012/13 2013/14 2014/15
2011 MTEF 9.2738% 9.3238% 9.3770% 9.3770%
2012 MTEF 9.1667% 9.2567% 9.3467% 9.4367%
Difference -0.1071% -0.0671% -0.0303% 0.0597%
Fiscal Impact - R205.286 million - R98.141 million R204.683 million
* Provincial Treasury own calculations
Table 3.2 also shows the PES phase-in over two continuous three-year cycles. Observations are that the relative shares communicated in the 2011 and 2012 MTEFs differ, when the two outer years of the 2011 MTEF and first two years of the 2012 MTEF are compared. It illustrates that the phasing-in of the target shares has resulted in variability and a level of uncertainty in absolute monetary terms, particularly applicable to the two common years of the 2011 and 2012 MTEFs.
When the 2011 MTEF and 2012 MTEF are compared and the financial years 2012/13 and 2013/14, MTEFs are considered, observations are that the variance for 2012/13 is -0.0671 per cent and for 2013/14, -0.0303 per cent. These negative variances result in the allocation of relatively less funds than what had been envisaged to the Province in the previous 2011 MTEF.
As a result of phasing-in of the PES share, any additional PES funds allocated from the national sphere for the 2012 MTEF, either for technical adjustments (due to higher than anticipated wage agreements) or for policy adjustments, would first be applied to compensate for any potential shortfalls, between what has been communicated in the 2011 MTEF and the proposed allocations for the 2012 MTEF. In short the potential shortfall becomes a first charge on any additional 2012 MTEF PES allocations.

MEDIUM TERM BUDGET POLICY STATEMENT 2012 - 2015
48
Policy priorities funded through the PES
In the Western Cape, the PES on average makes up 72.8 per cent of total provincial revenue over the 2012 MTEF.
Additions to the provincial equitable share provide for priorities in Social Development and Education. R2 billion is added nationally to the PES with respect to Social Development over the MTEF. The proportionate share for the Western Cape amounts to approximately R193 million and is aimed to provide for increasing the subsidies and number of days the subsidy is paid to non-profit organisations providing early childhood development programmes.
Additional funds for education over the MTEF provide for the progressive equalisation of the no fee school per learner subsidies paid to the poorest 60 per cent of schools, and to expand Grade R provision at primary schools. For this purpose R418 million is added over the MTEF.
Salary adjustments through the PES
The PES allocation provides for the carry-through costs of the higher-than-anticipated wage agreement in 2011/12.
Over the 2012 MTEF, National government has budgeted for R2.2 billion in 2012/13, R2.3 billion in 2013/14 and R2.4 billion in 2014/15 to cater for the Public Service Coordinating Bargaining Council (PSCBC) resolutions of 2011. It is estimated that the Western Cape will receive R204.2 million in 2012/13, R218.6 million in 2013/14 and R232.8 million in 2014/15 for this purpose.
Conditional grants for concurrent and associated functions
Nationally, the baseline for conditional grant allocations to all provinces has been revised upwards by R1.3 billion in 2012/13, R2 billion in 2013/14 and a further R3.6 billion in 2014/15. The bulk of the conditional grant increases go to the Disaster Management Grants, National Health Insurance pilots, Comprehensive HIV and Aids Grant and the Human Settlements Development Grant.
R611 million additional over the MTEF for Education and Social Development priorities
R656 million additional over the MTEF to cater for Improvements in Conditions of Service
Conditional Grants contribute 22.8 per cent of the total provincial envelope

CHAPTER 3: THE RESOURCE ENVELOPE AND FINANCING ISSUES
49
Additional resources are also set aside at the national level for piloting district-based health services as part of the proposed national health insurance reforms. The pilot projects will take place in 10 districts to be identified by the national department. The rationale is to test the feasibility and scalability of proposals in the green paper, which focus on primary health care, health promotion and preventative care.
National Departments must still, after consultation with relevant stakeholders, finalise their respective conditional grant allocations, the exact numbers of which will only be received as part of the later preliminary allocation process. For planning purposes the Provincial Treasury has made its own calculations based on previous trends in conditional grant distribution.
In summary, it is estimated that the Western Cape Government should receive an additional R177 million over the MTEF for conditional grants.
Within Education, estimated provisions have been made for an additional R8.6 million in 2012/13 and an additional R11.5 million in 2013/14 for the Education Infrastructure Grant. These funds are allocated for repair work on schools and other education facilities.
For Health, R14.4 million each MTEF year is redirected to Nursing Colleges. The funds have been reprioritised from the Health Infrastructure Grant baseline which will be utilised in the construction and rehabilitation of nursing colleges. R97 million is added to the Comprehensive HIV and Aids Grant in 2014/15 to cater for an increasing number of people qualifying for treatment. The additional funding responds specifically to the lowering of the CD4 count threshold for accessing HIV and Aids treatment.
For Human Settlements, R21.9 million in 2013/14, and R38.4 million in 2014/15, are added to the Human Settlements Development Grant. These funds are to provide for installing the necessary infrastructure in smaller and less capacitated municipalities to upgrade informal settlements to sustainable communities.
Overall, the Western Cape is estimated to receive conditional grants to the total value of R8.8 billion in 2012/13, R9.6 billion in 2013/14 and R10.3 billion in 2014/15. These contribute on average 22.8 per cent of the revenue envelope over the 2012 MTEF.
Increase in conditional grants largely cater for health priorities

MEDIUM TERM BUDGET POLICY STATEMENT 2012 - 2015
50
Table 3.3 provides the Provincial Treasury’s own calculation of the estimated national conditional grant transfers that could flow to the Province over the 2012 MTEF.
Table 3.3 Estimated revisions to conditional grant baseline allocations for the 2012 MTEF
R'000 2012/13 2013/14 2014/15 TotalMTEF
EducationEducation Infrastructure Grant 8 625 11 470 20 094
HealthHealth Infrastructure - 14 440 - 14 440 - 14 440 - 43 320Comprehensive HIV and Aids Grant 97 020 97 020Nursing Colleges 14 440 14 440 14 440 43 320
Human SettlementsHuman Settlements Development Grant 21 940 38 395 60 335
Total 8 625 33 410 135 415 177 449
Provincial own receipts
In aggregate, provincial own receipts as shown in Table 3.4 are projected to increase from R1.86 billion in the 2011/12 Adjusted budget to R1.91 billion in 2012/13.
The Provincial Treasury, the Department of Health and the Department of Transport and Public Works are the main contributors to Provincial own receipts. Total provincial own receipts for the Department of Transport and Public Works is projected to increase from R951.6 million in 2011/12 to R971.5 million in 2012/13. Total provincial own receipts for the Department of Health is projected to increase from R483.2 million in 2011/12 to R519.7 million in 2012/13. The additional own receipts are attributed to transfers received from the Global Fund donation, specifically targeted towards strengthening and expanding the Province’s HIV/Aids prevention, treatment and care programme.
Provincial Treasury’s own provincial receipts are expected to remain at R298.3 million over the 2012 MTEF period. The flat forward estimates in gambling tax revenue can be attributed to the industry having reached a mature level, as well as the relatively slow pace of recovery expected in the economy after the economic recession.
Provincial own receipts between the 2011/12 adjusted budget and 2012/13, are projected to increase by 2.8 per cent and marginally increase by 1.4 per cent between 2012/13 and 2013/14.
Provincial own receipts is projected to contribute 4.8 per cent to the 2012/13 total budget

CHAPTER 3: THE RESOURCE ENVELOPE AND FINANCING ISSUES
51
Table 3.4 Summary of provincial own receipts by vote
2011/12 2014/15Adjusted Budget
Premier 591 613 613 613 Provincial Parliament 52 52 52 52 Provincial Treasury 298 262 298 262 298 262 298 262 Community Safety 2 286 2 783 2 952 2 952 Education 24 025 24 533 25 065 25 065 Health 483 191 519 738 526 117 526 117 Social Development 565 593 615 615 Human Settlements 60 000 60 000 60 000 60 000 Environmental Affairs and Development Planning 318 318 318 318 Transport and Public Works 951 587 971 535 990 158 990 158 Agriculture 25 030 25 454 25 454 25 454 Economic Development and Tourism 8 040 5 334 5 334 5 334 Cultural Affairs and Sport 4 965 825 935 935 Local Government 50 50 50 50
Total 1 858 962 1 910 090 1 935 925 1 935 925
2012/13 2013/14Provincial DepartmentR'000 Medium-term estimate
Table 3.5 below shows the total annual provincial own receipts budget by economic classification over the 2012 MTEF per source. The major sources of own receipts for the Province are motor vehicle licence fees, casino taxes and health patient fees, which together account for over 75 per cent of provincial own receipts.
Table 3.5 Western Cape own receipts by source 2011/12 – 2014/15
2011/12 2012/13 2013/14 2014/15Adjusted Budget
Tax receipts 1 214 949 1 233 207 1 251 830 1 251 830 Casino taxes 277 000 277 000 277 000 277 000 Motor vehicle licences 912 885 931 143 949 766 949 766 Horse racing taxes 20 000 20 000 20 000 20 000 Other taxes (Liquor licence fees) 5 064 5 064 5 064 5 064 Sales of goods and services other than capital assets
376 660 379 759 380 382 380 382
Transfers received 182 256 214 553 220 932 220 932 Fines, penalties and forfeits 1 111 1 220 1 335 1 335 Interest, dividends and rent on land 4 456 4 457 4 458 4 458 Sales of capital assets 24 24 24 24 Financial transactions in assets and liabilities
79 506 76 870 76 964 76 964
1 858 962 1 910 090 1 935 925 1 935 925 Total provincial own receipts
Medium-term estimateSourceR'000

MEDIUM TERM BUDGET POLICY STATEMENT 2012 - 2015
52
Motor vehicle licence fees (MVLF)
As the largest revenue item for provincial own receipts, Motor Vehicle Licence Fees (MVLF) are projected to contribute R912.9 million to provincial own receipts in 2011/12. The income from these fees is projected to increase to R931.1 million in 2012/13 and R949.8 million in 2013/14.
In the past there have been concerns within the Provincial Government of the Western Cape (PGWC) with the application of the MVLF structure being higher than other provinces. This encouraged practices of licensing outside of the Western Cape which has resulted in the PGWC losing MVLF revenue.
Given this background, the PGWC some years back undertook research on the socio-economic incidence of the Western Cape’s motor vehicle licence structure, and the patterns and implications of cross-border licensing.
An update of this research is required in order to determine if the motor vehicle fee structure is appropriate and whether there is scope to update or amend the current motor vehicle license structure in the Province. The research will also explore the possibility of alternative user charge mechanisms relative to the current MVLF structure and deployment towards better addressing road maintenance backlog funding requirements.
Agreement was reached amongst provinces to start a process to harmonise MVLFs across provinces.
Government Motor Transport (GMT)
In a quest to continuously improve government efficiency, a study has been commissioned to investigate the tariff structures, fleet management practices and accounting treatment of GMT.
The completed study will provide clarity on how GMT could further improve upon its efficiency with regards to current challenges such as outstanding debt collection, fuel price volatility and optimal use of fleet vehicles.
Health patient fees
Health patient fees, incorporated under ‘sales of goods and services other than capital assets’ in Table 3.5, are expected to contribute R272 million to provincial own receipts in 2011/12. It is projected that this revenue item will remain at this level for the duration of the 2012 MTEF period.
Health patient fees to contribute approximately R272 million per annum

CHAPTER 3: THE RESOURCE ENVELOPE AND FINANCING ISSUES
53
Uniform Payment Fee Schedule (UPFS) tariffs in respect of full paying patients was increased by 5.9 per cent while no increases were made for H0, H1, H2 and H3 patient categories. The revised UPFS tariffs was implemented with effect from 1 April 2011.
One of the challenges for the Department of Health in terms of own revenue is the collection of Road Accident Fund (RAF) claims. In 2010/11 only 43 per cent of claims submitted were paid out by the RAF.
Casino and horse racing taxes
Casino taxes remain one of the largest contributors to provincial own receipts with a projected contribution in 2011/12 of 14.9 per cent to total provincial own receipts of the Western Cape. Casino taxes are expected to remain largely unchanged from the 2011 MTEF and will contribute R277 million in 2011/12. Casino taxes are projected to remain at R277 million over the 2012 MTEF period. Horse racing taxes are also projected to remain at R20 million over the MTEF period.
The Provincial Treasury is investigating new initiatives in order to increase revenue from casino taxes. One of these initiatives relates to the ending of the exclusivity period within the Western Cape and in particular the metro which would enable one of the existing outlying casinos to relocate to the metro.
Liquor licence fees
Liquor licence fee revenue projections have remained unchanged over the 2012 MTEF at R5.1 million. In December 2010 the Western Cape Provincial Parliament passed the Western Cape Liquor Amendment Act, 2010 (Act 10 of 2010). The establishment of the liquor Authority is expected to be finalised in 2012/13.
Financial transactions in Assets and Liabilities
Financial Transactions in Assets and Liabilities is estimated at around R77 million for each year over the 2012 MTEF mainly from the departments of Human Settlements Health and Education. Financial transactions in Assets and Liabilities caters for revenue items such as the Enhanced Extended Discount Benefit Scheme, Recovery of previous year’s expenditure and Staff debt.
The average contribution of casino taxes over the 2012 MTEF is 14.9 per cent
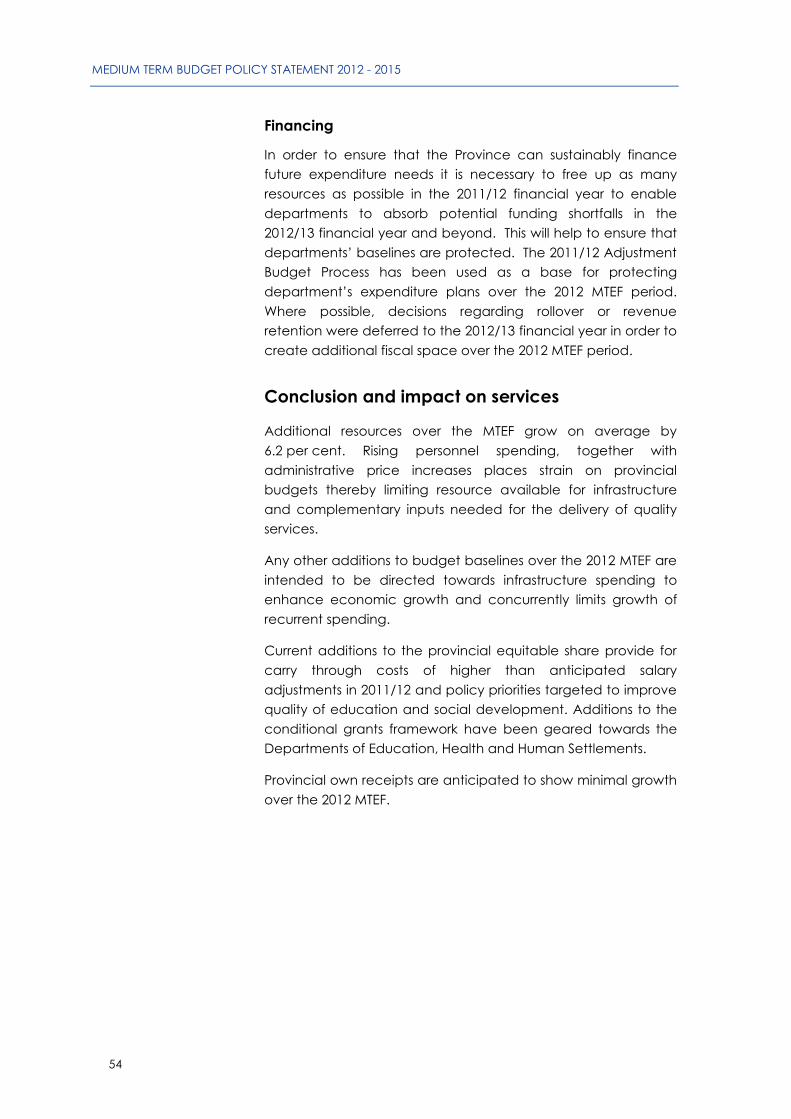
MEDIUM TERM BUDGET POLICY STATEMENT 2012 - 2015
54
Financing
In order to ensure that the Province can sustainably finance future expenditure needs it is necessary to free up as many resources as possible in the 2011/12 financial year to enable departments to absorb potential funding shortfalls in the 2012/13 financial year and beyond. This will help to ensure that departments’ baselines are protected. The 2011/12 Adjustment Budget Process has been used as a base for protecting department’s expenditure plans over the 2012 MTEF period. Where possible, decisions regarding rollover or revenue retention were deferred to the 2012/13 financial year in order to create additional fiscal space over the 2012 MTEF period.
Conclusion and impact on services
Additional resources over the MTEF grow on average by 6.2 per cent. Rising personnel spending, together with administrative price increases places strain on provincial budgets thereby limiting resource available for infrastructure and complementary inputs needed for the delivery of quality services.
Any other additions to budget baselines over the 2012 MTEF are intended to be directed towards infrastructure spending to enhance economic growth and concurrently limits growth of recurrent spending.
Current additions to the provincial equitable share provide for carry through costs of higher than anticipated salary adjustments in 2011/12 and policy priorities targeted to improve quality of education and social development. Additions to the conditional grants framework have been geared towards the Departments of Education, Health and Human Settlements.
Provincial own receipts are anticipated to show minimal growth over the 2012 MTEF.

55
4
Expenditure trends This Chapter provides information on the expenditure outcome of the 2010/11 financial year and the 2011/12 spending trends. Through the implementation of further austerity drives, departments will strive to achieve improved efficiency, especially with regard to personnel expenditure. The rather small 2011 Adjusted Budget will, through further fiscal consolidation, ‘free up’ funds to be used to create a buffer for departments with regards to the limited fiscal resources available in the 2012/13 financial year.
2010/11 Expenditure outcomes Details of the 2010/11 expenditure outcomes for the Province are set out in Table 4.1 below. In total, spending for the Province in 2010/11 amounted to R34.1 billion out of a total adjusted appropriation of R34.4 billion.
Table 4.1 Expenditure by votes, 2010/11 - 2011/12 financial years
Adjusted Budget
AuditedOutcome
Deviation from Adjusted
BudgetMain
budget Adjusted budget
Actual Spending
April 2011 to September 2011
1 Department of the Premier 623 369 620 918 0.4% 697 197 694 018 322 7612 Provincial Parliament 74 982 74 606 0.5% 88 242 88 716 40 0503 Provincial Treasury 131 504 127 500 3.0% 144 976 143 420 60 4064 Community Safety 288 911 288 542 0.1% 310 978 307 218 131 4505 Education 11 998 212 11 955 743 0.4% 13 331 843 13 377 152 6 337 0346 Health 12 408 383 12 344 628 0.5% 13 395 060 13 428 910 6 268 5547 Social Development 1 233 817 1 222 183 0.9% 1 331 611 1 332 141 569 8648 Human Settlements 2 192 395 2 165 120 1.2% 1 836 006 1 836 506 816 6719 Environmental Affairs & Development Planning 301 425 299 970 0.5% 351 262 348 534 161 03810 Transport & Public Works 4 000 096 3 807 886 4.8% 4 116 260 4 207 273 1 647 22811 Agriculture 483 987 483 485 0.1% 501 718 517 192 226 69112 Economic Development and Tourism 237 544 235 751 0.8% 254 414 257 070 112 00813 Cultural Affairs & Sport 294 704 294 023 0.2% 313 158 352 480 133 87014 Local Government 113 009 110 689 2.1% 135 974 129 997 53 988
34 382 338 34 031 044 1.0% 36 808 699 37 020 627 16 881 613
29 290 28 605 30 253 30 253 14 273
34 411 628 34 059 649 1.0% 36 838 952 37 050 880 16 895 886
VoteR'000
Sub-total
Direct Charge
Total
2010/11 2011/12

MEDIUM TERM BUDGET POLICY STATEMENT 2012 - 2015
56
The 2010/11 under spending amounted to R351 million or 1 per cent of the total adjusted appropriation. The under spending is mainly due to delays in infrastructure spending and personnel related issues of R42.5 million in Health and R63.8 million in Education, as well as the slow filling of vacant posts and under spending on national conditional grants of R192.2 million by Transport and Public Works.
2011/12 Mid-year estimates
The provincial spending results as at the second quarter of the 2011/12 financial year, depicted in the table above, amounts to R16.9 billion or 45.9 per cent of the 2011 Main Budget and is R1.6 billion or 10.7 per cent more than what was spent for the same period in the previous year.
In view of the uncertainty surrounding the global and domestic economies, departments will in future have to do year-on-year reviews to stabilise departmental baselines and to minimise the effect of fiscal and economical uncertainty on service delivery. This will require some expenditure/budget introspection to maintain a fine balance between recurrent expenditure (compensation of employees and goods and services) and capital and infrastructure expenditure in order to give effect to improved service delivery. It must be done in such a way as not to have a detrimental impact on service delivery, but promote responsive and effective governance.
Furthermore, departments will, given the stress that communities might be subjected to, as well as the results of the Provincial Strategic Objectives development process, give careful attention to the desired impact to be achieved with the funds at their disposal and reprioritise accordingly.
As an austerity measure, by especially focusing on personnel issues, departments will continue with efficiency and effectiveness drives, improve their focus on measurability and do more with less. This will assist in creating fiscal stability over the 2012 MTEF.
2011 Adjusted Budget
The 2011 Adjusted Budget proposes spending of an additional R211.9 million for the 2011/12 financial year. It lays the basis for the broad policy allocations in the Medium Term Budget Policy Statement and consists mainly of technical adjustments and allocations for specific purposes. It is a restrained adjusted budget, taking due consideration of the limited fiscal resources

CHAPTER 4: EXPENDITURE TRENDS
57
available in the 2012 Medium Term Expenditure Framework (MTEF). It deals with really necessary amendments to the current financial year in order to achieve fiscal consolidation and stability over the medium term and to enhance resilience against external fiscal shocks.
Given the tight fiscal envelope for the 2012 MTEF period, through this Adjusted Budget it is endeavoured to ‘free up’ as much funds as possible in the 2011/12 financial year to enable departments to create a buffer so as to fund (or partially fund) the shortfall in the 2012/13 financial year, to thus ensure that the fiscus can sustainably finance future expenditure needs.
The additions, shifts excluded, taken up in the 2011 Adjusted Budget, are as follows:
• R7.6 million to cover the higher than anticipated wage settlement cost at Further Education and Training (FET) colleges.
• R100.7 million for the rollover of unspent 2010/11 national conditional grants.
• R28.3 million for 2010/11 the rollover of unspent provincial funds and R0.4 million for the retention of 2010/11 over recovered revenue.
• R20 million for the forward bringing of Education infrastructure projects.
• Regarding the Augmentation of the EPWP Incentive grant for provinces, R5.2 million for the Social Sector and R6.1 million for the Infrastructure Sector.
• R17.1 million as emergency funds in terms of section 25(1) of the Public Finance Management Act, 1999, (Act 1 of 1999) (PFMA) for Agriculture for management of a critical stage in the Avian Influenza outbreak.
• R31.8 million for B3 municipal library services and R3.7 million for a library books stock take.
• A net R7.4 million to departments that collected additional 2011/12 own receipts and requested it to be utilised for specific expenditure purposes.
To enhance resilience in the 2012/13 financial year and to protect baselines, no funds have been allocated to provincial departments with regard to the 2011 wage agreement, which was 1.3 per cent higher than the initial plan when the 2011 Main Budget was tabled. The needs that do exist will be covered via internal reprioritisation from current allocations.

MEDIUM TERM BUDGET POLICY STATEMENT 2012 - 2015
58
Conclusion
Given the current fiscal and economic environment, there is a need for the relevant departments to continue with improving spending plans in respect of capital, especially on infrastructure. In respect of current expenditure, i.e. goods and services and transfer payments, departments will do further work to improve internal efficiencies and to assess what combination of expenditure will give the greatest return with respect to service to the communities.
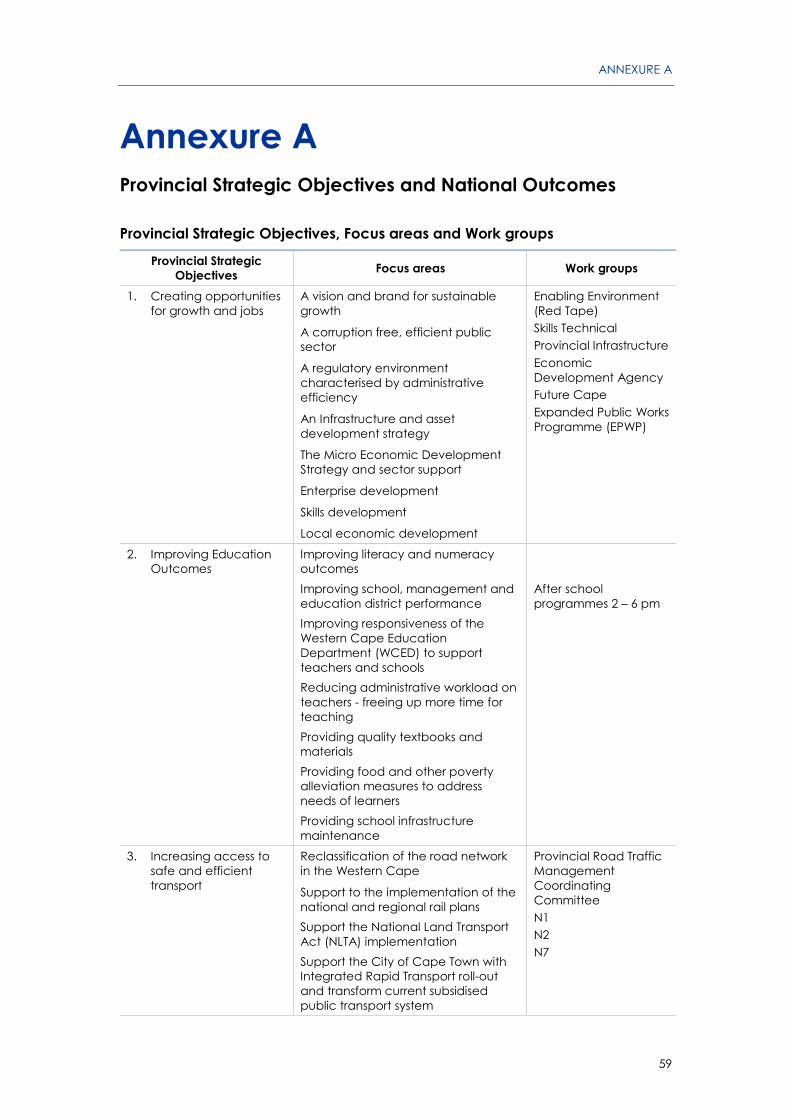
ANNEXURE A
59
Annexure A Provincial Strategic Objectives and National Outcomes
Provincial Strategic Objectives, Focus areas and Work groups
Provincial Strategic Objectives Focus areas Work groups
1. Creating opportunities for growth and jobs
A vision and brand for sustainable growth
Enabling Environment (Red Tape) Skills Technical Provincial Infrastructure Economic Development Agency Future Cape Expanded Public Works Programme (EPWP)
A corruption free, efficient public sector
A regulatory environment characterised by administrative efficiency
An Infrastructure and asset development strategy
The Micro Economic Development Strategy and sector support
Enterprise development
Skills development
Local economic development
2. Improving Education Outcomes
Improving literacy and numeracy outcomes
Improving school, management and education district performance
After school programmes 2 – 6 pm
Improving responsiveness of the Western Cape Education Department (WCED) to support teachers and schools
Reducing administrative workload on teachers - freeing up more time for teaching
Providing quality textbooks and materials
Providing food and other poverty alleviation measures to address needs of learners
Providing school infrastructure maintenance
3. Increasing access to safe and efficient transport
Reclassification of the road network in the Western Cape
Provincial Road Traffic Management Coordinating Committee N1 N2 N7
Support to the implementation of the national and regional rail plans
Support the National Land Transport Act (NLTA) implementation
Support the City of Cape Town with Integrated Rapid Transport roll-out and transform current subsidised public transport system

MEDIUM TERM BUDGET POLICY STATEMENT 2012 - 2015
60
Provincial Strategic Objectives Focus areas Work groups
Implement rural transport interventions
Reduce road fatalities Improved and coordinated law
enforcement activities
4. Increasing wellness Interventions to manage the burden of disease
Healthy Lifestyles Injury Prevention Women’s Health Child Health Preventing and controlling HIV and Aids, STIs and TB
Improving the quality of public health care response
Implementing Health care 2020
Decreasing the incidence of infectious disease (HIV and TB)
Decreasing the incidence of injuries
Decreasing the incidence of non-communicable diseases
Decreasing the incidence of childhood illness
Commitment to achieving the MDG's related to Health
5. Increasing Safety Making safety everyone's responsibility
Civilian oversight Western Cape safety partnership Road Safety Maximising the safety contribution of PGWC institutions, assets and people
Optimising security services for government assets, personnel and visitors
Optimising civilian oversight
Optimising road safety
6. Developing integrated and sustainable Human Settlements
Upscale the implementation of serviced sites
Human Settlement Planning Human Settlement Delivery Affordable Housing
Reduce bulk infrastructure as a constraint to human settlement development
Reduce institutional/human resource capacity constraints
Acquisition of well-located land Provide a fair allocation of housing opportunities Educate beneficiaries in respect of rights and responsibilities of ownership and rental housing Promote security of tenure
Increase densities of new human settlement developments on well-located land Closing the gap in the property market through private investment Enhancing the supply of new rental housing opportunities to encourage improved property management of rental housing stock
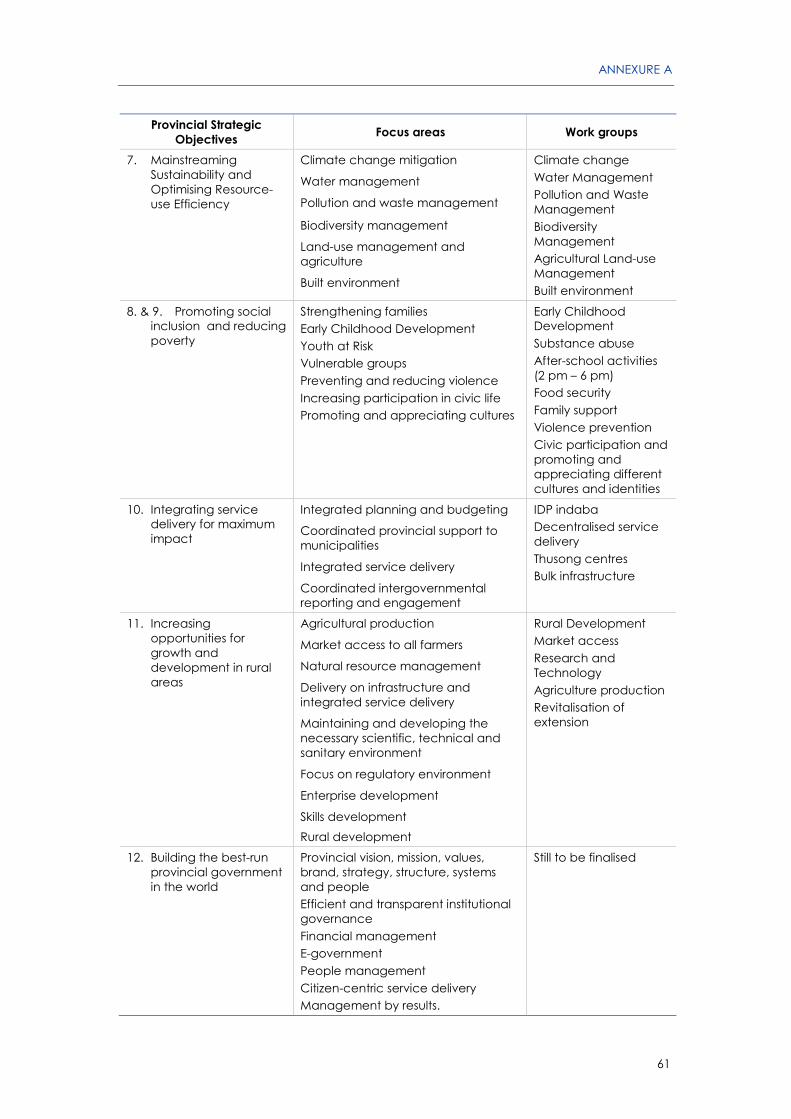
ANNEXURE A
61
Provincial Strategic Objectives Focus areas Work groups
7. Mainstreaming Sustainability and Optimising Resource-use Efficiency
Climate change mitigation Climate change Water Management Pollution and Waste Management Biodiversity Management Agricultural Land-use Management Built environment
Water management
Pollution and waste management
Biodiversity management
Land-use management and agriculture
Built environment
8. & 9. Promoting social inclusion and reducing poverty
Strengthening families Early Childhood Development Youth at Risk Vulnerable groups Preventing and reducing violence Increasing participation in civic life Promoting and appreciating cultures
Early Childhood Development Substance abuse After-school activities (2 pm – 6 pm) Food security Family support Violence prevention Civic participation and promoting and appreciating different cultures and identities
10. Integrating service delivery for maximum impact
Integrated planning and budgeting IDP indaba Decentralised service delivery Thusong centres Bulk infrastructure
Coordinated provincial support to municipalities
Integrated service delivery
Coordinated intergovernmental reporting and engagement
11. Increasing opportunities for growth and development in rural areas
Agricultural production Rural Development Market access Research and Technology Agriculture production Revitalisation of extension
Market access to all farmers
Natural resource management
Delivery on infrastructure and integrated service delivery
Maintaining and developing the necessary scientific, technical and sanitary environment
Focus on regulatory environment
Enterprise development
Skills development Rural development
12. Building the best-run provincial government in the world
Provincial vision, mission, values, brand, strategy, structure, systems and people Efficient and transparent institutional governance Financial management E-government People management Citizen-centric service delivery Management by results.
Still to be finalised

MEDIUM TERM BUDGET POLICY STATEMENT 2012 - 2015
62
12 National Outcomes
National Outcomes
1. Improved quality of basic education
2. A long and healthy life for all South Africans
3. All people in South Africa are and feel safe
4. Decent employment through inclusive growth
5. A skilled and capable workforce to support an inclusive growth path
6. An efficient, competitive and responsive economic infrastructure network
7. Vibrant, equitable and sustainable rural communities with food security for all
8. Sustainable human settlements and improved quality of household life
9. A responsive, accountable, effective and efficient local government system
10. Environmental assets and natural resources that are well protected and continually enhanced
11. Create a better South Africa and contribute to a better and safer Africa and World
12. An efficient, effective and development oriented public service and an empowered, fair and inclusive citizenship
GLOSSARY
63
Glossary
Baseline The initial allocations used during the budget process, derived from the previous year’s forward estimates.
Basic prices Basic prices is the measure of Gross Domestic Product that does not take into account the value of taxes levied and subsidies received on production.
Broad unemployment Includes discouraged employment seekers in the labour force.
Budget policy Budget policy is the means by which government directs and adjusts its overall and differentiated levels of spending in order to foster and influence a nation's economy and social welfare.
Burden of disease Refers to the nature and drivers of the causes of mortality and morbidity.
Conditional Grants Allocations of money from one sphere of government to another, conditional on certain services being delivered or on compliance with specified requirements.
Consumer price inflation (CPI) The main measure of inflation, charting the price movements of a basket of consumer goods and services.
Countercyclical fiscal policy Policy that has the opposite effect on economic activity to that caused by the business cycle, such as slowing spending growth in a boom period and accelerating spending in a recession.
Current account (of the balance of payments)
The difference between total exports and total imports, also taking into account service payments and receipts, interest, dividends and transfers. The current account can be in deficit or surplus. See also trade balance.
Discouraged work seekers Individuals who want to work and are available to work, but who are not actively looking for work.
Division of revenue The allocation of funds between the spheres of government as required by the Constitution. See also equitable share.

MEDIUM TERM BUDGET POLICY STATEMENT 2012 - 2015
64
Equitable share The allocation of revenue to the national, provincial and local spheres of government as required by the Constitution. See also division of revenue.
Financial year The 12 months according to which companies and organisations budget and account.
Fiscal framework A framework for integrating fiscal policy and budgeting over the medium-term by linking a system of aggregate fiscal forecasting to a disciplined process of maintaining detailed medium-term budget estimates by ministries reflecting existing government policies.
Fiscal policy Policy on taxation, spending and borrowing by government.
Fiscal space The ability of a government’s budget to provide additional programme resources without jeopardising fiscal sustainability.
Gini coefficient The Gini coefficient is a measure of the inequality of a distribution, a value of 0 expressing total equality and a value of 1 maximal inequality.
Gross domestic product (GDP) A measure of the total national output, income and expenditure in the economy. GDP per head is the simplest overall measure of welfare, although it does not take account of the distribution of income, nor of goods and services produced outside the market economy.
Headline CPI The main measure of inflation, charting the price movements of a basket of consumer goods and services.
Industrial development zone Designated sites linked to an international air or sea port, supported by incentives to encourage investment in export-oriented manufacturing and job creation.
Inflation An increase in the general level of prices.
Labour absorptive capacity Quantifies the difference between target employment growth rate and actual employment growth rate.
Labour force Number of employed and unemployed individuals of working age.
Medium-term expenditure framework (MTEF)
The three-year spending plans of national and provincial governments published at the time of the Budget.

GLOSSARY
65
Narrow unemployment rate Rate of unemployment that does not take into account the discouraged employment seekers from the labour force.
National budget The projected revenue and expenditure that flow through the National Revenue Fund. It does not include spending by provinces or local government from their own revenues.
Provincial own receipts Refers to taxes/fees and/or user charges, which a provincial department receives.
Public entities Companies, agencies, funds and accounts that are fully or partly owned by government or public authorities and are regulated by law.
Real consumer spending Expenditure on goods and services, including salaries, which are used up within a short period of time – usually a year.
Real interest rate The level of interest after taking account of inflation.
Recession Decline of Gross Domestic Product for two or more consecutive quarters.
Seasonally adjusted and annualised
The process of removing the seasonal volatility (monthly or quarterly) from a time series. This provides a measure of the underlying trend in the data. Annualised: to express a rate as if it were applied over one year.
Working age population Individuals aged between 15 and 65.