Mediterranean Investment and Partnership Observatory
17
ANIMA-MIPO ANIMA MIPO FDI and Partnership Observatory 4 lessons from the crisis MENA-OECD Investment Programme MENA OECD Investment Programme 19-20 March 2013 www.anima.coop
-
Upload
oecdglobal -
Category
News & Politics
-
view
287 -
download
2
Transcript of Mediterranean Investment and Partnership Observatory

ANIMA-MIPOANIMA MIPO FDI and PartnershipObservatory
4 lessons fromthe crisis
MENA-OECD Investment ProgrammeMENA OECD Investment Programme19-20 March 2013
www.anima.coop
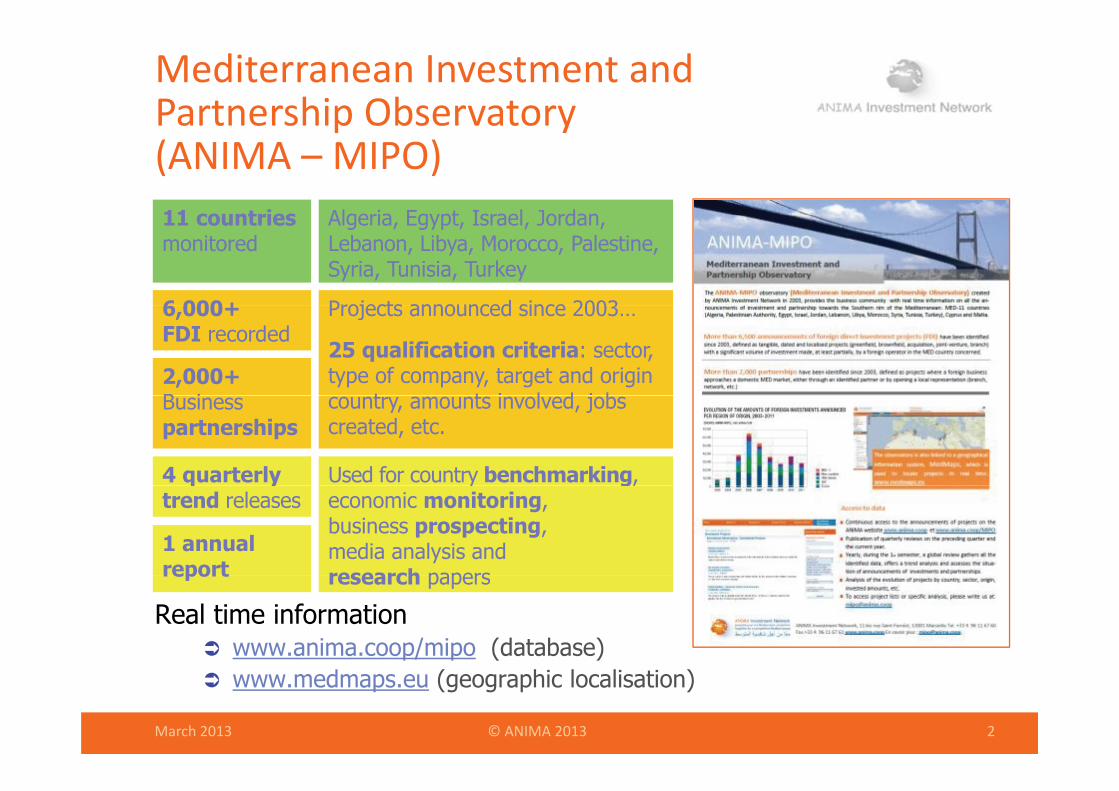
Mediterranean Investment and Partnership Observatoryp y(ANIMA – MIPO)11 countries Algeria Egypt Israel Jordan
6 000+
11 countriesmonitored
Algeria, Egypt, Israel, Jordan, Lebanon, Libya, Morocco, Palestine, Syria, Tunisia, Turkey
Projects announced since 20036,000+ FDI recorded
2,000+ B i
Projects announced since 2003…
25 qualification criteria: sector, type of company, target and origin
t t i l d j bBusiness partnerships
4 quarterly Used for country benchmarking,
country, amounts involved, jobs created, etc.
q ytrend releases
y g,economic monitoring, business prospecting, media analysis and research papers
1 annual report
Real time information www.anima.coop/mipo (database)
research papersreport
March 2013 © ANIMA 2013 2
www.medmaps.eu (geographic localisation)

4 lessons from the crisis 2008‐2012
FDI in the MED region in 2012:g
A good resilienceA good resilience
#1#1

Change in FDI flows & number of projects in 2012p j € 37.0 bn FDI announced in 2012: +5% in comparison with 2010 645 projects detected: -24% in comparison with 2010
64 523789
844 90070 000
FDI inflows ANIMA (€m) FDI inflows UNCTAD (€m) Number of projects
53 002
51 046 42 885
621
761 784 789
562
666 645
600
700
800
50 000
60 000
proj
ects
ws
(€m
illio
n)
35 145
37 272
28 036
35 313
27 184
37 061
30 135
51 04646 369
30 038
28 734
30 301
249306
300
400
500
30 000
40 000
Num
ber
of p
FDI i
nflo
w
9 860
11 683
27 184
12 397
11 342
28 734249
100
200
300
10 000
20 000
00
2003 2004 2005 2006 2007 2008 2009 2010 2011 2012
March 2013 © ANIMA 2013 4
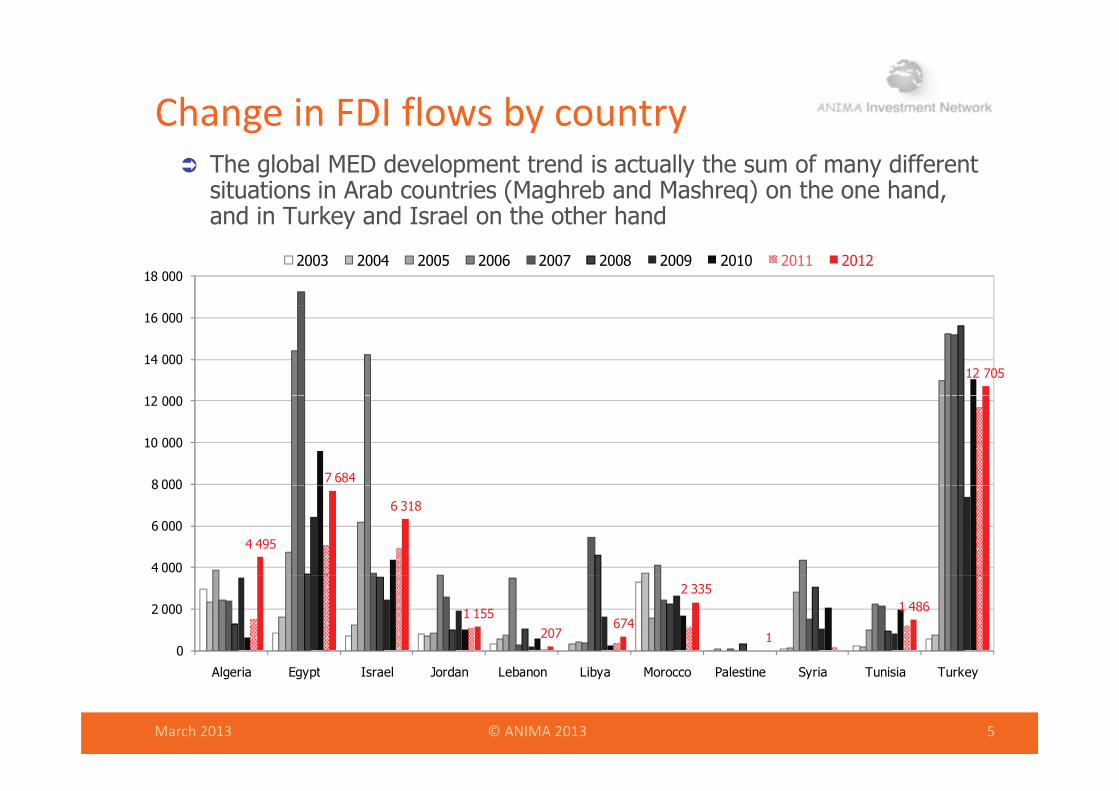
Change in FDI flows by countryg y y The global MED development trend is actually the sum of many different
situations in Arab countries (Maghreb and Mashreq) on the one hand, and in Turkey and Israel on the other handand in Turkey and Israel on the other hand
18 0002003 2004 2005 2006 2007 2008 2009 2010 2011 2012
12 70514 000
16 000
7 6848 000
10 000
12 000
4 495
6 318
4 000
6 000
8 000
1 155207
674
2 335
1
1 486
0
2 000
March 2013 © ANIMA 2013 5
Algeria Egypt Israel Jordan Lebanon Libya Morocco Palestine Syria Tunisia Turkey

Inward FDIs: invested amounts2006 2007 2008 2009 2010 2011 2012
€12.7 bn in 2012 127 projects
€6.3 bn in 2012 152 projects
TurkeyBank, Energy,
Real estate, Agribusiness, Di t ib ti A t ti
IsraelITC, Energy,
Drugs, Biotech
€1.5 bn in 2012 74 projects
€0 bn in 20120 project
Distribution, Automotive
€0.2 bn in 2012 19 j
€4.5 bn in 2012 44 projects€2.3 bn in 2012
120 projects
TunisiaTelecom, Energy,
Bank, Tourism,Consulting, Software
SyriaEnergy, Cement,
Real estate, Bank
€1 2012
LebanonTourism & Real estate , Bank,
Telecom, Consulting
19 projects
€0.7 bn in 2012 14 projects
€7.7 bn in 2012 68 projects
MoroccoTourism & Real Estate, Telecom, Bank, Agribusiness,
Automotive
AlgeriaEnergy, Telecom, Cement, Metallurgy,
Real estate
Lib
PalestineReal estate, ITC
€1m 2012 3 projects
€1.2 bn in 2012 24 projects
LibyaEnergy, Real estate,
Bank, Cement
EgyptE T l
Jordan
March 2013 © ANIMA 2013 6
Source: ANIMA-MIPO, Announced FDI ProjectsEnergy, Telecom,
Real estate, Cement, Bank
Jo daReal estate &
Tourism, Energy, Bank,Telecom

4 lessons from the crisis 2008‐2012
I t b h iInvestors behavior changed during the 2008‐2012 crisisg g
A more cautious approachA more cautious approach
#2#2

Change in partnership projects in 2012 Partnerships (ANIMA-MIPO): i.e. Non-Equity Modes of International
Production and Development (UNCTAD) 505 j t d t t d i 2012 2% i i ith 2010 505 projects detected in 2012: -2% in comparison with 2010
515
600
Management contract515
377
505
400
500
ersh
ips
Management contract
Technological partnership
Development agreement
152
207
295
200
300
umbe
r of
par
tn
Commercial partnership
Representative office
37
10889
123152
0
100
Nu
Franchise, shop, etc.
0
2003 2004 2005 2006 2007 2008 2009 2010 2011 2012
March 2013 © ANIMA 2013 8
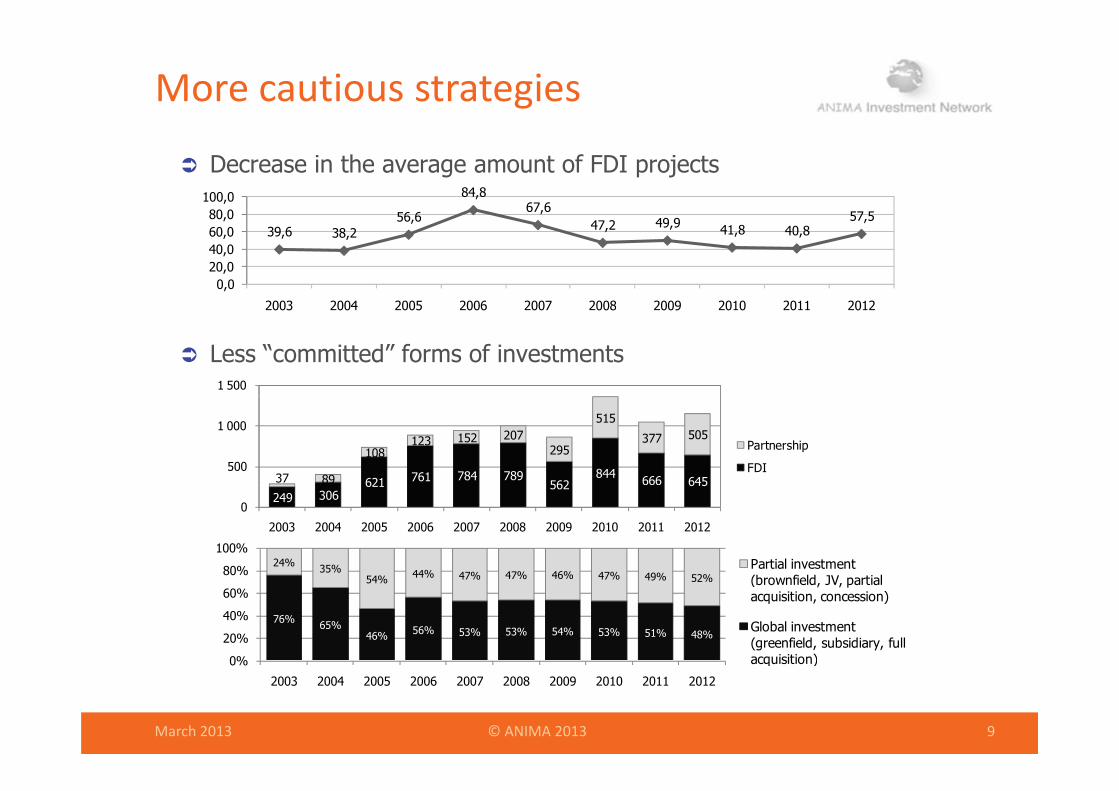
More cautious strategies
Decrease in the average amount of FDI projects
56 6
84,867,6
57 580 0100,0
39,6 38,256,6
47,2 49,9 41,8 40,857,5
0,020,040,060,080,0
2003 2004 2005 2006 2007 2008 2009 2010 2011 2012
1 500
Less “committed” forms of investments
2003 2004 2005 2006 2007 2008 2009 2010 2011 2012
621 761 784 789562
844 666 64537 89
108123 152 207
295
515
377 505
500
1 000
Partnership
FDI
249 306621 562 645
0
2003 2004 2005 2006 2007 2008 2009 2010 2011 2012
24% 35% 44% 47% 47% 46% 47% 49% 52%80%
100%Partial investment (b fi ld JV i l
76% 65%46% 56% 53% 53% 54% 53% 51% 48%
54% 44% 47% 47% 46% 47% 49% 52%
0%
20%
40%
60%
80%(brownfield, JV, partial acquisition, concession)
Global investment (greenfield, subsidiary, full acquisition)
March 2013 © ANIMA 2013 9
0%
2003 2004 2005 2006 2007 2008 2009 2010 2011 2012
q )

4 lessons from the crisis 2008‐2012
Origin of foreign investment
The decline of Europe pleadership
#2#2

Inward FDIs: number of projects
Europe = still 45% of announced FDI in 2012 in number of projects, but the European leadership is faltering
Oth i Other regions: North America = 23% Gulf = 12%
Other countries (including BRICs) =14% Other countries (including BRICs) =14% Intra-MED = 6%
Western investors (Europe, North America): a crisis of confidence?377 392400
318341
377 372
306
392
312289
300
400
ects
Europe
G lf
152174
158 148123
138
204 199
150200
Num
ber
of p
roje Gulf
USA-Canada
80 71
104
597836
47
123
138 136101
6274 78
83 8770
92
3850 53 50
2957
36
100
N
Other countries
MED-11
March 2013 © ANIMA 2013 11
14 1838 29 26 360
2003 2004 2005 2006 2007 2008 2009 2010 2011 2012

Inward FDIs: invested amounts
2012 is a record year for the “Other countries” (including BRICs) in announced FDI amounts
4 projects > €1bn : Bank Telecom & Tourism in Turkey Egypt & Algeria 4 projects > €1bn : Bank, Telecom & Tourism in Turkey, Egypt & Algeria FDI from the Gulf States on the rise again
Major sectors: Bank, Real estate, Tourism and TelecomBut a rising interest in Agrifood Renewable energy Consulting But a rising interest in Agrifood, Renewable energy, Consulting...
60000
70000
FDI inflows
30 1
327856693360
20157
5923
40000
50000
60000
USA-Canada
FDI inflows in € million
6714
19375
14758
8484
62233801
3071
3940
5656
20148793
5529
10766
70994742
4208
4992
5869
6294
20000
30000Other countries
MED-11
lf
4550 7262
15986 16698
2599918321 15461 17211
12775 991018432009
62232623 9631
9601654
0
10000
2003 2004 2005 2006 2007 2008 2009 2010 2011 2012
Gulf
Europe
March 2013 © ANIMA 2013 12
2003 2004 2005 2006 2007 2008 2009 2010 2011 2012

4 lessons from the crisis 2008‐2012
A sector rotation since 2011
Towards more inclusive investments?
#4#4

2011 and 2012: record years for productive investmentspTop 5 unchanged
Energy, Banking, Telecoms, Building and public works and Cementgy, g, , g p
But the crisis has favoured strategic sectors for the region Software, Automobiles, Medicines: a slow but constant rise, , Agrifood, Distribution, Consulting: encouraging trend in 2011 but a
decline in 2012 Aeronautics and Mechanics: a good performance in 2012g p cf. ANIMA/CMI survey (2011): most effective sectors in terms
of job creation
March 2013 © ANIMA 2013 14

Boosting EuroMed MSMEs
Emphasise current FDI trends Regional cluster initiatives to make the Mediterranean attractive on g
GLOBAL SPECIALTIES: Agrifood, Logistics, ICT, Media, Medicines, Automotive and Aeronautics industries, Distribution, etc.
Develop national aftercare strategies to boost reinvestments ( t ti l f €10 15 b )(potential of €10-15 bn)
2%5%
Global FDI inflows : MED-11 share (UNCTAD)
2,5% 2,4%1 8%
3,7%4,2%
3,0%3,3% 3,2%
2,8% 2,6%3%
4%
0,8%
1,4%1,8%
0%
1%
2%
2000 2001 2002 2003 2004 2005 2006 2007 2008 2009 2010 2011
March 2013 © ANIMA 2013 15

Promoting more inclusive investments
The EDILE initiative Developing better investment projects around the Mediterranean: p g p j
more inclusive activities, lower impact on the environment, higher local participation (jobs, etc.)
Mixing territories and financing institutions Building a referential for evaluating project global performance
Take investment inclusiveness into account Quantity and quality of jobs, economic spillovers and subcontracting,
compatibilit ith co nt economic and te ito ial st ategcompatibility with country economic and territorial strategy Leverage on local banks to drive investments to more inclusiveness,
by associating Development Finance Institutions Improve local governance for project appraisal Improve local governance for project appraisal
Associate local authorities, CCI, Business Federations, investment authorities, civil society
March 2013 © ANIMA 2013 16

Thank you for your attention
Emmanuel NOUTARY, General Delegate Emmanuel NOUTARY, General [email protected]
Zoé LUÇON, Project Managerzoe lucon@anima [email protected]
ANIMA Investment Network11b rue Saint Ferréol13001 Marseille – FRT. +33(0) 4 9611 6760www anima coopwww.anima.coop


![Mediterranean Sea: The GEF Strategic Partnership for the Mediterranean LME (Lascaratos) [IWC4 Presentation]](https://static.fdocuments.us/doc/165x107/5468abe2af7959a75e8b4b3e/mediterranean-sea-the-gef-strategic-partnership-for-the-mediterranean-lme-lascaratos-iwc4-presentation.jpg)