Medicare Part D Program Evaluation: Analysis of the Impact ......Analysis of the Impact of Medicare...
155
The Centers for Medicare & Medicaid Services’ Office of Research, Development, and Information (ORDI) strives to make information available to all. Nevertheless, portions of our files including charts, tables, and graphics may be difficult to read using assistive technology. Persons with disabilities experiencing problems accessing portions of any file should contact ORDI through e-mail at [email protected]. June 2011 Medicare Part D Program Evaluation: Analysis of the Impact of Medicare Part D on the FFS Program and Issues Related to Medication Adherence for Six Chronic Conditions—2008 Final Report Prepared for Benjamin Howell, PhD U.S. Department of Health and Human Services Centers for Medicare & Medicaid Services Research & Evaluation Group/ORDI Mail Stop C3-21-08 7500 Security Boulevard Baltimore, MD 21244 410-786-6628 [email protected] Prepared by Melvin J. Ingber, PhD Sara Freeman, MS Deborah Healy, PhD John Kautter, PhD Sarah Siegel, PhD RTI International 3040 Cornwallis Road Research Triangle Park, NC 27709 RTI Project Number 0209853.009.005
Transcript of Medicare Part D Program Evaluation: Analysis of the Impact ......Analysis of the Impact of Medicare...
The Centers for Medicare & Medicaid Services’ Office of Research, Development, and Information (ORDI) strives to make information available to all. Nevertheless, portions of our files including charts,
tables, and graphics may be difficult to read using assistive technology. Persons with disabilities experiencing problems accessing portions of any file should contact ORDI through e-mail at
June 2011
Medicare Part D Program Evaluation: Analysis of the Impact of Medicare Part D on
the FFS Program and Issues Related to Medication Adherence for Six Chronic
Conditions—2008
Final Report
Prepared for Benjamin Howell, PhD
U.S. Department of Health and Human Services Centers for Medicare & Medicaid Services
Research & Evaluation Group/ORDI Mail Stop C3-21-08
7500 Security Boulevard Baltimore, MD 21244
410-786-6628 [email protected]
Prepared by Melvin J. Ingber, PhD
Sara Freeman, MS Deborah Healy, PhD
John Kautter, PhD Sarah Siegel, PhD
RTI International 3040 Cornwallis Road
Research Triangle Park, NC 27709
RTI Project Number 0209853.009.005
MEDICARE PART D PROGRAM EVALUATION: ANALYSIS OF THE IMPACT OF MEDICARE PART D ON THE FFS PROGRAM AND ISSUES RELATED TO MEDICATION ADHERENCE FOR SIX CHRONIC CONDITIONS—2008
Authors: Melvin J. Ingber, PhD Sara Freeman, MS Deborah Healy, PhD John Kautter, PhD Sarah Siegel, PhD
Project Director: Melvin J. Ingber, PhD
Federal Contracting Officer’s Technical Representative: Benjamin Howell, PhD
RTI International
CMS Contract No. HSM-500-2005-0029I
June 2011
This project was funded by the Centers for Medicare & Medicaid Services under Contract No. HHSM-500-2005-0029I. The statements contained in this report are solely those of the authors and do not necessarily reflect the views or policies of the Centers for Medicare & Medicaid Services. RTI assumes responsibility for the accuracy and completeness of the information contained in this report.
CONTENTS
Executive Summary .........................................................................................................................1
1 Project Introduction ..............................................................................................................11
2 Descriptive Analysis of Part D Enrollment Patterns.............................................................15 2.1 Introduction ..................................................................................................................15 2.2 Data and Methods ........................................................................................................17 2.3 Cross-Disease Results ..................................................................................................19
2.3.1 Type of Coverage .............................................................................................19 2.3.2 Beneficiary Characteristics ..............................................................................20 2.3.3 Drug Expenditures ...........................................................................................21 2.3.4 Plan Enrollment ...............................................................................................22 2.3.5 Geographic Variation .......................................................................................24
2.4 Plan Switching .............................................................................................................25 2.4.1 Plan Level Switching .......................................................................................26 2.4.2 High Spenders—Coverage Level Switching ...................................................26
2.5 Discussion ....................................................................................................................27
3 Adherence Measures .............................................................................................................43 3.1 Introduction ..................................................................................................................43 3.2 Data and Methods ........................................................................................................45 3.3 Medication Possession Ratios ......................................................................................47 3.4 Adherence Measures in the Gap ..................................................................................49
3.4.1 Beneficiaries Who Entered But Did Not Exit the Gap ....................................50 3.4.2 Beneficiaries Who Entered and Exited the Gap ..............................................51
3.5 Discussion of Drug Adherence Measures ....................................................................53
4 Effect of Part D on Drug Adherence and Health Outcomes—Medicare Current Beneficiary Survey Analysis ...................................................................................77 4.1 Introduction ..................................................................................................................77 4.2 Methods and Data ........................................................................................................79
4.2.1 Propensity Score Analysis Approach ..............................................................80 4.2.2 Sample Selection ..............................................................................................81 4.2.3 Analytic Variables ...........................................................................................83 4.2.4 Multivariate Statistical Methods ......................................................................86 4.2.5 Accounting for Survey Structure and Design ..................................................87
4.3 Descriptive Results ......................................................................................................88 4.4 Multivariate Results .....................................................................................................90
4.4.1 Intermediate Results—Propensity Score Methodology ...................................90
iii
4.4.2 Impact of Part D on Drug Adherence Results .................................................91 4.4.3 Impact of Part D on Inpatient and ED Event Results ......................................92 4.4.4 Impact of Adherence on Inpatient and ED Event Results ...............................93
4.5 Discussion ....................................................................................................................93
5 Impact of Part D on Medicare Spending and Utilization, 2005–2008 ................................111 5.1 Introduction ................................................................................................................111 5.2 Data ............................................................................................................................112
5.2.1 Definition of Disease Groups.........................................................................113 5.3 Method .......................................................................................................................115 5.4 Results ........................................................................................................................118 5.5 Discussion ..................................................................................................................119
6 Analysis of the Effect of Adherence on Outcomes and Utilization ....................................127 6.1 Introduction ................................................................................................................127 6.2 Data ............................................................................................................................128 6.3 Methods......................................................................................................................129 6.4 Results ........................................................................................................................131 6.5 Discussion ..................................................................................................................133
7 Summary and Conclusions .................................................................................................141
Bibliography ................................................................................................................................143
List of Figures
4.1 Propensity score overlap between Part D and no coverage groups ............................ 95
List of Tables
2.1 Chronic condition sample definitions ......................................................................... 29 2.2 Selected disease group drug plan enrollment statistics for full sample—fee-for-
service (FFS) and Medicare Advantage (MA), July 2008 .......................................... 30 2.3 Selected disease group descriptive statistics for beneficiaries enrolled in fee-for-
service prescription drug plans (FFS-PDPs), July 2008 ............................................. 31 2.4 Selected disease group descriptive statistics for beneficiaries enrolled in
Medicare Advantage prescription drug plans (MA-PDs), July 2008 ......................... 32 2.5 Prescription drug hierarchical condition categories (RxHCCs) statistics for non-
low-income beneficiaries enrolled in fee-for-service prescription drug plans (FFS-PDPs), July 2008 ............................................................................................... 33
2.6 Prescription drug hierarchical condition categories (RxHCCs) statistics for non-low-income beneficiaries enrolled in Medicare Advantage prescription drug plans (MA-PDs), July 2008 ........................................................................................ 34
2.7 Selected disease group drug-expenditure descriptive statistics for beneficiaries enrolled in fee-for-service prescription drug plans (FFS-PDPs), July 2008 ............... 35
iv
2.8 Selected disease group drug-expenditure descriptive statistics for beneficiaries enrolled in Medicare Advantage prescription drug plans (MA-PDs), July 2008 ....... 36
2.9 Selected disease group plan enrollment statistics for beneficiaries enrolled in fee-for-service prescription drug plans (FFS-PDPs), July 2008 ................................. 37
2.10 Selected disease group plan enrollment statistics for beneficiaries enrolled in Medicare Advantage prescription drug plans (MA-PDs), July 2008 ......................... 38
2.11 Geographic enrollment statistics for beneficiaries enrolled in prescription drug plans, fee-for-service (FFS-PDP), and Medicare Advantage (MA-PD), July 2008............................................................................................................................. 39
2.12 Enrollment patterns and characteristics of plan type “Stayers” and “Switchers”: Full 2007–2008 PDP and MA-PD continuing enrollee Part D population ................. 40
2.13 Enrollment patterns of coverage type “Stayers” and “Switchers” (switch to gap coverage in 2008) for Part D high spenders: Part D continuing enrollees with annual drug expenditures $3,000 in 2007 and in 2008, non-low-income in 2007 and 2008, and no gap coverage in 2007 ............................................................. 41
3.1 Number of beneficiaries, by chronic disease and low-income subsidy (LIS)
status, 2008 ................................................................................................................. 55 3.2a Distribution of medication possession ratios (MPRs), by low-income subsidy
(LIS) status, Diabetes with complications, 2008 ........................................................ 56 3.2b Distribution of medication possession ratios (MPRs), by low-income subsidy
(LIS) status, Chronic obstructive pulmonary disease, 2008 ....................................... 57 3.2c Distribution of medication possession ratios (MPRs), by low-income subsidy
(LIS) status, Congestive heart failure, 2008 ............................................................... 58 3.2d Distribution of medication possession ratios (MPRs), by low-income subsidy
(LIS) status, Dementia, 2008 ...................................................................................... 59 3.2e Distribution of medication possession ratios (MPRs), by low-income subsidy
(LIS) status, Major depression, 2008 .......................................................................... 60 3.2f Distribution of medication possession ratios (MPRs), by low-income subsidy
(LIS) status, Rheumatoid arthritis, 2008 .................................................................... 61 3.3 Number of beneficiaries who entered but did not exit the gap, by chronic
disease and low-income subsidy (LIS) status, 2008 ................................................... 62 3.4a Medication possession ratios (MPRs) for beneficiaries who entered but did not
exit the coverage gap, by low-income subsidy (LIS) status, Diabetes with complications, 2008 .................................................................................................... 63
3.4b Medication possession ratios (MPRs) for beneficiaries who entered but did not exit the coverage gap, by low-income subsidy (LIS) status, Chronic obstructive pulmonary disease, 2008 ............................................................................................. 64
3.4c Medication possession ratios (MPRs) for beneficiaries who entered but did not exit the coverage gap, by low-income subsidy (LIS) status, Congestive heart failure, 2008 ................................................................................................................ 65
3.4d Medication possession ratios (MPRs) for beneficiaries who entered but did not exit the coverage gap, by low-income subsidy (LIS) status, Dementia, 2008 ............ 66
3.4e Medication possession ratios (MPRs) for beneficiaries who entered but did not exit the coverage gap, by low-income subsidy (LIS) status, Major depression, 2008............................................................................................................................. 67
v
3.4f Medication possession ratios (MPRs) for beneficiaries who entered but did not exit the coverage gap, by low-income subsidy (LIS) status, Rheumatoid arthritis, 2008 .............................................................................................................. 68
3.5 Number of beneficiaries who entered and exited the gap, by chronic disease and low-income subsidy (LIS) status, 2008 ...................................................................... 69
3.6a Medication possession ratios (MPRs) for beneficiaries who entered and exited the coverage gap, by low-income subsidy (LIS) status, Diabetes with complications, 2008 .................................................................................................... 70
3.6b Medication possession ratios (MPRs) for beneficiaries who entered and exited the coverage gap, by low-income subsidy (LIS) status, Chronic obstructive pulmonary disease, 2008 ............................................................................................. 71
3.6c Medication possession ratios (MPRs) for beneficiaries who entered and exited the coverage gap, by low-income subsidy (LIS) status, Congestive heart failure, 2008............................................................................................................................. 72
3.6d Medication possession ratios (MPRs) for beneficiaries who entered and exited the coverage gap, by low-income subsidy (LIS) status, Dementia, 2008 ................... 73
3.6e Medication possession ratios (MPRs) for beneficiaries who entered and exited the coverage gap, by low-income subsidy (LIS) status, Major depression, 2008 ...... 74
3.6f Medication possession ratios (MPRs) for beneficiaries who entered and exited the coverage gap, by low-income subsidy (LIS) status, Rheumatoid arthritis, 2008............................................................................................................................. 75
4.1 2006–2007 MCBS analytic sample selection ............................................................. 96 4.2 Percent in each category for 2006–2007 MCBS final analytic sample, by drug
coverage ...................................................................................................................... 97 4.3 Percent in each category for 2006–2007 MCBS final analytic sample— by
condition ................................................................................................................... 100 4.4 Standardized bias results: Number of variables with standardized bias greater
than or less than 5% in each quintile ........................................................................ 103 4.5 Logistic regressions of whether the respondent reported nonadherence at least
“sometimes” on Part D and controls: Coefficients on Part D ................................... 104 4.6 Logistic regression of whether the respondent reported nonadherence “often”
on Part D and controls: Coefficients on Part D ......................................................... 105 4.7 Logistic regressions of whether the respondent filled at least one prescription
for the given chronic condition on Part D and controls: Coefficients on Part D ...... 106 4.8 Logistic regression of having at least one inpatient event (top row) or
emergency department event (second row) on Part D and controls: Coefficients on Part D ................................................................................................................... 107
4.9 Poisson regression of the number of inpatient and emergency department events on Part D and controls among those with at least one event: Coefficients on Part D ................................................................................................................................ 108
4.10 Logistic regression of having at least one inpatient event or emergency department event on Part D, adherence, and controls: Coefficients on Part D and frequent nonadherence ....................................................................................... 109
vi
4.11 Poisson regression of the number of inpatient and emergency department events on Part D, adherence and controls among those with at least one event: Coefficients on Part D and frequent nonadherence .................................................. 110
5.1 Selected descriptive statistics .................................................................................... 121 5.2 Effect of duration of Part D enrollment on probability of an inpatient stay, 2008
Subject: Female, age 75 ............................................................................................ 122 5.3 Effect of duration of Part D enrollment on probability of an emergency
department visit, 2008 Subject: Female, age 75 ....................................................... 123 5.4 Effect of duration of Part D enrollment on inpatient spending by users, 2008
Subject: Female, age 75 ............................................................................................ 124 5.5 Effect of duration of Part D enrollment on number of emergency department
visits by users, 2008 Subject: Female, age 75 .......................................................... 125 6.1 Selected statistics for dependent variables in regressions ......................................... 135 6.2 Mean levels of adherence for study cohorts ............................................................. 136 6.3 Effect of adherence in 2008 on probability of an inpatient stay for adherence
change from 0.5 to 0.75 Subject: Female, age 75 with adherence in 2007 set at 0.5.............................................................................................................................. 137
6.4 Effect of adherence in 2008 on probability of an emergency department visit Subject: Female, age 75, Part D enrollment 2.5 years with adherence in 2007 set at 0.5 .................................................................................................................... 138
6.5 Effect of adherence in 2008 on inpatient spending by users for adherence change from 0.5 to 0.75 Subject: Female, age 75 ..................................................... 139
6.6 Effect of adherence in 2008 on number of emergency department visits by users for adherence change from 0.5 to 0.75 Subject: Female, age 75 .............................. 140
vii

This page intentionally left blank.
EXECUTIVE SUMMARY
This report is the third in a series of reports evaluating the Medicare Part D Program. The first report, titled Medicare Part D Program Evaluation: Analysis of the Impact of Medicare Part D on the Fee-For-Service Program, presented analyses of the effect, in 2006, of the introduction of the Part D prescription drug program on the overall Medicare program (Ingber et al., 2010a). The implementation of Part D provided an option for Medicare beneficiaries to get insurance covering prescription drugs, whether they were in fee-for-service (FFS) Medicare or in a Medicare Advantage (MA) plan. The second report, titled Medicare Part D Program Evaluation: Analysis of the Impact of Medicare Part D on the Fee-For-Service Program and Issues Related to Medication Adherence for Six Chronic Conditions—2007, focused mostly on 2007, the second year of the program, which had a relatively stable enrollment, rather than the enrollment phase-in that characterized 2006 (Ingber et al., 2010b). This report builds on the previous report, studying primarily 2008 and changes from 2007 to 2008. For both our 2007 and 2008 analyses, we focused on beneficiaries who had chronic conditions to address the following research questions.
1. What are Part D enrollment patterns for beneficiaries with specific chronic conditions?
2. What is the impact of Part D on patient adherence to medication therapy?
3. What is the impact of Part D on health outcomes and health care utilization and costs for beneficiaries with chronic conditions?
4. What is the relationship between differences in patient adherence and differences in health outcomes and health care utilization and cost?
To address the questions, we looked at populations with any of six chronic conditions that are considered to be sensitive to drug therapies: chronic obstructive pulmonary disease (COPD), congestive heart failure (CHF), diabetes with complications, dementia, major depression, and rheumatoid arthritis. The choice of the conditions to analyze was also driven by prevalence in the population. RTI International used data on 100 percent of the population to conduct some of these studies to keep the sample sizes high enough to estimate multivariate models as well as get reliable descriptive statistics. We also used the Medicare Current Beneficiary Survey (MCBS), which has a small sample, to approach some of the questions using information not available in the Medicare operational files. The latest two MCBS surveys available were used, 2006 and 2007.
The research questions investigate various aspects of the impact that access to insurance for drugs is having on the Medicare population. The underlying premise is that drugs are effective in controlling chronic diseases. The chain of logic is that the drug benefit will reduce out-of-pocket drug costs to enrollees, and this will improve adherence to drug regimens, which will in turn change health status and related utilization measures. We have examined some of the steps in this chain in conjunction with the research questions.
1
E.1 Descriptive Analysis of Enrollment Patterns
The descriptive analysis, in Section 2, is intended to determine whether the people with chronic diseases made particular choices in enrolling in drug plans. We performed an in-depth descriptive analysis of the enrollment patterns of these populations in Part D plans and other forms of drug coverage, including Retiree Drug Subsidy plans, other forms of creditable coverage, and no known coverage. We profiled prescription drug plans (PDPs) primarily serving FFS beneficiaries and MA drug plans (MA-PDs) integrated with the MA plans. We tabulated enrollment choices by beneficiary demographics, subsidy eligibility, medical conditions, types of plans, plan premiums, and geographic locations.
We concentrated particularly on the enrollees who were not in low-income subsidy (LIS) status. Non-LIS beneficiaries could choose whether to enroll in Part D at all; to do so, they had to choose a specific plan. The LIS population was mostly auto-enrolled and had much lower out-of-pocket costs because of the subsidy of premiums and cost sharing. All of the beneficiaries profiled had at least one of the six study diseases. For comparison purposes, we also profiled the full continuing enrollee population.
In our previous 2007 chronic condition analysis, we identified a subset of beneficiaries who seemed to be enrolled in non-optimal drug plans based on their drug spending. We expanded this enrollment analysis to study two types of plan switching from 2007 to 2008: (1) Plan type switching (from PDP to MA-PD or the reverse) for the full Part D continuing enrollee population and each of the chronic conditions; and (2) Coverage type switching (from no gap coverage to gap coverage) for a subset of non-low-income “high spenders” who lacked gap coverage in 2007.
Among the notable findings in the enrollment profiles are the following:
• The number of beneficiaries in all six disease groups increased from 2007 to 2008. The diabetes with complications and major depression samples had the largest growth, increasing 6.6 percent and 7.5 percent, respectively, in the full combined FFS and MA population. Among the MA subset, the increase was more dramatic (21.4% and 31.2%). The latter increase could have been related to coding intensity as well as disease prevalence.
• The non-LIS beneficiaries in the disease cohorts who are enrolled in PDPs have predicted drug expenditures that are considerably higher than those of the baseline average FFS beneficiary, according to the risk adjustment model used by CMS to pay drug plans. The predicted values for people in these disease groups are 42 to 55 percent higher.
• Among the non-LIS chronic condition beneficiaries who enrolled in PDPs, approximately 30 to 43 percent were in the coverage gap and 10 to 18 percent had reached catastrophic coverage. For all PDP continuing enrollees, 24 percent were in the coverage gap and 5 percent reached catastrophic coverage. Percentages of low-income PDP beneficiaries reaching the coverage gap or catastrophic coverage were
2
significantly higher. The corresponding percentages were lower for each of the MA-PD subsets.
• The 2008 enrollment patterns for non-LIS beneficiaries in PDPs were similar to those in 2007. About 40 percent chose enhanced drug plans; of those, slightly less than half chose an enhanced plan with some drug coverage in the coverage gap.
• For those who joined MA plans with drug plans, the idiosyncrasies of MA payment for nondrug and drug services made it possible for companies to again offer enhanced plans with low or no premiums. The distribution of non-LIS enrollees in enhanced plans increased from 80 percent in 2007 to 90 percent in 2008, the majority of which were in plans with gap coverage.
• Focusing on non-LIS beneficiaries, PDP enrollees in enhanced plans with gap coverage had the highest median drug spending followed by those in actuarially equivalent basic plans. In contrast, MA-PD enrollees in basic plans had higher median spending than those enrolled in enhanced plans with gap coverage.
• Enrollees who switched from PDPs in 2007 to MA-PDs in 2008 were younger and healthier than their “stayer” counterparts. Non-low-income beneficiaries were less likely than low-income beneficiaries to switch plans. Low percentages of PDP beneficiaries switched into an enhanced plan with gap coverage in 2008—even among a subset identified as high drug spenders in 2007.
E.2 Adherence to Drug Regimens
Section 3 of the report contains measurements of adherence to drug regimens in 2007 Part D data. We were addressing the following research questions:
• Overall, what were the drug adherence rates for Medicare beneficiaries with Part D coverage?
• What was the impact of plan coverage in the gap on drug adherence rates?
• To what extent are adherence rates impacted by whether the drug is a brand name or generic drug?
From a policy perspective these questions are interesting because if drugs are effective in slowing health deterioration and preventing complications, then taking the drugs according to the standard regimen—maintaining a high adherence rate—would be most effective. The statistics presented here are a profile of the current status of adherence as it can be observed in the Part D data.
For this analysis, we looked at six chronic conditions, COPD, CHF, diabetes with complications, dementia, major depression, and rheumatoid arthritis. For each of the chronic conditions, we conducted a review of the drug classes that would usually be used to treat each condition. The drugs were grouped into classes using the American Hospital Formulary Service
3
(AHFS) classification system. The classes for each disease cohort were chosen by reviewing literature and by consulting with physicians. Each drug class was then subdivided into two sub-classes, one for brand name drugs and one for generic drugs.
Using the Prescription Drug Event file (PDE), each prescription filled, by each person, was assigned to a class and brand or generic sub-class. The measure created from the data was the medication possession ratio (MPR), the ratio of days supplied purchased to the days eligible for coverage. (Adjustments were made for days in a hospital, for taking multiple drugs in a class, and for drugs carried over from 2006 and into 2008. Nursing home residents were excluded because adherence is controlled by the facility.) Beneficiaries had only one of three possible MPRs for each drug class, depending on whether the beneficiary purchased only brand name drugs within the therapeutic drug class, only generic drugs within the therapeutic class, or both brand name and generic drugs within the same therapeutic class.
The MPR has limitations as a measure. Days supplied is not always accurate; for some drugs with frequent dosage adjustments, like insulin, it is not meaningful. It also does not capture any purchases made outside the Part D system. Some generics may be cheaper at local chain pharmacies; in the coverage gap, some brand-name drugs may be cheaper if bought over the Internet.
The statistics compiled show the following:
• There is a wide variation in adherence rates across drug classes. However, with the exception of COPD, the median adherence rates for the most commonly taken drug sub-classes suggest general adherence with adherence rates typically 0.70 or higher.
• Beneficiaries were more likely to take a generic drug within a therapeutic drug class when there was an accepted generic equivalent. However, for many of the therapeutic drug classes used to treat the chronic conditions, there was either no generic alternative or the recommended therapy was a brand name drug.
• Mean adherence rates for beneficiaries receiving the low-income subsidy (LIS) were often lower than for non-LIS beneficiaries when taking generic drugs within a therapeutic drug class, but higher when taking brand names drugs within a drug class.
• Among beneficiaries who entered, but did not exit the gap, adherence rates for LIS beneficiaries taking brand name drugs within a therapeutic drug class fell less than for non-LIS beneficiaries in the coverage gap.
• Adherence rates for non-LIS beneficiaries who entered the coverage gap, but did not exit fell similar amounts for generic drugs within a drug class, independent of whether the beneficiary’s drug plan offered coverage in the gap.
• Adherence rates for beneficiaries who entered and exited the coverage gap fell similar amounts for LIS beneficiaries and non-LIS beneficiaries either with or without coverage.
4
Overall, the tables show adherence for the most commonly taken drug sub-classes, but levels could be improved for many of the less commonly taken drug classes. Our tables show that LIS status was a better predictor of adherence in the gap than plan coverage in the gap. LIS beneficiaries’ adherence rates dropped the least in the gap, particularly for brand name drugs while there was no difference between non-LIS beneficiaries with plan coverage in the gap and those without plan coverage in the gap. One possible explanation is that because very few plans with coverage in the gap covered brand name drugs, one possible explanation is that the higher copayments drugs pushed adherence rates for brand name drugs down disproportionately for non-LIS beneficiaries compared to LIS beneficiaries. A second explanation is that because generic drugs are fairly inexpensive, offering coverage in the gap is more symbolic and has no substantive impact on beneficiary adherence rates.
E.3 Survey Analyses of Relationships of Part D Enrollment, Adherence and Utilization, and Outcomes
In Section 4, the 2006 and 2007 Medicare Current Beneficiary Survey (MCBS) was used to address the following research questions:
• What is the impact of Part D on patient adherence to medication therapy?
• What is the impact of Part D on health care utilization outcomes? and
• What is the impact of drug adherence on health care utilization outcomes?
The MCBS is particularly useful to investigate these issues because it provides a well-defined comparison group for beneficiaries with Part D drug coverage. The MCBS contains survey information on prescription drug health insurance coverage, including coverage categories for Part D drug coverage and no drug coverage. The MCBS also includes a series of survey questions on drug adherence, as well as survey information on prescription drug events and health care utilization, including inpatient and emergency department (ED) events. Finally, the MCBS includes a wealth of other survey information useful for the analysis (e.g., socioeconomic data). Because of the survey questions, we are not reliant on claims data, so the drug event data are available even for those not enrolled in Part D, and the other utilization data are available even for those enrolled in Medicare Advantage. A limitation of the MCBS is the sample size, particularly for the disease cohorts studied.
Propensity score matching techniques were employed in the analysis to match the treatment group (Part D drug coverage) to the comparison group (no drug coverage). The use of propensity scores has become a frequently used technique in health economics. It allowed for the minimization of selection bias in the estimates of the effect of Part D by creating a comparison group that was more closely matched to Part D participants than simply the overall population of Medicare beneficiaries who did not have drug coverage.
The primary adherence measures used in the analysis were whether the beneficiary self-reported that they sometimes or frequently exhibited nonadherence to medication therapy. These measures were based on a set of five survey questions about drug adherence: (1) didn’t get one or more prescriptions; (2) delayed getting prescription because of cost; (3) took smaller doses of
5

prescription; (4) decided not to get prescription because of cost; and (5) skipped doses to make prescription last longer.
Our first adherence outcome measure, which we term “some nonadherence,” is a binary indicator variable based on (a) answering “yes” to question 1, and/or (b) answering either “sometimes” or “often” to any of the questions 2 to 5. Our second adherence outcome measure, which we term “frequent nonadherence,” is a stronger measure of nonadherence and is based on answering “often” to any of the questions 2 to 5. These adherence measures are similar to the adherence measures used in other studies of prescription adherence using the MCBS.
An alternative adherence measure used was whether the beneficiary filled at least one prescription to treat one of the study chronic conditions. This measure was based on the MCBS prescription drug event data.
For estimating the effects of Part D enrollment on outcomes we used measures that would be sensitive to adherence to drug therapies. Based on the reports in the MCBS the outcomes were:
• The probability of a hospital inpatient stay
• For those with a stay, the number of inpatient stays for the respondent in the last year
• The probability of an ED visit
• For those with an ED visit, the number of ED visits for the respondent in the last year
These analyses of the impact of Part D drug coverage on patient adherence to medication therapy were conducted on an overall analytic sample of 2,888 respondents from the 2006 and 2007 MCBS. The sample was restricted to beneficiaries that: (1) were diagnosed with at least one of the study’s six chronic conditions; (2) had Part D drug coverage or no drug coverage; and (3) met other sample criteria (e.g., exclusion of dual eligibles).
The key findings in this section are as follows:
• The descriptive analyses showed that beneficiaries with Part D drug coverage reported frequent nonadherence at only about half the rate as did beneficiaries with no drug coverage.
• The multivariate analyses showed that Part D beneficiaries are less likely to report frequent nonadherence than beneficiaries with no drug coverage (odds ratio = 0.41, t ratio = 3.40).
• The results for the impact of Part D on drug adherence vary somewhat depending on the measure of adherence. Results are strongest for frequent nonadherence as the nonadherence measure.
6
• Overall, however, the analyses support a conclusion that Part D drug coverage has a positive impact on medication adherence compared with no drug coverage.
• We find little relationship between Part D enrollment and the likelihood of having at least one inpatient event.
• We find that enrollment in Part D increased the likelihood of having at least one ED event.
• In the full sample including all six of the study’s chronic conditions, Part D enrollment was associated with fewer inpatient events but not related to the number of ED visits. However, for CHF, it was associated with fewer of both types of events.
• No direct relationship was found between adherence and inpatient or ED events in the vast majority of specifications.
E.4 Effect of Part D on Parts A and B of the Medicare Program—Claims Analysis
Some of the same questions that were analyzed with MCBS can also be analyzed with claims data. The advantage of the claims analysis is larger sample sizes; a disadvantage is the lack of personal information, such as socioeconomic data, on the beneficiaries. In the context of the drug program possibly improving health status and, concomitantly, reducing the use of health care services associated with poorer health, a large scale claims analysis was done. In this analysis the research question was:
• What is the impact of Part D on health outcomes and health care utilization and costs for beneficiaries with chronic conditions?
In Section 5 the approach is a before-and-after comparison of Medicare beneficiaries in 2005, the year before Part D was implemented, and in 2008, the third year of the program. The method compares, in two periods, people who would decide to enroll as well as people who would not enroll. The differences in the changes for the two groups are compared. It is a difference-in difference model approach.
The study cohorts were FFS beneficiaries in the six chronic disease groups in 2005 and the similar groups in 2008. This was not a panel study, although some of the population overlaps. LIS enrollees generally had Medicaid drug coverage in 2005 and little change in insurance status when they moved to Part D. They were excluded from the analysis.
The disease cohorts were defined using a file of 100 percent of the Medicare beneficiaries who had indicators for the diseases each beneficiary was reported to have. These indicators are the hierarchical condition category (HCC) groups, which are aggregates of clinically related diagnosis codes. Enrollment files were used to gather data for demographics and insurance status. Claims files provided spending and other data elements.
The research question was addressed by asking a set of questions for each disease cohort that would measure aspects of Part D’s having an effect on the broader program:
7

• Did Part D affect the probability of having at least one inpatient hospital stay?
• Did Part D affect the probability of at least one emergency department (ED) visit?
• Did Part D affect the Medicare costs for inpatient stays for those who had a stay?
• Did Part D affect the number of ED visits for those who had a visit?
The particular measures used were expected to be sensitive to Part D’s providing better access to drugs, conditional upon drugs being effective treatments. If disease exacerbations are reduced, we would expect hospitalizations and ED visits to be reduced. There is ambiguity in the direction of changes in some other measures. Services such as physician visits might increase if medication management requires additional visits.
The 2008 analysis included as indicators of Part D enrollment the years of enrollment, ranging from 0 to 3, and the years squared. The purpose of this specification was to determine whether we could detect, not just an average effect of duration of enrollment, but also a change in the effect with increasing time. The quadratic term provided “curvature.”
The findings of the analyses were somewhat mixed with the two duration terms sometimes providing increasing and sometimes decreasing effects over time. Generally, the findings related in increasing duration of enrollment from 0 to 1.5, 2 and 2.5 years are as follows:
• The probability of a stay typically decreased by only a few tenths of a percentage point. The peak effect varied by disease.
• The probability of an ED visit decreased by a few tenths of a percentage point, also with some effects peaking earlier than others.
• Inpatient spending for those who had at least one stay showed an interesting pattern. The impact of Part D was to increase spending but over time the change went in the negative direction. The initial increase is an anomaly but the decrease with duration is reasonable. Spending is a problematic variable in these analyses.
• The count of ED visits decreased by about 1.5 percent for COPD and seemed to peak at about 2 years. The effect for CHF was about 2 percent, peaking at 1.5 years. The other groups did not show significant effects.
There are a number of reasons that the measured effects were small, even though they were measured on people with chronic diseases. The comparison group is people who have no known drug coverage. They might have been purchasing drugs throughout the period. The Part D enrollees might also have been buying their own drugs in 2005.
The intent of the question was not to compare people with access to drugs to people without access. It concerned the effect of implementing a program in a world in which people had access but perhaps at a higher cost than they would with Part D. The effect of an
8

improvement in access could be marginal and could depend on the purchasing tradeoffs made by Part D enrollees before Part D started and by nonenrollees in both years.
E.5 Effect of Adherence on Utilization and Outcomes—Claims Analysis
The analysis now moved from the effect of the Part D program to the effect of adherence to drug regimens: What is the relationship between differences in patient adherence and differences in health outcomes and health care utilization and cost?
Having looked at effects of adherence using MCBS measures in Section 4, we move in Section 6 to the effects of adherence as measured by the Part D drug event data. The medication possession ratio, somewhat adjusted for this analysis, is the measure of adherence. Five of the six disease cohorts were included in this analysis.
Adherence for the study populations at the median is at reasonable levels, greater than 0.7. COPD is lower, below 0.6, related to adherence to inhalant medications having low adherence. Half of the people in the cohorts are below these levels. If adherence is improved, would Medicare experience change in some sentinel measures that indicate changes in health status and service use? The improvement in adherence used in the computations of effects on service use was a change from 0.50 to 0.75.
As in the claims-based study of the effects of Part D on Parts A and B, the research question is operationalized in four parts.
• Did adherence affect the probability of having at least one inpatient hospital stay?
• Did adherence affect the probability of at least one ED visit?
• Did adherence affect the Medicare costs for inpatient stays for those who had a stay?
• Did adherence affect the number of ED visits for those who had a visit?
The study analyzed 2008 utilization as a function of adherence in 2008 and in 2007. The measure of adherence for each disease group was the MPR for the drug class with the greatest MPR among all the classes used to treat the condition. Multiple classes of drugs are often used to treat a condition, but not all are needed simultaneously. We considered that if there were a dominant class in terms of adherence, then the MPR for that class would be an appropriate measure. Using multiple classes would result in many classes having an MPR of zero simply because those classes were not prescribed. The MPR measures differ from those described earlier in that people with stays in skilled nursing facilities (SNFs) were retained in the data; eliminating people with SNF stays would distort the rate of hospitalizations, which often are followed by SNF stays. Adjustments were made for the time spent in the SNF, during which drugs are not paid for through Part D.
The equations were formulated with demographic and health status measures as explanatory variables along with the adherence variable. The samples were FFS, non-LIS enrollees in Part D in each cohort.
9
The results of this modeling were, as might be expected, stronger than a test of the effect of Part D overall. These beneficiaries were all taking drugs to some degree. The findings, in brief, are that adherence changes did have weak effects on the target measures:
• The probability of an inpatient stay is reduced by less than 1 percentage point to 2 percentage points for the 25-point improvement in adherence, depending on condition. When significant, the 2008 adherence coefficient has a negative effect on the probability. The 2007 adherence is sometimes positive.
• The probability of an ED visit generally decreases by less than 1 percentage point to 1.6 percentage points for the 25 points of adherence improvement. There is less variability in the probabilities of outpatient ED visits than of inpatient stays. The coefficients are negative when significant.
• Inpatient spending is problematic again. The two adherence measures have opposite signs in some cases. The net effect of the 2 years of measures is negative and varies from a few tenths of a percent to more than 2 percent. The effect for major depression the one for which spending is increases with greater adherence in 2008.
• The count of ED visits for users of the service is more consistent. Improving adherence reduces, or at least does not increase the number of ED visits. The range of decrease when adherence is improved is from a bit more than 1 percentage point to about 3 percentage points.
These effects are not negligible but do not indicate major changes in Medicare services. It would appear that large changes in adherence would be needed to affect these service use measures.
E.6 Conclusion
Section 7 summarizes the project, which has explored many aspects of the effects of Part D in 2008, concentrating on beneficiaries with six chronic conditions. The enrollment patterns have been described in great detail. Plan switching to plans with gap coverage does not appear to be optimal for enrollees with high spending. Measures of drug adherence have been defined and measured for the program, with indications of moderate adherence levels. Particular attention has been paid to differences between generic and brand name drugs in adherence in the coverage gap. Generic adherence was less affected even when there was no coverage in the gap. Modeling has been done, with multiple approaches, exploring the effect of Part D on adherence, the effect of Part D on utilization and outcomes, and the effect of adherence on utilization and outcomes. Overall, the implementation of Part D had minor effects on service use in Medicare Parts A and B. Even improvements in adherence levels from 0.50 to 0.75 have small effects on service use. It is possible that the effects on quality of life, not measured in this study, are affected more than service use. Further work should be done to analyze why inpatient spending responded unevenly to enrollment and adherence improvements. In general, the Medicare savings aspects of the study are of small magnitude.
10
SECTION 1 PROJECT INTRODUCTION
The Part D prescription drug benefit, implemented in 2006, was a large addition to the Medicare program, providing insurance for a component of health care largely omitted from the program. The drugs covered by Part B of Medicare were generally those administered in physicians’ offices, and the drugs covered by Part A were those administered during inpatient stays. Coverage of a wide range of outpatient drugs by the program would provide insurance for drugs for those Medicare beneficiaries who did not have coverage, or adequate coverage, from employer and retiree coverage. Such coverage, along with retiree health insurance in general, has been shrinking. The program also replaced the Medicaid drug coverage programs for those covered by Medicare as well. This expansion of the Medicare program has generated great interest in the drug benefit’s effects not only on drug purchasing but also on the other components of Medicare.
This report is a follow-up to two previous reports. Medicare Part D Program Evaluation: Analysis of the Impact of Medicare Part D on the Fee-For-Service Program, covering 2006, presented analyses of the effect of the introduction of Part D on the Medicare program; it was followed by Medicare Part D Program Evaluation: Analysis of the Impact of Medicare Part D on the Fee-for-Service Program and Issues Related to Medication Adherence for Six Chronic Conditions—2007. The current set of studies focuses on the program in 2008 for analyses for which that year’s data were available. It concentrates on people with chronic conditions, in particular:
• Chronic obstructive pulmonary disease
• Congestive heart failure
• Diabetes with chronic complications
• Dementia
• Major depression
• Rheumatoid arthritis
The basic research questions this report addresses are as follows:
1. What are Part D enrollment patterns for beneficiaries with specific chronic conditions?
2. What is the impact of Part D on patient adherence to medication therapy?
3. What is the impact of Part D on health outcomes and health care utilization and costs for beneficiaries with chronic conditions?
4. What is the relationship between differences in patient adherence and differences in health outcomes and health care utilization and cost?
11
These conditions affect different body systems and range from high prevalence to moderate prevalence in the Medicare population. They also vary in the range and cost of drugs available to treat them. By focusing on these diseases, we hoped to detect the effects of the program better than when the Medicare population as a whole was studied.
The first research question, addressed in Section 2, looks at the patterns of enrollment across the many private drug plan types from which beneficiaries needing drugs must choose. Because the program is administered through private plans in which enrollees may choose to participate, the marketplace has plans that vary in such characteristics as formularies, premiums, drug costs, and cost sharing. The analysis describes the types of coverage people with the chronic conditions have, whether Part D, other creditable coverage, or no known coverage. It presents the distribution across types of plans they enroll in and levels of premiums they pay. Enrollees could choose one of the basic plan types or enhanced alternative plans, some of which cover some drugs in the program’s coverage gap. It also presents distributions of beneficiary choices by health status scores, comorbidities, drug spending, geography, and other dimensions. An added dimension is a description of the switching across plan types, between fee-for-service and Medicare Advantage, and between plans with and without coverage in the part of the benefit in which the defined standard plans have enrollees bearing all the drug costs. Particular attention is paid to the group of high-spending enrollees.
The choices made by beneficiaries are in the context of the structure of the benefit. The Part D benefit parameters change from year to year. This report focuses on the potential impacts of the Part D program in 2008, the program’s third year. In 2008, the Part D defined standard prescription drug benefit included a $275 deductible that the beneficiary was responsible for paying. Between $276 and the initial coverage limit of $2,510, the Part D plan was responsible for 75 percent of costs and the beneficiary paid a 25 percent coinsurance. There was no coverage between $2,511 and $5,726.25—the range known as the coverage gap, or “donut hole.” Beneficiaries were responsible for all costs in the coverage gap up to the $5,726.25 threshold, which corresponded to $4,050 in true out-of-pocket costs (TrOOP). 1 Catastrophic coverage began at that point, with costs being split among the Medicare program, providing reinsurance equal to 80 percent; the Part D plan, covering 15 percent; and the beneficiary, paying the greater of 5 percent coinsurance or copayments of $2.25 for generic drugs and $5.60 for brand-name drugs. Enrollees receiving a low-income subsidy (LIS) paid less than the standard amounts in most cases.
In addition to the standard benefit, there were two variant plan types that were actuarially equivalent, which could vary the payment structure in the initial coverage range, the deductible, or both. There were also enhanced plans that offered some coverage in the gap or coverage for products not covered by the standard benefit. Extra coverage was not covered by payments from
1 A payment for a prescription drug constitutes an “incurred cost” and counts toward a beneficiary’s TrOOP
threshold only if the payment is made by or on behalf of the beneficiary. Assistance from a state pharmaceutical assistance program or from a patient assistance program sponsored by a pharmaceutical assistance program generally counts toward the TrOOP threshold. However, if the beneficiary is reimbursed for the costs by insurance, a group health plan, or other third-party arrangement, then the payments do not count toward the TrOOP threshold. Payments for drugs that are not included on the plan formulary also do not count toward the TrOOP threshold (Covington and Burling, 2005).
12

the Medicare program. Plans also varied, within limits, in the range of drugs offered in their formularies.
To study the effects of the program on adherence to drug regimens, or the effect of adherence on the Medicare program, it was necessary to construct measures of adherence. Section 3 of the report describes the construction of one of the measures of adherence, the medication possession ratio (MPR), and presents descriptive statistics. Conceptually the MPR is the proportion of eligible days covered by the supply of drugs purchased. The section discusses both the difficulties of construction of the measure and the limitations of the MPR as a measure of adherence.
The importance of adherence is in the context of the assumptions that the drugs for the chronic diseases should be taken on an ongoing basis and that the drugs are effective in reducing disease progression, complications, exacerbations, or any combination of these. The MPR is a measure of whether beneficiaries are regularly buying prescribed drugs, which is as close as we can get in the data to whether they are taking the drugs.
In Section 3 we describe how the MPR is created, not for individual products, but for classes of drugs that are related pharmacologically. The drug classes in the study were those that were deemed to be treatments for each of the disease groups. The description of adherence across the classes and the stages of the benefit structure yields information for policymakers on whether adherence is far enough from optimal levels that it is improvable and, as seen in the related studies here, whether improving the measure has effects on health and utilization. The descriptive work also goes into detail on adherence changes in the coverage gap for brand-name and generic drugs for each therapeutic class.
The second research question, concerning the effects of the Part D program on drug regimen adherence, uses the Medicare Current Beneficiary Survey (MCBS) data for 2006 and 2007, the latest surveys available. The analysis is in Section 4. Although the data set has much information about the beneficiaries beyond the basics in claims and enrollment data, it is relatively small, with about 12,000 people in the survey each year, many of whom are excluded from the analysis for various reasons. However, it proved impossible to construct the MPR as an adherence measure for survey beneficiaries who were not in Part D because the drug event file does not contain enough detail on purchases. We used survey responses and the drug information to get three simpler measures of adherence. The sample size limitation and the nature of the adherence measures limit the conclusions that can be drawn from this particular study. The analyses of the merged surveys used propensity score matching to compare Part D enrollees to beneficiaries with no drug coverage.
The third, somewhat large, research question—whether the implementation of Part D had effects on program outcomes and utilization—is first addressed in Section 4 using the MCBS data. This analysis, like the first survey-based analysis, also uses propensity score matching. The question is addressed in a different way in Section 5 using Medicare claims and enrollment information. Sample sizes are large for each of the study groups. Policymakers are interested in whether the program had discernible effects on the use of Part A and B services. In particular we approach this question by looking at whether there were differences over time between the Part D enrollee population and the population that did not enroll. In this analysis, we compared the
13
changes from 2005, pre-Part D, through 2008. The specific measures used were probability of an inpatient hospital stay, inpatient spending for people with stays, probability of an emergency department visit, and counts of visits for users of the emergency department.
It has been difficult to measure the effects across the whole population because a large proportion of Part D enrollees receive the LIS, and most of this group would have had Medicaid coverage for drugs in 2005. Any changes in patterns of use for this group would be minor. We concentrate on the non-LIS population. Even in this population and concentrating on the chronic condition groups, detecting changes in program services would depend on whether the Part D enrollees were acquiring drugs to a reasonable extent and whether similar nonenrollees also do so. All these factors reduce the effect that has to be measured. The policy question is important, but unless there was a large proportion of beneficiaries with very limited access to drugs before Part D, expectations for a large impact are not justified. The study in Section 5 is able to address the issue because sample sizes are large. In the 2008 analysis, the possibility that longer durations of Part D enrollment may have different marginal effects from shorter durations is addressed by including the square of the duration to allow varying impacts over time.
If the program is supposed to increase access to prescription drugs, and easier access helps improve adherence, the next research question is relevant for policy: What is the relationship between adherence and measures of outcomes and utilization? This question is addressed in Section 4 with MCBS data and in Section 6 with claims data. The 2008 data were used for the claims analysis. Data from 2006 and 2007 were used in the MCBS study.
As indicated in the MPR analysis in Section 3, to the extent that adherence varies and is not optimal, one would want to know the magnitude of the effects on the program that result from improving adherence. The measures used as dependent variables are sentinel indicators of changes in both program utilization and the need for such services—a measure of health status. We use the same measures used in Sections 4 and 5.
The regression analyses incorporate adherence measures as explanatory variables. The MPR is used in the case of the claims analysis, with adherence in 2007 and 2008 both used as explanatory variables. Indicators of buying or skipping prescriptions are used in the MCBS analysis. As in the other analyses, many beneficiary-specific control variables potentially affecting utilization are included.
From the point of view of finding measurable effects, this analysis is much closer to finding whether taking prescribed drugs affects health status and associated utilization. Finding reasonable effects then leads to the question of what tools can be used tool improve adherence. Although that question is not addressed in this report, the study indicates that some very modest improvement in health and utilization is possible by improving adherence.
This study has addressed four large research questions in multiple exploratory ways. The results show that we are not always measuring large effects and that each method of analysis has advantages and disadvantages. The subsequent sections describe each analysis in greater detail so that the measurement issues can be understood as well as the findings.
14
SECTION 2 DESCRIPTIVE ANALYSIS OF PART D ENROLLMENT PATTERNS
2.1 Introduction
In this part of the Part D program evaluation, we describe key differences in the characteristics of beneficiaries with specific chronic diseases in terms of their Part D enrollment patterns in 2008. This analysis builds on two previous reports, which described enrollment data for the entire Medicare population in 2006, the first year of the Medicare Part D Program, and for the chronic condition subsamples in 2007. In this analysis we focus on 2008 statistics, but also look for changes and trends over time and for differences between the beneficiaries with chronic conditions and the Medicare Part D population as a whole. The specific research question to be addressed in Task 5 was this:
• What are the Part D enrollment patterns for beneficiaries with specific chronic diseases?
As was noted previously, beneficiaries with chronic conditions may represent the population most likely to benefit from increased access to prescription drugs. These beneficiaries are more likely to need a greater number of prescription drugs and are more susceptible to suffering expensive health care complications if they do not adhere to their drug regimens. Access to affordable drugs may depend on enrollment in the most appropriate Part D plan—one that covers the specific drugs needed with cost sharing at levels that promote improved therapy adherence. Identifying and monitoring enrollment patterns by plan and benefit type for these beneficiaries may help inform policymakers on issues of access as well as on cost implications for both enrollees and the Medicare program.
In this descriptive analysis, RTI International studied the drug plan enrollment patterns of each chronic condition sample individually: chronic obstructive pulmonary disease (COPD), congestive heart failure (CHF), diabetes with complications, dementia, major depression, and rheumatoid arthritis. We then looked for similarities and differences across the six disease groups and in comparison to the general Medicare population both in 2007 and in 2008. We examined fee-for-service (FFS) and Medicare Advantage (MA) populations separately. For each topic of analysis, our initial breakouts were by type of drug coverage (Part D plan, creditable coverage from another source, or no known coverage). However, our primary focus was on beneficiaries enrolled in a Part D plan, either an FFS prescription drug plan (PDP) or a Medicare Advantage prescription drug plan (MA-PD). We classified enrollees by plan type into five categories: three basic plans (defined standard, actuarially equivalent, and basic alternative) and two enhanced (without gap coverage, with gap coverage). Detailed analyses were conducted that focused on beneficiary characteristics, plan structure and cost, disease profiles, and geographic characteristics.
Plan switching is a new topic within this 2008 analysis. In our 2007 analysis, we noted that a segment of non-low-income (non-LI) beneficiaries had consistently high drug spending in both 2006 and 2007 and were not enrolled in plans with gap coverage. In this study, we examined overall trends in Part D plan-type switching, from PDP to MA-PD or the reverse, as
15
well as coverage-type switching, looking at those who switch into a plan with gap coverage. For the latter study, we focused on non-LI high spenders in 2007 and 2008 who lacked gap coverage in 2007, a subgroup with a financial incentive to switch coverage type.
The population of greatest interest for this descriptive analysis was the non-LI, Part D-enrolled population, who are more sensitive to cost and coverage than the subsidized low-income (LI) population. For comparison purposes, most analyses were conducted for both populations.
Summary of Key Findings:
• The diabetes with complications and major depression chronic conditions had the largest growth in sample size from 2007 to 2008, increasing 6.6 percent and 7.5 percent, respectively, in the full combined FFS and MA population. Among the MA subset, the increase was more dramatic (21.4% and 31.2%).
• Among the non-LI chronic condition beneficiaries who enrolled in PDPs, approximately 30–43 percent were in the coverage gap and 10–18 percent had reached catastrophic coverage. For all PDP continuing enrollees, 24 percent were in the coverage gap and 5 percent reached catastrophic coverage. Percentages of LI PDP beneficiaries reaching the coverage gap or catastrophic coverage were significantly higher, in part due to no change in subsidized cost-sharing in the gap coverage phase. The corresponding percentages were lower for each of the MA-PD subsets.
• The 2008 enrollment patterns for non-LI beneficiaries in PDPs were similar to those in 2007. Approximately 60 percent enrolled in a basic Part D plan, 20 percent enrolled in an enhanced plan without gap coverage, and 20 percent enrolled in an enhanced plan with gap coverage. The latter group decreased slightly in 2008.
• Enrollment patterns for non-LI MA-PD enrollees changed significantly from 2007 to 2008. Enrollment in basic plans dropped to 10 percent; enrollment in enhanced plans with gap coverage rose to 60 percent.
• In the PDP sample, non-LI beneficiaries enrolled in enhanced plans with gap coverage had the highest median drug spending, followed by those in actuarially equivalent basic plans. In the MA-PD sample, non-LI beneficiaries enrolled in basic plans had higher median spending than those enrolled in enhanced plans with gap coverage.
• Enrollees who switched from PDPs in 2007 to MA-PDs in 2008 were younger and healthier than their “stayer” counterparts. Non-LI beneficiaries were less likely than LI beneficiaries to switch plans. Low percentages of PDP beneficiaries switched into an enhanced plan with gap coverage in 2008—even among a subset identified as high drug spenders in 2007.
16
2.2 Data and Methods
The descriptive analysis for this report focused on drug plan enrollment status as of July 2008 for Medicare beneficiaries with chronic conditions. It involved multiple sources of 100 percent data files in its creation.
Six chronic conditions with significant drug costs were chosen by CMS for the study, listed here in order by population size:
• COPD
• congestive heart failure
• diabetes with complications
• dementia
• major depression
• rheumatoid arthritis
To identify Medicare beneficiaries with these chronic conditions, RTI used the CMS risk adjustment files containing CMS hierarchical condition categories (HCCs) and prescription drug hierarchical condition categories (RxHCCs), disease groupings used to predict medical costs and drug costs. Our assumption was that beneficiaries chose their 2008 drug plan on the basis of information they already knew in 2007 about their personal disease history. Therefore we used the 2008 risk adjustment files, which contain HCC and RxHCC flags based on 2007 diagnosis data. We excluded 2008 new enrollees from our analysis because they lacked the required 2007 diagnosis profile.
As is shown in Table 2.1, we chose the HCC or RxHCC that best fit the chronic condition to identify beneficiaries. In most cases, such as COPD or CHF, the selected HCC or RxHCC marker identified the chronic condition population exactly. In some cases, such as major depression, both the HCC and RxHCC classifications were broader than desired and we chose the most restrictive definition. When studying these analyses, it is important to realize that the identified population may include beneficiaries with related diagnoses but not necessarily the featured diagnosis.
RTI used the 2007 and 2008 Part D Denominator 100 percent files as the primary source of its Part D enrollment data, with the majority of data extracted from the July 2008 file. In addition to Part D enrollment and beneficiary characteristics, these files contain the most reliable information on the Retiree Drug Subsidy (RDS) and other sources of creditable coverage (e.g., Federal Employees Health Benefits, TRICARE, Veterans Administration, etc.). With these enrollment data, we reduced the full 2008 chronic condition sample identified through the risk
17
adjustment files to include only FFS and MA beneficiaries enrolled in Medicare as of July 2008.2 Beneficiaries who died in 2008 before July were excluded from our descriptive analysis; but any beneficiaries who died after the July cutpoint were included.
We linked the Part D Denominator data to the Health Plan Management System (HPMS) files to determine drug benefit type (e.g., defined standard) and plan characteristics (e.g., level of gap coverage). RTI used the Common Medicare Environment (CME) file for demographic information. The 2007 and 2008 Prescription Drug Event (PDE) files were used to determine drug expenditures for both the FFS and MA populations. The beneficiary files (either Standard Analytic File or National Claims History) were used to profile the FFS population according to Part A and Part B characteristics of 2008, such as expenditures and hospitalizations. Because MA plans do not submit claims, we could not do the comparable Part A and Part B analysis on the MA population. Risk score files were used to profile the full population in terms of their Part A/B risk scores and Part D risk scores. The CMS risk adjustment files, described earlier as the source of our initial chronic condition designations, were also used to identify the full RxHCC profile of each beneficiary as well as end-stage renal disease (ESRD) status. County-level and census data were used to identify geographic characteristics. The final sample for the 2008 descriptive analysis included 12,019,788 beneficiaries classified into the six chronic conditions. The chronic conditions are not mutually exclusive. The same beneficiary may appear in more than one disease group; this occurred with 30 percent of the full chronic condition sample, a result identical to our 2007 findings.
Our descriptive analysis featured six main topics, with beneficiaries stratified by drug plan enrollment status:
1. Personal descriptive statistics—In these analyses, we examined the demographic composition (age, sex, race), low-income status, ESRD status, risk scores, and 2008 Part A and Part B expenditures and utilization of beneficiaries to profile each chronic condition sample.
2. Part D expenditures—In addition to mean annual Part D expenditures, we calculated spending at various percentiles and looked at distributions of beneficiaries by benefit phase (deductible and initial coverage, coverage gap, and catastrophic coverage).
3. Plan characteristics—Focusing only on beneficiaries enrolled in Part D plans, we analyzed plans by deductibles, cost-sharing structure, type of gap coverage, and monthly Part D premiums in terms of both mean premiums and decile distributions.
4. RxHCC descriptive statistics—Knowing that most beneficiaries in each chronic condition sample had other diagnoses that would predict prescription drug usage, we looked at their complete RxHCC profiles to gauge how comorbidities could affect plan choice.
2 Beneficiaries enrolled in employer-only plans were excluded from the sample, as were residents of Puerto Rico and
U.S. territories. Additionally, the MA sample excluded private-fee-for-service plans, all types of cost plans, and Program of All-inclusive Care for the Elderly (PACE) plans.
18

5. Geographic descriptive statistics—We investigated geographic patterns, looking at enrollment by urbanicity, census region, and PDP or MA-PD region.
6. Plan enrollment changes—Classifying beneficiaries as “stayers” (stayed in same plan in 2007 and 2008) or “switchers” (switched to a different plan in 2008), we examined characteristics of beneficiaries in terms of switching plan type (PDP or MA-PD) or coverage type (gap coverage compared with no gap coverage).
In addition to the core 2008 chronic condition sample, we constructed full Medicare population 2007 and 2008 samples for comparison purposes. Because new enrollees by necessity were excluded from the chronic condition sample, we excluded new enrollees from our full 2007 and 2008 samples as well to better match the comparison data. We refer to beneficiaries in these samples as continuing enrollees. Although this report focuses on 2008, the 2007 continuing enrollee sample was constructed for completeness, in order to provide baseline full population trends in addition to changes in the chronic condition subsamples.
2.3 Cross-Disease Results
In this section, we pull key results from the individual chronic condition analyses to make comparisons across the six disease groups.
2.3.1 Type of Coverage
Table 2.2 presents an overview of the six chronic condition samples and their composition by contract type (FFS or MA) and type of drug coverage. For comparison purposes, full continuing enrollee sample data from 2008 is included in the last column. The COPD and CHF disease groups continued to have the largest populations, and rheumatoid arthritis the smallest. The overall diabetes population was greater, but this analysis focused on the smaller subset of diabetes with complications. It should be noted that, among the MA subset, the diabetes with complications sample was nearly as large as the CHF population (789,750 and 806,679, respectively). The diabetes with complications group had the greatest MA concentration (24%) and had one of the greatest increases in its population size over 2007 (21.4% in the MA population). The major depression disease group had the greatest percentage growth from 2007—for both of its subsets (FFS 2.9%; MA 31.2%) and overall (7.5%).
Underlying the changes in the disease group compositions was an overall trend in MA growth compared to FFS in the Medicare population. The FFS continuing enrollee population decreased by nearly 2 percent, whereas the MA population increased by 13 percent.
The 2008 distribution by type of coverage continued the patterns present in 2007. FFS beneficiaries with chronic conditions were more likely than the overall population to enroll in a drug plan. The no-known-coverage category had nearly 19 percent of FFS beneficiaries in the 2006 full sample. The 2007 continuing enrollee data showed that rate dropping to 15 percent, and in 2008 it was about 14 percent. Among the chronic condition samples, the FFS no-known-coverage rate ranged from 8 percent to 12 percent. FFS beneficiaries with major depression were most likely to be enrolled in a PDP and least likely to have coverage through the Retiree Drug Subsidy or to have no known coverage. As in 2007, the FFS rheumatoid arthritis population had the opposite findings. In the MA population, as in that of the FFS, the major
19
depression group had the greatest enrollment in a Part D drug plan (MA-PD). The MA population showed slight increases over 2007 in coverage through the Retiree Drug Subsidy, offset by slight decreases in other creditable coverage.
2.3.2 Beneficiary Characteristics
Focusing on personal descriptive statistics, Tables 2.3 and 2.4 feature differences by chronic condition for beneficiaries enrolled in PDPs and MA-PDs, respectively. The underlying age composition of the PDP sample was different from that of the MA-PD sample. It had a greater percentage of the youngest age group (ages 64 and under, eligible for Part D primarily through disability status) and the oldest age group (ages 85 and above). Compared to the PDP sample, the MA-PD sample has a higher proportion in the younger elderly age brackets. As would be expected, the age composition by disease group remained relatively constant from 2007 to 2008. Dementia was concentrated in the oldest age groups, as was CHF. Major depression was concentrated in the youngest age group. There were minor shifts in population, however. Within the MA-PD subset, the proportion in the youngest age bracket increased for every disease group except major depression, which decreased. Because major depression is more prevalent among younger ages (and milder forms of depression are more common at older ages), it is striking that the oldest age group (ages 85+) had the greatest percentage growth in the major depression MA-PD subset (CDC, 2010). CMS has experienced a higher intensity of coding within the MA population, including a greater proportion of coding of diseases at higher severity levels. This major depression enrollment shift could be an example of that phenomenon.
The composition by sex did not change by chronic condition over time. Females made up a greater percentage of the rheumatoid arthritis, major depression, and dementia disease groups. The racial statistics in this 2008 analysis give more detailed information on the non-White and non-Black populations. The apparent decrease in the White population from 2007 to 2008 is a result of better identification of the Asian and Hispanic populations through the use of a different race variable. Similar to the 2007 results, racial differences by disease groups showed a higher proportion of Blacks with CHF and diabetes with complications compared to the overall Black population. Hispanics had a higher proportion in three disease groups—diabetes with complications, major depression, and rheumatoid arthritis—compared to their overall population. Hispanics make up a greater proportion of the overall MA-PD population, in part because of the MA concentration in the West with its significant Hispanic population. Asians, compared to their overall population, were underrepresented in each of the chronic conditions, except for a slight increase in the diabetes with complications disease group. The Native American population also had a disproportionate concentration in the diabetes with complications disease group and additionally in the rheumatoid arthritis disease group. The “unknown” race group is omitted from these tables.
About half of those who enrolled in a PDP were low income and had their drug coverage subsidized. This proportion has remained constant since 2006. The LI population has been increasing incrementally within the MA-PD subgroup, reaching 27.5 percent in 2008. All six chronic conditions had a higher proportion of LI beneficiaries than the general continuing enrollee population. From 2007 to 2008 for all six diseases, the LI proportions decreased slightly within the PDP population (about 1%) and increased (about 5%) for the MA-PD population. As was the case in 2007, the percentage of the population identified as low income
20
was greatest for disease groups at two ends of the age spectrum, major depression (youngest) and dementia (oldest).
Tables 2.3 and 2.4 also compare risk scores by disease group. The Part D risk score uses a beneficiary’s diagnosis profile to predict drug spending. The Part A/B risk score predicts Medicare Part A and Part B spending. Part D risk scores for the PDP subset showed slight variability across disease groups but were significantly higher than the 2008 continuing enrollee average. The diabetes with complications disease group again in 2008 had the highest mean Part D risk score, 1.55, which can be interpreted as beneficiaries’ having predicted drug costs 55 percent higher than those of the baseline average FFS beneficiary (risk score of 1.00). The Part A/B risk scores showed greater variability, ranging from 1.85 (major depression) to 2.69 (CHF). The MA-PD samples showed trends similar to those of their PDP counterparts, but with consistently lower risk scores. Both the PDP and MA-PD samples showed slight increases in risk scores over 2007.
The lack of variability in Part D risk scores across groups can be attributed in part to the fact that many of the beneficiaries in these disease groups are taking multiple medications, frequently for chronic conditions not featured in this study (e.g., high cholesterol or hypertension). Tables 2.5 and 2.6 demonstrate this point, presenting RxHCCs used to identify the featured chronic conditions as well as other common RxHCCs within these populations. These tables focus on the non-LI PDP and MA-PD subsets. The corresponding information for LI beneficiaries is found in the Technical Appendix to this report.
2.3.3 Drug Expenditures
Next we focus on Part D drug spending by disease group and the distribution of each sample in terms of Part D benefit phase coverage levels. The annual Part D expenditures, which were constructed using PDE data, represent the total drug spending by all parties (the beneficiary, the Part D plan, and the Medicare program).3 A review of the Part D benefit structure will aid in interpreting the expenditure data in Tables 2.7 and 2.8.4
As is seen in Table 2.7, PDP-enrolled, non-LI beneficiaries in all six disease groups had mean annual expenditures within the coverage gap range ($2,510–$5,726.25). Similar to 2007,
3 Total spending was calculated as the sum of two PDE fields: Gross Drug Cost Below Out-of-Pocket Threshold
(GDCB) + Gross Drug Cost Above Out-of-Pocket Threshold (GDCA). In our 2007 analysis, the mean annual Part D expenditure data reported corresponded to Part D PDP and MA-PD panels, which were limited to beneficiaries with the same plan type (PDP or MA-PD) in both 2006 and 2007. Because of major shifts in FFS compared with MA enrollment, requiring 2 years of the same plan type would limit our sample size. Therefore, in this study we conducted cross-sectional analyses of Part D spending in 2007 and 2008.
4 In 2008, the Part D Defined Standard prescription drug benefit included a $275 deductible that the beneficiary was responsible for paying. Between $276 and the initial coverage limit of $2,510, the Part D plan was responsible for 75 percent of costs and the beneficiary paid a 25 percent coinsurance. There was no coverage between $2,511 and $5,726.25—the range known as the coverage gap, or “donut hole.” Beneficiaries were responsible for all costs in the coverage gap up to the $5,726.25 threshold, which corresponded to $4,050 in true out-of-pocket costs. Catastrophic coverage began at that point, with costs being split among the Medicare program, providing reinsurance equal to 80 percent; the Part D plan, covering 15 percent; and the beneficiary, paying the greater of 5 percent coinsurance or copayments of $2.25 for generic drugs and $5.60 for nongeneric drugs.
21
the dementia disease group had the highest 2008 mean spending, $3,733, which corresponded to beneficiary out-of-pocket costs of $2,056.75 ($275 deductible + $558.75 initial coverage coinsurance + $1,223 gap). The rankings from highest (dementia) to lowest (COPD) mean spending by disease group were consistent in 2007 and 2008, except for rheumatoid arthritis expenditures being slightly higher than CHF in 2008. Among the baseline non-LI continuing enrollee population, about one-fourth are in the coverage gap and 5 percent reach catastrophic coverage. For the chronic condition samples, these percentages are much higher, with approximately 10 percent to nearly 20 percent in the catastrophic coverage range. A sizeable proportion (8.6%–16.4%) of these non-LI chronic condition beneficiaries reaching catastrophic coverage were not enrolled in plans with gap coverage benefits. Thus, on average they paid more than $4,050 in true out-of-pocket costs in 2008.
The PDP-enrolled, LI beneficiaries had much higher mean annual expenditures because their subsidized copayment structure continued through the gap—they were not subject to 100 percent coinsurance. Four of the disease groups had mean expenditures within the catastrophic coverage level: major depression ($6,790); rheumatoid arthritis ($6,202); diabetes with complications ($6,091); and, unlike the 2007 findings, COPD ($5,741). Strikingly, 44 percent of the LI population with major depression reached catastrophic coverage.
The MA-PD-enrolled population followed a similar pattern (see Table 2.8), although mean spending was lower by about $500–$1,500 depending on the sample (non-LI or LI) and chronic condition. In the non-LI subset, the majority of chronic condition beneficiaries did not reach the coverage gap and even among the dementia subset less than 10 percent reached the catastrophic coverage level. Identical to our 2007 findings, none of the disease groups for the MA-PD LI subset had mean spending within the catastrophic coverage level.
2.3.4 Plan Enrollment
Having an understanding of the demographic composition and spending patterns of each disease group, we now focus on plan enrollment statistics for beneficiaries enrolled in Part D prescription plans. Under the Part D program, participating organizations have the option of offering basic or enhanced benefits. In addition to the defined standard basic plan previously described, organizations may offer two actuarially equivalent variants—actuarially equivalent5 and basic alternative.6 Part D plans are also able to offer enhanced alternative prescription drug plans, which exceed the benefits offered in basic plans. This enhanced coverage often includes supplemental benefits including cost sharing, increased initial coverage limit or reduced deductible, provision of some coverage through the coverage gap, or any combination of these
5 Actuarially equivalent plans have an overall structure similar to the defined standard benefit, but the cost sharing
can differ from the 25 percent coinsurance under the standard defined benefit. These actuarially equivalent plans may have tiered copayments—for example, low dollar amounts for generic drugs and higher dollar amounts for preferred and nonpreferred brand-name drugs.
6 Under the basic alternative option, plans may have a different overall structure for the benefit, although they have to be actuarially equivalent to the standard benefit. Basic alternative benefit structures may include reductions in the deductible, changes in cost sharing, and a modification of the initial coverage limit. These benefit package alternative features provide coverage with an actuarial value equal to the defined standard coverage.
22
benefits. For the 2007 and 2008 analyses, we stratified enhanced plans into two groups—those with gap coverage and those without. We examined the non-LI and LI populations separately because of the significant differences in cost-sharing burden (no coverage gap for LI) as well as the fact that most LI beneficiaries are auto-enrolled into basic plans.
Table 2.9 presents plan enrollment statistics for the FFS-PDP-enrolled chronic condition samples. For each disease group, the non-LI sample followed a rough breakout of 60-20-20—about 60 percent enrolled in basic plans, 20 percent in enhanced plans without gap coverage, and 20 percent in enhanced plans with gap coverage. Looking more closely at the data, there were changes from 2007 to 2008. In terms of enhanced plan coverage, in 2007 within all six disease groups a slightly greater proportion chose plans with gap coverage. In 2008, these results were reversed. Among the basic plan types, beneficiaries in all disease groups continued to prefer the basic alternative plans, which frequently offer no deductible and therefore more predictable average monthly spending. The proportion of beneficiaries enrolled in actuarially equivalent basic plans doubled, reaching levels comparable to the defined standard plan. The baseline non-LI FFS-PDP continuing enrollees followed a rough breakout of 60-25-15, with only 15 percent of this overall healthier population enrolling in enhanced plans with gap coverage.
The LI PDP sample followed a completely different pattern but was strikingly consistent across disease groups because of its heavy concentration of auto-enrolled deemed beneficiaries. There were significant changes in plan distribution among basic plans from 2007 to 2008—defined standard changed from 19 percent to 22 percent, actuarially equivalent from 27 percent to 38 percent, and basic alternative from 50 percent to 35 percent. The enhanced plan levels remained low, accounting for less than 5 percent.
Because the plan type enrollment patterns across disease groups were consistent, the mean monthly premiums by disease group were also consistent. The non-LI population had a mean premium of $30 for basic plans and enhanced plans without gap coverage, which was about a $5 increase for basic plans over 2007. The mean monthly premium for enhanced plans with gap coverage rose from $62 in 2007 to about $67 in 2008. The LI population had similar monthly premiums, which were slightly lower for basic plans compared to the non-LI population.
Plan type enrollment patterns and monthly premiums continued to be quite different within the MA-PD population because of the Medicare Advantage structure. All MA enrollees (including those in health maintenance organizations [HMOs], local and regional preferred provider organizations [PPOs], and special needs plans [SNPs]) must be offered at least basic Part D coverage as part of their total benefits package. MA-PDs can use Part C savings to subsidize premiums for enhanced Part D options as an overall incentive to attract and retain enrollees. Many MA plans take advantage of this ability, as is evident in the MA-PD plan type distribution presented in Table 2.10. In contrast to the FFS-PDP, non-LI 60-20-20 distribution, the non-LI population in MA-PD plans followed a rough 10-30-60 pattern—about 10 percent enrolled in basic plans, 30 percent in enhanced plans without gap coverage, and 60 percent in enhanced plans with gap coverage. This enrollment pattern showed a marked change from 2007, which had been a 20-40-40 breakout. As is noted in the table, there was a 52 percent to 75 percent increase in the proportion of non-LI MA-PD beneficiaries enrolled in enhanced plans with gap coverage.
23
The LI MA-PD sample followed its own pattern, which also changed from the previous year and was different from the non-LI MA-PD sample as well as from its LI PDP counterpart. A slightly lower proportion enrolled in basic plans in 2008 compared to 2007; and a higher proportion of those in enhanced plans chose gap coverage in 2008.
Unlike in the PDP sample, where enhanced benefits cost more, the MA-PD monthly premium continued to be higher for basic plans ($25) than for enhanced plans ($7–$17), an artifact related to payment incentives previously described. Approximately 40 percent of the MA-PD population paid no monthly premium for their Part D plan.
In terms of plan characteristics, which are not presented in tables, the major change from 2007 to 2008 was in the type of drugs covered in the gap for non-LI PDP beneficiaries enrolled in enhanced plans offering gap coverage. In 2007, 91 percent were in plans that offered gap coverage for generics only. In 2008, 100 percent of plans covered generics only. For non-LI MA-PD beneficiaries enrolled in enhanced plans offering gap coverage, the percentages were relatively constant in 2007 and 2008. About 75 percent were in plans with coverage for generics only; 25 percent had either generic and brand coverage or coverage of all formulary drugs.
2.3.5 Geographic Variation
There is geographic variation in enrollment patterns by plan type (PDP or MA-PD) and by disease group. Table 2.11 presents 2008 geographic statistics on urbanicity and composition by census region for the six chronic conditions and the overall continuing enrollee populations. The PDP population had an overall distribution of 73 percent in urban areas and 27 percent in rural areas. Major depression had the greatest concentration in urban areas (78%); dementia and diabetes with complications were also proportionally higher in urban areas. The MA-PD population was proportionally more urban, 90 percent urban in its overall distribution. Similarly, major depression had a slightly high concentration in urban areas. Comparing each plan type’s composition by census region showed that PDPs were significantly more concentrated in the Midwest and South and MA-PDs had strong penetration in the West. Looking at differences by disease group indicated that beneficiaries in the South had higher concentrations than the overall population of COPD, CHF, diabetes with complications, and rheumatoid arthritis in both the PDP and MA-PD subsets. Among the PDP population, those in the West were less likely than the overall population to have any of the six chronic conditions. The same pattern holds true for the MA-PD population in the West, with the exception of major depression, which had a higher concentration. In terms of compositional changes from 2007 to 2008, there were no significant geographic shifts in these broad divisions within the PDP population. The MA-PD population showed slight increases in its rural composition and in the census regions of the Midwest and South.
More detailed geographic analyses were conducted at the PDP- and MA-PD-region levels, stratified by low-income status. These showed significant variation by state, presumably due to the cost structure of plans offered, in the proportion of beneficiaries enrolled in basic plans, enhanced plans without gap coverage, and enhanced plans with gap coverage. For example, the summaries below for the non-LI subsets show the full sample distributions as well as the drug plan regions with the highest and lowest concentrations:
24
PDP non-LI subset
• Basic plans (Full sample 60.2%; New York 82.7%; Wisconsin 36.8%)
• Enhanced plans without gap coverage (Full sample 22.8%; Kansas 38.3%; Illinois 8.8%)
• Enhanced plans with gap coverage (Full sample 17.0%; Michigan 28.5%; New York 6.2%)
MA-PD non-LI subset7
• Basic plans (Full sample 10.5%; Georgia-South Carolina 41.1%; Nevada 0.8%)
• Enhanced plans without gap coverage (Full sample 30.5%; Arizona 57.6%; Louisiana-Mississippi 5.4%)
• Enhanced plans with gap coverage (Full sample 59.0%; Louisiana-Mississippi 88.6%; Kansas-Oklahoma 31.9%)
2.4 Plan Switching
Next we investigate the patterns of beneficiaries who were enrolled in Part D plans in terms of their decisions to stay in their existing drug plan or to switch plans. Medicare beneficiaries are limited in when and how often they may change plans. After the Initial Enrollment Period, the Medicare Part D program has an Annual Coordinated Election Period (ACEP) from mid-November through December each year in which beneficiaries may enroll in, disenroll from, or change their drug plans.8 Beneficiaries may want to switch drug plans for a variety of reasons, such as a change in health status affecting needed prescriptions, choice of drugs on a plan’s formulary, cost-sharing payment structure, monthly premiums, or a plan’s administrative policies. Additionally, a switch from FFS to MA or MA to FFS for Part A and Part B coverage would necessitate a change in the Part D drug plan.
For this analysis we examined two aspects of drug plan switching: (1) plan level switching between PDP and MA-PD plans for the full Part D continuing enrollee population and (2) coverage level switching for non-low-income (non-LI) high spenders who did not have gap coverage in 2007. In the latter analysis, beneficiaries may have remained in the same plan level (PDP or MA-PD) or simultaneously switched both coverage level (to enhanced with gap coverage) and plan level (from PDP to MA-PD or the reverse).
7 Alaska is the only MA-PD region not included in this subset. In 2008 its MA plan offerings were limited to
private-fee-for-service and medical savings accounts.
8 The Medicare Part D Program has additional enrollment time periods, known as Special Enrollment Periods, for which beneficiaries may qualify [gaining or losing creditable coverage, moving, changing institutionalized status, having Extra Help status, changing PACE enrollment, etc.] (Medicare Rights Center, 2009).
25

2.4.1 Plan Level Switching
As was noted earlier in this section, there were major underlying shifts in FFS and MA enrollment during the period of this analysis. The growth in MA enrollment from 2007 to 2008 involved new Medicare enrollees joining MA plans as well as continuing enrollees switching from FFS to MA. At the same time, the growth was mitigated by a smaller number of MA enrollees switching to FFS. For our plan type analysis, we defined beneficiaries as plan type “stayers” if they remained in the same type of plan (either PDP or MA-PD) in 2007 and 2008 and as “switchers” if they switched their 2007 plan type in 2008. We further stratified the analysis by low-income (LI) status.
Table 2.12 presents enrollment patterns and descriptive statistics of these beneficiaries, classified into four sets of stayer-switcher pairs, with the LI sets to the right. The first pair features non-LI beneficiaries enrolled in PDPs in 2007. Of this set, 97.1 percent were stayers and 2.9 percent were switchers, switching to MA-PDs in 2008. Looking at risk scores, drug spending, and demographics of each switcher-stayer pair reveals several patterns. The non-LI switchers from PDPs to MA-PDs had slightly lower risk scores and lower 2007 Part D spending than the PDP stayers. These switchers were younger, more likely to be male, and less likely to be White. In contrast, non-LI switchers from MA-PDs to PDPs had significantly higher risk scores and higher spending than the MA-PD stayers and were more likely to be disabled (under 65 age group) or in the oldest age bracket. They were slightly more likely to be female and to be White or Black. The same drug spending patterns carried over to the LI stayer-switcher pairs. There was little or no difference by sex among the LI stayer-switcher pairs. Differences by race for the LI population were only slightly different from those of the non-LI—Blacks were more likely to switch in both directions, as were Hispanics, with the latter group much more likely to switch from a PDP to an MA-PD.
These results are consistent with related studies showing that younger and healthier enrollees are more likely to switch to a less expensive and more restrictive health plan (Cutler et al., 2009; Tchernis et al., 2006). Chronic condition beneficiaries with extensive health needs are less likely to switch to a less expensive and more restrictive health plan in part because of the transition costs. They could lose continuity of care if their existing physicians are not part of the network. Switching plans and providers also involves time selecting a plan, finding new physicians, transferring records, running new tests, and understanding new administrative policies. The low switching rates for non-LI beneficiaries for our analysis (2.9% to MA-PD and 1.5% to PDP) are also consistent with the previously cited studies. The LI populations in our study had higher switching rates (4.1% to MA-PD and 8.0% to PDP). There are several possible reasons for these higher rates. LI beneficiaries are able to switch plans once a month, rather than only during the ACEP. Many are auto-enrolled and may choose to change their initial enrollment. Furthermore, LI beneficiaries are more likely to have experienced instability in their health care coverage and thus may not have an established pattern of care from which they are reluctant to switch.
2.4.2 High Spenders—Coverage Level Switching
Our final analysis looked at non-LI beneficiaries who in 2007 lacked gap coverage but had high Part D expenditures (total spending of $3,000 or higher) in both 2007 and 2008. For
26
beneficiaries enrolled in a defined standard plan in 2007, total spending of $3,000 corresponded to $1,398.75 in out-of-pocket costs ($265 deductible + $533.75 initial coverage coinsurance + $600 gap spending). We limited this study to non-LI beneficiaries because they are not subsidized through the coverage gap. These non-LI high spenders would be those most likely to consider switching to a plan with gap coverage for financial reasons. For this high-spender analysis, we defined beneficiaries as coverage type “stayers” if they remained in the same type of plan (no gap coverage) in 2007 and 2008 and as “switchers” if they switched in 2008 to a plan with gap coverage.
Table 2.13 displays a summary of our findings. Among all non-LI continuing enrollees, 6.8 percent met our definition of high spenders. The proportion was double that for most of the chronic conditions; dementia had a rate three times as high, nearly 21 percent. The proportion of switchers by disease ranged from 8.6 percent (dementia) to 13.9 percent (major depression). Each sample was separated into four subsamples of switcher-stayer pairs, corresponding to overall plan type. For example, the first two pairs of stayers-switchers feature beneficiaries who were enrolled in PDPs in 2007. These enrollees could have remained in a PDP in 2008 and switched to gap coverage or, while making the switch to gap coverage in 2008, they could have also changed to an MA-PD plan. As Table 2.13 shows, the proportion who switched to gap coverage varied greatly by stayer-switcher subset. Those who were in a PDP in both years were least likely to switch to gap coverage, having switching rates in the 2 to 3 percent range. In contrast, those who simultaneously switched from a PDP to an MA-PD had the highest rates of switching to gap coverage, 51 to 55 percent.
The Technical Appendix to this report includes detailed results for the full high-spender sample and each chronic condition subsample, featuring 2007 and 2008 Part D expenditures and risk scores as well as demographic statistics. Many of the plan-switching trends across the disease groups were consistent with other analyses. Those who switched to gap coverage in each of the four possible subsets were more likely to be in the two youngest age groups, under age 65 or age 65 to 74. Switchers frequently had lower spending in 2007 than their stayer counterparts. However, in most cases the differences in Part D spending from 2007 to 2008 were greater for switchers than for stayers. The lower spending in 2007 could indicate that switchers were healthier or, alternatively, that they limited drug spending until switching to a plan with gap coverage. There were variations in this pattern for the dementia and major depression subsamples.
2.5 Discussion
The purpose of this comprehensive descriptive analysis was to identify the Part D enrollment patterns and trends over time among Medicare beneficiaries with these six chronic conditions: COPD, CHF, diabetes with complications, dementia, major depression, and rheumatoid arthritis.
As in 2007, our analysis showed that beneficiaries with chronic conditions had significantly higher drug expenses than the baseline continuing enrollee in the overall sample. Whereas about 24 percent of the non-low-income (non-LI) PDP population reached the coverage gap, 30 to 43 percent of those in the chronic condition samples did. Median total drug spending ranged from approximately $2,100 to $3,100. Between 8 percent and 16 percent of the non-LI
27
PDP chronic condition samples were enrolled in plans without gap coverage and reached the catastrophic coverage level. Although mean annual drug spending increased from 2007 to 2008, the percentage of non-LI PDP beneficiaries enrolled in plans with gap coverage decreased slightly.
Many of the changes in enrollment figures, especially in the MA population, have interrelated causes. For example, MA-PDs had proportionally higher enrollment growth in the South. Several states in this region have the highest rates of obesity, diabetes, and depression in the country (CDC, 2009, 2010; Strine et al., 2008), which in turn contributed to significant increases in the diabetes with complications and major depression sample sizes. At the same time, the geographic analyses showed that several of the Southern states had very high concentrations of beneficiaries enrolled in enhanced plans with gap coverage. This occurrence, combined with double-digit growth, played a role in raising the overall percentage of enhanced plans with gap coverage in the non-LI MA-PD population to 60 percent. This example illustrates the challenge and limitations of this analysis. A variety of decisions at the individual beneficiary level, as well as ongoing changes in plan offerings at the community or regional level, combined with geographic variation in disease prevalence and practice patterns, makes disentangling the causes of changing enrollment patterns difficult.
Our plan switching analyses provide descriptive statistics suggesting that younger and healthier beneficiaries are more likely to switch plans—whether switching plan type (PDP to MA-PD) or coverage type (no gap coverage to gap coverage). For non-LI PDP beneficiaries who were high spenders in 2007 and not enrolled in a plan with gap coverage, only about 4 percent switched to gap coverage plans in 2008. Several reasons could be posited for this low rate among those most likely to benefit financially from switching coverage type. Beneficiaries may be satisfied with the non-financial aspects of their drug plan and choose higher payments for the peace of mind of a solid plan. Beneficiaries may not understand the choices available to them or they may be limited in their ability to evaluate the annual costs of both premiums and copayments. Beneficiaries may not have a sufficient support system to help them periodically re-evaluate plan choice. And finally, beneficiaries with chronic conditions may be focused on their significant health issues and unable or unwilling to address less-pressing non-health issues. This scenario could easily be imagined for beneficiaries experiencing dementia (or their families).
In light of the many chronic condition beneficiaries experiencing high drug spending and their reluctance to switch plans, the enrollment statistics in this analysis provide a framework for identifying subgroups who are likely to benefit from the Affordable Care Act’s phase-out of the coverage gap.
28
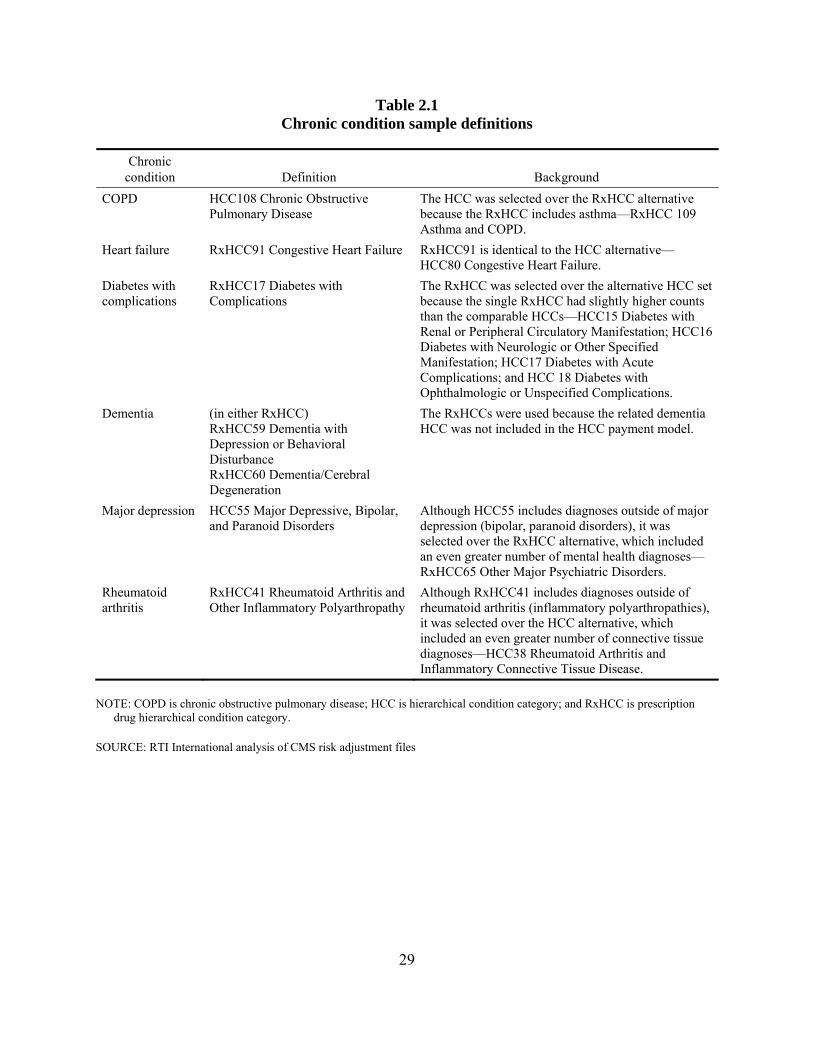
Table 2.1 Chronic condition sample definitions
Chronic condition Definition Background
COPD HCC108 Chronic Obstructive Pulmonary Disease
The HCC was selected over the RxHCC alternative because the RxHCC includes asthma—RxHCC 109 Asthma and COPD.
Heart failure RxHCC91 Congestive Heart Failure RxHCC91 is identical to the HCC alternative—HCC80 Congestive Heart Failure.
Diabetes with complications
RxHCC17 Diabetes with Complications
The RxHCC was selected over the alternative HCC set because the single RxHCC had slightly higher counts than the comparable HCCs—HCC15 Diabetes with Renal or Peripheral Circulatory Manifestation; HCC16 Diabetes with Neurologic or Other Specified Manifestation; HCC17 Diabetes with Acute Complications; and HCC 18 Diabetes with Ophthalmologic or Unspecified Complications.
Dementia (in either RxHCC) RxHCC59 Dementia with Depression or Behavioral Disturbance RxHCC60 Dementia/Cerebral Degeneration
The RxHCCs were used because the related dementia HCC was not included in the HCC payment model.
Major depression HCC55 Major Depressive, Bipolar, and Paranoid Disorders
Although HCC55 includes diagnoses outside of major depression (bipolar, paranoid disorders), it was selected over the RxHCC alternative, which included an even greater number of mental health diagnoses—RxHCC65 Other Major Psychiatric Disorders.
Rheumatoid arthritis
RxHCC41 Rheumatoid Arthritis and Other Inflammatory Polyarthropathy
Although RxHCC41 includes diagnoses outside of rheumatoid arthritis (inflammatory polyarthropathies), it was selected over the HCC alternative, which included an even greater number of connective tissue diagnoses—HCC38 Rheumatoid Arthritis and Inflammatory Connective Tissue Disease.
NOTE: COPD is chronic obstructive pulmonary disease; HCC is hierarchical condition category; and RxHCC is prescription drug hierarchical condition category.
SOURCE: RTI International analysis of CMS risk adjustment files
29
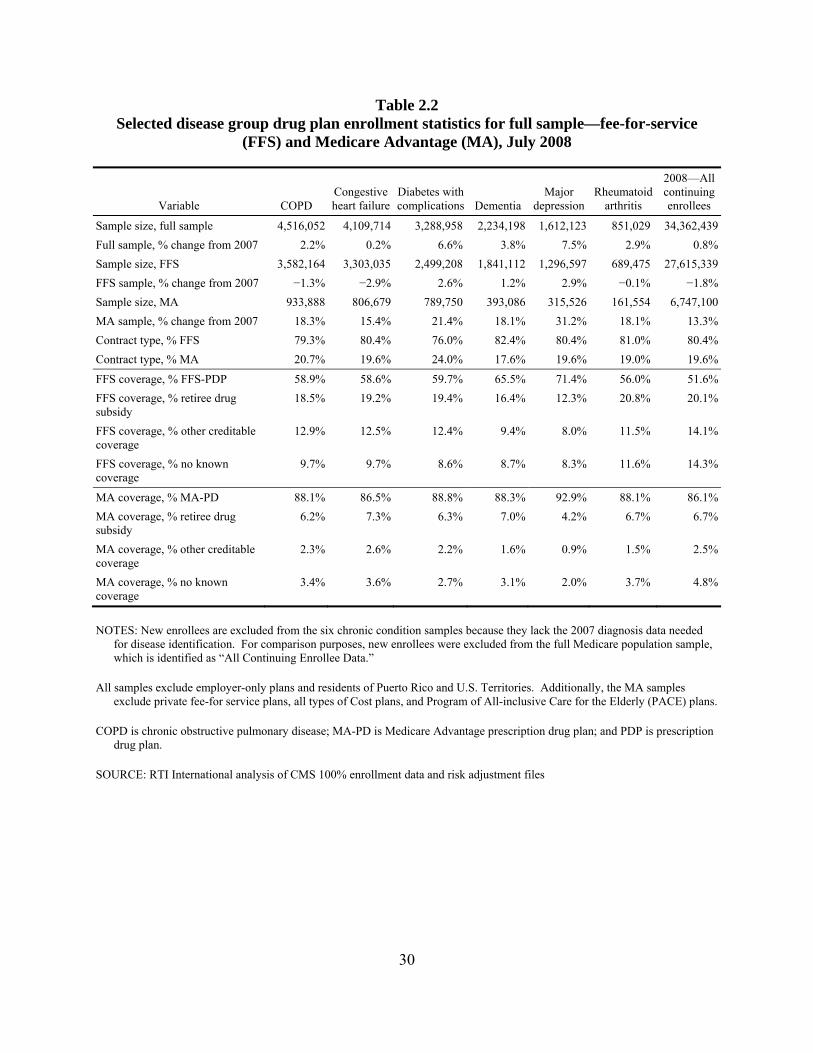
Table 2.2 Selected disease group drug plan enrollment statistics for full sample—fee-for-service
(FFS) and Medicare Advantage (MA), July 2008
Variable COPDCongestive heart failure
Diabetes with complications Dementia
Major depression
Rheumatoid arthritis
2008—All continuing enrollees
Sample size, full sample 4,516,052 4,109,714 3,288,958 2,234,198 1,612,123 851,029 34,362,439Full sample, % change from 2007 2.2% 0.2% 6.6% 3.8% 7.5% 2.9% 0.8%Sample size, FFS 3,582,164 3,303,035 2,499,208 1,841,112 1,296,597 689,475 27,615,339FFS sample, % change from 2007 −1.3% −2.9% 2.6% 1.2% 2.9% −0.1% −1.8%Sample size, MA 933,888 806,679 789,750 393,086 315,526 161,554 6,747,100MA sample, % change from 2007 18.3% 15.4% 21.4% 18.1% 31.2% 18.1% 13.3%Contract type, % FFS 79.3% 80.4% 76.0% 82.4% 80.4% 81.0% 80.4%Contract type, % MA 20.7% 19.6% 24.0% 17.6% 19.6% 19.0% 19.6%
FFS coverage, % FFS-PDP 58.9% 58.6% 59.7% 65.5% 71.4% 56.0% 51.6%FFS coverage, % retiree drug subsidy
18.5% 19.2% 19.4% 16.4% 12.3% 20.8% 20.1%
FFS coverage, % other creditable coverage
12.9% 12.5% 12.4% 9.4% 8.0% 11.5% 14.1%
FFS coverage, % no known coverage
9.7% 9.7% 8.6% 8.7% 8.3% 11.6% 14.3%
MA coverage, % MA-PD 88.1% 86.5% 88.8% 88.3% 92.9% 88.1% 86.1%MA coverage, % retiree drug subsidy
6.2% 7.3% 6.3% 7.0% 4.2% 6.7% 6.7%
MA coverage, % other creditable coverage
2.3% 2.6% 2.2% 1.6% 0.9% 1.5% 2.5%
MA coverage, % no known coverage
3.4% 3.6% 2.7% 3.1% 2.0% 3.7% 4.8%
NOTES: New enrollees are excluded from the six chronic condition samples because they lack the 2007 diagnosis data needed for disease identification. For comparison purposes, new enrollees were excluded from the full Medicare population sample, which is identified as “All Continuing Enrollee Data.”
All samples exclude employer-only plans and residents of Puerto Rico and U.S. Territories. Additionally, the MA samples exclude private fee-for service plans, all types of Cost plans, and Program of All-inclusive Care for the Elderly (PACE) plans.
COPD is chronic obstructive pulmonary disease; MA-PD is Medicare Advantage prescription drug plan; and PDP is prescription drug plan.
SOURCE: RTI International analysis of CMS 100% enrollment data and risk adjustment files
30
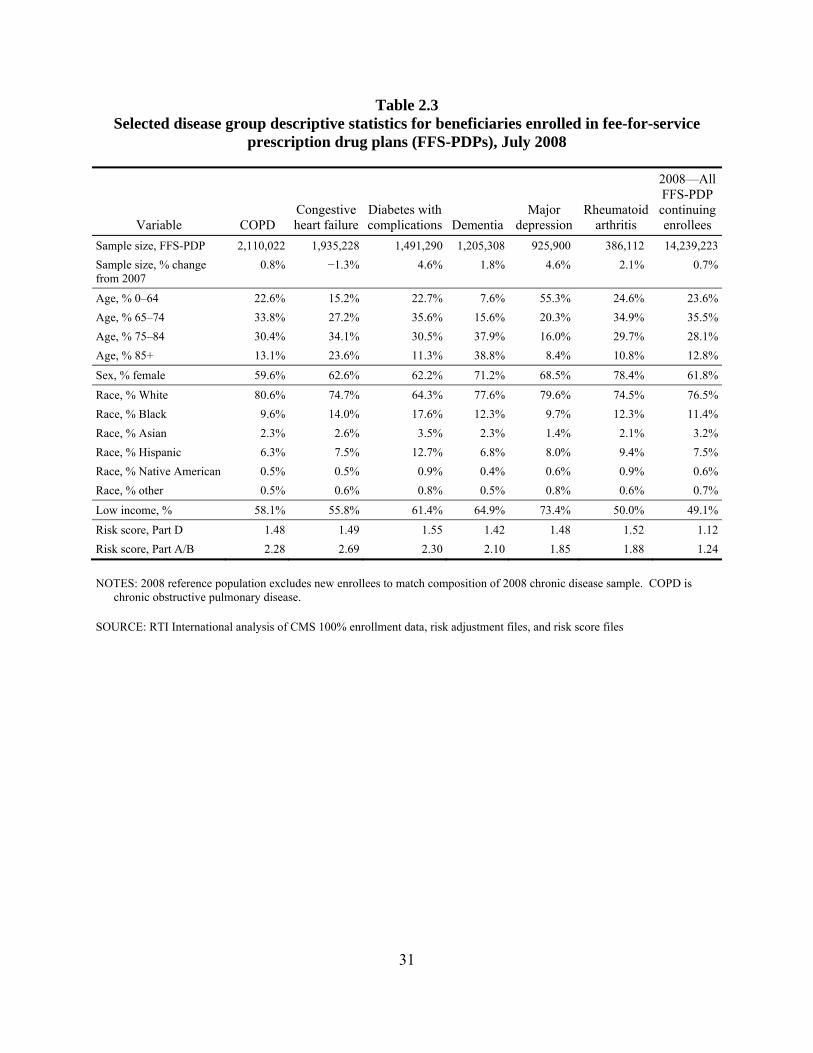
Table 2.3 Selected disease group descriptive statistics for beneficiaries enrolled in fee-for-service
prescription drug plans (FFS-PDPs), July 2008
Variable COPD Congestive heart failure
Diabetes with complications Dementia
Major depression
Rheumatoid arthritis
2008—All FFS-PDP continuing enrollees
Sample size, FFS-PDP 2,110,022 1,935,228 1,491,290 1,205,308 925,900 386,112 14,239,223Sample size, % change from 2007
0.8% −1.3% 4.6% 1.8% 4.6% 2.1% 0.7%
Age, % 0–64 22.6% 15.2% 22.7% 7.6% 55.3% 24.6% 23.6%Age, % 65–74 33.8% 27.2% 35.6% 15.6% 20.3% 34.9% 35.5%Age, % 75–84 30.4% 34.1% 30.5% 37.9% 16.0% 29.7% 28.1%Age, % 85+ 13.1% 23.6% 11.3% 38.8% 8.4% 10.8% 12.8%
Sex, % female 59.6% 62.6% 62.2% 71.2% 68.5% 78.4% 61.8%
Race, % White 80.6% 74.7% 64.3% 77.6% 79.6% 74.5% 76.5%Race, % Black 9.6% 14.0% 17.6% 12.3% 9.7% 12.3% 11.4%Race, % Asian 2.3% 2.6% 3.5% 2.3% 1.4% 2.1% 3.2%Race, % Hispanic 6.3% 7.5% 12.7% 6.8% 8.0% 9.4% 7.5%Race, % Native American 0.5% 0.5% 0.9% 0.4% 0.6% 0.9% 0.6%Race, % other 0.5% 0.6% 0.8% 0.5% 0.8% 0.6% 0.7%
Low income, % 58.1% 55.8% 61.4% 64.9% 73.4% 50.0% 49.1%
Risk score, Part D 1.48 1.49 1.55 1.42 1.48 1.52 1.12Risk score, Part A/B 2.28 2.69 2.30 2.10 1.85 1.88 1.24
NOTES: 2008 reference population excludes new enrollees to match composition of 2008 chronic disease sample. COPD is chronic obstructive pulmonary disease.
SOURCE: RTI International analysis of CMS 100% enrollment data, risk adjustment files, and risk score files
31
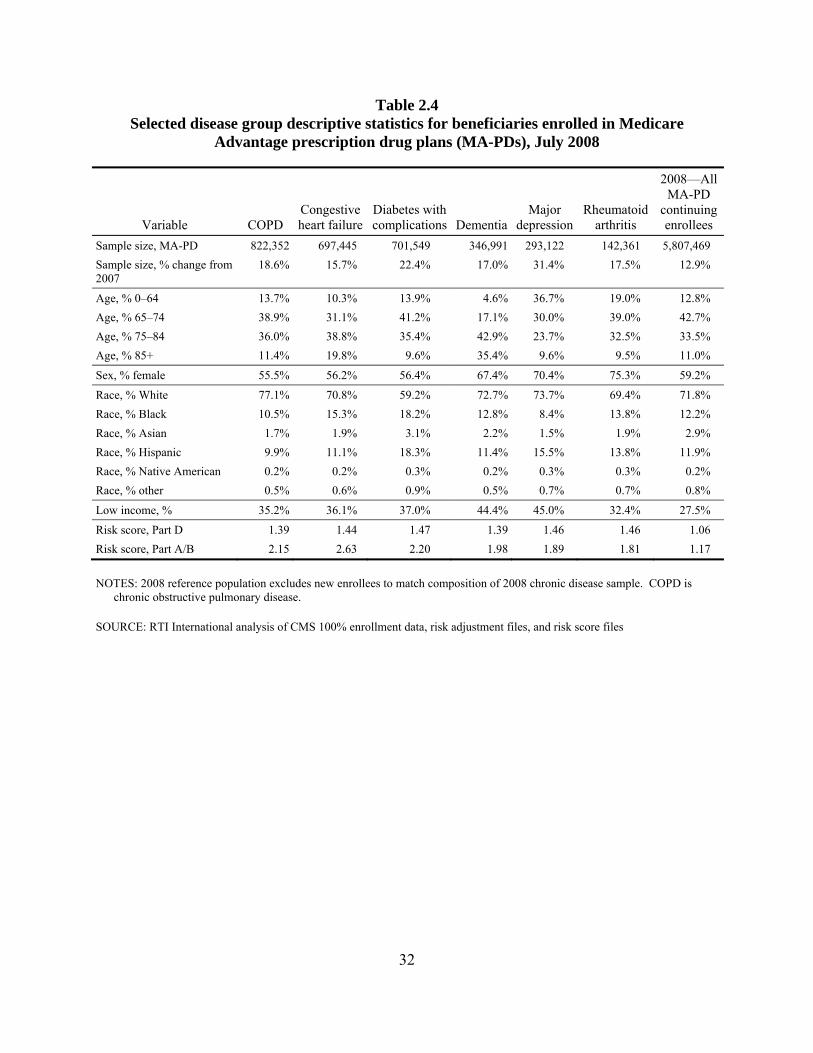
Table 2.4 Selected disease group descriptive statistics for beneficiaries enrolled in Medicare
Advantage prescription drug plans (MA-PDs), July 2008
Variable COPD Congestive heart failure
Diabetes with complications Dementia
Major depression
Rheumatoid arthritis
2008—AllMA-PD
continuing enrollees
Sample size, MA-PD 822,352 697,445 701,549 346,991 293,122 142,361 5,807,469 Sample size, % change from 2007
18.6% 15.7% 22.4% 17.0% 31.4% 17.5% 12.9%
Age, % 0–64 13.7% 10.3% 13.9% 4.6% 36.7% 19.0% 12.8% Age, % 65–74 38.9% 31.1% 41.2% 17.1% 30.0% 39.0% 42.7% Age, % 75–84 36.0% 38.8% 35.4% 42.9% 23.7% 32.5% 33.5% Age, % 85+ 11.4% 19.8% 9.6% 35.4% 9.6% 9.5% 11.0%
Sex, % female 55.5% 56.2% 56.4% 67.4% 70.4% 75.3% 59.2%
Race, % White 77.1% 70.8% 59.2% 72.7% 73.7% 69.4% 71.8% Race, % Black 10.5% 15.3% 18.2% 12.8% 8.4% 13.8% 12.2% Race, % Asian 1.7% 1.9% 3.1% 2.2% 1.5% 1.9% 2.9% Race, % Hispanic 9.9% 11.1% 18.3% 11.4% 15.5% 13.8% 11.9% Race, % Native American 0.2% 0.2% 0.3% 0.2% 0.3% 0.3% 0.2% Race, % other 0.5% 0.6% 0.9% 0.5% 0.7% 0.7% 0.8%
Low income, % 35.2% 36.1% 37.0% 44.4% 45.0% 32.4% 27.5%
Risk score, Part D 1.39 1.44 1.47 1.39 1.46 1.46 1.06 Risk score, Part A/B 2.15 2.63 2.20 1.98 1.89 1.81 1.17
NOTES: 2008 reference population excludes new enrollees to match composition of 2008 chronic disease sample. COPD is chronic obstructive pulmonary disease.
SOURCE: RTI International analysis of CMS 100% enrollment data, risk adjustment files, and risk score files
32
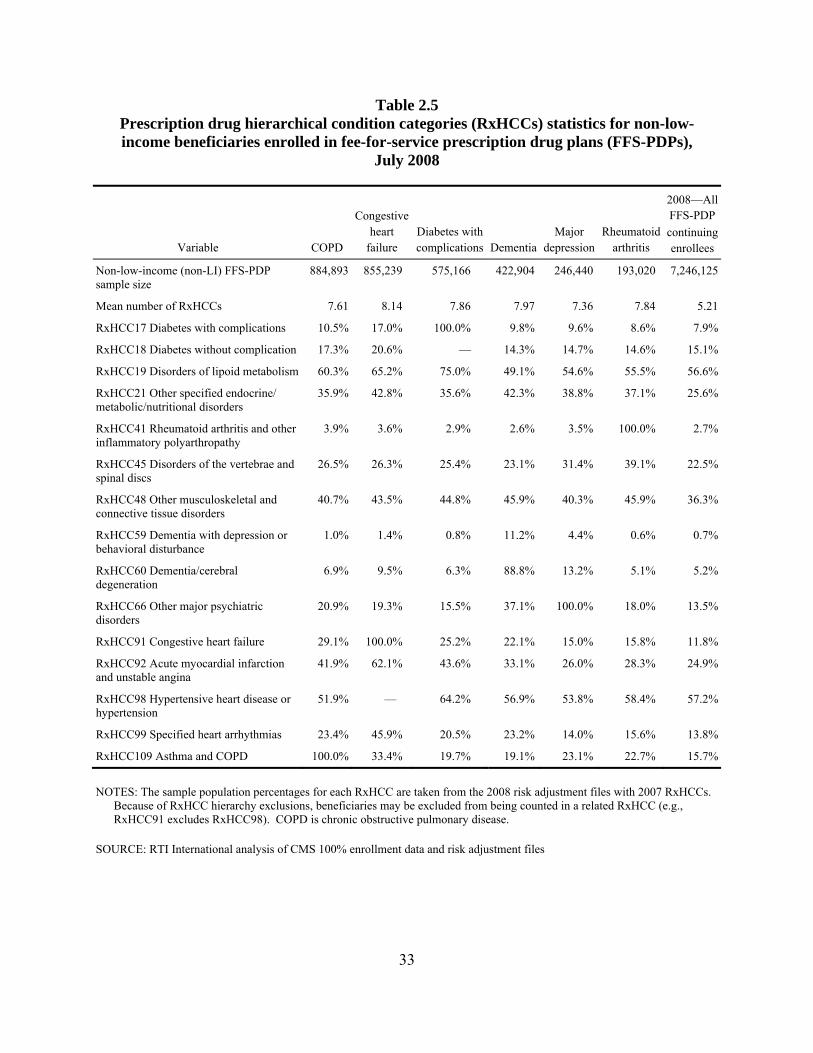
Table 2.5 Prescription drug hierarchical condition categories (RxHCCs) statistics for non-low-income beneficiaries enrolled in fee-for-service prescription drug plans (FFS-PDPs),
July 2008
Variable COPD
Congestive heart
failure Diabetes with complications Dementia
Major depression
Rheumatoid arthritis
2008—AllFFS-PDP continuing enrollees
Non-low-income (non-LI) FFS-PDP sample size
884,893 855,239 575,166 422,904 246,440 193,020 7,246,125
Mean number of RxHCCs 7.61 8.14 7.86 7.97 7.36 7.84 5.21
RxHCC17 Diabetes with complications 10.5% 17.0% 100.0% 9.8% 9.6% 8.6% 7.9%
RxHCC18 Diabetes without complication 17.3% 20.6% — 14.3% 14.7% 14.6% 15.1%
RxHCC19 Disorders of lipoid metabolism 60.3% 65.2% 75.0% 49.1% 54.6% 55.5% 56.6%
RxHCC21 Other specified endocrine/ metabolic/nutritional disorders
35.9% 42.8% 35.6% 42.3% 38.8% 37.1% 25.6%
RxHCC41 Rheumatoid arthritis and other inflammatory polyarthropathy
3.9% 3.6% 2.9% 2.6% 3.5% 100.0% 2.7%
RxHCC45 Disorders of the vertebrae and spinal discs
26.5% 26.3% 25.4% 23.1% 31.4% 39.1% 22.5%
RxHCC48 Other musculoskeletal and connective tissue disorders
40.7% 43.5% 44.8% 45.9% 40.3% 45.9% 36.3%
RxHCC59 Dementia with depression or behavioral disturbance
1.0% 1.4% 0.8% 11.2% 4.4% 0.6% 0.7%
RxHCC60 Dementia/cerebral degeneration
6.9% 9.5% 6.3% 88.8% 13.2% 5.1% 5.2%
RxHCC66 Other major psychiatric disorders
20.9% 19.3% 15.5% 37.1% 100.0% 18.0% 13.5%
RxHCC91 Congestive heart failure 29.1% 100.0% 25.2% 22.1% 15.0% 15.8% 11.8%
RxHCC92 Acute myocardial infarction and unstable angina
41.9% 62.1% 43.6% 33.1% 26.0% 28.3% 24.9%
RxHCC98 Hypertensive heart disease or hypertension
51.9% — 64.2% 56.9% 53.8% 58.4% 57.2%
RxHCC99 Specified heart arrhythmias 23.4% 45.9% 20.5% 23.2% 14.0% 15.6% 13.8%
RxHCC109 Asthma and COPD 100.0% 33.4% 19.7% 19.1% 23.1% 22.7% 15.7%
NOTES: The sample population percentages for each RxHCC are taken from the 2008 risk adjustment files with 2007 RxHCCs. Because of RxHCC hierarchy exclusions, beneficiaries may be excluded from being counted in a related RxHCC (e.g., RxHCC91 excludes RxHCC98). COPD is chronic obstructive pulmonary disease.
SOURCE: RTI International analysis of CMS 100% enrollment data and risk adjustment files
33
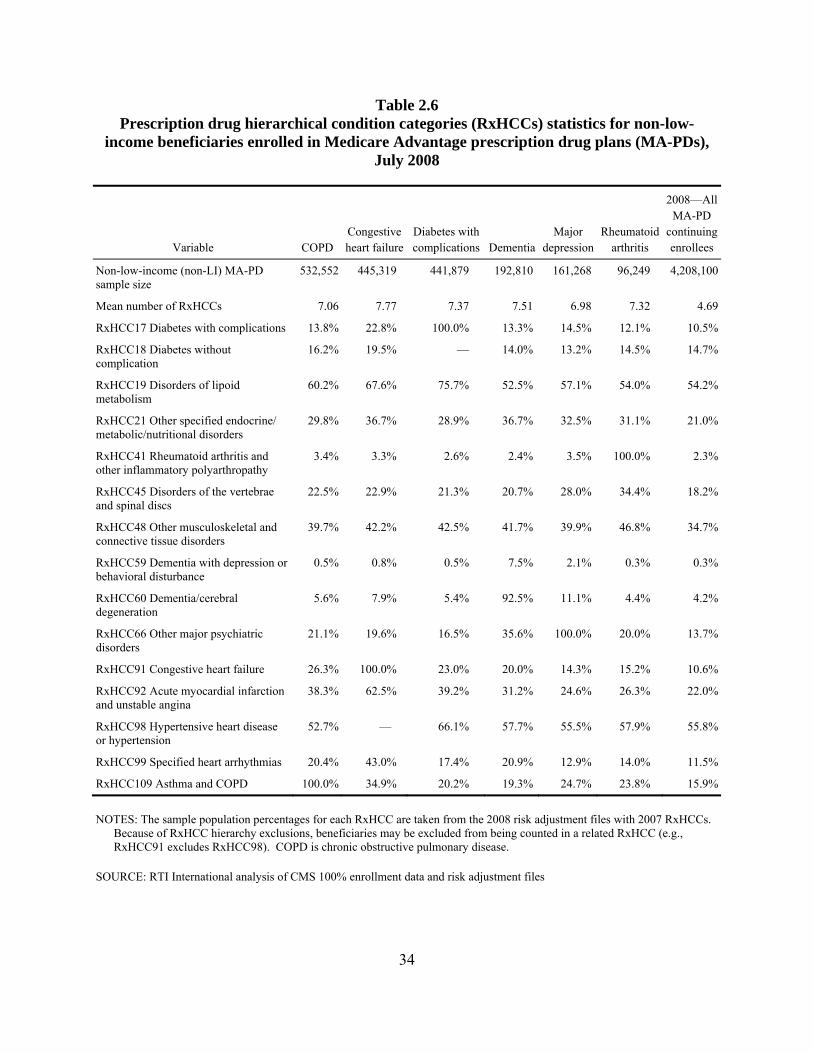
Table 2.6 Prescription drug hierarchical condition categories (RxHCCs) statistics for non-low-
income beneficiaries enrolled in Medicare Advantage prescription drug plans (MA-PDs), July 2008
Variable COPD Congestive heart failure
Diabetes with complications Dementia
Major depression
Rheumatoid arthritis
2008—All MA-PD
continuing enrollees
Non-low-income (non-LI) MA-PD sample size
532,552 445,319 441,879 192,810 161,268 96,249 4,208,100
Mean number of RxHCCs 7.06 7.77 7.37 7.51 6.98 7.32 4.69
RxHCC17 Diabetes with complications 13.8% 22.8% 100.0% 13.3% 14.5% 12.1% 10.5%
RxHCC18 Diabetes without complication
16.2% 19.5% — 14.0% 13.2% 14.5% 14.7%
RxHCC19 Disorders of lipoid metabolism
60.2% 67.6% 75.7% 52.5% 57.1% 54.0% 54.2%
RxHCC21 Other specified endocrine/ metabolic/nutritional disorders
29.8% 36.7% 28.9% 36.7% 32.5% 31.1% 21.0%
RxHCC41 Rheumatoid arthritis and other inflammatory polyarthropathy
3.4% 3.3% 2.6% 2.4% 3.5% 100.0% 2.3%
RxHCC45 Disorders of the vertebrae and spinal discs
22.5% 22.9% 21.3% 20.7% 28.0% 34.4% 18.2%
RxHCC48 Other musculoskeletal and connective tissue disorders
39.7% 42.2% 42.5% 41.7% 39.9% 46.8% 34.7%
RxHCC59 Dementia with depression or behavioral disturbance
0.5% 0.8% 0.5% 7.5% 2.1% 0.3% 0.3%
RxHCC60 Dementia/cerebral degeneration
5.6% 7.9% 5.4% 92.5% 11.1% 4.4% 4.2%
RxHCC66 Other major psychiatric disorders
21.1% 19.6% 16.5% 35.6% 100.0% 20.0% 13.7%
RxHCC91 Congestive heart failure 26.3% 100.0% 23.0% 20.0% 14.3% 15.2% 10.6%
RxHCC92 Acute myocardial infarction and unstable angina
38.3% 62.5% 39.2% 31.2% 24.6% 26.3% 22.0%
RxHCC98 Hypertensive heart disease or hypertension
52.7% — 66.1% 57.7% 55.5% 57.9% 55.8%
RxHCC99 Specified heart arrhythmias 20.4% 43.0% 17.4% 20.9% 12.9% 14.0% 11.5%
RxHCC109 Asthma and COPD 100.0% 34.9% 20.2% 19.3% 24.7% 23.8% 15.9%
NOTES: The sample population percentages for each RxHCC are taken from the 2008 risk adjustment files with 2007 RxHCCs. Because of RxHCC hierarchy exclusions, beneficiaries may be excluded from being counted in a related RxHCC (e.g., RxHCC91 excludes RxHCC98). COPD is chronic obstructive pulmonary disease.
SOURCE: RTI International analysis of CMS 100% enrollment data and risk adjustment files
34
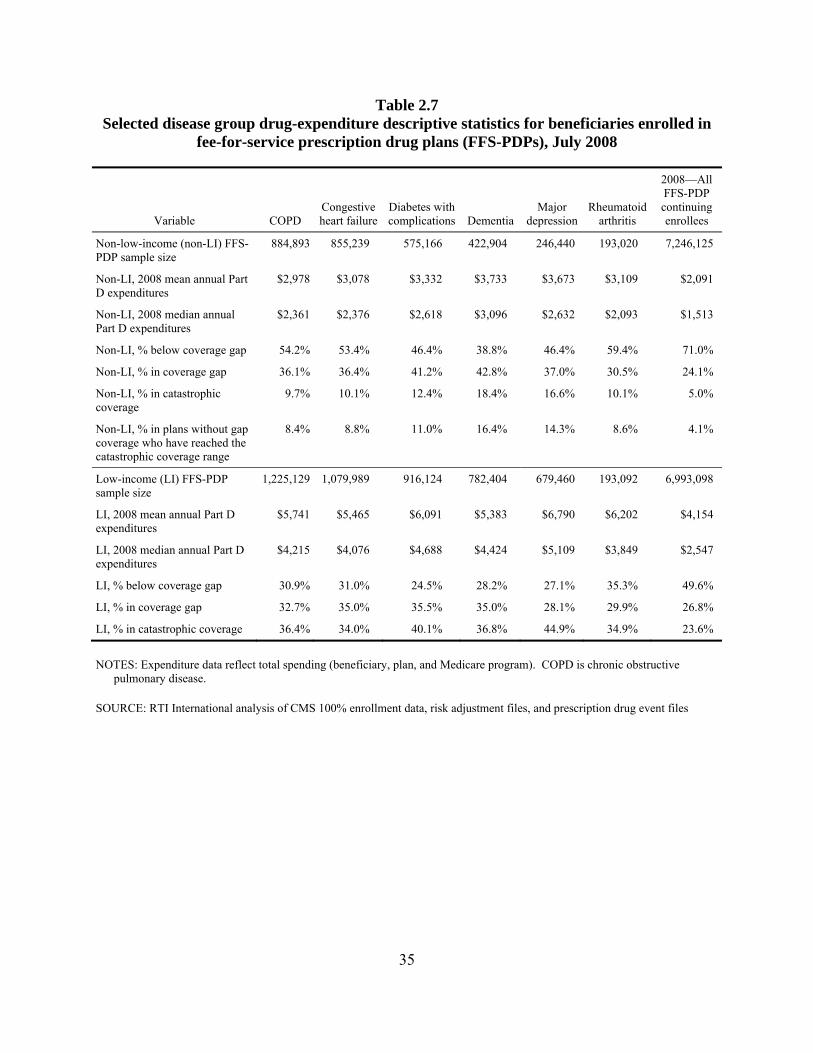
Table 2.7 Selected disease group drug-expenditure descriptive statistics for beneficiaries enrolled in
fee-for-service prescription drug plans (FFS-PDPs), July 2008
Variable COPD Congestive heart failure
Diabetes with complications Dementia
Major depression
Rheumatoid arthritis
2008—All FFS-PDP continuing enrollees
Non-low-income (non-LI) FFS-PDP sample size
884,893 855,239 575,166 422,904 246,440 193,020 7,246,125
Non-LI, 2008 mean annual Part D expenditures
$2,978 $3,078 $3,332 $3,733 $3,673 $3,109 $2,091
Non-LI, 2008 median annual Part D expenditures
$2,361 $2,376 $2,618 $3,096 $2,632 $2,093 $1,513
Non-LI, % below coverage gap 54.2% 53.4% 46.4% 38.8% 46.4% 59.4% 71.0%
Non-LI, % in coverage gap 36.1% 36.4% 41.2% 42.8% 37.0% 30.5% 24.1%
Non-LI, % in catastrophic coverage
9.7% 10.1% 12.4% 18.4% 16.6% 10.1% 5.0%
Non-LI, % in plans without gap coverage who have reached the catastrophic coverage range
8.4% 8.8% 11.0% 16.4% 14.3% 8.6% 4.1%
Low-income (LI) FFS-PDP sample size
1,225,129 1,079,989 916,124 782,404 679,460 193,092 6,993,098
LI, 2008 mean annual Part D expenditures
$5,741 $5,465 $6,091 $5,383 $6,790 $6,202 $4,154
LI, 2008 median annual Part D expenditures
$4,215 $4,076 $4,688 $4,424 $5,109 $3,849 $2,547
LI, % below coverage gap 30.9% 31.0% 24.5% 28.2% 27.1% 35.3% 49.6%
LI, % in coverage gap 32.7% 35.0% 35.5% 35.0% 28.1% 29.9% 26.8%
LI, % in catastrophic coverage 36.4% 34.0% 40.1% 36.8% 44.9% 34.9% 23.6%
NOTES: Expenditure data reflect total spending (beneficiary, plan, and Medicare program). COPD is chronic obstructive pulmonary disease.
SOURCE: RTI International analysis of CMS 100% enrollment data, risk adjustment files, and prescription drug event files
35
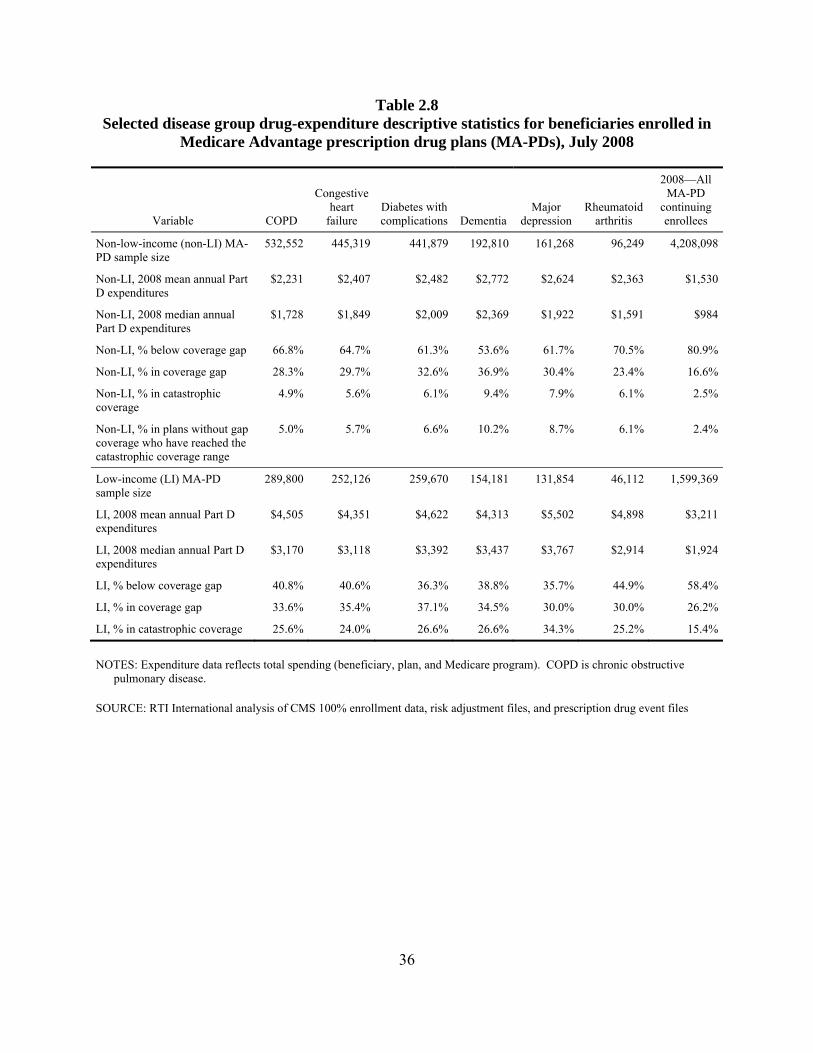
Table 2.8 Selected disease group drug-expenditure descriptive statistics for beneficiaries enrolled in
Medicare Advantage prescription drug plans (MA-PDs), July 2008
Variable COPD
Congestive heart
failure Diabetes with complications Dementia
Major depression
Rheumatoid arthritis
2008—All MA-PD
continuing enrollees
Non-low-income (non-LI) MA-PD sample size
532,552 445,319 441,879 192,810 161,268 96,249 4,208,098
Non-LI, 2008 mean annual Part D expenditures
$2,231 $2,407 $2,482 $2,772 $2,624 $2,363 $1,530
Non-LI, 2008 median annual Part D expenditures
$1,728 $1,849 $2,009 $2,369 $1,922 $1,591 $984
Non-LI, % below coverage gap 66.8% 64.7% 61.3% 53.6% 61.7% 70.5% 80.9%
Non-LI, % in coverage gap 28.3% 29.7% 32.6% 36.9% 30.4% 23.4% 16.6%
Non-LI, % in catastrophic coverage
4.9% 5.6% 6.1% 9.4% 7.9% 6.1% 2.5%
Non-LI, % in plans without gap coverage who have reached the catastrophic coverage range
5.0% 5.7% 6.6% 10.2% 8.7% 6.1% 2.4%
Low-income (LI) MA-PD sample size
289,800 252,126 259,670 154,181 131,854 46,112 1,599,369
LI, 2008 mean annual Part D expenditures
$4,505 $4,351 $4,622 $4,313 $5,502 $4,898 $3,211
LI, 2008 median annual Part D expenditures
$3,170 $3,118 $3,392 $3,437 $3,767 $2,914 $1,924
LI, % below coverage gap 40.8% 40.6% 36.3% 38.8% 35.7% 44.9% 58.4%
LI, % in coverage gap 33.6% 35.4% 37.1% 34.5% 30.0% 30.0% 26.2%
LI, % in catastrophic coverage 25.6% 24.0% 26.6% 26.6% 34.3% 25.2% 15.4%
NOTES: Expenditure data reflects total spending (beneficiary, plan, and Medicare program). COPD is chronic obstructive pulmonary disease.
SOURCE: RTI International analysis of CMS 100% enrollment data, risk adjustment files, and prescription drug event files
36
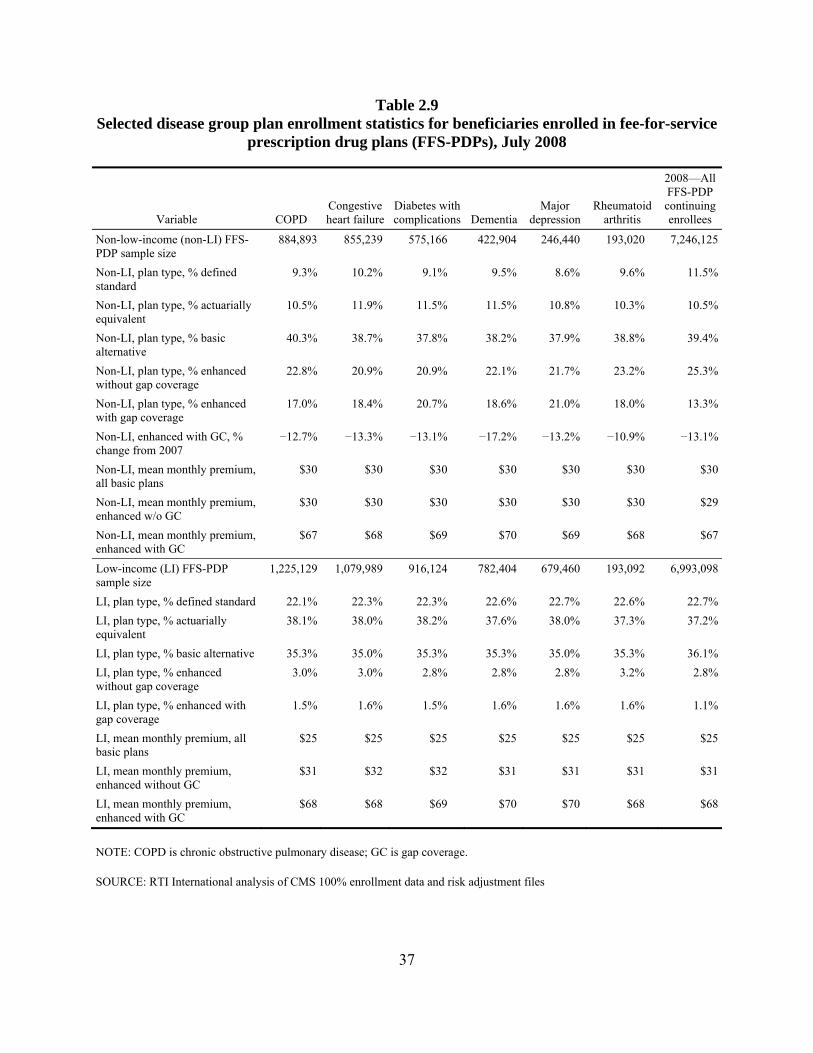
Table 2.9 Selected disease group plan enrollment statistics for beneficiaries enrolled in fee-for-service
prescription drug plans (FFS-PDPs), July 2008
Variable COPDCongestive heart failure
Diabetes with complications Dementia
Major depression
Rheumatoid arthritis
2008—All FFS-PDP continuing enrollees
Non-low-income (non-LI) FFS-PDP sample size
884,893 855,239 575,166 422,904 246,440 193,020 7,246,125
Non-LI, plan type, % defined standard
9.3% 10.2% 9.1% 9.5% 8.6% 9.6% 11.5%
Non-LI, plan type, % actuarially equivalent
10.5% 11.9% 11.5% 11.5% 10.8% 10.3% 10.5%
Non-LI, plan type, % basic alternative
40.3% 38.7% 37.8% 38.2% 37.9% 38.8% 39.4%
Non-LI, plan type, % enhanced without gap coverage
22.8% 20.9% 20.9% 22.1% 21.7% 23.2% 25.3%
Non-LI, plan type, % enhanced with gap coverage
17.0% 18.4% 20.7% 18.6% 21.0% 18.0% 13.3%
Non-LI, enhanced with GC, % change from 2007
−12.7% −13.3% −13.1% −17.2% −13.2% −10.9% −13.1%
Non-LI, mean monthly premium, all basic plans
$30 $30 $30 $30 $30 $30 $30
Non-LI, mean monthly premium, enhanced w/o GC
$30 $30 $30 $30 $30 $30 $29
Non-LI, mean monthly premium, enhanced with GC
$67 $68 $69 $70 $69 $68 $67
Low-income (LI) FFS-PDP sample size
1,225,129 1,079,989 916,124 782,404 679,460 193,092 6,993,098
LI, plan type, % defined standard 22.1% 22.3% 22.3% 22.6% 22.7% 22.6% 22.7%LI, plan type, % actuarially equivalent
38.1% 38.0% 38.2% 37.6% 38.0% 37.3% 37.2%
LI, plan type, % basic alternative 35.3% 35.0% 35.3% 35.3% 35.0% 35.3% 36.1%LI, plan type, % enhanced without gap coverage
3.0% 3.0% 2.8% 2.8% 2.8% 3.2% 2.8%
LI, plan type, % enhanced with gap coverage
1.5% 1.6% 1.5% 1.6% 1.6% 1.6% 1.1%
LI, mean monthly premium, all basic plans
$25 $25 $25 $25 $25 $25 $25
LI, mean monthly premium, enhanced without GC
$31 $32 $32 $31 $31 $31 $31
LI, mean monthly premium, enhanced with GC
$68 $68 $69 $70 $70 $68 $68
NOTE: COPD is chronic obstructive pulmonary disease; GC is gap coverage.
SOURCE: RTI International analysis of CMS 100% enrollment data and risk adjustment files
37
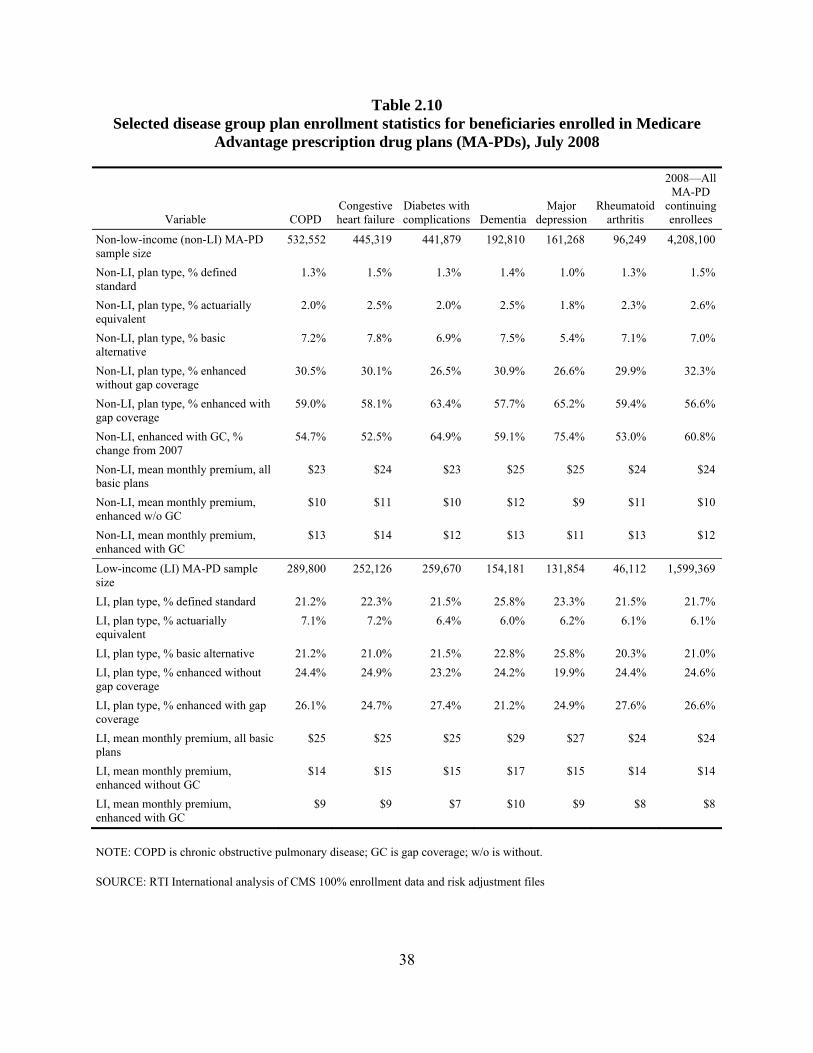
Table 2.10 Selected disease group plan enrollment statistics for beneficiaries enrolled in Medicare
Advantage prescription drug plans (MA-PDs), July 2008
Variable COPD Congestive heart failure
Diabetes with complications Dementia
Major depression
Rheumatoid arthritis
2008—All MA-PD
continuing enrollees
Non-low-income (non-LI) MA-PD sample size
532,552 445,319 441,879 192,810 161,268 96,249 4,208,100
Non-LI, plan type, % defined standard
1.3% 1.5% 1.3% 1.4% 1.0% 1.3% 1.5%
Non-LI, plan type, % actuarially equivalent
2.0% 2.5% 2.0% 2.5% 1.8% 2.3% 2.6%
Non-LI, plan type, % basic alternative
7.2% 7.8% 6.9% 7.5% 5.4% 7.1% 7.0%
Non-LI, plan type, % enhanced without gap coverage
30.5% 30.1% 26.5% 30.9% 26.6% 29.9% 32.3%
Non-LI, plan type, % enhanced with gap coverage
59.0% 58.1% 63.4% 57.7% 65.2% 59.4% 56.6%
Non-LI, enhanced with GC, % change from 2007
54.7% 52.5% 64.9% 59.1% 75.4% 53.0% 60.8%
Non-LI, mean monthly premium, all basic plans
$23 $24 $23 $25 $25 $24 $24
Non-LI, mean monthly premium, enhanced w/o GC
$10 $11 $10 $12 $9 $11 $10
Non-LI, mean monthly premium, enhanced with GC
$13 $14 $12 $13 $11 $13 $12
Low-income (LI) MA-PD sample size
289,800 252,126 259,670 154,181 131,854 46,112 1,599,369
LI, plan type, % defined standard 21.2% 22.3% 21.5% 25.8% 23.3% 21.5% 21.7% LI, plan type, % actuarially equivalent
7.1% 7.2% 6.4% 6.0% 6.2% 6.1% 6.1%
LI, plan type, % basic alternative 21.2% 21.0% 21.5% 22.8% 25.8% 20.3% 21.0% LI, plan type, % enhanced without gap coverage
24.4% 24.9% 23.2% 24.2% 19.9% 24.4% 24.6%
LI, plan type, % enhanced with gap coverage
26.1% 24.7% 27.4% 21.2% 24.9% 27.6% 26.6%
LI, mean monthly premium, all basic plans
$25 $25 $25 $29 $27 $24 $24
LI, mean monthly premium, enhanced without GC
$14 $15 $15 $17 $15 $14 $14
LI, mean monthly premium, enhanced with GC
$9 $9 $7 $10 $9 $8 $8
NOTE: COPD is chronic obstructive pulmonary disease; GC is gap coverage; w/o is without.
SOURCE: RTI International analysis of CMS 100% enrollment data and risk adjustment files
38
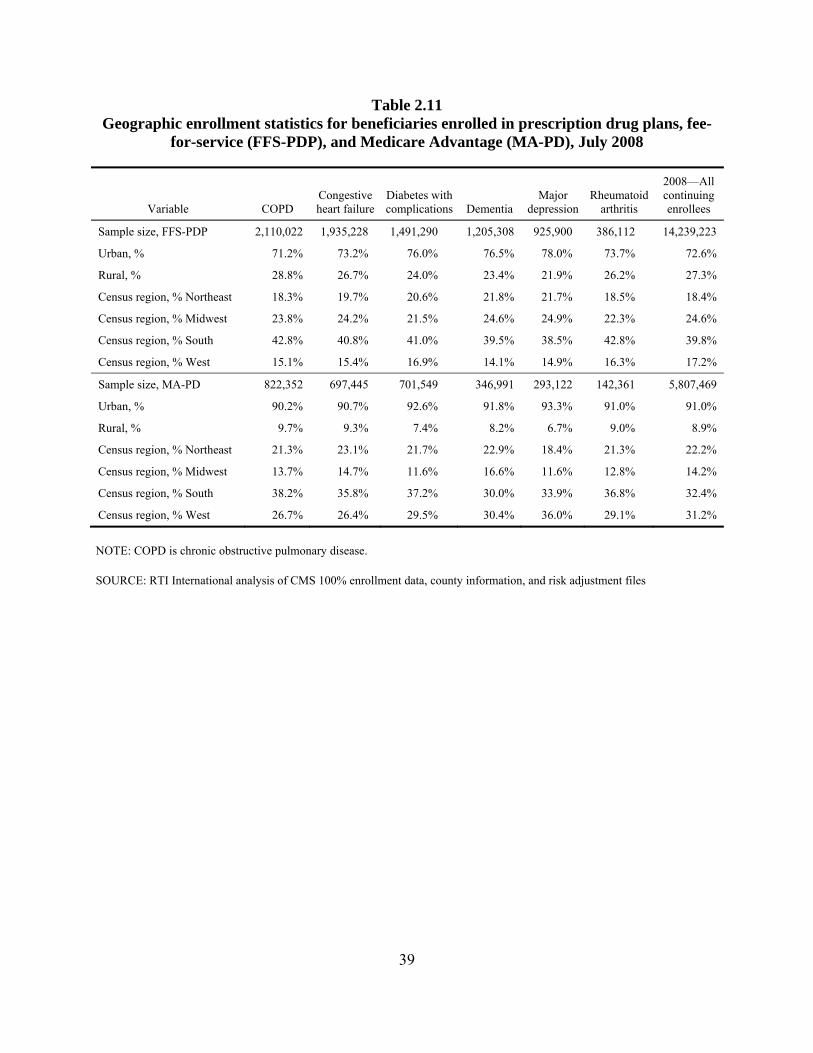
Table 2.11 Geographic enrollment statistics for beneficiaries enrolled in prescription drug plans, fee-
for-service (FFS-PDP), and Medicare Advantage (MA-PD), July 2008
Variable COPD Congestive heart failure
Diabetes with complications Dementia
Major depression
Rheumatoid arthritis
2008—All continuing enrollees
Sample size, FFS-PDP 2,110,022 1,935,228 1,491,290 1,205,308 925,900 386,112 14,239,223
Urban, % 71.2% 73.2% 76.0% 76.5% 78.0% 73.7% 72.6%
Rural, % 28.8% 26.7% 24.0% 23.4% 21.9% 26.2% 27.3%
Census region, % Northeast 18.3% 19.7% 20.6% 21.8% 21.7% 18.5% 18.4%
Census region, % Midwest 23.8% 24.2% 21.5% 24.6% 24.9% 22.3% 24.6%
Census region, % South 42.8% 40.8% 41.0% 39.5% 38.5% 42.8% 39.8%
Census region, % West 15.1% 15.4% 16.9% 14.1% 14.9% 16.3% 17.2%
Sample size, MA-PD 822,352 697,445 701,549 346,991 293,122 142,361 5,807,469
Urban, % 90.2% 90.7% 92.6% 91.8% 93.3% 91.0% 91.0%
Rural, % 9.7% 9.3% 7.4% 8.2% 6.7% 9.0% 8.9%
Census region, % Northeast 21.3% 23.1% 21.7% 22.9% 18.4% 21.3% 22.2%
Census region, % Midwest 13.7% 14.7% 11.6% 16.6% 11.6% 12.8% 14.2%
Census region, % South 38.2% 35.8% 37.2% 30.0% 33.9% 36.8% 32.4%
Census region, % West 26.7% 26.4% 29.5% 30.4% 36.0% 29.1% 31.2%
NOTE: COPD is chronic obstructive pulmonary disease.
SOURCE: RTI International analysis of CMS 100% enrollment data, county information, and risk adjustment files
39

Table 2.12 Enrollment patterns and characteristics of plan type “Stayers” and “Switchers”: Full 2007–2008 PDP and MA-PD continuing
enrollee Part D population
40
Variable
2008 Combined PDP and MA-PD sample
2008 Stayer
non-low-income
2007 PDP 2008 PDP
2008 Switcher non-low- income
2007 PDP 2008 MA-PD
2008 Stayer
non-low-income
2007 MA-PD 2008 MA-PD
2008 Switcher non-low-income
2007 MA-PD 2008 PDP
2008 Stayer low-
income 2007 PDP 2008 PDP
2008 Switcher
low- income
2007 PDP 2008 MA-PD
2008 Stayer low-
income 2007 MA-PD 2008 MA-PD
2008 Switcher
low- income
2007 MA-PD 2008 PDP
Part D continuing enrollees with complete 2007 and 2008 data, N
17,820,280 6,376,508 189,743 3,451,087 51,447 6,201,217 264,067 1,183,294 102,917
Percent who switch plan type 3.4% — — — — — — — — Row percents by stayer-switcher pair — 97.1% 2.9% 98.5% 1.5% 95.9% 4.1% 92.0% 8.0% 2008 mean Part D risk scores 1.12 1.07 1.05 1.02 1.15 1.21 1.24 1.19 1.31 2008 mean Part A&B risk scores 1.27 1.11 1.02 1.10 1.41 1.47 1.45 1.49 1.85 Mean 2007 Part D expenditures $2,618 $2,039 $1,812 $1,420 $2,135 $3,835 $3,226 $2,798 $3,344 Median 2007 Part D expenditures $1,610 $1,525 $1,300 $945 $1,563 $2,407 $2,009 $1,708 $2,319 Mean 2008 Part D expenditures $2,834 $2,101 $1,841 $1,522 $2,300 $4,236 $3,574 $3,184 $3,983 Median 2008 Part D expenditures $1,687 $1,531 $1,280 $990 $1,758 $2,628 $2,172 $1,909 $2,815 Age, % 0–64 19.8% 6.5% 10.8% 6.4% 7.6% 39.8% 33.3% 24.8% 24.6% Age, % 65–74 35.3% 41.8% 50.1% 42.3% 42.8% 24.9% 34.3% 32.4% 30.3% Age, % 75–84 31.7% 36.7% 31.2% 39.1% 35.6% 23.1% 23.4% 30.4% 30.2% Age, % 85+ 13.2% 15.0% 7.9% 12.2% 13.9% 12.3% 9.0% 12.4% 14.8% Sex, % female 61.7% 62.4% 58.8% 57.3% 60.2% 62.5% 63.3% 66.3% 66.3% Sex, % male 38.3% 37.6% 41.2% 42.7% 39.8% 37.5% 36.7% 33.7% 33.7% Race, % White 75.3% 92.0% 82.5% 79.7% 81.7% 61.5% 44.1% 53.1% 45.6% Race, % Black 11.6% 4.0% 10.4% 7.6% 11.0% 18.5% 28.9% 22.0% 28.6% Race, % Asian 3.1% 1.0% 1.2% 2.6% 1.5% 5.5% 3.4% 4.2% 4.5% Race, % Hispanic 8.8% 2.3% 5.1% 9.1% 5.0% 12.5% 22.5% 19.5% 20.1% Race, % Native American 0.5% 0.2% 0.2% 0.2% 0.2% 0.9% 0.4% 0.3% 0.5% Race, % other 0.7% 0.4% 0.5% 0.8% 0.5% 0.9% 0.6% 0.8% 0.7% Race, % unknown 0.1% 0.1% 0.0% 0.1% 0.1% 0.2% 0.1% 0.1% 0.1%
NOTES: 1. PDP or MA-PD enrollment based on July 1, 2007, and July 1, 2008, status. 2008 risk scores are based on 2007 diagnoses. 2. In this analysis, a “stayer” is defined as someone who in 2007 and 2008 stays in the same type of Part D prescription drug plan (PDP or MA-PD). A “switcher” is defined as
someone who switches drug plans in 2008 (from PDP to MA-PD or MA-PD to PDP). 3. MA-PD is Medicare Advantage prescription drug plan; PDP is prescription drug plan.
SOURCE: RTI International analysis of CMS 100 percent enrollment data, risk adjustment files, risk score files, and Prescription Drug Event files
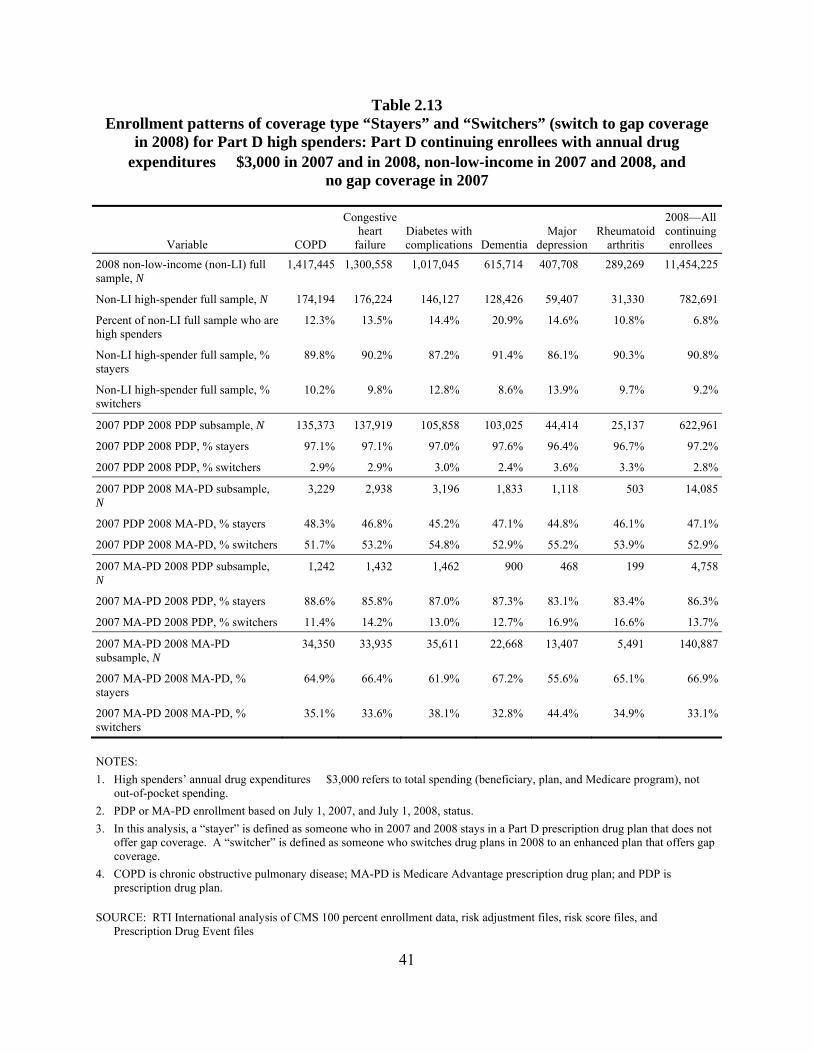
Table 2.13 Enrollment patterns of coverage type “Stayers” and “Switchers” (switch to gap coverage
in 2008) for Part D high spenders: Part D continuing enrollees with annual drug expenditures $3,000 in 2007 and in 2008, non-low-income in 2007 and 2008, and
no gap coverage in 2007
Variable COPD
Congestive heart
failure Diabetes with complications Dementia
Major depression
Rheumatoid arthritis
2008—All continuing enrollees
2008 non-low-income (non-LI) full sample, N
1,417,445 1,300,558 1,017,045 615,714 407,708 289,269 11,454,225
Non-LI high-spender full sample, N 174,194 176,224 146,127 128,426 59,407 31,330 782,691
Percent of non-LI full sample who are high spenders
12.3% 13.5% 14.4% 20.9% 14.6% 10.8% 6.8%
Non-LI high-spender full sample, % stayers
89.8% 90.2% 87.2% 91.4% 86.1% 90.3% 90.8%
Non-LI high-spender full sample, % switchers
10.2% 9.8% 12.8% 8.6% 13.9% 9.7% 9.2%
2007 PDP 2008 PDP subsample, N 135,373 137,919 105,858 103,025 44,414 25,137 622,961
2007 PDP 2008 PDP, % stayers 97.1% 97.1% 97.0% 97.6% 96.4% 96.7% 97.2%
2007 PDP 2008 PDP, % switchers 2.9% 2.9% 3.0% 2.4% 3.6% 3.3% 2.8%
2007 PDP 2008 MA-PD subsample, N
3,229 2,938 3,196 1,833 1,118 503 14,085
2007 PDP 2008 MA-PD, % stayers 48.3% 46.8% 45.2% 47.1% 44.8% 46.1% 47.1%
2007 PDP 2008 MA-PD, % switchers 51.7% 53.2% 54.8% 52.9% 55.2% 53.9% 52.9%
2007 MA-PD 2008 PDP subsample, N
1,242 1,432 1,462 900 468 199 4,758
2007 MA-PD 2008 PDP, % stayers 88.6% 85.8% 87.0% 87.3% 83.1% 83.4% 86.3%
2007 MA-PD 2008 PDP, % switchers 11.4% 14.2% 13.0% 12.7% 16.9% 16.6% 13.7%
2007 MA-PD 2008 MA-PD subsample, N
34,350 33,935 35,611 22,668 13,407 5,491 140,887
2007 MA-PD 2008 MA-PD, % stayers
64.9% 66.4% 61.9% 67.2% 55.6% 65.1% 66.9%
2007 MA-PD 2008 MA-PD, % switchers
35.1% 33.6% 38.1% 32.8% 44.4% 34.9% 33.1%
NOTES: 1. High spenders’ annual drug expenditures $3,000 refers to total spending (beneficiary, plan, and Medicare program), not
out-of-pocket spending. 2. PDP or MA-PD enrollment based on July 1, 2007, and July 1, 2008, status. 3. In this analysis, a “stayer” is defined as someone who in 2007 and 2008 stays in a Part D prescription drug plan that does not
offer gap coverage. A “switcher” is defined as someone who switches drug plans in 2008 to an enhanced plan that offers gap coverage.
4. COPD is chronic obstructive pulmonary disease; MA-PD is Medicare Advantage prescription drug plan; and PDP is prescription drug plan.
SOURCE: RTI International analysis of CMS 100 percent enrollment data, risk adjustment files, risk score files, and Prescription Drug Event files
41

This page intentionally left blank.
SECTION 3 ADHERENCE MEASURES
3.1 Introduction
Beneficiaries with chronic diseases, such as diabetes and congestive heart failure (CHF), often need to take drugs daily. For these beneficiaries, adherence to their medication regimen is necessary for controlling the condition and avoiding a complication or adverse outcome, such as a hospitalization. However, individuals often fail to adhere to their medication regimens for a number of reasons.
The most common reason given by survey respondents for failing to fill a prescription was cost; the second most common reason given was that they did not believe that the medicine was necessary (Kennedy et al., 2008; Safran et al., 2005). Consistent with the survey findings that cost was the main reason for nonadherence, nonadherence rates are higher among vulnerable groups such as those with lower incomes and the uninsured (Kennedy et al., 2008; Safran et al., 2005). Similarly, harder economic times increase the rate of nonadherence; the rate at which patients abandoned prescriptions at the pharmacy increased consistently from 2006 to 2009 with the worsening economic conditions (Wolters Kluwer, 2009). Overall, the estimates of nonadherence in the recent literature range from very low numbers such as 4.4 percent (Kennedy et al., 2008) to high numbers such as 22 percent (Fischer et al., 2010).9
The Medicare Part D program, which offers Medicare beneficiaries access to prescription drug coverage, was implemented in 2006. One goal of the Part D program was to reduce the likelihood that beneficiaries with chronic conditions would not adhere to their drug regime because they could not afford the drugs. To reach that goal, Medicare Part D covers a share of the cost of the prescription drugs for beneficiaries. In 2008, the defined standard benefit included an initial $275 deductible and a 25 percent copayment for drug spending between $275 and $2,510, followed by a coverage gap or “donut hole” in which the beneficiary paid all drug costs until total drug spending reached $5,726.25 ($4,050 in beneficiary out of pocket costs), at which point the beneficiary exited the gap and entered the catastrophic coverage. In the catastrophic phase, the beneficiary then paid a copayment of 5 percent or $2.25/$5.60 (generic/brand), whichever was higher.
Several studies have shown that adherence rates fell for beneficiaries in the coverage gap (Sun et al., 2009; Zhang et al., 2009). As a result, beneficiaries with caps on drug coverage were not only more likely to reduce their adherence rates for chronic medications, but more likely to have poorer control of blood pressure, lipid, and glucose levels (Hsu et al., 2006). However, Gu et al. (2011) found that coverage in the gap offered by enhanced plans could increase adherence rates, although the impact will vary by plan because what drugs are covered by the plan in the gap, whether the plans covers brand or only generic drugs, and what amounts are required for the copayments or coinsurance for the drugs are at the discretion of the plan.
9 The main reason for this disagreement is most likely differences in data sources, such as surveys compared with
insurance claim data and in-person compared with telephone surveys (Kirking et al., 2006).
43
In this section, we study the effect of brand-name status and plan coverage in the gap of Medicare Part D on drug adherence for beneficiaries with chronic conditions. The chronic conditions are chronic obstructive pulmonary disease (COPD), CHF, diabetes with complications, dementia, major depression, and rheumatoid arthritis. The research questions addressed in this section help answer the question of what the impact of the Part D coverage gap is on patients’ adherence to their medication therapy. The specific research questions are as follows:
• Overall, what were the drug adherence rates for Medicare beneficiaries with Part D coverage?
• What was the impact of plan coverage in the gap on drug adherence rates?
• To what extent are adherence rates affected by whether the drug is a brand-name or generic drug?
Underlying the questions about adherence to drug regimens is the assumption that beneficiaries with chronic conditions need to adhere to their drug regimens to control the condition and avoid complications and hospitalizations. The first question looks at whether beneficiaries with chronic conditions are adhering to their drug regimens. However, it does not answer whether the adherence rate is higher than in the absence of Part D. The second question can be used to determine whether cost-sharing has an impact on drug adherence rates, while the third question can be used as a proxy for whether the cost of the drug has an impact on adherence rates. This analysis is descriptive and shows the current levels of adherence. Finding the means of increasing adherence appropriate to different subpopulations would be a relevant study.
As a result of this study, we found the following:
• Beneficiaries were more likely to take a generic drug within a therapeutic drug class when there was an accepted generic equivalent. However, for many of the therapeutic drug classes used to treat the chronic conditions, there was either no generic alternative or the recommended therapy was a brand-name drug.
• Beneficiaries receiving the low income subsidy (LIS) often had lower mean adherence rates than non-LIS beneficiaries for generic drugs within a therapeutic drug class, but higher mean adherence rates for brand-name drugs within a drug class.
• Among beneficiaries who entered but did not exit the gap, adherence rates for LIS beneficiaries taking brand-name drugs within a therapeutic drug class fell less than for non-LIS beneficiaries in the coverage gap.
• Adherence rates for non-LIS beneficiaries who entered but did not exit the coverage gap fell similar amounts for generic drugs within a drug class, independent of whether the beneficiary’s drug plan offered coverage in the gap.
44
• Adherence rates for beneficiaries who entered and exited the coverage gap fell similar amounts for LIS beneficiaries and non-LIS beneficiaries either with or without coverage.
3.2 Data and Methods
The two main sources of data for the adherence measures are the Common Medicare Environment (CME) Part D enrollment files for 2007 and 200810 and the 100% Prescription Drug Event (PDE) transaction-level claims. These two files were supplemented with information from the National Medicare Utilization Database (NMUD), long-term institutionalized (LTI) files, and Medicare Part A claims. Person-level data from the CME, denominator, and LTI files were used to construct eligibility variables. Person-level expenditure and contract or plan data from the PDE TAP files were used to construct total spending and plan liability variables. Diagnoses from the NMUD extract were used to construct person-level medical condition variables for fee-for-service (FFS) enrollees.
Our sample consisted of beneficiaries with one or more of six chronic diseases: COPD, CHF, diabetes with complications, dementia, major depression, and rheumatoid arthritis. For this analysis, we used the same methodology to define our chronic conditions as in Section 2. To identify Medicare beneficiaries with these chronic conditions, we used the CMS risk adjustment files containing CMS hierarchical condition categories (HCCs) and prescription drug hierarchical condition categories (RxHCCs), disease groupings used to predict medical costs and drug costs. Our assumption was that beneficiaries chose their 2008 drug plan on the basis of information they already knew in 2007 about their personal disease history. Therefore we used the 2008 risk adjustment files, which contain HCC and RxHCC flags based on 2007 diagnosis data. We excluded new enrollees (as of 2008) from our analysis because they lacked the required 2007 diagnosis profile. Table 2.1 shows the criteria used to define each chronic condition.
We limited our analysis to beneficiaries with continuous Medicare Parts A and B coverage in 2007 and at least 1 month of Part D coverage in 2008. We then excluded beneficiaries who had either a skilled nursing facility or a long-term institutionalized (LTI) stay as well as beneficiaries who were deemed or received an LIS for only part of 2008. Finally, we required that beneficiaries have taken at least one drug within a drug class used to treat their chronic condition in the last quarter of 2007. We added this last requirement because we wanted to avoid the situation where a beneficiary began taking a drug in 2008 for several reasons. First, the medication possession ratio would be artificially low because the beneficiary would not have any days supplied for the earlier part of the year. Second, the beneficiary may only take the drug for a short time if it is determined that it is not effective for that individual. Third, the beneficiary may try many brand-name or generic versions of drugs within the class before settling on one particular drug. Table 3.1 shows final number of beneficiaries by chronic condition and LIS status for 2008. Beneficiaries were considered non-LIS if they did not receive an LIS in any month in 2008.
10 Data Appendix A3.1 shows the results using 2006 and 2007 data.
45
For each of the six chronic conditions, we evaluated beneficiary adherence in a selected set of therapeutic classes. We had three goals in selecting the therapeutic classes. First, we wanted the therapeutic classes to include drugs that an individual would take regularly as maintenance drugs for the condition itself, rather than for acute flare-ups or for side effects of the condition. Second, we wanted each therapeutic class to be sufficiently narrow so that an individual would be unlikely to take more than one drug within the class. Third, we wanted each therapeutic class to be broad enough that it would include the possible substitute drugs that an individual could switch between within a class.
To meet these goals, in consultation with a clinician, we selected a set of American Hospital Formulary Service (AHFS) eight-digit drug classes to track each chronic condition. To do this, we first constructed an exhaustive list of the drugs used to treat each of these chronic conditions. The list of drugs was derived from three primary sources: the Merck Manual;11 reputable online sources, such as the Mayo Clinic Web site; and a physician consultant, who helped put our findings in the context of current clinical practice. We then used AHFS Drug Information 2010 (AHFS, 2010) to categorize these drugs into drug classes, which resulted in the final list of drug classes.
We then identified each drug within a therapeutic drug class as a brand-name or generic drug on the basis of the NDC in the PDE claim. For each beneficiary, we then determined whether in 2008, the beneficiary purchased only brand-name drugs within the therapeutic drug class, only generic drugs within the therapeutic class, or both brand-name and generic drugs within the same therapeutic class. We then calculated our adherence measures for each beneficiary by therapeutic drug class and brand/generic/both subclass. For the remainder of this section, we use the term “drug subclass” to refer to the combination of therapeutic drug class and brand/generic/both subclass.
The adherence measure used in this section is the medication possession ratio (MPR), which is the number of days that a drug has been supplied, divided by the potential number of eligible days of supply that could have been ordered. To calculate the number of days supplied, we went back to the last quarter of 2007 because a prescription might have been filled shortly before the start of 2008 and as much as a 3-month supply could have been in a beneficiary’s possession at the beginning of the year. Similarly, we corrected for prescriptions filled in the last quarter of 2008 in cases in which the days supplied exceeded the remaining days in the year. We also controlled for the fact that people might take more than one drug within a class, by capping the days supplied of a drug in a month at the number of days in the month. To calculate the eligible days, the denominator in our ratio, we calculated the total days enrolled in Part D in 2008, and then subtracted for the days a beneficiary had a Part A stay.12
To answer our first research question, about the drug adherence rates for Medicare beneficiaries with Part D coverage, we analyzed annual drug adherence rates for our sample FFS beneficiaries with chronic conditions. To answer our second research question, about the impact
11 Accessed through http://www.merck.com/mmpe/index.html
12 In a Part A stay, the hospital or institution is required to provide the drugs.
46
of the plan coverage in the gap on drug adherence, we analyzed drug adherence rates separately for beneficiaries whose plans offered some coverage in the gap and beneficiaries with no coverage in the gap at three different times: before they reached the gap, while they were in the gap, and after they exited the gap and received catastrophic coverage. Finally, we answered our third research question, about the impact of brand-name drug status, in two ways. First, we compared the overall drug adherence rates for brand-name and generic drugs. We then analyzed the MPRs separately for brand-name and generic drugs in the coverage gap to see whether the impact of the coverage gap on adherence rates differed for brand-name and generic drugs.
3.3 Medication Possession Ratios
We first analyzed the MPRs for FFS beneficiaries with one of the six chronic conditions. We consider whether receiving an LIS affects adherence and whether adherence rates vary for brand-name and generic drugs.
The impact of Part D may differ for LIS and non-LIS beneficiaries. One reason is that lower-income beneficiaries are often less likely to adhere to drug regimens. A second reason is that LIS beneficiaries often have lower copayments in the subsidized portion of Part D before the gap threshold and continue coverage in the gap. These lower copayments and continuity of coverage should theoretically lead to higher MPRs for LIS beneficiaries. Consequently, the net effect of Part D on drug adherence by LIS beneficiaries is unclear.
The impact of Part D may differ for brand-name and generic drugs as well as for the interaction of brand-name/generic status with LIS status. Brand-name drugs are typically more expensive than generic drugs. Consequently, for non-LIS beneficiaries in the standard plan, their coinsurance before the coverage gap (25%) will be higher for brand-name drugs than generic, as will their costs in the coverage gap when beneficiaries are responsible for 100 percent of the cost of their drugs. The difference in the relative price of brand-name and generic drugs may affect beneficiaries with Part D in different ways. First, it may change their choice of whether to take a brand-name or generic drug; second, it may influence adherence rates.
Tables 3.2a through 3.2f show the distribution of annual 2008 MPRs by chronic condition, LIS status, and drug subclass for the most commonly taken drug subclasses.13 Tables 3.2a through 3.2f show a wide variation in the mean adherence across the most common drug subclasses for both non-LIS and LIS beneficiaries. The mean MPR for non-LIS beneficiaries ranges from a low of 0.52 for beneficiaries with COPD taking brand-name selective beta-2-adrenergic agonists to 0.82 for beneficiaries with CHF taking generic beta adrenergic blocking agents. The mean MPR for LIS beneficiaries ranges from 0.57 for beneficiaries with COPD taking brand-name antimuscarinics/antispasmodics to a high of 0.80 for beneficiaries with CHF taking generic beta adrenergic blocking agents.
The overall distribution of adherence rates for the most commonly taken drug subclasses suggests compliance. The adherence rate for the top quartile (75th percentile) is above 0.75 and often above 0.90 and, with the exception of drug classes used to treat COPD, the medians are all
13 The full tables with all drug subclasses for a chronic condition can be found in Appendix A3.1.
47
above 0.60 and often above 0.80. For the two most commonly taken COPD drug subclasses, brand-name antimuscarinics/antispasmodics and brand-name selective beta-2-adrenergic agents, the median adherence rates are 0.58 and 0.51 for non-LIS and 0.61 and 0.60 for LIS beneficiaries. There are two possible explanations for the lower COPD drug adherence rates. First, some beneficiaries may be taking the drugs only periodically, as with antispasmodics. The second possible explanation is that many of these beneficiaries are taking multiple drugs, so that when a choice needs to be made which drugs not to take for financial reasons, COPD drugs often are not purchased in favor of other drugs.14
Tables 3.2a through 3.2f also show that the choice of brand-name or generic drug varies more by chronic condition than drug class within a chronic condition. Of the four common drug classes used to treat diabetes with complications, only two, biguanides and sulfonylureas, have accepted generic alternatives. A comparison of Appendix A3.1, Tables A3.1a and 3.2a, shows that for both drug classes more than 90 percent of beneficiaries chose to take the generic drug. Similarly, Tables 3.2c and 3.2f show that beneficiaries with CHF and rheumatoid arthritis are more likely to take the generic drug when it is an acceptable option.
However, beneficiaries with COPD and dementia are more likely to take the brand-name drug. Table 3.2b shows that the two most common drugs taken by beneficiaries with COPD are antimuscarinics/antispasmodics and selective beta-2adrenergic agonists. For both of these drug classes, there is a generic option. However, unlike with diabetes, CHF, or rheumatoid arthritis, beneficiaries with COPD overwhelmingly took a brand-name drug. One possible explanation for this is that while there are generic drugs within the class, the drugs used to treat COPD are brand name. This is the case with antimuscarinics/antispasmodics.15
There may be a different reason that beneficiaries with dementia chose the brand-name drug. Table 3.2d shows that more than 99 percent of beneficiaries with dementia chose to take the brand-name parasympathomimetic (cholinergic agents) rather than the generic. This may also explain why Table 3.2e shows that beneficiaries with major depression are prescribed the brand-name antipsychotic rather than the generic alternative.
Overall, the tables also show that adherence rates for brand-name drug subclasses are slightly lower than for generic drug subclasses, although it is hard to draw any conclusions because there is so much variation in adherence rates across therapeutic drug classes. There is only one therapeutic drug class, selective serotonin reuptake inhibitors (SSRIs), in which both generic and brand-name drugs are commonly taken within the class. In this special case, the mean MPR is lower for brand-name drugs for both LIS and non-LIS beneficiaries. The mean MPR for brand-name SSRIs is 0.63 for LIS beneficiaries and 0.59 for non-LIS beneficiaries, which is more than 20 percent lower than for generic SSRIs. For generic SSRIs, LIS beneficiaries had an MPR of 0.72 and non-LIS beneficiaries an MPR of 0.73.
14 RTI phone conversation with pharmacist.
15 E-mail with pharmacist, April 25, 2011.
48
Finally, tables 3.2a through 3.2f show that the mean adherence rate for LIS is typically lower than for non-LIS beneficiaries for the most commonly taken generic drug subclasses, but higher for the most commonly taken brand-name drug subclasses. This pattern may be explained by thinking about the relative prices paid for the drugs by LIS and non-LIS beneficiaries. For brand-name drugs, on average non-LIS beneficiaries may be paying a relatively high price compared to LIS recipients, whereas for generic drugs, there may be relatively little difference between what LIS and non-LIS beneficiaries pay for their drugs.
3.4 Adherence Measures in the Gap
Previous literature (Fung et al., 2010; Hoadley et al., 2008) has found that adherence fell for beneficiaries in the coverage gap, and other research has also shown that that coverage in the gap offered by enhanced plans could increase adherence rates (Gu et al., 2010). In our next analysis, we study the impact of entering the gap on drug adherence. Because LIS beneficiaries continue their coverage in the gap, their MPRs should not be affected. Similarly, non-LIS beneficiaries whose plans offer some coverage in the gap should be less affected than those with no gap coverage. We also expect that the impact on adherence should be higher for brand-name drugs than for generic drugs for two reasons. First, because brand-name drugs are typically more expensive than generic, beneficiary out-of-pocket costs in the gap would be higher for brand-name drugs. This should theoretically lead to a bigger decrease in MPR for brand-name drugs relative to generic drugs. Second, in 2008, very few plans that offered coverage in the gap covered brand-name drugs.
For this analysis, we limited our sample to beneficiaries enrolled in Part D for all of 2008 and then divided non-LIS beneficiaries into two cohorts, those with plan coverage in the gap and those with no plan coverage in the gap. To determine when beneficiaries entered and exited the coverage gap, we used the thresholds for the standard 2008 benefit plan. In 2008, the coverage gap began when the total retail drug costs reached $2,510 and ended when the beneficiary’s out-of-pocket costs reached $4,050 or the cumulative retail drug cost of $5,726.25. We then used total monthly drug costs to divide each beneficiary’s year into up to three parts, corresponding to the months before entering the gap, the months during the gap, and the months after the gap. We then calculated the average monthly MPR separately by beneficiary and drug subclass for each part of the year. We excluded the transition months into and out of the gap from our analysis.
There may be a selection issue with beneficiaries who did not enter the gap if the reason was that they had lower drug adherence rates. Therefore, to better isolate the impact of the gap on drug adherence, we eliminated any beneficiaries who did not enter the coverage gap. We further separated beneficiaries who entered the gap into those who entered but did not exit the gap and those who both entered and exited the gap. We did this to control for any potential selection issues with those exit the gap. For example, beneficiaries more likely to have high enough drug spending to reach the catastrophic phase may either be sicker and therefore more likely to adhere to their medication regimen, or they may reach the catastrophic phase because they have a higher adherence rate than those who did not exit the coverage gap.
Table 3.3 shows the number of beneficiaries in our sample who entered but did not exit the gap in 2008 by both plan coverage in the gap and LIS status.
49
3.4.1 Beneficiaries Who Entered But Did Not Exit the Gap
Tables 3.4a through 3.4f show the average 2008 MPR by chronic condition for beneficiaries who entered but did not exit the coverage gap by plan coverage in the gap and by drug subclass for the most common drug subclasses.16 The MPRs are shown separately for non-LIS beneficiaries in plans with gap coverage, non-LIS beneficiaries in plans without gap coverage, and LIS beneficiaries. The tables show a fairly consistent pattern across all the disease categories, at least for the most commonly taken drugs. However, because there are differences across the disease categories, we discuss each table separately.
Table 3.4a shows the average MPR, by drug subclass, for beneficiaries with diabetes who entered but did not exit the gap. For brand-name-drug subclasses, the MPRs for LIS beneficiaries dropped less than for both non-LIS beneficiaries with gap coverage and those with no gap coverage. For insulins, the MPR for LIS beneficiaries did not fall in the gap, but it fell 0.05 and 0.03 for non-LIS beneficiaries with and without gap coverage, respectively. The difference was even larger for thiazolidinediones. The MPR for LIS beneficiaries fell 0.08, or slightly more than half of the 0.17 fall in MPR in the gap for non-LIS beneficiaries with gap coverage and 0.15 fall for non-LIS beneficiaries with no gap coverage. Generic drugs exhibit a different pattern. For generic drugs, adherence rates in the gap fell the least for LIS beneficiaries, while adherence rates for non-LIS beneficiaries with gap coverage fell marginally less than for those without gap coverage.
Table 3.4b shows the average MPR, by drug subclass, for beneficiaries with COPD who entered but did not exit the gap. For non-LIS beneficiaries with and without gap coverage, the MPR for brand-name antimuscarinics/antispasmodics and selective beta-2-adrenergic agonists fell a similar amount in the gap. However, the MPR for LIS beneficiaries fell less than half that amount.
Table 3.4c shows the average MPR, by drug subclass, for beneficiaries with CHF who entered but did not exit the gap. The fall in MPR for generic drugs in the gap shows no difference between non-LIS beneficiaries with gap coverage, non-LIS beneficiaries without gap coverage, and LIS beneficiaries. Among CHF patients, angiotensin II receptor agonists are the only brand-name drug class taken by a large number of CHF patients. The MPR for angiotensin II receptor agonists fell the most: 0.12 for beneficiaries with gap coverage, 0.09 for beneficiaries with no gap coverage, and only 0.05 for LIS beneficiaries. This is the same pattern seen for commonly used brand-name drugs used to treat beneficiaries with diabetes with complications and COPD.
Table 3.4d shows the average MPR, by drug subclass, for beneficiaries with dementia who entered but did not exit the gap. There are no commonly taken generic dementia drug classes. As with beneficiaries with CHF, COPD, and diabetes with complications, the MPR for LIS beneficiaries fell only about half as much in the gap as that for non-LIS beneficiaries, whether or not they had gap coverage. However, there was no difference in the fall in the MPR in the gap between non-LIS beneficiaries with and without gap coverage.
16 The full tables with all drug subclasses for a chronic condition can be found in Appendix A3.1.
50
Table 3.4e shows the average MPR, by drug subclass, for beneficiaries with major depression who entered but did not exit the gap. Major depression is the only disease group in which there is a drug class, SSRIs, in which both the brand-name and generic drugs are both commonly taken. Table 3.4e shows that, for beneficiaries taking generic SSRIs, non-LIS beneficiaries and LIS beneficiaries do not differ in the change in MPR in the gap. However, the drop in MPR in the gap for brand-name SSRIs is not only higher across all three beneficiary groups, but it also shows a smaller drop in the gap for LIS beneficiaries than for non-LIS beneficiaries. The MPR for LIS beneficiaries taking brand-name SSRIs fell 0.13 in the gap, compared with 0.17 for non-LIS beneficiaries with and without gap coverage. Two other brand-name-drug subclasses are commonly taken for major depression. For both of these drug subclasses, the MPR for LIS beneficiaries fell significantly less than for non-LIS beneficiaries. The MPR for brand-name SSRIs and norepinephrine reuptake inhibitors fell 0.12 in the gap for non-LIS beneficiaries without gap coverage, 0.15 for non-LIS beneficiaries with gap coverage, and only 0.07 for LIS beneficiaries. The difference for brand-name atypical antipsychotics was even greater. The MPR for LIS beneficiaries fell 0.17, which is large in of itself, but considerably less than the 0.27 and 0.25 drop in MPR for non-LIS beneficiaries with and without gap coverage, respectively.
Table 3.4f shows the average MPR, by drug subclass, for beneficiaries with rheumatoid arthritis who entered but did not exit the gap. Two drug subclasses, generic antimalarials and generic antineoplastic agents, show similar falls in MPR in the gap for LIS and non-LIS beneficiaries. However, the fall in MPR in the gap for antimalarials was slightly higher for non-LIS beneficiaries without gap coverage, at 0.10, than for non-LIS beneficiaries with gap coverage, whose MPR fell only 0.07 in the gap.
3.4.2 Beneficiaries Who Entered and Exited the Gap
Beneficiaries who entered and exited the gap may be fundamentally different from beneficiaries who entered but did not exit the gap for two reasons. First, they may be sicker, thereby taking more medications, and therefore more likely to exit the gap. Second, they may be higher adherers, which would result in higher spending on their prescriptions, which is why they exited the gap. We therefore analyze the impact of the gap on their adherence rates separately from beneficiaries who entered but did not exit the gap. Table 3.5 shows the number of beneficiaries in our sample who entered and exited the gap in 2008 by plan coverage in the gap and by LIS status.
Tables 3.6a through 3.6f show the average MPR by chronic condition for beneficiaries who entered and exited the coverage gap by plan coverage in the gap, LIS status, and drug subclass for the most common drug subclasses.17 The number of beneficiaries taking any one drug subclass is much smaller in these tables; therefore, it is harder to draw any conclusions. However, the tables show a fairly consistent pattern across all the disease categories, at least for the most commonly taken drug subclasses. Overall, the tables show very little difference in the average MPR before, during, or after the gap between non-LIS beneficiaries with gap coverage, non-LIS beneficiaries without gap coverage, and LIS beneficiaries.
17 The full tables with all drug subclasses for a chronic condition can be found in Appendix A3.1.
51
Table 3.6a shows the average MPR, by drug subclass, for beneficiaries with diabetes with complications who entered and exited the gap. There is little difference in the change in the MPR in the gap for non-LIS beneficiaries with gap coverage, non-LIS without gap coverage, and LIS beneficiaries for either the common brand-name or generic drug subclasses. However, the change in the MPR in the gap did differ across drug subclasses. The MPR for generic sulfonylureas fell the most in the gap: 0.07 for both non-LIS beneficiaries without gap coverage and LIS beneficiaries and slightly less, 0.06, for non-LIS beneficiaries with gap coverage. The smallest drop was for insulins. The average MPR for insulin did not fall for non-LIS beneficiaries with gap coverage or LIS beneficiaries and fell only 0.01 for non-LIS beneficiaries without gap coverage. As beneficiaries exited the gap, the MPR fell again in the catastrophic phase for almost all drug subclasses except insulin, which showed slight increases of 0.02 and 0.03 in adherence rates for non-LIS beneficiaries with and without gap coverage, respectively.
Table 3.6b shows the average MPR, by drug subclass, for beneficiaries with COPD who entered and exited the gap. There was no difference in the change in MPR in the gap for non-LIS beneficiaries with or without gap coverage and LIS beneficiaries. The fall in MPR in the gap for beneficiaries with COPD fell only negligibly, between 0.02 and 0.03 for brand-name antimsucarinics/antispasmodics and brand-name selective beta-2-adrnergic agonists. As beneficiaries exited the gap, the MPR either remained the same or rose for all beneficiaries except LIS beneficiaries taking brand-name antimuscarinics/antispasmodics; their MPR fell another 0.02.
Table 3.6c shows the average MPR, by drug subclass, for beneficiaries with CHF who entered and exited the gap. Among the most common drug subclasses, there was no difference in the change in MPR in the gap for non-LIS beneficiaries with or without gap coverage and LIS beneficiaries. The MPR for all three beneficiary groups fell 0.03 for generic beta-adrenergic blocking agents and 0.06 for generic angiotensin-converting enzyme inhibitors, and there was only a slight difference, of 0.02, across beneficiary groups in the change in MPR for brand-name angiotensin II receptor agonists and generic loop diuretics. As beneficiaries exited the coverage gap, the MPR fell again for all drug subclasses.
Table 3.6d shows the average MPR, by drug subclass, for beneficiaries with dementia who entered and exited the gap. There was no difference in the change in MPR in the gap for non-LIS beneficiaries with or without gap coverage and LIS beneficiaries. Furthermore, the change was very small, only an average 0.03 for brand-name parasympathomimetic (cholinergic agents) and 0.02 for brand-name central nervous system agents.
Table 3.6e shows the average MPR, by drug subclass, for beneficiaries with major depression who entered and exited the gap. Among the more common drug classes used to treat major depression, there are differences in the change in MPR in the gap between non-LIS beneficiaries with or without gap coverage and LIS beneficiaries. For the brand-name drug classes, the MPR for non-LIS beneficiaries with gap coverage fell more than for non-LIS beneficiaries without gap coverage or for LIS beneficiaries, although the difference was small. However, for the generic drug subclasses, the MPR for non-LIS beneficiaries with gap coverage fell the least, although again the difference was small. As beneficiaries exited the coverage gap, the MPRs declined similar amounts for all three beneficiary groups.
52
Table 3.6f shows the average MPR, by drug subclass, for beneficiaries with rheumatoid arthritis who entered and exited the gap. The MPR for all three groups fell similar amounts in the gap for the two most common drug subclasses used to treat rheumatoid arthritis. The MPR for generic antineoplastic agents fell 0.07 in the gap for all three beneficiary groups, whereas the MPR for brand-name disease modifying antirheumatic agents fell less than 0.02 for all three beneficiary groups. However, there was a difference in the change in MPR in the catastrophic phase across beneficiary groups. The MPR for non-LIS beneficiaries with gap coverage increased 0.04 in the catastrophic phase for brand-name disease modifying antirheumatic agents, but it remained the same for LIS beneficiaries. Similarly, the MPR for non-LIS beneficiaries without gap coverage remained the same in the catastrophic phase for generic antineoplastic agents, but it increased 0.03 for LIS beneficiaries.
3.5 Discussion of Drug Adherence Measures
In the analysis of drug adherence measures, we attempted to look at drug adherence for Medicare beneficiaries with one or more of the six chronic conditions. We began our analysis by looking at the overall drug adherence rates for Medicare beneficiaries with Part D coverage. We looked at adherence rates separately for non-LIS and LIS beneficiaries by therapeutic drug class and by whether the drug was a brand-name or generic drug within the class. We then analyzed adherence rates before, during, and after the coverage gap separately for beneficiaries with and without plan coverage in the gap. In this analysis, we wanted to answer the question of whether adherence rates are affected by whether the beneficiary has plan coverage in the gap.
Collectively, our set of descriptive tables suggests that there is a large variation in drug adherence rates among Medicare Part D beneficiaries both within a drug subclass and chronic condition and between drug subclasses and chronic conditions. Our analyses found that beneficiaries were more likely to take a generic drug within a therapeutic drug class when there was an accepted generic alternative, but that generic drugs were not always possible. For some drug classes, either no generic was available or the recommended therapy for the chronic condition was a brand-name drug. We found this to be the case even with several very expensive drug classes, such as the atypical antipsychotics used to treat major depression and the disease modifying antirheumatic agents used to treat rheumatoid arthritis.
We also found that drug adherence rates did differ between LIS and non-LIS beneficiaries. We found that adherence rates for generic drug subclasses were marginally lower for LIS beneficiaries than non-LIS beneficiaries. This finding is consistent with our hypothesis that low-income beneficiaries often have lower drug adherence rates than wealthier beneficiaries. However, we also found that, for the most commonly taken brand-name drug subclasses, LIS beneficiaries had higher adherence rates than non-LIS beneficiaries. One possible explanation for this dichotomy is the relative prices of brand-name and generic drugs. Generic drugs are relatively inexpensive, so that there is little difference in the amount paid by LIS and non-LIS beneficiaries. However, brand-name drugs are relatively more expensive (and some very expensive), so that the higher copayments and lack of coverage in the gap pushed adherence rates down disproportionately for non-LIS beneficiaries than for LIS beneficiaries.
Consistent with this overall finding were our findings in our analysis of adherence rates for beneficiaries who entered but did not exit the coverage gap. First, we found that adherence
53
rates for non-LIS beneficiaries with gap coverage and non-LIS beneficiaries without gap coverage taking generic drugs fell similar amounts in the gap. One possible explanation is that because generic drugs are fairly inexpensive, offering coverage in the gap is more symbolic and has no real impact on beneficiary adherence rates. Second, we found that adherence rates for brand-name drugs fell less in the coverage gap for LIS beneficiaries than for non-LIS beneficiaries. There are two possible explanations. First, because most non-LIS beneficiaries had little or no coverage in the gap, some non-LIS beneficiaries may have chosen to forgo their medication or not take it as often. Other non-LIS beneficiaries may have chosen to purchase their medication outside of the Part D plan—for example, through a large discount pharmacy—if that option were cheaper. Because these purchases would not be in the PDE data, it would appear that the beneficiary had stopped adhering to the drug regimen. Both these explanations would lead to lower adherence rates for non-LIS beneficiaries. We would also expect both of these changes in beneficiary behavior to increase in likelihood with the cost of the drug, which would explain why non-LIS adherence rates fell significantly more than LIS adherence rates for the brand-name drugs, which are often expensive.
Finally, we found that adherence rates for beneficiaries who entered and exited the coverage gap fell similar amounts for LIS and non-LIS beneficiaries. The fall in adherence rates was also much lower than for beneficiaries who entered but did not exit the gap. This is consistent with our hypothesis that beneficiaries who enter and exit the gap are fundamentally different from those that enter but do not exit the coverage gap in that they choose to take their medications. It is because these beneficiaries chose to take their medication that their adherence rates did not fall precipitously in the gap and they eventually exited the gap.
These conclusions have two limitations. First, we have data only on prescriptions filled under Part D and not on days of the drug taken. This is a problem for two reasons: the days supplied in the PDE data may not have a one-to-one correspondence with days taken of the drug, and beneficiaries may fill prescriptions outside of Part D at large discount pharmacies if the costs are lower. As discussed earlier, this purchasing pattern may be more likely in the coverage gap when beneficiaries bear significantly higher out-of-pocket costs for drugs, and it could lead to a negative bias in the adherence rates in the gap. The second limitation is that, in our analysis of the coverage gap, we did not have data on what drugs were covered by drug plans in the gap, what the copayments were in the gap, or whether specific gap coverage plans included those drugs in our study.
54
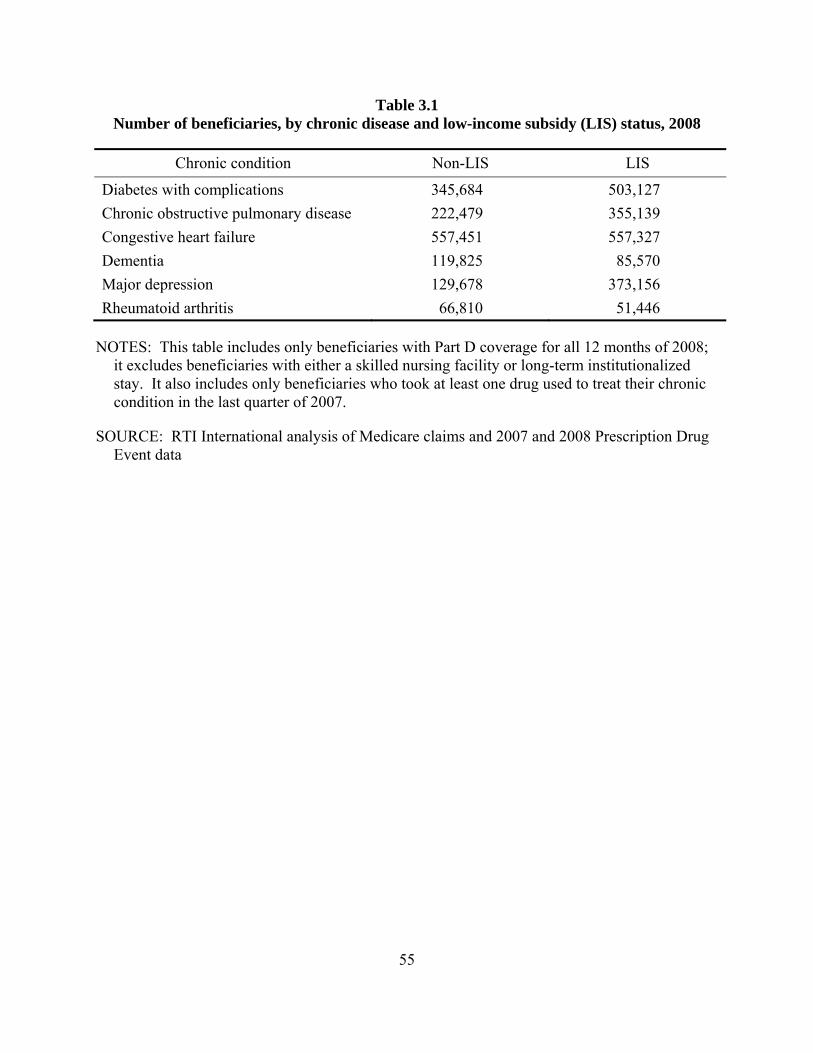
Table 3.1 Number of beneficiaries, by chronic disease and low-income subsidy (LIS) status, 2008
Chronic condition Non-LIS LIS
Diabetes with complications 345,684 503,127 Chronic obstructive pulmonary disease 222,479 355,139 Congestive heart failure 557,451 557,327 Dementia 119,825 85,570 Major depression 129,678 373,156 Rheumatoid arthritis 66,810 51,446
NOTES: This table includes only beneficiaries with Part D coverage for all 12 months of 2008; it excludes beneficiaries with either a skilled nursing facility or long-term institutionalized stay. It also includes only beneficiaries who took at least one drug used to treat their chronic condition in the last quarter of 2007.
SOURCE: RTI International analysis of Medicare claims and 2007 and 2008 Prescription Drug Event data
55
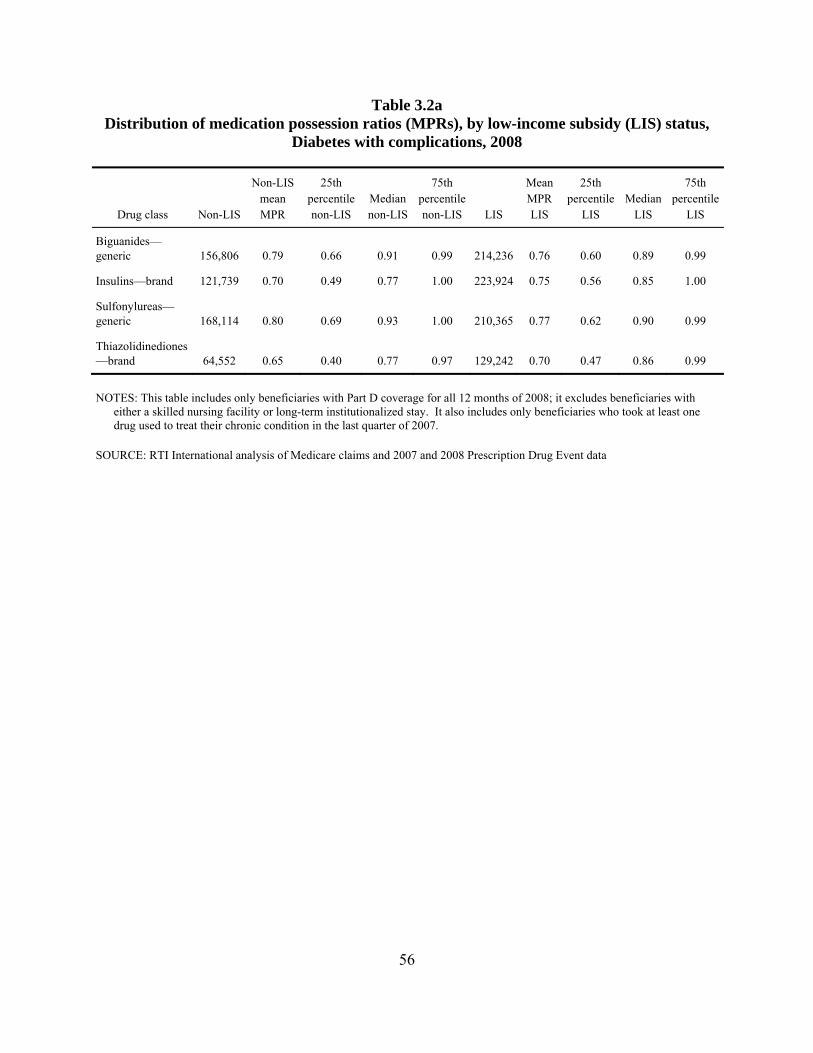
Table 3.2a Distribution of medication possession ratios (MPRs), by low-income subsidy (LIS) status,
Diabetes with complications, 2008
Drug class Non-LIS
Non-LIS mean MPR
25th percentile non-LIS
Median non-LIS
75th percentile non-LIS LIS
Mean MPR LIS
25th percentile
LIS Median
LIS
75th percentile
LIS
Biguanides—generic 156,806 0.79 0.66 0.91 0.99 214,236 0.76 0.60 0.89 0.99
Insulins—brand 121,739 0.70 0.49 0.77 1.00 223,924 0.75 0.56 0.85 1.00
Sulfonylureas—generic 168,114 0.80 0.69 0.93 1.00 210,365 0.77 0.62 0.90 0.99
Thiazolidinediones—brand 64,552 0.65 0.40 0.77 0.97 129,242 0.70 0.47 0.86 0.99
NOTES: This table includes only beneficiaries with Part D coverage for all 12 months of 2008; it excludes beneficiaries with either a skilled nursing facility or long-term institutionalized stay. It also includes only beneficiaries who took at least one drug used to treat their chronic condition in the last quarter of 2007.
SOURCE: RTI International analysis of Medicare claims and 2007 and 2008 Prescription Drug Event data
56
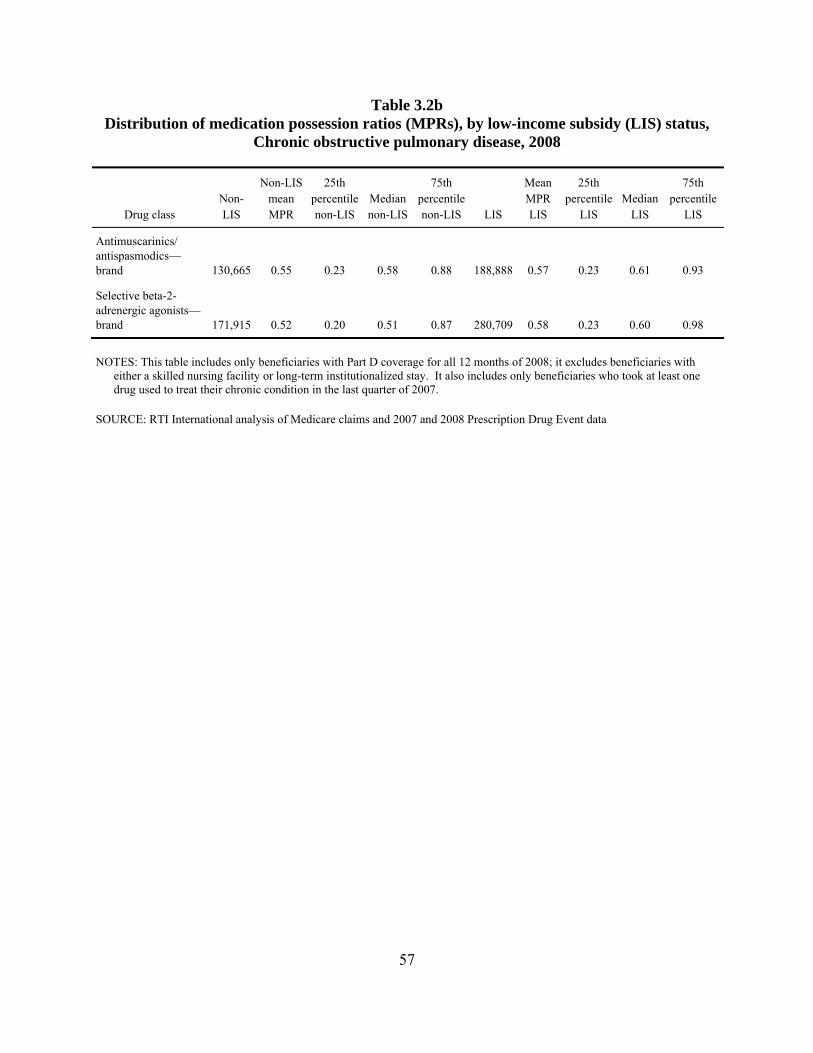
Table 3.2b Distribution of medication possession ratios (MPRs), by low-income subsidy (LIS) status,
Chronic obstructive pulmonary disease, 2008
Drug class Non-LIS
Non-LIS mean MPR
25th percentile non-LIS
Median non-LIS
75th percentile non-LIS LIS
Mean MPR LIS
25th percentile
LIS Median
LIS
75th percentile
LIS
Antimuscarinics/ antispasmodics—brand 130,665 0.55 0.23 0.58 0.88 188,888 0.57 0.23 0.61 0.93
Selective beta-2-adrenergic agonists—brand 171,915 0.52 0.20 0.51 0.87 280,709 0.58 0.23 0.60 0.98
NOTES: This table includes only beneficiaries with Part D coverage for all 12 months of 2008; it excludes beneficiaries with either a skilled nursing facility or long-term institutionalized stay. It also includes only beneficiaries who took at least one drug used to treat their chronic condition in the last quarter of 2007.
SOURCE: RTI International analysis of Medicare claims and 2007 and 2008 Prescription Drug Event data
57
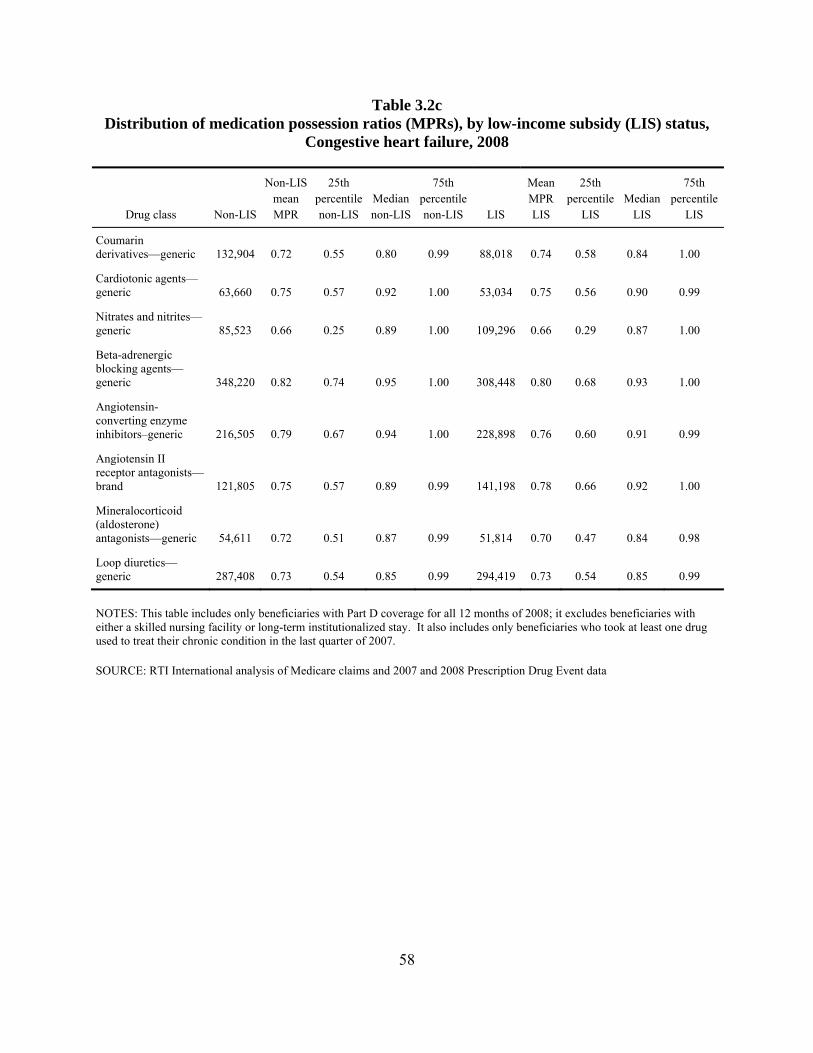
Table 3.2c Distribution of medication possession ratios (MPRs), by low-income subsidy (LIS) status,
Congestive heart failure, 2008
Drug class Non-LIS
Non-LIS mean MPR
25th percentile non-LIS
Median non-LIS
75th percentile non-LIS LIS
Mean MPR LIS
25th percentile
LIS Median
LIS
75th percentile
LIS
Coumarin derivatives—generic 132,904 0.72 0.55 0.80 0.99 88,018 0.74 0.58 0.84 1.00
Cardiotonic agents—generic 63,660 0.75 0.57 0.92 1.00 53,034 0.75 0.56 0.90 0.99
Nitrates and nitrites—generic 85,523 0.66 0.25 0.89 1.00 109,296 0.66 0.29 0.87 1.00
Beta-adrenergic blocking agents—generic 348,220 0.82 0.74 0.95 1.00 308,448 0.80 0.68 0.93 1.00
Angiotensin-converting enzyme inhibitors–generic 216,505 0.79 0.67 0.94 1.00 228,898 0.76 0.60 0.91 0.99
Angiotensin II receptor antagonists—brand 121,805 0.75 0.57 0.89 0.99 141,198 0.78 0.66 0.92 1.00
Mineralocorticoid (aldosterone) antagonists—generic 54,611 0.72 0.51 0.87 0.99 51,814 0.70 0.47 0.84 0.98
Loop diuretics—generic 287,408 0.73 0.54 0.85 0.99 294,419 0.73 0.54 0.85 0.99
NOTES: This table includes only beneficiaries with Part D coverage for all 12 months of 2008; it excludes beneficiaries with either a skilled nursing facility or long-term institutionalized stay. It also includes only beneficiaries who took at least one drug used to treat their chronic condition in the last quarter of 2007.
SOURCE: RTI International analysis of Medicare claims and 2007 and 2008 Prescription Drug Event data
58
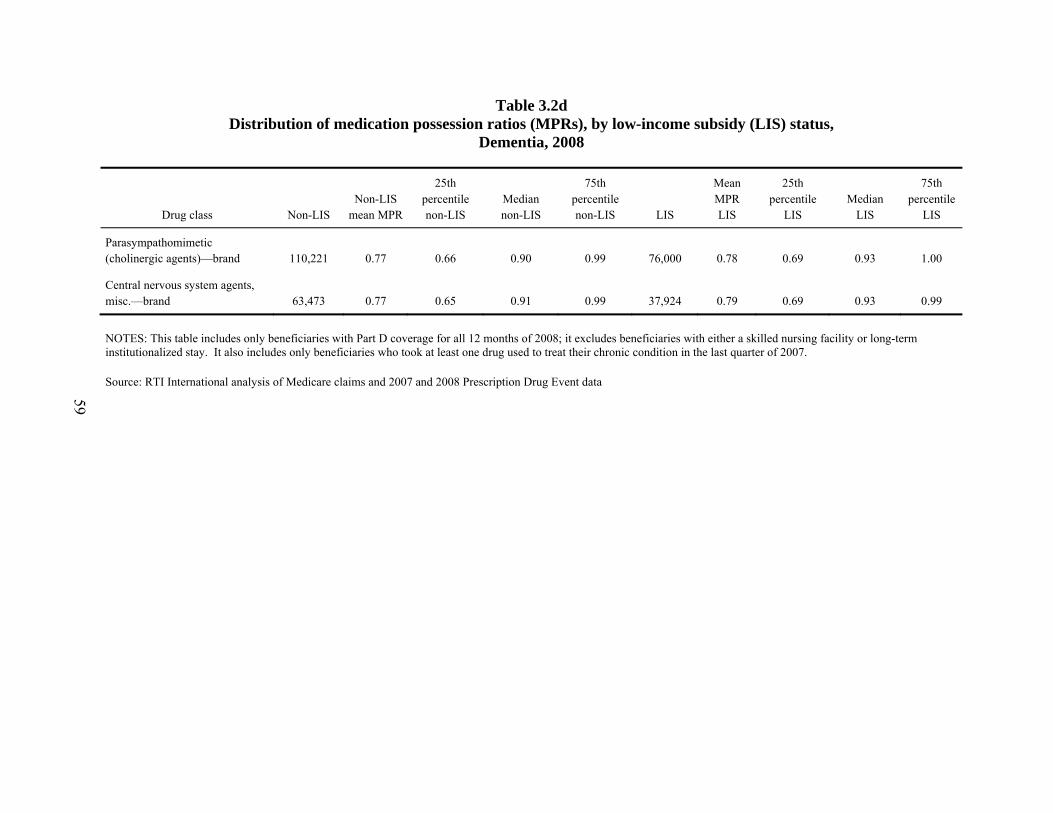
Table 3.2d Distribution of medication possession ratios (MPRs), by low-income subsidy (LIS) status,
Dementia, 2008
Drug class Non-LIS Non-LIS
mean MPR
25th percentile non-LIS
Median non-LIS
75th percentile non-LIS LIS
Mean MPR LIS
25th percentile
LIS Median
LIS
75th percentile
LIS
Parasympathomimetic (cholinergic agents)—brand 110,221 0.77 0.66 0.90 0.99 76,000 0.78 0.69 0.93 1.00
Central nervous system agents, misc.—brand 63,473 0.77 0.65 0.91 0.99 37,924 0.79 0.69 0.93 0.99
NOTES: This table includes only beneficiaries with Part D coverage for all 12 months of 2008; it excludes beneficiaries with either a skilled nursing facility or long-term institutionalized stay. It also includes only beneficiaries who took at least one drug used to treat their chronic condition in the last quarter of 2007.
Source: RTI International analysis of Medicare claims and 2007 and 2008 Prescription Drug Event data
59
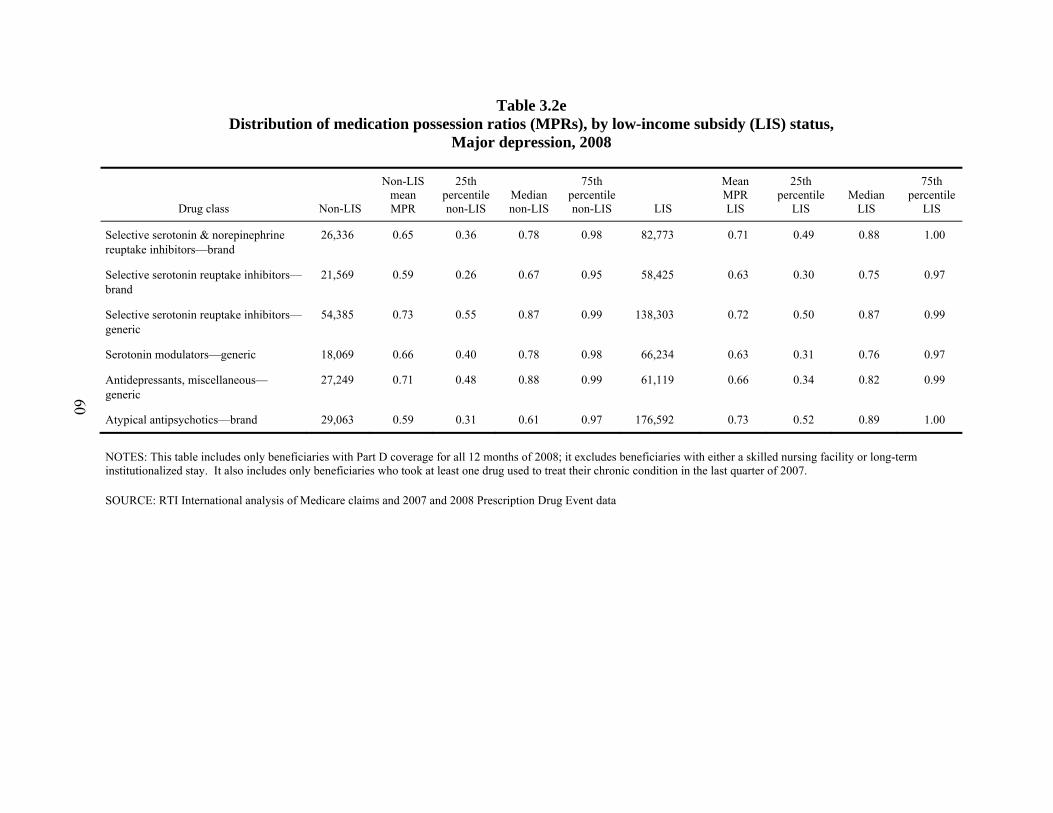
Table 3.2e Distribution of medication possession ratios (MPRs), by low-income subsidy (LIS) status,
Major depression, 2008
Drug class Non-LIS
Non-LIS mean MPR
25th percentile non-LIS
Median non-LIS
75th percentile non-LIS LIS
Mean MPR LIS
25th percentile
LIS Median
LIS
75th percentile
LIS
Selective serotonin & norepinephrine reuptake inhibitors—brand
26,336 0.65 0.36 0.78 0.98 82,773 0.71 0.49 0.88 1.00
Selective serotonin reuptake inhibitors—brand
21,569 0.59 0.26 0.67 0.95 58,425 0.63 0.30 0.75 0.97
Selective serotonin reuptake inhibitors—generic
54,385 0.73 0.55 0.87 0.99 138,303 0.72 0.50 0.87 0.99
Serotonin modulators—generic 18,069 0.66 0.40 0.78 0.98 66,234 0.63 0.31 0.76 0.97
Antidepressants, miscellaneous—generic
27,249 0.71 0.48 0.88 0.99 61,119 0.66 0.34 0.82 0.99
Atypical antipsychotics—brand 29,063 0.59 0.31 0.61 0.97 176,592 0.73 0.52 0.89 1.00
NOTES: This table includes only beneficiaries with Part D coverage for all 12 months of 2008; it excludes beneficiaries with either a skilled nursing facility or long-term institutionalized stay. It also includes only beneficiaries who took at least one drug used to treat their chronic condition in the last quarter of 2007.
SOURCE: RTI International analysis of Medicare claims and 2007 and 2008 Prescription Drug Event data
60
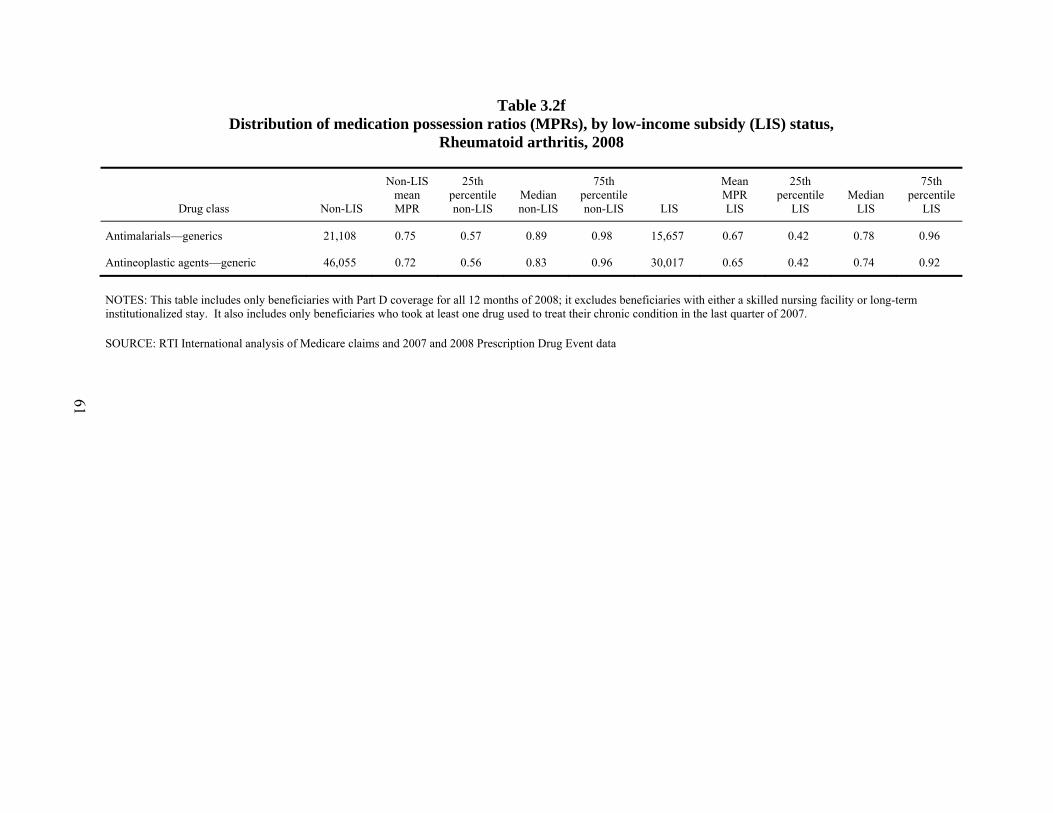
Table 3.2f Distribution of medication possession ratios (MPRs), by low-income subsidy (LIS) status,
Rheumatoid arthritis, 2008
Drug class Non-LIS
Non-LIS mean MPR
25th percentile non-LIS
Median non-LIS
75th percentile non-LIS LIS
Mean MPR LIS
25th percentile
LIS Median
LIS
75th percentile
LIS
Antimalarials—generics 21,108 0.75 0.57 0.89 0.98 15,657 0.67 0.42 0.78 0.96
Antineoplastic agents—generic 46,055 0.72 0.56 0.83 0.96 30,017 0.65 0.42 0.74 0.92
NOTES: This table includes only beneficiaries with Part D coverage for all 12 months of 2008; it excludes beneficiaries with either a skilled nursing facility or long-term institutionalized stay. It also includes only beneficiaries who took at least one drug used to treat their chronic condition in the last quarter of 2007.
SOURCE: RTI International analysis of Medicare claims and 2007 and 2008 Prescription Drug Event data
61
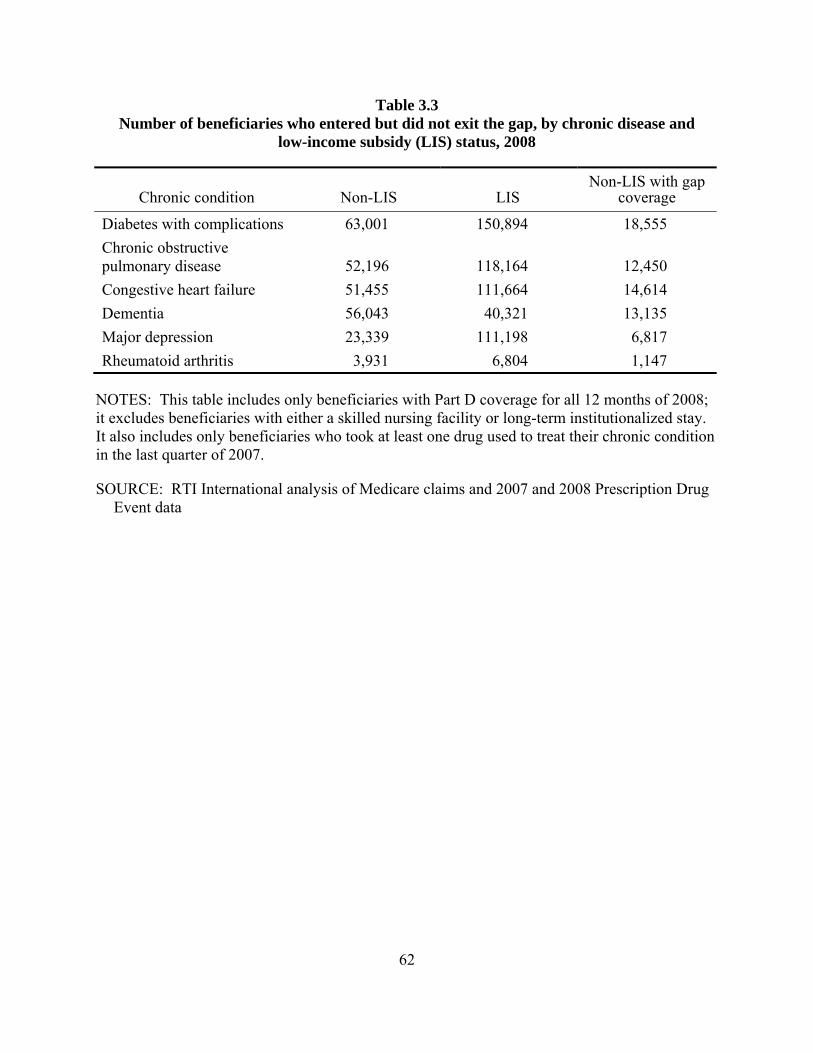
Table 3.3 Number of beneficiaries who entered but did not exit the gap, by chronic disease and
low-income subsidy (LIS) status, 2008
Chronic condition Non-LIS LIS Non-LIS with gap
coverage
Diabetes with complications 63,001 150,894 18,555 Chronic obstructive pulmonary disease 52,196 118,164 12,450 Congestive heart failure 51,455 111,664 14,614 Dementia 56,043 40,321 13,135 Major depression 23,339 111,198 6,817 Rheumatoid arthritis 3,931 6,804 1,147
NOTES: This table includes only beneficiaries with Part D coverage for all 12 months of 2008; it excludes beneficiaries with either a skilled nursing facility or long-term institutionalized stay. It also includes only beneficiaries who took at least one drug used to treat their chronic condition in the last quarter of 2007.
SOURCE: RTI International analysis of Medicare claims and 2007 and 2008 Prescription Drug Event data
62
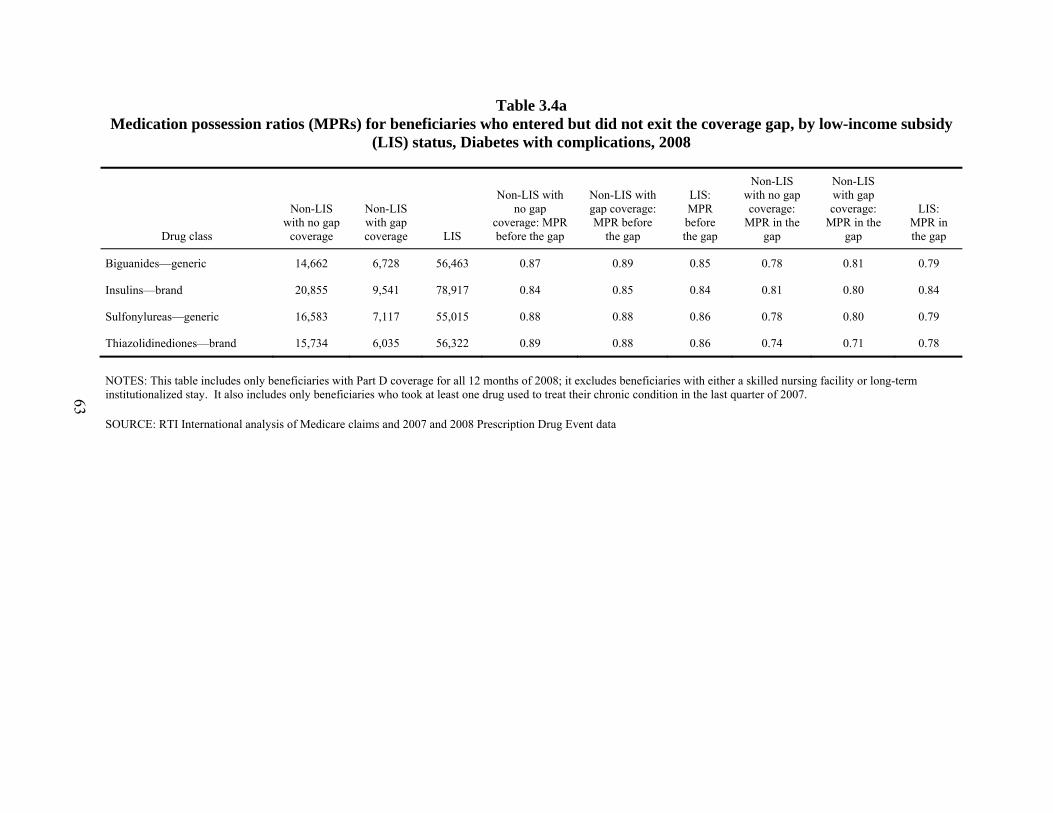
Table 3.4a Medication possession ratios (MPRs) for beneficiaries who entered but did not exit the coverage gap, by low-income subsidy
(LIS) status, Diabetes with complications, 2008
Drug class
Non-LIS with no gap
coverage
Non-LIS with gap coverage LIS
Non-LIS with no gap
coverage: MPR before the gap
Non-LIS with gap coverage: MPR before
the gap
LIS: MPR before the gap
Non-LIS with no gap coverage:
MPR in the gap
Non-LIS with gap coverage:
MPR in the gap
LIS: MPR in the gap
Biguanides—generic 14,662 6,728 56,463 0.87 0.89 0.85 0.78 0.81 0.79
Insulins—brand 20,855 9,541 78,917 0.84 0.85 0.84 0.81 0.80 0.84
Sulfonylureas—generic 16,583 7,117 55,015 0.88 0.88 0.86 0.78 0.80 0.79
Thiazolidinediones—brand 15,734 6,035 56,322 0.89 0.88 0.86 0.74 0.71 0.78
NOTES: This table includes only beneficiaries with Part D coverage for all 12 months of 2008; it excludes beneficiaries with either a skilled nursing facility or long-term institutionalized stay. It also includes only beneficiaries who took at least one drug used to treat their chronic condition in the last quarter of 2007.
SOURCE: RTI International analysis of Medicare claims and 2007 and 2008 Prescription Drug Event data
63
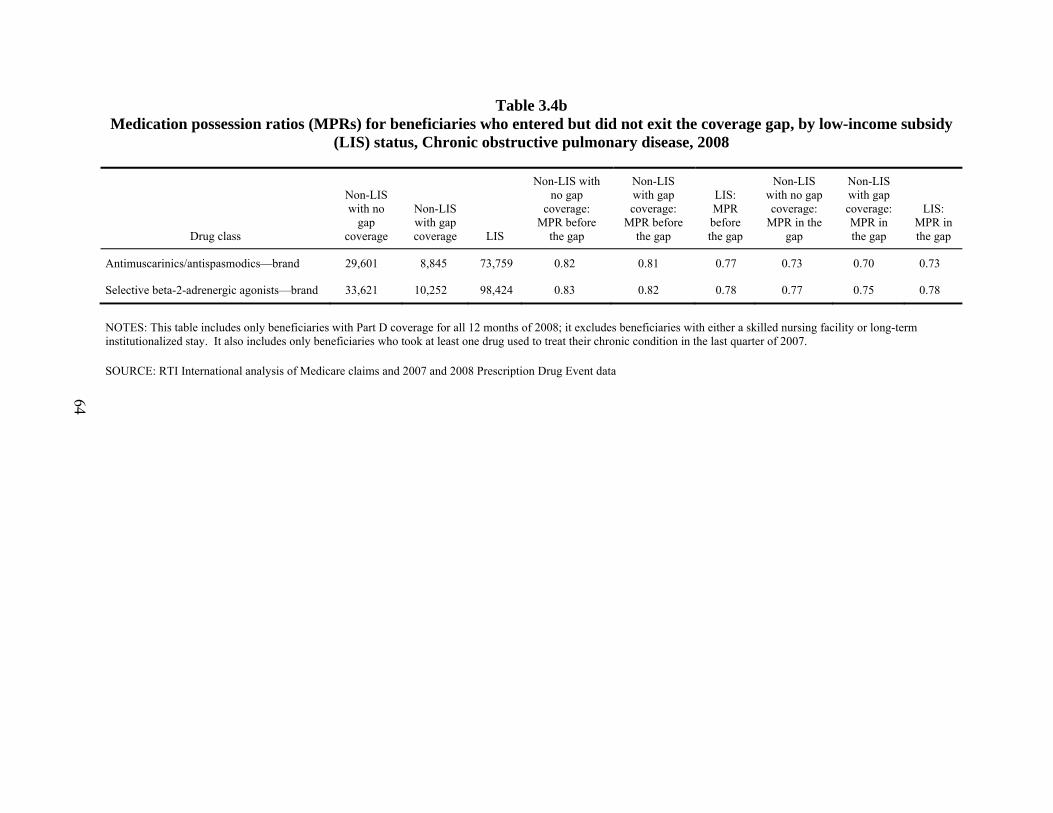
Table 3.4b Medication possession ratios (MPRs) for beneficiaries who entered but did not exit the coverage gap, by low-income subsidy
(LIS) status, Chronic obstructive pulmonary disease, 2008
Drug class
Non-LIS with no
gap coverage
Non-LIS with gap coverage LIS
Non-LIS with no gap
coverage: MPR before
the gap
Non-LIS with gap coverage:
MPR before the gap
LIS: MPR before the gap
Non-LIS with no gap coverage:
MPR in the gap
Non-LIS with gap coverage: MPR in the gap
LIS: MPR in the gap
Antimuscarinics/antispasmodics—brand 29,601 8,845 73,759 0.82 0.81 0.77 0.73 0.70 0.73
Selective beta-2-adrenergic agonists—brand 33,621 10,252 98,424 0.83 0.82 0.78 0.77 0.75 0.78
NOTES: This table includes only beneficiaries with Part D coverage for all 12 months of 2008; it excludes beneficiaries with either a skilled nursing facility or long-term institutionalized stay. It also includes only beneficiaries who took at least one drug used to treat their chronic condition in the last quarter of 2007.
SOURCE: RTI International analysis of Medicare claims and 2007 and 2008 Prescription Drug Event data
64

Table 3.4c Medication possession ratios (MPRs) for beneficiaries who entered but did not exit the coverage gap, by low-income subsidy
(LIS) status, Congestive heart failure, 2008
Drug class
Non-LIS with no gap
coverage
Non-LIS with gap coverage LIS
Non-LIS with no gap coverage:
MPR before the
gap
Non-LIS with gap coverage:
MPR before the
gap
LIS: MPR before the
gap
Non-LIS with no gap coverage:
MPR in the gap
Non-LIS with gap coverage:
MPR in the gap
LIS: MPR in the
gap
Coumarin derivatives—generic 7,186 3,196 15,882 0.81 0.82 0.83 0.74 0.76 0.78
Cardiotonic agents—generic 4,172 1,731 10,365 0.87 0.88 0.87 0.79 0.79 0.79
Nitrates and nitrites—generic 5,453 2,255 23,158 0.85 0.86 0.81 0.79 0.79 0.77
Beta-adrenergic blocking agents—generic
20,091 8,614 58,818 0.91 0.91 0.90 0.85 0.87 0.86
Angiotensin-converting enzyme inhibitors—generic
11,402 5,084 41,638 0.88 0.89 0.87 0.79 0.81 0.79
Angiotensin II receptor antagonists—brand
11,490 4,303 36,711 0.89 0.89 0.89 0.80 0.77 0.84
Loop diuretics—generic 20,416 8,684 64,525 0.83 0.84 0.83 0.78 0.79 0.79
NOTES: This table includes only beneficiaries with Part D coverage for all 12 months of 2008; it excludes beneficiaries with either a skilled nursing facility or long-term institutionalized stay. It also includes only beneficiaries who took at least one drug used to treat their chronic condition in the last quarter of 2007.
SOURCE: RTI International analysis of Medicare claims and 2007 and 2008 Prescription Drug Event data
65
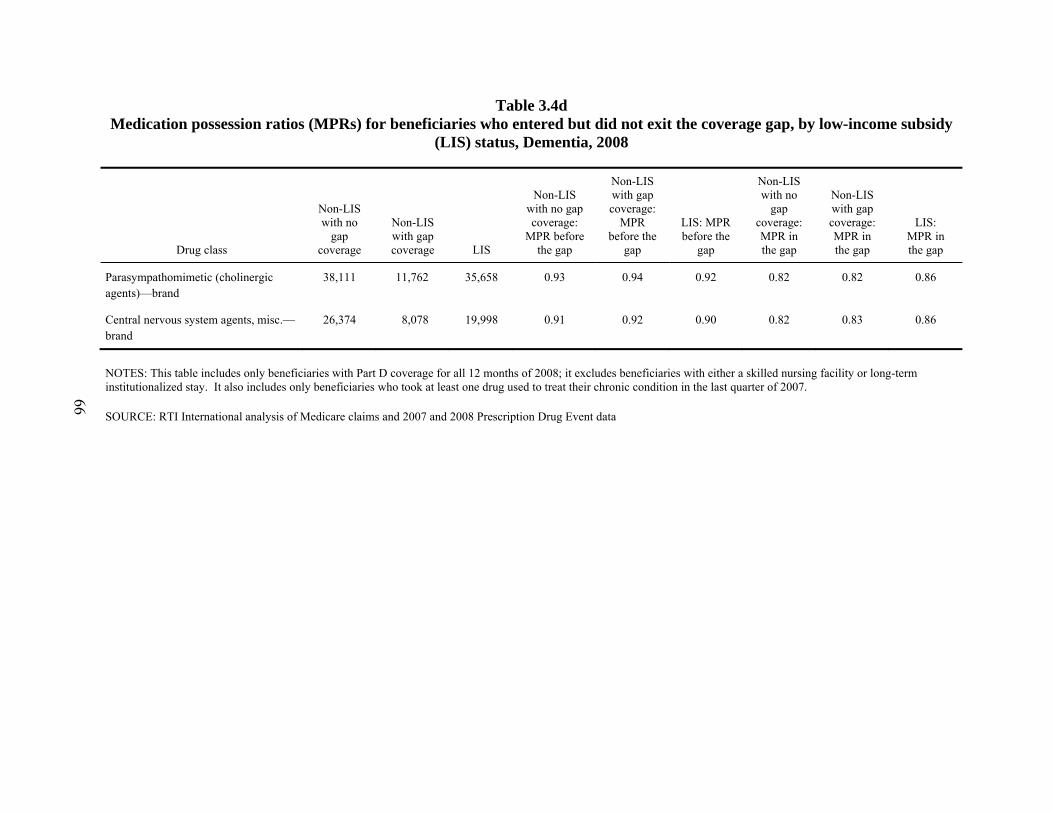
Table 3.4d Medication possession ratios (MPRs) for beneficiaries who entered but did not exit the coverage gap, by low-income subsidy
(LIS) status, Dementia, 2008
Drug class
Non-LIS with no
gap coverage
Non-LIS with gap coverage LIS
Non-LIS with no gap coverage:
MPR before the gap
Non-LIS with gap coverage:
MPR before the
gap
LIS: MPR before the
gap
Non-LIS with no
gap coverage: MPR in the gap
Non-LIS with gap coverage: MPR in the gap
LIS: MPR in the gap
Parasympathomimetic (cholinergic agents)—brand
38,111 11,762 35,658 0.93 0.94 0.92 0.82 0.82 0.86
Central nervous system agents, misc.—brand
26,374 8,078 19,998 0.91 0.92 0.90 0.82 0.83 0.86
NOTES: This table includes only beneficiaries with Part D coverage for all 12 months of 2008; it excludes beneficiaries with either a skilled nursing facility or long-term institutionalized stay. It also includes only beneficiaries who took at least one drug used to treat their chronic condition in the last quarter of 2007.
SOURCE: RTI International analysis of Medicare claims and 2007 and 2008 Prescription Drug Event data
66
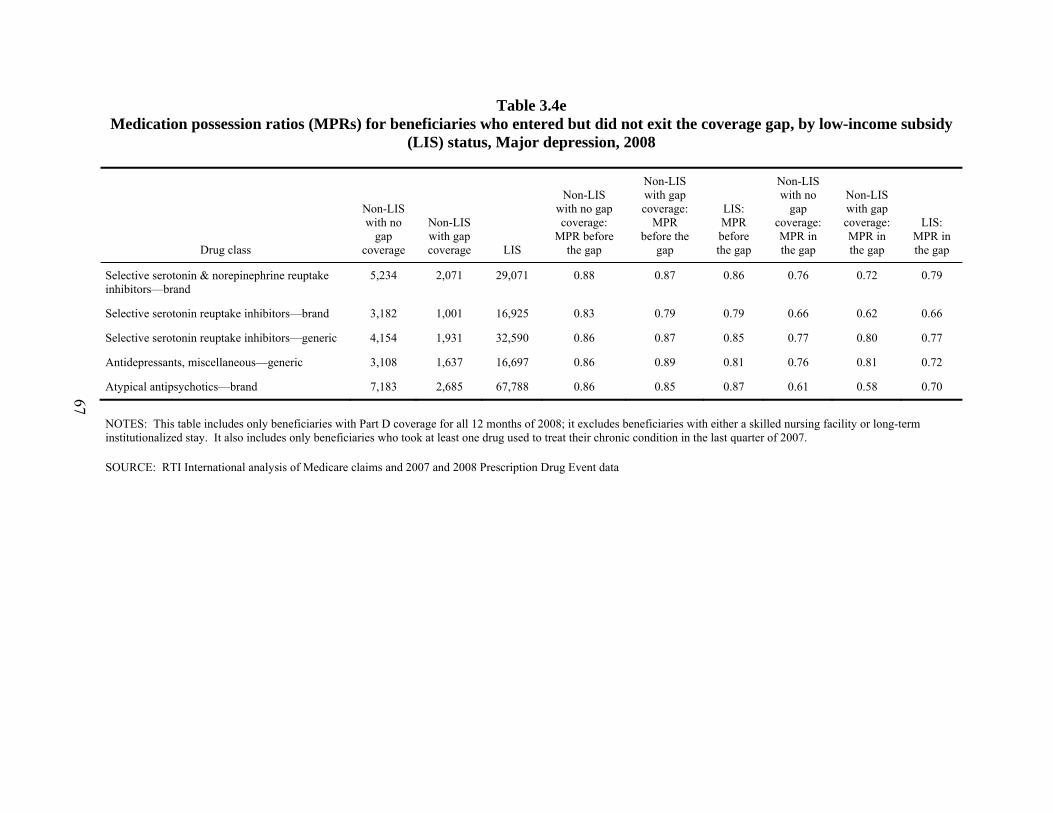
Table 3.4e Medication possession ratios (MPRs) for beneficiaries who entered but did not exit the coverage gap, by low-income subsidy
(LIS) status, Major depression, 2008
Drug class
Non-LIS with no
gap coverage
Non-LIS with gap coverage LIS
Non-LIS with no gap coverage:
MPR before the gap
Non-LIS with gap coverage:
MPR before the
gap
LIS: MPR before the gap
Non-LIS with no
gap coverage: MPR in the gap
Non-LIS with gap coverage: MPR in the gap
LIS: MPR in the gap
Selective serotonin & norepinephrine reuptake inhibitors—brand
5,234 2,071 29,071 0.88 0.87 0.86 0.76 0.72 0.79
Selective serotonin reuptake inhibitors—brand 3,182 1,001 16,925 0.83 0.79 0.79 0.66 0.62 0.66
Selective serotonin reuptake inhibitors—generic 4,154 1,931 32,590 0.86 0.87 0.85 0.77 0.80 0.77
Antidepressants, miscellaneous—generic 3,108 1,637 16,697 0.86 0.89 0.81 0.76 0.81 0.72
Atypical antipsychotics—brand 7,183 2,685 67,788 0.86 0.85 0.87 0.61 0.58 0.70
NOTES: This table includes only beneficiaries with Part D coverage for all 12 months of 2008; it excludes beneficiaries with either a skilled nursing facility or long-term institutionalized stay. It also includes only beneficiaries who took at least one drug used to treat their chronic condition in the last quarter of 2007.
SOURCE: RTI International analysis of Medicare claims and 2007 and 2008 Prescription Drug Event data
67
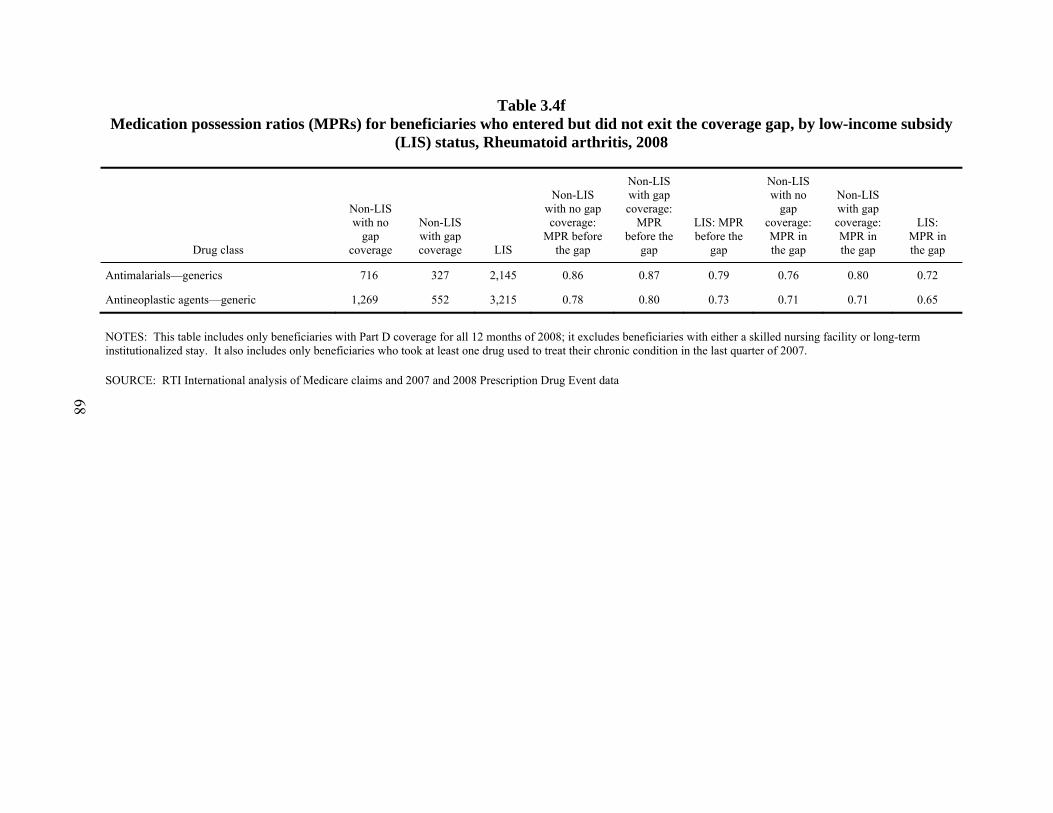
Table 3.4f Medication possession ratios (MPRs) for beneficiaries who entered but did not exit the coverage gap, by low-income subsidy
(LIS) status, Rheumatoid arthritis, 2008
Drug class
Non-LIS with no
gap coverage
Non-LIS with gap coverage LIS
Non-LIS with no gap coverage:
MPR before the gap
Non-LIS with gap coverage:
MPR before the
gap
LIS: MPR before the
gap
Non-LIS with no
gap coverage: MPR in the gap
Non-LIS with gap coverage: MPR in the gap
LIS: MPR in the gap
Antimalarials—generics 716 327 2,145 0.86 0.87 0.79 0.76 0.80 0.72
Antineoplastic agents—generic 1,269 552 3,215 0.78 0.80 0.73 0.71 0.71 0.65
NOTES: This table includes only beneficiaries with Part D coverage for all 12 months of 2008; it excludes beneficiaries with either a skilled nursing facility or long-term institutionalized stay. It also includes only beneficiaries who took at least one drug used to treat their chronic condition in the last quarter of 2007.
SOURCE: RTI International analysis of Medicare claims and 2007 and 2008 Prescription Drug Event data
68
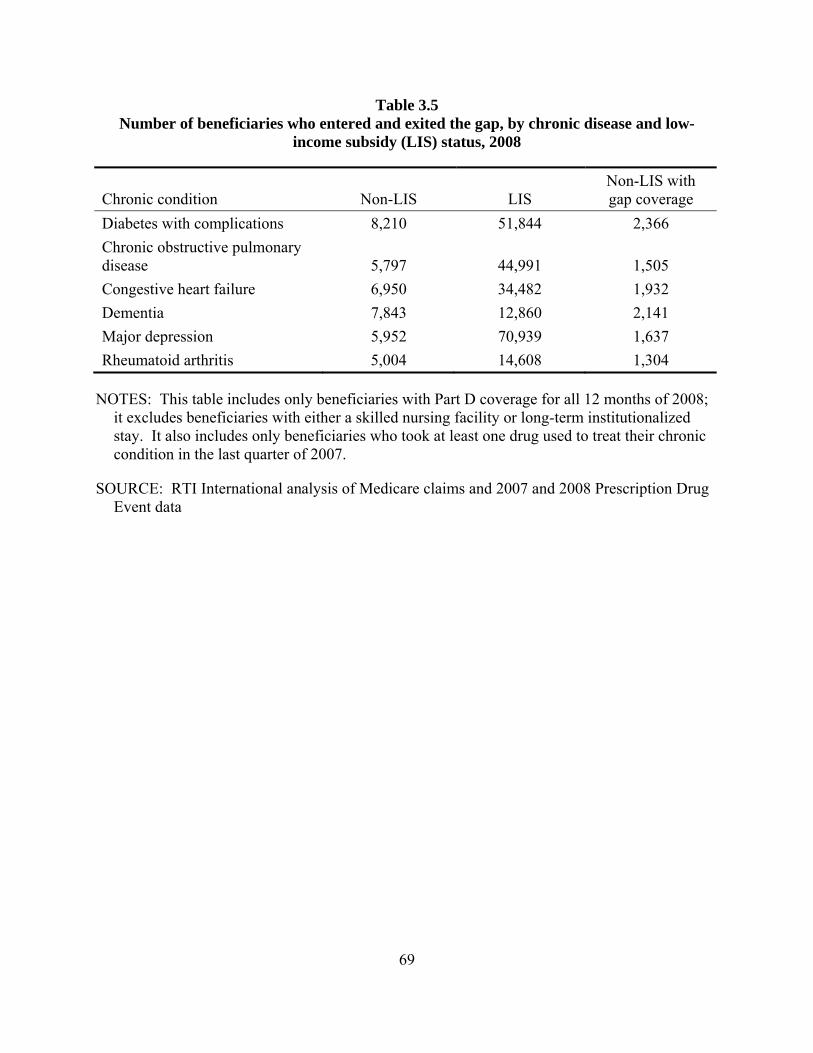
Table 3.5 Number of beneficiaries who entered and exited the gap, by chronic disease and low-
income subsidy (LIS) status, 2008
Chronic condition Non-LIS LIS Non-LIS with gap coverage
Diabetes with complications 8,210 51,844 2,366 Chronic obstructive pulmonary disease 5,797 44,991 1,505 Congestive heart failure 6,950 34,482 1,932 Dementia 7,843 12,860 2,141 Major depression 5,952 70,939 1,637 Rheumatoid arthritis 5,004 14,608 1,304
NOTES: This table includes only beneficiaries with Part D coverage for all 12 months of 2008; it excludes beneficiaries with either a skilled nursing facility or long-term institutionalized stay. It also includes only beneficiaries who took at least one drug used to treat their chronic condition in the last quarter of 2007.
SOURCE: RTI International analysis of Medicare claims and 2007 and 2008 Prescription Drug Event data
69
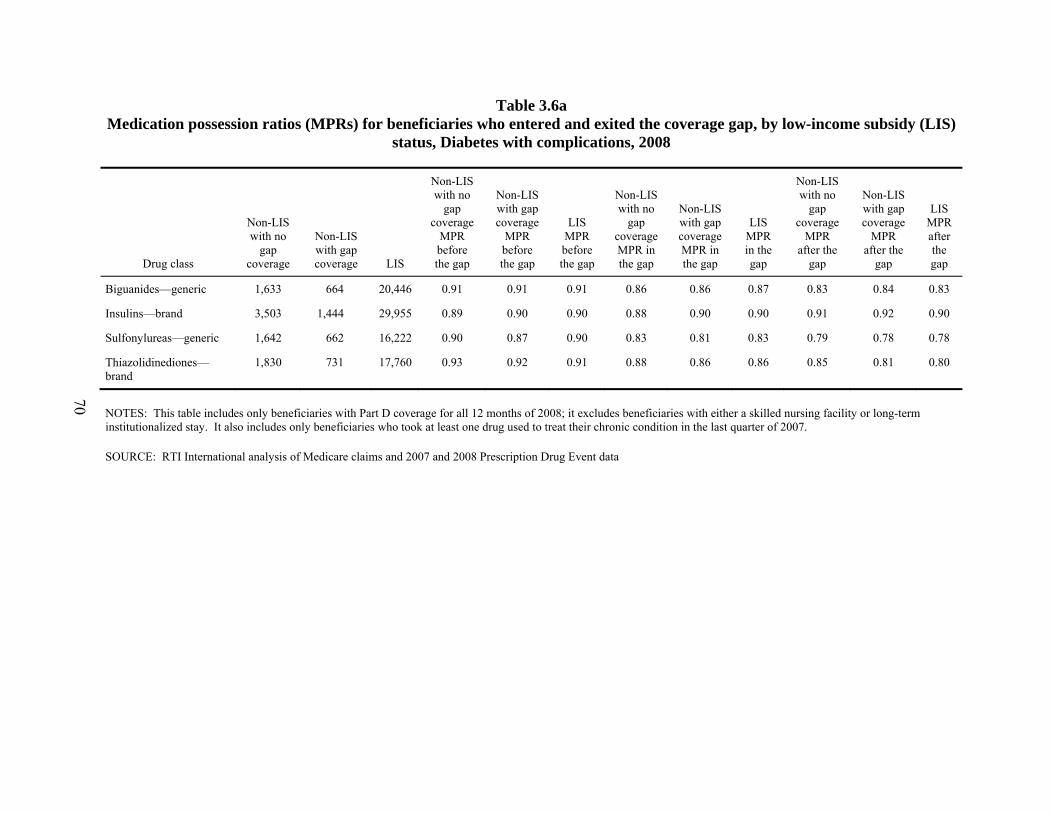
Table 3.6a Medication possession ratios (MPRs) for beneficiaries who entered and exited the coverage gap, by low-income subsidy (LIS)
status, Diabetes with complications, 2008
Drug class
Non-LIS with no
gap coverage
Non-LIS with gap coverage LIS
Non-LIS with no
gap coverage
MPR before the gap
Non-LIS with gap coverage
MPR before the gap
LIS MPR before the gap
Non-LIS with no
gap coverage MPR in the gap
Non-LIS with gap coverage MPR in the gap
LIS MPR in the gap
Non-LIS with no
gap coverage
MPR after the
gap
Non-LIS with gap coverage
MPR after the
gap
LIS MPR after the gap
Biguanides—generic 1,633 664 20,446 0.91 0.91 0.91 0.86 0.86 0.87 0.83 0.84 0.83
Insulins—brand 3,503 1,444 29,955 0.89 0.90 0.90 0.88 0.90 0.90 0.91 0.92 0.90
Sulfonylureas—generic 1,642 662 16,222 0.90 0.87 0.90 0.83 0.81 0.83 0.79 0.78 0.78
Thiazolidinediones—brand
1,830 731 17,760 0.93 0.92 0.91 0.88 0.86 0.86 0.85 0.81 0.80
NOTES: This table includes only beneficiaries with Part D coverage for all 12 months of 2008; it excludes beneficiaries with either a skilled nursing facility or long-term institutionalized stay. It also includes only beneficiaries who took at least one drug used to treat their chronic condition in the last quarter of 2007.
SOURCE: RTI International analysis of Medicare claims and 2007 and 2008 Prescription Drug Event data
70
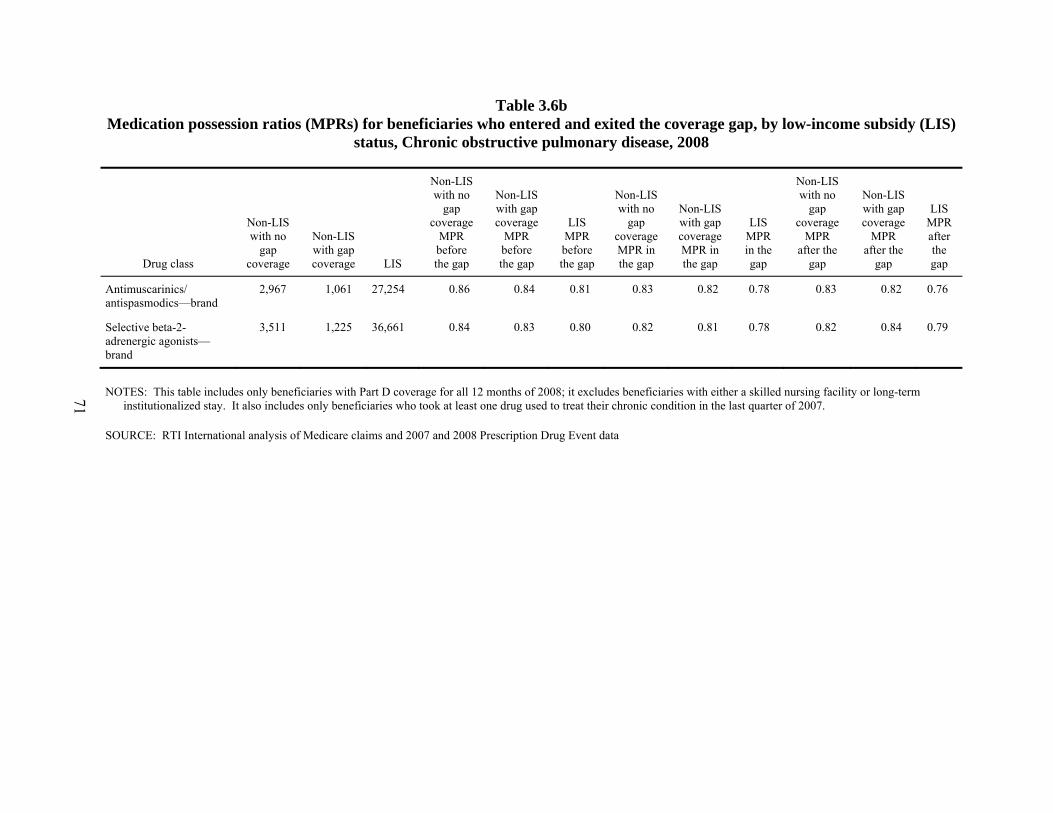
Table 3.6b Medication possession ratios (MPRs) for beneficiaries who entered and exited the coverage gap, by low-income subsidy (LIS)
status, Chronic obstructive pulmonary disease, 2008
Drug class
Non-LIS with no
gap coverage
Non-LIS with gap coverage LIS
Non-LIS with no
gap coverage
MPR before the gap
Non-LIS with gap coverage
MPR before the gap
LIS MPR before the gap
Non-LIS with no
gap coverage MPR in the gap
Non-LIS with gap coverage MPR in the gap
LIS MPR in the gap
Non-LIS with no
gap coverage
MPR after the
gap
Non-LIS with gap coverage
MPR after the
gap
LIS MPR after the gap
Antimuscarinics/ antispasmodics—brand
2,967 1,061 27,254 0.86 0.84 0.81 0.83 0.82 0.78 0.83 0.82 0.76
Selective beta-2-adrenergic agonists—brand
3,511 1,225 36,661 0.84 0.83 0.80 0.82 0.81 0.78 0.82 0.84 0.79
NOTES: This table includes only beneficiaries with Part D coverage for all 12 months of 2008; it excludes beneficiaries with either a skilled nursing facility or long-term institutionalized stay. It also includes only beneficiaries who took at least one drug used to treat their chronic condition in the last quarter of 2007.
SOURCE: RTI International analysis of Medicare claims and 2007 and 2008 Prescription Drug Event data
71

Table 3.6c Medication possession ratios (MPRs) for beneficiaries who entered and exited the coverage gap, by low-income subsidy (LIS)
status, Congestive heart failure, 2008
Drug class
Non-LIS with no
gap coverage
Non-LIS with gap coverage LIS
Non-LIS with no
gap coverage
MPR before the gap
Non-LIS with gap coverage
MPR before the gap
LIS MPR before the gap
Non-LIS with no
gap coverage MPR in the gap
Non-LIS with gap coverage MPR in the gap
LIS MPR in the gap
Non-LIS with no
gap coverage
MPR after the
gap
Non-LIS with gap coverage
MPR after the
gap
LIS MPR
after the gap
Beta-adrenergic blocking agents—generic
2,594 1,017 17,024 0.95 0.93 0.94 0.92 0.90 0.91 0.89 0.90 0.89
Angiotensin-converting enzyme inhibitors—generic
1,394 615 12,694 0.92 0.93 0.92 0.86 0.87 0.86 0.82 0.84 0.82
Angiotensin II receptor antagonists—brand
1,594 592 10,408 0.92 0.92 0.93 0.89 0.87 0.89 0.86 0.87 0.87
Loop diuretics—generic 2,777 1,183 20,120 0.88 0.88 0.88 0.84 0.83 0.85 0.84 0.82 0.83
NOTES: This table includes only beneficiaries with Part D coverage for all 12 months of 2008; it excludes beneficiaries with either a skilled nursing facility or long-term institutionalized stay. It also includes only beneficiaries who took at least one drug used to treat their chronic condition in the last quarter of 2007.
SOURCE: RTI International analysis of Medicare claims and 2007 and 2008 Prescription Drug Event data
72

Table 3.6d Medication possession ratios (MPRs) for beneficiaries who entered and exited the coverage gap, by low-income subsidy (LIS)
status, Dementia, 2008
Drug class
Non-LIS with no
gap coverage
Non-LIS with gap coverage LIS
Non-LIS with no
gap coverage
MPR before the gap
Non-LIS with gap coverage
MPR before the gap
LIS MPR before
the gap
Non-LIS with no
gap coverage MPR in the gap
Non-LIS with gap coverage MPR in the gap
LIS MPR in the gap
Non-LIS with no
gap coverage
MPR after the
gap
Non-LIS with gap coverage
MPR after the
gap
LIS MPR after the gap
Parasympathomimetic (cholinergic agents)—brand
5,217 1,964 11,439 0.97 0.98 0.97 0.95 0.95 0.94 0.89 0.87 0.89
Central nervous system agents, misc.—brand
3,981 1,557 7,351 0.97 0.97 0.96 0.95 0.95 0.94 0.93 0.92 0.92
NOTES: This table includes only beneficiaries with Part D coverage for all 12 months of 2008; it excludes beneficiaries with either a skilled nursing facility or long-term institutionalized stay. It also includes only beneficiaries who took at least one drug used to treat their chronic condition in the last quarter of 2007.
SOURCE: RTI International analysis of Medicare claims and 2007 and 2008 Prescription Drug Event data
73
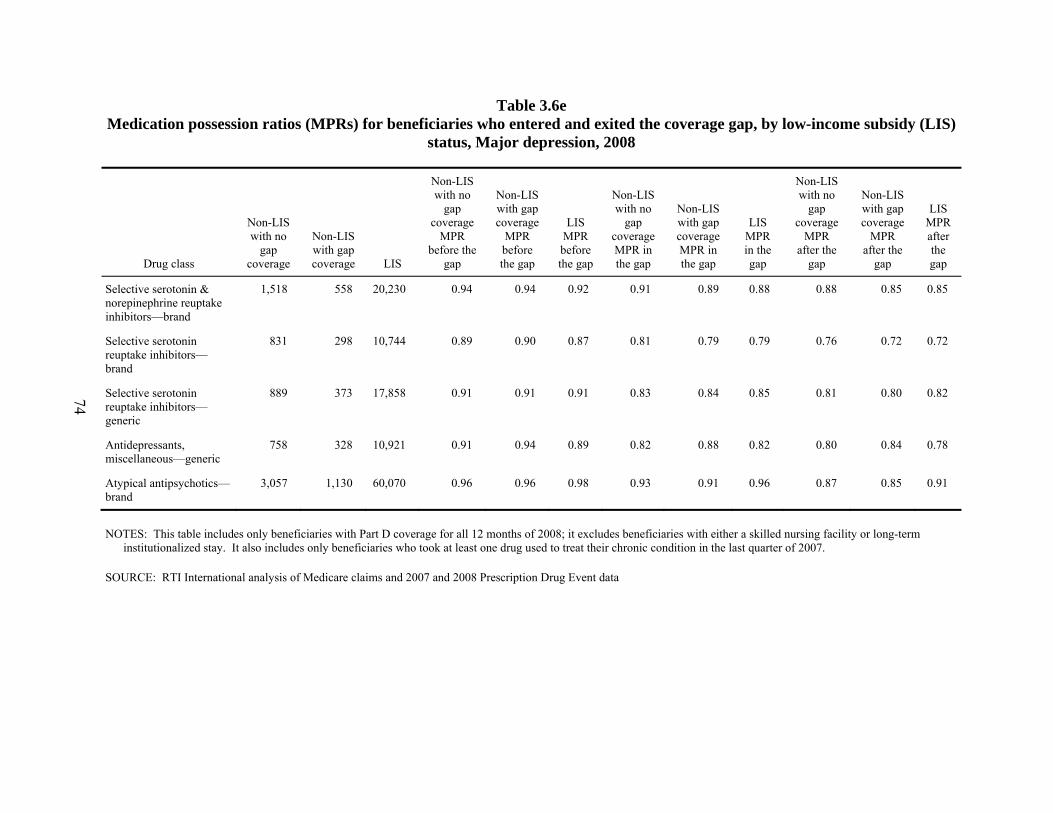
Table 3.6e Medication possession ratios (MPRs) for beneficiaries who entered and exited the coverage gap, by low-income subsidy (LIS)
status, Major depression, 2008
Drug class
Non-LIS with no
gap coverage
Non-LIS with gap coverage LIS
Non-LIS with no
gap coverage
MPR before the
gap
Non-LIS with gap coverage
MPR before the gap
LIS MPR before the gap
Non-LIS with no
gap coverage MPR in the gap
Non-LIS with gap coverage MPR in the gap
LIS MPR in the gap
Non-LIS with no
gap coverage
MPR after the
gap
Non-LIS with gap coverage
MPR after the
gap
LIS MPR after the gap
Selective serotonin & norepinephrine reuptake inhibitors—brand
1,518 558 20,230 0.94 0.94 0.92 0.91 0.89 0.88 0.88 0.85 0.85
Selective serotonin reuptake inhibitors—brand
831 298 10,744 0.89 0.90 0.87 0.81 0.79 0.79 0.76 0.72 0.72
Selective serotonin reuptake inhibitors—generic
889 373 17,858 0.91 0.91 0.91 0.83 0.84 0.85 0.81 0.80 0.82
Antidepressants, miscellaneous—generic
758 328 10,921 0.91 0.94 0.89 0.82 0.88 0.82 0.80 0.84 0.78
Atypical antipsychotics—brand
3,057 1,130 60,070 0.96 0.96 0.98 0.93 0.91 0.96 0.87 0.85 0.91
NOTES: This table includes only beneficiaries with Part D coverage for all 12 months of 2008; it excludes beneficiaries with either a skilled nursing facility or long-term institutionalized stay. It also includes only beneficiaries who took at least one drug used to treat their chronic condition in the last quarter of 2007.
SOURCE: RTI International analysis of Medicare claims and 2007 and 2008 Prescription Drug Event data
74
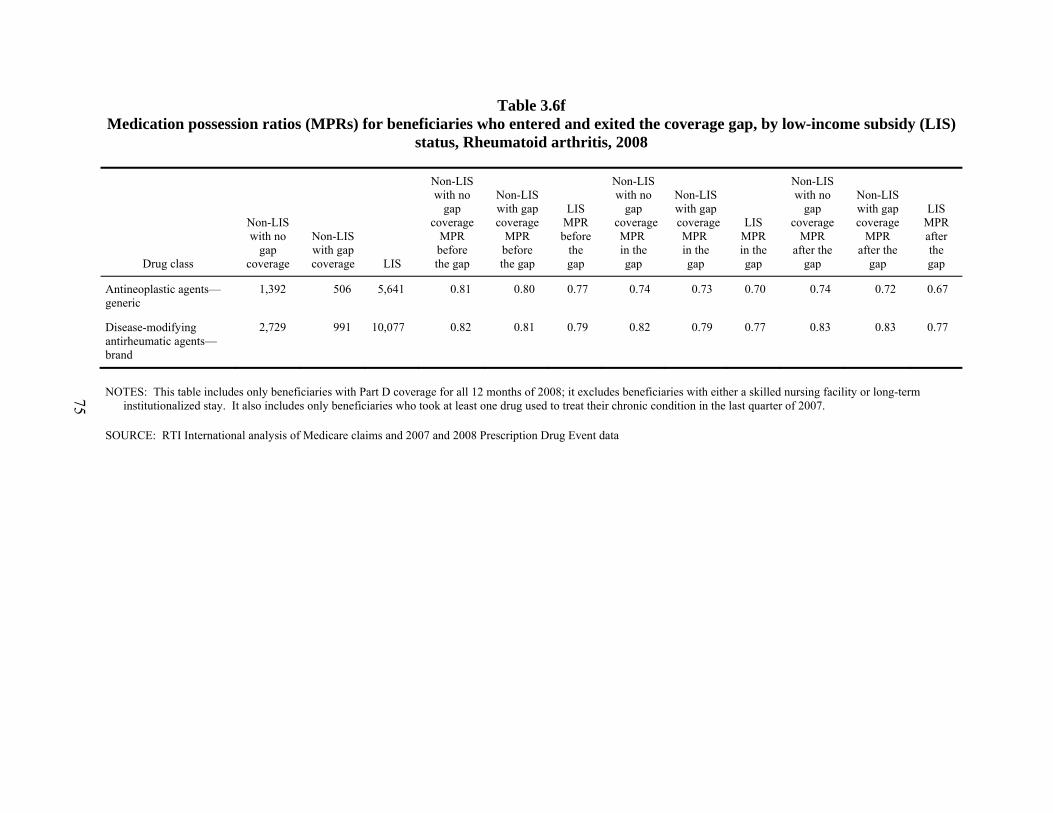
Table 3.6f Medication possession ratios (MPRs) for beneficiaries who entered and exited the coverage gap, by low-income subsidy (LIS)
status, Rheumatoid arthritis, 2008
Drug class
Non-LIS with no
gap coverage
Non-LIS with gap coverage LIS
Non-LIS with no
gap coverage
MPR before the gap
Non-LIS with gap coverage
MPR before the gap
LIS MPR before
the gap
Non-LIS with no
gap coverage MPR in the gap
Non-LIS with gap coverage MPR in the gap
LIS MPR in the gap
Non-LIS with no
gap coverage
MPR after the
gap
Non-LIS with gap coverage
MPR after the
gap
LIS MPR after the gap
Antineoplastic agents—generic
1,392 506 5,641 0.81 0.80 0.77 0.74 0.73 0.70 0.74 0.72 0.67
Disease-modifying antirheumatic agents—brand
2,729 991 10,077 0.82 0.81 0.79 0.82 0.79 0.77 0.83 0.83 0.77
NOTES: This table includes only beneficiaries with Part D coverage for all 12 months of 2008; it excludes beneficiaries with either a skilled nursing facility or long-term institutionalized stay. It also includes only beneficiaries who took at least one drug used to treat their chronic condition in the last quarter of 2007.
SOURCE: RTI International analysis of Medicare claims and 2007 and 2008 Prescription Drug Event data
75

This page intentionally left blank.

SECTION 4 EFFECT OF PART D ON DRUG ADHERENCE AND HEALTH OUTCOMES—
MEDICARE CURRENT BENEFICIARY SURVEY ANALYSIS
4.1 Introduction
In this section, the 2006 and 2007 Medicare Current Beneficiary Survey (MCBS) was used to address the following research questions:
• What is the impact of Part D on patient adherence to medication therapy?
• What is the impact of Part D on utilization outcomes? and
• What is the impact of drug adherence on utilization outcomes?
This analysis focused on beneficiaries with the study’s six selected chronic conditions (i.e., chronic obstructive pulmonary disease [COPD], congestive heart failure [CHF], diabetes with complications, dementia, major depression, and rheumatoid arthritis [RA]). Treatment of chronic disease generally entails prescription medication, but a substantial percentage of Medicare beneficiaries on medications for chronic illnesses do not fully take their prescription regimens as prescribed. Drug adherence has potentially important effects on health outcomes and health care utilization, although evidence on this relationship is mixed. Thus investigation of these research questions is of importance to CMS and policymakers in that it analyzes the impacts that access to insurance for drugs is having on drug adherence.
The MCBS is particularly useful to investigate these research questions because it provides a well-defined comparison group for beneficiaries with Part D drug coverage. The MCBS is a continuous, multipurpose, rotating panel survey of a representative national sample of the Medicare population. It contains survey information on prescription drug insurance coverage, including coverage categories for Part D, employer-sponsored, self-purchased, other public or private, and no drug coverage. The MCBS also includes a series of survey questions on drug adherence, as well as survey information on prescription drug utilization events (PDEs). It also includes health utilization measures, including the number of inpatient and emergency department (ED) events for all Medicare participants from a combination of self-reported information from the survey and claims data. Finally, the MCBS also includes a wealth of other survey information useful for the analysis (e.g., socioeconomic data).
Inpatient and ED events were used to measure health care utilization outcomes in this analysis. Inpatient hospital services account for over one-quarter of Medicare benefit payments (27%) (Kaiser Family Foundation, 2010). ED visits also account for a considerable percentage of Medicare benefit payments, especially among high-cost Medicare beneficiaries (CBO, 2005). In addition, ED visits are an important measure of both health care utilization patterns and health outcomes, as an ED visit indicates a health problem severe enough to require emergency treatment. One of the goals of the introduction of Medicare Part D was to lower costs and improve patient outcomes through lowering hospitalizations and ED visits (Stuart et al., 2007). Inpatient and ED events were also chosen as the outcomes for this analysis because they are the MCBS health outcomes measures that we expect to be most closely and immediately tied to
77
medication adherence. Although other measures were considered, including self-reported health status and limitation in activities of daily living (ADLs), RTI determined that inpatient and ED events were likely to be affected more strongly and quickly by medication adherence than those more general measures of health would be.
Prior studies have used the MCBS to examine drug adherence in the Medicare population. Madden and colleagues (2008) used data from the 2004–2006 waves of the MCBS to estimate the impact of the Part D program on cost-related nonadherence (CRN). The researchers concluded that there was evidence of a small, but significant, overall decrease in CRN and in foregoing of basic needs after Part D implementation. However, no net decrease in CRN after Part D was observed among the sickest beneficiaries, who continued to experience higher rates of CRN. Kennedy and colleagues (2011) conducted a similar study using the 2005–2006 MCBS. The researchers concluded that Part D coverage reduced but did not eliminate CRN for newly drug-insured beneficiaries, but unresolved CRN persisted for both newly and continuously drug-insured beneficiaries, especially among disabled beneficiaries. Kennedy and colleagues (2008) used the 2004 MCBS to determine the rates of self-reported failure to fill at least one prescription prescribed to them during the year for any condition. The researchers found that most Medicare beneficiaries filled their prescriptions, but adherence was somewhat better for beneficiaries with employer-sponsored drug coverage. Stuart and colleagues (2009) used the 1997–2004 MCBS to estimate the effects of persistence in medication fills on health outcomes for patients with diabetes. The researchers found that, for users of older oral antidiabetes agents, each additional prescription filled was associated with significantly lower risk of hospitalization, fewer hospital days, and lower Medicare spending.
A number of researchers have looked at the relationship between drug coverage, adherence, and hospitalizations. Stuart and colleagues (2007), Khan and colleagues (2008), and Briesacher and colleagues (2005) all used MCBS data and found no relationship between drug coverage and Medicare spending for hospital services (in the case of Stuart et al. and Briesacher et al.) or hospitalization rates (in the case of Khan et al.). Chandra, Gruber, and McKnight (2007), on the other hand, found that an increase in patient cost-sharing for physician visits and prescription drugs did result in an increased number of hospitalizations. Stuart and colleagues (2009) used the MCBS to look at the effects of medication adherence by Medicare beneficiaries with diabetes and found that, “for users of older oral antidiabetes agents, ACE inhibitors, ARBs, and statins, each additional prescription fill was associated with significantly lower risk of hospitalization, fewer hospital days, and lower Medicare spending” (p. 647). Murray and colleagues (2009) and Tu and colleagues (2005) both studied patients with CHF participating in randomized trials, and both found that better adherence to certain medications was associated with fewer hospital admissions. These adherence studies all focus on small and specific subgroups of people with a particular condition. The contradictory results for drug coverage and limited nature of the studies for adherence make the more overall relationship between drug adherence, drug coverage, and hospitalizations an important and open question,
We conduct a methodologically rigorous analysis by employing propensity score analysis techniques in our multivariate analysis. The use of propensity scores has become a very popular technique in health economics. It allows us to minimize selection bias in our estimates of the effect of Part D by creating a comparison group that is more closely matched to Part D
78
participants than simply the overall population of Medicare beneficiaries who do not have drug coverage.
To the best of our knowledge, this study is unique in studying the three research questions tackled and incorporates each of the following: (1) a nationally representative sample of the Medicare population; (2) a time period after Part D implementation; (3) survey data on drug adherence, on PDEs, on inpatient and ED events, and on drug insurance coverage; and (4) a matched comparison group based on a propensity score approach (PSA). With this, we believe the analysis in this section is a contribution to the drug adherence literature.
The key findings in this section are as follows:
• The descriptive analyses showed that beneficiaries with Part D drug coverage reported frequent nonadherence at only about half the rate as did beneficiaries with no drug coverage.
• The multivariate analyses showed that Part D beneficiaries are less likely to report frequent nonadherence than beneficiaries with no drug coverage (odds ratio = 0.41, t-statistic = 3.40).
• The results for the impact of Part D on drug adherence vary somewhat depending on the measure of adherence.
• Overall, however, the analyses support a conclusion that Part D drug coverage has a positive impact on medication adherence compared with no drug coverage.
• We find little relationship between Part D enrollment and the likelihood of having at least one inpatient event.
• We find that enrollment in Part D increased the likelihood of having at least one ED event.
• In the full sample including all six of the study’s chronic conditions, Part D enrollment was associated with fewer inpatient events but not related to the number of ED visits. However, for CHF, it was associated with fewer of both types of events.
• No direct relationship was found between adherence and inpatient or ED events in the vast majority of specifications.
4.2 Methods and Data
We now describe our methods and data for our analysis. We first describe the PSA for matching the Part D coverage (treatment) and no drug coverage (comparison) groups. We then document our processes for sample selection, analytic variable creation, and weighting. Finally, we explain our multivariate estimation techniques.
79
4.2.1 Propensity Score Analysis Approach
Many techniques are possible using the PSA. However, each one of these approaches begins with defining a treatment and comparison group. We chose to limit our sample for this purpose to only Part D participants and those with no drug coverage. In this way, we excluded beneficiaries who were very unlikely to participate in Part D because they already have coverage. In addition, the resulting impact estimate will be the impact of Part D coverage as compared to no coverage at all, an impact that is more informative than a comparison with other existing coverage. In addition we exclude Medicaid recipients, as they are automatically enrolled in Part D and thus have no appropriate comparison beneficiaries in the no coverage group.
The next step in PSA is estimating a propensity score using a logistic regression. In this case, that was a logistic regression of participation in Part D on a range of variables that we expect may influence both enrollment in Part D and outcomes. The independent variables used in this regression were indicators of each of our six chronic conditions, as well as each of the measures described in detail under the heading “control variables” in Section 4.2.3 below. After this, there are many choices as to how to approach PSA; they can be categorized into four types of approach:
1. Traditional Matching Estimators
2. Weighting Approaches
3. Using the Propensity Score as a Covariate
4. Combinations of Approaches
The primary source of background information that led to our choice of approaches was “Recent Developments in the Econometrics of Program Evaluation” by Imbens and Wooldridge (2009), an 80-page overview of many different approaches that appeared in the Journal of Economic Literature in 2009. It is a very complete, technical, and recent discussion of the pros and cons and implementation of many different methods. This led us to choose an approach that falls into category four, a combination of approaches, which is the approach strongly recommended by Imbens and Wooldridge. The combined approach most appropriate for this analysis was determined to be stratification by propensity score followed by regression for each stratum. There are many simpler PSAes, but each has substantial weaknesses which this approach largely overcomes (Imbens and Wooldridge, 2009; Kurth et al., 2006).
In this analysis, after estimating the propensity scores on the analytic sample, there were five steps in the analysis:
1. Assess the overlap in propensity scores between the Part D and comparison samples; discard observations that are not in the overlapping area.
2. Divide the resulting sample into five quintiles by propensity score.
80

3. Assess the balance of the variables within each stratum, by estimating the equation immediately below for every variable in each stratum, where and are the estimated mean and standard deviation in the Part D group, and similarly for the comparison group. Generally, values of under 5 percent (in absolute value) are considered evidence that the data has been successfully balanced (Austin, 2008; Caliendo and Kopeinig, 2005).
4. Run regressions separately on each quintile created above, using only the control variables that are not adequately balanced (|standard bias| > 5%) in at least one quintile (Austin, 2008; Caliendo and Kopeinig, 2005).
5. Combine the five regressions to obtain the final impact estimate, using the equations immediately below to estimate the final estimates ( ) and their variance ( ):
Note that is the number of comparison group observations in the kth quintile, is the number of Part D observations in the kth quintile, and N is the total number of observations. Finally, the standard error for the final estimate ( ) equals the square root of the variance of the estimate ( ).
4.2.2 Sample Selection
Our analysis of the effect of Part D on drug adherence was conducted using stacked cross-sectional samples from the 2006 and 2007 MCBS Cost and Use Files, which together have a total of 23,979 observations. For each survey year (2006 and 2007), the sample selection criteria were as follows:
• Community-residing in survey year
• 12 months of Parts A and B enrollment during survey year
• Alive at the end of survey year
• United States resident in survey year
81
• Able to merge data to survey year Medicare RxHCC Risk Score file
• Able to merge data to survey year MCBS Access to Care file
• Not diagnosed with end-stage renal disease (ESRD) in survey year
The reasons for these criteria are varied. Importantly, the sample excluded beneficiaries residing in nursing homes because, presumably, nursing home patients are generally prescribed necessary medications and are assisted in taking their medications as required. The measure used for community-residing was that respondents were in their homes during the third round of interviews in the survey year, when many of the relevant questions were asked. In addition, the sample excluded new Medicare enrollees and decedents in the survey year, who would have had a partial year of experience in the Medicare program. Beneficiaries who resided in U.S. territories in the survey year were excluded because there were some questions on the comparability of the data for these beneficiaries. Also important for our analyses were variables from the Medicare RxHCC Risk Score Files and the MCBS Access to Care Files, so beneficiaries who could not be merged to those data sources in the survey year were excluded. This restriction is almost equivalent to excluding all observations from the MCBS supplemental sample—those who were added to the sample after the initial selection was made based on the Medicare population in January 2005 for the 2006 survey, or January 2006 for the 2007 survey. Because the supplemental sample was not included in most of the Cost and Use survey, we do not have high-quality data for this sample, which is another reason to exclude them. As is done in the other sections of the report, we exclude ESRD patients because they are a small sample with unique characteristics and extensive health care needs, so the estimates are more reliable when they are not included in the analysis sample.
Table 4.1 summarizes the sample selection and the number of observations by each restriction. After all the sample criteria were applied, the sample size was N = 18,441. We then made additional sample restrictions to develop our analytic sample for determining the impact of Part D drug coverage on drug adherence. This involved restricting the sample further to beneficiaries with (1) Part D drug coverage or no drug coverage in the survey year, (2) not dually enrolled in Medicare and Medicaid in the survey year, (3) diagnosed with at least one of the study’s six selected chronic conditions in the survey year, and (4) propensity score contained in overlap region for the Part D (treatment) and no drug coverage (comparison) groups. The reasons for these restrictions were discussed previously in Sections 4.1 and 4.2.1. Each line of Table 4.1 shows the number in each category individually, not progressively—for instance, although there are 12,369 with Part D or no drug coverage and 14,890 who are not in Medicaid, there are many fewer than that who are both not in Medicaid AND have either Part D or no drug coverage. The sample size for the final analytic sample is 2,888 (Table 4.1). Finally, out of the 2,888 observations in the final analytic sample, the counts by each of the study’s selected chronic conditions are: COPD (1,174), CHF (1,059), diabetes with complications (731), dementia (416), major depression (267), and RA (203).18 For our analyses, we pool the observations across the six chronic conditions (n = 2,888).
18 Our methodology for identifying patients with the selected chronic conditions is presented in Section 2.
82
4.2.3 Analytic Variables
Drug Adherence. Our primary adherence outcome measures are based on a set of five survey questions about drug adherence:
1. Didn’t get one or more prescriptions
2. Delayed getting prescription because of cost
3. Took smaller doses of prescription
4. Decided not to get prescription because of cost
5. Skipped doses to make prescription last longer
Our first adherence outcome measure, which we term some nonadherence, is a binary indicator variable based on (a) answering “yes” to question 1), and/or (b) answering either “sometimes” or “often” to any of the questions 2) to 5). Our second adherence outcome measure, which we term frequent nonadherence, is a stronger measure of nonadherence and is based on answering “often” to any of the questions 2) to 5). These adherence measures are similar to the adherence measures used in other studies of prescription adherence using the MCBS (e.g., Madden et al., 2008, 2009; Kennedy et al., 2008, 2011).
It is important to note several caveats about these adherence measures. First, these measures do not take into account what medication the respondent was nonadherent to. Although analysis will be conducted only using respondents with one of the study’s six selected chronic conditions, the medication they are reporting nonadherence to may be for another condition. In some cases, that condition may be far less serious, and the medication could be less medically necessary; it is impossible to know based on the survey questions included in the MCBS. Second, these measures of adherence remain far different from the medication possession ratio (MPR) used in the section of the study that is based on Part D claims data. Third, these measures are relevant only to those who received a prescription for at least one medication. However, since the analytic sample is restricted to beneficiaries with one of the study’s six chronic conditions, over 99 percent of the sample filled at least one prescription during the year. Thus this is a miniscule limitation. Fourth, these adherence measures are based on simple self-reporting, without any external verification.
A third adherence outcome measure used in the analysis is a binary indicator for whether a beneficiary had at least one prescription filled to treat their chronic condition.19 Prescription drug utilization events (PDEs) are identified in the MCBS Cost and Use Prescription Medicine Event File. MCBS interviewers verified the data collected for this file by asking respondents to provide prescription bottles when possible. This file includes a variable that identifies whether the event is survey-only, PDE-only, or survey matched to PDE. To create this measure of drug
19 The methodology for identifying prescription drugs used to treat the selected chronic conditions is provided in
Section 3.
83
adherence, we excluded the PDE-only events. Otherwise, there would be a bias for Part D enrollees compared with non-Part D enrollees.
Hospitalizations. The first utilization variable of interest is the number of hospitalizations, which in the MCBS is based on a combination of survey information and Medicare administrative data on individual hospital stays. This creates data for both fee-for-service and Medicare Advantage enrollees. The MCBS cost and use hospital inpatient event file is used to identify hospitalization events.
Emergency Department (ED) Visits. The second utilization variable of interest is the number of ED visits, which is also based on a combination of survey information and Medicare administrative data on ED visits, thus including both fee-for-service and Medicare Advantage enrollees. Like hospitalizations, this is an important outcome due to the level of expenditures, but it is also a more direct measure of health outcomes. The MCBS cost and use hospital inpatient and hospital outpatient event files are used to identify ED events.20
Drug Coverage. We examined the effects of Part D on drug adherence. The two groups in our analysis sample are Part D enrollees and those with no drug coverage. The indicator of Part D coverage was equal to 1 for any respondent with at least one month of Part D coverage, zero otherwise. This measure was derived from the MCBS health insurance file (RIC 4), which uses a combination of survey-reported and administrative information to identify drug coverage.
Chronic Conditions. Ideally we would examine the effects of Part D on drug adherence separately by each of the study’s six selected chronic conditions. However, given the limited sample size for the MCBS, we pooled the observations for the six chronic conditions. However, we created 1/0 indicator variables for each of the six chronic conditions (COPD, CHF, diabetes with complications, dementia, major depression, and RA). We also created interactions of each of these chronic condition indicator variables with the Part D coverage vs. no drug coverage indicator variable.
Control Variables. The analysis examined the impact of Part D on drug adherence, controlling for a large number of beneficiary characteristics as follows:
• Demographics and socioeconomics
– Age (0–64, 65–74, 75–84, and 85+)
– Sex (female/male)
– Race (Black, White, other)
– Census divisions (New England, Middle Atlantic, East North Central, West North Central, South Atlantic, East South Central, West South Central, Mountain, Pacific)
20 The hospital inpatient event file includes ED visits leading to a hospitalization, and the hospital outpatient event
file includes ED visits not leading to a hospitalization.
84
– Urbanicity (metropolitan/nonmetropolitan)
– Income ($0–$15,000; $15,001–$30,000; $30,001–$50,000; $50,001+)
– Education—less than high school, high school graduate, some college, bachelors degree or more
– Household composition—lives alone (yes/no)
• Health status
– RxHCC risk score quintiles (0–20 percent, 20–40 percent, 40–60 percent, 60–80 percent, and 80–100 percent)
• Attitudes toward medical care
– Agreed that they would do almost anything to avoid going to the doctor (yes/no)
– Agreed that they usually go to the doctor as soon as they feel bad (yes/no)
– Someone accompanies them to the doctor’s office (yes/no)
• Other control variables
– Survey year (2006, 2007)
Demographic and socioeconomic control variables were derived from the MCBS. Age, sex, race, census region, and urbanicity are each derived from the Administrative Identification file (RIC A). Income and education were derived from the Survey Identification file (RIC 1). Household composition is derived from the Household Composition file (RIC 5). Attitudes toward health care are derived from the Access to Care File (RIC 3).
The RxHCC risk score, a measure of health status, is the most important control variable for our analysis. It was obtained from the 2006 and 2007 Medicare RxHCC Risk Score Files, which are based on the Risk Adjustment Model used for Part D capitation payments (CMS, 2005). In the RxHCC model, demographics and diagnoses are used to predict Part D expenditures, similar to the method used to risk-adjust Part C capitation payments (Pope et al., 2004). Specifically, 84 disease groups, or RxHCCs, from the previous year are used to predict Part D expenditures in the survey year. The RxHCC risk score is an expenditure-weighted index of a beneficiary’s diagnoses that predicts the relative risk of future Medicare Part D expenditures. The risk score measures used in our analysis were indicators of what quintile a beneficiary’s risk score was in: the first quintile, scores of 0–20 (lowest); the second quintile, scores of 21–40; and so on up to the fifth quintile, which was those with scores of 81–100 (highest). These quintiles were defined on the full MCBS cost and use sample.
85

4.2.4 Multivariate Statistical Methods
4.2.4.1 Examining the Impact on Adherence
The dependent variables for our multivariate statistical model will be our measures of drug adherence. Given that our drug adherence measures are binary variables (see Section 4.2.2), we used a logistic regression model as shown in Equation 4.1:
Log [P/(1–P)] = a0+a1X+ a2C + a3D + e (Eq. 4.1)
In Equation 4.1, depending on the adherence outcome measure used, P is the probability of either (1) some nonadherence, (2) frequent nonadherence or (3) filling at least one prescription to treat their chronic condition. The beneficiary’s characteristics, represented by X, include the demographic, socioeconomic, health status, and other control variables (see Section 4.2.2). Indicator variables for the study’s six selected chronic conditions are represented by C. Finally, the model also includes an indicator variable for Part D versus no drug coverage, represented by D.
We also estimate an alternative specification as follows:
Log [P/(1–P)] = a0+a1X+ a2C*D + e (Eq. 4.2)
Note that the alternative specification in Equation 4.2 includes interactions of Part D with each of the study’s six chronic conditions, represented by C*D, but includes main effects only for each chronic condition, not for Part D. Because everyone in the sample has at least one chronic condition, this fully saturates the interactions. Thus, these interactions essentially estimate the impact of Part D on drug adherence separately for each of the six chronic conditions, without running the regression separately on each chronic condition subsample.21
We adjust for quasi-complete separation using the Firth method (Firth, 1993). Failure of the likelihood maximization algorithm to converge is a frequent problem in logistic regression, especially when the sample size is small like it is with the MCBS. The convergence problem is mainly a consequence of data patterns known as complete or quasi-complete separation (Allison, 2008). The Firth method, originally developed to reduce the bias of maximum likelihood
21 There is potential concern as to the validity of the coefficients on the terms that are interactions of chronic
conditions and Part D enrollment. This concern is related to the fact that the chronic condition indicators were used in the creation of the propensity scores. Because the chronic condition indicators are included in the creation of the propensity score, the coefficients on the main effects of the chronic condition indicators in the final results are not valid. These indicators applied to both people with Part D and people with no insurance. However, because the interactions between Part D enrollment and the condition indicators were not used in the creation of the propensity scores, the coefficients on these interactions are indeed valid. Nevertheless, as a sensitivity test, we re-ran the regression that created our strongest results (the regression of frequent nonadherence on the interactions with Part D), with an alternative propensity score specification. This alternative specification did not include the chronic condition indicators in the creation of the propensity score. Using this alternative propensity score did not qualitatively change our results.
86

estimates, has been shown to provide an ideal solution to separation. It uses penalized maximum likelihood estimation to produce finite parameter estimates (Heinze and Schemper, 2002).
For each propensity score quintile, we estimate a logistic regression model as described above. We then calculate final estimates by taking a weighted average of the five propensity score quintile logistic regression results. See Section 4.2.1 for details.
4.2.4.1 Examining the Impact on Inpatient and ED Events
We use a common approach for estimation of count data such as this inpatient and ED visit event data. This approach is a two-step model, where logistic regression (with equation as above except for the dependent variable now measures inpatient or ED events) is used to estimate the probabilities of having at least one event, and zero-truncated Poisson is used to estimate the number of events, given a beneficiary experiences at least one event. This is the method used to model ED visits in Section 5. One challenge of this approach, however, is that the second stage—the Poisson regression—uses only the observations on the beneficiaries with at least one event. As shown in Table 4.2, because only 31.7 percent of the sample had at least one hospitalization and only 19.0 percent of the sample has at least one ED visit, this cuts down drastically on an already small sample. Because of the computational limits of Poisson regression, this makes it intractable to conduct the planned analysis using the same approach used in the rest of our MCBS analysis. As a result, rather than conducting this second stage analysis on each quintile separately, we conduct it on the full sample using the propensity score as a covariate. Results of the Poisson analysis are reported as incidence rate ratios (IRRs). These are ratios that show the ratio of the expected number of events when a given variable is equal to 1, to the expected number when the variable is equal to 0. So an IRR below 1 on the Part D indicator would indicate that Part D decreases the number of events.
For each model, we again run two different specifications. In the first specification, the variable of interest is Part D, and in the second one Part D is interacted with each of the chronic conditions, yielding estimates showing how the effect of Part D varies by condition.
4.2.5 Accounting for Survey Structure and Design
Similar to virtually all surveys, the MCBS is subject to several forms of nonresponse (Kautter et al., 2006). These include unit nonresponse, in which beneficiaries are not interviewed, and item nonresponse, in which interviewed beneficiaries do not answer certain questions. In addition, in longitudinal surveys such as the MCBS, there is the potential for beneficiaries to drop out of the survey entirely (attrition). Consequences of nonresponse include the following: (1) biases in point estimators, (2) inflation of the variances of point estimators, and (3) biases in customary estimators of precision (Dillman et al., 2002). The MCBS cross-sectional sample weights adjust for nonresponse and account for differential probabilities of selection (beneficiaries eligible for Medicare by disability, and the oldest beneficiaries eligible by age, are oversampled in the MCBS).
However, despite these facts, we do not use the MCBS survey weights in our multivariate analysis of the effects of Part D on drug adherence. There are a couple of reasons for this. First, our goal is not to produce estimates that can be projected to the national Medicare population. Rather, our goal is to determine the impact of Part D on drug adherence for our customized
87

analytic sample, which has several exclusion/inclusion criteria, many resulting from the PSA (see Sections 4.2.1 and 4.2.2). In addition, weighting can potentially increase both bias and variance (Freedman and Berk, 2008). These factors make weighting inappropriate and unnecessary.
Due to the structure of the MCBS, about three-quarters of the observations in 2006 are also in the sample in 2007. Because of this, we would ideally cluster the standard errors by individual to account for the fact that an individual’s outcomes in 2006 are likely to be correlated with their outcomes in 2007, even after controlling for their characteristics. However, as the use of the Firth correction cannot be combined with cluster standard errors, we were unable to make this correction. We did, however, repeat one of the models using cluster standard errors (some of them could be run without the Firth correction) and we found the standard errors to be virtually identical to those presented here.
4.3 Descriptive Results
Table 4.2 presents descriptive statistics for the final analytic sample, both overall (the first column) and by drug coverage (Part D in the second column, no drug coverage in the third column). For comparison purposes, descriptive statistics for the MCBS cost and use sample (after exclusions—see Table 4.1) are also included in the final column. The sample size for the overall analytic sample is 2,888 observations, with most of these enrolled in Part D (2,490) and a smaller number in the no coverage group (398). The full cost and use sample includes 18,441 observations. The most common of our chronic conditions by far are COPD (40.7%) and CHF (36.7%), and those are also the most common conditions in the full cost and use sample.
Overall, nonadherence rates are somewhat higher in our analysis sample than in the full cost and use sample; this is consistent with other studies finding higher nonadherence among those with chronic conditions (e.g., Kennedy et al., 2011). They are also higher for the no coverage group than for the Part D enrollees. The rate of some nonadherence in the analysis sample is 17.4 percent (17.0% and 20.1% for Part D and no drug coverage, respectively), the rate of frequent nonadherence is 3.6 percent (3.1% and 6.5% for Part D and no drug coverage, respectively), and the rate of filling at least one prescription for their chronic condition was 78.4 percent (79.5% and 71.4% for Part D and no drug coverage, respectively). All of these results imply adherence rates that are much higher than those found when MPRs are calculated directly, as in Section 3 of this report. Kirking and colleagues (2006) discuss several possible reasons for this. First, in-home surveys such as MCBS generally resulted in higher values than telephone surveys. Second, this question references “this year,” which, based on the design of the MCBS, refers to 9–11 months, so adherence would be higher than that found over 1 full year. Lastly, surveys that focused specifically on medications found lower adherence rates than more general surveys such as MCBS.
There are also clear differences among the groups in inpatient and ED events. Both types of events are more common in the analysis sample (the first column) than the full MCBS cost and use sample (the final column). This is not surprising given that in the analysis sample all have chronic conditions. The rate of inpatient events is quite similar between those in Part D and those with no drug coverage. However, the rate of ED events is higher among those in Part D (19.7% for Part D, 14.8% for no drug coverage).
88
In addition to chronic conditions, drug adherence, and inpatient and ED events, Table 4.2 provides results for various beneficiary characteristics, including demographic, socioeconomic, and health status categories. Due to our sample restrictions, the final analytic sample is somewhat older, more white, lower education, and in worse health (as measured by RxHCC risk score) than the broader full MCBS cost and use sample. However, the descriptives are overall quite similar—other than the chronic conditions, the analysis sample is fairly similar to the broader Medicare population. In addition, those enrolled in Part D are quite similar to those with no drug coverage, based on these descriptive statistics. There are two substantial differences between the two groups however:
• Part D enrollees are much more likely to be women (58.3% of those enrolled are female, compared to 41.2% of those with no coverage);
• Part D enrollees are in worse health—this is shown most starkly by the fact that 35.1 percent of Part D enrollees have RxHCC risk scores above the 80th percentile of the overall distribution, whereas only 24.9 percent of those with no drug coverage in our analysis sample have scores this high.
Both of these are evidence of selection effects that, if not properly accounted for, will lead to selection bias in our impact estimates. If we fail to properly account for the fact that Part D enrollees are in worse health than those with no coverage, we will come to the false conclusion that Part D enrollment in fact has a negative effect. The result of this difference can be seen in the raw difference in the rate of ED events, which is higher among those in Part D, most likely due to the fact that this group is overall in worse health. The goal of propensity score analysis is to extract the true impact of Part D enrollment despite this existing background difference in health.
Table 4.3 presents descriptive results for the MCBS final analytic sample for each of the study’s six selected chronic conditions. There are many differences between groups evident in this table; we will only discuss a few of the largest. The first few rows show that typically, beneficiaries identified with one of the six chronic conditions have comorbidities. For example, for beneficiaries with COPD, approximately one-third have CHF, and vice versa.
The adherence measures show that adherence, as measured by reports of nonadherence, is much lower for those with major depression than the other groups. This may be due to the adverse effects of antidepressants, as well as the nature of the disease itself. A full 10.1 percent of those with major depression report frequent nonadherence. At the other extreme, only 0.5 percent of those with dementia report frequent nonadherence. The rate of having filled at least one prescription to treat the condition is over 80 percent for CHF, diabetes with complications, and major depression, but only about 50 percent for COPD, dementia, and RA.
The rate of having at least one inpatient event is highest for those with CHF (44.2%) and lowest for those with RA (23.6%). Those with RA also have the lowest rate of having at least one ED event (13.8%) while those with dementia have the highest rate (24.3%). Among the demographic characteristics, the ones showing the largest differences by condition are age and gender. Those with dementia are substantially older than the other groups, with only 2.9 percent
89
under age 65 (and eligible due to disability) and over a third (35.1%) over age 85. This is consistent with the age pattern of dementia.
The opposite is true for major depression, with far more of this group being under age 65 (43.1%) than any other group. This may be because depression is a common comorbidity among those with a disability. In addition, although those with COPD, CHF, and diabetes with complication are close to 50 percent men, 50 percent women, the other three groups have far more women than men; over 60 percent of those with dementia and major depression are women, as are 76.4 percent of those with RA. This is not surprising given the higher rates of major depression and RA among women overall (Mayo Clinic, 2009, 2011a) and the fact that women live longer and the rate of dementia increases strongly with age (Mayo Clinic, 2011b).
Finally, those with dementia are far more likely to be accompanied to the doctor (73.6%) than those in other groups (all near or under 50%).
4.4 Multivariate Results
In this section we present our multivariate results on the impact of Part D coverage on drug adherence. Our two primary drug adherence measures, some nonadherence and frequent nonadherence, are based on a series of MCBS survey questions on drug adherence (see Section 4.2.3 for details). A propensity score methodology was used to match the treatment (Part D coverage) and comparison (no drug coverage) groups (see Section 4.2.1 for details), and then logistic regression analysis was used to determine the impact of Part D on drug adherence (see Section 4.2.4 for details).
In Section 4.4.1 we present the propensity score results used to match the treatment and comparison groups. Then in Section 4.4.2 we present the logistic regression model results to estimate the impact of Part D on drug adherence, in Section 4.4.3 we present the estimate of the impact of Part D on inpatient and ED events, and in Section 4.4.4 we present the estimate of the impact of adherence on inpatient and ED events. All tables presented here show only the coefficients on the key variables—Part D and, where applicable, adherence. The full results including all other coefficients for each quintile are shown in tables A4.X-A4.X of the Section 4 Technical Appendix.
4.4.1 Intermediate Results—Propensity Score Methodology
The first step in the propensity score methodology was to estimate a propensity score model. The propensity score model predicts the probability that the beneficiary will have Part D drug coverage versus no drug coverage using sociodemographic, health status, and other beneficiary characteristic variables. The results for the propensity score model are provided in Table A4.1 in Section 4 Technical Appendix.
The second step in the methodology is to assess the overlap in propensity scores between the Part D drug coverage and no drug coverage groups. Figure 4.1 provides a graphical presentation of the propensity score overlap between the Part D coverage and no drug coverage groups. As is evident from the figure, the overlap is fairly good. However, as would be expected, the propensity scores for Part D coverage beneficiaries tend to be clustered at higher propensity score values, whereas the propensity scores for no drug coverage beneficiaries are
90
more spread out between lower and higher propensity score values. There were 35 observations that were not in the overlap, and these were dropped from the analysis.
The next steps in the methodology are to divide the analytic sample into five quintiles based on the propensity scores, and then assess the balance of the variables in each stratum. Table 4.4 presents the standardized bias results, including the number of variables with standardized bias greater than or less than 5 percent (in absolute value). Given the number of variables with standardized bias greater than 5 percent (in absolute value), in the regression models we estimate using this PSA (see Section 4.4.2), we include all of the variables as control variables.
4.4.2 Impact of Part D on Drug Adherence Results
To estimate the impact of Part D on drug adherence, we estimated a logistic regression model separately for each propensity score quintile, and then combined the results to obtain final estimates (see Section 4.2.1 for details). In this section we present the results for the final estimates, and include the complete results as appendices. Table 4.5 shows the logistic regression results of some nonadherence on Part D enrollment and other factors. The first two columns correspond to the model specification that includes a single main effect for Part D (see Equation 4.1), and the remaining columns correspond to the model specification that includes interactions of Part D with each of the study’s six selected chronic conditions (see Equation 4.2).
In Table 4.5, although enrollment in Part D was not significantly related to this adherence measure in the first model specification, the relationship is in the expected direction, with enrollment in Part D decreasing the likelihood of reporting some nonadherence compared to beneficiaries with no drug coverage (odds ratio = 0.79). Interestingly, the results vary across propensity score quintiles, with the odds ratios ranging from 0.19 for the 5th quintile to 1.71 for the 4th quintile. In the second model specification, again enrollment in Part D was not significantly related to this adherence measure. However, in each of the chronic conditions, enrollment in Part D decreased the likelihood of reporting some nonadherence, except for dementia which was more likely (odds ratio = 1.39).
Table 4.6 shows the logistic regression results of frequent nonadherence on Part D enrollment and other factors. Again, the first two columns correspond to the model specification that includes a single main effect for Part D, and the remaining columns correspond to the model specification that includes interactions of Part D with each of the study’s six selected chronic conditions.
As shown in Table 4.6, enrollment in Part D is significantly related to this adherence measure in the first model specification, and the relationship is in the expected direction, with enrollment in Part D decreasing the likelihood of reporting frequent nonadherence compared to beneficiaries with no drug coverage (odds ratio = 0.41, t-statistic = 3.40). These results are consistent across the propensity score quintiles, with odds ratios ranging from 0.12 for the 5th quintile to 0.73 for the 3rd quintile. In the second model specification, this relationship was also in the expected direction for each of the chronic conditions, with those enrolled in Part D being less likely to report frequent nonadherence, with the odds ratios ranging from 0.16 for dementia to 0.92 for major depression. Only two of the six chronic condition odds ratios were statistically
91
significant however (COPD with t-statistic = 2.21 and dementia with t-statistic = 2.30), but this is not surprising given the small sample sizes.
Finally, Table 4.7 shows the relationship between participation in Part D and whether a beneficiary with a given chronic condition filled a prescription for a drug used to treat that condition. Logistic regression models were estimated separately for COPD, CHF, and diabetes with complications (sample size limitations prevented estimation of the other three chronic conditions).
As shown in Table 4.7, among CHF beneficiaries, Part D coverage increases the likelihood of filling at least one prescription to treat that condition. The odds ratio is 2.39 and it is statistically significant (t-statistic = 2.03). The other two chronic conditions have the same pattern, with odds ratios of 1.12 for COPD and 1.17 for diabetes with complications, although neither is statistically significant. In general, these results are consistent with the multivariate results on our primary adherence measures some nonadherence and frequent nonadherence.
4.4.3 Impact of Part D on Inpatient and ED Event Results
Table 4.8 shows the results of the logistic regression of the number of inpatient events on Part D enrollment in the first row. As in the tables showing the impact on adherence, the first two columns show the coefficient and t-statistic of Part D alone, while all subsequent columns show the results for each chronic condition of a second specification that includes interactions of Part D with each chronic condition. Here, we present only the overall results; separate results by quintile are shown in the appendix. In this table, no coefficients are significant at the 5 percent level or even the 10 percent level. Thus, the direct relationship between Part D enrollment and the likelihood of having at least one inpatient event appears to be quite weak if it exists at all. This is not surprising given the very similar rates of hospitalization between the two groups, as shown in the descriptive statistics.
Table 4.9 shows the results of the second stage Poisson regression. Again, the first two columns show the overall results, and the subsequent columns show the interactions with each chronic condition. The first row shows the results for inpatient events. The overall results are not significant at the 5 percent level, but they are significant at the 10 percent level and in the expected direction, indicating that Part D decreases the number of inpatient events, although weakly (the IRR is 0.88 and the t-statistic is 1.72). Also, one of the interactions is significant: that with CHF. This interaction has an IRR of 0.75 and t-statistic of 2.65. Although Part D was not significantly related to the likelihood of having an inpatient event for those with CHF, it was associated with a decreased number of events.
Table 4.8 shows the results of the logistic regression of the number of ED events on Part D enrollment in the second row. Some of these results are very strongly statistically significant, but in the opposite direction from what we would expect. The odds ratio for the full sample is greater than 1 (1.42) and nearly significant at 5% (t-statistic of 1.93). This implies that Part D participation makes having at least one ED event more likely, especially for respondents with COPD. This result strongly implies that despite the efforts to minimize selection bias, it remains and is leading to the possibly false conclusion that Part D has negative effects.
92
Again, Table 4.9 shows the results of the second stage Poisson regression. The results for ED events are in the second row. As in the second stage for inpatient events, although the overall results are far from significant, one of the interactions is significant: that with CHF. This interaction has an IRR of 0.61 and t-statistic of 2.87. Although Part D was associated with a higher likelihood of having an ED event for those some groups, it was associated with a decreased number of events for those with CHF.
4.4.4 Impact of Adherence on Inpatient and ED Event Results
Tables 4.10 and 4.11 show the identical regressions as 4.8 and 4.9, with one exception: the variable “frequent nonadherence” has been added to all of the regressions and to both tables. These results show the impact of adherence on inpatient and ED events when Part D enrollment is controlled for. Overall, the coefficients on Part D remain virtually identical to what they were in the previous tables, largely because frequent nonadherence is not a significant predictor. There is one exception where frequent nonadherence is marginally significant: the regression of the number of inpatient events, among those with at least one inpatient event (coefficient 0.73, t-statistic 1.89). Unfortunately, this coefficient implies that those who report frequent nonadherence have fewer inpatient events. This effect is the opposite direction from what we would expect. However, as it is the only significant coefficient on nonadherence out of all of the regressions presented in tables 4.10 and 4.11, and it is only marginally significant, it is likely to have occurred by chance. The overall conclusion from this section thus remains that we do not see any relationship between drug adherence and either inpatient or ED events.
4.5 Discussion
Analyses of the impact of Part D drug coverage on drug adherence, and of the impact of Part D drug coverage and drug adherence on inpatient and ED events, was conducted on an overall sample of 2,888 MCBS respondents having at least one of the study’s six chronic conditions. The sample was restricted to beneficiaries with Part D drug coverage (treatment group) and no drug coverage (comparison group), along with other sample restrictions (e.g., exclusion of dual Medicare and Medicaid enrollees). A propensity score methodology was used to match the treatment and comparison groups.
In general, both the descriptive and multivariate results lead to the same conclusions. In the study of the impact of Part D on drug adherence, the descriptives show that those enrolled in Part D have higher adherence rates than those with no drug coverage, and the multivariate results suggest that Part D increases adherence rates. This result is clearest for frequent nonadherence, which is twice as common among those without drug coverage than those enrolled in Part D, and the odds ratio on Part D is less than 1 and highly significant (odds ratio = 0.41, t-statistic = 3.40). Based on an average frequent nonadherence rate of 6.5 percent among those with no drug coverage, the interpretation of this odds ratio means there is a 3.7 percentage point decrease in nonadherence due to Part D enrollment. Although these results are somewhat dependent on the measure of adherence used, the very large effect implies that enrolling those with no drug coverage into Part D would greatly increase adherence to the drug regimens prescribed to Medicare beneficiaries.
93
One of the major goals of increasing adherence is to decrease overall health care costs, primarily through decreasing high-cost treatments such as inpatient and ED events. Unfortunately, the descriptive results show that those enrolled in Part D have very similar rates of having an inpatient event as those with no drug coverage, and those in Part D in fact have higher rates of ED events. Again, the multivariate results reinforce this finding, showing little relationship between Part D enrollment and the likelihood of having at least one inpatient event, but that enrollment in Part D increased the likelihood of having at least one ED event. This very counterintuitive result strongly suggests that, despite all of our efforts to minimize selection bias, it strongly remains. The fact that those enrolled in Part D are in worse health, as measured by their RxHCC risk scores, means that failure to properly account for selection bias would cause results to indicate that Part D has negative effects. Thus, the fact that Part D appears to increase ED events indicates that we were unable to disentangle the direct effect of Part D from this negative selection effect. However, this conclusion is softened by the results of the second-stage analysis, which show that, although Part D enrollment was not related to the number of ED events for the overall analytic sample, it was associated with fewer of both types of events among beneficiaries with CHF and (somewhat weakly) associated with fewer inpatient events among the overall sample.
This relationship between Part D and inpatient and ED events remained consistent when a control for level of adherence was added to the analysis, and no relationship was found between adherence and inpatient or ED events in the vast majority of specifications. Thus, our results show some promise for Part D to decrease avoidable utilization, at least in some cases and in some groups. This is consistent with other research showing that better drug adherence can decrease hospitalizations substantially among certain groups (e.g., Murray and colleagues [2009], Tu and colleagues [2005]). This implies that, although Part D has increased adherence, a positive change, this increased adherence likely only translates into decreased utilization for beneficiaries with conditions that respond particularly well to drug treatment—for example, CHF.
A number of characteristics of these data, combined with the fact that drug adherence by its nature is difficult to measure, have resulted in some limitations in our research. One important limitation was the small sample size of the MCBS, which limited the analysis that could be conducted with the less common chronic conditions. Possibly the greatest limitation, however, was that two very important pieces of information were not provided in the MCBS for non-Part D enrollees: an MCBS PDE’s “days supplied” and a “service date” or other indication of when the prescription was filled. Without this information, it was not possible to create an MPR, defined as the ratio of days supplied of prescription drugs divided by total days in the time period. MPR is the preferred measure of adherence and was used in the sections of this report that do not rely on the MCBS.
94
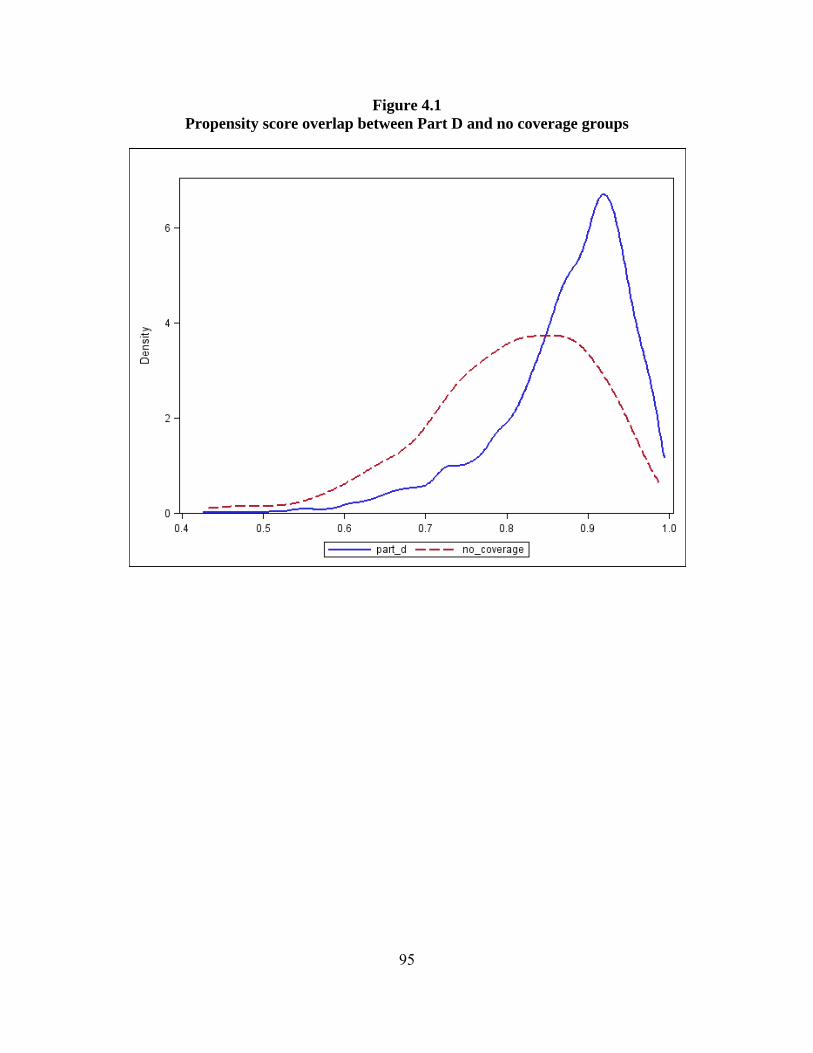
Figure 4.1 Propensity score overlap between Part D and no coverage groups
95
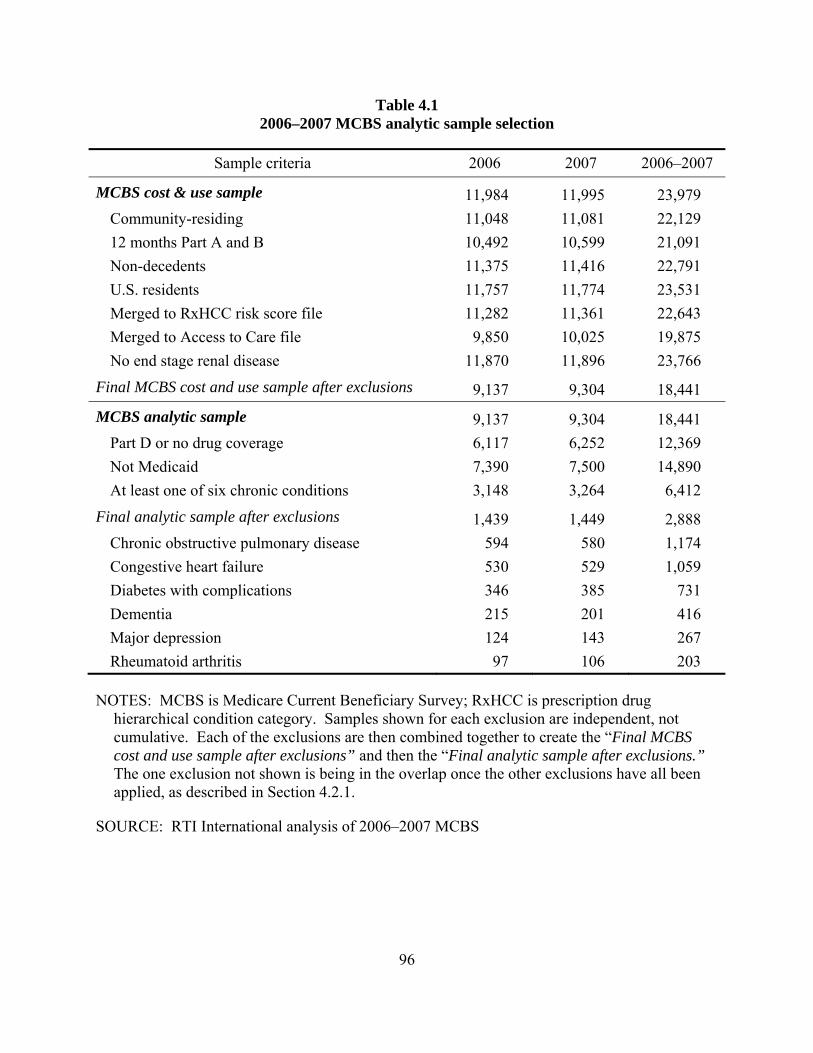
Table 4.1 2006–2007 MCBS analytic sample selection
Sample criteria 2006 2007 2006–2007
MCBS cost & use sample 11,984 11,995 23,979 Community-residing 11,048 11,081 22,129 12 months Part A and B 10,492 10,599 21,091 Non-decedents 11,375 11,416 22,791 U.S. residents 11,757 11,774 23,531 Merged to RxHCC risk score file 11,282 11,361 22,643 Merged to Access to Care file 9,850 10,025 19,875 No end stage renal disease 11,870 11,896 23,766
Final MCBS cost and use sample after exclusions 9,137 9,304 18,441
MCBS analytic sample 9,137 9,304 18,441 Part D or no drug coverage 6,117 6,252 12,369 Not Medicaid 7,390 7,500 14,890 At least one of six chronic conditions 3,148 3,264 6,412
Final analytic sample after exclusions 1,439 1,449 2,888 Chronic obstructive pulmonary disease 594 580 1,174 Congestive heart failure 530 529 1,059 Diabetes with complications 346 385 731 Dementia 215 201 416 Major depression 124 143 267 Rheumatoid arthritis 97 106 203
NOTES: MCBS is Medicare Current Beneficiary Survey; RxHCC is prescription drug hierarchical condition category. Samples shown for each exclusion are independent, not cumulative. Each of the exclusions are then combined together to create the “Final MCBS cost and use sample after exclusions” and then the “Final analytic sample after exclusions.” The one exclusion not shown is being in the overlap once the other exclusions have all been applied, as described in Section 4.2.1.
SOURCE: RTI International analysis of 2006–2007 MCBS
96
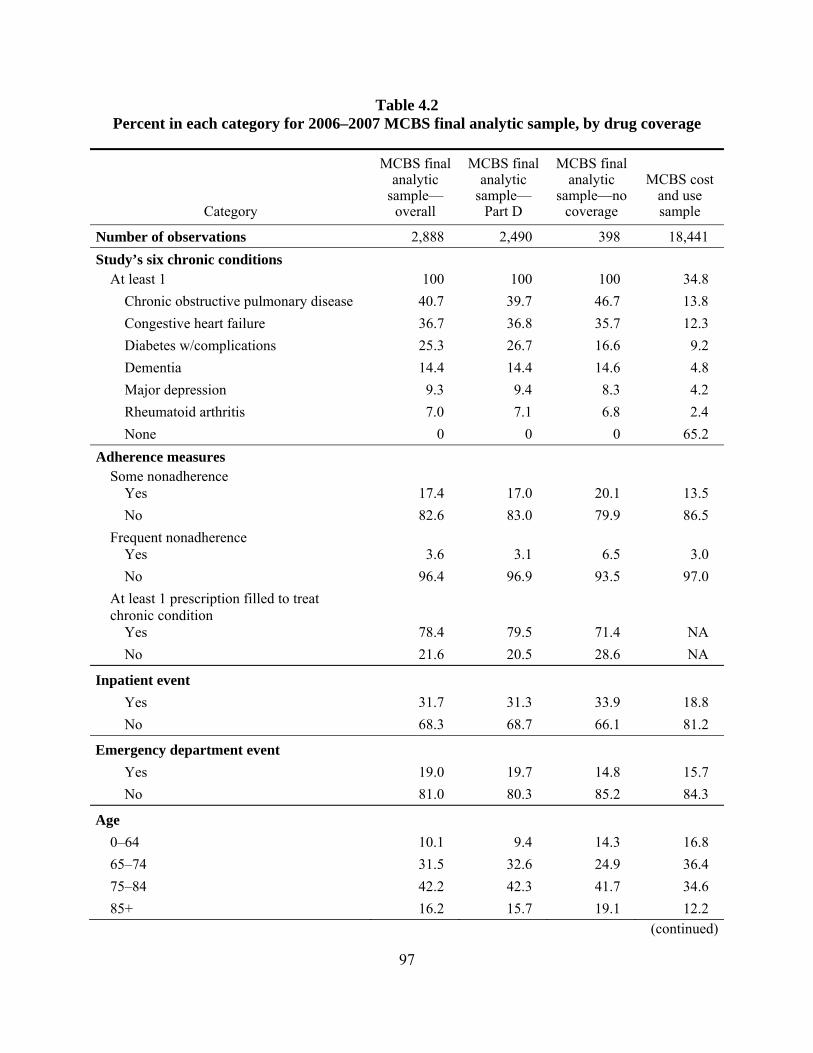
Table 4.2 Percent in each category for 2006–2007 MCBS final analytic sample, by drug coverage
Category
MCBS final analytic
sample—overall
MCBS final analytic
sample— Part D
MCBS final analytic
sample—no coverage
MCBS cost and use sample
Number of observations 2,888 2,490 398 18,441 Study’s six chronic conditions
At least 1 100 100 100 34.8 Chronic obstructive pulmonary disease 40.7 39.7 46.7 13.8 Congestive heart failure 36.7 36.8 35.7 12.3 Diabetes w/complications 25.3 26.7 16.6 9.2 Dementia 14.4 14.4 14.6 4.8 Major depression 9.3 9.4 8.3 4.2 Rheumatoid arthritis 7.0 7.1 6.8 2.4 None 0 0 0 65.2
Adherence measures Some nonadherence
Yes 17.4 17.0 20.1 13.5 No 82.6 83.0 79.9 86.5
Frequent nonadherence Yes 3.6 3.1 6.5 3.0 No 96.4 96.9 93.5 97.0
At least 1 prescription filled to treat chronic condition
Yes 78.4 79.5 71.4 NA No 21.6 20.5 28.6 NA
Inpatient event Yes 31.7 31.3 33.9 18.8 No 68.3 68.7 66.1 81.2
Emergency department event Yes 19.0 19.7 14.8 15.7 No 81.0 80.3 85.2 84.3
Age 0–64 10.1 9.4 14.3 16.8 65–74 31.5 32.6 24.9 36.4 75–84 42.2 42.3 41.7 34.6 85+ 16.2 15.7 19.1 12.2
(continued)
97
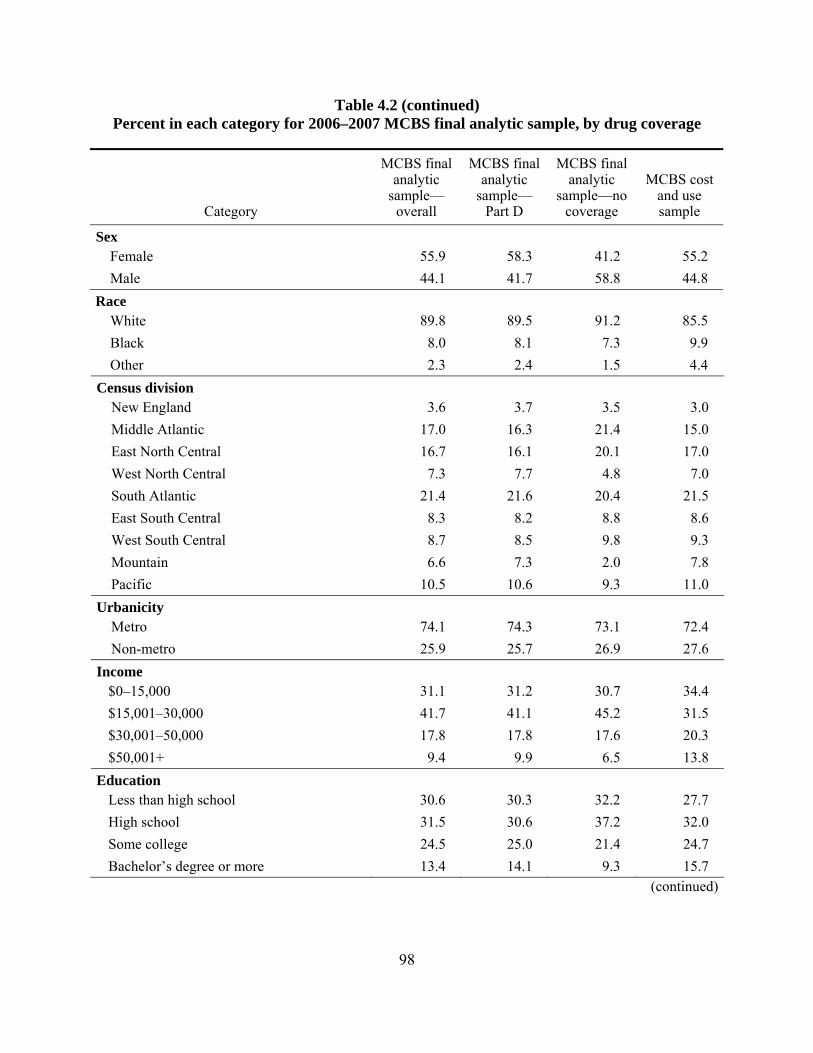
Table 4.2 (continued) Percent in each category for 2006–2007 MCBS final analytic sample, by drug coverage
Category
MCBS final analytic
sample—overall
MCBS final analytic
sample— Part D
MCBS final analytic
sample—no coverage
MCBS cost and use sample
Sex Female 55.9 58.3 41.2 55.2 Male 44.1 41.7 58.8 44.8
Race White 89.8 89.5 91.2 85.5 Black 8.0 8.1 7.3 9.9 Other 2.3 2.4 1.5 4.4
Census division New England 3.6 3.7 3.5 3.0 Middle Atlantic 17.0 16.3 21.4 15.0 East North Central 16.7 16.1 20.1 17.0 West North Central 7.3 7.7 4.8 7.0 South Atlantic 21.4 21.6 20.4 21.5 East South Central 8.3 8.2 8.8 8.6 West South Central 8.7 8.5 9.8 9.3 Mountain 6.6 7.3 2.0 7.8 Pacific 10.5 10.6 9.3 11.0
Urbanicity Metro 74.1 74.3 73.1 72.4 Non-metro 25.9 25.7 26.9 27.6
Income $0–15,000 31.1 31.2 30.7 34.4 $15,001–30,000 41.7 41.1 45.2 31.5 $30,001–50,000 17.8 17.8 17.6 20.3 $50,001+ 9.4 9.9 6.5 13.8
Education Less than high school 30.6 30.3 32.2 27.7 High school 31.5 30.6 37.2 32.0 Some college 24.5 25.0 21.4 24.7 Bachelor’s degree or more 13.4 14.1 9.3 15.7
(continued)
98

Table 4.2 (continued) Percent in each category for 2006–2007 MCBS final analytic sample, by drug coverage
Category
MCBS final analytic
sample—overall
MCBS final analytic
sample—Part D
MCBS final analytic
sample—no coverage
MCBS cost and use sample
Household composition Lives alone 33.7 33.9 32.7 32.1 Doesn’t live alone 66.3 66.1 67.3 68.0
Attitudes toward health care Accompanied to doctor
Yes 47.7 47.5 48.5 39.2 No 52.4 52.5 51.5 60.8
Avoid going to doctor Yes 24.6 24.1 28.1 27.7 No 75.4 75.9 71.9 72.3
Always go to doctor when needed Yes 36.6 37.4 31.7 35.1 No 63.4 62.6 68.3 64.8
RxHCC risk score 0–20% (lowest) 7.9 7.3 11.6 20.1 20–40% 12.1 10.9 19.6 20.1 40–60% 19.2 19.8 15.1 20.1 60–80% 27.2 26.9 28.9 19.9 80–100% (highest) 33.7 35.1 24.9 19.8
MCBS survey year 2006 49.8 49.1 54.5 49.62007 50.2 50.9 45.5 50.5
NOTES: MCBS is Medicare Current Beneficiary Survey; NA is not applicable; RxHCC is prescription drug hierarchical condition category.
SOURCE: RTI International analysis of 2006 and 2007 MCBS
99
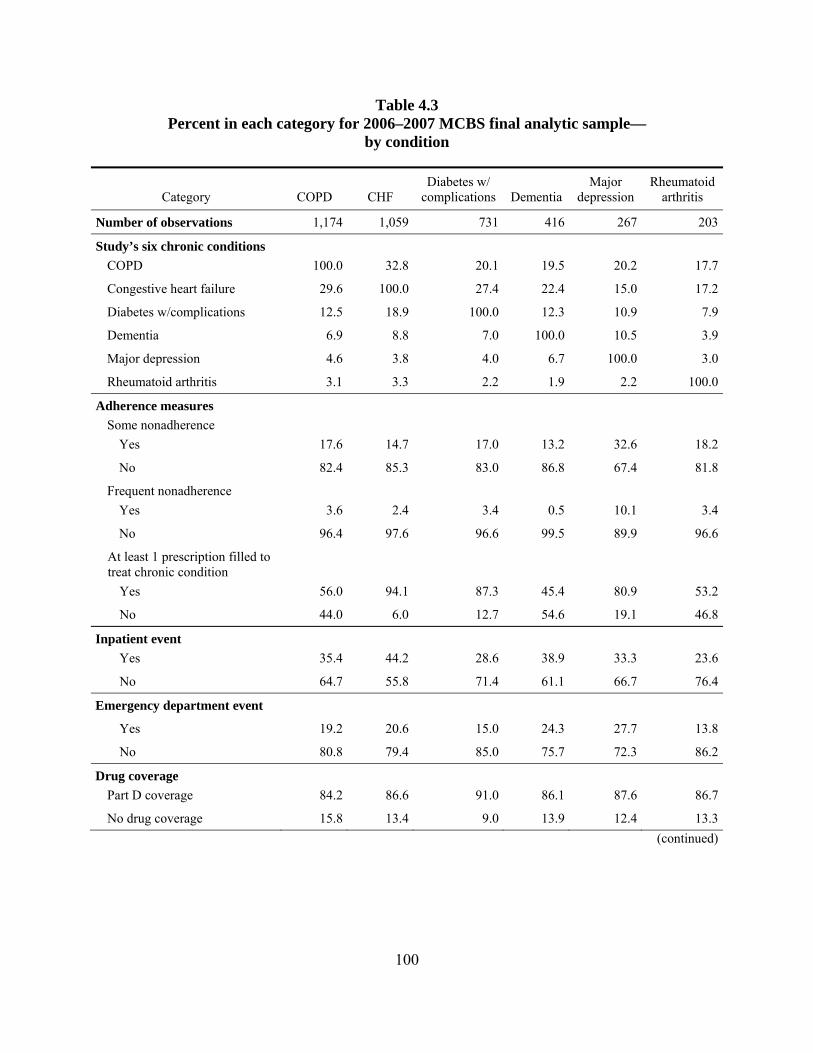
Table 4.3 Percent in each category for 2006–2007 MCBS final analytic sample—
by condition
Category COPD CHF Diabetes w/
complications Dementia Major
depression Rheumatoid
arthritis
Number of observations 1,174 1,059 731 416 267 203
Study’s six chronic conditions COPD 100.0 32.8 20.1 19.5 20.2 17.7
Congestive heart failure 29.6 100.0 27.4 22.4 15.0 17.2
Diabetes w/complications 12.5 18.9 100.0 12.3 10.9 7.9
Dementia 6.9 8.8 7.0 100.0 10.5 3.9
Major depression 4.6 3.8 4.0 6.7 100.0 3.0
Rheumatoid arthritis 3.1 3.3 2.2 1.9 2.2 100.0
Adherence measures Some nonadherence
Yes 17.6 14.7 17.0 13.2 32.6 18.2
No 82.4 85.3 83.0 86.8 67.4 81.8
Frequent nonadherence Yes 3.6 2.4 3.4 0.5 10.1 3.4
No 96.4 97.6 96.6 99.5 89.9 96.6
At least 1 prescription filled to treat chronic condition
Yes 56.0 94.1 87.3 45.4 80.9 53.2
No 44.0 6.0 12.7 54.6 19.1 46.8
Inpatient event Yes 35.4 44.2 28.6 38.9 33.3 23.6
No 64.7 55.8 71.4 61.1 66.7 76.4
Emergency department event
Yes 19.2 20.6 15.0 24.3 27.7 13.8
No 80.8 79.4 85.0 75.7 72.3 86.2
Drug coverage Part D coverage 84.2 86.6 91.0 86.1 87.6 86.7
No drug coverage 15.8 13.4 9.0 13.9 12.4 13.3(continued)
100
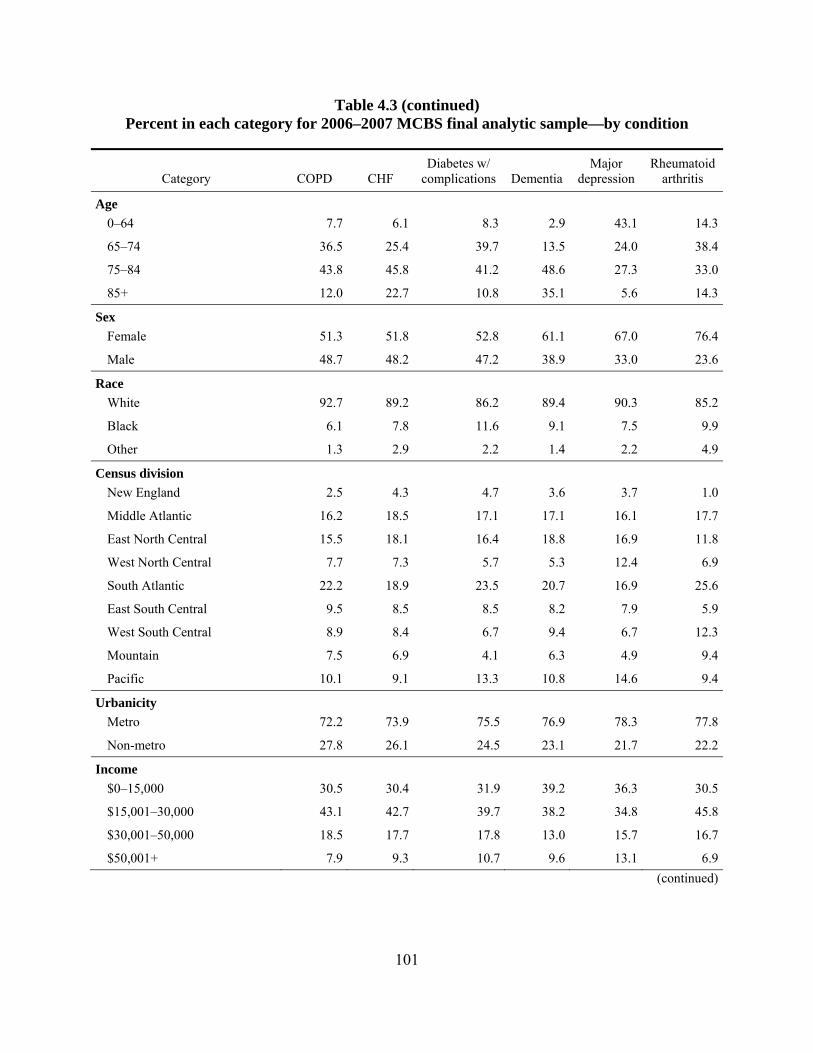
Table 4.3 (continued) Percent in each category for 2006–2007 MCBS final analytic sample—by condition
Category COPD CHF Diabetes w/
complications Dementia Major
depression Rheumatoid
arthritis
Age 0–64 7.7 6.1 8.3 2.9 43.1 14.3
65–74 36.5 25.4 39.7 13.5 24.0 38.4
75–84 43.8 45.8 41.2 48.6 27.3 33.0
85+ 12.0 22.7 10.8 35.1 5.6 14.3
Sex Female 51.3 51.8 52.8 61.1 67.0 76.4
Male 48.7 48.2 47.2 38.9 33.0 23.6
Race White 92.7 89.2 86.2 89.4 90.3 85.2
Black 6.1 7.8 11.6 9.1 7.5 9.9
Other 1.3 2.9 2.2 1.4 2.2 4.9
Census division New England 2.5 4.3 4.7 3.6 3.7 1.0
Middle Atlantic 16.2 18.5 17.1 17.1 16.1 17.7
East North Central 15.5 18.1 16.4 18.8 16.9 11.8
West North Central 7.7 7.3 5.7 5.3 12.4 6.9
South Atlantic 22.2 18.9 23.5 20.7 16.9 25.6
East South Central 9.5 8.5 8.5 8.2 7.9 5.9
West South Central 8.9 8.4 6.7 9.4 6.7 12.3
Mountain 7.5 6.9 4.1 6.3 4.9 9.4
Pacific 10.1 9.1 13.3 10.8 14.6 9.4
Urbanicity Metro 72.2 73.9 75.5 76.9 78.3 77.8
Non-metro 27.8 26.1 24.5 23.1 21.7 22.2
Income $0–15,000 30.5 30.4 31.9 39.2 36.3 30.5
$15,001–30,000 43.1 42.7 39.7 38.2 34.8 45.8
$30,001–50,000 18.5 17.7 17.8 13.0 15.7 16.7
$50,001+ 7.9 9.3 10.7 9.6 13.1 6.9(continued)
101
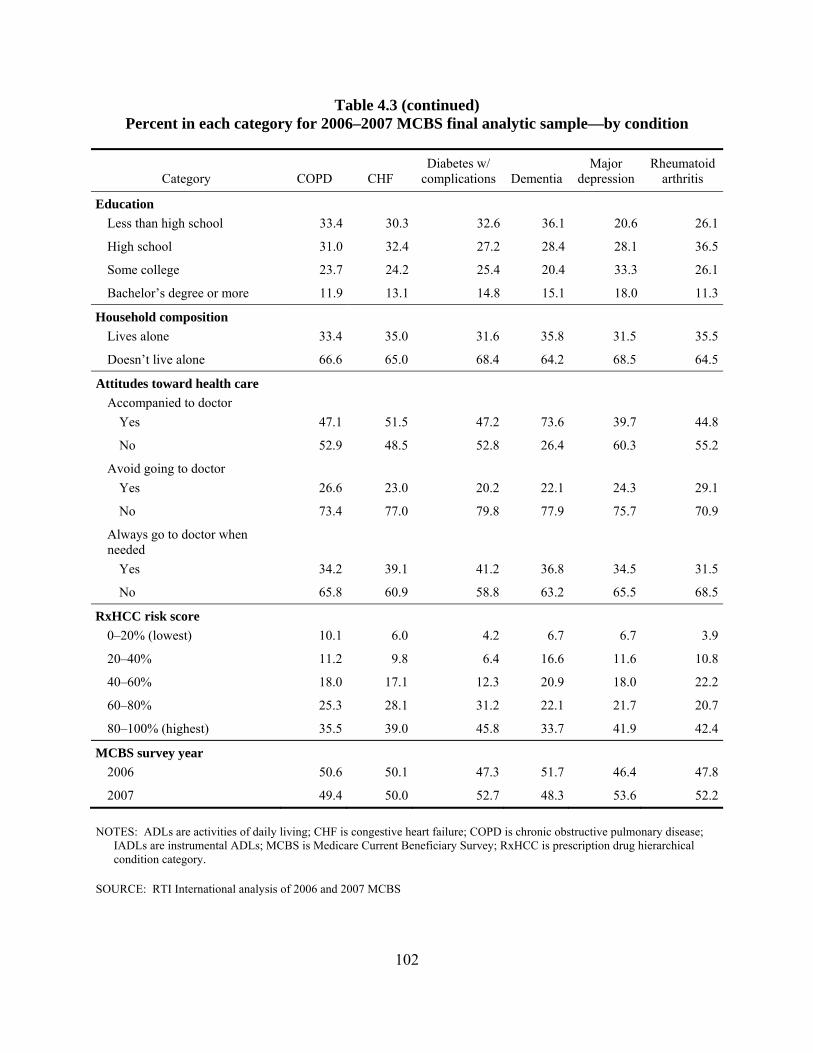
Table 4.3 (continued) Percent in each category for 2006–2007 MCBS final analytic sample—by condition
Category COPD CHF Diabetes w/
complications Dementia Major
depression Rheumatoid
arthritis
Education Less than high school 33.4 30.3 32.6 36.1 20.6 26.1
High school 31.0 32.4 27.2 28.4 28.1 36.5
Some college 23.7 24.2 25.4 20.4 33.3 26.1
Bachelor’s degree or more 11.9 13.1 14.8 15.1 18.0 11.3
Household composition Lives alone 33.4 35.0 31.6 35.8 31.5 35.5
Doesn’t live alone 66.6 65.0 68.4 64.2 68.5 64.5
Attitudes toward health care Accompanied to doctor
Yes 47.1 51.5 47.2 73.6 39.7 44.8
No 52.9 48.5 52.8 26.4 60.3 55.2
Avoid going to doctor Yes 26.6 23.0 20.2 22.1 24.3 29.1
No 73.4 77.0 79.8 77.9 75.7 70.9
Always go to doctor when needed
Yes 34.2 39.1 41.2 36.8 34.5 31.5
No 65.8 60.9 58.8 63.2 65.5 68.5
RxHCC risk score 0–20% (lowest) 10.1 6.0 4.2 6.7 6.7 3.9
20–40% 11.2 9.8 6.4 16.6 11.6 10.8
40–60% 18.0 17.1 12.3 20.9 18.0 22.2
60–80% 25.3 28.1 31.2 22.1 21.7 20.7
80–100% (highest) 35.5 39.0 45.8 33.7 41.9 42.4
MCBS survey year 2006 50.6 50.1 47.3 51.7 46.4 47.8
2007 49.4 50.0 52.7 48.3 53.6 52.2
NOTES: ADLs are activities of daily living; CHF is congestive heart failure; COPD is chronic obstructive pulmonary disease; IADLs are instrumental ADLs; MCBS is Medicare Current Beneficiary Survey; RxHCC is prescription drug hierarchical condition category.
SOURCE: RTI International analysis of 2006 and 2007 MCBS
102
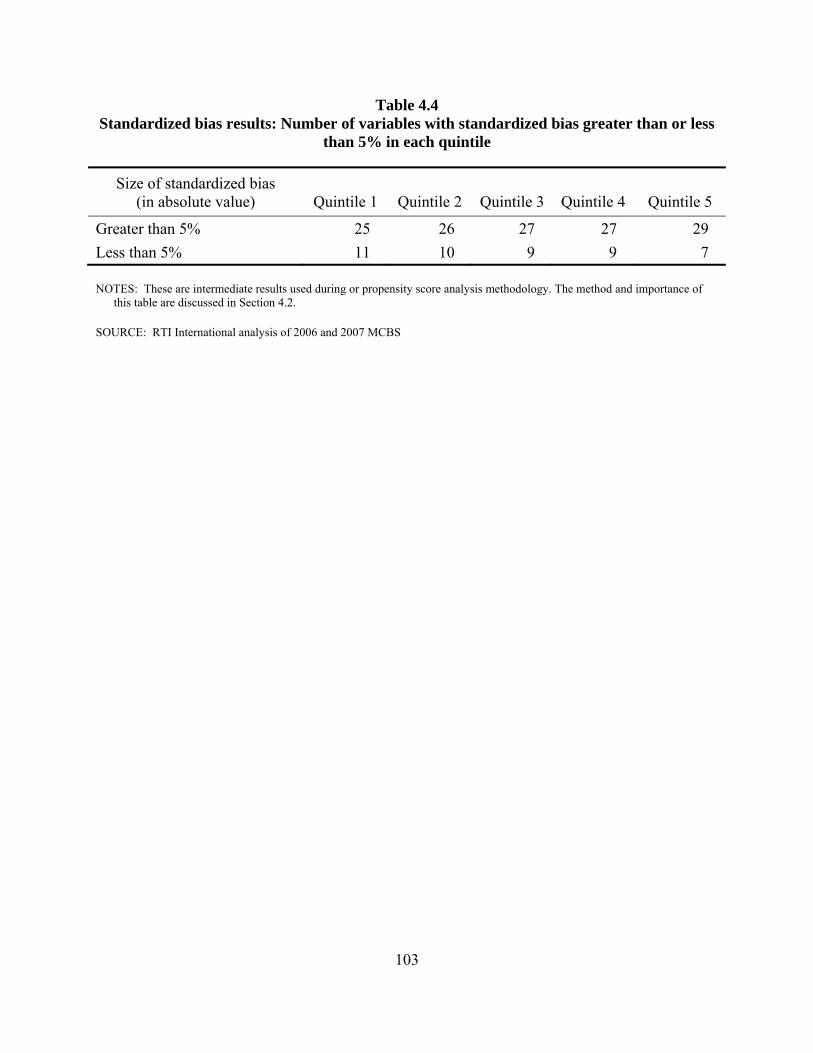
Table 4.4 Standardized bias results: Number of variables with standardized bias greater than or less
than 5% in each quintile
Size of standardized bias (in absolute value) Quintile 1 Quintile 2 Quintile 3 Quintile 4 Quintile 5
Greater than 5% 25 26 27 27 29 Less than 5% 11 10 9 9 7
NOTES: These are intermediate results used during or propensity score analysis methodology. The method and importance of this table are discussed in Section 4.2.
SOURCE: RTI International analysis of 2006 and 2007 MCBS
103
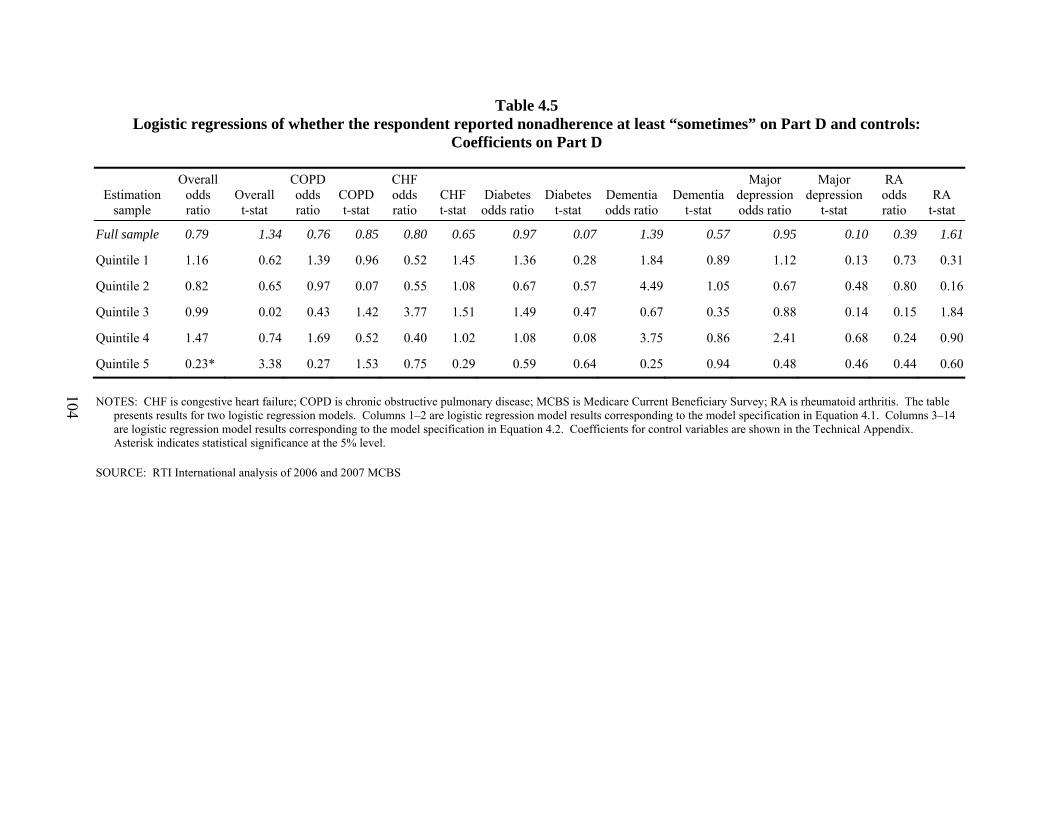
Table 4.5 Logistic regressions of whether the respondent reported nonadherence at least “sometimes” on Part D and controls:
Coefficients on Part D
Estimation sample
Overall odds ratio
Overall t-stat
COPD odds ratio
COPD t-stat
CHF odds ratio
CHF t-stat
Diabetes odds ratio
Diabetes t-stat
Dementia odds ratio
Dementia t-stat
Major depression odds ratio
Major depression
t-stat
RA odds ratio
RA t-stat
Full sample 0.79 1.34 0.76 0.85 0.80 0.65 0.97 0.07 1.39 0.57 0.95 0.10 0.39 1.61
Quintile 1 1.16 0.62 1.39 0.96 0.52 1.45 1.36 0.28 1.84 0.89 1.12 0.13 0.73 0.31
Quintile 2 0.82 0.65 0.97 0.07 0.55 1.08 0.67 0.57 4.49 1.05 0.67 0.48 0.80 0.16
Quintile 3 0.99 0.02 0.43 1.42 3.77 1.51 1.49 0.47 0.67 0.35 0.88 0.14 0.15 1.84
Quintile 4 1.47 0.74 1.69 0.52 0.40 1.02 1.08 0.08 3.75 0.86 2.41 0.68 0.24 0.90
Quintile 5 0.23* 3.38 0.27 1.53 0.75 0.29 0.59 0.64 0.25 0.94 0.48 0.46 0.44 0.60
NOTES: CHF is congestive heart failure; COPD is chronic obstructive pulmonary disease; MCBS is Medicare Current Beneficiary Survey; RA is rheumatoid arthritis. The table presents results for two logistic regression models. Columns 1–2 are logistic regression model results corresponding to the model specification in Equation 4.1. Columns 3–14 are logistic regression model results corresponding to the model specification in Equation 4.2. Coefficients for control variables are shown in the Technical Appendix. Asterisk indicates statistical significance at the 5% level.
SOURCE: RTI International analysis of 2006 and 2007 MCBS
104
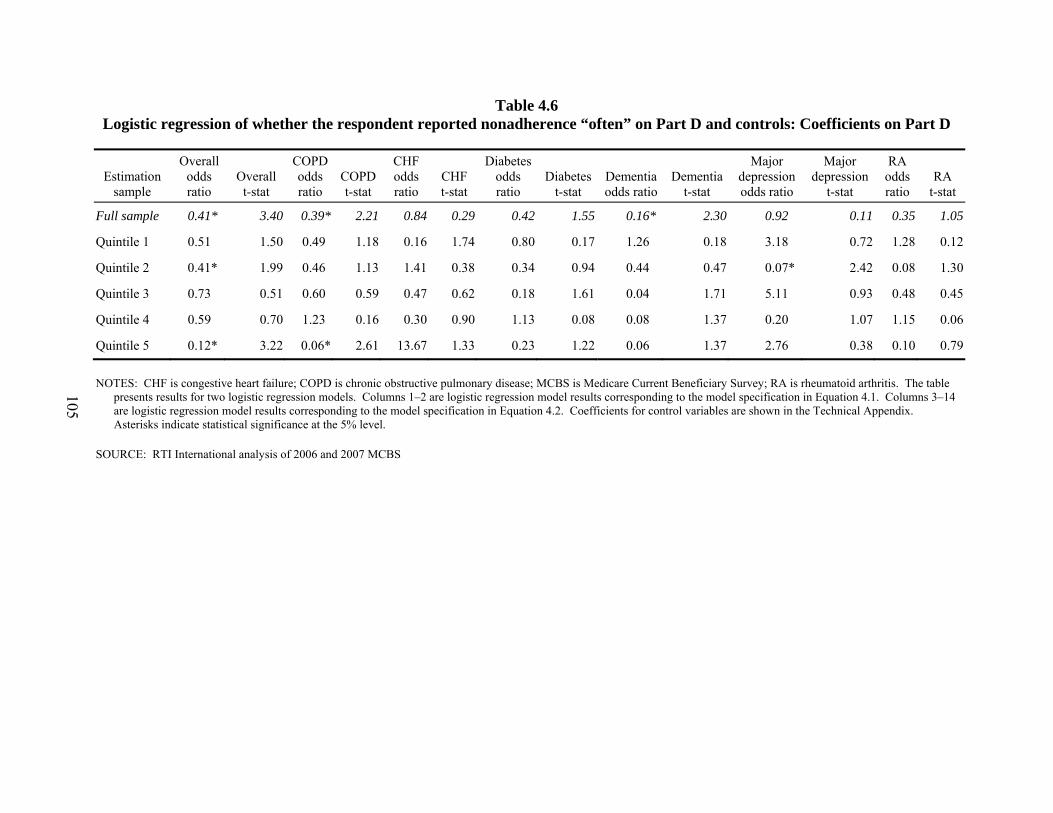
Table 4.6 Logistic regression of whether the respondent reported nonadherence “often” on Part D and controls: Coefficients on Part D
Estimation sample
Overall odds ratio
Overall t-stat
COPD odds ratio
COPD t-stat
CHF odds ratio
CHF t-stat
Diabetes odds ratio
Diabetes t-stat
Dementia odds ratio
Dementia t-stat
Major depression odds ratio
Major depression
t-stat
RA odds ratio
RA t-stat
Full sample 0.41* 3.40 0.39* 2.21 0.84 0.29 0.42 1.55 0.16* 2.30 0.92 0.11 0.35 1.05
Quintile 1 0.51 1.50 0.49 1.18 0.16 1.74 0.80 0.17 1.26 0.18 3.18 0.72 1.28 0.12
Quintile 2 0.41* 1.99 0.46 1.13 1.41 0.38 0.34 0.94 0.44 0.47 0.07* 2.42 0.08 1.30
Quintile 3 0.73 0.51 0.60 0.59 0.47 0.62 0.18 1.61 0.04 1.71 5.11 0.93 0.48 0.45
Quintile 4 0.59 0.70 1.23 0.16 0.30 0.90 1.13 0.08 0.08 1.37 0.20 1.07 1.15 0.06
Quintile 5 0.12* 3.22 0.06* 2.61 13.67 1.33 0.23 1.22 0.06 1.37 2.76 0.38 0.10 0.79
NOTES: CHF is congestive heart failure; COPD is chronic obstructive pulmonary disease; MCBS is Medicare Current Beneficiary Survey; RA is rheumatoid arthritis. The table presents results for two logistic regression models. Columns 1–2 are logistic regression model results corresponding to the model specification in Equation 4.1. Columns 3–14 are logistic regression model results corresponding to the model specification in Equation 4.2. Coefficients for control variables are shown in the Technical Appendix. Asterisks indicate statistical significance at the 5% level.
SOURCE: RTI International analysis of 2006 and 2007 MCBS
105
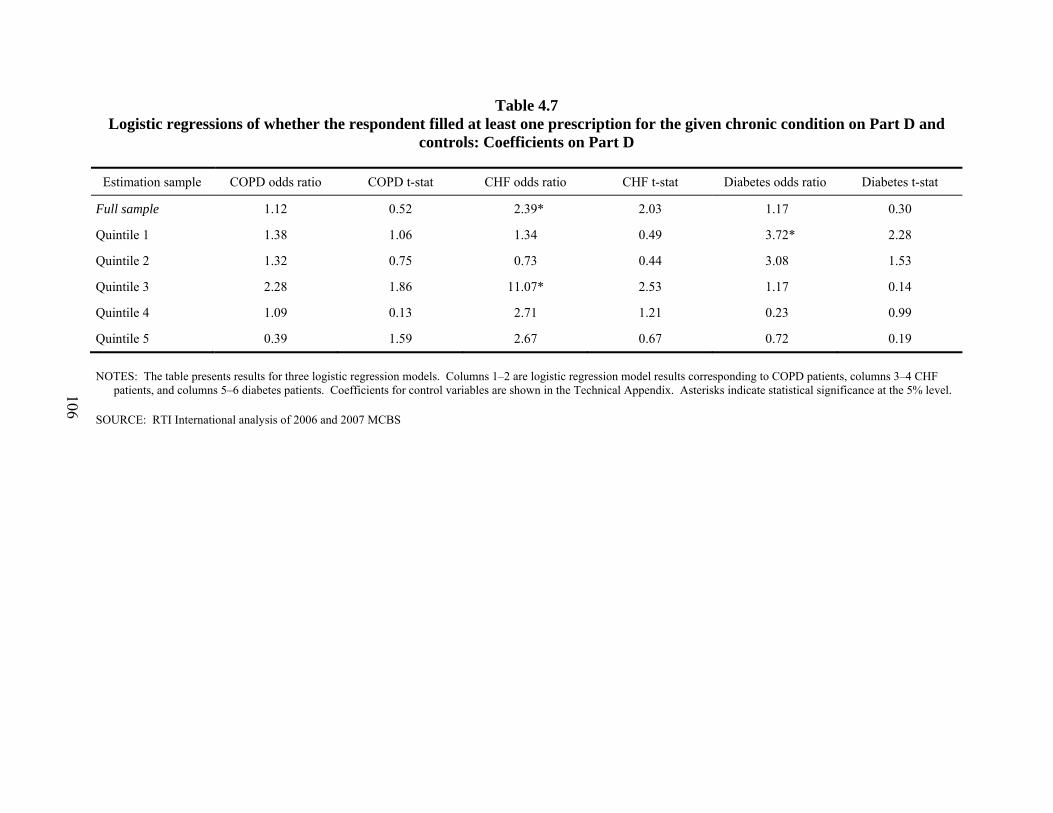
Table 4.7 Logistic regressions of whether the respondent filled at least one prescription for the given chronic condition on Part D and
controls: Coefficients on Part D
Estimation sample COPD odds ratio COPD t-stat CHF odds ratio CHF t-stat Diabetes odds ratio Diabetes t-stat
Full sample 1.12 0.52 2.39* 2.03 1.17 0.30
Quintile 1 1.38 1.06 1.34 0.49 3.72* 2.28
Quintile 2 1.32 0.75 0.73 0.44 3.08 1.53
Quintile 3 2.28 1.86 11.07* 2.53 1.17 0.14
Quintile 4 1.09 0.13 2.71 1.21 0.23 0.99
Quintile 5 0.39 1.59 2.67 0.67 0.72 0.19
NOTES: The table presents results for three logistic regression models. Columns 1–2 are logistic regression model results corresponding to COPD patients, columns 3–4 CHF patients, and columns 5–6 diabetes patients. Coefficients for control variables are shown in the Technical Appendix. Asterisks indicate statistical significance at the 5% level.
SOURCE: RTI International analysis of 2006 and 2007 MCBS
106
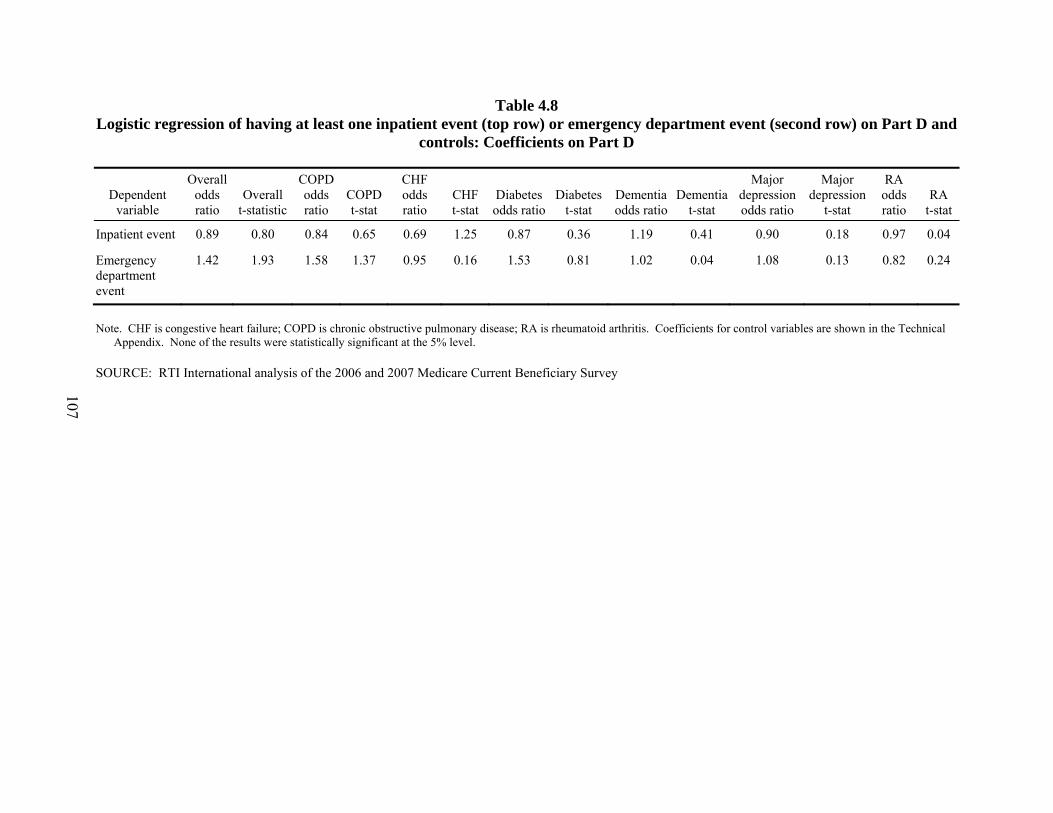
Table 4.8 Logistic regression of having at least one inpatient event (top row) or emergency department event (second row) on Part D and
controls: Coefficients on Part D
Dependent variable
Overall odds ratio
Overall t-statistic
COPD odds ratio
COPD t-stat
CHF odds ratio
CHF t-stat
Diabetes odds ratio
Diabetes t-stat
Dementia odds ratio
Dementia t-stat
Major depression odds ratio
Major depression
t-stat
RA odds ratio
RA t-stat
Inpatient event 0.89 0.80 0.84 0.65 0.69 1.25 0.87 0.36 1.19 0.41 0.90 0.18 0.97 0.04
Emergency department event
1.42 1.93 1.58 1.37 0.95 0.16 1.53 0.81 1.02 0.04 1.08 0.13 0.82 0.24
Note. CHF is congestive heart failure; COPD is chronic obstructive pulmonary disease; RA is rheumatoid arthritis. Coefficients for control variables are shown in the Technical Appendix. None of the results were statistically significant at the 5% level.
SOURCE: RTI International analysis of the 2006 and 2007 Medicare Current Beneficiary Survey
107
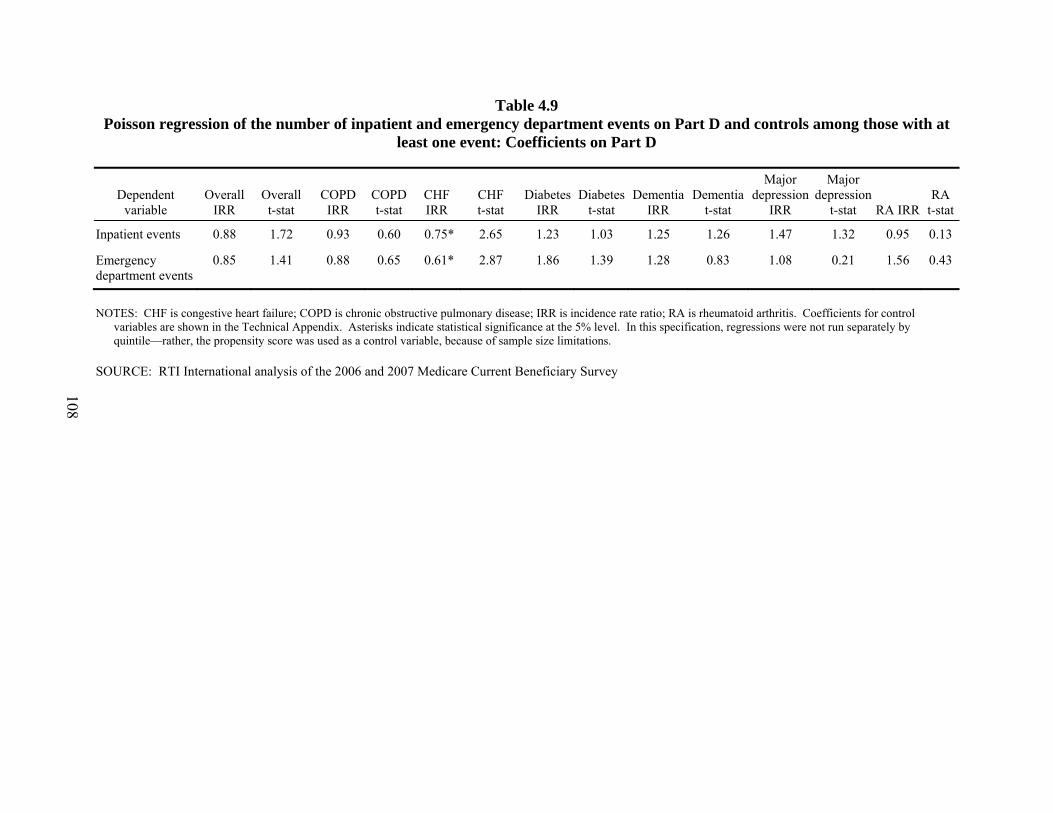
Table 4.9 Poisson regression of the number of inpatient and emergency department events on Part D and controls among those with at
least one event: Coefficients on Part D
Dependent variable
Overall IRR
Overall t-stat
COPD IRR
COPD t-stat
CHF IRR
CHF t-stat
Diabetes IRR
Diabetes t-stat
Dementia IRR
Dementia t-stat
Major depression
IRR
Major depression
t-stat RA IRRRA
t-stat
Inpatient events 0.88 1.72 0.93 0.60 0.75* 2.65 1.23 1.03 1.25 1.26 1.47 1.32 0.95 0.13
Emergency department events
0.85 1.41 0.88 0.65 0.61* 2.87 1.86 1.39 1.28 0.83 1.08 0.21 1.56 0.43
NOTES: CHF is congestive heart failure; COPD is chronic obstructive pulmonary disease; IRR is incidence rate ratio; RA is rheumatoid arthritis. Coefficients for control variables are shown in the Technical Appendix. Asterisks indicate statistical significance at the 5% level. In this specification, regressions were not run separately by quintile—rather, the propensity score was used as a control variable, because of sample size limitations.
SOURCE: RTI International analysis of the 2006 and 2007 Medicare Current Beneficiary Survey
108
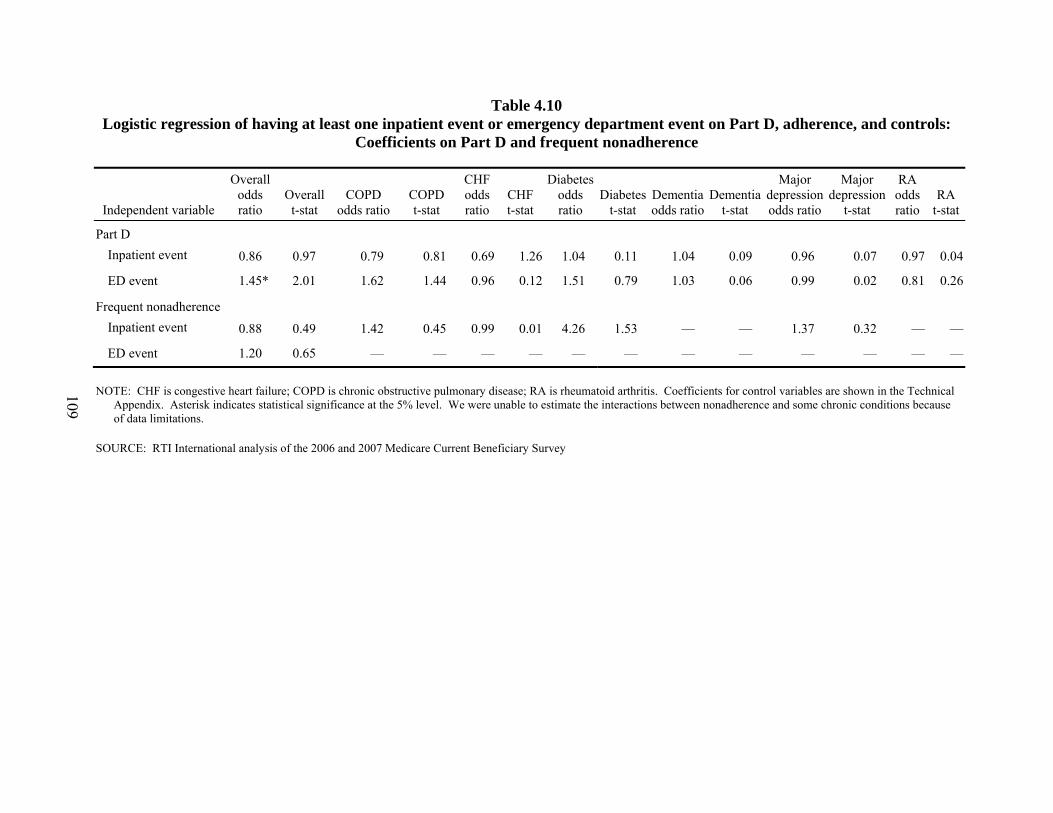
Table 4.10 Logistic regression of having at least one inpatient event or emergency department event on Part D, adherence, and controls:
Coefficients on Part D and frequent nonadherence
Independent variable
Overall odds ratio
Overall t-stat
COPD odds ratio
COPD t-stat
CHF odds ratio
CHF t-stat
Diabetes odds ratio
Diabetes t-stat
Dementia odds ratio
Dementia t-stat
Major depression odds ratio
Major depression
t-stat
RA odds ratio
RA t-stat
Part D Inpatient event 0.86 0.97 0.79 0.81 0.69 1.26 1.04 0.11 1.04 0.09 0.96 0.07 0.97 0.04
ED event 1.45* 2.01 1.62 1.44 0.96 0.12 1.51 0.79 1.03 0.06 0.99 0.02 0.81 0.26
Frequent nonadherence Inpatient event 0.88 0.49 1.42 0.45 0.99 0.01 4.26 1.53 — — 1.37 0.32 — —
ED event 1.20 0.65 — — — — — — — — — — — —
NOTE: CHF is congestive heart failure; COPD is chronic obstructive pulmonary disease; RA is rheumatoid arthritis. Coefficients for control variables are shown in the Technical Appendix. Asterisk indicates statistical significance at the 5% level. We were unable to estimate the interactions between nonadherence and some chronic conditions because of data limitations.
SOURCE: RTI International analysis of the 2006 and 2007 Medicare Current Beneficiary Survey
109

Table 4.11 Poisson regression of the number of inpatient and emergency department events on Part D, adherence and controls among
those with at least one event: Coefficients on Part D and frequent nonadherence
Independent and dependent variables
Overall IRR
Overall t-stat
COPD IRR
COPD t-stat
CHF IRR
CHF t-stat
Diabetes IRR
Diabetes t-stat
Dementia IRR
Dementia t-stat
Major depression
IRR
Major depression
t-stat RA IRRRA
t-stat
Part D Inpatient events 0.87 1.91 0.93 0.64 0.75* 2.62 1.20 0.91 1.25 1.23 1.41 1.14 0.95 0.15
Emergency department events
0.84 1.42 0.89 0.63 0.61* 2.82 1.84 1.33 1.27 0.82 1.08 0.23 1.53 0.40
Frequent nonadherence Inpatient events 0.73 1.89 0.99 0.05 0.78 0.80 0.79 0.62 — — 0.73 0.85 1.30 0.41
Emergency department events
0.83 0.94 0.92 0.26 0.89 0.24 1.03 0.05 — — 0.83 0.58 1.26 0.38
NOTES: CHF is congestive heart failure; COPD is chronic obstructive pulmonary disease; IRR is incidence rate ratio; RA is rheumatoid arthritis. Coefficients for control variables are shown in the Technical Appendix. Asterisks indicate statistical significance at the 5% level. In this specification, regressions were not run separately by quintile—rather, the propensity score was used as a control variable, because of sample size limitations.
SOURCE: RTI International analysis of the 2006 and 2007 Medicare Current Beneficiary Survey
110
SECTION 5 IMPACT OF PART D ON MEDICARE SPENDING AND UTILIZATION, 2005–2008
5.1 Introduction
The question addressed in this analysis is this: What is the impact of Part D on health outcomes and health care utilization and costs for beneficiaries with chronic conditions? The approach compares the utilization of services in 2008, the third program year, to the base year, 2005, before the program started. The measures to be examined for effects were inpatient hospital spending and use of the hospital emergency department (ED). By controlling for many factors that affect utilization, we estimated the effect of Part D for five of the six disease classes that are the subject of this report.
In the first of these reports, covering 2006, we had studied Medicare beneficiaries irrespective of health status. The sample was based on a 5 percent sample of beneficiaries. With a wide range of health statuses in the study, the effects of Part D were not expected to be easy to detect, and mixed results were found. The late enrollment of a portion of the population in 2006 also would tend to reduce any observable effects in that year. Because the benefits of drug therapies often take time to manifest themselves, we have looked further out from the implementation year. Our last study reported on comparing 2007 to 2005 and in this report we go out to the third year, 2008. This work and that for 2007 use 100 percent samples concentrated on people with known chronic diseases with drug treatments.
In the 2007 and 2008 studies, the probability of detecting a Part D effect was enhanced. The conditions studied were chronic obstructive pulmonary disease (COPD), congestive heart failure (CHF), diabetes with complications, major depression, and rheumatoid arthritis (RA). We compare changes that occurred over time for Part D enrollees with changes for nonenrollees in a population, excluding low-income subsidized enrollees, most of whom had drug coverage through Medicaid in 2005 as well as the study years.
The effect of Part D is addressed with the following specific questions for each disease cohort:
• Did Part D affect the probability of having at least one inpatient stay?
• Did Part D affect the probability of at least one ED visit?
• Did Part D affect the Medicare costs for inpatient stays for those who had a stay?
• Did Part D affect the number of ED visits for those who had a visit?
In addition to these basic questions, the analysis was formulated to test whether the duration of enrollment in Part D varied in effect on the program.
111
The findings in brief are as follows:
• Although statistically significant for most conditions, the change in the probability of having at least one inpatient stay was reduced by only a few tenths of a percentage point. The effect varied with duration of enrollment.
• The effects for the probability of at least one ED visit were of the same magnitude. The variation with enrollment duration was similar to that of inpatient stays.
• The effect of enrollment and duration on inpatient spending for those with hospital admissions was to increase spending for most of the cohorts. The increase declined as enrollment duration increased. The explanation for this is not apparent. There may be a number of confounding factors.
• For those who used the ED, the number of visits decreased by 2 percent or less for COPD and CHF, less than 1 percent for diabetes with complications, and by no statistically significant amount for the other two disease cohorts.
• The pattern of effects on utilization indicated that, over the longer time observed in the 2008 study than earlier work, the effect of the program increased and tended to plateau after 2 years of enrollment duration.
The effects estimated are small, as they were in the earlier study of the 2005–2007 comparison. It is important to note that the effect measured is that of enrollment in the Part D program, not the effect of drugs. Access to drugs may be improved by enrollment in the program, but the extent of the purchase of drugs in 2005, before Part D, is not known. The comparison group is one of no known drug coverage, not necessarily persons with no drug coverage. The degree to which the comparison group is self-funding drug purchases is also not known. All the people in the study, enrollees and nonenrollees, were matched on their diagnosis group.
5.2 Data
This analysis incorporated data on Medicare fee-for-service (FFS) beneficiaries who were not low income by the definitions used by the program. Most of the low-income beneficiaries were auto-enrolled into the Part D program in 2006, 2007, and 2008, and the enrollment was confounded with the time effect. The low-income beneficiaries who were in the Part D category of “Deemed,” based on State data for people receiving Medicaid or assistance with paying for Medicare, are the vast majority of the low-income population who receive a subsidy. The pharmacy benefit under Medicaid continued under Part D, so there was no significant coverage change for this group. Their utilization of Part A and B services was also quite different from those who are not officially low income, making any use of this group as a contrast to determine the Part D effect a dubious effort.
To have sufficient sample size for the subpopulations in the study, we used Medicare 100 percent eligibility and claims data for each year. Subsets and exclusions were made from
112
this point. The basic criteria used in defining the analytic populations for prediction years 2005 and 2008 are listed below. The term “base year” refers to the year before the prediction year.
• Both Part A and B coverage for 12 months in the base and prediction years.
• No Medicare Advantage (MA) plan enrollment in the base and prediction years.
• No Medicare Secondary Payer status in either year.
• No Deemed, other low-income subsidy status, or Medicaid buy-in months.
• No beneficiaries with a status of end-stage renal disease.
• United States resident for all years.
• No decedents.
These criteria were intended to ensure that we have complete information on each beneficiary with respect to characteristics, such as diagnoses and spending. The end-stage renal disease population was omitted because this condition can have utilization effects that overwhelm the effects of each of the study conditions. Elimination of decedents makes the 2 years in each study more homogeneous; it also eliminates beneficiaries whose disease may have been too advanced for the access to drugs to make a significant difference. The observation period is the same for all beneficiaries, removing another complicating effect.
The data used for the dependent variables were the Inpatient claims files for inpatient spending and the Outpatient claims files for hospital outpatient claims, with ED usage determined by the presence of revenue codes for ED use. To be able to study the subpopulation with the study diseases, it was necessary to start with 100 percent of the population and claims and then subset to the study groups. The independent control variables were demographic information from the Medicare Enrollment Data Base (EDB) and Denominator files, Part D enrollment and other drug coverage in the Common Medicare Environment (CME) files, and disease markers in risk adjustment files originally created for payment of MA plans. Because the disease markers for dementia were not in the risk adjustment files for 2005, that cohort was not studied in this analysis.
5.2.1 Definition of Disease Groups
Because data were needed from 2004 through 2008, uniform definitions of medical conditions were needed. The use of the most recent and refined version of the conditions could not easily be used, particularly for 2004. By allowing some broadening of some of the conditions to the level of the Version 12 hierarchical condition categories (HCCs), we were able to use the same condition clusters in all years. The definitions of the study groups are as follows:
• COPD—HCC108. This includes COPD and some pulmonary hypertension cases. Use of this definition excludes the few people with cystic fibrosis from this group.
113
• CHF—HCC80. This is congestive heart failure.
• Diabetes with complications—this includes diabetes diagnosis codes that indicate renal, vascular, neurological, ophthalmologic, and acute complications (HCCs 15–18). The beneficiaries coded with uncomplicated diabetes are excluded.
• Dementia—this group was excluded from the HCC model used and was not included in these analyses.
• Major depression—HCC55. This group includes major depression, bipolar, and paranoid disorders. The large majority are coded with major depression. Limiting to this group excluded people with mental disorders such as schizophrenia.
• RA—HCC38. This group does include people with similarly treated inflammatory conditions and some rare conditions such as Behçet’s.
Although these definitions are a bit broader than those used in Section 3, for this kind of analysis the effects are minor. A few more codes from the International Classification of Diseases, 9th edition, Clinical Modification (ICD-9-CM) are admitted to the grouping definitions. These are much narrower groups than the population as a whole and are all chronic conditions treated with drugs. They are suited as indicators for the effects of Part D on such subgroups.
Table 5.1 presents selected utilization statistics on the five disease populations for the 2 years. Even though these are two similar cross-sections of Medicare beneficiaries, the population averaged a few months older in 2008. The advent of Part D resulted in a move from traditional FFS to MA plans because drug premiums were subsidized in MA prescription drug plans by rebates from the MA nondrug part of the program. Typically, older beneficiaries are more reluctant to move from FFS than younger beneficiaries. The following are selected observations concerning the populations.
• CHF is the highest inpatient expenditure group. The order in 2005 was CHF ($5,128), diabetes with complications ($4,228), and COPD ($3,992). The mean cost rankings remain the same in 2008. The overall inpatient spending means are up 15 to 23 percent, while the much higher means for inpatient users are up 10 to 15 percent over the 3 years.
• The increase in overall ED visit rates over the years is from 10 to 14 percent. The rates are higher than they were in 2007. The rates for users rose about 3 to 4 percent. Major depression remains the highest visit group, with users at a mean of 1.80 visits in 2005 and 1.85 in 2008.
• Major depression is clearly skewed to the younger, under-age-65 population compared with the other conditions. Females outnumber males by 2 to 1 in this population. The RA group is even more skewed toward females, at more than 2 to 1.
114
The age distribution is older and more like CHF, a relatively high proportion in the 80–84 age range. People age 75 and over constitute half the group.
• The proportion of the population enrolled in Part D does not vary widely. The diabetes group has the lowest penetration of Part D at about 39 percent; depression and RA are 44 and 43 percent. This is a few points higher than in 2007.
5.3 Method
A simple comparison of 2 years cannot reveal effects of the “treatment” of implementing Part D; there are many confounding changes over the years in addition to the implementation of Part D. There are differences from year to year in payment policies, payment levels, and the FFS population profile, as well as a difference between enrollees and nonenrollees. The difference between the year-to-year differences is the effect that is to be measured. This analysis was done on cross-sections of beneficiaries who were indicated to have the study diseases. The results will be described after the formulation of the model is discussed.
The data contain 2 years of observations (2005, 2008). For each year, a set of variables was used as predictors of spending for that year. The dependent variables in this work are probability of having an inpatient stay, inpatient expenditures for those with at least one stay, probability of an ED visit, and counts of ED visits for those with a visit. This approach can indicate separately the relative effect of the program on any use and quantity. The predictor variables include a broad range of beneficiary characteristics that are known to affect spending and the variables indicating drug coverage.
The variables chosen for analysis are those that should have a clear direction of change if Part D is enhancing access to drugs. Inpatient spending captures both numbers of stays and the severity of the nature of the stay as reflected in the diagnosis-related group (DRG) weights that determine payment. ED visits would also reflect exacerbations of conditions. The hypothesis is that both of these would decrease if Part D enrollment is having the desired effect. The approach was to use a two-part model. In the first stage, the probability of any use of the service is estimated. In the second stage, the amount of inpatient spending or counts of ED visits are estimated for beneficiaries who use the service.
For each prediction year, 2005 and 2008, the main predictor variables conceptually are as follows:
• Demographic variables
a. 24 age/sex classes such as female 60–64, female 65–69, female 70–74, etc. Each sex category has 12 age groups. The under-65 age categories also capture that a beneficiary is eligible by disability in the sample year.
b. Originally disabled. This is a marker for a beneficiary who is at least age 65 but who once had eligibility as a disabled beneficiary.
115
These demographic variables are used to capture spending not captured by the more clinical variables, which encompass many, but not all, medical conditions.
• Diagnosis/condition categories. These are the HCCs developed for CMS to predict costs for payment of MA plans. The HCCs used here capture the most important conditions for predicting spending in the Medicare population. These groupings are clusters of ICD-9-CM diagnosis codes that have been grouped by both clinical homogeneity and predicted cost implications. Separate sets of these are used to predict Part A and B costs and Part D costs. Because we are predicting nondrug costs, the former set was used.
For this modeling, the beneficiaries’ diagnoses from the year before each prediction year were used. This decision is not related to the fact that the HCCs are being used this way in the payment system for MA plans; it is because the prevalence of diseases in the prediction years could be affected by the presence of the drug plan. This endogeneity of a variable that should be predicting as though Part D was not present is removed by using prior year diagnoses, 2004 to predict 2005 and 2006 to predict 2007.
To use these variables effectively, we restricted the study population to those beneficiaries who had been in FFS Part A and B for 12 months of each diagnosis year. This provides full information on the whole sample.
• Long-term institutionalized (LTI). This is a marker for a person considered a nursing home resident. Prior research has indicated that models for the community dwelling tend to overpredict spending when applied to the LTI population. These people are costly to Medicare on average, but they use less Medicare-covered care than people with similar disease constellations in the community. The operational definition is that used for the MA program. It draws on the nursing home minimum data set (MDS) 90-day patient assessments to start an LTI period and a discharge lasting at least 30 days to end the period. In this model, it is the fraction of a year in LTI status.
• Part_D_enrollee is a control variable. More explicit predictors do not capture all the differences in service use between the type of beneficiaries who decide to enroll and those who do not. This variable aims to capture those differences.
• Part_D_years_2008 is the length in years of Part D enrollment since the program started. Time is a factor because the effect of taking drugs for a chronic condition may not be apparent until differences in accumulated negative events can be detected. When the effects in 2006 were evaluated, it was important to account for when a beneficiary enrolled over the extended enrollment period. By 2007, enrollment periods had normalized and the time in the program would be more important. For 2008 the time can vary in increments of one-twelfth of a year (a month) from 0 to a maximum of 36/12 (3 years) for enrollees.
116
• Part_D_years_2008_sq is the square of the previous variable. It is included to test whether the effect of Part D enrollment tends to flatten over time. A coefficient opposite in sign to the linear term would indicate that the Part D effect (if any) tends to plateau after some period of enrollment has occurred.
• Other drug coverage. The model has months of coverage by Retiree Drug Subsidy plans and other creditable coverage from TRICARE, Federal employee health benefits, the Veterans Administration, State pharmacy assistance plans, and employer group coverage plans that make Medicare a secondary payer for medical services.
The model in skeleton form is as follows:
Service use = (a1 × demographic1 + a2 × demographic2 + ….) for Year_2005
+ (b1 × demographic1 + b2 × demographic2 + …) for Year_2008
+ (c1 × HCC1 + c2 × HCC2 + …) for Year_2005
+ (d1 × HCC1 + d2 × HCC2 + …) for Year_2008
+ (lti1 × long-term institutionalized) for Year_2005
+ (lti2 × long-term institutionalized) for Year_2008
+ e1 × Part_D_enrollee, marked for 2005 and 2008
+ f1 × Part_D_years_2008, the treatment effect sought
+ f2 × Part_D_years_2008_sq, square of treatment effect
+ g1 × Other drug coverage variables
The coefficients for the control variables are estimated separately for each year in this method. Because they vary across the years, they pick up much of the effect that would simply be captured by the year variable. This approach differs from the more usual simple additive term for the “treatment” year. It allows groups of predictor variables to vary in their 2008 effects compared with their 2005 effects as well as allows a treatment year additive effect.
Conceptually, in a difference-in-difference regression analysis, if the equation pertaining to 2005 is subtracted from the equation for 2008, the difference is an equation in which terms that are identical in both years, like Part_D_enrollee, vanish. Terms that are similar, but different in magnitude, like the demographics or clinical terms, become the 2008-2005 differences for those terms. Terms that appear as nonzero in only one year remain in the difference equation (for example, the year term and Part D months in 2007).
The difference equation above that applies to nonenrollees is subtracted from the difference equation for the enrollees. Some terms in this equation have the same coefficients for the Part D and non-Part D beneficiaries. These terms vanish from this difference. Such terms
117
are those related to the demographic and clinical variable sets. In addition, the Year_2008 term applies equally to both groups and is differenced away. The only terms that remain of the difference-in-difference process is f1 × Part_D_years_2008 and the squared term, in which f1 is the effect of enrollment in Part D in an implementation year and f2 is similar. The magnitude of this term is the Part D effect per month of enrollment in this formulation, the treatment effect.
The technical aspects of the modeling require different model structures for each equation type. The probability-of-use models for both inpatient and ED are logit models. The log of the use variable is the dependent variable, and the error term distribution is binomial. The inpatient spending model again uses a log of spending as the dependent variable, with a gamma distribution for the error term. The ED visits are a count variable and are used in log form with a Poisson error term. These issues are noted because they affect the way the results are reported.
5.4 Results
The coefficients for Part D years were statistically significant in most, but not all, of the models. In Tables 5.2–Table 5.5, selected coefficients related to duration of Part D are presented with their significance levels. Those with poor statistical significance have been reported as having no effect. Although there is a correlation between the enrollment duration and the square of the duration, which would tend to inflate the variances of the coefficients, the very high level of significance that occurs most of the time indicates that this is not a major problem for the estimates. The results of the regressions are best presented as transformations of the estimated coefficients of interest. Logit coefficients are measures of the log of odds ratios and are best understood when transformed to probabilities. Odds ratios do not convey the magnitudes of the probabilities of events. The spending and counts have coefficients that indicate changes in the log of the spending and counts; these coefficients are best transformed into percent change effects.
To capture the effects of enrollment duration, the coefficients are reported for Part D years of enrollment and the enrollment years squared. Opposite signs indicate somewhat nonlinear effects over time. Because the squared term can turn the trend in the opposite direction over time, the values are most useful for assessing at what point enrollment duration reaches a maximum effect and plateaus. The tables show effects at 1.5, 2, and 2.5 years.
Table 5.2 shows the probability of an admission for a female, age 75, who has the disease for the cohort modeled. In a logit model, the effect of a change in a variable is dependent on the values of the other variables in the model. All the HCC disease comorbidity variables are set to zero, as are the originally disabled variable and LTI variable. The probability of a stay is affected by these values, but the magnitude of the effect of the Part D variable does not change drastically. The effect of changing from no enrollment to 1.5 years, 2 years, and 2.5 years was measured by computing the probabilities with Part D duration set to zero and comparing that probability to each of the three durations. The Part D enrollee variable was also set to allow an estimation of the Part D effect for a person who was of the type to enroll in Part D.
In the probability of admission table, there were statistically significant reductions of a few tenths of a percentage point for COPD, CHF, diabetes, and RA. The probability of an admission for major depression is not affected. The effect for COPD, CHF, and RA seems to
118
plateau at about 2 years of enrollment. Reductions in effect after that are more an artifact of not using a higher-order polynomial or other complex function for duration. The effect of enrollment duration on diabetes with complications seems to continue past the 2.5 years because the offsetting squared term is insignificant. In our prior study, comparing 2007 to 2005, all the cohorts, including major depression, had reduced probability at 1.5 years (the only time point reported).
The effect of Part D enrollment on the probability of an ED visit is reported in Table 5.3. The pattern is similar to that for inpatient stays. However, the plateau effect for COPD, CHF, and RA seems to occur at about 1.5 years rather than 2 years of enrollment. That for diabetes is a bit shorter than for the inpatient stays, at about 2 years; the offsetting coefficient on duration squared is larger and significant here. The order of magnitude of the Part D effect is similar to the 0.2 to 0.3 percentage point found in the inpatient effect. In the prior 2007 study, major depression did show a significant effect at 1.5 years.
Table 5.4 reports the percent change in inpatient spending for those who are admitted for at least one hospital stay. In this case, COPD, CHF, diabetes with complications, and major depression showed significant percentage changes. However, the changes were in an unexpected direction. The changes indicate increased spending, but the increase gets smaller over time, tending toward a decrease. This may indicate that the control variables are not capturing all the changes over time that are occurring in Medicare payments. Table 5.1 does indicate that spending by users was higher in 2008 than 2005. But even if the patients were sicker, the many health status variables, independently estimated for the 2 years, should have captured much of this effect. It may also indicate that the newer enrollees tend to have more or more severe hospitalizations and that longer enrollment reduces utilization. The decrease over time in the magnitude does indicate that increased enrollment duration did have an effect in the expected negative direction, but the overall effect for enrollees is positive over the time tracked. The enrollment effects for RA were not statistically significant. The 2007 study showed reductions at 1.5 years for all groups.
Table 5.5 is a similar table with percent changes in numbers of ED visits for those who had at least one visit. In this case there is no price effect, but the results of counts of visits are not homogeneous. The COPD cohort displays a reduction with enrollment, with the plateau at about 2 years. The CHF cohort also shows a reduction in visits, with the plateau at about 18 months. The effect on the diabetes cohort is positive until the 2.5-year point, when there is a reduction. Neither the major depression nor the RA cohort shows significant effects with enrollment. In the 2007 study, diabetes as well as depression and RA exhibited no effect. COPD and CHF exhibited reductions, as in this study.
5.5 Discussion
The difference-in-difference analysis of the effect of implementing Part D—comparing 2005, pre-Part D, with 2008, the third year of Part D—has shown only small effects at the program level. The probability of use of inpatient and ED services is reduced a few tenths of a percentage point. In some cases, inpatient spending shows an increase with Part D enrollment, with a decline in that amount with increased duration. Although many control variables capture health status, it is possible that the known migration of beneficiaries into and out of MA plans is
119
affecting the patterns over time. The results in the descriptive analysis of the population show a pattern of beneficiaries with comparatively low predicted costs moving into MA plans and those with higher predicted costs moving to FFS. We can study only the utilization of the FFS plans here.
The intriguing findings of the study are the patterns of Part D effect as the duration of enrollment increases. Although some of the patterns could be related to uncorrected selection over time, there is evidence that the effect of enrollment duration may follow a pattern related to the effect of purchasing and taking drugs for a medical condition. That is, the risk of complications and exacerbations of a chronic condition will be reduced over time, but that reduction has limits; it is possible that the progression of the condition over time continues, but at a slower pace.
The difference-in-difference approach may weaken as the gap between the two time periods widens and more unknown factors affect the results. Another limitation in interpreting this analysis is that the nonenrollees in Part D, with whom enrollees are compared, have no known drug insurance. This is not to say that they have no drug insurance. By 2008 the nonenrollees may be even more likely to have some sort of coverage, or ample self-coverage, that is not observable. In addition, the Part D enrollees, as well as nonenrollees, will have been acquiring drugs to an unknown degree in 2005, before Part D. Both these circumstances will result in the observed program effect’s being weaker than it might have been in a world in which access to drugs was solely related to Part D. Therefore, finding small effects in the expected direction is not surprising.
This analysis looks at the effects of the program overall. In Section 7 of this report, the question addressed is the effect of the regularity of buying (and probably taking) drugs. The analysis moves from the loose link between Part D enrollment and Part A and B spending, to a question closer to the effectiveness of drugs in changing Part A and B service use.
120
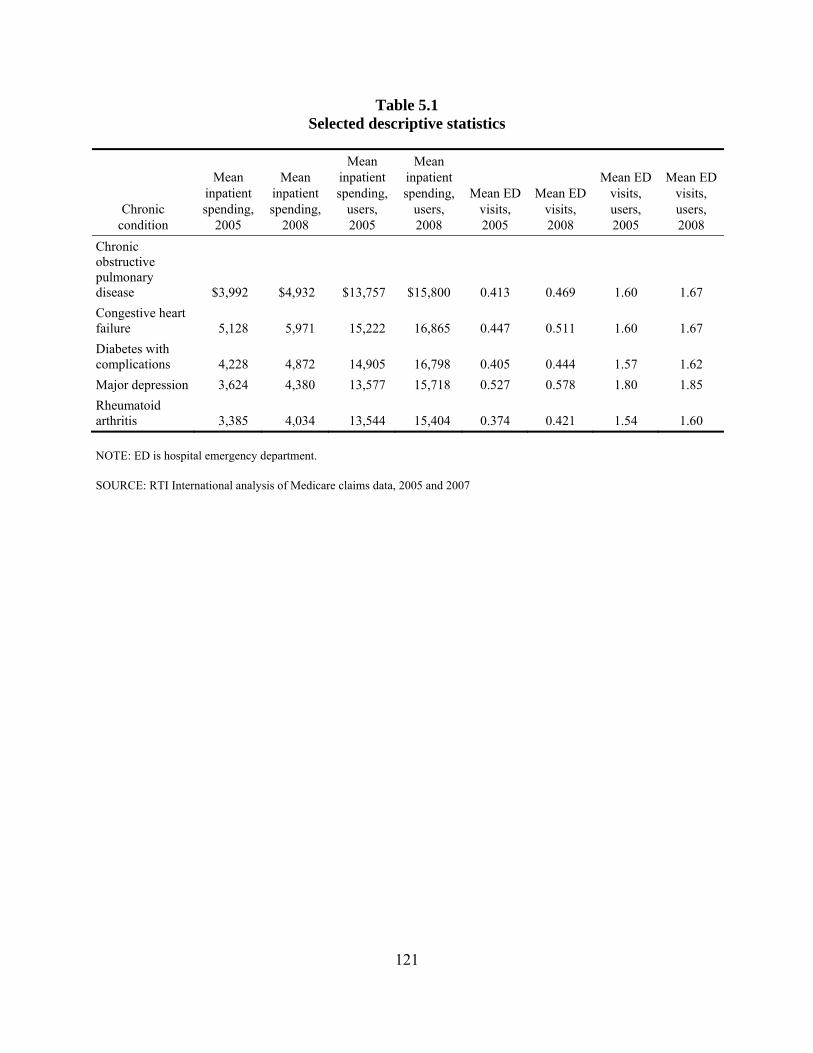
Table 5.1 Selected descriptive statistics
Chronic condition
Mean inpatient spending,
2005
Mean inpatient spending,
2008
Mean inpatient spending,
users, 2005
Mean inpatient spending,
users, 2008
Mean ED visits, 2005
Mean ED visits, 2008
Mean ED visits, users, 2005
Mean ED visits, users, 2008
Chronic obstructive pulmonary disease $3,992 $4,932 $13,757 $15,800 0.413 0.469 1.60 1.67 Congestive heart failure 5,128 5,971 15,222 16,865 0.447 0.511 1.60 1.67 Diabetes with complications 4,228 4,872 14,905 16,798 0.405 0.444 1.57 1.62 Major depression 3,624 4,380 13,577 15,718 0.527 0.578 1.80 1.85 Rheumatoid arthritis 3,385 4,034 13,544 15,404 0.374 0.421 1.54 1.60
NOTE: ED is hospital emergency department.
SOURCE: RTI International analysis of Medicare claims data, 2005 and 2007
121
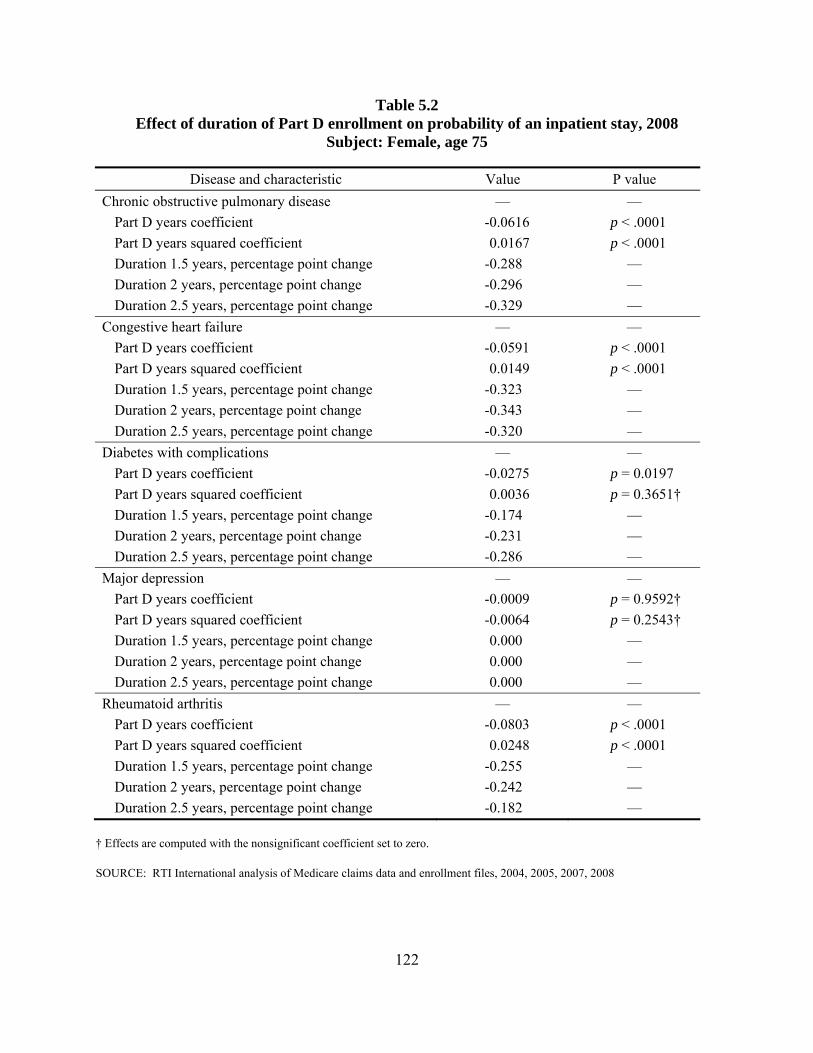
Table 5.2 Effect of duration of Part D enrollment on probability of an inpatient stay, 2008
Subject: Female, age 75
Disease and characteristic Value P value Chronic obstructive pulmonary disease — —
Part D years coefficient -0.0616 p < .0001 Part D years squared coefficient 0.0167 p < .0001 Duration 1.5 years, percentage point change -0.288 — Duration 2 years, percentage point change -0.296 — Duration 2.5 years, percentage point change -0.329 —
Congestive heart failure — — Part D years coefficient -0.0591 p < .0001 Part D years squared coefficient 0.0149 p < .0001 Duration 1.5 years, percentage point change -0.323 — Duration 2 years, percentage point change -0.343 — Duration 2.5 years, percentage point change -0.320 —
Diabetes with complications — — Part D years coefficient -0.0275 p = 0.0197 Part D years squared coefficient 0.0036 p = 0.3651† Duration 1.5 years, percentage point change -0.174 — Duration 2 years, percentage point change -0.231 — Duration 2.5 years, percentage point change -0.286 —
Major depression — — Part D years coefficient -0.0009 p = 0.9592† Part D years squared coefficient -0.0064 p = 0.2543† Duration 1.5 years, percentage point change 0.000 — Duration 2 years, percentage point change 0.000 — Duration 2.5 years, percentage point change 0.000 —
Rheumatoid arthritis — — Part D years coefficient -0.0803 p < .0001 Part D years squared coefficient 0.0248 p < .0001 Duration 1.5 years, percentage point change -0.255 — Duration 2 years, percentage point change -0.242 — Duration 2.5 years, percentage point change -0.182 —
† Effects are computed with the nonsignificant coefficient set to zero.
SOURCE: RTI International analysis of Medicare claims data and enrollment files, 2004, 2005, 2007, 2008
122
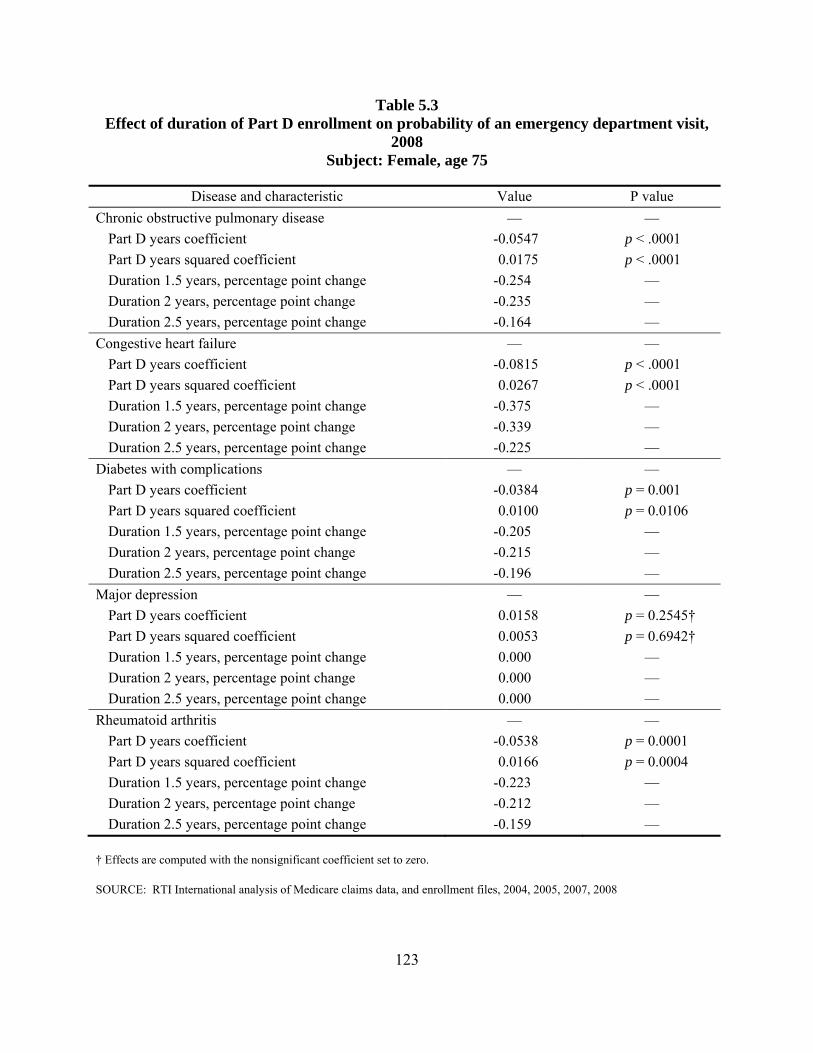
Table 5.3 Effect of duration of Part D enrollment on probability of an emergency department visit,
2008 Subject: Female, age 75
Disease and characteristic Value P value Chronic obstructive pulmonary disease — —
Part D years coefficient -0.0547 p < .0001 Part D years squared coefficient 0.0175 p < .0001 Duration 1.5 years, percentage point change -0.254 — Duration 2 years, percentage point change -0.235 — Duration 2.5 years, percentage point change -0.164 —
Congestive heart failure — — Part D years coefficient -0.0815 p < .0001 Part D years squared coefficient 0.0267 p < .0001 Duration 1.5 years, percentage point change -0.375 — Duration 2 years, percentage point change -0.339 — Duration 2.5 years, percentage point change -0.225 —
Diabetes with complications — — Part D years coefficient -0.0384 p = 0.001 Part D years squared coefficient 0.0100 p = 0.0106 Duration 1.5 years, percentage point change -0.205 — Duration 2 years, percentage point change -0.215 — Duration 2.5 years, percentage point change -0.196 —
Major depression — — Part D years coefficient 0.0158 p = 0.2545† Part D years squared coefficient 0.0053 p = 0.6942† Duration 1.5 years, percentage point change 0.000 — Duration 2 years, percentage point change 0.000 — Duration 2.5 years, percentage point change 0.000 —
Rheumatoid arthritis — — Part D years coefficient -0.0538 p = 0.0001 Part D years squared coefficient 0.0166 p = 0.0004 Duration 1.5 years, percentage point change -0.223 — Duration 2 years, percentage point change -0.212 — Duration 2.5 years, percentage point change -0.159 —
† Effects are computed with the nonsignificant coefficient set to zero.
SOURCE: RTI International analysis of Medicare claims data, and enrollment files, 2004, 2005, 2007, 2008
123
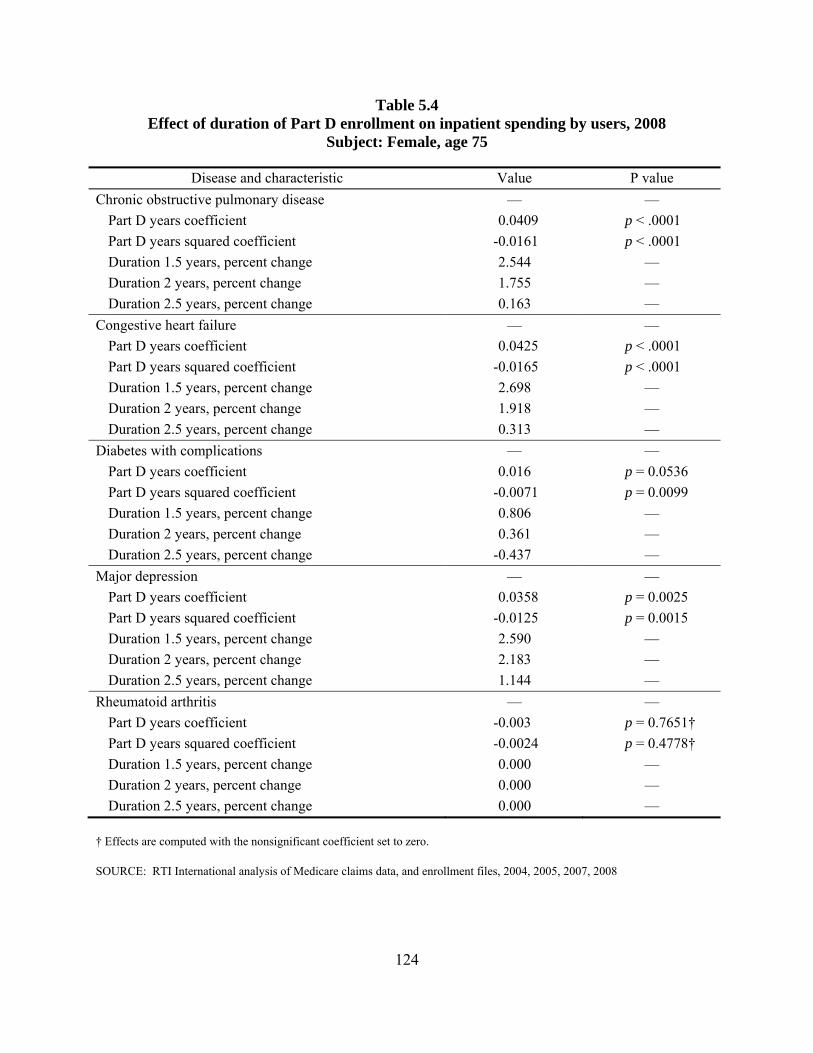
Table 5.4 Effect of duration of Part D enrollment on inpatient spending by users, 2008
Subject: Female, age 75
Disease and characteristic Value P value Chronic obstructive pulmonary disease — —
Part D years coefficient 0.0409 p < .0001 Part D years squared coefficient -0.0161 p < .0001 Duration 1.5 years, percent change 2.544 — Duration 2 years, percent change 1.755 — Duration 2.5 years, percent change 0.163 —
Congestive heart failure — — Part D years coefficient 0.0425 p < .0001 Part D years squared coefficient -0.0165 p < .0001 Duration 1.5 years, percent change 2.698 — Duration 2 years, percent change 1.918 — Duration 2.5 years, percent change 0.313 —
Diabetes with complications — — Part D years coefficient 0.016 p = 0.0536 Part D years squared coefficient -0.0071 p = 0.0099 Duration 1.5 years, percent change 0.806 — Duration 2 years, percent change 0.361 — Duration 2.5 years, percent change -0.437 —
Major depression — — Part D years coefficient 0.0358 p = 0.0025 Part D years squared coefficient -0.0125 p = 0.0015 Duration 1.5 years, percent change 2.590 — Duration 2 years, percent change 2.183 — Duration 2.5 years, percent change 1.144 —
Rheumatoid arthritis — — Part D years coefficient -0.003 p = 0.7651† Part D years squared coefficient -0.0024 p = 0.4778† Duration 1.5 years, percent change 0.000 — Duration 2 years, percent change 0.000 — Duration 2.5 years, percent change 0.000 —
† Effects are computed with the nonsignificant coefficient set to zero.
SOURCE: RTI International analysis of Medicare claims data, and enrollment files, 2004, 2005, 2007, 2008
124
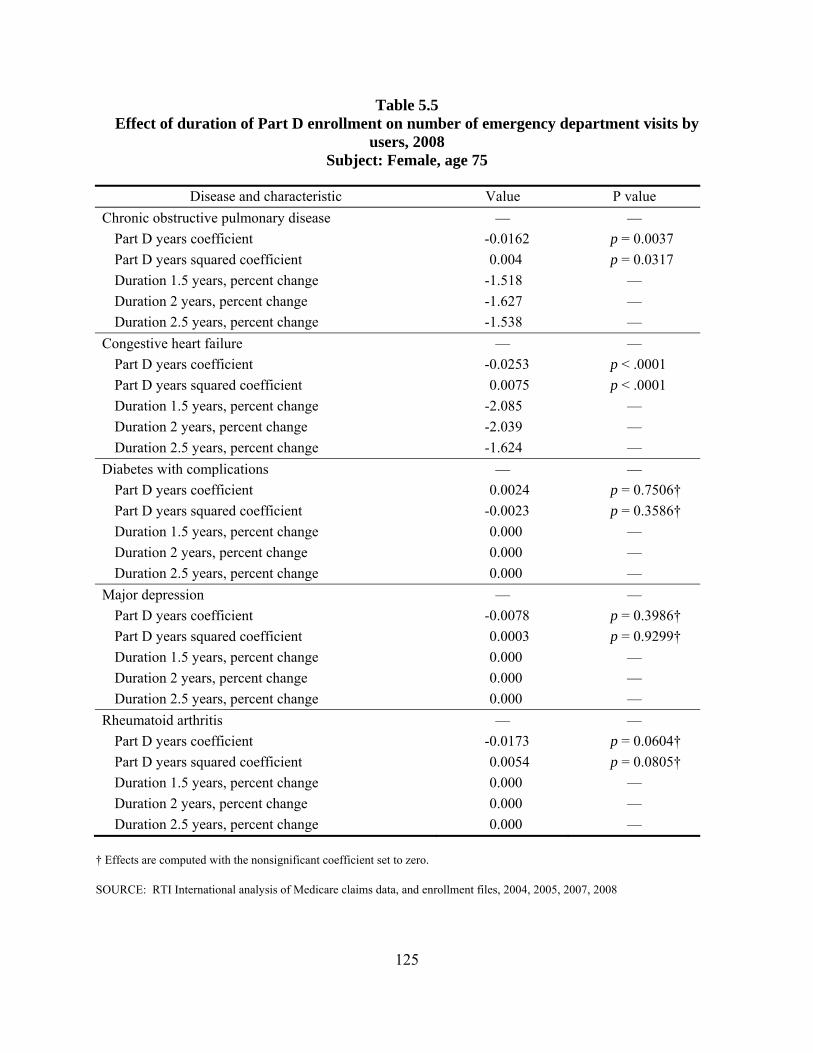
Table 5.5 Effect of duration of Part D enrollment on number of emergency department visits by
users, 2008 Subject: Female, age 75
Disease and characteristic Value P value Chronic obstructive pulmonary disease — —
Part D years coefficient -0.0162 p = 0.0037 Part D years squared coefficient 0.004 p = 0.0317 Duration 1.5 years, percent change -1.518 — Duration 2 years, percent change -1.627 — Duration 2.5 years, percent change -1.538 —
Congestive heart failure — — Part D years coefficient -0.0253 p < .0001 Part D years squared coefficient 0.0075 p < .0001 Duration 1.5 years, percent change -2.085 — Duration 2 years, percent change -2.039 — Duration 2.5 years, percent change -1.624 —
Diabetes with complications — — Part D years coefficient 0.0024 p = 0.7506† Part D years squared coefficient -0.0023 p = 0.3586† Duration 1.5 years, percent change 0.000 — Duration 2 years, percent change 0.000 — Duration 2.5 years, percent change 0.000 —
Major depression — — Part D years coefficient -0.0078 p = 0.3986† Part D years squared coefficient 0.0003 p = 0.9299† Duration 1.5 years, percent change 0.000 — Duration 2 years, percent change 0.000 — Duration 2.5 years, percent change 0.000 —
Rheumatoid arthritis — — Part D years coefficient -0.0173 p = 0.0604† Part D years squared coefficient 0.0054 p = 0.0805† Duration 1.5 years, percent change 0.000 — Duration 2 years, percent change 0.000 — Duration 2.5 years, percent change 0.000 —
† Effects are computed with the nonsignificant coefficient set to zero.
SOURCE: RTI International analysis of Medicare claims data, and enrollment files, 2004, 2005, 2007, 2008
125

This page intentionally left blank.
SECTION 6 ANALYSIS OF THE EFFECT OF ADHERENCE ON OUTCOMES AND UTILIZATION
6.1 Introduction
This section of the report focuses on the general research question: What is the relationship between differences in patient adherence and differences in health outcomes and health care utilization and cost? In other sections we have examined the effect of Part D on such measures. If Part D improves access, and access improves adherence, the next link to examine is the connection between adherence to a drug regimen and measures of outcomes and service use.
Adherence is measured here as a form of the medication possession ratio (MPR), the ratio of days supplied to days eligible in the program. Adjustments were made for time spent in hospitals or skilled nursing facilities (SNFs) because drugs taken during such stays are not provided through Part D. We can measure this variable only for the Part D enrollees. The focus is the non-low-income-subsidy population with five disease cohorts, chronic obstructive pulmonary disease (COPD), congestive heart failure (CHF), diabetes with complications, major depression, and rheumatoid arthritis (RA).
As a matter of policy interest, it would be relevant whether adherence, at least as measured by purchases, did affect the outcome and utilization measures. Efforts to improve adherence would be more likely to be undertaken if effects could be measured.
To operationalize the general research question, we ask the following more specific questions:
• What is the effect of adherence on the probability of having an inpatient hospital stay?
• For those who have stays, what is the effect of adherence on inpatient spending?
• What is the effect of adherence on the probability of having an emergency department (ED) visit?
• For those who have visits, what is the effect on the number of visits?
Medicare fee-for-service claims data were used to create the service use variables and the variables used to control for health status. The diagnoses from these claims were used to identify people in the disease cohorts. The Prescription Drug Event file (PDE) was used to identify people who were users of the drugs and to create the MPRs. We tracked not the use of individual drugs but the use of drugs by class. For this analysis we recognized that beneficiaries do not take all the classes of drugs that could be used to treat their condition. We would consider beneficiaries adherent if they were adherent to one of the relevant classes. Thus the maximum MPR across the multiple classes used for a condition was used as a measure.
127
For the analysis of 2008 data, it was possible to track adherence for both 2008 and the prior year, 2007. Adherence for each year was separately included in the analyses to allow the shorter-term effects and longer-term effects to be measured separately.
The effect of the quantity of drug therapy used, rather than just enrollment in Part D, was expected to be stronger than the effect of simply enrolling in Part D, even for a population with chronic diseases. Indeed, significant and substantive effects were measured, with some variation across the conditions.
The findings, in brief, are that adherence improvements from 0.50 to 0.75 did have small effects on the target measures:
• The probability of an inpatient stay is reduced by tenths of a percentage point to 2 points, depending on condition. Inpatient spending decreases by about 2.5 to 5 percent for a 25-point increase in adherence, varying by condition.
• The probability of an ED visit generally decreased by about the same magnitude for 25 points of adherence improvement. There is less variability in the probabilities of outpatient ED visits than inpatient stays.
• Inpatient spending had mixed results for changes in prior year adherence changes and 2008 changes. The effects varied from less than 1 percentage point to a bit over 2 points. Inclusion of both the 2007 and the 2008 adherence measures sometimes resulted in different signs on the two terms. The interpretation of this situation is not obvious. A potential technical explanation, that the two variables are correlated, was not borne out by correlation tests and tests of condition indexes (Belsley, Kuh, & Welsch, 1980).
• The effects on counts of ED visits were more consistent than inpatient spending effects. The magnitude of reduction was between 1 and 3 percentage points.
These findings indicate that there is a small effect of adherence improvement. Because the disease cohorts include people who may have other medical conditions as well, and because adherence was measured for the drugs used to treat the diseases defining the cohort, it is possible that the changes measured are less than what is achievable. If adherence to drugs for their comorbidities is correlated with the cohort-specific adherence, the numbers may be about right. If adherence to drugs for the comorbidities can also be improved, the overall effects of adherence may be higher.
6.2 Data
The sample used for the study is a subset of the 2008 non-low-income-subsidy enrollees in Part D who were indicated to have at least one of the study conditions: COPD, CHF, diabetes with chronic complications, major depression, or RA.22 The dementia cohort was not included
22 In this analysis, the definitions are those of hierarchical condition categories, which vary somewhat from the list in
Table 2.1.
128
as it was not one of the condition categories available in the version of the classification used. Subjects also had to have at least one record of a filled prescription for one of the study drug classes in the PDE records in the last quarter of the prior year, 2007. Because adherence in 2007 was also included, the study population had also to be present in 2007 with a filled prescription for a relevant drug in the last quarter of 2006. These restrictions produced smaller sample sizes than were used in the study of the effect of Part D in Section 5.
The adherence measures are a variation on those described in Section 3. The MPR, the number of days supplied of a drug divided by the potential eligible days of supply that could have been ordered, is adjusted for carryover from the prior year and for carryover into the subsequent year. We also adjusted for days in an inpatient hospital or SNF. Beneficiaries who were in an SNF were included in the analysis, as many hospital inpatients are discharged to SNFs; excluding these beneficiaries would result in a distortion of the data on inpatient stays. Beneficiaries in nursing facilities in nonskilled stays were excluded. Because there are enrollees who seem to purchase drugs despite being covered for drugs during the inpatient stays, and other causes of noise in the data, the MPR values that exceed 1 are capped at a maximum value of 1.
Each person in the sample for each disease may have multiple conditions and multiple drug classes used for each condition. When analyzing a cohort with a particular condition, we included an adherence measure relevant to the drug classes for that condition as an explanatory variable along with control variables for demographics and comorbidities. For the latter, the hierarchical condition categories (HCCs) for diseases reported in the prior year, 2007, were used.
The data elements necessary were derived from the Medicare 100 percent claims and enrollment data as well as the PDE data for prescriptions filled. The classes of drugs for each condition were arrived at through the literature and in discussions with physicians, as described in Section 3. The drug classes assigned were those in the American Hospital Formulary Service schema, mapped to specific drugs by First DataBank.
6.3 Methods
A two-part method of analysis was used. In the first stage, a regression was run to predict any use of a service. In the second stage, only users of the service were included to determine the quantity of the service. For prediction of probability of inpatient use, a logit analysis was used. Then, for those who had at least one inpatient hospital stay, the inpatient spending was modeled using the log of spending and a gamma distribution for the error term. This two-part approach is often called the “hurdle” method. For this analysis, it enables us to look at both parts of the causes of spending—having a hospitalization and then the costs of hospitalizations conditional on having at least one.
In the case of use of ED services, the same method was used for the first stage, a logit regression to predict use of the ED. The second stage, which models a count of ED visits for users of the service, applied a Poisson regression. The log of the visit count is the dependent variable, and the error term is modeled with a Poisson distribution, appropriate for counts of discrete events.
129
The equations have the following form:
Dependent variable =
a1 × demographic1 + a2 × demographic2 + …
+ b1 × HCC1 + b2 × HCC2 + …
+ c × fraction of year long-term institutionalized
+ d × originally eligible due to disability
+ e × Part_D_months enrolled
+ f × maximum adherence for drug in relevant class, 2007
+ g × maximum adherence for drug in relevant class, 2008
As described in Section 5, the HCC variables are 70 diagnosis clusters used to predict Medicare spending. Although used principally for the Medicare Advantage program, the groups are developed on the fee-for-service population and the HCC grouper program is run on all Medicare beneficiaries each year. For this analysis, the diagnoses reported in 2007 were used to predict the dependent variables in 2008.
A number of possibilities were considered for the adherence measure: the MPR for each drug class, a set of variables marking ranges for the MPR (e.g., 0–20 percent, 20–40 percent …) or the variable chosen, and the maximum MPR for the classes used for the condition. This last variable has some advantages. It is not necessary to take all the classes that treat a disease to be treating the disease. A number of MPRs would be equal to zero because some other class was being used. It would not be appropriate to consider this zero score to be nonadherence. The interpretation of the coefficients becomes difficult. A measure indicating that some drug related to the condition was regularly taken (or at least purchased) was deemed a good indicator of adherence. Thus, in these equations the maximum value of the MPRs for the condition-related drug classes was the variable included. It could range from just greater than 0 to 1.
To facilitate the interpretation of the results, Table 6.1 presents some of the statistics for the inpatient spending and ED counts for each of the condition cohorts.
The value of N in each cell is the count of people used in each regression. The logit regressions, estimating probability of use, have users and nonusers of services. The regressions for users have smaller samples, reflecting the proportions of beneficiaries with at least one inpatient stay or at least one ED visit.
The RA cohort had the lowest proportion of people with inpatient stays and with ED use. The CHF cohort had the highest proportion with inpatient stays and ED use. For ED users, people with major depression had the greatest number of visits. Overall in Medicare, the proportion of beneficiaries with hospital stays is approximately 0.2; these populations were clearly high users.
The mean inpatient spending for users was lowest for the RA group and highest for those with diabetes with complications. Interestingly, the inpatient spending for this cohort of Part D
130
enrollees, who are known to purchase drugs, is somewhat lower than for the cohort studied in Section 5. Table 5.1 shows higher spending for inpatient service users in general.
The means of the measures of adherence for each chronic disease group are shown in Table 6.2. The average of this measure of adherence, the maximum across the set of drug classes used for each reference condition, is high across four of the five conditions, about 0.80. COPD is low, at about 0.55. This is likely because the drugs are frequently administered as inhalants, which have lower adherence rates.23 Similar numbers have been reported in the literature (Tamura and Ohta, 2007). The standard deviation for all but COPD was about 0.25; COPD had higher variation at 0.33.
6.4 Results
A coefficient for adherence was statistically significant in all the models, but not always in both years and not always in the current year. To present the results, the tables for probability of use display the raw coefficients and the significance level for duration of Part D enrollment and the adherence measures for 2007 and 2008. To make the results more meaningful, the values are best presented as transformations of the estimated coefficients of interest. Logit coefficients are measures of the log of odds ratios and are best understood when transformed to probabilities. Odds ratios do not convey the magnitudes of the probabilities of events. The spending and counts have coefficients that indicate changes in the log of the spending and counts and are best transformed into percentages.
Table 6.3 shows the probability of an admission for a female, age 75, who has the disease for the cohort modeled and has 2.5 years of Part D enrollment. In a logit model, the effect of a change in a variable is dependent on the other variable values in the model. All the HCC disease comorbidity variables are set to zero, as are the originally disabled variable and the long-term institutionalized variable. The probabilities vary as the values of the characteristics vary, but the differences do not vary dramatically as variables are changed. The effect of changing by 25 percentage points of adherence is measured by computing the probabilities with adherence set to values of interest to get the best measure for the change.
The object of the probability rows in Table 6.3 is to compare the probability of an admission at two levels of adherence to determine the probability change associated with an adherence improvement. The probability is computed for 2008 adherence set at 0.50 and then at 0.75. This is a goal that seems reasonable. The 2007 adherence is fixed at the starting adherence of 0.50. Doing this demonstrates the marginal effect of an increase of 2008 adherence with the 2007 adherence at the lower level.
The probability of admission for this beneficiary is lower than the mean for each of the cohorts. However, the change results are not very sensitive to computing with a person close to or even higher than the mean probability. For example, the COPD beneficiary simulated in Table 6.3 has a 22.2 percent chance of being admitted with 2008 adherence set at 0.50. This improves to 21.8 percent when 2008 adherence is improved to 0.75. The improvement is
23 The drugs in these measures are not those to be taken sporadically, but those to be taken regularly.
131
0.4 percentage points. Increasing the disease burden of the simulated beneficiary so the probability of admission is in the range of the mean raises the improvement to 0.5 points. The improvement is small in both cases. For COPD, the coefficient for years of enrollment is statistically insignificant. The 2007 adherence coefficient is positive and the 2008 is negative, both statistically significant. The correlation coefficient of adherence in the 2 years was higher for COPD than for any of the other conditions, 0.74. The other groups had year-to-year correlations of 0.54 or lower. The patterns of signs and the significance levels do not seem to be related to correlation effects.
CHF manifests significance on all the variables of interest. Both adherence measures are negative. The improvement in probability of admission, which is higher than that for COPD, is 0.9 percentage points. Diabetes with complications improves by 1.7 percentage points. Only the 2008 short-term adherence is significant. Major depression shows sensitivity only to the 2007 adherence; the 2008 term is not significant. A change has been computed based on changes in 2007 and reported in the footnote to the table (0.5 points). The RA group has a comparatively large negative coefficient on 2008 adherence, and the change of adherence from 0.50 to 0.75 results in a 2.1 percentage point change.
The changes in probability of at least one ED visit related to a similar change in adherence are displayed in Table 6.4. The pattern for ED visits is more consistent than that for admissions. The 2008 adherence coefficients are all negative and significant. The 2007 coefficients are significant for all but RA. Those that are significant are all negative. As 2008 adherence is improved, the changes in ED visit probability are COPD, 0.7; CHF, 1; diabetes, 1; major depression, 1.5; and RA, 1.6 percentage points. The order of magnitude of these changes is similar to that of the inpatient stay changes.
In the second stage of analysis, the effect of adherence on inpatient spending and on numbers of ED visits was estimated for those who used such services. This is a separate measure of the effect of adherence to determine whether those who use any of the service use it at a lower intensity.
In these regressions, the log of spending or counts was the dependent variable, and the coefficients are changes in the log of the dependent variable. The number calculated by the exponentiation of the coefficients represents the percentage change in the spending or count variable for a unit change in the adherence variable, expressed as a proportion (from 0 to 1). Table 6.5 displays the percent changes in inpatient spending and ED visits for users of the services. The percent changes were computed for a change in the adherence from 0.50 to 0.75 to determine the effect of a 25-point change in adherence. The numbers differ slightly when other 25-point intervals are used. The table displays the coefficients for duration of Part D enrollment, adherence for 2007 and 2008, and the results of changing either or both years’ adherence.
Inpatient spending exhibits a number of instances in which the effects of the prior year and current year adherence coefficients have opposite signs and are statistically significant. CHF is such a case. Increasing adherence in 2008 increases spending by 1.59 percentage points. Increasing adherence in the prior year decreases spending by 2.14 points. The prior year effect is stronger and the net effect over 2 years is a decrease.
132
COPD shows nonsignificance for the 2008 adherence and a negative for 2007. Increasing the 2007 adherence decreases the spending by 0.69 points. Diabetes with complications, on the other hand, has coefficient significance for only the 2008 adherence. Improving adherence decreases spending by a more substantive 2.23 percentage points. Major depression shows a negative significant effect for 2007 and positive significant effect for 2008. Although the years offset each other, the 2008 effect is stronger and the effect of improving one or both years is to increase spending. In the case of RA the signs for the 2 years are also opposite, but the much stronger 2008 effect dominates and reduces spending even when combined with the offsetting 2007 effect.
The inpatient spending variable has proven to be difficult to explain in a consistent way. There were unexpected results in the results of Section 5 difference-in-difference analysis as well. In this analysis the modeling is simpler; only the 2008 spending is present. The inclusion of 2 years of adherence, though logical, has produced puzzling results. As mentioned above, the correlation of the spending in the 2 years is not very great and is not the cause of the apparently anomalous results. What does seem to be shown is that the effect of improving adherence by a considerable amount, from 0.50 to 0.75, does not appear to produce a very large effect on inpatient spending.
The next measure of utilization analyzed with this approach does not reflect spending. It is the count of ED visits in 2008 and the effect of adherence on that count. Table 6.6 is structured like Table 6.5. The coefficients on adherence, while not always statistically significant, are consistently negative. Improving adherence reduces, or at least does not increase, the number of ED visits. The range of decrease when adherence is improved is from a bit more than 1 percentage point to about 3 percentage points.
6.5 Discussion
In this analysis, inpatient stays and ED visits are regarded both as utilization measures for the Medicare program and as outcome measures as markers of undesirable medical events. Models were estimated that decomposed the measures into probability of use and intensity of use for those with at least one instance of the service. The explanatory variable of greatest interest was adherence to a drug regimen, measured by the highest MPR among the drug classes used to treat the condition defining the sample under study. Because there are multiple classes for each condition, and not all are used by each person, adherence to any one of the treatment classes indicates treating the condition. For this 2008 study, both adherence in 2008 and adherence in the prior year were included in the models.
For four of the five disease groups (CHF, diabetes with chronic complications, major depression, and RA), average adherence was quite high, with sufficient variance to estimate adherence effects. The average adherence for COPD was only about 50 percent, consonant with other findings for inhalant drugs. For probability of inpatient use and spending, the signs on adherence were not always in the expected direction. The effects of improving adherence from 0.50 to 0.75 were generally small, at most about 2 percentage points. The effect of adherence improvement on probability of an ED visit was more consistent but of the same magnitude. In general, the effect of a 0.25 change in adherence was not substantively large.
133
The effects on amount of inpatient spending were a bit more muddled as to the signs on the 2 years of adherence included, but the substantive effects were again small. The number-of-ED-visits model had more consistent coefficients but a similar small result. The results of these analyses are not encouraging in terms of the effects on important components of Medicare utilization, although the beneficiaries’ quality of life may have been affected. Savings to the program are small for the years measured.
In a test of the models in which only the 2008 adherence variable was included, the interpretations simplified. In all but one case, the coefficients were small and negative when significant. The coefficient for the major depression group in the spending equation was positive. This indicates that there is a net improvement as adherence improves but that there are time effects worth examining.
A limitation of this analysis is that the defined disease cohorts include members who may have a variety of comorbidities. The presence of the comorbidities is largely accounted for by the HCC control variables, but the adherence to drugs for those conditions is not. The adherence effects described here are specific to the diseases under study. Adherences to drug regimens for any other diseases that may be present are not explicitly accounted for separately. In addition, nonadherence in the form of not filling any prescription for a condition that could not be measured; we required at least one fill to be included.
134

Table 6.1 Selected statistics for dependent variables in regressions
Chronic condition Proportion with inpatient stay
Mean spending for those with an inpatient stay
($)
Proportion with emergency
department visit
Mean number of visits for those
with a visit
Chronic obstructive pulmonary disease
0.34 N = 294,913
$15,421 N = 101,527
0.30 N = 294,913
1.71 N = 87,623
Congestive heart failure
0.36 N = 525,183
$16,231 N = 191,124
0.32 N = 525,183
1.68 N = 165,509
Diabetes with complications
0.30 N = 321,577
$16,403 N = 95,579
0.28 N = 321,577
1.62 N = 89,941
Major depression 0.29 N = 103,523
$15,468 N = 30,127
0.32 N = 103,523
1.78 N = 32,907
Rheumatoid arthritis 0.25 N = 71,638
$15,003 N = 18,029
0.24 N = 71,638
1.53 N = 17,528
SOURCE: RTI International analysis of Medicare data
135
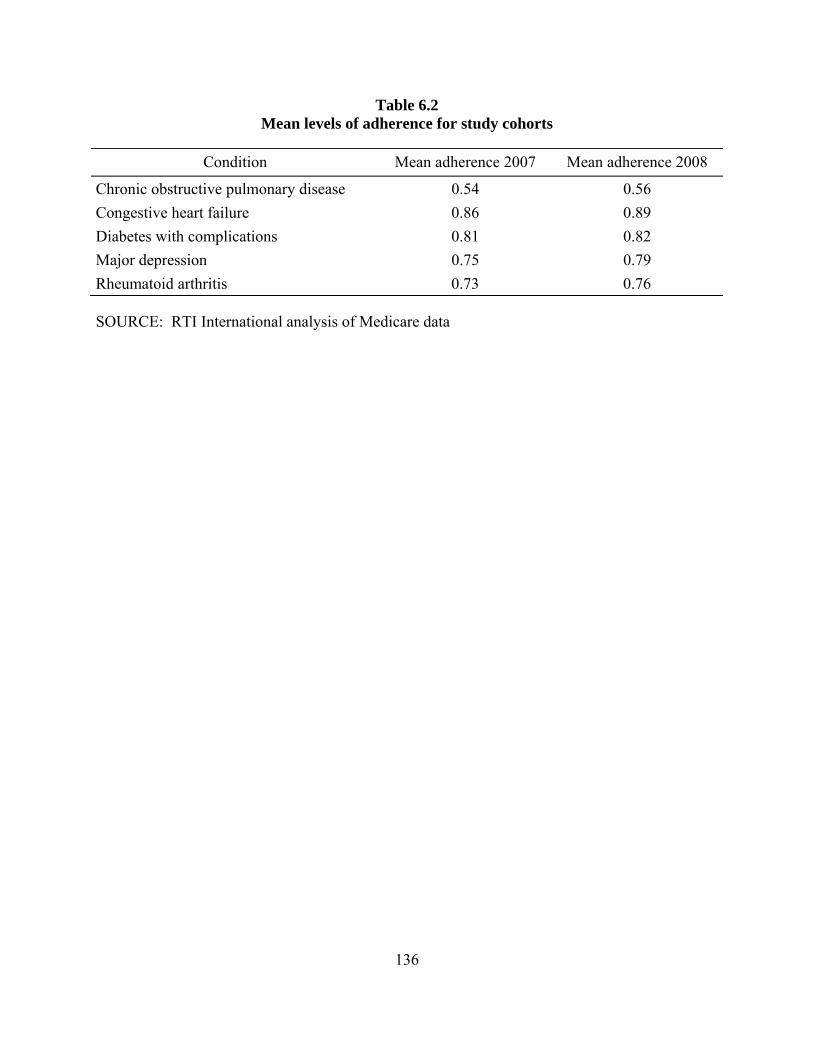
Table 6.2 Mean levels of adherence for study cohorts
Condition Mean adherence 2007 Mean adherence 2008
Chronic obstructive pulmonary disease 0.54 0.56 Congestive heart failure 0.86 0.89 Diabetes with complications 0.81 0.82 Major depression 0.75 0.79 Rheumatoid arthritis 0.73 0.76
SOURCE: RTI International analysis of Medicare data
136
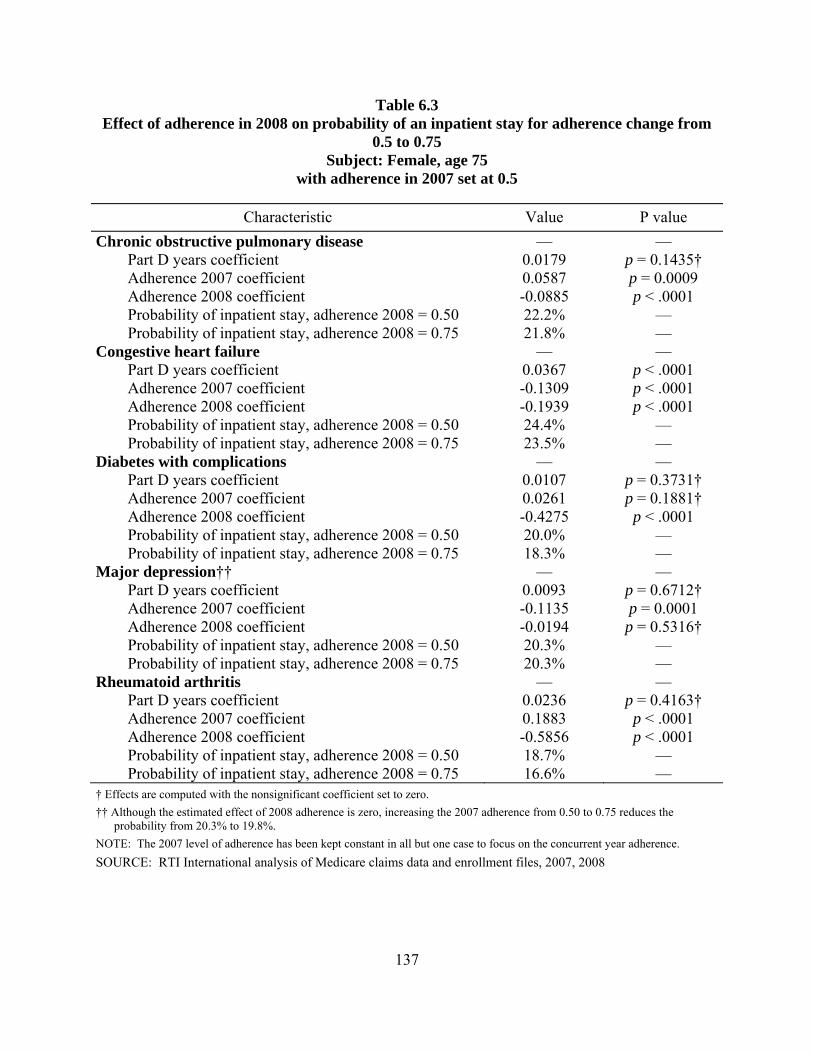
Table 6.3 Effect of adherence in 2008 on probability of an inpatient stay for adherence change from
0.5 to 0.75 Subject: Female, age 75
with adherence in 2007 set at 0.5
Characteristic Value P value Chronic obstructive pulmonary disease — —
Part D years coefficient 0.0179 p = 0.1435† Adherence 2007 coefficient 0.0587 p = 0.0009 Adherence 2008 coefficient -0.0885 p < .0001 Probability of inpatient stay, adherence 2008 = 0.50 22.2% — Probability of inpatient stay, adherence 2008 = 0.75 21.8% —
Congestive heart failure — — Part D years coefficient 0.0367 p < .0001 Adherence 2007 coefficient -0.1309 p < .0001 Adherence 2008 coefficient -0.1939 p < .0001 Probability of inpatient stay, adherence 2008 = 0.50 24.4% — Probability of inpatient stay, adherence 2008 = 0.75 23.5% —
Diabetes with complications — — Part D years coefficient 0.0107 p = 0.3731† Adherence 2007 coefficient 0.0261 p = 0.1881† Adherence 2008 coefficient -0.4275 p < .0001 Probability of inpatient stay, adherence 2008 = 0.50 20.0% — Probability of inpatient stay, adherence 2008 = 0.75 18.3% —
Major depression†† — — Part D years coefficient 0.0093 p = 0.6712† Adherence 2007 coefficient -0.1135 p = 0.0001 Adherence 2008 coefficient -0.0194 p = 0.5316† Probability of inpatient stay, adherence 2008 = 0.50 20.3% — Probability of inpatient stay, adherence 2008 = 0.75 20.3% —
Rheumatoid arthritis — — Part D years coefficient 0.0236 p = 0.4163† Adherence 2007 coefficient 0.1883 p < .0001 Adherence 2008 coefficient -0.5856 p < .0001 Probability of inpatient stay, adherence 2008 = 0.50 18.7% — Probability of inpatient stay, adherence 2008 = 0.75 16.6% —
† Effects are computed with the nonsignificant coefficient set to zero. †† Although the estimated effect of 2008 adherence is zero, increasing the 2007 adherence from 0.50 to 0.75 reduces the
probability from 20.3% to 19.8%. NOTE: The 2007 level of adherence has been kept constant in all but one case to focus on the concurrent year adherence. SOURCE: RTI International analysis of Medicare claims data and enrollment files, 2007, 2008
137
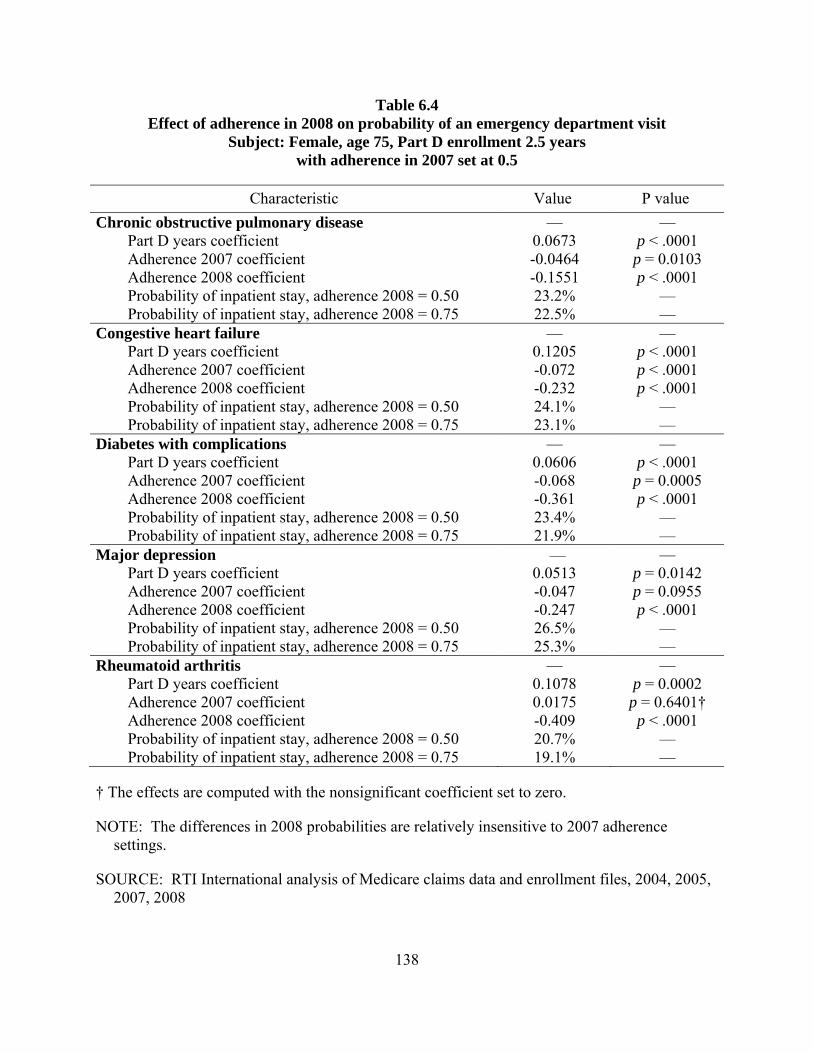
Table 6.4 Effect of adherence in 2008 on probability of an emergency department visit
Subject: Female, age 75, Part D enrollment 2.5 years with adherence in 2007 set at 0.5
Characteristic Value P value Chronic obstructive pulmonary disease — —
Part D years coefficient 0.0673 p < .0001 Adherence 2007 coefficient -0.0464 p = 0.0103 Adherence 2008 coefficient -0.1551 p < .0001 Probability of inpatient stay, adherence 2008 = 0.50 23.2% — Probability of inpatient stay, adherence 2008 = 0.75 22.5% —
Congestive heart failure — — Part D years coefficient 0.1205 p < .0001 Adherence 2007 coefficient -0.072 p < .0001 Adherence 2008 coefficient -0.232 p < .0001 Probability of inpatient stay, adherence 2008 = 0.50 24.1% — Probability of inpatient stay, adherence 2008 = 0.75 23.1% —
Diabetes with complications — — Part D years coefficient 0.0606 p < .0001 Adherence 2007 coefficient -0.068 p = 0.0005 Adherence 2008 coefficient -0.361 p < .0001 Probability of inpatient stay, adherence 2008 = 0.50 23.4% — Probability of inpatient stay, adherence 2008 = 0.75 21.9% —
Major depression — — Part D years coefficient 0.0513 p = 0.0142 Adherence 2007 coefficient -0.047 p = 0.0955 Adherence 2008 coefficient -0.247 p < .0001 Probability of inpatient stay, adherence 2008 = 0.50 26.5% — Probability of inpatient stay, adherence 2008 = 0.75 25.3% —
Rheumatoid arthritis — — Part D years coefficient 0.1078 p = 0.0002 Adherence 2007 coefficient 0.0175 p = 0.6401† Adherence 2008 coefficient -0.409 p < .0001 Probability of inpatient stay, adherence 2008 = 0.50 20.7% — Probability of inpatient stay, adherence 2008 = 0.75 19.1% —
† The effects are computed with the nonsignificant coefficient set to zero.
NOTE: The differences in 2008 probabilities are relatively insensitive to 2007 adherence settings.
SOURCE: RTI International analysis of Medicare claims data and enrollment files, 2004, 2005, 2007, 2008
138
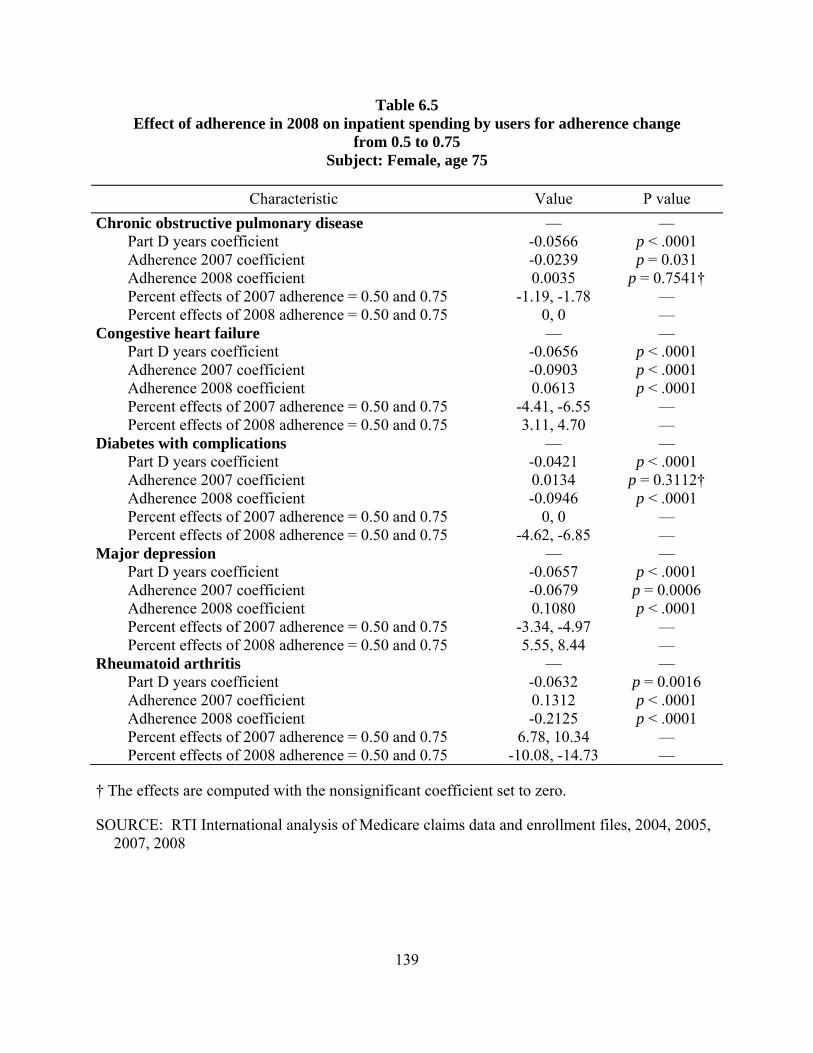
Table 6.5 Effect of adherence in 2008 on inpatient spending by users for adherence change
from 0.5 to 0.75 Subject: Female, age 75
Characteristic Value P value Chronic obstructive pulmonary disease — —
Part D years coefficient -0.0566 p < .0001 Adherence 2007 coefficient -0.0239 p = 0.031 Adherence 2008 coefficient 0.0035 p = 0.7541† Percent effects of 2007 adherence = 0.50 and 0.75 -1.19, -1.78 — Percent effects of 2008 adherence = 0.50 and 0.75 0, 0 —
Congestive heart failure — — Part D years coefficient -0.0656 p < .0001 Adherence 2007 coefficient -0.0903 p < .0001 Adherence 2008 coefficient 0.0613 p < .0001 Percent effects of 2007 adherence = 0.50 and 0.75 -4.41, -6.55 — Percent effects of 2008 adherence = 0.50 and 0.75 3.11, 4.70 —
Diabetes with complications — — Part D years coefficient -0.0421 p < .0001 Adherence 2007 coefficient 0.0134 p = 0.3112† Adherence 2008 coefficient -0.0946 p < .0001 Percent effects of 2007 adherence = 0.50 and 0.75 0, 0 — Percent effects of 2008 adherence = 0.50 and 0.75 -4.62, -6.85 —
Major depression — — Part D years coefficient -0.0657 p < .0001 Adherence 2007 coefficient -0.0679 p = 0.0006 Adherence 2008 coefficient 0.1080 p < .0001 Percent effects of 2007 adherence = 0.50 and 0.75 -3.34, -4.97 — Percent effects of 2008 adherence = 0.50 and 0.75 5.55, 8.44 —
Rheumatoid arthritis — — Part D years coefficient -0.0632 p = 0.0016 Adherence 2007 coefficient 0.1312 p < .0001 Adherence 2008 coefficient -0.2125 p < .0001 Percent effects of 2007 adherence = 0.50 and 0.75 6.78, 10.34 — Percent effects of 2008 adherence = 0.50 and 0.75 -10.08, -14.73 —
† The effects are computed with the nonsignificant coefficient set to zero.
SOURCE: RTI International analysis of Medicare claims data and enrollment files, 2004, 2005, 2007, 2008
139
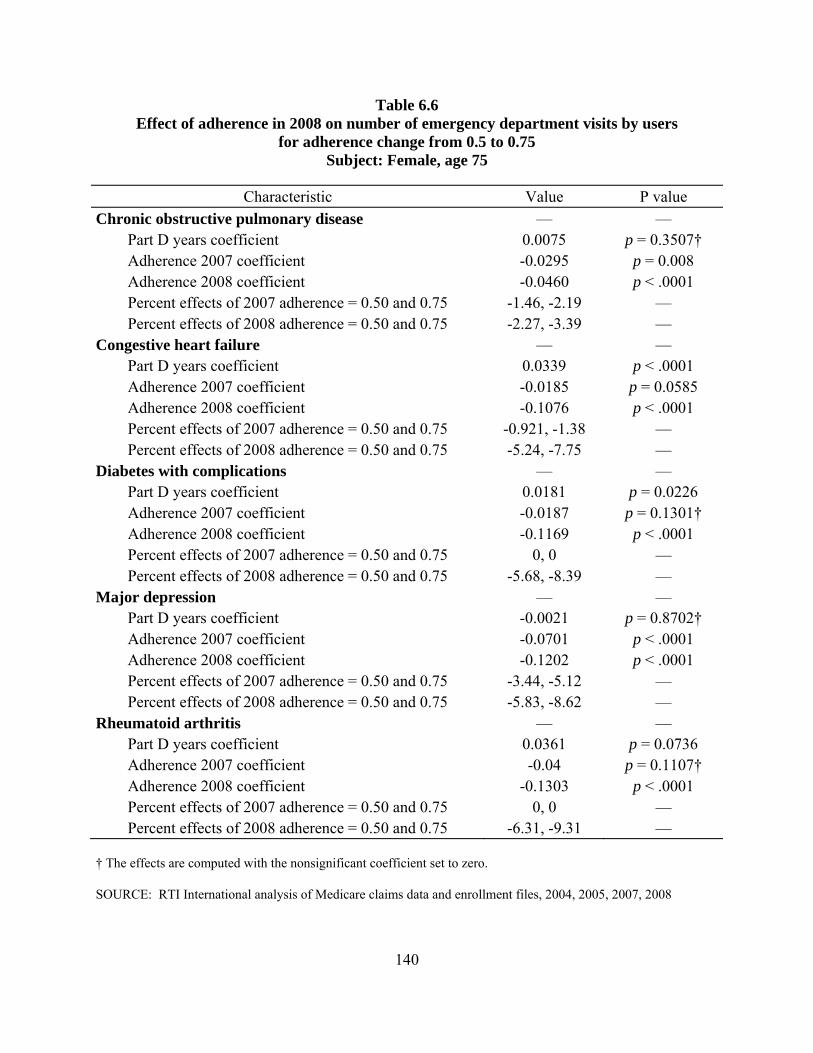
Table 6.6 Effect of adherence in 2008 on number of emergency department visits by users
for adherence change from 0.5 to 0.75 Subject: Female, age 75
Characteristic Value P value Chronic obstructive pulmonary disease — —
Part D years coefficient 0.0075 p = 0.3507† Adherence 2007 coefficient -0.0295 p = 0.008 Adherence 2008 coefficient -0.0460 p < .0001 Percent effects of 2007 adherence = 0.50 and 0.75 -1.46, -2.19 — Percent effects of 2008 adherence = 0.50 and 0.75 -2.27, -3.39 —
Congestive heart failure — — Part D years coefficient 0.0339 p < .0001 Adherence 2007 coefficient -0.0185 p = 0.0585 Adherence 2008 coefficient -0.1076 p < .0001 Percent effects of 2007 adherence = 0.50 and 0.75 -0.921, -1.38 — Percent effects of 2008 adherence = 0.50 and 0.75 -5.24, -7.75 —
Diabetes with complications — — Part D years coefficient 0.0181 p = 0.0226 Adherence 2007 coefficient -0.0187 p = 0.1301† Adherence 2008 coefficient -0.1169 p < .0001 Percent effects of 2007 adherence = 0.50 and 0.75 0, 0 — Percent effects of 2008 adherence = 0.50 and 0.75 -5.68, -8.39 —
Major depression — — Part D years coefficient -0.0021 p = 0.8702† Adherence 2007 coefficient -0.0701 p < .0001 Adherence 2008 coefficient -0.1202 p < .0001 Percent effects of 2007 adherence = 0.50 and 0.75 -3.44, -5.12 — Percent effects of 2008 adherence = 0.50 and 0.75 -5.83, -8.62 —
Rheumatoid arthritis — — Part D years coefficient 0.0361 p = 0.0736 Adherence 2007 coefficient -0.04 p = 0.1107† Adherence 2008 coefficient -0.1303 p < .0001 Percent effects of 2007 adherence = 0.50 and 0.75 0, 0 — Percent effects of 2008 adherence = 0.50 and 0.75 -6.31, -9.31 —
† The effects are computed with the nonsignificant coefficient set to zero.
SOURCE: RTI International analysis of Medicare claims data and enrollment files, 2004, 2005, 2007, 2008
140

SECTION 7 SUMMARY AND CONCLUSIONS
This report explored the following research questions in different ways:
1. What are Part D enrollment patterns for beneficiaries with specific chronic conditions?
2. What is the impact of Part D on patient adherence to medication therapy?
3. What is the impact of Part D on health outcomes and health care utilization and costs for beneficiaries with chronic conditions?
4. What is the relationship between differences in patient adherence and differences in health outcomes and health care utilization and cost?
We considered these questions for Medicare beneficiaries with chronic conditions that are treated with outpatient prescription drugs: chronic obstructive pulmonary disease, congestive heart failure, diabetes with complications, dementia, major depression, and rheumatoid arthritis. Many results, using a number of methodological approaches, have been presented, along with descriptions of the analytical challenges that explain the nature of the findings to a degree.
In the big picture, the questions are about the choices made by enrollees with chronic diseases in selecting drug plans, characteristics of adherence to drugs by these groups, and the direct or indirect effects on other services covered by the Medicare program.
The issue of enrollment patterns addresses whether plan choices seem reasonable for a population with a regular need for drugs. If their choices do not seem reasonable, one might question whether improvements are needed to the information received by potential enrollees. It has been observed that Part D enrollees have a tendency to stay in the plan they have been enrolled in. Renewing the search for an optimal plan each year seems to be difficult for many. A major challenge to enrollees in 2008 was that in many parts of the country the number of plans to choose from was quite large. Administrative rules controlling the proliferation of very similar plans from the same sponsor were put in place in a later year. Our analyses provide evidence that younger and healthier beneficiaries are more likely to switch plans. A sizeable subset of beneficiaries with high drug spending continued to be enrolled in basic plans that were ultimately more costly than enhanced plans offering coverage in the benefit phase for which basic plans have a gap in coverage. These two findings combine to indicate that, for high-cost beneficiaries, the phase-out of the coverage gap through the Affordable Care Act may have the greatest impact in alleviating the financial burden of non-optimal plan choices.
The descriptive presentation of adherence to drug regimens provides a window on the degree to which an insurance program alone is not sufficient to ensure that patients take drugs according to the patterns found to be effective. Although there are reasons for some people to take some of these drugs episodically, to change drugs, and to drop drugs that are not working, there seems to be room to improve adherence on average. This work analyzes the effect of price on adherence by looking at adherence in the coverage gap for both generic and brand-name
141
drugs. We found that generics were used frequently when they were available for a class of drugs. Overall, adherence dropped somewhat in the gap, irrespective of coverage in the gap. Brand-name adherence was more affected in the gap, likely because prices are much higher for those drugs. Ongoing reductions in cost sharing for generics in the gap may have a relatively small effect on adherence. The effects of phasing out the generic gap and the manufacturer’s 50 percent discount, started in 2011, should be monitored to determine which has a stronger effect on purchases.
Our analysis of the Medicare Current Beneficiary Survey examined factors affecting adherence. The finding that, compared to beneficiaries with no drug insurance, Part D enrollees have higher adherence is a bright spot in the analysis. The survey can better identify people with no insurance rather than with no known insurance.
Whether the implementation of the Part D program changes trends in Medicare utilization is important for those who are looking for cost savings to offset the cost of the Part D program. It is also of interest to those who are interested in the changes in health status that are related to changes in utilization patterns. This study provided evidence of only small reductions in the use of the kinds of services deemed most sensitive to slowing of progression of disease that might occur with improved access to drugs.
Even in that population, beneficiaries were likely acquiring drugs before and after the program implementation, so the changes in access would be ones of degree. Our large sample analyses did show small effects in inpatient hospital use and emergency department use. There was some indication that longer duration of enrollment reduced utilization of services.
In looking at the effects of adherence itself on utilization and health status, we examined a more direct link between purchasing, if not consumption, of drugs and the service use measures. Adherence is a measure of how well beneficiaries are using the access provided by insurance, and the analyses measure whether higher adherence makes a difference. If one wanted to make the drug program more effective in reducing costs and improving health, investing in methods to improve adherence could be worthwhile. The evidence is for weak effects in improving adherence from a modest 50 percent to 75 percent. This finding seems to call for follow-up analysis to determine whether the adherence improvement effects on utilization are truly no larger than the few percent estimated. The estimated effects on inpatient spending were less than 2 percent.
In short, for the chronic disease cohorts in this study: enrollment patterns are reasonable, though not optimal, for non-low-income-subsidy beneficiaries who spend the most on drugs; adherence is variable across drug classes, but for most, the median level is at or greater than 0.70; adherence in the coverage gap drops, with the drop for generics not influenced by coverage for generics in the gap; effects of the program on sentinel utilization measures are small; and effects of adherence improvements on the same measures are small.
142
BIBLIOGRAPHY
Abaluck, J.T., and Gruber, J.: Choice Inconsistencies Among the Elderly: Evidence from Plan Choice in the Medicare Part D Program. Working Paper No. 14759. Cambridge, Mass. National Bureau of Economic Research, Feb. 2009.
Allison, P.D.: Convergence Failures in Logistic Regression. Paper presented at the SAS Global Forum. San Antonio, Tex., March 2008.
American Hospital Formulary Service: AHFS Drug Information 2010. Bethesda, Md. American Society of Health-System Pharmacists, 2010.
Austin, P.C.: A critical appraisal of propensity-score matching in the medical literature between 1996 and 2003. Statist. Med. 27:2037-2049, 2008.
Belsley, D. A., Kuh, E. & Welsch, R. E.: Regression Diagnostics: Identifying Influential Data and Sources of Collinearity. New York. John Wiley & Sons, 1980.
Berglund, P.: Analysis of Complex Sample Survey Data Using the SURVEYMEANS and SURVEYREG Procedures and Macro Coding. Paper presented at the SAS SUGI Proceedings. Orlando, Fla., April 2002.
Briesacher, B., Stuart, B., Doshi, J., et al.: Medicare beneficiaries and the impact of gaining prescription drug coverage on inpatient and physician spending. Health Serv. Res. 40(5, Part 1):1279-1296, Oct. 2005.
Caliendo, M., & Kopeinig, S.: Some practical guidance for the implementation of propensity score matching. IZA Discussion Paper Series. No. 1588. Bonn, Germany. Institute for the Study of Labor, 2005.
Centers for Disease Control and Prevention: Current depression among adults—United States, 2006 and 2008. MMWR 59(38):1229-1235, Oct. 1, 2010. Erratum accessed at http://www.cdc.gov/Features/dsDepression/Revised_Table_Estimates_for_Depression_MMWR_Erratum_Feb%202011.pdf
Centers for Disease Control and Prevention: Estimated county-level prevalence of diabetes and obesity—United States, 2007. MMWR 58(45):1259-1263, Nov. 20, 2009.
Centers for Medicare & Medicaid Services: Announcement for Medicare Advantage and Part D drug plans, April 4, 2005. Announcement accessed at http://www.cms.gov/MedicareAdvtgSpecRateStats/Downloads/Announcement2006.pdf
Chandra, A., Gruber, J., and McKnight, R.: Patient Cost-Sharing, Hospitalization Offsets, and the Design of Optimal Health Insurance for the Elderly. Working Paper 12972. Cambridge, Mass. National Bureau of Economic Research, March 2007.
Congress of the United States, Congressional Budget Office: High-Cost Medicare Beneficiaries. A CBO Paper. Washington. May 2005.
143
Cutler, D., Lincoln, B., and Zeckhauser, R.: Selection Stories: Understanding Movements Across Health Plans. Working Paper 15164. Cambridge, Mass. National Bureau of Economic Research, July 2009.
Dillman, D.A., Eltinge, J.L., Groves, R.M., et al.: Survey nonresponse in design, data collection, and analysis. In Survey Nonresponse, edited by R.M. Groves, D.A. Dilman, J.L. Eltinge, and R.J.A. Little. New York. John Wiley & Sons, Inc., 2002.
Dulio, A., Perry, M., and Cubanski, J.: Voices of Beneficiaries: Attitudes Toward Medicare Part D Open Enrollment for 2008. Washington. Kaiser Family Foundation, Dec. 2007.
Firth, D.: Bias reduction of maximum likelihood estimates. Biometrika 80:27-38, 1993.
Fischer, M.A., Stedman, M.R., Lii, J., et al.: Primary medication non-adherence: Analysis of 195,930 electronic prescriptions. J. Gen. Intern. Med. 25(4):284-290, 2010.
Freedman, D.A., & Berk, R.A.: Weighting regressions by propensity scores. Eval. Rev. 32(4):392-409, 2008.
Fung, V., Mangione, C.M., Huang, J., et al.: Falling into the coverage gap: Part D drug costs and adherence for Medicare advantage prescription drug plan beneficiaries with diabetes. Health Serv. Res. 45(2):355-375, April 2010.
Gu, Q., Zeng, F., Patel, B.V., et al.: Part D coverage gap and adherence to diabetes medications. Am. J. Manag. Care 16(12):911-918, 2010.
Heinze, G., and Schemper, M.: A solution to the problem of separation in logistic regression. Stat. Med. 21:2409-2419, 2002.
Hoadley, J., Hargrave, E., Cubanski, J., et al.: The Medicare Part D Coverage Gap: Costs and Consequences in 2007. Menlo Park, Calif. The Kaiser Family Foundation, 2008.
Hsu, J., Price, M., Huang, J., et al.: Unintended consequences of caps on Medicare drug benefits. N. Engl. J. Med. 354(22):2349-2359, 2006.
Hubbard, T., and Daimyo, S.: Medication Adherence and Care Teams: A Call for Demonstration Projects. Cambridge, Mass. New England Healthcare Institute, Sept. 2010.
Imbens, G.W., and J.M. Wooldridge: Recent developments in the econometrics of program evaluation. J. Econ. Lit. 47(1):5-86, 2009.
Ingber, M.J, Greenwald, L., Freeman, S., et al.: Medicare Part D Program Evaluation: Analysis of the Impact of Medicare Part D on the FFS Program. CMS Contract No. HSM-500-2005-0029I. Research Triangle Park, N.C. RTI International, 2010a.
144
Ingber, M.J, Freeman, S., Healy, D., et al.: Medicare Part D Program Evaluation: Analysis of the Impact of Medicare Part D on the FFS Program and Issues Related to Medication Adherence for Six Chronic Conditions—2007. CMS Contract No. HSM-500-2005-0029I. Research Triangle Park, N.C. RTI International, 2010b.
Jiang, H.J., Wier, L.M., Potter, D.E.B., et al: Potentially Preventable Hospitalizations Among Medicare-Medicaid Dual Eligibles, 2008. Statistical Brief No. 96. Rockville, Md. Healthcare Cost and Utilization Project (HCUP), Agency for Healthcare Research and Quality, Sept. 2010.
Kaiser Family Foundation: Examining Sources of Coverage Among Medicare Beneficiaries: Supplemental Insurance, Medicare Advantage, and Prescription Drug Coverage Findings From the Medicare Current Beneficiary Survey, 2006. Menlo Park, CA. Kaiser Family Foundation, August 2008.
Kaiser Family Foundation: Medicare: A Primer, 2010. Report No.7615-03. Menlo Park, Ca. Kaiser Family Foundation, April 2010. Retrieved Dec. 6, 2010, from http://www.kff.org/medicare/upload/7615-03.pdf
Kautter, J., Greenwald, L., Pope, G.C., et al.: Part D Payment Demonstration Enrollment Analysis. CMS Contract No. 500-00-0024, T.O. #23. Research Triangle Park, N.C. RTI International, 2008.
Kautter, J., Ingber, M.J., and Pope, G.C.: Medicare risk adjustment for the frail elderly. Health Care Financing Rev. 30(2):83-93, 2009.
Kautter, J., Khatutsky, G., Pope, G.C., et al.: Impact of nonresponse on Medicare current beneficiary survey estimates. Health Care Financing Rev. 27(4):71-93, 2006.
Kennedy, J., Maciejewski, M., Liu, D, et. al.: Cost-related nonadherence in the Medicare program: The impact of Part D. Med. Care 49(5):522-526, May 2011.
Kennedy, J., Tuleu, I., and Mackay, K.: Unfilled prescriptions of Medicare beneficiaries: Prevalence, reasons, and types of medicines prescribed. J. Manag. Care Pharm. 14(6):553-560, July/Aug. 2008.
Khan, N., Kaestner, R., and Lin, S.: Insurance coverage and healthcare: Effect of prescription drug coverage on health of the elderly. Health Serv. Res. 43(5, Part I):1576-1597, Oct. 2008.
Kirk, J.K., D’Agostino, R.B., Jr., Bell, R.A., et al.: Disparities in HbA1c levels between African-American and non-Hispanic White adults with diabetes. Diabetes Care 29(9):2130-2136, Sept. 2006.
Kirking, D.M., Lee, J.A., Ellis, J.J., et al.: Patient-reported underuse of prescription medications: A comparison of nine surveys. Med. Care Res. Rev. 63(4):427-446, 2006.
Kurth, T., Walker, M.W., Glynn, R.J., et al.: Results of multivariable logistic regression, propensity matching, propensity adjustment, and propensity-based weighting under conditions of nonuniform effect. Am. J. Epidemiol. 163(3):262-270, 2006.
145
Madden, J.M., Graves, A.J., Ross-Degnan, D., et al.: Cost-related medication nonadherence after implementation of Medicare Part D, 2006–2007. JAMA 302(16):1755-1766, Oct. 2009.
Madden, J.M., Graves, A.J., Zhang, F., et al.: Cost-related medication nonadherence and spending on basic needs following implementation of Medicare Part D. JAMA 299(16):1922-1928, Apr. 2008.
Mayo Clinic: Depression in Women: Understanding the Gender Gap. Retrieved from http://www.mayoclinic.com/health/depression/MH00035, June 7, 2011a.
Mayo Clinic: Dementia. Retrieved from http://www.mayoclinic.com/health/dementia/DS01131, June 7, 2011b.
Mayo Clinic: Rheumatoid Arthritis. Retrieved from http://www.mayoclinic.com/health/rheumatoid-arthritis/DS00020, November 3, 2009.
Medicare Rights Center: Medicare Private Drug Plan (Part D) Special Enrollment Periods. Retrieved from http://www.medicarerights.org/pdf/sep_chart.pdf. New York. Medicare Rights Center, 2009.
Murray, M.D., Tu, W., Wu, J., et al.: Factors associated with exacerbation of heart failure include treatment adherence and health literacy skills. Clin. Pharmacol. Ther. 85(6):651-658, June 2009.
Polinski, J.M., Bhandari, A., Saya, U.Y., et al.: Medicare beneficiaries’ knowledge of and choices regarding Part D, 2005 to the present. J. Am. Geriatr. Soc. 58(5):950-966, May 2010.
Pope, G.C., Kautter, J., Ellis, R.P., et al.: Risk adjustment of Medicare capitation payments using the CMS-HCC model. Health Care Financing Rev. 25(4):119-141, Summer 2004.
Safran, D.G., Neuman, P., Schoen, C., et al.: Prescription drug coverage and seniors: Findings from a 2003 national survey [Web exclusive]. Health Aff. W5-152 through W5-166, April 19, 2005. doi: 10.1377/hlthaff.w5.152.
Strine, T., Mokdad, A., Balluz, L., et al.: Depression and anxiety in the United States: Findings from the 2006 Behavioral Risk Factor Surveillance System. Psychiatr. Serv. 59(12):1383-1390, Dec. 2008.
Stuart, B.C., Briesacher, B.A., Doshi, J.A., et al.: Will Part D produce savings in Part A and Part B? The impact of prescription drug coverage on Medicare program expenditures. Inquiry 44:146-156, Summer 2007.
Stuart, B.C., Simoni-Wastila, L., Zhao, L., et al.: Increased persistency in medication use by U.S. Medicare beneficiaries with diabetes is associated with lower hospitalization rates and cost savings. Diabetes Care 32(4):647-649, Apr. 2009.
Sun, S.X., Lee, K.Y., and Aruru, M.: Examining Part D beneficiaries’ medication use in the doughnut hole. Am. J. Pharm. Benefits 1(1):19-28, 2009.
146
Tamura, G., and Ohta, K.: Adherence to treatment by patients with asthma or COPD: Comparison between inhaled drugs and transdermal patch. Respir. Med. 101(9):1895-1902, 2007.
Tchernis, R., Normand, S.T., Pakes, J., et al.: Selection and plan switching behavior. Inquiry 43:10-22, Spring 2006.
Tu, W., Morris, A.B., Li, J., et al.: Association between adherence measurements of metoprolol and health care utilization in older patients with heart failure. Clin. Pharmacol. Ther. 77(3):189-201, Mar. 2005.
Wolters Kluwer Pharma Solutions: Pharma Insight 2009: Patients Take More Power Over Prescription Decisions [press release].
Zhang, Y., Donohue, J.M., Newhouse, .J.P., et al.: The effects of the coverage gap on drug spending: A closer look at Medicare Part D. Health Aff. (Millwood) 28(2):w317-w325, 2009.
147