Medical Spending and Hospital Analysis Over Time...Medical Spending and Hospital Inpatient Care in...
29
CHE Research Paper 127 Medical Spending and Hospital Inpatient Care in England: an Analysis Over Time Maria Jose Aragon, Martin Chalkley, Nigel Rice
Transcript of Medical Spending and Hospital Analysis Over Time...Medical Spending and Hospital Inpatient Care in...

CHE Research Paper 127
Medical Spending and Hospital Inpatient Care in England: an Analysis Over Time
Maria Jose Aragon, Martin Chalkley, Nigel Rice


Medical spending and hospital inpatient care in England: An analysis over time
1Maria Jose Aragon 1Martin Chalkley 1,2Nigel Rice
1Centre for Health Economics, University of York, York, UK 2Department of Economics and Related Studies, University of York, York, UK March 2016
Background to series
CHE Discussion Papers (DPs) began publication in 1983 as a means of making current research material more widely available to health economists and other potential users. So as to speed up the dissemination process, papers were originally published by CHE and distributed by post to a worldwide readership. The CHE Research Paper series takes over that function and provides access to current research output via web-based publication, although hard copy will continue to be available (but subject to charge). Acknowledgements
This is an independent report commissioned and funded by the Policy Research Programme in the Department of Health from the Economics of Social and Health Care Research Unit (ESHCRU). ESHCRU is a joint collaboration between the University of York, London School of Economics and University of Kent. The views expressed are those of the authors and may not reflect those of the funders. The Hospital Episode Statistics are copyright ©1998/99 - 2012/13, re-used with the permission of The Health and Social Care Information Centre. All rights reserved. Further copies
Copies of this paper are freely available to download from the CHE website www.york.ac.uk/che/publications/ Access to downloaded material is provided on the understanding that it is intended for personal use. Copies of downloaded papers may be distributed to third-parties subject to the proviso that the CHE publication source is properly acknowledged and that such distribution is not subject to any payment. Printed copies are available on request at a charge of £5.00 per copy. Please contact the CHE Publications Office, email [email protected], telephone 01904 321405 for further details. Centre for Health Economics Alcuin College University of York York, UK www.york.ac.uk/che © Maria Jose Aragon, Martin Chalkley, Nigel Rice
Medical Spending and Hospital Inpatient Care in England: An Analysis over Time i
Abstract
Health care in England is predominantly provided free at the point of service through the publicly fundedNational Health Service (NHS). Total NHS expenditure, which has risen in real terms by an averageof 3.7% per annum since the inception of the NHS in 1948, constituted 7.9% of GDP in 2012. Thispaper presents a summary of the trends in medical expenditure in England and then using detailedadministrative data presents analysis of the growth over 15 years of expenditure and activity in hospitalinpatient health care, which represents around 20-25% of all NHS expenditure. We document thecoincidence of observed trends in expenditure with reported activity, morbidity and the proximity ofindividuals to death. We find that; (i) expenditure for both elective and emergency inpatient care broadlyfollows activity so expenditure is mostly driven by activity rather than unit costs; (ii) expenditure isconcentrated in individuals with multiple diseases so that the prevalence and identification of complexmedical conditions are important drivers of expenditure and (iii) health care activity rises substantiallyfor individuals in the period before death so that expenditure is driven substantially by mortality in thepopulation. Taken together these findings indicate that this element of health care expenditure in Englandhas been substantially driven by the underlying morbidity and age of the population in conjunction withimproving health care technology.
JEL: H51; J11; I19.Keywords: English National Health Service, health care expenditure, health care activity, end of lifeexpenditures.

CHE Research Paper 127 ii

Medical Spending and Hospital Inpatient Care in England: An Analysis over Time 1
1. Introduction
Health care in England is predominantly provided publicly through the National Health Service (NHS).The system, largely free at the point of use, is funded through conventional income and expendituretaxes and employment-related National Insurance contributions. Direct patient contributions are smallwith minimal copayments. From its inception in 1948 through to 2014 UK public spending on the NHShas risen in real terms by an average of 3.7% per annum to approximately 7.9% of GDP in 2012. NHSexpenditure in England amounted to £108.8b in financial year 2010/11, equivalent to approximately£4,618 per household (Harker 2012).
This article documents the trend in aggregate health care expenditure in England over the past twentyyears and provides a detailed analysis of one component of this expenditure over 15 years. Overallexpenditure responds to changes in the real costs of delivering healthcare, the volume of activity thatis undertaken and the composition of that activity and these in turn can be expected to reflect theunderlying health of the population. In order to examine the potential contributions of these diversefactors it is necessary to disaggregate expenditure both in terms of the kinds of services delivered andthe characteristics of the individuals who receive it. Our focus is expenditure on Hospital and CommunityHealth Services (HCHS), which represents around 65% of NHS expenditure. More specifically, weconsider admitted patient care which includes inpatient and day cases. Together these representapproximately one third of total HCHS expenditure. Besides being a large part of overall expenditure,inpatient is appropriate to study because there are administrative data on NHS hospitals’ activity providingdetails of individual patients, including dates of admission and discharge, whether the admission wasplanned, and clinical information on diagnoses and procedures, amongst others. We combine these datawith records that provide the cost of each admission.
The data we examine concern all inpatient activity and provide approximately 15 million (varying from12m in 1998/99 to 19m in 2012/13) records per annum enabling detailed analysis generalisable tothe population of health care users as a whole. By matching admissions to their costs we are able toestablish the pattern of this area of health care activity in England over a 15 year period to 2012/13. Weinvestigate how expenditure translates to trends in activity and changes in morbidity and the age andgender characteristics of the population over the same period. We then focus further on expenditure atthe end of life since it is well documented that expenditure at the end of life is greater than at other pointsin the life cycle.
We find that expenditure for both elective and emergency inpatient care broadly follows activity. There isthus no obvious evidence either that increasing unit costs are a substantial driver of expenditure or thathospital expenditure is driven by demand for discretionary treatments. We find evidence that expenditureis concentrated in individuals with multiple diseases so that the prevalence and identification of complexmedical conditions is a potentially important driver of expenditure. And we confirm previous findings thathealth care activity and associated expenditure rises substantially for individuals in the period beforedeath so that expenditure is driven substantially by mortality in the population. Taken together thesefindings indicate that expenditure on inpatient health care in England has been substantially driven bythe underlying morbidity and age of the population in conjunction with improving health care technology.
A novel element of our study is the construction and analysis of a consistent time series of 15 yearsof detailed administrative records in order to disaggregate and understand the potential drivers of asubstantial element of publicly funded healthcare expenditure in England.

CHE Research Paper 127 2
2. Institutional Framework
Health care delivery in the United Kingdom (UK) is synonymous with the publicly funded NHS whichaccounts for by far the greater proportion of health care provision with the (growing) exception of dentalhealth care. Although it is often described as a single entity, the NHS is comprised of four separatepublicly funded systems for each of England, Scotland, Wales and Northern Ireland. Each traces itsorigins back to 1948, although a precursor publicly funded system in Scotland existed for some 35 yearsprior to that. Block grants via the Barnett formula are used to determine public funding to each of thedevolved administrations within which each is free to decide how much to spend on the NHS. The broadfunctional split of expenditure in all cases is between secondary care termed Hospital and CommunityHealth Services and primary care usually termed Family Health Services. The former accounts foraround 65% of total expenditure, details for which are provided in Section 3 below.
Although the UK tax system contains an element called National Insurance the term is not reallyuseful.1 Conventional income and expenditure taxes and so-called ‘insurance’ contributions are pooledand provide almost all of the financing for the NHS. Patient contributions are limited to a few items;dental care, prescription medicines and eye tests although there are some differences in these acrossjurisdictions. For example, prescription charges for eligible patients are currently £8.20 per item dispensedin England. This raised £450m in 2010/11 or around 0.5% of the NHS resource budget (Department ofHealth 2011). Wales, Scotland and Northern Ireland have abolished prescription charges. Charges fordental treatment vary across jurisdictions with England paying between £17.50 and £209 depending onthe service provided (UK Statutory Instrument 2009/407 2009). Dental charges provided £614.3m infunding in England in 2009/10 (Health and Social Care Information Centre 2011).
Health care professionals can be either directly employed by the NHS (usually true for hospital physiciansand nurses) or self-employed contractors of the service (usually the case for general medical practitionersand dentists) and such individuals are then free to engage in private practise. Traditionally hospitalservices were (and still mostly are) supplied by NHS organisations but there has recently been a movetowards contracting with non-NHS suppliers.
Rationing of health care has always been a politically charged issue. With effectively zero copaymentthe NHS has traditionally relied on a gatekeeping role of primary physicians and waiting lists to limithospital-based treatments. For other treatments there are various forms of waiting or queueing thatregulate demand.
There has been a substantial recent process of system reform, especially of hospital provided healthcare, commencing in 2004 and mostly affecting only England. This has seen the adoption of fixed pricesfor hospital treatments, greater discretion over the use of funds by NHS hospitals, and empowerment ofpatients through encouraging choice and ‘shopping around’. These changes have been evidenced toincrease hospital activity. There has also been greater direct setting of targets for waiting times and otherperformance measures, which have applied to a greater or lesser extent across the four jursidictions.
1 National Insurance contributions (NI) are employment (including self-employed) based contributions that qualify individuals forcertain benefits under the National Insurance Fund. These include state pensions, incapacity benefits, sick pay, jobseeker’sallowance bereavement benefits and maternity pay. NI is also used to fund the NHS. In Great Britain in 2012-2013, approximately20% (£20b) of total NI was used for this purpose; the remainder allocated to the National Insurance Fund (circa £84b) (GovernmentActuary’s Department 2013).
Medical Spending and Hospital Inpatient Care in England: An Analysis over Time 3
3. Basic Trends in Health Care Expenditure
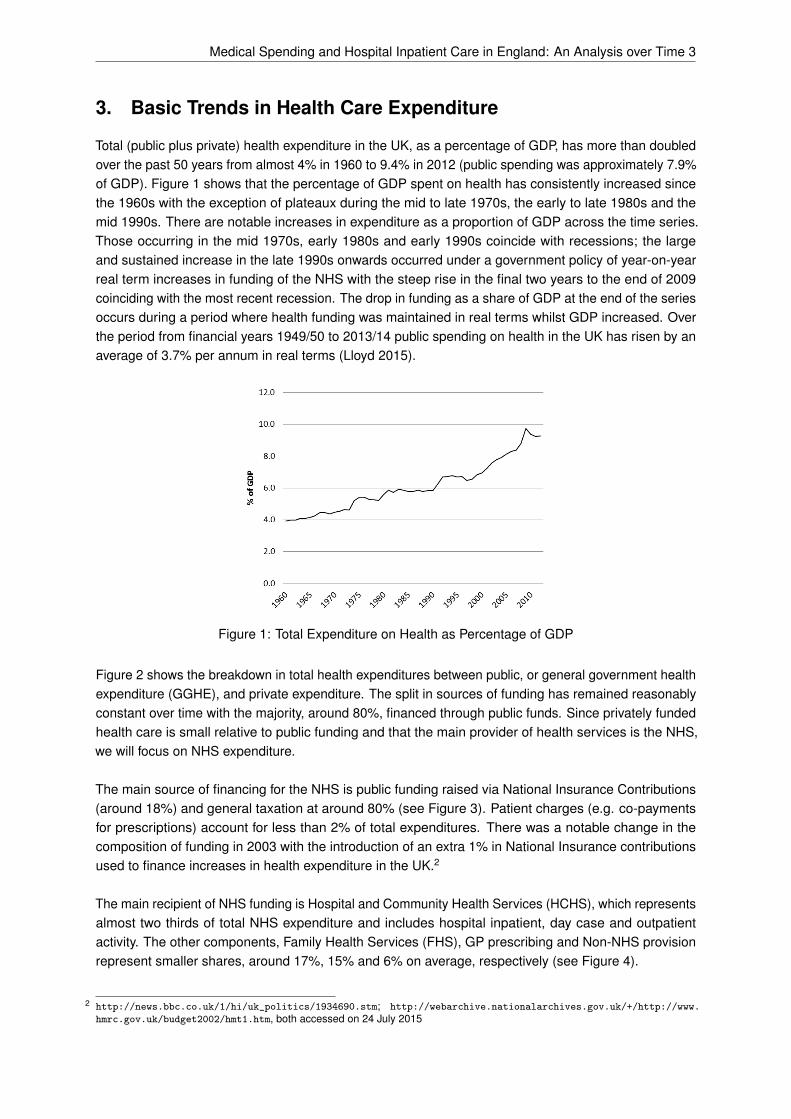
Total (public plus private) health expenditure in the UK, as a percentage of GDP, has more than doubledover the past 50 years from almost 4% in 1960 to 9.4% in 2012 (public spending was approximately 7.9%of GDP). Figure 1 shows that the percentage of GDP spent on health has consistently increased sincethe 1960s with the exception of plateaux during the mid to late 1970s, the early to late 1980s and themid 1990s. There are notable increases in expenditure as a proportion of GDP across the time series.Those occurring in the mid 1970s, early 1980s and early 1990s coincide with recessions; the largeand sustained increase in the late 1990s onwards occurred under a government policy of year-on-yearreal term increases in funding of the NHS with the steep rise in the final two years to the end of 2009coinciding with the most recent recession. The drop in funding as a share of GDP at the end of the seriesoccurs during a period where health funding was maintained in real terms whilst GDP increased. Overthe period from financial years 1949/50 to 2013/14 public spending on health in the UK has risen by anaverage of 3.7% per annum in real terms (Lloyd 2015).
Figure 1: Total Expenditure on Health as Percentage of GDP
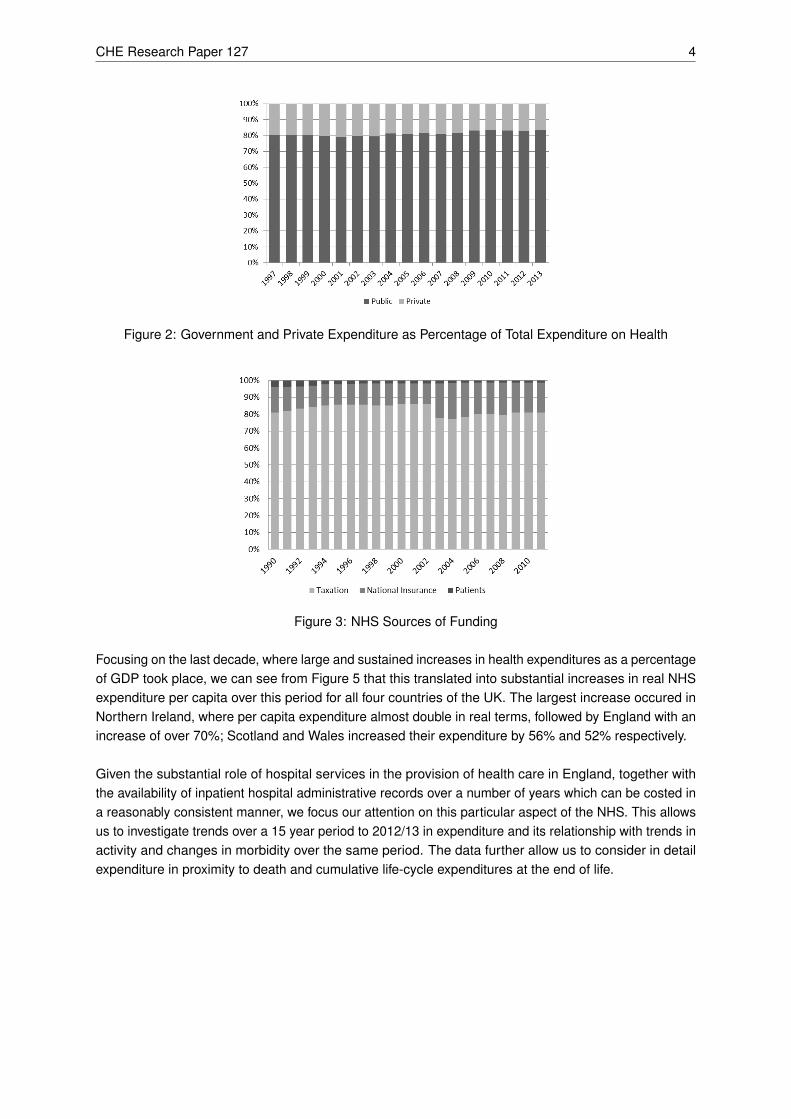
Figure 2 shows the breakdown in total health expenditures between public, or general government healthexpenditure (GGHE), and private expenditure. The split in sources of funding has remained reasonablyconstant over time with the majority, around 80%, financed through public funds. Since privately fundedhealth care is small relative to public funding and that the main provider of health services is the NHS,we will focus on NHS expenditure.
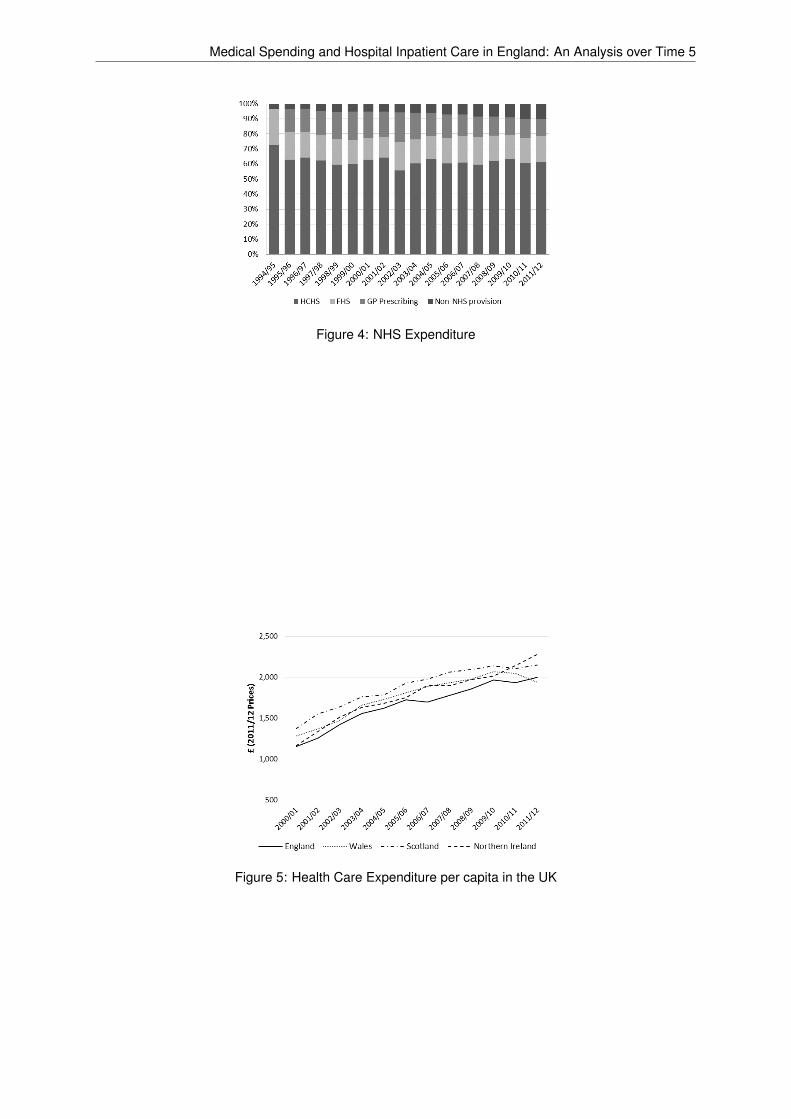
The main source of financing for the NHS is public funding raised via National Insurance Contributions(around 18%) and general taxation at around 80% (see Figure 3). Patient charges (e.g. co-paymentsfor prescriptions) account for less than 2% of total expenditures. There was a notable change in thecomposition of funding in 2003 with the introduction of an extra 1% in National Insurance contributionsused to finance increases in health expenditure in the UK.2
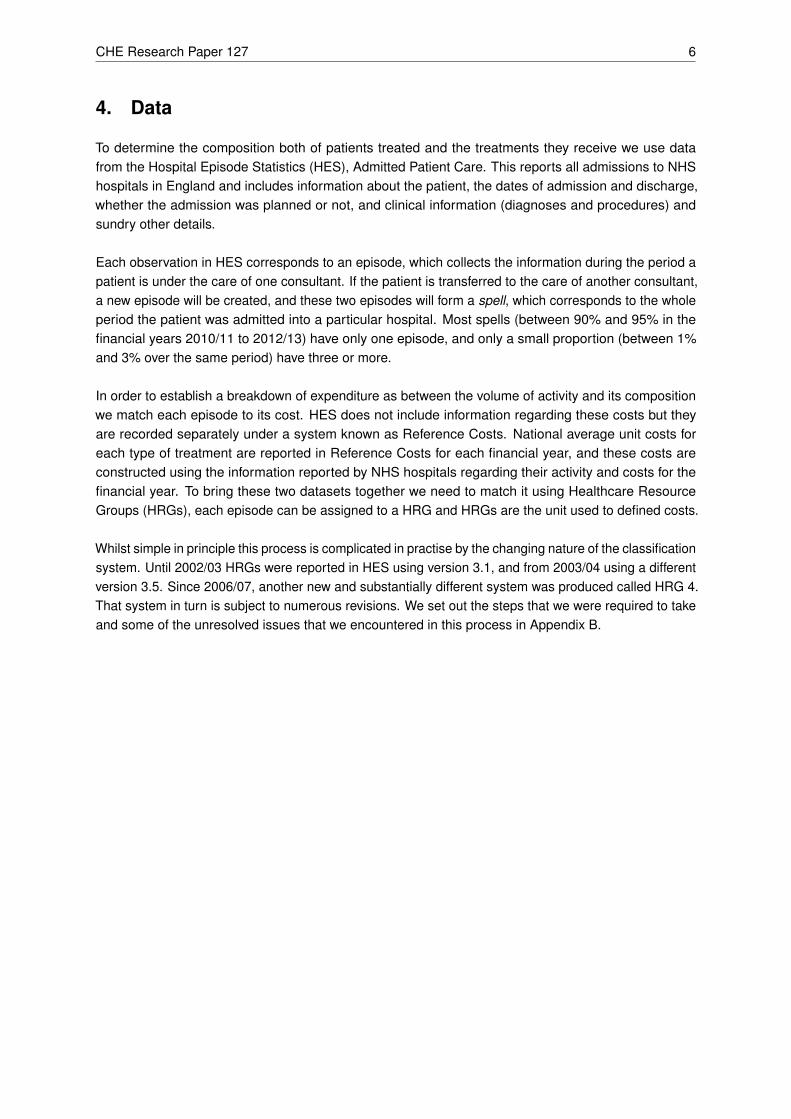
The main recipient of NHS funding is Hospital and Community Health Services (HCHS), which representsalmost two thirds of total NHS expenditure and includes hospital inpatient, day case and outpatientactivity. The other components, Family Health Services (FHS), GP prescribing and Non-NHS provisionrepresent smaller shares, around 17%, 15% and 6% on average, respectively (see Figure 4).
2 http://news.bbc.co.uk/1/hi/uk_politics/1934690.stm; http://webarchive.nationalarchives.gov.uk/+/http://www.hmrc.gov.uk/budget2002/hmt1.htm, both accessed on 24 July 2015
CHE Research Paper 127 4
Figure 2: Government and Private Expenditure as Percentage of Total Expenditure on Health
Figure 3: NHS Sources of Funding
Focusing on the last decade, where large and sustained increases in health expenditures as a percentageof GDP took place, we can see from Figure 5 that this translated into substantial increases in real NHSexpenditure per capita over this period for all four countries of the UK. The largest increase occured inNorthern Ireland, where per capita expenditure almost double in real terms, followed by England with anincrease of over 70%; Scotland and Wales increased their expenditure by 56% and 52% respectively.
Given the substantial role of hospital services in the provision of health care in England, together withthe availability of inpatient hospital administrative records over a number of years which can be costed ina reasonably consistent manner, we focus our attention on this particular aspect of the NHS. This allowsus to investigate trends over a 15 year period to 2012/13 in expenditure and its relationship with trends inactivity and changes in morbidity over the same period. The data further allow us to consider in detailexpenditure in proximity to death and cumulative life-cycle expenditures at the end of life.
Medical Spending and Hospital Inpatient Care in England: An Analysis over Time 5
Figure 4: NHS Expenditure
Figure 5: Health Care Expenditure per capita in the UK
CHE Research Paper 127 6
4. Data
To determine the composition both of patients treated and the treatments they receive we use datafrom the Hospital Episode Statistics (HES), Admitted Patient Care. This reports all admissions to NHShospitals in England and includes information about the patient, the dates of admission and discharge,whether the admission was planned or not, and clinical information (diagnoses and procedures) andsundry other details.
Each observation in HES corresponds to an episode, which collects the information during the period apatient is under the care of one consultant. If the patient is transferred to the care of another consultant,a new episode will be created, and these two episodes will form a spell, which corresponds to the wholeperiod the patient was admitted into a particular hospital. Most spells (between 90% and 95% in thefinancial years 2010/11 to 2012/13) have only one episode, and only a small proportion (between 1%and 3% over the same period) have three or more.
In order to establish a breakdown of expenditure as between the volume of activity and its compositionwe match each episode to its cost. HES does not include information regarding these costs but theyare recorded separately under a system known as Reference Costs. National average unit costs foreach type of treatment are reported in Reference Costs for each financial year, and these costs areconstructed using the information reported by NHS hospitals regarding their activity and costs for thefinancial year. To bring these two datasets together we need to match it using Healthcare ResourceGroups (HRGs), each episode can be assigned to a HRG and HRGs are the unit used to defined costs.
Whilst simple in principle this process is complicated in practise by the changing nature of the classificationsystem. Until 2002/03 HRGs were reported in HES using version 3.1, and from 2003/04 using a differentversion 3.5. Since 2006/07, another new and substantially different system was produced called HRG 4.That system in turn is subject to numerous revisions. We set out the steps that we were required to takeand some of the unresolved issues that we encountered in this process in Appendix B.

Medical Spending and Hospital Inpatient Care in England: An Analysis over Time 7
5. Trends in hospital inpatient care
The analyses that follow present descriptive inference conditional on the population of inpatient users;that is, we only observe individuals’ expenditure and activity data in periods when they have accessedservices.
A key concern for health policy is to understand the underlying drivers of the observed growth in healthcare expenditure. Are trends in expenditure dominated by demand or supply side characteristics?For example, is expenditure simply responding to changing health care needs brought about throughpopulation growth and a changing demographic profile? Is the ‘average’ person sicker than before, in thesense that there exists a greater prevalence of morbidity at a particular point in time, or that prevalencehas remained stable but the severity of morbidity has increased? Have expectations about the benefitsof health care treatment increased thereby raising demand? Are patients treated more intensively usingimproved and more expensive technologies? Are there more and different kinds of sickness that wecan now treat? Has the political dynamic of increased funding in itself had a role to play, for example, inencouraging supplier induced demand to justify calls for additional expenditure?
These are the questions that motivate our analysis. While unpicking causal relationships is beyondthe analysis presented here, the data allow us to gain some insight into these issues by observing thecoincidence of changing expenditure and changing activity and morbidity over time. We aim to provide acoherent analysis of the trends in hospital inpatient expenditure in England since 1998/99 and its links toactivity and morbidity, with a particular focus on expenditure in proximity to death.
5.1. Health care expenditure profiles over time
With the exception of the years from 2006/07 to 2008/09, total inpatient expenditure rose over the 15 yearperiod from 1998/99 to 2012/13 (Figure 6). Expenditure in 1998/99 was approximately £14.1b and by theend of the series amounted to £23.7b (in 2012 prices); an increase of £9.6b (or 68%). Over the sevenyear period to 2005/06, the increase was reasonably constant averaging approximately 7% annually.From 2010/11 onwards annual inpatient expenditure has remained relatively flat. There was a notablefall in expenditure growth in 2006/07 and a subsequent decrease in 2007/08. This appears to be due tothe fact that the new classification system (HRG 4) had a higher number of HRGs with zero cost thanits predecessor (HRG 3.5) and a different way of costing non-electives (see Appendix B). Throughoutthe period women received a greater share of expenditure with the difference over men increasing from£1.7b to £2.3b across the series.
The two main components of inpatient health care expenditure are elective and emergency care. Theseare defined by admission type on arrival to hospital and are potentially revealing of the underlying driversof expenditure trends. Arguably, one might expect trends in emergency care to be less prone to increasingpopulation demand, and particularly supply-induced demand, than elective care as it would appearreasonable to assume that people do not choose to be rushed into hospital as an emergency admission.Both, however, show similar trends of rising expenditure over time (see Figure 7) with elective care risingapproximately 77% across the period and emergency care by around 72%. In all years emergencyexpenditure was greater than observed for elective care but accounted for a smaller proportion of totalactivity. A greater share of expenditure was provided to women for both elective and emergency care. Itis clear that the dramatic fall in total expenditure to 2007/08 is due largely to changes in the costing ofactivity applicable to emergency care.

CHE Research Paper 127 8
Figure 6: Total Inpatient Health Care Expenditure
Figure 7: Elective (l.h.s.) and Emergency (r.h.s.) Expenditures
5.2. Health care activity profiles over time
To understand better the observed rise in inpatient expenditure we consider the change in activity overthe same period. Increased activity might be observed through two channels. First, increased activitybrought about by a greater number of individuals accessing inpatient services; secondly, increasedactivity observed through either a greater number of admissions in a given year for a given individual orgreater intensity of care for a given patient admission. Both potentially reflect combinations of changes inhealth care need and demand, and changes in the supply of health care through technological innovation.
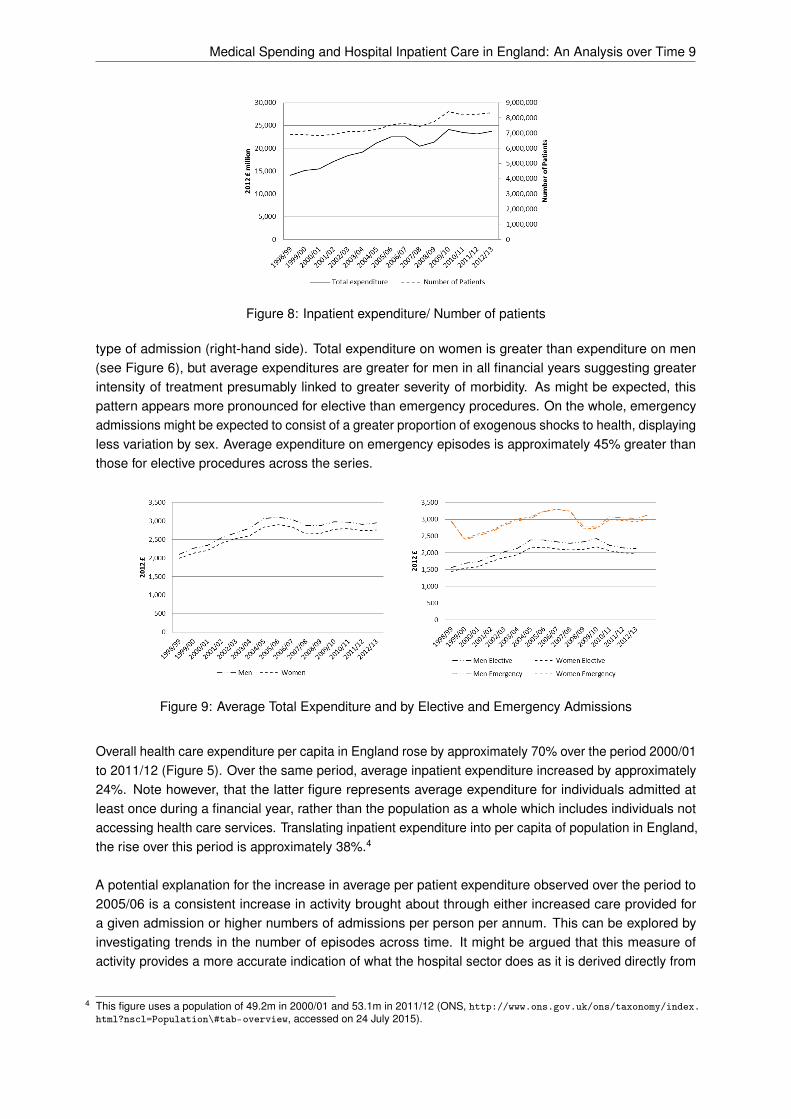
Figure 8 displays total expenditure against the number of distinct patients admitted in a year acrossthe series.3 The number of patients admitted has risen steadily over the period, from 6.9m individualsin 1998/99 to 8.3m in 2012/13; an increase of 20%. The ratio of expenditure to patients is reasonablyconstant from around 2006/07 onwards; however, prior to this we observe expenditure increasing at afaster rate than the number of admitted patients. This appears to suggest that average expenditure perpatient was increasing to 2005/06 and remained relatively constant thereafter.
This is confirmed by the observed trend in average expenditure per individual with at least one admissionin the year. Figure 9 plots total average inpatient expenditure by sex (left hand side) and similarly by
3 This is a count of the number of individuals admitted during the year, rather than the number of admissions. Multiple admissions fora given individual in a given year count the same as a single admission.
Medical Spending and Hospital Inpatient Care in England: An Analysis over Time 9
Figure 8: Inpatient expenditure/ Number of patients
type of admission (right-hand side). Total expenditure on women is greater than expenditure on men(see Figure 6), but average expenditures are greater for men in all financial years suggesting greaterintensity of treatment presumably linked to greater severity of morbidity. As might be expected, thispattern appears more pronounced for elective than emergency procedures. On the whole, emergencyadmissions might be expected to consist of a greater proportion of exogenous shocks to health, displayingless variation by sex. Average expenditure on emergency episodes is approximately 45% greater thanthose for elective procedures across the series.
Figure 9: Average Total Expenditure and by Elective and Emergency Admissions
Overall health care expenditure per capita in England rose by approximately 70% over the period 2000/01to 2011/12 (Figure 5). Over the same period, average inpatient expenditure increased by approximately24%. Note however, that the latter figure represents average expenditure for individuals admitted atleast once during a financial year, rather than the population as a whole which includes individuals notaccessing health care services. Translating inpatient expenditure into per capita of population in England,the rise over this period is approximately 38%.4
A potential explanation for the increase in average per patient expenditure observed over the period to2005/06 is a consistent increase in activity brought about through either increased care provided fora given admission or higher numbers of admissions per person per annum. This can be explored byinvestigating trends in the number of episodes across time. It might be argued that this measure ofactivity provides a more accurate indication of what the hospital sector does as it is derived directly from
4 This figure uses a population of 49.2m in 2000/01 and 53.1m in 2011/12 (ONS, http://www.ons.gov.uk/ons/taxonomy/index.html?nscl=Population\#tab-overview, accessed on 24 July 2015).

CHE Research Paper 127 10
data on episodes of care - an episode being the treatment received under a single consultant. This isless prone to systematic biases due to changes in accounting rules over time inherent in convertingactivity data to expenditure. Figure 10 presents profiles of the average number of episodes over time.The total number of inpatients admitted per annum across the period to 2005/06 rose by around 600,000(9% increase on patients admitted in 1998/99 - Figure 8) and the average number of episodes per personincreased by approximately 0.3 (20% increase on average episodes in 1998/99). Average episodescontinued to rise until 2008/09. Average episodes then decreased to approximately 2 episodes perinpatient per year. A similar rise in episodes to 2008/09 followed by a decline is also observed for electiveepisodes and to a lesser extent emergency episodes (not shown). On average men have a greaternumber of episodes than women.
Figure 10: Average Number of Episodes
5.3. Morbidity profiles over time
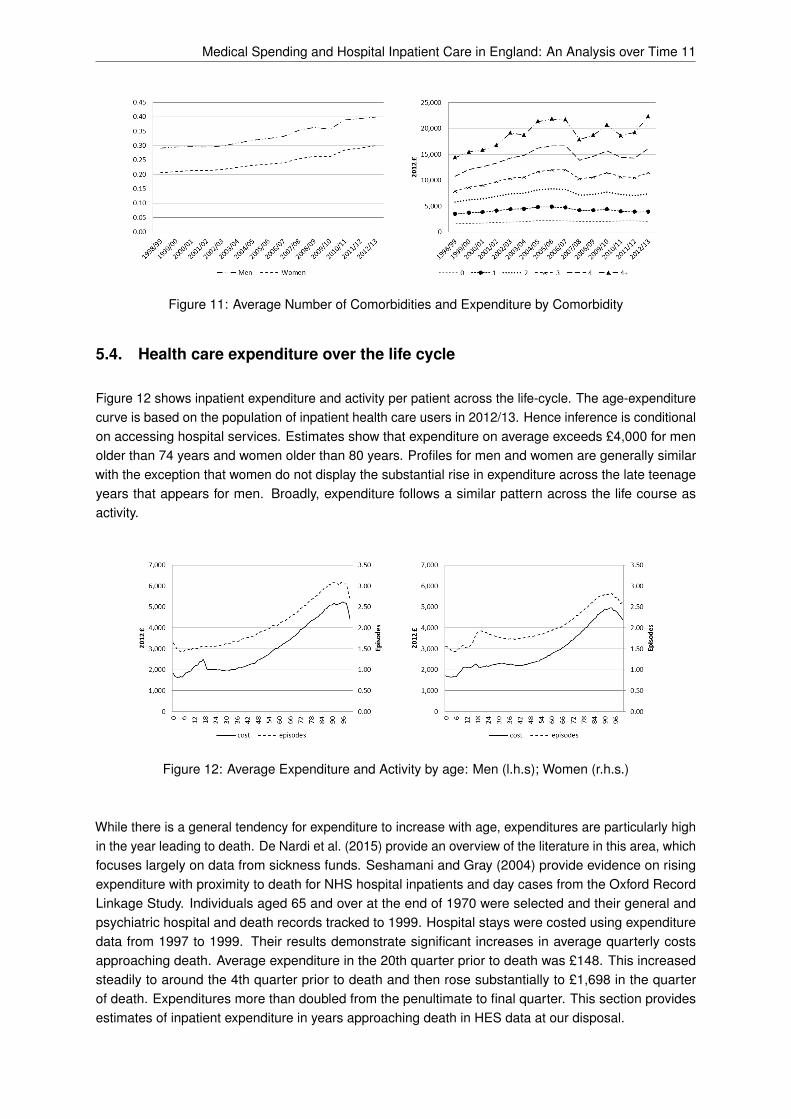
Figure 11 shows the trend in the average number of comorbidities reported within HES.5 The observedincrease in comorbidity helps to explain the observed rise in activity (episodes of care). However, thismight also reflect changing attitudes and protocols to reporting within HES data, for example due toincentives created through Payment by Results which require recording of diagnoses. It is notable thatthe number of reported comorbidities is increasing at the end of the series, whereas activity appears tolevel off (with the exception of emergencies). Men are reported to have a greater average number ofcomorbidities than women.
There is a clear relationship between the number of comorbidites and expenditure (Figure 11; r.h.s.).In the final year of observation (2012/13) the difference in average expenditure for patients recordedwithout a comorbidity and with a single comorbidity was £1,790; the difference in average expenditure forpatients with 1 and 2 comorbidities was £3,478; between 2 and 3, £4,096; between 3 and 4, £4,677 andbetween 4 and 4+ was £6,133. Complications brought about due to increased comorbidity are clearlymore expensive to treat.
5 The diseases considered are those used to calculate the Charlson Comorbidity Index. See http://www.hscic.gov.uk/media/16110/Indicator-Specification-Summary-Hospital-level-Mortality-Indicator-methodology-updated/pdf/SHMI/_specification.pdf, accessed on 24 July 2015.
Medical Spending and Hospital Inpatient Care in England: An Analysis over Time 11
Figure 11: Average Number of Comorbidities and Expenditure by Comorbidity
5.4. Health care expenditure over the life cycle
Figure 12 shows inpatient expenditure and activity per patient across the life-cycle. The age-expenditurecurve is based on the population of inpatient health care users in 2012/13. Hence inference is conditionalon accessing hospital services. Estimates show that expenditure on average exceeds £4,000 for menolder than 74 years and women older than 80 years. Profiles for men and women are generally similarwith the exception that women do not display the substantial rise in expenditure across the late teenageyears that appears for men. Broadly, expenditure follows a similar pattern across the life course asactivity.
Figure 12: Average Expenditure and Activity by age: Men (l.h.s); Women (r.h.s.)
While there is a general tendency for expenditure to increase with age, expenditures are particularly highin the year leading to death. De Nardi et al. (2015) provide an overview of the literature in this area, whichfocuses largely on data from sickness funds. Seshamani and Gray (2004) provide evidence on risingexpenditure with proximity to death for NHS hospital inpatients and day cases from the Oxford RecordLinkage Study. Individuals aged 65 and over at the end of 1970 were selected and their general andpsychiatric hospital and death records tracked to 1999. Hospital stays were costed using expendituredata from 1997 to 1999. Their results demonstrate significant increases in average quarterly costsapproaching death. Average expenditure in the 20th quarter prior to death was £148. This increasedsteadily to around the 4th quarter prior to death and then rose substantially to £1,698 in the quarterof death. Expenditures more than doubled from the penultimate to final quarter. This section providesestimates of inpatient expenditure in years approaching death in HES data at our disposal.

CHE Research Paper 127 12
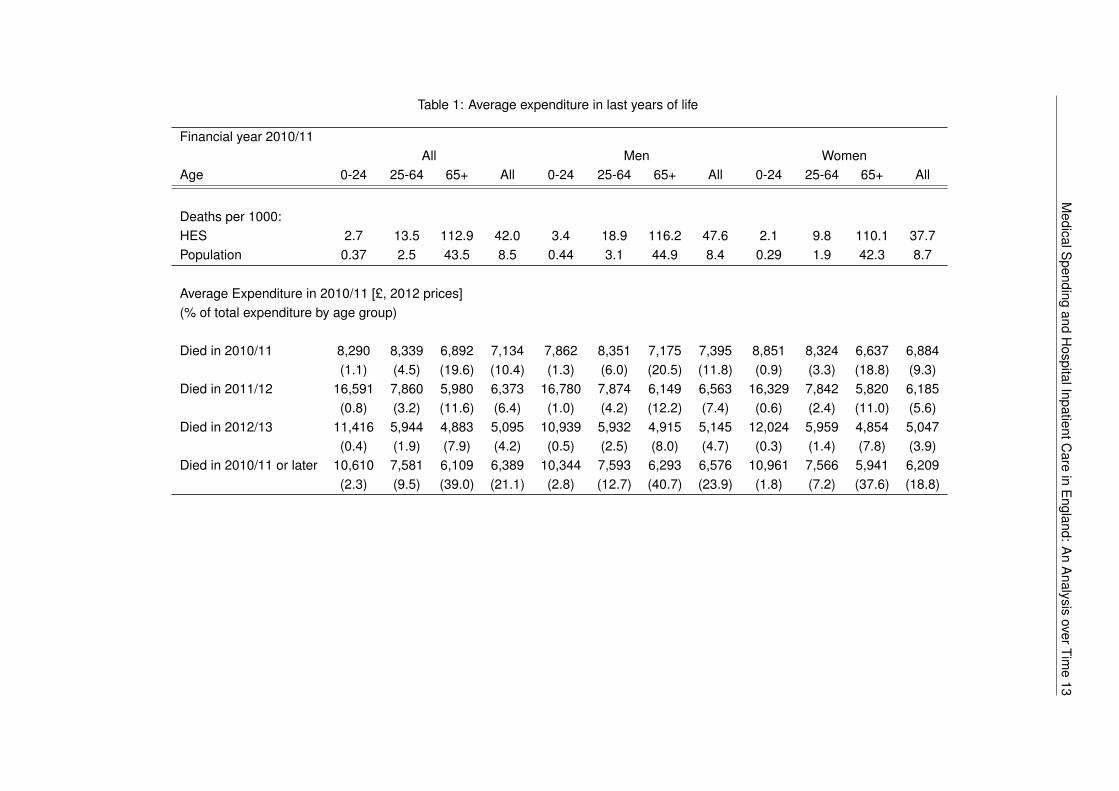
Table 1 presents some basic facts on inpatient expenditure in the final years preceding death. Expenditurefigures are based on financial years. Accordingly, if an individual dies in May, they will contributeexpenditure data for the months April and May; while a death in March will contribute up to 12 months ofexpenditure data. Data are taken from the financial year 2010/11 and are broken down by sex and age.
From the population of 8.2m inpatient admission in 2010/11 there were 343.8k deaths overall and 4.6k,53.0k, and 286.2k respectively across age categories 0-24; 25-64, 65+ in the same year.6 The firsttwo rows of Table 1 compare these rates with death rates observed in the general population (Officefor National Statistics 2013). Clearly the death rates in the population of hospital inpatient users issubstantially greater than that observed in the general population. This is particularly the case for theyoung (0-24 years) where deaths per 1000 individuals are over 7 times greater in the population ofhospital inpatients compared to the general population. Death rates for inpatients over 65 years areapproximately 2.6 times that observed in the general population.
The second panel of Table 1 presents average expenditure in the year of death, next to last year, andsecond to last year. Figures in parentheses show expenditure as a percentage of total expenditure inthe same age and sex group. Expenditure on inpatients in the last year of life in 2010/11 totalled £2.5b;approximately 10.4% of total inpatient expenditure for 2010/11. Average expenditure was £7,134 butvaries across age groups, being substantially greater for younger age groups than for those over 65years. Using US Medicare data, Yang et al. (2003) report a similar finding that spending on inpatientcare in the last year of life declines with age at death. Given the larger proportion of deaths amongstthose aged 65+ years7, however, the proportion of total health care expenditure afforded to the final yearof death is substantially greater for this age group (19.6%) than for either the age group 0-24 (1.1%), orthe age group 25-64 (4.5%). In general, average expenditures in the final year of life are greater for menthan women.
Average inpatient expenditure in the next to last year is £6,373 which equates to about 6% of totalexpenditure, and £5,095 in the second to last year. Expenditure summed across individuals withinthe final 3 years of life represents one fifth (21.1%) of total inpatient expenditure for 2010/11. This islargely accounted for by the 65+ age group where expenditure across the final 3 years of life amountsto 39% of total expenditure on this age group and 17% of total inpatient expenditure for the financialyear. Accordingly, a substantial proportion of total inpatient expenditure in England is accounted for bytreatments in the final years of life, and which is largely explained by health care use by the over 65s.This result appears to accord with findings elsewhere. For example, Yang et al. (2003) report time todeath as the main reason for inpatient expenditures using US Medicare data.
6 Deaths are taken from ONS registers and include deaths both within and outwith hospital stays.7 83% of all observed deaths in 2010/11 occurred in this age group.
MedicalS
pendingand
HospitalInpatientC
arein
England:
An
Analysis
overTime
13
Table 1: Average expenditure in last years of life
Financial year 2010/11All Men Women
Age 0-24 25-64 65+ All 0-24 25-64 65+ All 0-24 25-64 65+ All
Deaths per 1000:HES 2.7 13.5 112.9 42.0 3.4 18.9 116.2 47.6 2.1 9.8 110.1 37.7Population 0.37 2.5 43.5 8.5 0.44 3.1 44.9 8.4 0.29 1.9 42.3 8.7
Average Expenditure in 2010/11 [£, 2012 prices](% of total expenditure by age group)
Died in 2010/11 8,290 8,339 6,892 7,134 7,862 8,351 7,175 7,395 8,851 8,324 6,637 6,884(1.1) (4.5) (19.6) (10.4) (1.3) (6.0) (20.5) (11.8) (0.9) (3.3) (18.8) (9.3)
Died in 2011/12 16,591 7,860 5,980 6,373 16,780 7,874 6,149 6,563 16,329 7,842 5,820 6,185(0.8) (3.2) (11.6) (6.4) (1.0) (4.2) (12.2) (7.4) (0.6) (2.4) (11.0) (5.6)
Died in 2012/13 11,416 5,944 4,883 5,095 10,939 5,932 4,915 5,145 12,024 5,959 4,854 5,047(0.4) (1.9) (7.9) (4.2) (0.5) (2.5) (8.0) (4.7) (0.3) (1.4) (7.8) (3.9)
Died in 2010/11 or later 10,610 7,581 6,109 6,389 10,344 7,593 6,293 6,576 10,961 7,566 5,941 6,209(2.3) (9.5) (39.0) (21.1) (2.8) (12.7) (40.7) (23.9) (1.8) (7.2) (37.6) (18.8)

CHE Research Paper 127 14
Figure 13: Average Expenditure by Quarter to Death
An alternative way of illustrating the increase in health care costs in the final years of life is presentedin Figure 13 which plots inpatient expenditures by quarter to death. These estimates are based on thepopulation of decedents observed to die in the financial year 2012/13. We follow these individuals back intime across successive years of HES and calculate their health care expenditure in each of the previous40 quarters (Figure 13 plots expenditure (at 2012 prices) for up to 20 quarters prior to death).8 Where anindividual is not observed to have an inpatient episode in a particular quarter, expenditure is assumed tobe zero. Quarterly mean expenditure for individuals aged 25 to 64 at death; and for individuals aged 65+at death are provided. For all quarters, mean expenditure for the age group 65 years and over are lowerthan for the younger age group. For both groups there is a clear and sharp increase in expenditure inthe final year and quarter of life. In quarters preceeding the final four (two) mean expenditure for the25-64 year age group (65+ years) is below £1,000. Mean expenditure approximately doubles from the5th quarter from death to the penultimate quarter. For the older age group mean expenditure in thefinal quarter of life is 3.2 times the expenditure in the penultimate quarter (£4,402 vesus £1,371); for theyounger age group mean expenditure is 2.7 times greater than in the penultimate quarter (£4,961 vesus£1,825).
5.4.1. Cumulative expenditure approaching death
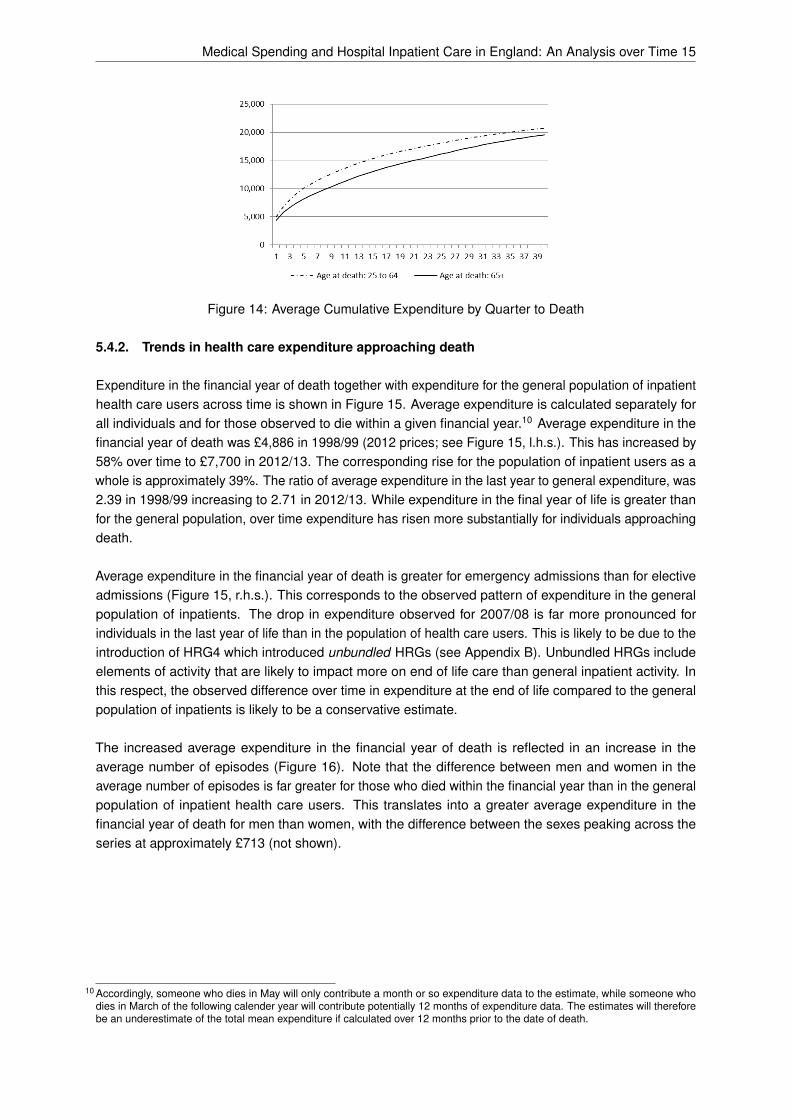
Figure 14 shows mean cumulative expenditure as a function of the number of quarters approachingdeath. In this way, the figure illustrates a ten-year (40 quarters) life-cycle profile of mean cumulativeexpenditure for individuals observed to have died in 2012/13. Cumulative mean expenditure increasesat a diminishing rate as a function of distance from death and are greater for decedents aged 24 to 64years at death than for decedents aged 65+ years, although the latter group make up by far the largestproportion of all deaths (399,165 deaths versus 64,664).9 Mean cumulative expenditure across the 40quarters was £19,547 in the 65+ age category and £20,732 for the 25-64 age category. Approximately25% of total mean cumulative expenditure falls in the final quarter to death.
8 We calculate quarters from death on the basis of date of death of the deceased as recorded on Office of National Statistics (ONS)Records and linked to HES data. A quarter is defined as 365/4 days. To be able to link ONS death records to HES an individualmust have had a hospital inpatient stay at some point during the 15 years of HES observations.
9 In addition, there were 5,407 deaths in the 0 to 24 age category.
Medical Spending and Hospital Inpatient Care in England: An Analysis over Time 15
Figure 14: Average Cumulative Expenditure by Quarter to Death
5.4.2. Trends in health care expenditure approaching death
Expenditure in the financial year of death together with expenditure for the general population of inpatienthealth care users across time is shown in Figure 15. Average expenditure is calculated separately forall individuals and for those observed to die within a given financial year.10 Average expenditure in thefinancial year of death was £4,886 in 1998/99 (2012 prices; see Figure 15, l.h.s.). This has increased by58% over time to £7,700 in 2012/13. The corresponding rise for the population of inpatient users as awhole is approximately 39%. The ratio of average expenditure in the last year to general expenditure, was2.39 in 1998/99 increasing to 2.71 in 2012/13. While expenditure in the final year of life is greater thanfor the general population, over time expenditure has risen more substantially for individuals approachingdeath.
Average expenditure in the financial year of death is greater for emergency admissions than for electiveadmissions (Figure 15, r.h.s.). This corresponds to the observed pattern of expenditure in the generalpopulation of inpatients. The drop in expenditure observed for 2007/08 is far more pronounced forindividuals in the last year of life than in the population of health care users. This is likely to be due to theintroduction of HRG4 which introduced unbundled HRGs (see Appendix B). Unbundled HRGs includeelements of activity that are likely to impact more on end of life care than general inpatient activity. Inthis respect, the observed difference over time in expenditure at the end of life compared to the generalpopulation of inpatients is likely to be a conservative estimate.
The increased average expenditure in the financial year of death is reflected in an increase in theaverage number of episodes (Figure 16). Note that the difference between men and women in theaverage number of episodes is far greater for those who died within the financial year than in the generalpopulation of inpatient health care users. This translates into a greater average expenditure in thefinancial year of death for men than women, with the difference between the sexes peaking across theseries at approximately £713 (not shown).
10 Accordingly, someone who dies in May will only contribute a month or so expenditure data to the estimate, while someone whodies in March of the following calender year will contribute potentially 12 months of expenditure data. The estimates will thereforebe an underestimate of the total mean expenditure if calculated over 12 months prior to the date of death.

CHE Research Paper 127 16
Figure 15: Average Inpatient Health care Expenditure in Financial Year of Death
Figure 16: Average Episodes in Financial Year of Death

Medical Spending and Hospital Inpatient Care in England: An Analysis over Time 17
6. Conclusions
The real terms increase in health expenditure observed in England over the last 20 years, which mirrorsthat of other countries, raises the spectre of health care spending becoming an ever greater proportionof GDP. In a publicly funded system such as the NHS this would place an ever-increasing burden ongovernment revenues at a time when financial constraints on the government are particularly tight. Itis, therefore, necessary to have a better understanding of what is driving increases in order to betterforecast and if necessary temper those drivers.
Our supposition is that in order to get that better understanding it is necessary to consider consistenttime series and to decompose expenditure. Longer time series give the ability to discern trends asdistinct from short term shocks, and decomposition allows trends to be understood better in terms of thecomplex interactions of volumes of treatments and their underlying costs. We have pursued this line ofinvestigation, focusing on hospital inpatient expenditures over a 15 year period in England.
There are many ways to subset data on hospital treatments; by the nature of the treatment itself; bythe characteristics of who the treatment is delivered to or by the characteristics of the supplier of thetreatment. Of necessity our examination has been preliminary and incomplete; we have restrictedattention to a few key characteristics of treatment (whether it is elective or emergency care) and to a fewkey characteristics of the recipients (their age, co-morbidities and their proximity to death). Neverthelessour analysis is informative.
In respect of inpatient hospital care it is hard to escape the conclusion that proximity to death is a verysubstantial driver of expenditure. This is often obscured by the general tendency of health care costs torise with a person’s age. Whilst this effect is evidenced in the data it is proximity to death rather than ageper se that seems the more important influence on costs. And whilst in general health care expendituresare rising, it appears that the gap between general expenditure and expenditure in last year of life is alsorising indicating that end of life care is becoming more expensive relative to general care. So when itcomes to hospital expenditure policy makers may need to pay more attention to the rate at which thepopulation is dying than to the rate at which it is ageing. There may also be important debates to behad as to whether managing the process of death in expensive health care facilities such as hospitals isappropriate.
Beyond proximity to death and general ageing our analysis also points to the disproportionate effectof multiple diseases in generating hospital expenditure. We cannot distinguish between whether thepopulation is getting sicker (perhaps because people are living longer) or whether we are simply gettingbetter at identifying multiple illnesses. In any case there appears to be an underlying trend towardsmultiple comorbidities and that trend has consequences in terms of increasing expenditure in hospitals.Again there is perhaps a challenge to both policy-makers and health care professionals here regardinghow best to manage individuals with these comorbidities.
What we do not find any obvious evidence of is a substantial role for increasing unit costs. Hospitalexpenditure in England has risen quickly because more people are treated and those who are treatedare treated more intensively across multiple episodes in hospital. As noted earlier, England has pursueda number of policies specifically targeted at improving efficiency of the hospital sector and thereforeaimed at ensuring that unit costs are kept under control. We cannot establish whether these policieshave been effective, because it is possible that in their absence we would have observed similar, oreven more benign trends in relation to correlation of activity and expenditure. However, there is the

CHE Research Paper 127 18
possibility of answering this question because other jurisdictions in the UK, which have similar healthcare systems, have not pursued the same policies. Comparative studies of these jurisdictions using thekind of extended decomposed trend analysis presented here is a potential avenue for future research.

Medical Spending and Hospital Inpatient Care in England: An Analysis over Time 19
References
De Nardi, M., E. French, J. Bailey Jones and J. McCauley (2015). Medical Spending of the U.S. Elderly.Mimeo.
Department of Health (2011). Department of Health Annual Report and Accounts 2010-11. Accessedon 24 July 2015. URL: https://www.gov.uk/government/publications/department-of-health-annual-report-and-accounts-2010-11.
— (2012). Reference costs 2011-12. Accessed on 24 July 2015. URL: https : / / www . gov . uk /government/uploads/system/uploads/attachment_data/file/213060/2011-12-reference-costs-publication.pdf.
Government Actuary’s Department (2013). Report by the Government Actuary on the draft SocialSecurity Benefits Up-rating Order 2013 and the draft Social Security (Contributions)(Re-rating) Order2013.
Harker, R. (2012). NHS funding and expenditure. House of Commons Library Note, April 2012.Health and Social Care Information Centre (2011). NHS Dental Services for England 2010/11. Accessed
on 24 July 2015. URL: http://www.hscic.gov.uk/pubs/dentalstats1011.Lloyd, T. (2015). Historical trends in the UK. The Health Foundation, Funding Overview.Office for National Statistics (2013). Mortality Statistics: Deaths Registered in UK by Area of Usual
Residence, 2011. Accessed on 24 July 2015. URL: http://www.ons.gov.uk/ons/publications/re-reference-tables.html?edition=tcm:77-275375.
Seshamani, M. and A. Gray (2004). ‘Ageing and health-care expenditure: the red herring argumentrevisited.’ Health Economics, 13: (4), 303–314.
UK Statutory Instrument 2009/407 (2009). The National Health Service (Dental Charges) AmendmentRegulations 2009.
Yang, Z., E. Norton and S. Stearns (2003). ‘Longevity and Health Care Expenditures: The Real ReasonsOlder People Spend More’. Journal of Gerontology: Social Sciences, 58B: (1), S2–S10.

CHE Research Paper 127 20
A. Data Sources Figures
Figure 1: OECD Health Statistics 2014 - Frequently Requested Data, http://www.oecd.org/els/health-systems/oecd-health-statistics-2014-frequently-requested-data.htm, accessed on 24July 2015.
Figure 2: Office for National Statistics. Expenditure on Healthcare in the UK: 2013, Reference Table 7: Per-centage Share of Public and Private Healthcare Expenditure, 1997-2013, http://www.ons.gov.uk/ons/rel/psa/expenditure-on-healthcare-in-the-uk/2013/art-expenditure-on-healthcare--2013.html,accessed on 24 July 2015.
Figure 3: OHE Guide to UK Health and Health Care Statistics 2013, Table 2.5.
Figure 4: Office for National Statistics. Public Service Productivity Estimates: Healthcare, 2012, Ref-erence Table 2: Public service healthcare expenditure shares, by output component, 1994-95 to 2011-12, http://www.ons.gov.uk/ons/rel/psa/public-sector-productivity-estimates--healthcare/2012/art-healthcare.html, accessed on 24 July 2015.
Figure 5: OHE Guide to UK Health and Health Care Statistics 2013, Table 2.3.
Other Figures: HES and Reference Costs.
Medical Spending and Hospital Inpatient Care in England: An Analysis over Time 21
B. Matching costs to activity
As noted in the text we needed to match Hospital Episodes Statistics data to Reference Costs. TheNHS Reference Costs are published by the Department of Health, and include the National Schedule ofReference Costs and the Reference Cost Index.11 They have been published for each financial year since1998/99. The National Schedule of Reference Costs reports, for different types of hospital, the nationalaverage cost for each HRG; these costs are calculated using the information reported by hospitals abouttheir activity and its cost in a financial year. The Reference Cost Index reports for each NHS hospital anindex comparing the actual cost of its activity with the cost it would have had if its costs were the nationalaverage costs. The costs included in the National Schedule of Reference Costs accounted for half of theNHS expenditure in 2011/12 (Department of Health 2012).
We use the average cost reported in National Schedule of Reference Costs for NHS Trusts (from now onthe Schedule), due to it being available for a longer period and that NHS Trusts account for most of theactivity reported in the Schedule (over 85% of the costs since 2006/07) (Department of Health 2012).We use the Schedule of the financial years 1998/99 to 2012/13.
The Schedule includes different types of activity and reports for each HRG the number of episodes, theaverage unit cost of an episode, the highest and lowest reported cost and the interquartile range. Thesecosts are not adjusted for differences in cost across the country and exclude excess bed days (excessbed days are reported separately since 2003/04).
The average unit costs of episodes is reported for different types of activity, and more types of activityhave been included over time as the scope of the Reference Cost increased, e.g. in 1998/99 it includedelective, non-elective, day cases, outpatients, and critical care, and the following year it additionallyincluded radiotherapy, A&E services and community services. Other types of activity reported in theSchedule in later years include specialist services, pathology and radiology services, and mental healthservices.
The comparison of costs over time is not direct since there have been changes to the Reference Costs,such as the HRG classification, the trim points that determine excess bed days, and the requirements forthe collection of costs from the hospitals. In addition to these general changes there have been someother changes that need to be kept in mind when comparing costs over time. Activity that cannot beassigned to treatments or procedures (given an HRG code starting with ’U’) is normally not includedin the Schedule, with the exception of 2001/02 and 2002/03 when these U-codes were included. In2004/05 the NHS was given funding to cover an increase in pensions indexation that occurred the yearbefore, and this increased cost is reflected in the reference costs. From 2005/06 onwards non-electiveadmissions no longer include the cost incurred in observation wards prior to the admission.
The HRG classification used in the Schedule varies over time, as new versions became available.Between 1998/99 and 2002/03 the Schedule used HRG3.1, between 2003/04 and 2005/06 HRG3.5 andbetween 2006/07 and 2011/12 HRG4.12 In 2012/13 HRG4+ was introduced. However, in our data we
11 More details about the Reference Costs can be found in the following links (both accessed on 24 July 2015):http://webarchive.nationalarchives.gov.uk/20130107105354/http://www.dh.gov.uk/en/Managingyourorganisation/NHScostingmanual/DH_129310 (1998/99 - 2008/09)https://www.gov.uk/government/collections/nhs-reference-costs (2009/10 onwards)
12 Note that within HRG4 the number of HRGs varies from year to year, for details see ‘HRG4 2011/12 Reference Costs GrouperRoots’ in http://www.hscic.gov.uk/article/2610/HRG4-201112-Reference-Costs-Grouper-Documentation, accessed on24 July 2015.

CHE Research Paper 127 22
used HRG4 since 2007/08 and use the HRG3.5 costs from 2005/06 to cost the activity of 2006/07, sincethe Reference Cost Grouper for that year does not work properly.
The change in the HRG classification from HRG3.5 to HRG4 has an impact on our data because ofthe increase in the number of HRGs that have zero cost and changes in the way non-elective costs arereported.
Since we are interested in the cost of the activity reported in the Admitted Patient HES, we will useonly three types of activity: elective, non-elective, and day case, these three types of activity accountfor around 42% of the costs reported in the Scheduled (Department of Health 2012).13 We assignthe elective average cost to episodes that are recorded as ordinary elective admissions14; the daycase average cost to episodes recorded as day case or as regular attender15; and the non-electivecost to emergencies16 and maternity17. It is important to note that by using the average cost we areunderestimating costs as this excludes excess bed days and procedures that require days of critical care,the costs for which are reported separately in the Schedule. To attach costs to the HES inpatient data weuse the HRG code of each episode.18
The financial year 2007/08 is the first one for which we use HRG4. As can be seen in Figures 6 and 7this change of HRG version coincides with a drop in the total cost, particularly for non-electives. We haveexplored possible causes of this drop and provide some details next.
The first reason why the change in the HRG classification, going from HRG3.5 to HRG4, has an impact onour data is the increase in the number of HRGs that have zero cost. In HRG3.5 only U-codes and mentalhealth HRGs had zero cost. HRG4 introduced unbundled HRGs19, which leave some (core) HRGs withzero cost since the cost associated with that episode is recorded separately. So, in HRG4 there are moreHRG codes that have no associated cost than in HRG3.5, which will appear as a decrease in the activityin our data, since we only consider episodes with cost; additionally, the proportion of U-codes increasesin the two financial years after the introduction of HRG4, probably due to the greater complexity of theHRG allocation process.
To quantify how much of the drop observed on the figures can be explained by the presence of zerocost (core) HRGs we identified the zero cost HRGs20 with most activity in each financial year since2007/08 and used information available in the Schedule for unbundled HRGs or from other years toinpute a cost. The zero cost HRGs with most activity were the following: PB03Z (Healthy Baby), SB97Z(Same day Chemotherapy admission/attendance), SC97Z (Same day External Beam RadiotherapyAdmission or Attendance), LA08E (Chronic Kidney Disease with length of stay 1 day or less associatedwith Renal Dialysis21). PB03Z had costs for inpatient, day case and non-elective in the 2009/10 Schedule,
13 Other costs reported in the Schedule include outpatient, A&E and non-acute activity.14 Coded as classpat = 1 & admimeth = 11, 12, or 13.15 Coded as classpat = 2, 3, or 4 & admimeth = 11, 12, or 13.16 Coded as admimeth = 21, 22, 23, 24, or 28.17 Coded as admimeth = 31 or 32.18 Up to 2006/07 we use the HRG code recorded in HES, and from 2007/08 we use the HRG code that is produced by the Reference
Cost Grouper of the corresponding year. In 2006/07 HES reports HRG3.5 but the Schedule uses HRG4, so it is not possible tomatch the data, so we used the Schedule for 2005/06 to assign the cost for each episode. From 2007/08 onwards the Schedulereports non-elective activity separated by long stay and short stay, we use the weighted average of these two costs for each HRGas the average cost of non-elective activity.
19 Unbundled HRGs represent additional elements of care (e.g. chemo- and radiotherapy, high costs drugs), which are alwaysassociated with a core HRG that represents a care event (e.g. inpatient, day case, outpatient).
20 Other than U-codes and mental health.21 In 2012/13 this HRG was removed and replaced by two HRGs, LA97A and LA97B, that separate dialysis patients by age.
Medical Spending and Hospital Inpatient Care in England: An Analysis over Time 23
so we used these costs in previous and later years that do not report it. For SB97Z, SC97Z andLA08E (LA97A, LA97B) we used the national average reference cost from the 2012/13 Schedule forChemotherapy, Radiotherapy and Renal Dialysis, respectively.22,23 The costs related to the zero costHRGs with most activity account for £200-£600 million (in 2012 prices) in the years following the changeof HRG classification.
Another change that could be behind the drop observed in Figures 6 and 7 is the way the non-electivecosts are reported in the Schedule, up to 2006/07 there was only one non-elective cost and from 2007/08onwards non-elective activity is separated into long stay and short stay; we use the weighted average ofthese two costs for each HRG. The effect of this change can be quantified using the information availablein the Schedule for non-elective in 2007/08 and 2006/07. We calculated the total cost for the 2007/08activity (short stay plus long stay) using both the weighted average of the non-elective short and longstay cost for each HRG in 2007/08 and using the non-elective cost for 2006/07. The difference betweenthese two approaches accounted for approximately £400 million (in 2012 prices). It is important to notethat this approximation is incomplete as there are HRG codes in 2007/08 that did not exist in 2006/07.
The observed drop in expenditure to 2007/08 would appear to be due substantially to changes in thedetailed implementation of the Payment by Results National Tariff which reduced prices for a largenumber of emergency admissions. As we are unable to explain the total drop in expenditure through theabove imputations, in the main body of the paper, we use activity as recorded in HES together with theappropriate HRG classification, including HRG4 from 2007/08 onwards.
22 See ‘National schedule of reference costs: the main schedule’ in https://www.gov.uk/government/publications/nhs-reference-costs-2012-to-2013, accessed on 24 July 2015.
23 These national averages are calculated including activity from settings that are not in HES (outpatient and other), but the averagesobtained focusing only in the settings relevant for HES (inpatient, day case, regular attenders) are similar, so we simply use thenational average.