Medical Image Analysislatecki/Papers/MIA2018.pdf · 2018-02-16 · According to the Nottingham...
13
Medical Image Analysis 45 (2018) 121–133 Contents lists available at ScienceDirect Medical Image Analysis journal homepage: www.elsevier.com/locate/media DeepMitosis: Mitosis detection via deep detection, verification and segmentation networks Chao Li a , Xinggang Wang a,∗ , Wenyu Liu a , Longin Jan Latecki b a School of Electronics Information and Communications, Huazhong University of Science and Technology, Wuhan, PR China b CIS Department, Temple University, Philadelphia, PA 19122, USA a r t i c l e i n f o Article history: Received 30 April 2017 Revised 11 October 2017 Accepted 2 December 2017 Available online 31 January 2018 Keywords: Mitosis detection Faster R-CNN Fully convolutional network Breast cancer grading a b s t r a c t Mitotic count is a critical predictor of tumor aggressiveness in the breast cancer diagnosis. Nowadays mitosis counting is mainly performed by pathologists manually, which is extremely arduous and time- consuming. In this paper, we propose an accurate method for detecting the mitotic cells from histopatho- logical slides using a novel multi-stage deep learning framework. Our method consists of a deep segmen- tation network for generating mitosis region when only a weak label is given (i.e., only the centroid pixel of mitosis is annotated), an elaborately designed deep detection network for localizing mitosis by us- ing contextual region information, and a deep verification network for improving detection accuracy by removing false positives. We validate the proposed deep learning method on two widely used Mitosis Detection in Breast Cancer Histological Images (MITOSIS) datasets. Experimental results show that we can achieve the highest F-score on the MITOSIS dataset from ICPR 2012 grand challenge merely using the deep detection network. For the ICPR 2014 MITOSIS dataset that only provides the centroid location of mitosis, we employ the segmentation model to estimate the bounding box annotation for training the deep detection network. We also apply the verification model to eliminate some false positives produced from the detection model. By fusing scores of the detection and verification models, we achieve the state- of-the-art results. Moreover, our method is very fast with GPU computing, which makes it feasible for clinical practice. © 2018 Elsevier B.V. All rights reserved. 1. Introduction According to the Nottingham Grading System (Elston and Ellis, 1991), there are three important morphological features on Hematoxylin and Eosin (H&E) stained slides for breast cancer grading. They are mitotic count, tubule formation, and nuclear pleomorphism. Among them, mitotic count is the most important biomarker. Pathologists usually search for mitosis on high-power fields (HPFs) manually. It is a time-consuming and tedious task due to the large number of HPFs in a single whole slide and the high variation in the appearance of mitotic cells. Besides, the judgment of mitotic cell is very subjective, making it hard to reach a consensus on mitotic count among pathologists. Thus it is very essential to develop automatic detection methods, which will not only save a lot of time, manpower and material resources, but also improve the reliability of pathological diagnosis. ∗ Corresponding author. E-mail addresses: [email protected] (C. Li), [email protected] (X. Wang), [email protected] (W. Liu), [email protected] (L.J. Latecki). Mitosis detection from the H&E stained histopathological im- ages is hard due to the following challenges. First, the appearance of mitosis varies in a wide range, as shown in Fig. 1(a). Mitosis has four phases called prophase, metaphase, anaphase and telophase. The shapes and structures of cells in different phases are diverse. In the telophase stage, the nucleus of cell has split into two parts, but they should still be counted as one cell because they are not yet separated completely from each other. In the third row of Fig. 1(a), we show some mitotic cells in telophase stage. Second, mitotic cells are considerably less than non-mitotic cells. The low probability of their occurrence makes the detection more difficult. Third, there are some other cells (like apoptotic cells, dense nu- clei) that have similar appearances with mitosis, making it hard to screen them out. Fig. 1(b) illustrates some non-mitotic cells. Recently, many automatic mitosis detection methods have been proposed. This phenomenon owes to some mitosis detection con- tests including the 2012 ICPR mitosis detection contest (Roux et al., 2013), the AMIDA13 contest at MICCAI 2013 (Veta et al., 2015), the 2014 ICPR MITOS-ATYPIA challenge (MITOS-ATYPIA-14, 2014), and the mitosis detection task in TUPAC16 contest at MICCAI 2016 (TUPAC16, 2016). Many of the existing methods use handcrafted https://doi.org/10.1016/j.media.2017.12.002 1361-8415/© 2018 Elsevier B.V. All rights reserved.
Transcript of Medical Image Analysislatecki/Papers/MIA2018.pdf · 2018-02-16 · According to the Nottingham...
Medical Image Analysis 45 (2018) 121–133
Contents lists available at ScienceDirect
Medical Image Analysis
journal homepage: www.elsevier.com/locate/media
DeepMitosis: Mitosis detection via deep detection, verification and
segmentation networks
Chao Li a , Xinggang Wang
a , ∗, Wenyu Liu
a , Longin Jan Latecki b
a School of Electronics Information and Communications, Huazhong University of Science and Technology, Wuhan, PR China b CIS Department, Temple University, Philadelphia, PA 19122, USA
a r t i c l e i n f o
Article history:
Received 30 April 2017
Revised 11 October 2017
Accepted 2 December 2017
Available online 31 January 2018
Keywords:
Mitosis detection
Faster R-CNN
Fully convolutional network
Breast cancer grading
a b s t r a c t
Mitotic count is a critical predictor of tumor aggressiveness in the breast cancer diagnosis. Nowadays
mitosis counting is mainly performed by pathologists manually, which is extremely arduous and time-
consuming. In this paper, we propose an accurate method for detecting the mitotic cells from histopatho-
logical slides using a novel multi-stage deep learning framework. Our method consists of a deep segmen-
tation network for generating mitosis region when only a weak label is given (i.e., only the centroid pixel
of mitosis is annotated), an elaborately designed deep detection network for localizing mitosis by us-
ing contextual region information, and a deep verification network for improving detection accuracy by
removing false positives. We validate the proposed deep learning method on two widely used Mitosis
Detection in Breast Cancer Histological Images (MITOSIS) datasets. Experimental results show that we
can achieve the highest F-score on the MITOSIS dataset from ICPR 2012 grand challenge merely using the
deep detection network. For the ICPR 2014 MITOSIS dataset that only provides the centroid location of
mitosis, we employ the segmentation model to estimate the bounding box annotation for training the
deep detection network. We also apply the verification model to eliminate some false positives produced
from the detection model. By fusing scores of the detection and verification models, we achieve the state-
of-the-art results. Moreover, our method is very fast with GPU computing, which makes it feasible for
clinical practice.
© 2018 Elsevier B.V. All rights reserved.
1
E
H
g
p
b
fi
d
t
j
a
e
o
i
l
a
o
f
T
I
b
y
F
m
p
T
c
s
p
h
1
. Introduction
According to the Nottingham Grading System ( Elston and
llis, 1991 ), there are three important morphological features on
ematoxylin and Eosin (H&E) stained slides for breast cancer
rading. They are mitotic count, tubule formation, and nuclear
leomorphism. Among them, mitotic count is the most important
iomarker. Pathologists usually search for mitosis on high-power
elds (HPFs) manually. It is a time-consuming and tedious task
ue to the large number of HPFs in a single whole slide and
he high variation in the appearance of mitotic cells. Besides, the
udgment of mitotic cell is very subjective, making it hard to reach
consensus on mitotic count among pathologists. Thus it is very
ssential to develop automatic detection methods, which will not
nly save a lot of time, manpower and material resources, but also
mprove the reliability of pathological diagnosis.
∗ Corresponding author.
E-mail addresses: [email protected] (C. Li), [email protected] (X. Wang),
[email protected] (W. Liu), [email protected] (L.J. Latecki).
t
2
t
a
(
ttps://doi.org/10.1016/j.media.2017.12.002
361-8415/© 2018 Elsevier B.V. All rights reserved.
Mitosis detection from the H&E stained histopathological im-
ges is hard due to the following challenges. First, the appearance
f mitosis varies in a wide range, as shown in Fig. 1 (a). Mitosis has
our phases called prophase, metaphase, anaphase and telophase.
he shapes and structures of cells in different phases are diverse.
n the telophase stage, the nucleus of cell has split into two parts,
ut they should still be counted as one cell because they are not
et separated completely from each other. In the third row of
ig. 1 (a), we show some mitotic cells in telophase stage. Second,
itotic cells are considerably less than non-mitotic cells. The low
robability of their occurrence makes the detection more difficult.
hird, there are some other cells (like apoptotic cells, dense nu-
lei) that have similar appearances with mitosis, making it hard to
creen them out. Fig. 1 (b) illustrates some non-mitotic cells.
Recently, many automatic mitosis detection methods have been
roposed. This phenomenon owes to some mitosis detection con-
ests including the 2012 ICPR mitosis detection contest ( Roux et al.,
013 ), the AMIDA13 contest at MICCAI 2013 ( Veta et al., 2015 ),
he 2014 ICPR MITOS-ATYPIA challenge ( MITOS-ATYPIA-14, 2014 ),
nd the mitosis detection task in TUPAC16 contest at MICCAI 2016
TUPAC16, 2016 ). Many of the existing methods use handcrafted

122 C. Li et al. / Medical Image Analysis 45 (2018) 121–133
Fig. 1. Examples of mitotic cells and non-mitotic cells. (a) shows some mitotic cells. The third row contains mitoses in telophase stage. (b) shows some non-mitotic cells
with similar appearances to mitotic cells.
t
(
c
d
i
m
a
m
2
a
b
d
p
c
a
b
w
d
F
t
l
p
d
r
d
m
t
f
p
i
t
m
b
d
(
a
features to model the appearance of mitotic cells. Some methods
( Sommer et al., 2012; Irshad et al., 2013; Khan et al., 2012; Veta
et al., 2013; Tek et al., 2013 ) design different sorts of statistical,
morphological and textural features to explicitly capture character-
istics of mitosis. However, due to the diverse and complex shapes
of mitosis and the existence of confounding cells, it is hard to
manually design discriminative features to effectively distinguish
mitosis from non-mitotic cells.
Since the remarkable work of Krizhevsky et al. (2012) in ILSVRC
2012 ( Russakovsky et al., 2015a ), convolutional neural networks
(CNN) have revolutionized the world of computer vision. The
methods based on CNN have set up new records in many vision
tasks, such as image classification ( He et al., 2016; Tang et al.,
2017; Wang et al., 2018 ), object detection ( Ren et al., 2015; Li et al.,
2017 ) and semantic segmentation ( Long et al., 2015 ). In biomedical
analysis field, CNN based methods also yield excellent perfor-
mance in several tasks, for instance, the brain tumor segmentation
( Havaei et al., 2017 ), the analysis of developing embryos from
videos ( Ning et al., 2005 ), and so on. Hence some CNN based ap-
proaches ( Malon et al., 2013; Cire ̧s an et al., 2013; Wang et al., 2014;
Chen et al., 2016a; 2016b ) have been proposed to detect mitosis.
Compared with traditional methods, deep learning based methods
can learn more efficacious features from data automatically.
Current deep networks based mitosis detection methods typi-
cally fall into two categories. (1) Considering mitosis detection as
a classification problem, e.g., IDSIA ( Cire ̧s an et al., 2013 ) classifies
image patches using a plain CNN. This strategy could be regarded
as a sliding-window-based mitosis detection method, which is
very slow. (2) Considering mitosis detection problem as a semantic
segmentation problem, e.g. Chen et al. (2016b) infer the location of
mitosis using fully convolutional networks (FCN), which ignores re-
gion information and makes it hard to deal with weak labels, e.g.,
the 2014 MITOSIS dataset that only labels the center of mitosis.
We argue that it makes more sense to consider the mitosis
detection task as an object detection problem, and propose a
method named DeepMitosis using deep detection network to solve
this problem. Meanwhile, to the best of our knowledge, this is the
first paper that applies a deep detection method to the mitosis
detection problem.
Faster R-CNN ( Ren et al., 2015 ), a region-based ConvNets de-
ection model, uses a fully convolutional Region Proposal Network
RPN) to generate proposals and then applies a region-based
lassification network to classify these proposals. We adapt this
eep detection model to the mitosis detection task.
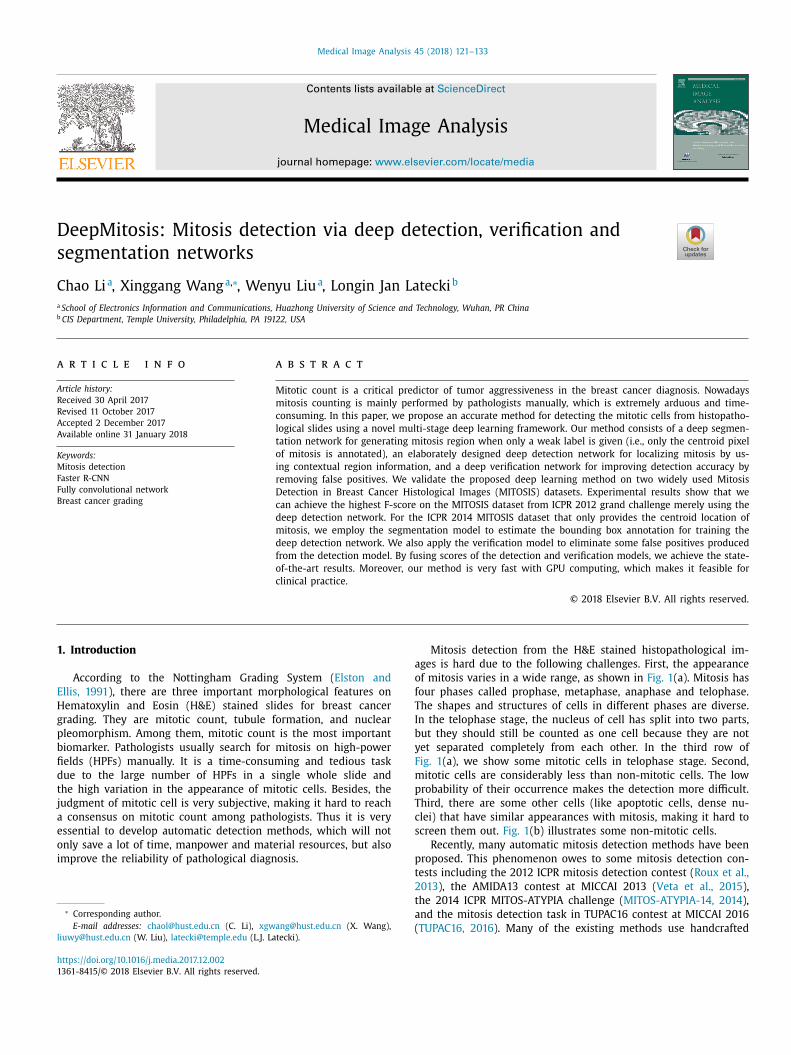
An overview of the proposed DeepMitosis system is illustrated
n Fig. 2 . It consists of three components: a deep segmentation
odel based on FCN for producing estimated bounding box labels,
deep detection model based on Faster R-CNN for localizing
itosis, and a deep verification model based on ResNet ( He et al.,
016 ) for classifying the detection patches to further improve the
ccuracy. The training of deep detector demands the bounding
ox labels. We can train the detector on 2012 MITOSIS dataset
irectly since this dataset has already given the label of each
ixel. However, the 2014 MITOSIS dataset only annotates the
entroid of mitosis, thus we need to estimate the bounding box
nnotations of mitotic cells before training the detector. Inspired
y the success of FCN in semantic segmentation in natural images,
e utilize a FCN model that has been trained on 2012 MITOSIS
ataset to perform segmentation on the 2014 MITOSIS dataset.
or each labeled centroid, we infer a bounding box by combining
he segmentation result and the centroid label. The predicted box
abels are then utilized to train the deep detector. The inference
rocess has two stages, as shown in Fig. 2 (b). Firstly we run the
eep detection model on a histology image to produce detection
esults, and then these detected image patches are fed into the
eep verification model for further refinement. The verification
odel is a ResNet ( He et al., 2016 ), which is a powerful classifica-
ion network. The final result is a weighted sum of the predictions
rom the detection model and the verification model.
In summary, we have at least four main contributions in this
aper. (1) We obtain the state-of-the-art results on two challeng-
ng mitosis detection datasets with high detection speed. (2) We
ailor the general object detection framework Faster R-CNN to
itosis detection in H&E stained histopathological images. To our
est knowledge, this work is the first time the proposal-based
eep detection CNN is applied to the mitosis detection problem.
3) We propose a solution to train bounding box detector in
weakly supervised way, through using a deep segmentation
C. Li et al. / Medical Image Analysis 45 (2018) 121–133 123
DeepSegmentation
model
image segmentation estimated bouding boxes
(a)
Deep DeepDetection Verificationmodel model
image detection refined detection
(b)
Fig. 2. Mitosis detection system overview. (a) In training phase, it shows the process of generating estimated bounding box label for 2014 MITOSIS dataset. The yellow dot
denotes the original centroid annotation, while the green box denotes the estimated bounding box. The top segmented blob does not correspond to a marked centroid, so
we discard it. (b) In testing phase, it shows the mitosis detection pipeline which includes a deep detection model followed by a deep verification model. The yellow box and
green box are false positive and true positive, respectively. A false positive is filtered out in the verification stage. (For interpretation of the references to color in this figure
legend, the reader is referred to the web version of this article.)
n
d
e
v
a
F
v
r
o
s
C
2
m
t
b
d
e
L
P
c
b
m
m
o
a
a
t
(
C
c
r
c
r
d
2
a
w
A
t
t
d
c
c
c
c
fi
s
d
a
(
i
a
s
2
d
c
t
C
c
m
e
d
p
p
f
s
s
t
(
r
p
a
t
p
R
a
p
t
o
a
etwork to estimate bounding box labels. This weakly supervised
etector learning method helps to significantly reduce the labeling
ffort of pathologist. (4) We adopt a classification model to further
erify the detection results. The deep verification model provides
bootstrapping mechanism for mining hard negative examples.
using the predictions of the deep detection model and deep
erification model can improve the performance.
The rest of this paper is organized as follows. A brief review of
elated work is given in Section 2 . Section 3 introduces the details
f our proposed approach. Section 4 presents the experiments and
hows state-of-the-art results on two publicly available datasets.
onclusions are made in Section 5 .
. Related work
There have been many approaches proposed for automatic
itosis detection. In terms of the image features, we can divide
hem into two types, handcrafted features based and CNN features
ased.
Handcrafted features are widely applied in this problem to
escribe the appearance of mitotic cells ( Veta et al., 2013; Khan
t al., 2012; Wang et al., 2014; Sommer et al., 2012; Huang and
ee, 2012; Malon et al., 2013; Irshad et al., 2013; Tek et al., 2013;
aul and Mukherjee, 2015 ). The handcrafted features usually
ontain shape, statistical and textural features. They are designed
ased on the domain knowledge of pathologists to recognize
itosis. The features are usually classified by support vector
achines (SVM), random forest and Adaboost, etc. The drawback
f the handcrafted features is that they fail to well describe the
ppearance of mitosis. Since there are a variety of morphologies
nd textures in mitotic cells, it is hard to manually design features
o describe all mitosis very accurately.
Another type of features used in this task is based on CNNs
Malon et al., 2013; Wang et al., 2014; Cire ̧s an et al., 2013;
hen et al., 2016a ). Compared with the handcrafted features,
onvolutional features prove more powerful since they learn the
epresentation of mitosis automatically. The disadvantage of deep
onvolutional features is their complexity in computation and a
elatively long training time. Malon et al. (2013) combine manually
esigned features with CNN features and obtain a 0.659 F-score on
012 MITOSIS dataset. IDSIA ( Cire ̧s an et al., 2013 ) directly applies
deep classification network to images in a sliding window
ay. It yields the highest F-score at 2012 MITOSIS contest and
MIDA13 challenge among all participating methods. However,
his detection way is very computationally intensive, which makes
he method not practical in clinic. HC+CNN ( Wang et al., 2014 )
esigns a cascade system that requires fewer computing resources
ompared with IDSIA ( Cire ̧s an et al., 2013 ). It utilizes both hand-
rafted features and CNN features. In the test stage, images are
lassified by the handcrafted features based classifier and the CNN
lassifier, respectively. Once the detection results of the two classi-
ers are not consistent, the image would be further classified by a
econd-stage classifier trained with both features. It is not a pure
eep learning based method. Selecting candidates is still based on
traditional cell segmentation method using Laplacian of Gaussian
LoG) responses on color ratios. This candidate generation method
s prone to missing mitosis since the handcrafted features cannot
ccurately describe the mitosis. The CNN they used is relatively
mall with weak capacity of discrimination. CasNN ( Chen et al.,
016a ) adopts two convolutional neural networks to make up a
eep cascaded detection system: a coarse retrieval model to locate
andidates through fully convolutional networks, and a classifica-
ion network to find out mitosis from the candidates. Though the
asNN ( Chen et al., 2016a ) utilizes a neural network to produce
andidates, its two components (retrieval model and classification
odel) are trained independently. It is not trained in an end-to-
nd way, which impedes the integration of the two networks.
Different from previous methods, we apply a single deep
etection model to this problem. Our deep detection model is a
ure deep learning based method, which can produce candidate
roposals and classify them in a single model. Convolutional
eatures are shared between the region proposal network and the
ubsequent classification network in this model. We train the two
ub-networks jointly in an end-to-end fashion.
Deep learning based methods have significantly improved
he accuracy of object detection and image classification
Krizhevsky et al., 2012 ). The Region based convolutional neu-
al network (R-CNN) ( Girshick et al., 2014 ) uses region proposals
roduced by the selective search algorithm ( Uijlings et al., 2013 ),
nd recognizes the proposals by SVM with deep convolutional fea-
ures. R-CNN is very slow because it performs a ConvNet forward
ass for each proposal. To accelerate the detection speed, Fast
-CNN ( Girshick, 2015 ) computes features for the entire image
nd extracts the proposal features using a region of interest (RoI)
ooling layer. However, the proposals are still generated by a
raditional and external method, which accounts for a high portion
f processing time. To address this problem, Faster R-CNN applies
RPN to generate proposals. The RPN shares the convolutional
124 C. Li et al. / Medical Image Analysis 45 (2018) 121–133
s
F
o
t
c
p
a
v
fi
o
p
o
f
I
n
t
c
W
c
p
f
T
t
u
s
p
w
d
a
a
m
s
i
i
w
o
t
I
a
t
a
s
i
b
t
t
g
t
m
a
t
b
3
d
a
A
p
d
features with the Fast R-CNN classification network. This detector
achieves a frame rate of 5 fps. The R-CNN based methods have
been applied in many detection tasks, such as pedestrian detection
( Zhang et al., 2016; Li et al., 2015 ) and cell-phone usage detection
( Hoang Ngan Le et al., 2016 ).
The fully convolutional network is proposed for semantic
segmentation task. It achieves state-of-the-art performance in
several segmentation datasets, including PASCAL VOC and NYUDv2
( Silberman et al., 2012 ). Inspired by FCN, holistically-nested
edge detection (HED)( Xie and Tu, 2015 ) is proposed. It utilizes
the deeply-supervised nets (DSN) ( Lee et al., 2015 ) to perform
multi-scale and multi-level feature learning. The multi-scale results
provide a more accurate edge pixel localization and refine the edge
segmentation prediction. Recently, some deep segmentation meth-
ods have been proposed for medical image analysis ( Ronneberger
et al., 2015; Roth et al., 2016; Christ et al., 2017; Havaei et al.,
2017; Kamnitsas et al., 2017 ). U-Net ( Ronneberger et al., 2015 )
extends the architecture of FCN by a symmetric expanding path.
This network has shortcut connections from low layers (con-
tracting path) to high layers (expanding path) that have equal
resolution. Spatial information from low layers can be propagated
to high layers so that the localization is more accurate. The work
in Roth et al. (2016) utilizes HED ( Xie and Tu, 2015 ) to learn
organ interior and boundary mid-level cues for subsequent spatial
aggregation in pancreas segmentation. The deeply learned mid-
level cues are beneficial to the organ segmentation and lead to
state-of-the-art results for pancreas segmentation in CT abdomen
images. CFCN ( Christ et al., 2017 ) deploys cascaded FCNs for the
combined automatic segmentation of the liver and its lesions. This
method selects the U-Net architecture ( Ronneberger et al., 2015 )
as the FCN segmentation model. A first U-Net segments the liver
and then a second U-Net segments the lesions within the liver
ROIs. Havaei et al. (2017) propose a two-pathway architecture for
brain tumor segmentation. The two pathways respectively model
local details and global context. However, this network predicts
the class of a pixel with a patch centered at that pixel, which is
less efficient.
Though there have been some CNN-based methods for mitosis
detection, most of them use the CNN to classify patches or extract
features. We observe that no detection network, like R-CNN, has
been applied to this task. Our method adapts a deep detection
model to this medical image task. Furthermore, we solve the
problem of training the detection model on weakly annotated
mitosis data by means of a segmentation model. In addition, we
use a multi-stage system to improve the accuracy by fusing the
predictions of detection component and verification component.
3. Methods
In this section, we describe the DeepMitosis method in detail.
It mainly consists of three components. A deep detection model
(DeepDet) produces primary detection results. A deep verifica-
tion model (DeepVer) verifies these detections and eliminates
false positives. In addition, for the weak annotations that do not
provide pixel-level labels, we utilize a deep segmentation model
(DeepSeg) to segment the images and obtain estimated bounding
boxes annotations.
3.1. Using deep detection network to detect mitosis
DeepDet is the core component of our DeepMitosis system. We
illustrate the architecture of DeepDet in Fig. 3 . It utilizes a RPN to
generate category-agnostic proposals. Over the last convolutional
feature map, reference boxes with different scales and aspect ratios
are generated at each position. These reference boxes are called an-
chors. Two sibling fully-connected layers are responsible for clas-
ifying the anchor and regressing the bounding box, respectively.
or each anchor box, the anchor classifier predicts its probability
f being a foreground object, and the bounding box regressor es-
imates the location coordinates of the object. With the predicted
oordinates, the anchor box can be transformed to a region pro-
osal. Then, for each object proposal, a RoI pooling layer extracts
fixed-length feature vector from the feature map. The feature
ector of the proposal is then fed into the region-based classi-
cation network. The classification network also has two sibling
utput layers, one softmax layer for estimating the classification
robability, and a regressor layer for encoding the bounding boxes
f each class. To reduce the computational cost, the convolutional
eatures of the classification network are shared with the RPN.
The anchors of RPN have three scales and three aspect ratios.
n this application, the shape of mitosis is irregular, making it
ecessary to apply multiple aspect ratios. We follow the default
hree aspect ratios of anchors in RPN, which are 1:1, 1:2 and 2:1.
Since the resolution of HPF images is very large, it is not
onvenient to utilize the full image to train the detector directly.
e extract highly overlapped patches from original images, which
an be considered as a way of data augmentation.
Mitotic cell is relatively small with an average side of 30
ixels in HPF images. However, the stride in the last convolutional
eature map of RPN is equivalent to 16 pixels in the original image.
he coarse feature map is not suitable for accurate object localiza-
ion, especially for the small mitoses. To address this problem, we
p-sample the image patches by factor of two. Thus the 16 pixels
tride in the last convolutional feature map is equivalent to 8
ixels in the original image. The Faster R-CNN uses 3 anchor scales
ith areas of 128 2 , 256 2 , and 512 2 pixels for detecting objects of
ifferent scales. Statistics about mitotic cell area show that there
re few large mitotic cells, so we remove the largest scale 512 and
dd a small scale 64. The modified anchors can effectively cover
ost mitotic cells.
DeepDet is trained in an end-to-end way. The image mini-batch
ize is one. 256 anchors from an image are selected during a train-
ng batch. If an anchor is overlapped with any ground-truth bound-
ng box and the Intersection-over-Union (IoU) is higher than 0.7, it
ould be assigned as a positive sample. On the contrary, if the IoU
f an anchor is lower than 0.3 for all ground truth bounding boxes,
he anchor would be assigned as a false sample. The anchors with
oU between 0.3 and 0.7 are ignored during training, because they
re not typical samples and prone to introduce confusion.
RPN predicts the category (object or not object) and regresses
he bounding box for each anchor. Through the regression, anchors
re converted to proposals for the down-stream region-based clas-
ification network. To train the classification network, a proposal
s labeled as foreground if its IoU with a ground-truth bounding
ox is not less than 0.5. If its maximum IoU with any ground
ruth is in the interval [0.1, 0.5), it is labeled as background. In
his way, the chosen background proposals are all overlapped with
round truth, while most background region would not contribute
o the training. Considering that the number of mitosis is small,
any hard negatives in background region should be taken into
ccount during the training. Therefore, we change the IoU interval
o [0, 0.5). Thus the negative proposals can be selected from the
ackground region not overlapping with mitosis.
.2. Refining detection results by deep verification network
For the detector trained with estimated bounding boxes, its
etection results may include many false positives. Thus we need
verification model following the DeepDet to refine the results.
nother motivation to apply the verification model is that it can
rovide hard examples mining for the overall system. Faster R-CNN
oes not use bootstrapping and lacks the capacity for mining hard

C. Li et al. / Medical Image Analysis 45 (2018) 121–133 125
conv layers
proposals
conv feature mapRoI
pooling
FCssoftmax
bbox regressorfor each RoI
96
256 512
anchor boxes
anchor classifier bounding box regressor
RPN
Detection
region-based classifier
Fig. 3. The architecture of DeepDet model. It consists of a RPN and a region-based classifier. It takes a histology image and generates convolutional feature maps. Upon the
last feature map, anchors with multiple scales and aspect ratios are produced at each location. These anchors are handled by anchor classifiers and bounding box regressor
to produce proposals. For each proposal, the RoI pooling layer extracts a fixed-length feature vector from the feature map. Then the region-based classifier outputs a score
and a refined bounding box position for each region proposal. The green box and yellow box in the last detection image mark true positive and false positive, respectively.
(For interpretation of the references to color in this figure legend, the reader is referred to the web version of this article.)
train
1x1
+
x
relu xidentity3x3
relu
image
F(x)
F(x)+x
7x7
ResNet 50
1x1relu
fc2
softmax
positivesamples
negativesamples
Fig. 4. The architecture of DeepVer model. It is based on ResNet. Here we illustrate
a building block. The F ( x ) is the residual function that the stacked nonlinear layers
need to fit. The shortcut connection simply performs identity mapping, and its out-
put is added to the residual mapping F ( x ). A deep ResNet is constructed by stacking
these blocks. DeepVer is trained with the detection results of DeepDet.
e
R
c
I
m
m
p
t
v
t
w
i
o
c
a
u
w
i
o
l
s
b
s
w
t
S
S
T
s
t
o
p
p
e
3
n
i
r
t
g
o
b
b
b
p
a
b
t
e
o
xamples ( Shrivastava et al., 2016 ). In the DeepDet training, the
PN proposals that are wrongly classified by the region-based
lassifier cannot be collected for the training of next iterations.
n fact, these hard samples are very beneficial to the model opti-
ization. They can greatly enhance the discriminative capacity of
odel. Our verification model is trained on the DeepDet’s results,
articularly the produced false positives, so it can learn the ability
o identify the hard mimics. Thus the verification model can be
iewed as a way of hard example mining for DeepDet.
We collect all the detections produced by DeepDet to train
he DeepVer model. For each detection, we extract a square patch
ith fixed size. Our DeepVer model is illustrated in Fig. 4 . It
s based on the ResNet ( He et al., 2016 ), which achieves state-
f-the-art performances in many vision tasks, such as ImageNet
lassification ( Russakovsky et al., 2015b ), ImageNet detection,
nd COCO detection ( Lin et al., 2014 ). Instead of fitting a desired
nderlying mapping directly, the ResNet learns residual functions
ith reference to the layer inputs. The shortcut connection is an
dentity mapping, which sends the input to add with the output
f stacked layers. Through this designed structure, deep residual
earning net can solve the degradation problem when training a
ubstantial deep network.
In the detection phase, the DeepVer model outputs a proba-
ility score for each detection patch of DeepDet. We design two
trategies to utilize the DeepVer. The first method is a cascade
ay. It merely utilizes the classification scores of DeepVer to judge
he detection patches. Another method fuses the detector score
DeepDet and the classifier score S DeepVer , as shown below.
= ω × S DeepDet + (1 − ω) × S DeepVer (1)
he weight ω is determined by a parameter sweep on a validation
et. When making decisions, this fusion method utilizes not only
he classification score of DeepVer but also the prediction score
f DeepDet. As the DeepVer is optimized on the detection results
roduced by DeepDet, it may give low confidences for the false
ositives of DeepDet. Hence the verification phase can effectively
liminate false positives and improve the accuracy.
.3. Estimating bounding box label through deep segmentation
etwork
In the object detection problem, the annotations are usually
n the format of bounding box. Training the DeepDet model also
equires the bounding box label. As shown in Fig. 5 , there are two
ypes of annotations in mitosis datasets. One is the pixel-level
round truth that annotates every pixel of a mitotic cell. This type
f label provides sufficient information to easily obtain an accurate
ounding box for mitosis. Another kind of annotation merely la-
els the centroid pixel of a mitosis and we cannot get an accurate
ox to bound the mitosis tightly. A straight-forward method is to
roduce a fixed rectangle box for each mitosis. However, there is
wide range of aspect ratios and scales in mitotic cells. A fixed
ounding box cannot enclose every mitotic cell very well. To solve
his problem, we utilize a FCN model to segment the images and
stimate the mitotic region. A refined bounding box label can be
btained from the predicted mitotic region.
126 C. Li et al. / Medical Image Analysis 45 (2018) 121–133
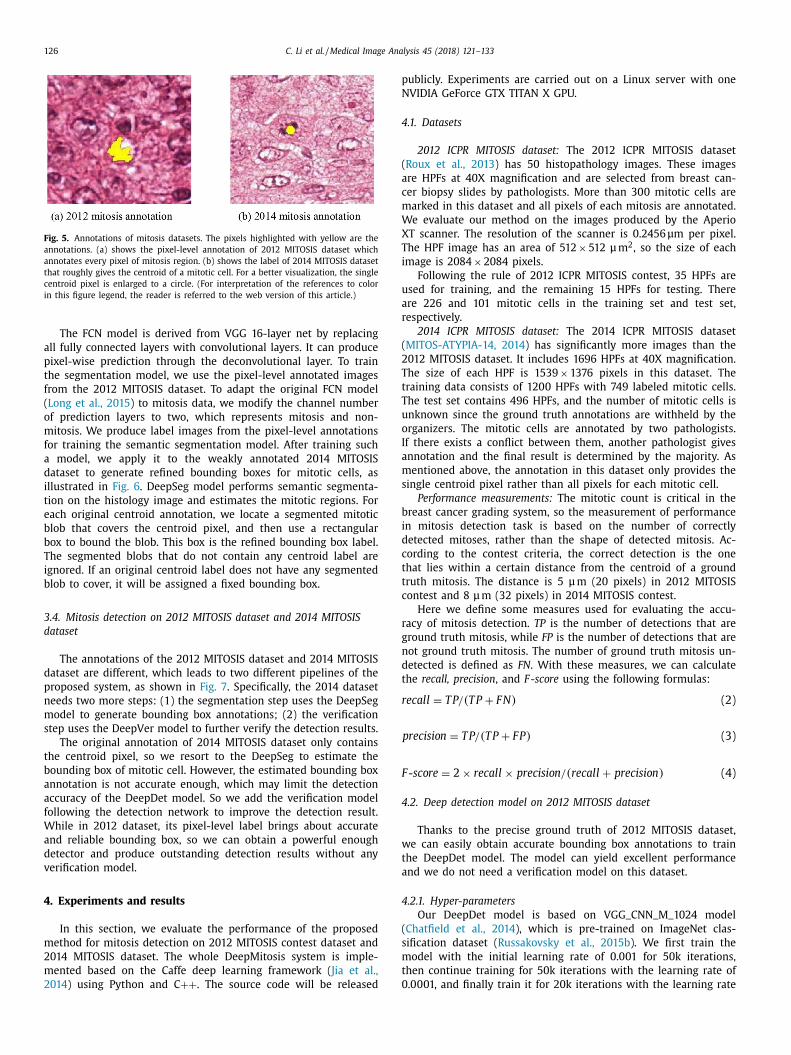
Fig. 5. Annotations of mitosis datasets. The pixels highlighted with yellow are the
annotations. (a) shows the pixel-level annotation of 2012 MITOSIS dataset which
annotates every pixel of mitosis region. (b) shows the label of 2014 MITOSIS dataset
that roughly gives the centroid of a mitotic cell. For a better visualization, the single
centroid pixel is enlarged to a circle. (For interpretation of the references to color
in this figure legend, the reader is referred to the web version of this article.)
p
N
4
(
a
c
m
W
X
T
i
u
a
r
(
2
T
t
T
u
o
I
a
m
s
b
i
d
c
t
t
c
r
g
n
d
t
r
F
4
w
t
a
4
(
s
m
t
0
The FCN model is derived from VGG 16-layer net by replacing
all fully connected layers with convolutional layers. It can produce
pixel-wise prediction through the deconvolutional layer. To train
the segmentation model, we use the pixel-level annotated images
from the 2012 MITOSIS dataset. To adapt the original FCN model
( Long et al., 2015 ) to mitosis data, we modify the channel number
of prediction layers to two, which represents mitosis and non-
mitosis. We produce label images from the pixel-level annotations
for training the semantic segmentation model. After training such
a model, we apply it to the weakly annotated 2014 MITOSIS
dataset to generate refined bounding boxes for mitotic cells, as
illustrated in Fig. 6 . DeepSeg model performs semantic segmenta-
tion on the histology image and estimates the mitotic regions. For
each original centroid annotation, we locate a segmented mitotic
blob that covers the centroid pixel, and then use a rectangular
box to bound the blob. This box is the refined bounding box label.
The segmented blobs that do not contain any centroid label are
ignored. If an original centroid label does not have any segmented
blob to cover, it will be assigned a fixed bounding box.
3.4. Mitosis detection on 2012 MITOSIS dataset and 2014 MITOSIS
dataset
The annotations of the 2012 MITOSIS dataset and 2014 MITOSIS
dataset are different, which leads to two different pipelines of the
proposed system, as shown in Fig. 7 . Specifically, the 2014 dataset
needs two more steps: (1) the segmentation step uses the DeepSeg
model to generate bounding box annotations; (2) the verification
step uses the DeepVer model to further verify the detection results.
The original annotation of 2014 MITOSIS dataset only contains
the centroid pixel, so we resort to the DeepSeg to estimate the
bounding box of mitotic cell. However, the estimated bounding box
annotation is not accurate enough, which may limit the detection
accuracy of the DeepDet model. So we add the verification model
following the detection network to improve the detection result.
While in 2012 dataset, its pixel-level label brings about accurate
and reliable bounding box, so we can obtain a powerful enough
detector and produce outstanding detection results without any
verification model.
4. Experiments and results
In this section, we evaluate the performance of the proposed
method for mitosis detection on 2012 MITOSIS contest dataset and
2014 MITOSIS dataset. The whole DeepMitosis system is imple-
mented based on the Caffe deep learning framework ( Jia et al.,
2014 ) using Python and C ++ . The source code will be released
ublicly. Experiments are carried out on a Linux server with one
VIDIA GeForce GTX TITAN X GPU.
.1. Datasets
2012 ICPR MITOSIS dataset: The 2012 ICPR MITOSIS dataset
Roux et al., 2013 ) has 50 histopathology images. These images
re HPFs at 40X magnification and are selected from breast can-
er biopsy slides by pathologists. More than 300 mitotic cells are
arked in this dataset and all pixels of each mitosis are annotated.
e evaluate our method on the images produced by the Aperio
T scanner. The resolution of the scanner is 0.2456 μm per pixel.
he HPF image has an area of 512 × 512 μ m
2 , so the size of each
mage is 2084 × 2084 pixels.
Following the rule of 2012 ICPR MITOSIS contest, 35 HPFs are
sed for training, and the remaining 15 HPFs for testing. There
re 226 and 101 mitotic cells in the training set and test set,
espectively.
2014 ICPR MITOSIS dataset: The 2014 ICPR MITOSIS dataset
MITOS-ATYPIA-14, 2014 ) has significantly more images than the
012 MITOSIS dataset. It includes 1696 HPFs at 40X magnification.
he size of each HPF is 1539 × 1376 pixels in this dataset. The
raining data consists of 1200 HPFs with 749 labeled mitotic cells.
he test set contains 496 HPFs, and the number of mitotic cells is
nknown since the ground truth annotations are withheld by the
rganizers. The mitotic cells are annotated by two pathologists.
f there exists a conflict between them, another pathologist gives
nnotation and the final result is determined by the majority. As
entioned above, the annotation in this dataset only provides the
ingle centroid pixel rather than all pixels for each mitotic cell.
Performance measurements: The mitotic count is critical in the
reast cancer grading system, so the measurement of performance
n mitosis detection task is based on the number of correctly
etected mitoses, rather than the shape of detected mitosis. Ac-
ording to the contest criteria, the correct detection is the one
hat lies within a certain distance from the centroid of a ground
ruth mitosis. The distance is 5 μ m (20 pixels) in 2012 MITOSIS
ontest and 8 μ m (32 pixels) in 2014 MITOSIS contest.
Here we define some measures used for evaluating the accu-
acy of mitosis detection. TP is the number of detections that are
round truth mitosis, while FP is the number of detections that are
ot ground truth mitosis. The number of ground truth mitosis un-
etected is defined as FN . With these measures, we can calculate
he recall, precision , and F - score using the following formulas:
ecall = T P/ (T P + F N) (2)
precision = T P/ (T P + F P ) (3)
- score = 2 × recall × precision/ (recall + precision ) (4)
.2. Deep detection model on 2012 MITOSIS dataset
Thanks to the precise ground truth of 2012 MITOSIS dataset,
e can easily obtain accurate bounding box annotations to train
he DeepDet model. The model can yield excellent performance
nd we do not need a verification model on this dataset.
.2.1. Hyper-parameters
Our DeepDet model is based on VGG_CNN_M_1024 model
Chatfield et al., 2014 ), which is pre-trained on ImageNet clas-
ification dataset ( Russakovsky et al., 2015b ). We first train the
odel with the initial learning rate of 0.001 for 50k iterations,
hen continue training for 50k iterations with the learning rate of
.0 0 01, and finally train it for 20k iterations with the learning rate

C. Li et al. / Medical Image Analysis 45 (2018) 121–133 127
pixel-wise prediction
segmentation
original label
estimated bounding boxes
image
25612864 4096 2
deconvolution
Fig. 6. The process of transforming centroid annotations to bounding box annotations by DeepSeg model. DeepSeg produces pixel-wise segmentation probability map. For
each mitosis in ground truth, we locate a corresponding segmented mitotic region and generate a bounding box. The green boxes denote the estimated bounding boxes. The
top segmented blob does not match a mitosis, so we ignore it. (For interpretation of the references to color in this figure legend, the reader is referred to the web version
of this article.)
2012 image DeepDetection
2014 image DeepDetection
DeepVerification
DeepSegmentation2012 image 2014 image
train inference
(a)
(b)
(c)
2014 image DeepDetection
DeepVerification
2012 image
Fig. 7. The pipelines of the two mitosis dataset. (a) shows the detection pipeline
of 2012 MITOSIS dataset, which merely utilizes the DeepDet model. (b) shows the
detection pipeline of 2014 MITOSIS dataset, which needs the DeepVer model to re-
fine the detections. (c) shows that the DeepSeg model is trained on 2012 MITOSIS
dataset and then applied on 2014 dataset.
Table 1
The performance of our detection models on 2012 MITOSIS test
set. These models are trained using image patches with dif-
ferent scales. The “Patch Size” is the original size of cropped
patch. All patches are uniformly re-scaled to 1024 × 1024 pixels
to train DeepDet models. The corresponding enlarged ratio of
the image patch is shown in “Scale” row.
Patch Size 1024 640 512 256
Scale 1 1.6 2 4
F-score 0.568 0.762 0.768 0.756
o
b
4
i
w
s
d
s
t
p
D
D
t
Table 2
The performance of DeepDet models trained
with different training sets. The performance is
evaluated on 2012 MITOSIS test set.
Training set F-score
AreaTh(800) 0.768
AreaTh(1600) + Rot 0.825
AreaTh(10 0 0) + Rot 0.814
AreaTh(800) + Rot 0.832
d
d
2
s
i
p
w
m
p
H
b
t
T
m
w
r
f
p
T
c
m
d
i
i
c
T
o
t
d
t
s
4
e
f 0.0 0 0 01. We set momentum to 0.9, weight decay to 0.0 0 05, and
atch size to 1.
.2.2. Data augmentation of training data
Even the TITAN X GPU has 12 GB memory, the full sized HPF
mage is still too large to be input into the DeepDet model. Thus
e need to crop image patches from the full HPF images.
The detection model is initially designed for common objects,
o mitosis under the original image scale is relatively small for the
etector. Hence we enlarge the image patches before training. To
eek the appropriate scale, we crop patches of different sizes from
he histology images and uniformly re-scale them to 1024 × 1024
ixels. Then we use these patches with different scales to train the
eepDet model individually. Table 1 shows the performance of our
eepDet models trained on image patches with different scales.
It can be observed that the F-score is very low when using
he original scale image patches. And the performance improves
rastically as the scale increases to 1.6. Further increasing the scale
oes not bring a distinct effect on the F-score. We choose the scale
in our experiments as it achieves the best result among different
cales. Moreover, using the moderate scale is relatively economical
n memory. Specifically, we densely sample patches of 512 × 512
ixels from the original images with a step size of 32 pixels. Then,
e re-scale these sampled image patches to 1024 × 1024 pixels.
It is noticeable that the mitotic cells in the boundary of patches
ay be split into two or more small parts. If the generated mitotic
art is tiny, it should not be regarded as a valid mitotic region.
ence we remove the image patches that contain small cross-
oundary mitotic cells from the training data. We set the area
hreshold to 800 pixels according to some evaluation experiments.
he moderate threshold keeps appropriate positive samples as
uch as possible, and simultaneously filters out tiny mitosis parts
hich may interfere with the training.
Training deep CNNs needs a large number of samples, so we
otate and mirror the original HPF images and then extract patches
rom the transformed full images to produce more training sam-
les. Here we rotate the original images in a step of 45 degrees.
he data augmentation can yield more mitotic samples, which are
ritical for the DeepDet training, especially when the number of
itotic samples in the original dataset is very small.
Table 2 shows the performance of DeepDet models trained on
ifferent training sets. The number in brackets of the first column
s the area threshold used to screen out the marginal mitosis. For
nstance, the “AreaTh(800)” training set removes the image patch
ontaining a boundary mitotic region smaller than 800 pixels.
he “+ Rot” means that the training set includes rotated images;
therwise, its data augmentation only includes mirroring. We note
hat the image rotation improves the F-score remarkably, which
emonstrates the importance of data augmentation. Fig. 8 shows
he detection results of “AreaTh(800) + Rot” detector on some
ample regions from 2012 MITOSIS test set.
.2.3. Parameters studies
We carry out some controlled experiments to examine how
ach parameter affects the performance of DeepDet model.
128 C. Li et al. / Medical Image Analysis 45 (2018) 121–133
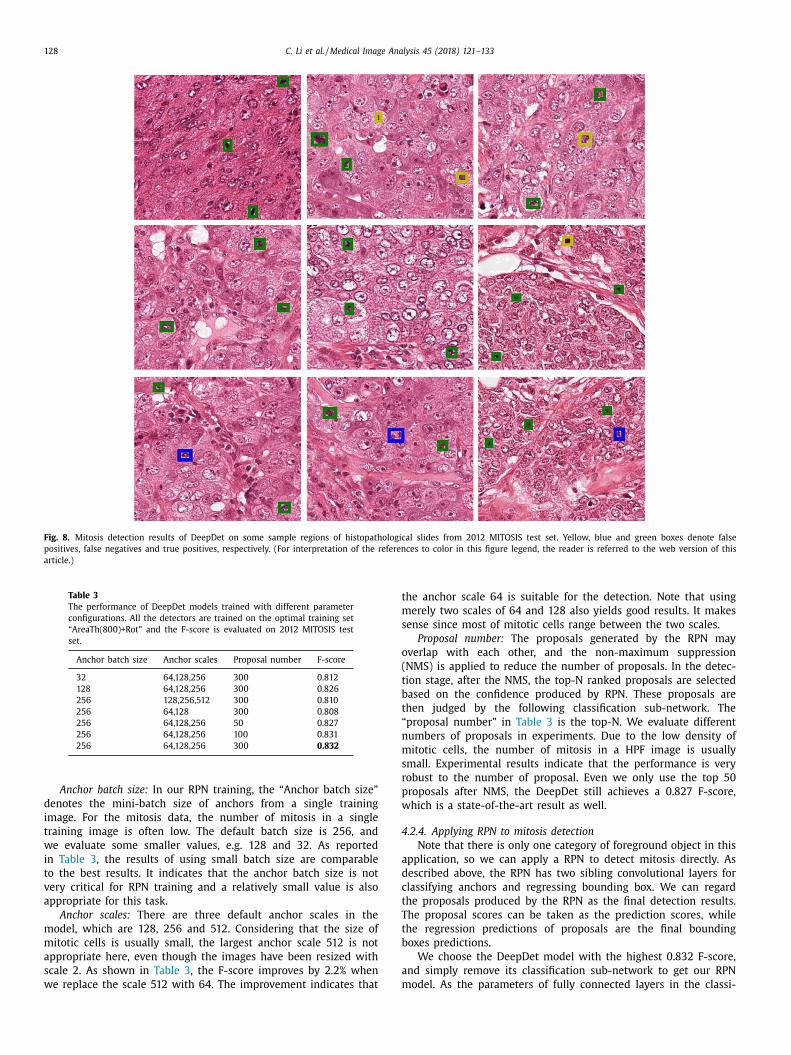
Fig. 8. Mitosis detection results of DeepDet on some sample regions of histopathological slides from 2012 MITOSIS test set. Yellow, blue and green boxes denote false
positives, false negatives and true positives, respectively. (For interpretation of the references to color in this figure legend, the reader is referred to the web version of this
article.)
Table 3
The performance of DeepDet models trained with different parameter
configurations. All the detectors are trained on the optimal training set
“AreaTh(800)+Rot” and the F-score is evaluated on 2012 MITOSIS test
set.
Anchor batch size Anchor scales Proposal number F-score
32 64,128,256 300 0.812
128 64,128,256 300 0.826
256 128,256,512 300 0.810
256 64,128 300 0.808
256 64,128,256 50 0.827
256 64,128,256 100 0.831
256 64,128,256 300 0.832
t
m
s
o
(
t
b
t
“
n
m
s
r
p
w
4
a
d
c
t
T
t
b
a
m
Anchor batch size: In our RPN training, the “Anchor batch size”
denotes the mini-batch size of anchors from a single training
image. For the mitosis data, the number of mitosis in a single
training image is often low. The default batch size is 256, and
we evaluate some smaller values, e.g. 128 and 32. As reported
in Table 3 , the results of using small batch size are comparable
to the best results. It indicates that the anchor batch size is not
very critical for RPN training and a relatively small value is also
appropriate for this task.
Anchor scales: There are three default anchor scales in the
model, which are 128, 256 and 512. Considering that the size of
mitotic cells is usually small, the largest anchor scale 512 is not
appropriate here, even though the images have been resized with
scale 2. As shown in Table 3 , the F-score improves by 2.2% when
we replace the scale 512 with 64. The improvement indicates that
he anchor scale 64 is suitable for the detection. Note that using
erely two scales of 64 and 128 also yields good results. It makes
ense since most of mitotic cells range between the two scales.
Proposal number: The proposals generated by the RPN may
verlap with each other, and the non-maximum suppression
NMS) is applied to reduce the number of proposals. In the detec-
ion stage, after the NMS, the top-N ranked proposals are selected
ased on the confidence produced by RPN. These proposals are
hen judged by the following classification sub-network. The
proposal number” in Table 3 is the top-N. We evaluate different
umbers of proposals in experiments. Due to the low density of
itotic cells, the number of mitosis in a HPF image is usually
mall. Experimental results indicate that the performance is very
obust to the number of proposal. Even we only use the top 50
roposals after NMS, the DeepDet still achieves a 0.827 F-score,
hich is a state-of-the-art result as well.
.2.4. Applying RPN to mitosis detection
Note that there is only one category of foreground object in this
pplication, so we can apply a RPN to detect mitosis directly. As
escribed above, the RPN has two sibling convolutional layers for
lassifying anchors and regressing bounding box. We can regard
he proposals produced by the RPN as the final detection results.
he proposal scores can be taken as the prediction scores, while
he regression predictions of proposals are the final bounding
oxes predictions.
We choose the DeepDet model with the highest 0.832 F-score,
nd simply remove its classification sub-network to get our RPN
odel. As the parameters of fully connected layers in the classi-
C. Li et al. / Medical Image Analysis 45 (2018) 121–133 129
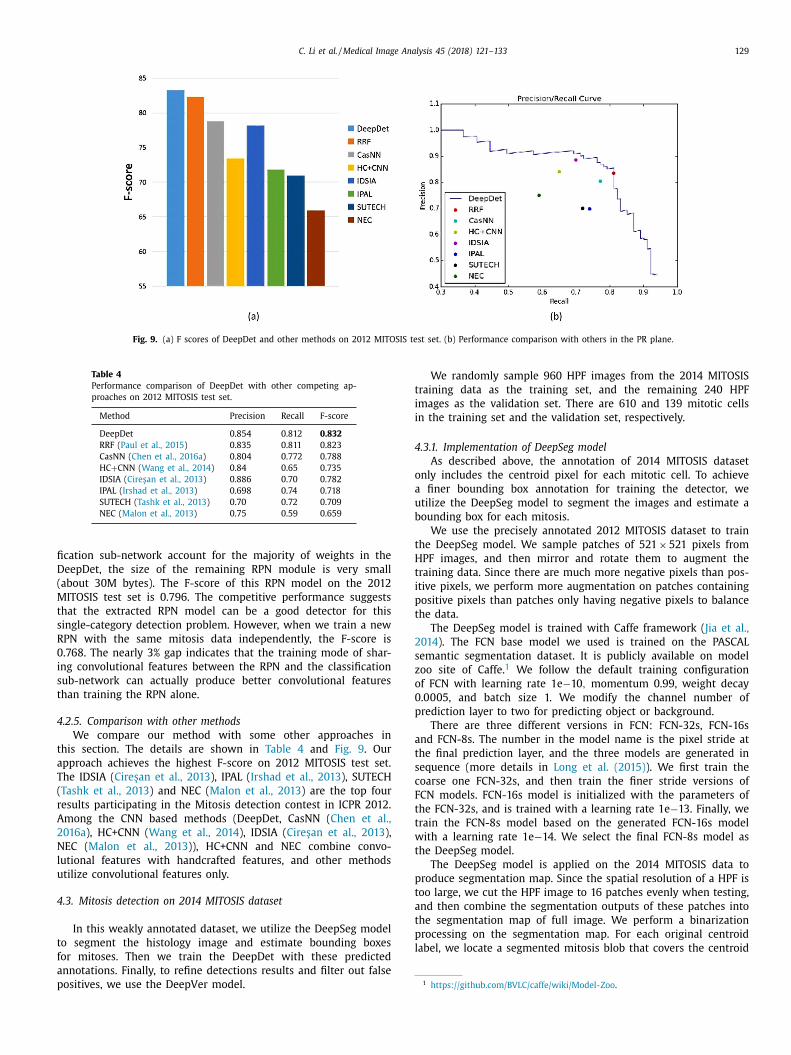
Fig. 9. (a) F scores of DeepDet and other methods on 2012 MITOSIS test set. (b) Performance comparison with others in the PR plane.
Table 4
Performance comparison of DeepDet with other competing ap-
proaches on 2012 MITOSIS test set.
Method Precision Recall F-score
DeepDet 0.854 0.812 0.832
RRF ( Paul et al., 2015 ) 0.835 0.811 0.823
CasNN ( Chen et al., 2016a ) 0.804 0.772 0.788
HC + CNN ( Wang et al., 2014 ) 0.84 0.65 0.735
IDSIA ( Cire ̧s an et al., 2013 ) 0.886 0.70 0.782
IPAL ( Irshad et al., 2013 ) 0.698 0.74 0.718
SUTECH ( Tashk et al., 2013 ) 0.70 0.72 0.709
NEC ( Malon et al., 2013 ) 0.75 0.59 0.659
fi
D
(
M
t
s
R
0
i
s
t
4
t
a
T
(
r
A
2
N
l
u
4
t
f
a
p
t
i
i
4
o
a
u
b
t
H
t
i
p
t
2
s
z
o
0
p
a
t
s
c
F
t
t
w
t
p
t
a
t
p
l
1 https://github.com/BVLC/caffe/wiki/Model-Zoo .
cation sub-network account for the majority of weights in the
eepDet, the size of the remaining RPN module is very small
about 30M bytes). The F-score of this RPN model on the 2012
ITOSIS test set is 0.796. The competitive performance suggests
hat the extracted RPN model can be a good detector for this
ingle-category detection problem. However, when we train a new
PN with the same mitosis data independently, the F-score is
.768. The nearly 3% gap indicates that the training mode of shar-
ng convolutional features between the RPN and the classification
ub-network can actually produce better convolutional features
han training the RPN alone.
.2.5. Comparison with other methods
We compare our method with some other approaches in
his section. The details are shown in Table 4 and Fig. 9 . Our
pproach achieves the highest F-score on 2012 MITOSIS test set.
he IDSIA ( Cire ̧s an et al., 2013 ), IPAL ( Irshad et al., 2013 ), SUTECH
Tashk et al., 2013 ) and NEC ( Malon et al., 2013 ) are the top four
esults participating in the Mitosis detection contest in ICPR 2012.
mong the CNN based methods (DeepDet, CasNN ( Chen et al.,
016a ), HC+CNN ( Wang et al., 2014 ), IDSIA ( Cire ̧s an et al., 2013 ),
EC ( Malon et al., 2013 )), HC+CNN and NEC combine convo-
utional features with handcrafted features, and other methods
tilize convolutional features only.
.3. Mitosis detection on 2014 MITOSIS dataset
In this weakly annotated dataset, we utilize the DeepSeg model
o segment the histology image and estimate bounding boxes
or mitoses. Then we train the DeepDet with these predicted
nnotations. Finally, to refine detections results and filter out false
ositives, we use the DeepVer model.
We randomly sample 960 HPF images from the 2014 MITOSIS
raining data as the training set, and the remaining 240 HPF
mages as the validation set. There are 610 and 139 mitotic cells
n the training set and the validation set, respectively.
.3.1. Implementation of DeepSeg model
As described above, the annotation of 2014 MITOSIS dataset
nly includes the centroid pixel for each mitotic cell. To achieve
finer bounding box annotation for training the detector, we
tilize the DeepSeg model to segment the images and estimate a
ounding box for each mitosis.
We use the precisely annotated 2012 MITOSIS dataset to train
he DeepSeg model. We sample patches of 521 × 521 pixels from
PF images, and then mirror and rotate them to augment the
raining data. Since there are much more negative pixels than pos-
tive pixels, we perform more augmentation on patches containing
ositive pixels than patches only having negative pixels to balance
he data.
The DeepSeg model is trained with Caffe framework ( Jia et al.,
014 ). The FCN base model we used is trained on the PASCAL
emantic segmentation dataset. It is publicly available on model
oo site of Caffe. 1 We follow the default training configuration
f FCN with learning rate 1e −10 , momentum 0.99, weight decay
.0 0 05, and batch size 1. We modify the channel number of
rediction layer to two for predicting object or background.
There are three different versions in FCN: FCN-32s, FCN-16s
nd FCN-8s. The number in the model name is the pixel stride at
he final prediction layer, and the three models are generated in
equence (more details in Long et al. (2015) ). We first train the
oarse one FCN-32s, and then train the finer stride versions of
CN models. FCN-16s model is initialized with the parameters of
he FCN-32s, and is trained with a learning rate 1e −13 . Finally, we
rain the FCN-8s model based on the generated FCN-16s model
ith a learning rate 1e −14 . We select the final FCN-8s model as
he DeepSeg model.
The DeepSeg model is applied on the 2014 MITOSIS data to
roduce segmentation map. Since the spatial resolution of a HPF is
oo large, we cut the HPF image to 16 patches evenly when testing,
nd then combine the segmentation outputs of these patches into
he segmentation map of full image. We perform a binarization
rocessing on the segmentation map. For each original centroid
abel, we locate a segmented mitosis blob that covers the centroid
130 C. Li et al. / Medical Image Analysis 45 (2018) 121–133
Table 5
Performance results of our methods
on 2014 MITOSIS validation set.
Method F-score
DeepDet (fixed) 0.489
DeepDet + Seg 0.505
DeepDet + Seg+Ver(c) 0.559
DeepDet + Seg+Ver(f) 0.572
Table 6
Performance results of our methods on 2014 MITOSIS
test set.
Method Precision Recall F-score
DeepDet + Seg 0.431 0.370 0.398
DeepDet + Seg+Ver 0.431 0.443 0.437
“
c
0
D
T
d
t
T
e
w
v
t
a
u
D
t
c
s
c
t
o
2
4
s
g
t
(
D
r
h
r
t
t
p
0
i
i
w
T
d
t
t
4
o
s
a
p
t
w
pixel. Then we get a bounding box to enclose the segmented blob
as the new annotation. If there is no segmented mitotic region
covering the centroid, we will assign a fixed bounding box to it. In
our experiment, there are about 104 mitotic cells that do not have
corresponding segmented blobs, accounting for 14% of all mitoses.
4.3.2. Implementation of DeepVer model
The estimated mitotic bounding box on 2014 MITOSIS dataset
may be not very reliable, which can introduce inaccurate su-
pervision during the DeepDet training. The detection results of
DeepDet on this dataset are not very accurate, hence we exploit
the DeepVer model to further verify them. The verification model
is based on the ResNet pre-trained on the ImageNet dataset
( Russakovsky et al., 2015b ). It is trained on the extracted detection
patches of DeepDet. We keep the center of detection patch un-
changed and extract a 96 × 96 patch. For positive patch, we rotate
it with a 90-degree step to produce more positive samples for
balancing the data bias. Meanwhile, we crop patches from centroid
ground truth, and perform the same rotation augmentation on
them. Moreover, the original annotation has provided some mimics
which are prone to be wrongly identified as mitosis. We add these
samples to our training data to improve the model capacity of rec-
ognizing hard negatives. Finally, there are 16,248 training patches
in total. We train a 50-layer ResNet as the DeepVer. We train the
model for 12,0 0 0 iterations with a batch size of 64. The learning
rate is 0.01 and momentum is 0.9, and weight decay is 0.0 0 01.
4.3.3. The effectiveness of DeepSeg and DeepVer models
We conduct some ablation experiments to demonstrate the ef-
fectiveness of our deep segmentation model and deep verification
model.
DeepDet (fixed): We first train a baseline DeepDet model on
the 2014 MITOSIS training set. Its parameters setting follows the
configuration in 2012 MITOSIS dataset. We extract patches of
512 × 512 pixels from the training images and re-scale them to
1024 × 1024 pixels. The anchor scales in RPN training are 64, 128
and 256. We assign a simple and uniform bounding box for each
mitotic cell. The side length of the box is fixed to 40 pixels. The
originally marked centroid pixel lies in the center of the box.
Through a careful validation on the dataset, the 40 × 40 bounding
box is found to be the best fixed annotation. We name the detector
trained with fixed bounding box annotation as “DeepDet (fixed)”.
DeepDet+Seg: This DeepDet model is trained with the same
data and parameter setting as the DeepDet (fixed), but it utilizes
the estimated bounding box annotations produced by the DeepSeg
model. We name this model as “DeepDet+Seg”. Table 5 shows that
the DeepDet+Seg actually produces superior detection quality on
2014 MITOSIS validation set, compared with the DeepDet (fixed).
This experimental result indicates that the refined annotations
from DeepSeg model are conducive to the DeepDet training.
DeepDet+Seg+Ver: We then apply the DeepVer model to the
detection results of DeepDet+Seg. Here we take two strategies
to exploit the DeepVer model. The first method is a cascade
way that simply takes the DeepVer classification results on the
detection patches as the final decisions. We name this method as
“DeepDet+Seg+Ver(c)”, as it utilizes the three deep models and the
c” stands for “cascade”. In this experiment, the DeepVer only pro-
esses the detected patches with DeepDet+Seg score higher than
.94. The DeepVer model can filter out many false positives of
eepDet+Seg and hence improves the F-score to 0.559 as shown in
able 5 . The second method is to combine the confidences of the
etection model and verification model. As described in Eq. (1) ,
he fusion takes a weighted sum of the scores of the two models.
he weight ω is optimized on the validation set, and is 0.9 in our
xperiment. We name this method as “DeepDet+Seg+Ver(f)”, in
hich the “f” stands for “fusion”. It achieves a 0.572 F-score on the
alidation set. Compared with the DeepDet+Seg+Ver(c) method,
he fusion method can take advantage of the two prediction scores
dequately and achieves a superior detection quality. Thus we only
se the fusion strategy in the following experiments.
Fig. 10 illustrates some detections comparisons between the
eepDet+Seg and DeepDet+Seg+Ver on the 2014 MITOSIS valida-
ion set. The first nine columns confirm that the DeepDet+Seg+Ver
an effectively identify false positives of DeepDet, due to the
trong discriminative capacity of DeepVer model. The last two
olumns illustrate mitotic cells missed by DeepDet+Seg are iden-
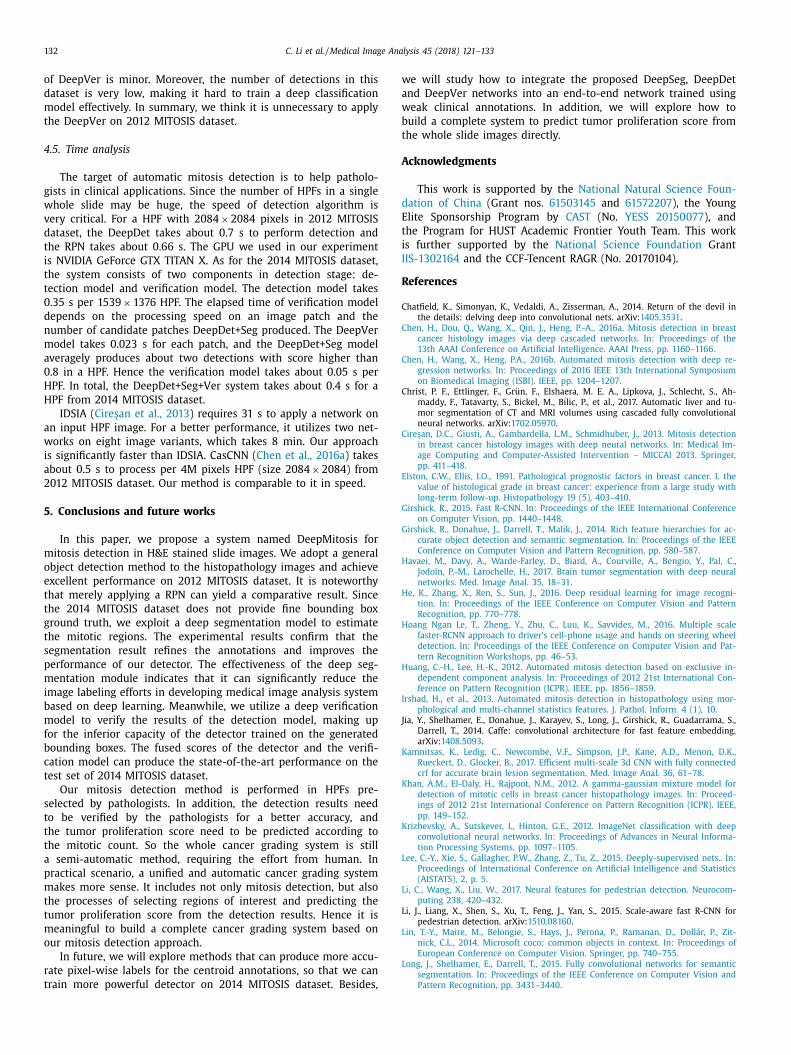
ified by the DeepDet+Seg+Ver. Fig. 11 shows the detection results
f proposed DeepDet+Seg+Ver approach on four HPFs from the
014 MITOSIS validation set.
.3.4. Results on the test set
We now focus on the performance of our approach on the test
et of 2014 MITOSIS dataset. The test set has 496 HPFs and no
round truth has been released by the organizers. Here we train
he verification model on the detection patches of all training data
including the validation set).
Experimental results on test set are shown in Table 6 . The
eepDet+Seg achieves a 0.398 F-score, which is a comparable
esult to the state-of-the-art as we will see below. We choose a
igh score 0.984 as the decision threshold in DeepDet+Seg, so its
ecall is relatively low. This high threshold is a trade-off between
he precision and recall. For example, if we reduce the detection
hreshold score to 0.9, the recall will increase to 0.522, but the
recision will drop to 0.192, leading to a much worse F-score
.281. Compared with the DeepDet+Seg, DeepDet+Seg+Ver has an
dentical precision, but a significant improvement in recall, which
ncreases the F-score to 0.437. We take the DeepDet+Seg detections
ith scores higher than 0.88 for the following verification phase.
he relatively low threshold of detection model involves more true
etections, and simultaneously the verification model can remove
he false positives effectively, so the F-score is remarkably higher
han the DeepDet+Seg.
.3.5. Comparison with other methods
The performance comparison of the proposed method with
ther approaches is reported in Table 7 . Our method achieves a
tate-of-the-art performance with F-score 0.437, outperforming
ll other methods except for the CasNN ( Chen et al., 2016a ). The
recision of our DeepMitosis (DeepDet+Seg+Ver) method is higher
han that of CasNN, while our recall is inferior to the CasNN,
hich results in a 0.5% lower F-score.
C. Li et al. / Medical Image Analysis 45 (2018) 121–133 131
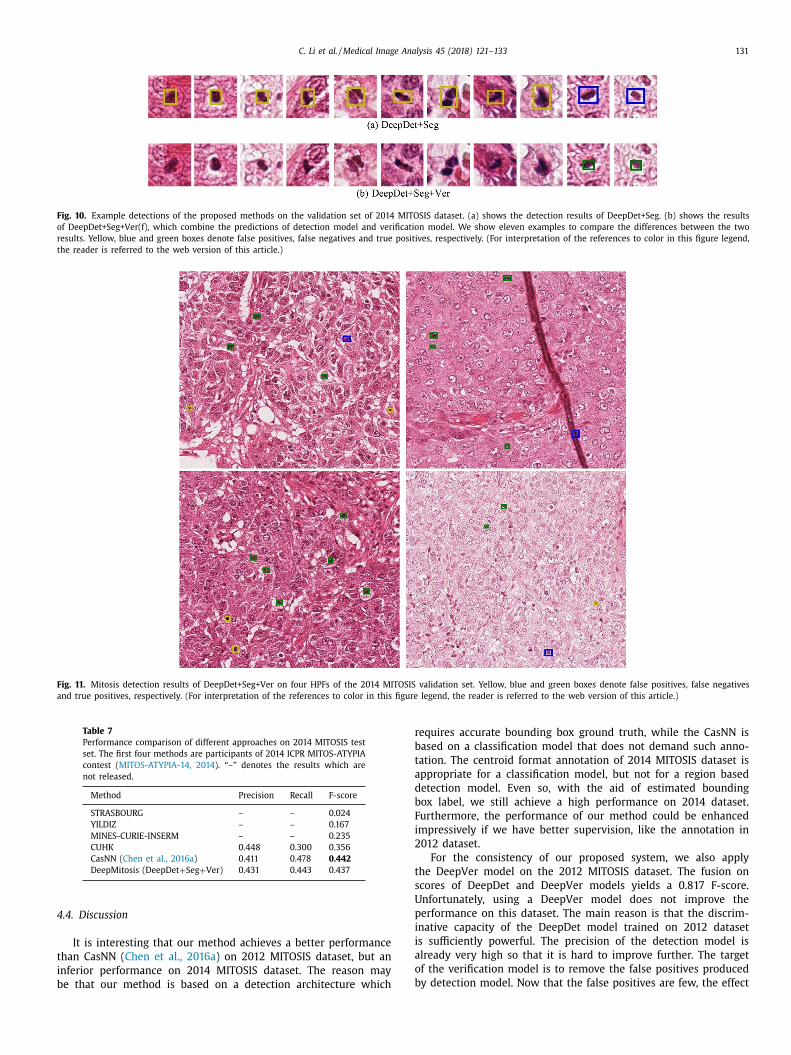
Fig. 10. Example detections of the proposed methods on the validation set of 2014 MITOSIS dataset. (a) shows the detection results of DeepDet+Seg. (b) shows the results
of DeepDet+Seg+Ver(f), which combine the predictions of detection model and verification model. We show eleven examples to compare the differences between the two
results. Yellow, blue and green boxes denote false positives, false negatives and true positives, respectively. (For interpretation of the references to color in this figure legend,
the reader is referred to the web version of this article.)
Fig. 11. Mitosis detection results of DeepDet+Seg+Ver on four HPFs of the 2014 MITOSIS validation set. Yellow, blue and green boxes denote false positives, false negatives
and true positives, respectively. (For interpretation of the references to color in this figure legend, the reader is referred to the web version of this article.)
Table 7
Performance comparison of different approaches on 2014 MITOSIS test
set. The first four methods are participants of 2014 ICPR MITOS-ATYPIA
contest ( MITOS-ATYPIA-14, 2014 ). “–” denotes the results which are
not released.
Method Precision Recall F-score
STRASBOURG – – 0.024
YILDIZ – – 0.167
MINES-CURIE-INSERM – – 0.235
CUHK 0.448 0.300 0.356
CasNN ( Chen et al., 2016a ) 0.411 0.478 0.442
DeepMitosis (DeepDet + Seg + Ver) 0.431 0.443 0.437
4
t
i
b
r
b
t
a
d
b
F
i
2
t
s
U
p
i
i
a
o
b
.4. Discussion
It is interesting that our method achieves a better performance
han CasNN ( Chen et al., 2016a ) on 2012 MITOSIS dataset, but an
nferior performance on 2014 MITOSIS dataset. The reason may
e that our method is based on a detection architecture which
equires accurate bounding box ground truth, while the CasNN is
ased on a classification model that does not demand such anno-
ation. The centroid format annotation of 2014 MITOSIS dataset is
ppropriate for a classification model, but not for a region based
etection model. Even so, with the aid of estimated bounding
ox label, we still achieve a high performance on 2014 dataset.
urthermore, the performance of our method could be enhanced
mpressively if we have better supervision, like the annotation in
012 dataset.
For the consistency of our proposed system, we also apply
he DeepVer model on the 2012 MITOSIS dataset. The fusion on
cores of DeepDet and DeepVer models yields a 0.817 F-score.
nfortunately, using a DeepVer model does not improve the
erformance on this dataset. The main reason is that the discrim-
native capacity of the DeepDet model trained on 2012 dataset
s sufficiently powerful. The precision of the detection model is
lready very high so that it is hard to improve further. The target
f the verification model is to remove the false positives produced
y detection model. Now that the false positives are few, the effect
132 C. Li et al. / Medical Image Analysis 45 (2018) 121–133
w
a
w
b
t
A
d
E
t
i
I
R
C
C
C
C
E
G
G
H
H
H
I
J
K
K
K
L
L
L
L
L
of DeepVer is minor. Moreover, the number of detections in this
dataset is very low, making it hard to train a deep classification
model effectively. In summary, we think it is unnecessary to apply
the DeepVer on 2012 MITOSIS dataset.
4.5. Time analysis
The target of automatic mitosis detection is to help patholo-
gists in clinical applications. Since the number of HPFs in a single
whole slide may be huge, the speed of detection algorithm is
very critical. For a HPF with 2084 × 2084 pixels in 2012 MITOSIS
dataset, the DeepDet takes about 0.7 s to perform detection and
the RPN takes about 0.66 s. The GPU we used in our experiment
is NVIDIA GeForce GTX TITAN X. As for the 2014 MITOSIS dataset,
the system consists of two components in detection stage: de-
tection model and verification model. The detection model takes
0.35 s per 1539 × 1376 HPF. The elapsed time of verification model
depends on the processing speed on an image patch and the
number of candidate patches DeepDet+Seg produced. The DeepVer
model takes 0.023 s for each patch, and the DeepDet+Seg model
averagely produces about two detections with score higher than
0.8 in a HPF. Hence the verification model takes about 0.05 s per
HPF. In total, the DeepDet+Seg+Ver system takes about 0.4 s for a
HPF from 2014 MITOSIS dataset.
IDSIA ( Cire ̧s an et al., 2013 ) requires 31 s to apply a network on
an input HPF image. For a better performance, it utilizes two net-
works on eight image variants, which takes 8 min. Our approach
is significantly faster than IDSIA. CasCNN ( Chen et al., 2016a ) takes
about 0.5 s to process per 4M pixels HPF (size 2084 × 2084) from
2012 MITOSIS dataset. Our method is comparable to it in speed.
5. Conclusions and future works
In this paper, we propose a system named DeepMitosis for
mitosis detection in H&E stained slide images. We adopt a general
object detection method to the histopathology images and achieve
excellent performance on 2012 MITOSIS dataset. It is noteworthy
that merely applying a RPN can yield a comparative result. Since
the 2014 MITOSIS dataset does not provide fine bounding box
ground truth, we exploit a deep segmentation model to estimate
the mitotic regions. The experimental results confirm that the
segmentation result refines the annotations and improves the
performance of our detector. The effectiveness of the deep seg-
mentation module indicates that it can significantly reduce the
image labeling effort s in developing medical image analysis system
based on deep learning. Meanwhile, we utilize a deep verification
model to verify the results of the detection model, making up
for the inferior capacity of the detector trained on the generated
bounding boxes. The fused scores of the detector and the verifi-
cation model can produce the state-of-the-art performance on the
test set of 2014 MITOSIS dataset.
Our mitosis detection method is performed in HPFs pre-
selected by pathologists. In addition, the detection results need
to be verified by the pathologists for a better accuracy, and
the tumor proliferation score need to be predicted according to
the mitotic count. So the whole cancer grading system is still
a semi-automatic method, requiring the effort from human. In
practical scenario, a unified and automatic cancer grading system
makes more sense. It includes not only mitosis detection, but also
the processes of selecting regions of interest and predicting the
tumor proliferation score from the detection results. Hence it is
meaningful to build a complete cancer grading system based on
our mitosis detection approach.
In future, we will explore methods that can produce more accu-
rate pixel-wise labels for the centroid annotations, so that we can
train more powerful detector on 2014 MITOSIS dataset. Besides,
e will study how to integrate the proposed DeepSeg, DeepDet
nd DeepVer networks into an end-to-end network trained using
eak clinical annotations. In addition, we will explore how to
uild a complete system to predict tumor proliferation score from
he whole slide images directly.
cknowledgments
This work is supported by the National Natural Science Foun-
ation of China (Grant nos. 61503145 and 61572207 ), the Young
lite Sponsorship Program by CAST (No. YESS 20150077 ), and
he Program for HUST Academic Frontier Youth Team. This work
s further supported by the National Science Foundation Grant
IS-1302164 and the CCF-Tencent RAGR (No. 20170104).
eferences
hatfield, K., Simonyan, K., Vedaldi, A., Zisserman, A., 2014. Return of the devil inthe details: delving deep into convolutional nets. arXiv: 1405.3531 .
Chen, H. , Dou, Q. , Wang, X. , Qin, J. , Heng, P.-A. , 2016a. Mitosis detection in breastcancer histology images via deep cascaded networks. In: Proceedings of the
13th AAAI Conference on Artificial Intelligence. AAAI Press, pp. 1160–1166 . hen, H. , Wang, X. , Heng, P.A. , 2016b. Automated mitosis detection with deep re-
gression networks. In: Proceedings of 2016 IEEE 13th International Symposium
on Biomedical Imaging (ISBI). IEEE, pp. 1204–1207 . hrist, P. F., Ettlinger, F., Grün, F., Elshaera, M. E. A., Lipkova, J., Schlecht, S., Ah-
maddy, F., Tatavarty, S., Bickel, M., Bilic, P., et al., 2017. Automatic liver and tu-mor segmentation of CT and MRI volumes using cascaded fully convolutional
neural networks. arXiv: 1702.05970 . ire ̧s an, D.C. , Giusti, A. , Gambardella, L.M. , Schmidhuber, J. , 2013. Mitosis detection
in breast cancer histology images with deep neural networks. In: Medical Im-age Computing and Computer-Assisted Intervention – MICCAI 2013. Springer,
pp. 411–418 .
lston, C.W. , Ellis, I.O. , 1991. Pathological prognostic factors in breast cancer. I. thevalue of histological grade in breast cancer: experience from a large study with
long-term follow-up. Histopathology 19 (5), 403–410 . irshick, R. , 2015. Fast R-CNN. In: Proceedings of the IEEE International Conference
on Computer Vision, pp. 1440–1448 . irshick, R. , Donahue, J. , Darrell, T. , Malik, J. , 2014. Rich feature hierarchies for ac-
curate object detection and semantic segmentation. In: Proceedings of the IEEE
Conference on Computer Vision and Pattern Recognition, pp. 580–587 . avaei, M. , Davy, A. , Warde-Farley, D. , Biard, A . , Courville, A . , Bengio, Y. , Pal, C. ,
Jodoin, P.-M. , Larochelle, H. , 2017. Brain tumor segmentation with deep neuralnetworks. Med. Image Anal. 35, 18–31 .
He, K. , Zhang, X. , Ren, S. , Sun, J. , 2016. Deep residual learning for image recogni-tion. In: Proceedings of the IEEE Conference on Computer Vision and Pattern
Recognition, pp. 770–778 .
oang Ngan Le, T. , Zheng, Y. , Zhu, C. , Luu, K. , Savvides, M. , 2016. Multiple scalefaster-RCNN approach to driver’s cell-phone usage and hands on steering wheel
detection. In: Proceedings of the IEEE Conference on Computer Vision and Pat-tern Recognition Workshops, pp. 46–53 .
uang, C.-H. , Lee, H.-K. , 2012. Automated mitosis detection based on exclusive in-dependent component analysis. In: Proceedings of 2012 21st International Con-
ference on Pattern Recognition (ICPR). IEEE, pp. 1856–1859 .
rshad, H. , et al. , 2013. Automated mitosis detection in histopathology using mor-phological and multi-channel statistics features. J. Pathol. Inform. 4 (1), 10 .
ia, Y., Shelhamer, E., Donahue, J., Karayev, S., Long, J., Girshick, R., Guadarrama, S.,Darrell, T., 2014. Caffe: convolutional architecture for fast feature embedding.
arXiv: 1408.5093 . amnitsas, K. , Ledig, C. , Newcombe, V.F. , Simpson, J.P. , Kane, A.D. , Menon, D.K. ,
Rueckert, D. , Glocker, B. , 2017. Efficient multi-scale 3d CNN with fully connected
crf for accurate brain lesion segmentation. Med. Image Anal. 36, 61–78 . han, A.M. , El-Daly, H. , Rajpoot, N.M. , 2012. A gamma-gaussian mixture model for
detection of mitotic cells in breast cancer histopathology images. In: Proceed-ings of 2012 21st International Conference on Pattern Recognition (ICPR). IEEE,
pp. 149–152 . rizhevsky, A. , Sutskever, I. , Hinton, G.E. , 2012. ImageNet classification with deep
convolutional neural networks. In: Proceedings of Advances in Neural Informa-
tion Processing Systems, pp. 1097–1105 . ee, C.-Y. , Xie, S. , Gallagher, P.W. , Zhang, Z. , Tu, Z. , 2015. Deeply-supervised nets.. In:
Proceedings of International Conference on Artificial Intelligence and Statistics(AISTATS), 2, p. 5 .
i, C. , Wang, X. , Liu, W. , 2017. Neural features for pedestrian detection. Neurocom-puting 238, 420–432 .
i, J., Liang, X., Shen, S., Xu, T., Feng, J., Yan, S., 2015. Scale-aware fast R-CNN forpedestrian detection. arXiv: 1510.08160 .
in, T.-Y. , Maire, M. , Belongie, S. , Hays, J. , Perona, P. , Ramanan, D. , Dollár, P. , Zit-
nick, C.L. , 2014. Microsoft coco: common objects in context. In: Proceedings ofEuropean Conference on Computer Vision. Springer, pp. 740–755 .
ong, J. , Shelhamer, E. , Darrell, T. , 2015. Fully convolutional networks for semanticsegmentation. In: Proceedings of the IEEE Conference on Computer Vision and
Pattern Recognition, pp. 3431–3440 .

C. Li et al. / Medical Image Analysis 45 (2018) 121–133 133
M
M
N
P
P
R
R
R
R
R
R
S
S
S
T
T
T
T
U
V
V
W
W
X
Z
alon, C.D. , Cosatto, E. , et al. , 2013. Classification of mitotic figures with convolu-tional neural networks and seeded blob features. J. Pathol. Inform. 4 (1), 9 .
ITOS-ATYPIA-14, 2014. Mitos-atypia-14-dataset. https://mitos- atypia- 14. grand-challenge.org/dataset/ (Online; accessed 17.03.03).
ing, F. , Delhomme, D. , LeCun, Y. , Piano, F. , Bottou, L. , Barbano, P.E. , 2005. Towardautomatic phenotyping of developing embryos from videos. IEEE Trans. Image
Process. 14 (9), 1360–1371 . aul, A. , Dey, A. , Mukherjee, D.P. , Sivaswamy, J. , Tourani, V. , 2015. Regenerative ran-
dom forest with automatic feature selection to detect mitosis in histopatholog-
ical breast cancer images. In: Medical Image Computing and Computer-AssistedIntervention – MICCAI 2015. Springer, pp. 94–102 .
aul, A. , Mukherjee, D.P. , 2015. Mitosis detection for invasive breast cancer gradingin histopathological images. IEEE Trans. Image Process. 24 (11), 4041–4054 .
en, S. , He, K. , Girshick, R. , Sun, J. , 2015. Faster R-CNN: Towards real-time objectdetection with region proposal networks. In: Proceedings of Advances in Neural
Information Processing Systems, pp. 91–99 .
onneberger, O. , Fischer, P. , Brox, T. , 2015. U-net: convolutional networks forbiomedical image segmentation. In: Proceedings of International Conference
on Medical Image Computing and Computer-Assisted Intervention. Springer,pp. 234–241 .
oth, H.R. , Lu, L. , Farag, A. , Sohn, A. , Summers, R.M. , 2016. Spatial aggregation ofholistically-nested networks for automated pancreas segmentation. In: Proceed-
ings of International Conference on Medical Image Computing and Comput-
er-Assisted Intervention. Springer, pp. 451–459 . oux, L. , Racoceanui, D. , Loménie, N. , Kulikova, M. , Irshad, H. , Klossa, J. , Capron, F. ,
Genestie, C. , Le Naour, G. , Gurcan, M.N. , 2013. Mitosis detection in breast cancerhistological images an ICPR 2012 contest. J. Pathol. Inform. 4, 4–8 .
ussakovsky, O., Deng, J., Su, H., Krause, J., Satheesh, S., Ma, S., Huang, Z., Karpa-thy, A., Khosla, A., Bernstein, M., Berg, A.C., Fei-Fei, L., 2015a. ImageNet large
scale visual recognition challenge. Int. J. Comput. Vis. 115 (3), 211–252. doi: 10.
1007/s11263-015-0816-y . ussakovsky, O. , Deng, J. , Su, H. , Krause, J. , Satheesh, S. , Ma, S. , Huang, Z. , Karpa-
thy, A . , Khosla, A . , Bernstein, M. , et al. , 2015b. ImageNet large scale visual recog-nition challenge. Int. J. Comput. Vis. 115 (3), 211–252 .
hrivastava, A . , Gupta, A . , Girshick, R. , 2016. Training region-based object detectorswith online hard example mining. In: Proceedings of the IEEE Conference on
Computer Vision and Pattern Recognition, pp. 761–769 .
ilberman, N. , Hoiem, D. , Kohli, P. , Fergus, R. , 2012. Indoor segmentation and sup-port inference from RGBD images. In: Proceedings of European Conference on
Computer Vision – ECCV 2012. Springer, pp. 746–760 . ommer, C. , Fiaschi, L. , Hamprecht, F.A. , Gerlich, D.W. , 2012. Learning-based mitotic
cell detection in histopathological images. In: Proceedings of 2012 21st Interna-tional Conference on Pattern Recognition (ICPR). IEEE, pp. 2306–2309 .
ang, P. , Wang, X. , Huang, Z. , Bai, X. , Liu, W. , 2017. Deep patch learning for weaklysupervised object classification and discovery. Pattern Recognition. 71, 446–459 .
ashk, A. , Helfroush, M.S. , Danyali, H. , Akbarzadeh, M. , 2013. An automatic mitosis
detection method for breast cancer histopathology slide images based on objec-tive and pixel-wise textural features classification. In: Proceedings of 2013 5th
Conference on Information and Knowledge Technology (IKT). IEEE, pp. 406–410 .ek, F.B. , et al. , 2013. Mitosis detection using generic features and an ensemble of
cascade adaboosts. J. Pathol. Inform. 4 (1), 12 . UPAC16, 2016. Tumor-proliferation-assessment-challenge. https://http://tupac.
tue-image.nl/ (Online; accessed 17.07.30).
ijlings, J.R. , Van De Sande, K.E. , Gevers, T. , Smeulders, A.W. , 2013. Selective searchfor object recognition. Int. J. Comput. Vis. 104 (2), 154–171 .
eta, M. , van Diest, P. , Pluim, J. , 2013. Detecting mitotic figures in breast cancerhistopathology images. In: SPIE Medical Imaging. International Society for Op-
tics and Photonics, p. 867607 . eta, M. , Van Diest, P.J. , Willems, S.M. , Wang, H. , Madabhushi, A. , Cruz-Roa, A. , Gon-
zalez, F. , Larsen, A.B. , Vestergaard, J.S. , Dahl, A.B. , et al. , 2015. Assessment of
algorithms for mitosis detection in breast cancer histopathology images. Med.Image Anal. 20 (1), 237–248 .
ang, H. , Cruz-Roa, A. , Basavanhally, A. , Gilmore, H. , Shih, N. , Feldman, M. ,Tomaszewski, J. , Gonzalez, F. , Madabhushi, A. , 2014. Cascaded ensemble of con-
volutional neural networks and handcrafted features for mitosis detection. In:SPIE Medical Imaging. International Society for Optics and Photonics, p. 90410B .
ang, X. , Yan, Y. , Tang, P. , Bai, X. , Liu, W. , 2018. Revisiting multiple instance neural
networks. Pattern Recognit. 74, 15–24 . ie, S. , Tu, Z. , 2015. Holistically-nested edge detection. In: Proceedings of IEEE Inter-
national Conference on Computer Vision . hang, L. , Lin, L. , Liang, X. , He, K. , 2016. Is faster R-CNN doing well for pedestrian de-
tection? In: Proceedings of European Conference on Computer Vision. Springer,pp. 443–457 .