Medical Center Community Health Needs … Network (PMCN) Community Health Needs Assessment (CHNA)...
75
Indiana Regional Medical Center Community Health Needs Assessment 2015
Transcript of Medical Center Community Health Needs … Network (PMCN) Community Health Needs Assessment (CHNA)...

Indiana Regional
Medical Center
Community
Health Needs
Assessment
2015

2015 Community Health Needs Assessment
Executive Summary
ACKNOWLEDGEMENTS
The Indiana Regional Medical Center (IRMC) and Pennsylvania Mountain
Care Network (PMCN) Community Health Needs Assessment (CHNA) was
made possible through the generous support of IRMC, Clarion Hospital,
Punxsutawney Area Hospital and Strategy Solutions, Inc. (SSI).
Representatives from these three hospitals and SSI worked collaboratively to
guide and conduct this assessment. A steering committee made up of senior
representatives of each hospital, as well as representatives from local health
departments, leading health and social service organizations and county
government provided additional input. The combined expertise, knowledge
and commitment of the members of these committees were vital to the
project. The project team of Ben Hughes, Larry Sedlemeyer, Nancy Smith,
John Stroup and Bridget Thornton were the main liaisons between the
steering committees and SSI, the consulting group that PMCN hired to assist
with the assessment. This group deserves special recognition for their tireless
oversight and support of the CHNA process.
During this CHNA project, two dozen individuals were interviewed by
representatives from all three hospitals including administrative and clinical
staff from the hospitals, representatives from health and social service
agencies, public health officers, warden, school district personnel, veteran’s
affairs, clergy, and other public and elected officials. SSI also conducted a
community survey with 1,144 completed surveys. Finally information was
gathered by the project team through a series of focus groups. These
information-gathering efforts allowed the project team and steering
committees to gain a better understanding of the health status, health care
needs, service gaps and barriers to care of those living in the counties of
Armstrong, Butler, Clarion, Clearfield, Forest, Indiana, Jefferson and
Venango. The project team would like to thank all of the people who were
involved in this project, particularly those who participated in interviews,
survey efforts, focus groups and information gathering.

2015 Community Health Needs Assessment
Executive Summary
PROJECT TEAM
Ben Hughes, Punxsutawney Area Hospital
Larry Sedlemeyer, Indiana Regional Medical Center
Nancy Smith, Indiana Regional Medical Center
John Stroup, Clarion Hospital
Bridget Thornton, Clarion Hospital
Debra Thompson, Strategy Solutions, Inc.
Jacqui Catrabone, Strategy Solutions, Inc.
Kathy Roach, Strategy Solutions, Inc.
STEERING COMMITTEE MEMBERS
Clarion Hospital
Tracy Becker, Clarion Chamber of Commerce
Brooke Divins, Clarion Hospital
Sue Groner, Clarion County Health Department
Joe Grunenwald, Clarion Board Member
Jesse Kelley, Clarion County YMCA
Julie Kunselman, Clarion Hospital
Vince Lamorella, Clarion Hospital
Jessica Moore, Crisis Intervention, Clarion
Trish Pezuti, FQHC Clarion
Fred Port, Clarion Hospital Board Member
Dr. Semeyn/Dr. Kenneson, Primary Care Physicians
Mike Stahlman, Clarion Area High School
John Stroup, Clarion Hospital
Bridget Thornton, Clarion Hospital
Leslie Walters, Clarion Hospital
Stephanie Wilshire, AAA
Peter Winkler, Congressman Thompson’s Office
Indiana Regional Medical Center
Kami Anderson, Armstrong-Indiana-Clarion Drug & Alcohol Commission
Mark Correia, Indiana University of Pennsylvania
Kathleen Drozdiak, Clymer Family Practice
Michelle Faught, ICCAP, Inc.
Robert Gongaware, Indiana Regional Medical Center
Sandy Harber, ICCAP, Inc.

2015 Community Health Needs Assessment
Executive Summary
Janine Maust, Aging Services, Inc.
Maureen Pounds, Indiana County Department of Human Services
Jeff Raykes, Indiana County Office of Planning/Development
Mark Richards, Indiana Regional Medical Center
Susan Sapko, United Way of Indiana County
Anita Schilling, Pennsylvania Department of Health
Larry Sedlemeyer, Indiana Regional Medical Center
Nancy Smith, Indiana Regional Medical Center
Liz Spencer, Indiana County Department of Human Services
Jim Struzzi, Indiana County Chamber of Commerce
Punxsutawney Area Hospital
Kim DeChurch, Punxsutawney School District
Stacey Depp, Punxsutawney Home Care Agency
Lori Fulton, Pennsylvania Department of Health
Norman Fry, Punxsutawney Area Hospital
Ben Hughes, Punxsutawney Area Hospital
Abby Kengersky, Punxsutawney Area Hospital
Laurie Klingensmith, Punxsutawney Area Hospital
Robin Moran, Punxsutawney Area Hospital
Diane Neville, Punxsutawney Area Hospital
LuAnn Rapore, Community Guidance Center
Leslie Wineburg, Punxsutawney Area Hospital

2015 Community Health Needs Assessment
Executive Summary
Executive Summary ......................................................................................................... iii
History and Recent Accomplishments ................................................................................
Methodology ......................................................................................................................
Demographics .....................................................................................................................
Access to Quality Health Care ............................................................................................
Chronic Disease ..................................................................................................................
Healthy Environment ..........................................................................................................
Health Mothers, Babies and Children .................................................................................
Infectious Disease ...............................................................................................................
Mental Health and Substance Abuse .................................................................................
Physical Activity and Nutrition ...........................................................................................
Tobacco Use ........................................................................................................................
Injury ...................................................................................................................................
Conclusions .........................................................................................................................
TABLE OF CONTENTS

2015 Community Health Needs Assessment
Executive Summary
Page | 1
Indiana Regional Medical Center (IRMC) is proud to present its 2015 Community
Health Needs Assessment (CHNA) Report. This report summarizes a comprehensive
review and analysis of health status indicators, public health, socioeconomic,
demographic and other qualitative and quantitative data from the primary service
area of IRMC. The data also reflects a collaboration that IRMC entered into on July
24, 2014 with Clarion Hospital and Punxsutawney Area Hospital, known as the
Pennsylvania Mountain Care Network (PMCN). PMCN was formed to improve the
health of the communities they serve by controlling costs, remaining independent,
improving access, expanding the network of specialty physicians and improving
patient outcomes. This report also includes secondary and disease incidence and
prevalence data from Armstrong, Butler, Clarion, Clearfield, Forest, Indiana,
Jefferson and Venango Counties, as the PMCN service area includes portions of all
of these counties. The data was reviewed and analyzed to determine the top
priority needs and issues facing the region overall, and each individual hospital
service area.
The primary purpose of this assessment was to identify the health needs and issues
of the community defined as the primary service area of each hospital in the PMCN.
In addition, the CHNA provides useful information for public health and health care
providers, policy makers, social service agencies, community groups and
organizations, religious institutions, businesses, and consumers who are interested
in improving the health status of the community and region. The results enable the
hospital, as well as other community providers, to more strategically identify
community health priorities, develop interventions and commit resources to
improve the health status of the region.
The full report is also offered as a resource to individuals and groups interested in
using the information to inform better health care and community agency decision
making.
Individually and collectively, improving the health of the community and region is a
top priority of each hospital of PMCN. Beyond the education, patient care and
program interventions provided by IRMC, we hope the information presented is not
only a useful community resource, but also encourages additional activities and
collaborative efforts that improve the health status of the community.
MESSAGE TO THE COMMUNITY

2015 Community Health Needs Assessment
Executive Summary
Page | 2
The 2015 Indiana Regional Medical Center (IRMC) Community Health Needs
Assessment (CHNA) was conducted to identify significant health issues and needs,
as well as to provide critical information to IRMC and others in a position to make a
positive impact on the health of the region’s residents. The results enable the
hospital and other community partners to more strategically establish priorities,
develop interventions and direct resources to improve the health of people living in
the IRMC service area.
To assist with the CHNA process, IRMC and the Pennsylvania Mountain Care
Network (PMCN) retained Strategy Solutions, Inc., a planning and research firm
whose mission is to create healthy communities to conduct the collaborative study.
The assessment followed best practices as outlined by the Association of
Community Health Improvement. The assessment was also designed to ensure
compliance with current Internal Revenue Service (IRS) guidelines for charitable
501(c)(3) tax-exempt hospitals that was published in December 2014. This CHNA
included a detailed examination of the following areas:
• Evaluation of the 2012 IRMC CHNA Implementation Strategies
• Demographics & Socio-Economic Indicators
• Access to Quality Health Care
• Chronic Disease
• Healthy Environment
• Healthy Mothers, Babies and Children
• Infectious Disease
• Mental Health and Substance Abuse
• Physical Activity and Nutrition
• Tobacco Use
• Injury
Secondary public health data on disease incidence and mortality, as well as
behavioral risk factors, were gathered from numerous sources including the
Pennsylvania Department of Health, the Centers for Disease Control, Healthy People
2020, County Health Rankings, as well as a number of other reports and
publications. Data were collected primarily for Indiana County and the PMCN
overall, although some selected national data is included where local/regional data
was not available. Demographic data were collected from the Nielsen/Claritas
demographic database. Primary qualitative data collected specifically for this
assessment included a total of 24 in-depth interviews with individuals from different
EXECUTIVE SUMMARY

2015 Community Health Needs Assessment
Executive Summary
Page | 3
consistencies and interest groups with eight stakeholders specifically representing
the needs of the IRMC service area. A PMCN community survey was conducted with
1,144 responses received from the region, with 573 from Indiana County. In
addition to gathering input from stakeholder interviews, input and guidance also
came from hospital and community representatives who served on the IRMC
Steering Committee.
After all primary and secondary data were reviewed and analyzed; the data
suggested a total of 35 distinct issues, needs and possible priority areas for
intervention. The Steering Committees of all three hospitals prioritized and
discussed the significant needs of the regional overall which included hypertension,
obesity, cardiovascular disease, diabetes, preventative care/screenings, cancer
(specifically breast, colorectal and prostate), flu and pneumonia, prescription drug
abuse, Lyme disease and drug abuse/mortality. The IRMC Steering Committee
analyzed the needs further and ultimately selected the following most significant
priority needs based on the magnitude, impact and capacity criteria:
1. Lyme Disease
2. Healthy eating
3. Alcohol abuse
4. Drug Abuse
5. Prescription abuse
6. Preventive care
7. Cancer
a. Colorectal
b. Breast
8. Coronary Artery Disease
9. Hypertension
10. Diabetes
11. Obesity
The IRMC Steering Committee also agreed that one of the top priorities moving
forward over the next few years is to focus on creating a county-wide vision for a
healthy community, increasing collaboration, as well as to engage Indiana County
“anchor agencies” and reduce fragmentation of services to improve community
health.
The implementation strategies selected by the hospital, the PMCN and community
partners will address the most significant needs through a variety of
implementation strategies and is published in a separate document.

2015 Community Health Needs Assessment
Executive Summary
Page | 4
To guide this assessment, each hospital leadership team formed a Steering
Committee in their local service area that consisted of hospital and community
leaders who represented the broad interests of their local region. These included
representatives who understood the needs and issues related to various
underrepresented groups including medically underserved populations, low-income
persons, minority groups, and those with chronic disease needs, individuals with
expertise in public health, and internal program managers. The IRMC Steering
Committee met three times between April 2015 and June 2015 to provide guidance
on the various components of the CHNA.
Service Area Definition
Consistent with IRS guidelines at the time of data collection, the project partners
defined the community by geographic location based on the primary service area of
the hospital, as well as the service area of PMCN overall. More specifically, the
geography of the IRMC service area includes Indiana County, as illustrated in Figure
1. The geography of the PMCN region includes the counties of Armstrong, Butler,
Clarion, Clearfield, Forest, Indiana, Jefferson and Venango and is illustrated in Figure
2.
METHODOLOGY

2015 Community Health Needs Assessment
Executive Summary
Page | 5
Figure 1: IRMC Service Area
2015 Community Health Needs Assessment
Executive Summary
Page | 6
Figure 2: PMCN Overall Service Area
Asset Inventory
The hospital staff in each member hospital identified existing health care facilities
and resources within their primary service area and the region overall available to
respond to the significant health needs of the community. Resource directories
currently utilized by the hospital case management and social service departments
were compiled. The information included in the asset inventory and map include a
listing of aging services, alcohol/drug abuse/prevention education, children and

2015 Community Health Needs Assessment
Executive Summary
Page | 7
youth services, clothing, counseling/support, education/educational information,
employment training/counseling, food, fuel/utilities, health/medical care/
educational information, housing/shelter, mental health/developmental disabilities,
money/income, pregnancy services, protective services, recreation/socialization,
transportation, and veterans services.
Qualitative and Quantitative Data Collection
In an effort to examine the health related needs of the residents of each individual
service area as well as the region overall and to meet current IRS guidelines and
requirements, the methodology employed both qualitative and quantitative data
collection and analysis methods. The staff, Steering Committee members and
consulting team made significant efforts to ensure that the entire regional service
territory, all socio-demographic groups and all potential needs, issues and
underrepresented populations were considered in the assessment.
The secondary quantitative data collection process included demographic and socio-
economic data obtained from Nielsen/Claritas (www.claritas.com); disease
incidence and prevalence data obtained from the Pennsylvania Departments of
Health and Vital Statistics; Behavioral Risk Factor Surveillance Survey (BRFSS) data
collected by the Centers for Disease Control and Prevention and the Healthy People
2020 goals from HealthyPeople.gov. In addition, various health and health related
data from the following sources were also utilized for the assessment: the US
Department of Agriculture, the Pennsylvania Department of Education, and the
County Health Rankings (www.countyhealthrankings.org). Selected data was also
included from the 2014 Pennsylvania Autism Census Update 2014, Clarion County
2013 PA Youth Survey and the National Survey Results on Drug Abuse – 1975-2013.
Selected Emergency Department and inpatient utilization data from each hospital
was also included.
The primary data collection process also included conducting a community survey
during April 2015, utilizing a mixed-methodology convenience sample, with data
collection completed via paper and the Internet. Each network hospital put a link to
the survey on their website, distributed the survey link via e-mail to local residents
on their individual mailing lists and distributed paper surveys in selected locations in
their facilities. The North Central Workforce Investment Board emailed the survey
link to their contact lists. A total of 1,144 surveys were completed, including 573
from Indiana County residents.
The primary data collection process included qualitative data from eight stakeholder
interviews conducted during March and April 2015 by staff members of IRMC, with
an additional 16 interviews conducted during that timeframe by staff members of
the other regional hospitals. Stakeholders interviewed included individuals with
expertise in the following disciplines and/or organizational affiliations:

2015 Community Health Needs Assessment
Executive Summary
Page | 8
• Head Start/Retired Hospital staff/Certified Diabetic Educator/ Yoga
Instructor/ Registered Dietitian, Punxsutawney
• Hospitalist/Family Practice Physician, Punxsutawney
• Punxsutawney Area Community Center
• Primary Health Network/Billing
• Clarion Hospital/Emergency Room Physician
• Indiana County Sheriff’s Office
• Office of Veterans Affairs, Indiana County
• Clarion Area School District Superintendent
• Children and Youth Services/Human Services, Clarion County
• Pennsylvania Department of Public Welfare
• Service and Access Management, Clarion County
• Indiana County Emergency Management
• Indiana County Head Start
• Punxsutawney Rotary Club/Creative Garden Daycare
• Visiting Nurse Association of Indiana County
• Indiana County Housing Authority
• Clarion County Prison
• Office of Veterans Affairs, Clarion County
• Clarion Ministerium
• Area Agency on Aging, Clarion County
• Armstrong-Indiana Behavioral Health and Developmental Health Program
• PA State Government, Representative for 62nd Legislative District, Indiana
County
Focus groups were conducted with five different groups in March and April 2015
representing the following groups as seen in Table 1:
Table 1: PMCN Focus Groups Conducted
Date
Conducted
Group Total #
Participants
Hospital Area
Represented
March 20,
2015
Clarion County School
Nurses
14 Clarion
March 25,
2015
Laurel Lake Church Bible
Group
9 Punxsutawney
April 14,
2015
Senior Citizens from
Senior Center
16 Clarion
April 20,
2015
Clarion County Rotary Club 25 Clarion

2015 Community Health Needs Assessment
Executive Summary
Page | 9
Date
Conducted
Group Total #
Participants
Hospital Area
Represented
April 22,
2015
Clarion University
Students
8 Clarion
Interviews and focus groups captured personal perspectives from community
members, providers, and leaders with insight and expertise into the health of a
specific population group or issue, a specific community or the county overall.
Needs/Issues Prioritization Process
On May 1 2015, each PMCN hospital Steering Committee met to review the primary
and secondary data collected through the needs assessment process and discussed
needs and issues present in both the region and their local service territory. Debra
Thompson, President of Strategy Solutions, Inc. presented the data to the IRMC
Steering Committee and discussed the needs of the local area, what IRMC and other
providers are currently offering the community, and discussed other potential needs
that were not reflected in the data collected. A total of 35 possible needs and issues
were identified, based on disparities in the data (differences in sub-populations,
comparison to state, national or Healthy People 2020 goals, negative trends, or
growing incidence. Four criteria, including accountable role, magnitude of the
problem, impact on other health outcomes, and capacity (systems and resources to
implement evidence based solutions), were identified that the group would use to
evaluate identified needs and issues.
During the week after the meeting, Steering Committee members from all three
PMCN hospitals completed the prioritization exercise using the Survey Monkey
Internet survey tool to rate each the needs and issues on a one to ten scale by each
of the selected criteria.
The number of Steering Committee members participating in the prioritization
exercise included:
• PMCN: 34 participants (note: one committee member represents 2
hospitals –Clarion and Indiana)
• Clarion – 13 participants
• Indiana – 11 participants
• Punxsutawney – 11 participants
The consulting team analyzed the data from the prioritization exercise and rank
ordered the results by overall composite score (reflecting the scores of all criteria)
for the PMCN region as well as for each individual hospital Steering Committee.

2015 Community Health Needs Assessment
Executive Summary
Page | 10
On May 29, 2015, each hospital Steering Committee met again to discuss the
prioritization results and the significant for their local area, and to discuss whether
the hospital or another collaborative partner would be the lead agency in
addressing selected needs.
Review and Approval
The IRMC CHNA report will be approved by the IRMC Board of Directors on June 11,
2015.

2015 Community Health Needs Assessment
Executive Summary
Page | 11
Evaluation of the 2012 IRMC CHNA Implementation Strategies
In March 2015, IRMC conducted a 3-year evaluation of the implementation
strategies undertaken since completion of the 2012 CHNA. Although the status for
most county level indicators did not move substantially, it is clear that IRMC is
working and making progress to improve the health of the community.
Earlier in 2015, IRMC received a grant from the Pennsylvania Office of Rural Health
to implement the Healthy Communities, Inc. data site on their website. This data
uses “gas gauge” graphics to display related indicators that show where Indiana
County is in relation to all of Pennsylvania.
In reviewing the status of each of the seven identified priority areas, IRMC reported
that:
• Priority Area 1: Increase to 78% Indiana County women that receive early
prenatal care – only 65.5% of Indiana County women received early prenatal
care, missing the IRMC 2011 goal by 12.5%. However, 84% of the women
who deliver at IRMC did receive early prenatal care.
• Priority Area 2: Decrease the physician to population ratio by 10% to
1:1,200 population – ratio only at 1:1,764 population despite the addition of
the equivalent of 12 primary care physicians.
• Priority Area 3: Decrease the percent of overweight and obese in Indiana
County to 60% - data combined with two other counties at 68%.
• Priority Area 4: Reduce the death rate from Influenza and Pneumonia to 17
per 100,000 population – this goal almost reached at 17.2 deaths per
100,000 population.
• Priority Area 5: Increase the percent of adults being screened for cholesterol
to 82% - no data available.
• Priority Area 6: Reduce the preventable hospitalizations and readmission
rate by 20% from 119/1,000 Medicare enrollees – goal achieved with 92
readmissions/ 1,000 Medicare enrollees.
GENERAL FINDINGS

2015 Community Health Needs Assessment
Executive Summary
Page | 12
• Priority Area 7: Decrease number of patients seen in the ED for substance
abuse by 25% - number of patients presenting has increased by 10%.
In addition, through the implementation planning process, IRMC
substantially improved its collaborative relationships with community
partners, especially related to the work with the Clarion, Armstrong and
Indiana Drug and Alcohol Commission. A listing of the status of the various
initiatives pursued in the implementation strategies is included in Appendix A
of this report.
Demographics
For purposes of this assessment, the service area geography is defined as Indiana
County. The overall population of this area as of the 2010 Census was 88,880.
• From the 2000 to 2010 census the Indiana Regional Medical Center service
area population has been steadily declining and is projected to continue to
decline from 87,169 in 2015 to 86,660 in 2020.
• At 50.24%, there are slightly more females living in the Primary Service
Area.
• The Primary Service Area is predominately white, with a rate of 52.47%.
• The majority of the Primary Service Area (47.7%) is between the ages of 25-
54.
• Just under half of the Primary Service Area population(48.4%) is married
and living with their spouse.
• One in three (30.5%) have received an Associate Degree or higher
educational attainment. Slightly more than one in ten (12.3%) residents
have not graduated high school, while 43.8% of the Primary Service Area
has obtained a high school diploma or GED, while 13.3% has obtained at
least a college education.
• The income statistics for the Primary Service Area indicates the service area
to be low to middle income; just under one in five households (16.2%) have
an annual income of $15,000 or less. Over half (53.4%) have annual
incomes less than $50,000.
• 52.8% of the Primary Service Area is employed; however, 4.3% are not in
the labor force; very few (4.3%) residents are currently unemployed.
• Almost a third (28.5%) of residents in the Primary Service Area travel less
than 30 minutes to get to work.
Asset Inventory
A list of community assets and resources that are available in the community to
support residents was compiled and is mapped in Figures 3 and 4. The assets

2015 Community Health Needs Assessment
Executive Summary
Page | 13
identified a listing of aging services, alcohol/drug abuse/prevention education,
children and youth services, clothing, counseling/support, education/educational
information, employment training/counseling, food, fuel/utilities, health/medical
care/educational information, housing/shelter, mental health/developmental
disabilities, money/income, pregnancy services, protective services, recreation/
socialization, transportation, and veterans services. Also included in the asset
inventory is a listing of all assets available under the PMCN collaboration.
Figure 3: IRMC Asset Map

2015 Community Health Needs Assessment
Executive Summary
Page | 14
Figure 4: PMCN Asset Map

2015 Community Health Needs Assessment
Executive Summary
Page | 15
Table 2. IRMC Asset Listing
Aging Services Address City State Zip
acessAbilities, Inc 2273 Philadelphia Street Indiana PA 15701
Aging Services, Inc 1005 Oak Street Indiana PA 15701
Armagh Community Center 12095 PA 56 Armagh PA 15920
Aultman Community Center 57 7th Street Aultman PA 15713
Chestnut Hills Community
Center
26 Heybert Drive Blairsville PA 15717
Homer Center Community
Center
279 Yellow Creek Street Homer City PA 15748
Indiana Community Center 1001 Oak Street Indiana PA 15701
Mahoning Hills Community
Center
19288 Rt 119 North Punxsutawney PA 15767
Saltsburg Community
Center
212 Point Street Saltsburg PA 15681
Twolick Valley Community
Center
450 Franklin Street Clymer PA 15728
CareNet/ VNA 850 Hospital Road, Suite 3000 Indiana PA 15701
Helpmates, Inc. 978 Philadelphia Street Indiana PA 15701
IRMC Behavioral Health
Services
835 Hospital Road Indiana PA 15701
IRMC Lifeline Emergency
Response System
835 Hospital Road Indiana PA 15701
SeniorCARE 1220 Wayne Avenue Indiana PA 15701
Alcohol/Drug Abuse/
Prevention Education
Address City State Zip
Armstrong-Indiana-Clarion
Drug & Alcohol
Commission, Inc
10829 US 422 Shelocta PA 15774
ARIN IU 28 Underage Users
Group
2895 West Pike Road Indiana PA 15701
Conewago, Indiana
(inpatient)
2275 Warren Road Indiana PA 15701
Med-Tech Rehab
(methodone)
1985 Route 22 Hwy West Blairsville PA 15717
PeerStar, LLC 300 Indian Springs Road, Suite 122 Indiana PA 15701
The Open Door 665 Philadelphia St Indiana PA 15701
Children & Youth Services Address City State Zip
accessAbilities, Inc 2273 Philadelphia Street Indiana PA 15701
Adelphoi Village Academy 226 North 5th Street Indiana PA 15701
ARIN IU 28, Family
Programs
2895 West Pike Road Indiana PA 15701
Big Hearts, Little Hands
(mentoring)
60 N. Ben Franklin Road Indiana PA 15701

2015 Community Health Needs Assessment
Executive Summary
Page | 16
Children & Youth Services Address City State Zip
Catholic Charities,
Greensburg Diocese
1200 Oakland Avenue Indiana PA 15701
Care Center of Indiana
County
125 North 5th Street Indiana PA 15701
Child Care Information
Services
155 North Clymer Avenue Indiana PA 15701
Community Guidance
Center
793 Old Rt 119 North Indiana PA 15701
Evergreen Boys & Girls
Clubs of Indiana County
650 South 13th Street Indiana PA 15701
Hopeful Hearts/VNA 728 Church Street Indiana PA 15701
Family Behavioral
Resources
1380 PA- 286 Indiana PA 15701
Indiana County Children &
Youth Services
350 North 4th Street Indiana PA 15701
Indiana County Head Start 528 Gompers Avenue Indiana PA 15701
Indiana County YMCA 60 North Ben Franklin Road Indiana PA 15701
Indi-Kids 570 South 11th Street Indiana PA 15701
IUP Child Study Center 1175 Maple Street Indiana PA 15705
Justice Works Youth Center 1618 Warren Road Indiana PA 15701
Kids Count Family
Psychological
1265 Wayne Avenue Suite 109 Indiana PA 15701
Lifesteps, Indiana County
Programs
1455 Church Street Indiana PA 15701
New Story 334 Philadelphia Street Indiana PA 15701
NHS Human Services 9457 Route 422 West Shelocta PA 15774
Penn State Cooperative
Extension - 4-H Clubs
827 Water Street Indiana PA 15701
Clothing Address City State Zip
Birthright 271 Philadelphia Street Indiana PA 15701
Chevy Chase Community
Center
640 North 5th Street Indiana PA 15701
Christos Clothes Closet 40 East Elm Street Homer City PA 15748
Clothes of Many Colors 5287 PA 56 Brush Valley PA 15720
Katie's Closet 100 South 6th Street Indiana PA 15701
Life-Way Pregnancy Center 1176 Grant Street, Suite 1160 Indiana PA 15701
My Best Friends Closet 813 Salt Street Saltsburg PA 15681
St. Vincent De Paul Thrift
Store
410 North 4th Street Indiana PA 15701
Salvation Army Thrift Store 2452 Philadelphia Street Indiana PA 15701
Counseling/Support Address City State Zip
Alice Paul House PO Box 417 Indiana PA 15701
Armstrong-Indiana
Behavioral & Development
Health
121 Armsdale Road, Suite 105 Kittanning PA 16201

2015 Community Health Needs Assessment
Executive Summary
Page | 17
Counseling/Support Address City State Zip
Catholic Charities,
Greensburg Diocese
1200 Oakland Avenue Indiana PA 15701
Care Center of Indiana
County
125 North 5th Street Indiana PA 15701
Christian Counseling
Services of Indiana County,
Inc.
637 Philadelphia Street, Suite 301 Indiana PA 15701
Community Guidance
Center
793 Old Rt 119 North Indiana PA 15701
Community Psychiatric
Centers
29 Saltsburg Road Jacksonville PA 15725
Family A.C.T.S., Inc. 610 Kolter Drive Indiana PA 15701
Family Behavioral
Resources
1380 PA- 286 Indiana PA 15701
Family Counseling Center 155 North 10th Street Indiana PA 15701
Hopeful Hearts/VNA 728 Church Street Indiana PA 15701
Kids Count Family
Psychological
1265 Wayne Avenue Suite 109 Indiana PA 15701
Life-Way Pregnancy Center 1176 Grant Street, Suite 1160 Indiana PA 15701
My Choice Medical Clinic
(Pregnancy)
1205 Maple Street, Suite A Indiana PA 15701
New Story 334 Philadelphia Street Indiana PA 15701
NHS Human Services 9457 Route 422 West Shelocta PA 15774
Peerstar, LLC 300 Indian Springs Road, Suite 122 Indiana PA 15701
The Open Door 665 Philadelphia St Indiana PA 15701
Education/Educational
Information
Address City State Zip
Adelphoi Village Academy 226 North 5th Street Indiana PA 15701
ARIN IU 28 (Children &
Adults)
2895 West Pike Road Indiana PA 15701
Care Center of Indiana
County (Parent)
125 North 5th Street Indiana PA 15701
Indiana County Head Start
(0-3, Preschool)
528 Gompers Avenue Indiana PA 15701
Indiana County Technology
Center (Youth, Adult)
441 Hamil Road Indiana PA 15701
Indi-Kids (Preschool) 570 South 11th Street Indiana PA 15701
IRMC Institute for Healthy
Living
2010 Shelly Drive Indiana PA 15701
IUP Child Study Center 1175 Maple Street Indiana PA 15705
Lifesteps, Indiana County
Programs (Mobile Library)
1455 Church Street Indiana PA 15701
New Story (Autism) 334 Philadelphia Street Indiana PA 15701

2015 Community Health Needs Assessment
Executive Summary
Page | 18
Education/Educational
Information
Address City State Zip
Penn State Cooperative
Extension (Consumer,
Agriculture)
827 Water Street Indiana PA 15701
Salvation Army (Tutoring) 635 Water Street Indiana PA 15701
Employment Training/
Counseling
Address City State Zip
Aging Services, Inc. (Seniors) 1005 Oak Street Indiana PA 15701
Community Living &
Learning
1430 Rt 286 East Indiana PA 15701
ICW Vocational Services,
Inc.
155 North 10th Street Indiana PA 15701
Indiana County Community
Action Program
827 Water Street Indiana PA 15701
Indiana County Technology
Center
441 Hamil Road Indiana PA 15701
PA Career Link, Indiana
County
300 Indian Springs Road Indiana PA 15701
Food Address City State Zip
Aging Service, Inc. 1005 Oak Street Indiana PA 15701
Arcadia Food Bank 248 Arcardia Road Arcadia PA 15712
Black Lick Food Bank Blair Street Black Lick PA 15716
Blairsville Food Bank 137 North Walnut Street Blairsville PA 15717
Brush Valley Food Bank 5544 Rt 259 Hwy South Brush Valley PA 15720
Catholic Charities,
Greensburg Diocese (Infant
Formula)
1200 Oakland Avenue Indiana PA 15701
Chevy Chase Community
Center
640 North 5th Street Indiana PA 15701
Clymer Food Bank 550 Sherman Street Clymer PA 15728
Commodore Food Bank 410 Musser Road Commodore PA 15729
Community Kitchen 575 Pfeiffer Road Marion Center PA 15759
Creekside Food Bank 444 Indiana Road Creekside PA 15732
Glen Campbell Food Bank 2712 Pine Vale Road Glen Campbell PA 15742
Heilwood Food Bank 6485 PA-403 Heilwood PA 15745
Homer City Food Bank 25 Main Street Homer City PA 15748
Indiana County Community
Action Program (ICCAP)
827 Water Street Indiana PA 15701
Indiana County Welfare
Office
2750 West Pike Road Indiana PA 15701
Indiana Food Bank 1849 South 6th Street Indiana PA 15701
Iselin Food Bank Iselin Road Saltsburg PA 15774
Marion Center Food Bank 710 Manor Street Marion Center PA 15759
Meals on Wheels, Homer
City
Homer City PA 15748

2015 Community Health Needs Assessment
Executive Summary
Page | 19
Food Address City State Zip
Meals on Wheels, Indiana R 534 Philadelphia Street Indiana PA 15701
Plumville Food Bank PA-85 Main Street Plumville PA 16246
Saltsburg Food Bank 212 Point Street Saltsburg PA 15681
Shelocta Food Bank 182 South Ridge Road Shelocta PA 15774
The Salvation Army 635 Water Street Indiana PA 15701
Women, Infants, and
Children Nutrition Program
(WIC)
1099 Oak Street Indiana PA 15701
Fuel/Utilities Address City State Zip
Catholic Charities,
Greensburg Diocese
1200 Oakland Avenue Indiana PA 15701
Indiana County Community
Action Program
827 Water Street Indiana PA 15701
Indiana County Welfare
Office
2750 West Pike Road Indiana PA 15701
Health/Medical Care/
Educational Information
Address City State Zip
accessAbilities, Inc. 2273 Philadelphia Street Indiana PA 15701
Adagio Health (Women) 1009 Oak Street Indiana PA 15701
Anew Home Health Agency 1380 Rt 286 East, Suite 223 Indiana PA 15701
BAYADA Pediatrics/Home
Health Care
175 Cornell Road, Suite 13 Blairsville PA 15717
Caring Heart Home Health 88 Juniper Street Homer City PA 15748
Center for Weight Loss 120 IRMC Drive, Suite 110 Indiana PA 15701
Chestnut Ridge Outpatient
Testing Center
25 Colony Boulevard Blairsville PA 15717
Chestnut Ridge Urgi- Care 25 Colony Boulevard Blairsville PA 15717
Empower3 Center for
Health
881 Hospital Road Indiana PA 15701
Family Hospice of Indiana
County
850 Hospital Road, Suite 3000 Indiana PA 15701
Heritage Home Health
Agency
1480 Indian Springs Road, Suite 2 Indiana PA 15701
Home Care Advantage 1480 Indian Springs Road, Suite 2 Indiana PA 15701
Home Nursing Agency 320 Franklin Street Clymer PA 15728
Indiana County Welfare
Office
2750 West Pike Road Indiana PA 15701
Indiana VA Outpatient Clinic 1570 Oakland Avenue Indiana PA 15701
Indiana Regional Medical
Center
835 Hospital Road Indiana PA 15701
Indiana Regional Medical
Center Urgi Care
875 Hospital Road Indiana PA 15701
Diabetes Education Center 835 Hospital Road Indiana PA 15701
IUP Speech, Language &
Hearing Clinic
570 South 11th Street Indiana PA 15705

2015 Community Health Needs Assessment
Executive Summary
Page | 20
Health/Medical Care/
Educational Information
Address City State Zip
Mahoning Outpatient
Testing Center
100 Neal Road Marion Center PA 15759
MedExpress 2128 Oakland Avenue Indiana PA 15701
Medi Home Health Agency 2265 Philadelphia Street Indiana PA 15701
Minute Clinic - CVS 2501 Warren Road Indiana PA 15701
Northern Cambria
Outpatient Testing Center
4210 Crawford Street Northern Cambria PA 15714
Pennsylvania Department of
Health
75 North 2nd Street Indiana PA 15701
Primary Health Network,
Indiana Dental Center
590 Indian Springs Road Indiana PA 15701
Primary Health Network,
Jacksonville Family
Medicine
29 Saltsburg Road Clarksburg PA 15725
Senior Care 1220 Wayne Avenue Indiana PA 15701
Tri-County Community
Health Center
1555 Shawna Road Cherry Tree PA 15724
Seward Outpatient Testing
Center
238 Indiana Street Seward PA 15954
Visiting Nurse Association of
Indiana County
850 Hospital Road, Suite 3000 Indiana PA 15701
Housing/Shelter Address City State Zip
Alice Paul House (Domestic
Violence)
PO Box 417 Indiana PA 15701
Family Promise of Indiana
County
1292 Old 119 North Indiana PA 15701
Habitat for Humanity PO Box 663 Indiana PA 15701
Housing Authority of
Indiana County
104 Philadelphia Street Indiana PA 15701
I & A Residential Services 1019 Philadelphia Street, Suite 2 Indiana PA 15701
Indiana County Community
Action Program (Homeless)
827 Water Street Indiana PA 15701
Lifesteps, Indiana County
Programs
1455 Church Street Indiana PA 15701
Mental Health/
Developmental Disabilities
Address City State Zip
accessAbilities, Inc. 2273 Philadelphia Street Indiana PA 15701
Armstrong-Indiana
Behavioral & Development
Health
121 Armsdale Road, Suite 105 Kittanning PA 16201
IRMC Behavioral Health
Services
835 Hospital Road Indiana PA 15701
Community Living &
Learning
1430 PA 286 Indiana PA 15701

2015 Community Health Needs Assessment
Executive Summary
Page | 21
Mental Health/
Developmental Disabilities
Address City State Zip
Community Psychiatric
Centers
29 Saltsburg Road Jacksonville PA 15725
Family Behavioral
Resources
1380 PA- 286 Indiana PA 15701
I & A Residential Services 1019 Philadelphia Street, Suite 2 Indiana PA 15701
ICW Vocational Services,
Inc.
155 North 10th Street Indiana PA 15701
Kids Count Family
Psychological
1265 Wayne Avenue Suite 109 Indiana PA 15701
Lifesteps, Indiana County
Programs
1455 Church Street Indiana PA 15701
New Beginnings Drop-In
Center
638 Old 119 North Indiana PA 15701
New Story (Autism) 334 Philadelphia Street Indiana PA 15701
NHS Human Services 9457 Route 422 West Shelocta PA 15774
The Open Door 665 Philadelphia St Indiana PA 15701
Money/Income Address City State Zip
Domestic Relations 665 Philadelphia Street Indiana PA 15701
Indiana County Welfare
Office
2750 West Pike Road Indiana PA 15701
Laurel Legal Services 655 Church Street Indiana PA 15701
Pregnancy Services Address City State Zip
Adagio Health 1097 Oak Street Indiana PA 15701
ARIN IU 28 (Teen programs) 2895 West Pike Road Indiana PA 15701
Birthrightirth 271 Philadelphia Street Indiana PA 15701
Catholic Charities,
Greensburg Diocese
1200 Oakland Avenue Indiana PA 15701
Life-Way Pregnancy Center 1176 Grant Street, Suite 1160 Indiana PA 15701
My Choice Medical Clinic
(Pregnancy)
1205 Maple Street, Suite A Indiana PA 15701
OB/GYN Care Center 879 Hospital Road Indiana PA 15701
Prenatal/Family Education
Programs - IRMC
835 Hospital Road Indiana PA 15701
Protective Services Address City State Zip
Aging Services, Inc. 1005 Oak Street Indiana PA 15701
Alice Paul House PO Box 417 Indiana PA 15701
Care Center of Indiana
County
125 North 5th Street Indiana PA 15701
Indiana County Children &
Youth Services
350 North 4th Street Indiana PA 15701
Laurel Legal Services 655 Church Street Indiana PA 15701
Recreation/Socialization Address City State Zip
Aging Services, Inc. 1005 Oak Street Indiana PA 15701
Armagh Community Center 12095 PA 56 Armagh PA 15920

2015 Community Health Needs Assessment
Executive Summary
Page | 22
Recreation/Socialization Address City State Zip
Aultman Community Center 57 7th Street Aultman PA 15713
Big Hearts/Little Hands 60 North Ben Franklin Road Indiana PA 15701
Blairsville Parks and
Recreation
101 East North Street Blairsville PA 15717
Blairsville Public Library 113 North Walnut Street Blairsville PA 15717
Burrell Township Library 119 Park Drive in Blacklick PA 15716
Chestnut Hills Community
Center
26 Heybert Drive Blairsville PA 15717
Crooked Fence Farm 1722 Nashville Road Rochester Mills PA 15721
Evergreen Boys & Girls
Clubs of Indiana County
650 South 13th Street Indiana PA 15701
Homer Center Community
Center
279 Yellow Creek Street Homer City PA 15748
Homer City Parks and
Recreation
11 Harrison Street Homer City PA 15748
Homer Center Public Library 6 North Main Street Homer City PA 15728
Indiana Community Center 1001 Oak Street Indiana PA 15701
Indiana County Parks and
Trails
1128 Blue Spruce Road Indiana PA 15701
Indiana County YMCA 60 North Ben Franklin Road Indiana PA 15701
Indiana Free Library 845 Philadelphia Street Indiana PA 15701
Indiana Parks and
Recreation
497 East Pike Road Indiana PA 15701
Penn State Cooperative
Extension (4-H Clubs)
827 Water Street Indiana PA 15701
Saltsburg Community
Center
212 Point Street Saltsburg PA 15681
SeniorCARE 1220 Wayne Avenue Indiana PA 15701
S&T Medical Fitness Facility 2010 Shelly Drive Indiana PA 15701
The Salvation Army
(summer camps)
635 Water Street Indiana PA 15701
Twolick Valley Community
Center
450 Franklin Street Clymer PA 15728
White Township Recreation
Complex
497 East Pike Road Indiana PA 15701
Transportation Address City State Zip
Aging Services, Inc. 1005 Oak Street Indiana PA 15701
Citizen's Ambulance Service 805 Hospital Road Indiana PA 15701
Indiana County Department
of Human Services (MATP)
300 Indian Springs Road, Suite203 Indiana PA 15701
IndiGO/Indiana County
Transit Authority
1657 Saltsburg Avenue Indiana PA 15701
Indiana County Veterans
Affairs
825 Philadelphia Street Indiana PA 15701
Medi-Van 1311 Philadelphia Street Northern Cambria PA 15714

2015 Community Health Needs Assessment
Executive Summary
Page | 23
Transportation Address City State Zip
SeniorCARE 1220 Wayne Avenue Indiana PA 15701
Stewart Bus Line 3551 State Route 156 Avonmore PA 15618
Veterans Address City State Zip
Crooked Fence Farm 1722 Nashville Road Rochester Mills PA 15721
Indiana County Veterans
Affairs
825 Philadelphia Street Indiana PA 15701
Indiana VA Outpatient Clinic 1570 Oakland Avenue Indiana PA 15701
PA CareerLink, Indiana
County
300 Indian Springs Road Indiana PA 15701
Key Findings –BRFSS & Public Health Data
This assessment reviewed a number of indicators at the county level from the
statewide Behavioral Risk Factor Survey (BRFSS) as well as disease incidence and
mortality indicators. For this analysis, the service area data was compared to state
and national data where possible.
As outlined in the following tables, for many of the BRFSS questions, IRMC’s service
area data was comparable to the state data, with some slight variability across the
indicators. Behavioral risk factors in the service area where the regional rates were
worse than the state include the percentage of people who rated their health status
fair or poor, obesity and those currently using chewing tobacco/snuff/snus
somewhat or every day.
When looking at the BRFSS questions related to PMCN’s service area data, the
regional rates that were worse than Pennsylvania include the percentage of people
who rated their health status fair or poor, adults ever told they had a heart attack,
obesity, adults 18-64 who were tested for HIV, those currently using chewing
tobacco/snuff/snus somewhat or every day and adults who report being an
everyday smoker.
The public health data for IRMC’s service area shows that the region has increasing
rates of breast cancer incidence, heart disease mortality, heart attack mortality,
Lyme disease, student health asthma, Chlamydia, Gonorrhea, drug-induced
mortality, mental and behavior disorders mortality, and auto accident mortality.
The 2013 Pennsylvania Youth Survey for children in grades 6, 8, 10 and 12 for the
IRMC service area suggests that there are increasing rates in lifetime use of alcohol,
marijuana and pain relievers, as well as percent of students who drove after
drinking or marijuana use.
Within PMCN’s service area has increasing rates of chronic diseases in several areas:
breast cancer incidence in the counties of Armstrong, Butler and Clarion; breast
cancer mortality in Clearfield County; bronchus and lung cancer incidence in

2015 Community Health Needs Assessment
Executive Summary
Page | 24
Armstrong and Indiana counties; bronchus and lung mortality in the counties of
Armstrong and Forest; colorectal cancer incidence in Armstrong County; colorectal
cancer mortality in Butler and Venango counties; ovarian cancer incidence in Butler
County; heart disease mortality in Indiana County; heart attack mortality for the
counties of Butler and Indiana; diabetes mortality in Armstrong, Clarion, Clearfield,
Jefferson and Venango counties; Type 1 diabetes in students in the counties of
Butler, Clarion, Clearfield, and Jefferson; Type 2 diabetes in Armstrong County; Lyme
disease in Armstrong, Butler, Clarion, Clearfield, Indiana and Jefferson counties; and
Alzheimer mortality in Clearfield County.
For the Healthy Environment indicators, PMCN’s service area has increasing rates of
student health asthma in Armstrong, Butler, Clearfield, Forest, Indiana and Jefferson
counties. Healthy Mothers, Babies and Children shows decreasing rates for PMCN’s
service area in prenatal care during the first trimester in Armstrong and Indiana
counties and breastfeeding in Forest County. Increasing trends for PMCN’s service
area can be seen in low birth-weight of babies born in Clearfield County; mothers
reporting Medicaid assistance in Butler County; teen live birth outcomes in
Clearfield and Venango counties; infant mortality in Butler County; students in
grades K-12 who are overweight in all counties but Indiana; and students in grades
K-12 who are obese in Clarion and Clearfield counties.
For the selected indicators within Infectious Disease, Mental Health and Substance
Abuse, Tobacco Use and Injury, PMCN’s service has increasing rates of Chlamydia in
all counties, although all counties are well below the Pennsylvania rate; Gonorrhea
in Butler, Indiana, Jefferson and Venango counties but again all below the state rate;
drug induced mortality in the counties of Armstrong, Butler, Clearfield and Indiana;
mental and behavior disorders mortality in Armstrong, Butler, Clarion, Clearfield,
Indiana and Jefferson counties; never/rarely get the social or emotional support
they need in the counties of Armstrong, Butler, Clearfield, Venango; adults who
smoke in Clearfield, Jefferson and Venango counties; auto accident mortality in
Indiana County; and firearm mortality in Butler County.
Other indicators that show an increasing trend in the PMCN service area include
unemployment, children living in poverty and children living in a single parent home
in all eight counties.
The 2013 Pennsylvania Youth Survey for children in grades 6, 8, 10 and 12 for the
PMCN service area shows that there are increasing rates in lifetime alcohol use for
all counties except Forest, as Forest County’s numbers cannot be reported as there
is only one school district in the county; lifetime marijuana use for Armstrong,
Clarion, Clearfield, Indiana and Jefferson counties; percent of students who drove
after drinking in the counties of Armstrong, Butler, Indiana, Jefferson and Venango;
percent of students who drove after marijuana use in Clearfield, Indiana and

2015 Community Health Needs Assessment
Executive Summary
Page | 25
Venango counties; and lifetime use of abusing pain relievers in the counties of
Armstrong, Butler, Clarion, Indiana, Jefferson and Venango.
Other Secondary Data: Hospital Utilization Rates
From 2011 through 2013, hospital inpatient discharges for ambulatory care sensitive
conditions for IRMC increased for: pneumonia, complications of pregnancy,
reproductive disorder, bronchitis/asthma in adults, drug and alcohol abuse, and
Chronic Obstructive Pulmonary Disease (COPD).

2015 Community Health Needs Assessment
Executive Summary
P a g e | xxvi
Overall Key Findings
The tables below highlight the key findings of the Behavioral Risk Factor Survey.
Source: Pennsylvania Department of Health, Centers for Disease Control, www.healthypeople.gov
The color coding illustrates comparisons to the Healthy People 2020 goal or the national
rate (if there is no HP 2020 goal). Red indicates that the regional data is worse than the
comparison and green indicates better than the comparison.
Cra wford,
Lawrence, Mercer,
Vena ngo
Crawford,
La wrence, Mercer,
Vena ngo
Forest, Elk,
Cameron,
Cl ea rfie ld,
Jefferson, Cl arion,
McKean, Warren
Forest, Elk,
Ca meron,
Clea rfi el d,
Jeffers on, Cl arion,
McKean, Wa rren
India na ,
Cambria ,
Somerset,
Armstrong
India na ,
Cambri a,
Somerset,
Armstrong
Bea ver,
Butler
Bea ver,
Butler PA PA US US HP 2020 Local PA US HP 2020
Behavior Risk 2008-10 2011-2013 2008-10 2011-2013 2008-10 2011-2013 2008-10 2011-2013 2008-10 2011-13 2010 2013 Goal Trend Comp Comp Comp
ACCESS
Reported Health Poor or Fair 17.0% 19.0% 22.0% 20.0% 20.0% 21.0% 14.0% 15.0% 15.0% 17.0% 14.7% 16.7% +/- +/- +
Physical Health Not Good for 1+ Days in the Past Month 36.0% 41.0% 37.0% 39.0% 40.0% 40.0% 36.0% 37.0% 37.0% 38.0% =/- +/-
Poor Physical or Mental Health Preventing Usual Activities in the Past Month 22.0% 22.0% 22.0% 19.0% 23.0% 23.0% 20.0% 20.0% 21.0% 22.0% +/= +/-
No Health Insurance 15.0% 15.0% 16.0% 17.0% 14.0% 15.0% 14.0% 14.0% 13.0% 16.0% 17.8% 16.8% 0% +/= +/- - +
No Personal Health Care Provider 9.0% 12.0% 10.0% 12.0% 10.0% 11.0% 12.0% 11.0% 11.0% 13.0% 22.9% 16.1% +/- - - -
Routine Check-up Within the Past 2 Years 80.0% 82.0% 83.0% 84.0% 80.0% 83.0% 81.0% 82.0% 83.0% 83.0% 81.3% + +/- +
Needed to See a Doctor But Could Not Due to Cost, Past Year 11.0% 13.0% 12.0% 10.0% 8.0% 12.0% 10.0% 12.0% 11.0% 13.0% 15.3% 4.2% +/- - - +
CHRONIC DISEASE
Ever Told They Have Heart Disease- Age 35 and older 9.0% 6.0% 8.0% 8.0% 9.0% 8.0% 6.0% 7.0% 7.0% 7.0% 4.1% 4.1% +/- +/- +
Ever Told They Had a Heart Attack- Age 35 and Older 8.0% 7.0% 9.0% 7.0% 9.0% 8.0% 7.0% 7.0% 6.0% 6.0% 4.2% 4.3% +/- + +
Ever Told They Had a Stroke- Age 35 and older 6.0% 5.0% 4.0% 4.0% 4.0% 3.0% 3.0% 3.0% 12.0% 4.0% 2.8% +/= -/= +
Ever Told They Had a MI, Heart Disease, or Stroke- Age GE 35 15.0% 13.0% 13.0% 15.0% 15.0% 14.0% 12.0% 12.0% 12.0% -/= +/=
Ever Told They Had Kidney Disease, Not Including Kidney Stones, Bladder Infection or
Incontinence 3.0% 3.0% 3.0% 3.0% 2.0% 2.5% + +
Overweight (BMI 25-30) 38.0% 32.0% 34.0% 37.0% 34.0% 32.0% 38.0% 39.0% 36.0% 36.0% 36.2% 35.4% +/- +/- +/-
Obese (30-99.99) 30.0% 35.0% 32.0% 30.0% 37.0% 36.0% 25.0% 27.0% 28.0% 29.0% 27.5% 29.4% 30.5% - +/- + +/-
Adults Who Were Ever Told They Have Diabetes 10.0% 12.0% 11.0% 12.0% 11.0% 11.0% 9.0% 9.0% 10.0% 9.7% +/- +/- +
HEALTHY ENVIRONMENT
Adults Who Have Ever Been Told They Have Asthma 13.0% 13.0% 11.0% 13.0% 12.0% 12.0% 11.0% 13.0% 14.0% 14.0% 13.8% 14.1% +/- - -
Adults Who Currently Have Asthma 10.0% 8.0% 9.0% 9.0% 7.0% 8.0% 9.0% 9.0% 10.0% 10.0% 9.1% 9.0% +/- - -/=
INFECTIOUS DISEASE
Adults Who Had a Pneumonia Vaccine, Age 65 and older 69.0% 74.0% 63.0% 68.0% 69.0% 70.0% 76.0% 75.0% 70.0% 71.0% 68.8% 69.5% 90.0% +/- +/- +/= -
Ever Tested for HIV, Ages 18-64 26.0% 28.0% 24.0% 27.0% 23.0% 25.0% 24.0% 28.0% 34.0% 38.0% 35.2% 73.6% - - - -
MENTAL HEALTH AND SUBSTANCE ABUSE
Mental Health Not Good 1+ Days in the Past Month 33.0% 34.0% 33.0% 32.0% 35.0% 34.0% 30.0% 32.0% 34.0% 36.0% +/- -
Adults Who Reported Binge Drinking (5 drinks for men, 4 for women) 14.0% 15.0% 21.0% 17.0% 20.0% 18.0% 15.0% 14.0% 17.0% 18.0% 17.1% 16.8% 24.4% +/- -/= +/- -
At Risk for Heavy Drinking (2 drinks for men, 1 for women daily) 4.0% 5.0% 7.0% 5.0% 4.0% 6.0% 4.0% 5.0% 5.0% 6.0% 6.2% +/- -/= +/-
Reported Chronic Drinking (2 or more drinks daily for the past 30 days) 5.0% 5.0% 8.0% 6.0% 6.0% 7.0% 4.0% 6.0% 6.0% 6.0% 5.0% -/= -/= +/=
PHYSICAL ACTIVITY AND NUTRITION
No Leisure Time/Physical Activity in the Past Month 24.0% 29.0% 29.0% 25.0% 25.0% 23.9% 32.6% -
No Leisure Time/Physical Activity in the Past Month: Education Level College 15.0% 22.0% 26.0% 14.0%
TOBACCO USE
Adults Who Reported Never Being a Smoker 52.0% 50.0% 46.0% 52.0% 52.0% 53.0% 59.0% 56.0% 54.0% 53.0% 56.6% 55.0% +/- +/- -
Adults Who Reported Being a Former Smoker 25.0% 26.0% 25.0% 25.0% 24.0% 25.0% 24.0% 23.0% 26.0% 26.0% 25.1% 25.3% +/- -/= +/-
Adults Who Reported Being a Former Smoker (Female) 17.0% 20.0% 18.0% 22.0% 18.0% 19.0% 21.0% 21.0% 23.0% 22.0% -/= +/-
Adults Who Reported Being A Former Smoker (Male) 34.0% 31.0% 31.0% 30.0% 30.0% 31.0% 26.0% 26.0% 29.0% 29.0% + +/-
Currently using Chewing Tobacco, Snuff, or Snus, Somewhat or Everyday NA 6.0% NA 12.0% NA 12.0% NA 6.0% 4.0% 4.2% +/= +
Adults Who Have Quit Smoking at Least 1 Day in the Past Year (daily) 48.0% 47.0% 56.0% 50.0% 47.0% 54.0% 32.0% 57.0% 50.0% 54.0% 80.0% - +/- -
Adults Who Reported Being a Current Smoker 23.0% 24.0% 29.0% 23.0% 24.0% 22.0% 18.0% 21.0% 20.0% 22.0% 17.3% 18.8% 12.0% +/- +/- + +
Adults Who Reported Being An Everyday Smoker 18.0% 18.0% 24.0% 18.0% 18.0% 18.0% 14.0% 15.0% 15.0% 16.0% 12.4% 13.4% +/- + +

2015 Community Health Needs Assessment
Executive Summary
Page | xxvii
The following table highlights various health indicators included in the assessment:
Source: Pennsylvania Department of Health, Centers for Disease Control, www.healthypeople.gov
The color coding illustrates comparisons to the Healthy People 2020 goal or the national
rate (if there is no HP 2020 goal). Red indicates that the regional data is worse than the
comparison and green indicates better than the comparison. Yellow indicates that one
county is higher and another is lower.
Trend Trend Trend Trend PA (2010)
PA (the last
year) US (2010)
US - 2011-
2013 HP 2020 PA US HP Goal
Public Health Data 2008 2009 2010 2011 2012 +/- 2008 2009 2010 2011 2012 +/- 2008 2009 2010 2011 2012 +/- 2008 2009 2010 2011 2012 +/- Rate Rate Rate Rate Goal Comp Comp Comp
CHRONIC DISEASE
Breast Cancer Rate per 100,000 58.9 68.1 60.7 58.7 75.3 + 72.9 77.0 62.9 81.9 73.5 + 57.0 76.9 80.4 33.1 80.5 + 60.9 60.0 56.4 58.8 49.8 - 71.5 69.4 121.9 122.0 41.0 +/- +/- +
Breast Cancer Mortality Rate per 100,000 13.1 14.4 11.8 13.3 = 13.7 12.4 11.0 14.1 8.4 - 9.8 10.3 11.9 10.7 + 13.1 12.5 22.2 21.5 20.7 +/- +/- -
Bronchus and Lung Cancer Rate per 100,000 59.3 67.1 52.5 67.2 69.0 + 63.0 68.8 59.2 46.8 53.7 - 65.8 83.6 54.2 56.3 39.7 - 62.9 60.4 61.6 58.3 57.6 - 69.1 63.9 73.0 + +/-
Bronchus and Lung Cancer Mortality Rate per 100,000 48.8 59.7 46.6 42.5 51.0 + 49.3 54.7 49.7 46.7 38.5 - 42.3 54.4 51.7 40.7 33.6 - 40.6 49.7 48.6 54.8 34.0 - 48.7 46.5 57.9 45.5 +/- +/- +/-
Colorectal Cancer Rate per 100,000 40.5 46.2 49.9 35.2 52.4 + 50.9 41.5 42.0 50.5 42.7 - 71.2 65.5 36.2 55.7 48.1 - 61.8 44.8 49.1 41.5 51.2 - 47.6 42.5 46.1 38.6 +/- +/- +
Colorectal Cancer Mortality Rate per 100,000 23.2 15.6 13.1 20.9 14.4 - 16.0 12.7 14.8 14.4 21.3 + 17.9 18.7 19.4 28.3 18.5 17.6 16.9 - 17.0 15.8 16.9 18.1 14.5 +/- +/- +
Ovarian Cancer Rate per 100,000 10.1 13.1 10.8 14.3 14.0 + 21.2 13.3 11.9 11.3
Ovarian Cancer Mortality Rate per 100,000 9.5 7.5 10.5 + 15.0 8.1 7.9 7.5
Prostate Cancer Rate per 100,000 126.5 149.6 108.4 121.5 77.1 - 188.6 205.0 160.5 174.1 119.2 - 227.8 203.9 153.7 142.1 110.5 - 139.1 120.3 164.5 131.6 120.9 - 139.6 101.7 128.3 + -
Prostate Cancer Mortality Rate per 100,000 28.9 21.9 11.1 26.0 19.9 - 23.1 21.2 19.1 20.8 21.8 +/-
Heart Disease Mortality Rate per 100,000 235.0 220.7 217.4 204.2 178.3 - 204.5 184.8 178.7 171.6 176.2 - 196.3 197.3 212.0 210.7 196.4 = 232.2 218.7 197.9 219.4 177.0 - 185.3 175.2 176.8 +/- +
Heart Attack Mortality Rate per 100,000 40.6 33.8 27.7 31.3 22.6 - 23.4 26.5 19.7 15.4 27.4 + 24.7 18.2 16.1 18.8 19.3 12.3 - 38.2 17.9 89.2 +/- +/-
Coronary Heart Disease Mortality Rate per 100,000 137.0 134.0 129.2 117.5 112.4 - 136.6 113.5 115.6 101.0 99.7 - 131.8 130.8 134.5 139.3 127.6 - 158.2 158.1 129.7 143.2 129.7 - 123.0 115.3 108.91 103.4 +/- +/- +/-
Cardiovascular Mortality Rate per 100,000 294.6 275.9 263.0 267.5 236.1 - 261.1 239.5 238.7 211.9 231.5 - 265.8 249.2 257.1 266.2 261.5 - 297.9 253.3 255.0 252.6 222.0 - 123.0 225.5 233.73 +/- +/-
Cerebrovascular Mortality Rate per 100,000 49.0 48.1 42.0 41.9 49.6 = 42.6 39.3 44.0 32.5 41.3 - 58.4 36.4 41.6 37.6 42.3 - 54.7 25.9 43.6 23.0 29.4 - 237.6 36.8 39.1 39.9 34.8 +/- +/- +/-
Diabetes Mortality Rate per 100,000 22.5 30.7 19.5 24.7 33.7 + 29.6 26.2 25.1 22.9 20.8 - 34.5 38.4 39.9 33.5 36.2 + 32.2 33.0 30.1 20.7 38.2 + 38.9 22.0 20.8 73.28 66.6 +/- +/- -
Type I Diabetes, Students 0.36% 0.40% 0.40% 0.36% = 0.39% 0.38% 0.44% 0.40% + 0.32% 0.30% 0.38% 0.36% + 0.34% 0.37% 0.35% 0.36% + 19.6 0.32% +/- +/-
Type II Diabetes, Students 0.07% 0.02% 0.09% 0.12% + 0.08% 0.09% 0.08% 0.09% - 0.05% 0.05% 0.05% 0.00% - 0.11% 0.08% 0.10% 0.08% - 0.30% 0.06% +/- +/-
Lyme Disease Rate per 100,000 29.1 78.1 105.9 212.9 198.8 + 61.8 101.8 82.1 123.3 127.0 + 30.4 45.0 95.0 166.5 + 119.4 177.3 159.2 282.4 330.1 + 30.0 39.4 8.6 + +
Alzheimer Mortality Rate per 100,000 38.2 29.0 30.6 36.6 32.3 - 26.7 23.0 27.0 25.1 19.7 - 39.9 20.4 26.3 22.5 30.7 - 17.9 21.9 18.8 21.1 19.1 + 18.7 26.8 + +
HEALTHY ENVIRONMENT
Student Health Asthma 5.87% 10.62% 10.25% 10.68% + 4.11% 9.65% 9.12% 9.87% + 8.57% 9.32% 9.23% 8.75% = 14.36% 14.82% 14.91% 15.44% + 6.8% 12.05%
HEALTHY MOTHERS, BABIES AND CHILDREN
Prenatal Care First Trimester 76.5% 79.9% 75.5% 76.8% 72.4% - 75.6% 81.8% 81.6% 81.5% 81.2% + 68.2% 71.0% 67.2% 63.8% 73.0% + 69.1% 74.7% 69.3% 70.1% 77.9% + 71.3% 72.4% 70.8 77.9% +/= +/= +/-
Non-Smoking Mother During Pregnancy 70.8% 74.2% 74.9% 72.3% 74.6% + 81.1% 83.1% 82.4% 83.9% 85.1% + 73.2% 74.4% 77.3% 78.6% 79.6% + 69.0% 71.7% 69.9% 69.6% 69.8% = 84.1% 85.2% 89.3 98.6% - - -
Non-Smoking Mother 3 Months Prior to Pregnancy 63.9% 68.5% 68.0% 64.9% 65.5% + 75.2% 78.8% 76.9% 78.7% 79.9% + 64.5% 70.8% 69.4% 71.6% 72.7% + 59.5% 64.0% 61.8% 61.8% 61.7% + 78.2% 80.1% 76.8 - -
Low Birth-Weight Babies Born 7.5% 8.8% 6.6% 7.4% 7.4% - 7.8% 7.0% 6.4% 6.4% 6.4% - 7.0% 7.8% 6.7% 9.7% 6.7% - 7.0% 6.5% 7.8% 7.2% 8.1% + 8.3% 8.1% 8.0% 7.8% =/- +/= +/-
Mothers Reporting WIC Assistance 47.7% 46.7% 46.5% 45.5% 44.9% - 28.3% 27.9% 29.1% 27.8% 24.4% - 48.3% 47.8% 39.2% 49.5% 40.1% - 55.5% 57.0% 54.8% 54.0% 53.6% - 40.1% 39.3% +/- +/-
Mothers Reporting Medicaid Assistance 40.1% 35.5% 35.0% 38.8% 35.1% - 12.7% 11.6% 9.3% 17.7% 19.5% + 40.0% 39.8% 35.7% 41.5% 30.2% - 45.2% 48.8% 49.6% 49.5% 42.4% - 32.7% 33.6% +/- +/-
Breastfeeding 53.7% 58.4% 63.8% 57.0% 64.3% + 70.2% 71.3% 74.5% 73.4% 76.4% + 61.5% 62.0% 71.9% 65.3% 67.3% + 53.5% 57.6% 58.0% 61.8% 65.4% + 70.0% 73.1% 77% 81.9% +/- +/- -
Teen Pregnancy Rate per 100,000, Ages 15-19 40.1 37.4 28.9 31.3 31.5 - 22.3 17.6 19.8 17.2 16.7 - 19.3 20.8 27.0 26.1 15.0 - 30.0 37.7 32.8 31.1 30.3 = 39.6 33.7 34.2 30.0 36.2 + - -
Teen Live Birth Outcomes, Ages 15-19 80.2% 82.3% 95.0% 92.1% 90.2% + 77.4% 77.2% 67.4% 72.1% 81.3% + 78.6% 85.1% 73.1% 89.8% 84.0% + 85.3% 83.3% 85.2% 89.2% 80.9% - 68.0% 69.5% 73.4% + +
Infant Mortality 5.0 5.4 7.5 + 7.3 7.0 6.2 6.1 6.0 + + +
Overweight BMI, Grades K-6 16.7% 20.5% 18.0% + 15.6% 15.4% 16.1% + 15.1% 14.6% 14.9% = 16.3% 16.1% 15.4% - 15.9%
Obese BMI, Grades K-6 20.1% 21.3% 20.0% = 14.7% 15.1% 13.5% - 20.8% 21.6% 20.7% = 20.9% 21.6% 21.9% + 16.7% 15.7%
Overweight BMI, Grades 7-12 21.0% 21.6% 19.2% - 15.6% 16.6% 17.5% + 15.6% 15.8% 16.1% + 15.2% 15.6% 15.5% = 16.4% 30.3%
Obese BMI, Grades 7-12 20.5% 20.3% 20.8% = 16.1% 16.3% 16.4% = 19.7% 20.6% 20.2% + 19.2% 19.3% 20.0% + 17.7% 13.7% 16.1%
INFECTIOUS DISEASE
Influenza and Pneumonia Mortality Rate per 100,000 15.4 17.2 14.8 13.7 12.2 - 16.9 13.1 16.4 15.5 12.9 - 22.1 16.7 15.8 14.6 11.9 12.6 - 13.4 13.3 16.2 15.1 + -
Chlamydia Rate per 100,000 87.2 87.0 140.7 186.7 195.9 + 99.0 9.1 107.7 148.8 178.4 + 207.6 154.5 197.6 154.9 219.4 + 139.9 99.6 116.4 125.2 149.0 + 374.1 430.9 426.0 446.6 + -
Gonorrhea Rate per 100,000 24.7 23.4 - 14.8 11.9 16.9 15.1 15.7 + 14.8 101.4 120.6 106.7 + -
MENTAL HEALTH AND SUBSTANCE ABUSE
Drug-Induced Mortality Rate per 100,000 15.8 23.4 23.9 23.5 + 9.6 11.8 11.9 17.0 14.0 + 14.1 12.7 - 15.5 19.2 10.2 11.3 +/- +/- +
Mental & Behavioral Disorders Mortality Rate per 100,000 17.7 35.2 31.4 30.8 51.5 + 39.7 29.7 48.2 43.7 49.3 + 19.0 19.8 32.6 + 25.6 19.4 31.1 30.2 34.7 + 37.6 43.0 63.3 +/- +/-
Never/Rarely Get the Social or Emotional Support They Need 20.0% 21.0% 22.0% + 17.0% 18.0% 18.0% + 22.0% 21.0% 19.0% - 15.0% 18.0% 19.0% + 21.0% +/-
TOBACCO USE
Adults who Smoke 23.0% 23.0% 23.0% 19.0% 18.0% 19.0% 19.0% 17.0% 15.0% - 18.0% 19.0% 21.0% + 21.0% 20.0% 12.0% +/- +/- +
INJURY
Auto Accident Mortality Rate per 100,000 16.3 17.5 15.8 - 13.3 8.9 14.5 10.4 9.7 - 31.0 24.8 26.3 16.1 19.0 - 10.5 10.0 11.9 10.7 12.4 +/- +/- +/-
Suicide Mortality per 100,000 20.0 16.2 16.5 16.4 - 13.8 11.4 10.6 13.2 9.8 - 17.6 12.7 10.9 22.8 12.5 - 11.7 12.1 12.1 4.5 10.2 +/- +/- +/-
Fall Mortality Rate per 100,000 10.5 9.1 - 8.3 6.9 5.4 7.2 8.3 = 10.8 9.1 8.3 8.4 8.1 9.6 7.2 + +/- +
Firearm Mortality Rate (Accidental, Suicide, Homicide) 13.2 8.1 6.7 7.6 8.9 8.3 + 17.0 15.9 11.7 - 10.0 11.0 10.1 10.1 9.3 +/- +/- +/-
Armstrong County Butler County Clarion County Clearfield County

2015 Community Health Needs Assessment
Executive Summary
Page | xxviii
The following table highlights various health indicators included in the assessment:
Source: Pennsylvania Department of Health, Centers for Disease Control, www.healthypeople.gov
The color coding illustrates comparisons to the Healthy People 2020 goal or the national
rate (if there is no HP 2020 goal). Red indicates that the regional data is worse than the
comparison and green indicates better than the comparison. Yellow indicates that one
county is higher and another is lower.
Trend Trend Trend Trend PA (2010)
PA (the last
year) US (2010)
US - 2011-
2013 HP 2020 PA US HP Goal
Public Health Data 2008 2009 2010 2011 2012 +/- 2008 2009 2010 2011 2012 +/- 2008 2009 2010 2011 2012 +/- 2008 2009 2010 2011 2012 +/- Rate Rate Rate Rate Goal Comp Comp Comp
CHRONIC DISEASE
Breast Cancer Rate per 100,000 160.4 51.7 47.7 64.9 49.5 58.4 + 53.0 69.5 71.2 62.5 58.5 + 88.2 82.6 60.9 53.6 65.8 - 71.5 69.4 121.9 122.0 41.0 - - +
Breast Cancer Mortality Rate per 100,000 19.1 13.4 11.7 16.5 - 25.0 25.3 12.7 13.6 15.4 - 13.1 12.5 22.2 21.5 20.7 + - -
Bronchus and Lung Cancer Rate per 100,000 125.3 48.5 47.9 41.2 43.3 62.7 + 70.4 73.6 61.2 71.7 66.5 - 87.8 73.9 79.5 84.2 63.7 - 69.1 63.9 73.0 +/- -
Bronchus and Lung Cancer Mortality Rate per 100,000 91.3 48.3 33.1 38.1 38.5 32.2 - 47.7 45.5 55.3 42.5 40.7 - 71.3 60.8 55.4 51.1 64.0 - 48.7 46.5 57.9 45.5 +/- +/- +/-
Colorectal Cancer Rate per 100,000 55.7 54.1 39.7 42.8 39.6 - 51.9 38.5 54.0 49.8 53.0 - 47.4 36.1 46.5 63.2 37.4 + 47.6 42.5 46.1 38.6 +/- +/- +/-
Colorectal Cancer Mortality Rate per 100,000 18.2 14.5 11.9 24.2 14.1 - 23.2 21.1 21.6 22.0 - 18.7 21.2 20.9 19.7 28.8 + 17.0 15.8 16.9 18.1 14.5 +/- +/- +
Ovarian Cancer Rate per 100,000 - 13.3 11.9 11.3
Ovarian Cancer Mortality Rate per 100,000 8.1 7.9 7.5
Prostate Cancer Rate per 100,000 156.2 124.3 126.0 129.4 116.1 91.7 - 177.8 117.4 163.5 175.1 143.4 - 172.5 105.4 103.4 100.6 141.3 - 139.6 101.7 128.3 +/- +/-
Prostate Cancer Mortality Rate per 100,000 32.5 20.1 25.4 24.5 - 21.2 19.1 20.8 21.8 + + +
Heart Disease Mortality Rate per 100,000 210.3 207.9 130.9 281.9 169.3 - 170.3 168.2 203.9 160.1 185.2 + 218.8 194.5 206.9 180.4 194.5 - 192.4 171.4 153.7 160.9 155.5 - 185.3 175.2 176.8 +/- +/-
Heart Attack Mortality Rate per 100,000 11.4 19.9 23.1 13.1 22.4 + 33.8 17.1 35.5 25.0 23.8 - 19.0 12.2 12.7 - 38.2 17..9 89.2 +/- -
Coronary Heart Disease Mortality Rate per 100,000 120.1 118.2 115.6 - 125.8 109.2 129.2 104.6 113.8 - 128.9 121.3 110.5 104.4 116.3 - 106.9 108.2 111.2 102.7 104.0 - 123.0 115.3 108.91 103.4 +/- +/- +
Cardiovascular Mortality Rate per 100,000 311.0 288.6 154.5 350.6 219.1 - 232.0 213.5 258.3 211.0 221.7 - 319.8 256.6 295.5 261.3 269.1 - 247.2 245.1 213.8 225.0 206.6 - 123.0 225.5 233.73 +/- +/-
Cerebrovascular Mortality Rate per 100,000 45.8 31.9 43.2 42.9 28.0 - 70.6 42.3 66.4 50.1 50.1 - 39.2 48.3 35.3 47.1 37.7 - 237.6 36.8 39.1 39.9 34.8 +/- +/- +/-
Diabetes Mortality Rate per 100,000 28.7 27.1 15.3 27.4 24.2 - 26.6 20.5 23.0 23.0 32.1 + 23.1 37.1 33.2 38.7 38.4 + 38.9 22.0 20.8 73.28 66.6 + - -
Type I Diabetes, Students 0.36% 0.58% 0.53% 0.19% - 0.38% 0.35% 0.35% 0.34% - 0.34% 0.38% 0.39% 0.42% + 0.30% 0.30% 0.27% 0.27% - 19.6 0.32% +/-
Type II Diabetes, Students 0.00% 0.00% 0.00% 0.00% 0.11% 0.10% 0.09% 0.08% - 0.07% 0.02% 0.00% 0.00% - 0.07% 0.07% 0.07% 0.05% - 0.30% 0.06% +/-
Lyme Disease Rate per 100,000 20.6 36.0 91.8 112.2 + 115.3 143.4 135.0 240.1 308.3 + 0.07% 39.4 8.6 + +
Alzheimer Mortality Rate per 100,000 21.0 21.7 18.8 23.4 16.5 33.2 13.8 31.2 24.6 14.0 - 28.8 14.6 21.0 17.5 28.3 = 18.7 26.8 +/- +/-
HEALTHY ENVIRONMENT
Student Health Asthma 8.1% 9.3% 7.8% 11.6% + 5.8% 9.3% 9.5% 10.1% + 10.4% 11.3% 11.9% 12.5% + 8.1% 9.0% 9.1% 6.1% - 6.8% 12.1% +/-
HEALTHY MOTHERS, BABIES AND CHILDREN
Prenatal Care First Trimester 84.4% 60.0% 62.5% 60.5% 72.7% - 67.1% 68.8% 69.2% 65.6% 65.8% - 54.5% 60.5% 61.4% 56.7% 70.2% + 64.2% 65.2% 71.1% 67.7% 70.8% + 71.3% 72.4% 70.8 77.9% +/- +/- -
Non-Smoking Mother During Pregnancy 68.8% 69.4% 61.5% 76.9% 73.5% + 79.7% 82.7% 81.5% 82.1% 80.6% = 71.8% 77.9% 76.6% 76.7% 76.1% + 67.6% 67.0% 67.3% 68.9% 68.8% + 84.1% 85.2% 89.3 98.6% - - -
Non-Smoking Mother 3 Months Prior to Pregnancy 65.6% 63.9% 55.6% 66.7% 64.7% - 73.5% 77.8% 74.9% 76.5% 76.0% + 63.4% 69.1% 67.1% 67.7% 68.4% + 60.5% 59.2% 60.3% 62.7% 61.6% + 78.2% 80.1% 76.8 - -
Low Birth-Weight Babies Born 7.9% 7.4% 6.9% 5.6% 6.1% - 7.2% 9.0% 8.7% 7.8% 7.1% - 7.0% 7.6% 8.8% 8.8% 6.2% - 8.3% 8.1% 8.0% 7.8% - - -
Mothers Reporting WIC Assistance 53.1% 80.6% 38.5% 52.6% 38.2% - 39.2% 37.8% 39.4% 40.5% 37.9% - 50.0% 45.1% 50.5% 47.6% 43.8% - 58.9% 60.6% 61.1% 53.8% 56.2% - 40.1% 39.3% +/-
Mothers Reporting Medicaid Assistance 37.5% 63.9% 37.0% 48.7% 32.4% - 36.8% 37.0% 37.1% 36.1% 36.4% - 42.8% 38.5% 46.9% 47.8% 36.0% - 48.9% 51.8% 48.7% 49.5% 43.0% - 32.7% 33.6% +/-
Breastfeeding 71.9% 55.6% 70.4% 61.5% 66.7% - 70.0% 72.7% 72.2% 74.8% 75.2% + 65.6% 64.3% 64.6% 72.1% 73.1% + 57.2% 60.7% 62.2% 63.9% 64.4% + 70.0% 73.1% 77% 81.9% +/- - -
Teen Pregnancy Rate per 100,000, Ages 15-19 21.0 15.1 15.9 16.6 18.7 - 48.7 39.1 36.2 44.8 40.1 - 44.9 41.1 42.3 40.7 43.6 - 39.6 33.7 34.2 30.0 36.2 +/- +/- +/-
Teen Live Birth Outcomes, Ages 15-19 59.6% 78.9% 62.3% 66.7% 84.0% + 85.5% 92.6% 85.2% 77.8% 89.1% + 90.7% 83.6% 94.3% 90.6% 88.1% - 68.0% 69.5% 73.4% +
Infant Mortality 13.3 7.3 7.0 6.2 6.1 6.0 + +
Overweight BMI, Grades K-6 13.7% 13.7% 14.7% + 18.0% 16.3% 17.0% - 16.7% 15.8% 15.4% - 17.5% 15.6% 16.3% - 15.9% +/-
Obese BMI, Grades K-6 17.3% 21.2% 14.0% - 22.4% 18.8% 20.6% - 20.0% 20.6% 20.7% = 20.1% 19.7% 20.1% = 16.7% 15.7% +/- +/-
Overweight BMI, Grades 7-12 20.7% 20.0% 22.5% + 15.6% 14.9% 14.9% - 16.3% 16.0% 17.9% + 16.9% 15.9% 27.5% + 16.4% 30.3% +/- -
Obese BMI, Grades 7-12 20.7% 21.4% 19.5% - 20.7% 16.2% 19.7% - 21.5% 21.5% 21.8% = 22.1% 21.4% 22.0% = 17.7% 13.7% 16.1% + + +
INFECTIOUS DISEASE
Influenza and Pneumonia Mortality Rate per 100,000 21.0 18.9 16.7 16.5 18.1 - 16.7 19.8 + 22.6 17.4 22.7 14.9 - 13.4 13.3 16.2 15.1 + +/-
Chlamydia Rate per 100,000 190.5 310.0 155.5 + 170.3 189.8 231.8 267.6 284.5 + 115.3 98.6 95.1 149.0 156.4 + 143.3 136.6 152.8 173.7 278.2 + 374.1 430.9 426.0 446.6 - -
Gonorrhea Rate per 100,000 26.3 29.7 32.6 28.0 44.2 + 20.1 38.7 + 101.4 120.6 106.7 - -
MENTAL HEALTH AND SUBSTANCE ABUSE
Drug-Induced Mortality Rate per 100,000 15.8 13.0 13.7 30.9 24.8 + 23.8 27.4 18.8 - 15.5 19.2 10.2 11.3 +/- + +
Mental & Behavioral Disorders Mortality Rate per 100,000 39.8 52.0 56.7 75.3 54.2 + 22.4 24.3 24.7 18.0 36.6 + 53.6 33.7 51.5 47.4 51.9 - 37.6 43.0 63.3 +/- -
Never/Rarely Get the Social or Emotional Support They Need 19.0% 18.0% 17.0% - 18.0% 17.0% 18.0% = 17.0% 19.0% 20.0% + 21.0% -
INJURY
Auto Accident Mortality Rate per 100,000 14.2 25.1 22.3 11.8 20.0 + 24.0 25.1 23.7 21.3 23.0 = 10.5 10.0 11.9 10.7 12.4 + + +
Suicide Mortality per 100,000 18.8 18.9 16.2 17.5 - 23.6 11.7 12.1 12.1 4.5 10.2 + + +
Fall Mortality Rate per 100,000 9.9 14.2 8.2 - 15.4 8.3 8.4 8.1 9.6 7.2 - - +
Firearm Mortality Rate (Accidental, Suicide, Homicide) 14.9 10.0 11.0 10.1 10.1 9.3
Forest County Indiana County Jefferson County Venango County

2015 Community Health Needs Assessment
Executive Summary
Page | xxix
The following table highlights various health indicators included in the assessment:
Source: County Health Rankings, Centers for Disease Control, www.healthypeople.gov
The color coding illustrates comparisons to the Healthy People 2020 goal or the national
rate (if there is no HP 2020 goal). Red indicates that the regional data is worse than the
comparison and green indicates better than the comparison. Yellow indicates that one
county is higher and another is lower.
Trend Trend Trend Trend PA - 2012
PA (the
last year) US - 2010 HP 2020 PA US HP Goal
Other Indicators 2013 2014 2015 +/- 2013 2014 2015 +/- 2013 2014 2015 +/- 2013 2014 2015 +/- Rate Rate Rate Goal Comp Comp Comp
ACCESS
Mammogram Screenings 63.0% 57.9% 57.4% +/- 63.7% 57.4% 57.8% - 67.8% 62.4% 64.6% - 73.6% 67.6% 67.9% - 67.2% 63.4% 67.1% 81.1% - - -
HEALTHY ENVIRONMENT
Unemployment Rates 8.4% 8.5% 8.0% - 6.7% 6.5% 6.3% - 9.8% 9.0% 8.0% - 8.8% 8.8% 8.4% - 8.7% 7.4% 8.9% +/- -
High School Graduation Rates 92.0% 91.0% 85.0% - 94.0% 94.0% 93.0% - 90.0% 90.0% 92.0% + 84.0% 84.0% 87.0% + 79.0% 85.0% 82.4% +/- +/-
Children Living in Poverty 19.0% 19.0% 20.0% + 11.0% 12.0% 10.0% - 18.0% 19.0% 22.0% + 22.0% 22.0% 24.0% + 19.0% 19.0% +/-
Children Living in Single Parent Homes 31.0% 30.0% 32.0% + 23.0% 22.0% 21.0% - 30.0% 31.0% 30.0% = 29.0% 29.0% 30.0% + 32.0% 33.0% -
Illiteracy 12.9% 12.9% = 8.7% 8.7% = 14.0% 14.0% = 13.9% 13.9% = 12.6% 12.6% +/-
PHYSICAL ACTIVITY AND NUTRITION
Limited Access to Healthy Foods 1.0% 1.0% 1.0% = 3.0% 3.0% 3.0% = 2.0% 2.0% 2.0% = 5.0% 5.0% 5.0% = 7.0% 4.0% +/-
Food Insecurity 15.0% 13.0% - 12.0% 11.0% - 10.0% 14.0% + 14.0% 13.0% - 14.0% -/=
Children Eligible for Free Lunch 32.0% 33.0% 38.0% + 17.0% 32.0% 17.0% = 30.0% 17.0% 29.0% - 37.0% 30.0% 34.0% - 34.0% 34.0% +/-
TOBACCO USE
Adults who Smoke 24.0% 24.0% 24.0% = 19.0% 18.0% 18.0% - 17.0% 18.0% 18.0% + 22.0% 19.0% 19.0% - 21.0% 21.0% 20.0% 12.0% +/-
ARMSTRONG COUNTY BUTLER COUNTY CLARION COUNTY CLEARFIELD COUNTY

2015 Community Health Needs Assessment
Executive Summary
Page | xxx
The following table highlights various health indicators included in the assessment:
Source: County Health Rankings, Centers for Disease Control, www.healthypeople.gov
The color coding illustrates comparisons to the Healthy People 2020 goal or the national
rate (if there is no HP 2020 goal). Red indicates that the regional data is worse than the
comparison and green indicates better than the comparison. Yellow indicates that one
county is higher and another is lower.
Trend Trend Trend Trend PA - 2010
PA (the
last year) US - 2010 HP 2020 PA US HP Goal
Other Indicators 2013 2014 2015 +/- 2013 2014 2015 +/- 2013 2014 2015 +/- 2013 2014 2015 +/- Rate Rate Rate Goal Comp Comp Comp
ACCESS
Mammogram Screenings 78.5% 67.6% 62.5% - 63.2% 61.4% 59.0% - 72.2% 64.3% 66.8% - 72.8% 70.9% 67.8% - 67.2% 63.4% 67.1% 81.1% +/- +/- -
HEALTHY ENVIRONMENT
Unemployment Rates 8.1% 9.5% 9.3% + 7.4% 7.8% 7.3% - 8.2% 7.9% 7.7% - 7.5% 7.9% 7.9% = 8.7% 7.4% 8.9% +/- +/-
High School Graduation Rates 96.0% 94.0% - 93.0% 92.0% 92.0% - 89.0% 90.0% 89.0% = 91.0% 91.0% 89.0% - 79.0% 85.0% 82.4% + +
Children Living in Poverty 32.0% 32.0% 38.0% + 23.0% 23.0% 20.0% - 23.0% 24.0% 24.0% + 26.0% 28.0% 25.0% - 19.0% 19.0% +
Children Living in Single Parent Homes 24.0% 26.0% 31.0% + 27.0% 27.0% 26.0% - 28.0% 30.0% 30.0% + 34.0% 35.0% 37.0% + 32.0% 33.0% +/-
Illiteracy 12.9% 12.9% = 8.7% 8.7% = 14.0% 14.0% = 13.9% 13.9% = 12.6% 12.6% +/-
PHYSICAL ACTIVITY AND NUTRITION
Limited Access to Healthy Foods 1.0% 1.0% 1.0% = 4.0% 4.0% 4.0% = 2.0% 2.0% 2.0% = 3.0% 3.0% 3.0% = 7.0% 4.0% -/=
Food Insecurity 13.0% 14.0% + 14.0% 14.0% = 12.0% 13.0% + 12.0% 13.0% + 14.0% -/=
Children Eligible for Free Lunch 33.0% 37.0% 39.0% + 33.0% 33.0% 31.0% - 36.0% 33.0% 39.0% + 39.0% 36.0% 42.0% + 34.0% 34.0% +/-
TOBACCO USE
Adults who Smoke 34.0% 34.0% = 21.0% 17.0% 17.0% - 24.0% 26.0% 26.0% + 22.0% 26.0% 26.0% + 21.0% 20.0% +/-
FOREST COUNTY INDIANA COUNTY JEFFERSON COUNTY VENANGO COUNTY

2015 Community Health Needs Assessment
Executive Summary
Page | xxxi
MENTAL HEALTH AND SUBSTANCE ABUSE Trend Trend Trend Trend Trend Trend Trend Trend PA US PA US
2009 2011 2013 +/- 2009 2011 2013 +/- 2009 2011 2013 +/- 2009 2011 2013 +/- 2009 2011 2013 +/- 2009 2011 2013 +/- 2009 2011 2013 +/- 2009 2011 2013 +/- Rate Rate Comp Comp
Alcohol Child/Adolescent Lifetime Use 2013 2013
Grade 6 22.6% 18.9% - 20.4% 20.7% 13.3% - 22.0% 17.5% 18.0% - 23.6% 17.4% 20.0% - 16.1% 20.1% 13.9% - 14.3% 26.6% 18.1% + 28.4% 13.3% +
Grade 8 32.1% 25.4% 30.1% - 57.7% 35.8% 35.1% - 44.3% 37.5% 42.0% - 44.8% 39.6% 41.5% - 52.4% 37.1% 40.2% - 40.1% 40.4% 42.1% + 47.6% 45.3% 45.9% - 35.1% 27.8% + +
Grade 10 38.5% 69.7% + 67.9% 70.3% 61.5% - 59.3% 57.4% 60.4% + 59.3% 58.3% 67.1% + 43.2% 56.4% 59.4% + 65.2% 57.2% 65.1% - 73.4% 54.0% 64.6% - 61.5% 52.1% +/- +
Grade 12 71.6% 86.2% 74.2% + 69.9% 64.7% 79.4% + 65.5% 69.3% 76.3% + 57.1% 65.7% 71.4% + 64.9% 63.2% 68.0% + 73.9% 72.7% - 74.2% 68.2% +/- +/-
Overall 28.1% 55.5% 41.5% 46.9% - 51.5% 44.9% 53.9% + 47.2% 47.6% 51.7% + 40.1% 45.3% 48.2% + 50.9% 48.8% 50.3% - 55.4% 54.9% 53.4% - 46.9% +/-
Marijuana Child/Adolescent Lifetime Use
Grade 6 1.0% 0.0% - 0.0% 0.0% 0.9% + 0.5% 0.5% 0.5% = 1.0% 0.9% 1.1% + 1.6% 0.4% 0.5% - 0.0% 2.3% 0.4% + 2.0% 0.8% +/-
Grade 8 6.4% 1.4% 2.2% - 3.8% 7.4% 3.4% - 7.6% 9.5% 6.7% - 6.8% 10.5% 6.7% - 2.3% 6.2% 6.2% + 5.6% 4.3% 4.9% - 16.5% 13.9% 14.8% - 6.4% 16.5% +/- -/=
Grade 10 12.8% 16.9% + 21.4% 29.7% 18.1% - 22.0% 22.3% 16.7% - 19.0% 21.0% 26.6% + 18.2% 18.7% 22.6% + 28.1% 21.7% 19.6% - 41.5% 30.1% 31.7% - 25.8% 35.8% +/- -
Grade 12 37.9% 41.4% 37.3% - 30.4% 26.0% 31.9% + 30.5% 30.9% 37.8% + 14.2% 35.0% 32.4% + 28.2% 27.9% 34.1% + 50.7% 39.4% - 40.3% 45.5% +/- -
Overall 4.2% 17.1% 12.1% 12.3% - 16.5% 14.9% 15.7% - 13.6% 16.5% 18.5% + 8.6% 15.3% 16.4% + 18.2% 15.4% 15.1% - 24.3% 28.3% 22.1% - 18.9% +/-
% of Children/Adolescents Who Drove After Drinking
Grade 6 0.0% 0.0% = 0.0% 0.0% 0.0% = 0.5% 1.5% 0.0% - 0.7% 0.3% 0.9% + 0.0% 0.0% 0.3% + 0.8% 0.0% 0.6% - 0.5% 0.2% +/-
Grade 8 0.0% 0.0% 0.4% + 1.9% 0.0% 1.3% - 6.0% 1.7% 2.3% - 0.7% 0.9% 1.6% + 0.0% 1.5% 0.6% + 0.5% 1.8% 0.0% - 2.1% 1.8% 1.0% - 0.4% +/-
Grade 10 0.0% 1.5% + 0.0% 8.1% 3.0% + 4.1% 5.1% 3.1% - 4.3% 3.6% 2.4% - 0.0% 4.7% 1.5% + 7.1% 3.3% 2.4% - 1.1% 1.1% 1.9% + 1.8% +/-
Grade 12 18.2% 19.4% 12.7% - 17.2% 14.0% 11.1% - 12.9% 15.4% 13.1% + 2.2% 12.4% 10.6% + 11.6% 10.9% 13.0% + 15.0% 11.3% - 8.7% +/-
Overall 1.3% 5.7% 3.5% 3.6% - 6.1% 5.5% 4.7% - 4.4% 5.4% 4.9% + 0.5% 4.7% 3.5% + 5.7% 4.5% 3.9% - 1.8% 4.5% 3.3% + 2.9% +/-
VenangoArmstrong Butler Clarion Clearfield Forest* Indiana Jefferson
The following table highlights various health indicators included in the assessment:
*PAYS for Forest County was not available to protect identification of individual students as this county did not have two public school districts participate or
had only one school district.
Source: 2013 Pennsylvania Youth Survey , National Survey Results on Drug Abuse – 1975-2013
The color coding illustrates comparisons to the Healthy People 2020 goal or the national
rate (if there is no HP 2020 goal). Red indicates that the regional data is worse than the
comparison and green indicates better than the comparison. Yellow indicates that one
county is higher and another is lower.

2015 Community Health Needs Assessment
Executive Summary
Page | xxxii
MENTAL HEALTH AND SUBSTANCE ABUSE Trend Trend Trend Trend Trend Trend Trend Trend PA US PA US
2009 2011 2013 +/- 2009 2011 2013 +/- 2009 2011 2013 +/- 2009 2011 2013 +/- 2009 2011 2013 +/- 2009 2011 2013 +/- 2009 2011 2013 +/- 2009 2011 2013 +/- Rate Rate Comp Comp
% of Children/Adolescents Who Drove After Using Marijuana
Grade 6 0.0% 0.0% = 0.0% 0.0% 1.0% + 0.0% 0.0% 0.0% = 0.3% 0.3% 0.2% - 0.0% 0.0% 0.3% + 0.0% 0.9% 0.0% = 0.5% 0.1% -
Grade 8 0.0% 0.0% 0.4% + 0.0% 0.0% 1.0% + 0.9% 1.0% 1.0% - 0.6% 0.6% 1.9% + 0.0% 1.1% 0.3% + 0.5% 0.0% 0.0% - 2.1% 1.5% 1.3% - 0.4% -
Grade 10 0.0% 0.0% = 3.6% 8.1% 2.5% - 4.3% 5.8% 2.3% - 3.8% 4.4% 2.1% - 2.3% 1.1% 2.3% = 6.4% 5.9% 1.8% - 3.4% 3.0% 5.7% + 2.4% +/-
Grade 12 9.1% 16.7% 8.9% - 9.7% 8.7% 8.1% - 13.8% 10.2% 12.8% - 4.3% 9.8% 10.0% + 10.7% 9.2% 7.9% - 16.2% 12.3% - 12.4% +/-
Overall 0.0% 3.5% 3.1% 2.7% - 4.1% 3.9% 3.3% - 4.4% 4.2% 4.7% + 1.6% 3.0% 3.4% + 5.1% 4.3% 2.5% - 2.5% 5.3% 4.7% + 4.1% +/-
Pain Reliver Child/Adolescent Lifetime Use
Grade 6 1.0% 2.6% + 1.9% 3.4% 0.0% - 2.3% 1.9% 0.5% - 0.9% 0.6% 1.0% + 3.2% 2.4% 1.0% - 80.0% 230.0% 170.0% + 3.0% 2.1% +/-
Grade 8 7.7% 0.0% 3.8% - 0.0% 1.1% 5.0% + 2.7% 2.5% 3.6% + 4.3% 2.8% 1.7% - 2.3% 2.6% 4.4% + 660.0% 310.0% 290.0% - 5.3% 7.0% 6.7% + 4.1% -
Grade 10 5.1% 4.5% - 9.1% 18.9% 12.6% + 9.2% 14.0% 6.1% - 7.5% 6.9% 3.1% - 13.6% 5.3% 9.8% - 1330.0% 670.0% 650.0% - 10.4% 10.3% 15.9% + 8.3% +/-
Grade 12 20.9% 10.3% 20.0% - 16.7% 13.5% 17.1% + 6.3% 7.3% 5.3% - 10.2% 14.0% 12.4% + 960.0% 1540.0% 1340.0% + 19.7% 20.0% + 12.1% +
Overall 3.3% 8.8% 5.3% 8.8% = 8.2% 8.1% 7.5% - 4.6% 4.6% 2.8% - 6.6% 6.0% 7.3% + 870.0% 730.0% 610.0% - 6.6% 11.1% 11.3% + 6.8% +
Armstrong Butler Clarion Clearfield Indiana Jefferson VenangoForest*
The following table highlights various health indicators included in the assessment:
*PAYS for Forest County was not available to protect identification of individual students as this county did not have two public school districts participate or
had only one school district.
Source: 2013 Pennsylvania Youth Survey, National Survey Results on Drug Abuse – 1975-2013
The color coding illustrates comparisons to the Healthy People 2020 goal or the national
rate (if there is no HP 2020 goal). Red indicates that the regional data is worse than the
comparison and green indicates better than the comparison. Yellow indicates that one
county is higher and another is lower.

2015 Community Health Needs Assessment
Executive Summary
Page | 33
Primary Research Results
A total of 24 stakeholder interviews were conducted throughout the region, with
eight conducted specifically with stakeholders from Indiana County. A PMCN
community survey conducted through Internet and paper survey distribution
received 1,144 completed surveys. Stakeholders were identified as experts in a
particular field related to their background, experience or professional position
and/or someone who understood the needs of a particular underrepresented group
or constituency. A total of five focus groups were conducted in the overall region.
While the interviews, focus groups and surveys were conducted across the region
with various community constituencies, they were conducted using a convenience
sample and thus are not necessarily representative of the entire population. The
results reported herein are qualitative in nature and reflect the perceptions and
experiences of interview and focus group participants.
Overall Community Health Status
Community survey respondents (1,144) were asked to rate the health status of the
community. A third of survey responses commented that their health status was fair
as seen in Figure 5 below. Indiana County respondents were slightly more likely than
average to rate their health status very good or good.

2015 Community Health Needs Assessment
Executive Summary
Page | 34
Figure 5: Community Survey – Community Health Status
Source: 2015 PMCN Community Survey, Strategy Solutions, Inc.
Other survey findings related to health status included:
• Just over half (52.2%) of the 2015 PMCN Community Survey respondents
rated their personal health as “Excellent” or “Very Good”.
• One third (36.9%) of the PMCN Community Survey respondents rated the
community health status as “Fair” or Poor”. Respondents from the Indiana
Regional Medical Center service area rated the community health
significantly higher when compared to the other hospital respondents.
• The majority (84.2%) of PMCN Focus Group respondents rated the health
status of the community as “Fair” or Poor.” They noted the aging
population, poverty, lack of recreational opportunities as substance abuse
among the reasons for their rating.
The majority of focus group respondents (30 out of 38) rated the health status of
the community as fair. When asked to comment on why they gave the rating they
did, respondents cited the following community health issues:
• aging population and associated health needs

2015 Community Health Needs Assessment
Executive Summary
Page | 35
• obesity is a problem due to lack of healthy food choices and inactivity
• substance abuse
• stress levels (diet, poor sleeping habits)
• not enough physicians to manage healthcare needs
• children are connected to technology as opposed to physical activity
• lack of education and awareness
When asked to identify factors that impact the health of the community, focus
group respondents indicated that a variety of things impact health including:
• age
• drugs (legal and illegal)
• lack of healthy eating
• inactivity, sometimes due to technology
• limited opportunities for kids and adults
• lack of religion and faith
• “Appalachia” mindset impacts the health of the community because several
generations do not seek care and do not “buy” into preventative care
• Lack of parent support and education
Suggestions to improve community health by the focus group participants included:
• Devote time and resources to the problem(s)
• Improved communication between providers and others involved
• Offer free/low income clinics
• More physicians
• Improve transportation
• Identify gaps in service and look for providers to fill them
• Wellness Center
• Improve access and affordability
Stakeholders were asked to identified the environmental factors that most
contributed to the health of the community. Responses are listed in Figure 6.

2015 Community Health Needs Assessment
Executive Summary
Page | 36
Figure 6: Stakeholder Interviews: Environmental Factors Impacting Community
Health
Source: PMCN CHNA Stakeholder Interviews, 2015
Initiatives Currently Underway
Stakeholders who were interviewed were asked to identify initiatives that are
already underway that can address community health needs. The initiatives
included:
• FQHC in the area
• Charitable foundation as part of Primary Health Network offers scholarships
• Primary Health Network will offer transportation May 1, 2015, expanding
drug and alcohol services and mental health services
• Chronic Disease Management through PCRC project at IRMC
• Church Food Pantries
• Celebration Recovery - church based recovery group for addiction
• Community Care Behavioral Health grant (PCORI) to assist people with
mental illness to connect to physical health
• Community Center
• Diabetes Clinic through Clarion Hospital
• YMCA Silver Sneakers, New Facility

2015 Community Health Needs Assessment
Executive Summary
Page | 37
• Prime Time Health program – stroke screenings, blood pressure screenings,
etc…
• Drug Free Communities
• Child Abuse Awareness programs
• The Care Center
• Domestic Violence Task Force
• Family Promise
• Cessation Classes
• Commissioners addressing drug addiction
• Head Start – Medical Care Organization Liaison to work with insurance
providers
• Oral Health Dental Task Force – address dental care for low income
individuals
• Mandated health screenings at school
• Economic Development Councils
• Local Legislators working on diabetes issues
• Mental Health Services – CCR and SAM
• Charity Care program at hospital
• Rotary sponsors a Community Garden project
• Community Blood Bank screening program
• Relay for Life
• Suicide Task Force
• NAMI
• Project Share – agencies purchase a van together for client/patient
transport
• VA Clinic
Additional Suggestions
Stakeholders also provided additional ideas and suggestions regarding how to
improve the health of the community. Responses included:
• Better promotion and marketing of available services
• Clergy needs to be involved
• Community leaders and groups need to work together
• More educational programs and advice on health and wellness
• Increase laws related to smoking
• Improve access to transportation

2015 Community Health Needs Assessment
Executive Summary
Page | 38
• Family education and awareness – resources available, healthy choices,
stress management
• Promote awareness of mental health issues and strategies
• Improve broadband access for tele health
• Break negative generational cycle
• Rural Health Clinics
• Increase number of PCP providers
• More programs and schools (that are better connected to resources and
families)
• Increase funding to programs/services
Access
Access to comprehensive, quality health care is important for the achievement of
health equity and for increasing the quality of life for everyone in the community.
Stakeholders identified access to and awareness of available medical services as a
top community need. They also identified the need for health insurance for the
working poor and general information on insurance coverage as a need. It was
suggested that many patients cannot afford healthcare, even with a payment plan
or sliding fee. Stakeholders noted that there is not a dentist who accepts MA or that
offers a sliding fee schedule. Transportation to and from medical services, including
the Emergency Department were also identified as a need. Stakeholders noted that
there is limited or no reimbursement or funding for transportation available in the
community. The transportation services that are available are typically regulated in
the number of days they can provide transportation for an individual, or offer
limited routes. There is also a lack of available services to veterans in the
community with limited transportation available to help Veterans access services
Focus group participants were asked to identify existing resources to address
community needs. Responses included:
• Passages – abuse intervention service
• Seminars and hospital instructional services
• Area Agency on Aging
• Clarion Senior Center
• Student Assistance Program (SAP)
• Service and Access Management (SAM)
• Social service agencies

2015 Community Health Needs Assessment
Executive Summary
Page | 39
• YMCA new building project
• Taxi service
• County transportation
• Primary Health Network
Barriers to accessing community resources included:
• Lack of knowledge of what is available
• Cost/lack of insurance
• Laziness
• Pride/lack of ownership
• Transportation issues
• Refusal of help
• “Appalachia” mindset
There are a number of observations and conclusions that can be derived from the
data related to Access to quality health care. They include:
• 40% of adults reported their physical health as not good one plus days in
the past month, compared to the state (38%).
• Adults who reported their health as fair or poor was significantly higher for
the three year-period 2011-2013.
• Indiana County and Pennsylvania percentages are below the Healthy People
2020 Goal of 16.1% for adults with no personal health care provider.
• There were no significant differences between the county and state in terms
of adults who visited a doctor for a routine check-up in the past year.
• Indiana County and Pennsylvania percentages are below the Healthy People
2020 Goal of 90.0% for adults who visited a doctor for a check-up within the
past two years.
• The service area and Pennsylvania percentages are above the Healthy
People 2020 Goal of 4.2% for adults who needed to see a doctor in the past
year but could not due to cost.
• 90.6% of Indiana County survey respondents indicated that they currently
have health care coverage, slightly less than the overall region (93.5%)
• Access to affordable health care, access to insurance coverage and access to
dementia care services were the top three issues related to access on the
community survey
• 12.8% of the regional survey respondents could not fill a prescription in the
last 12 months due to cost

2015 Community Health Needs Assessment
Executive Summary
Page | 40
• Almost half of the regional survey respondents (49.4%) had a routine
medical checkup within the last six months, with another 24.8% indicating
that they have had a checkup within the last year. A small portion (6%)
indicated that it has been 5 or more years since they have had a checkup.
• Most (94.4%) of the regional survey respondents indicated that they had a
regular health care provider. The most frequent reasons cited that they did
not have a provider was that they were healthy/had no need or had no
insurance.
• According to the PRC National Child & Adolescent Health Survey, more than
half of the children in the United States are covered under Private 65.3%
Insurance.
• The study also found that 6.6% of children in the Northeast Region are
uninsured, which is comparable to the United States (6.5%).
• According to the PRC National Child & Adolescent Health Survey, the
majority (91.7%) of children in the Northeast Region had a routine physician
visit in the past year, which is higher when compared to the United States
(85.3%).
• The study also found that 83.6% of children in the Northeast region had an
annual routine dental check-up, which is slightly lower than the United
States (84.9%).
• The Northeast region (19.5%) had the lowest number of children accessing
health care through an urgent care center when compared to the other
regions and the United States (28.6%).
• The majority of 2015 PMCN Community Survey respondents (93.5%) have
health insurance. Respondents from IRMC's service area were significantly
more likely to not have health insurance (8.7%) when compared to the
other hospital service area respondents.
• According to the PRC National Child & Adolescent Health Survey, one in four
children (24.5%) in the Northeast Region experienced a barrier or delay in
accessing the care they needed, which is lower than the United States
(29.4%).
• Slightly more than one in ten (12.8%) PMCN Community Survey
Respondents were not able to fill a prescription due to cost during the past
year.

2015 Community Health Needs Assessment
Executive Summary
Page | 41
Chronic Disease
Conditions that are long-lasting, relapse, remission and continued persistence are
categorized as chronic diseases. The issues of obesity, hypertension/high blood
pressure, and a high cancer rate were identified as major concerns in the
community survey.
Stakeholders identified obesity is a top community health need. They also noted
the need for management of chronic disease as a top need. Stakeholders suggest
that there is an increase in chronic disease related to lifestyle behaviors.
Focus group participants identified several chronic diseases as the biggest
community needs, including diabetes, heart disease, stroke and cancer.
There are a number of observations and conclusions that can be derived from the
data related to Chronic Disease. They include:
• Heart disease and heart attack mortality rates are increasing over the period
2008-2012 for IRMC’s service area.
• Cardiovascular mortality rates were higher in Jefferson County for 2012
then the other service area counties.
• Cerebrovascular disease mortality rates were significantly higher in
Armstrong County for 2012.
• Breast cancer incident rates are increasing over the five year period for
Indiana County.
• For the year 2012, bronchus and lung mortality rates were significantly
lower in Indiana County.
• Lyme disease was significantly higher in the service area for the years 2011
and 2012.
• Obesity rates for Indiana County are significantly higher than the state rate
for the period 2008-2013.
• Mammogram screenings are trending downward for the years 2013-2015.
• According to the PMCN Community Survey 76.0% of all adults age 55 and
older had a sigmoidoscopy or colonoscopy.
• Over half (61.4%) of male PMCN Community Survey respondents age 65 and
older had a Prostate-Specific Antigen Test (PSA) within the past year.
• All of the PMCN Community Survey respondents ages 65 to 74 have had
their blood pressure checked within the past two years.

2015 Community Health Needs Assessment
Executive Summary
Page | 42
• Of the PMCN Community Survey respondents age 65 and older, 65% have
been told they have high blood pressure.
• Less than half of the survey respondents younger than 75 had their blood
cholesterol checked in the past six months, regardless of age group. Just
over half (55.9%) of those over the age of 75 had their blood cholesterol
checked within the past six months.
• According to the PRC National Child & Adolescent Health Survey, twice as
many children in the Northeast region (1.4%) have diabetes compared to
the United States (0.7%).
• Approximately one in ten (10.7%) PMCN Community Survey respondents
have been told they have diabetes. Respondents from the Punxsutawney
Area Hospital service region were significantly less likely to have been told
they have diabetes compared to Overall half of respondents in each age
group on the PMCN Community Survey are considered overweight or obese.
The highest percentage (78.3%) is between the ages of 18 to 24 and 65 to
74.
• Overall, 71.4% of the PMCN Community Survey Respondents are considered
overweight or obese.
• Half (50.7%) of the female PMCN Community Survey respondents had a
mammogram within the past year.
• The majority of female survey respondents age 18 to 24 (89.5%) and 25 to
34 (85.9%) have never had a mammogram.
• Slightly over half (51.7%) of female PMCN Community Survey respondents
had a pap test within the past year. Female respondents from
Punxsutawney Area Hospital were significantly more likely to have never
had a pap test compared to the other hospital respondents.
• The top chronic disease problems identified on the community survey
included obesity and overweight (3.95), Hypertension/High Blood Pressure
(3.58), Cancer (3.58), Diabetes (3.56) High Cholesterol (3.50), and
Cardiovascular Disease (3.47).

2015 Community Health Needs Assessment
Executive Summary
Page | 43
Healthy Environment
Environmental quality is a general term which refers to varied characteristics that
relate to the natural environment such as air and water quality, pollution and noise,
weather as well as the potential effects such characteristics have on physical and
mental health. In addition, environmental quality also refers to the socio-economic
characteristics of a given community or area, including economic status, education,
crime and geographic information.
One stakeholder reported that 12% of the population lives in poverty. Another
reported that individuals with a criminal or drug record are unable to qualify for
available housing.
Focus group participants identified several environmental factors as contributing to
community health needs. Parental involvement was identified as one of the biggest
community health needs. Poverty and lack of education about health and wellness
were identified as perceived barriers.
There are a number of observations and conclusions that can be derived from the
data related to Healthy Environment. They include:
• The high school graduation rates are higher than the state rate, although
the graduation rate is trending down for the service area.
• The unemployment rates across the county are comparable to the state
rate, and are lower than the national rate.
• The percentage of children living in poverty is higher than the state
percentage, although the trend is decreasing over the three year period.
• The percent of children living with a single parent is showing a downward
trend and is lower than the state percentage.
• Asthma hospitalization rates for Indiana County in 2010 (the last data
available) was moderately high, in the 17.6 to 29.8 range.
• A study conducted in New York and Pennsylvania found that methane
contamination of private drinking water wells was associated with proximity
to active natural gas drilling.” (Osborne SG, et al., 2011)
• “While many of the chemicals used in the drilling and fracking process are
proprietary, the list includes benzene, toluene, ethyl benzene, xylene,
ethylene glycol, glutaraldehyde and other substances with a broad range of
potential toxic effects on humans ranging from cancer to adverse effects on

2015 Community Health Needs Assessment
Executive Summary
Page | 44
the reproductive, neurological, and endocrine systems (ATSDR, Colborn T.,
et al., U.S. EPA 2009).
• “Sources of air pollution around a drilling facility include diesel exhaust from
the use of machinery and heavy trucks, and fugitive emissions from the
drilling and NGE/HF practices….volatile organic compounds can escape
capture from the wells and combine with nitrogen oxides to produce
ground level ozone.” (CDPHE 2008, 2010)
• According to the PRC National Child & Adolescent Health Survey, one in ten
children (10.6%) in the Northeast Region have Asthma, which is slightly
lower when compared to the United States (11.6%).
• Slightly more than one in four (27.0%) children in the United States had an
Asthma related visit to the Emergency Room or Urgent Care Facility.
• According to the PRC National Child & Adolescent Health Survey, one in ten
children (10.6%) in the Northeast Region have Asthma, which is slightly
lower when compared to the United States (11.6%).
• PMCN Community Survey respondents identified employment/lack of jobs
(3.72) and poverty (3.51) as top community health needs.
The top environmental problems identified on the community survey were
employment opportunities/lack of jobs (3.72), poverty (3.51), crime (3.13) and
delinquency/youth crime (3.12)
Healthy Mothers, Babies and Children
The well-being of children determines the health of the next generation and can
help predict future public health challenges for families, communities, and the
health care system. The healthy mothers, babies and children topic area addresses a
wide range of conditions, health behaviors, and health systems indicators that affect
the health, wellness, and quality of life for the entire community.
Stakeholders noted a need for dental services for low income children as a top
community health need. Child abuse and neglect was also identified as a top
community need. It was noted that parents are having difficulty re-enrolling with
the Department of Human Services, resulting in a lapse in health care coverage for
children. Another health concern was addicts having babies, noting that there are
drug addicted pregnant women currently incarcerated.
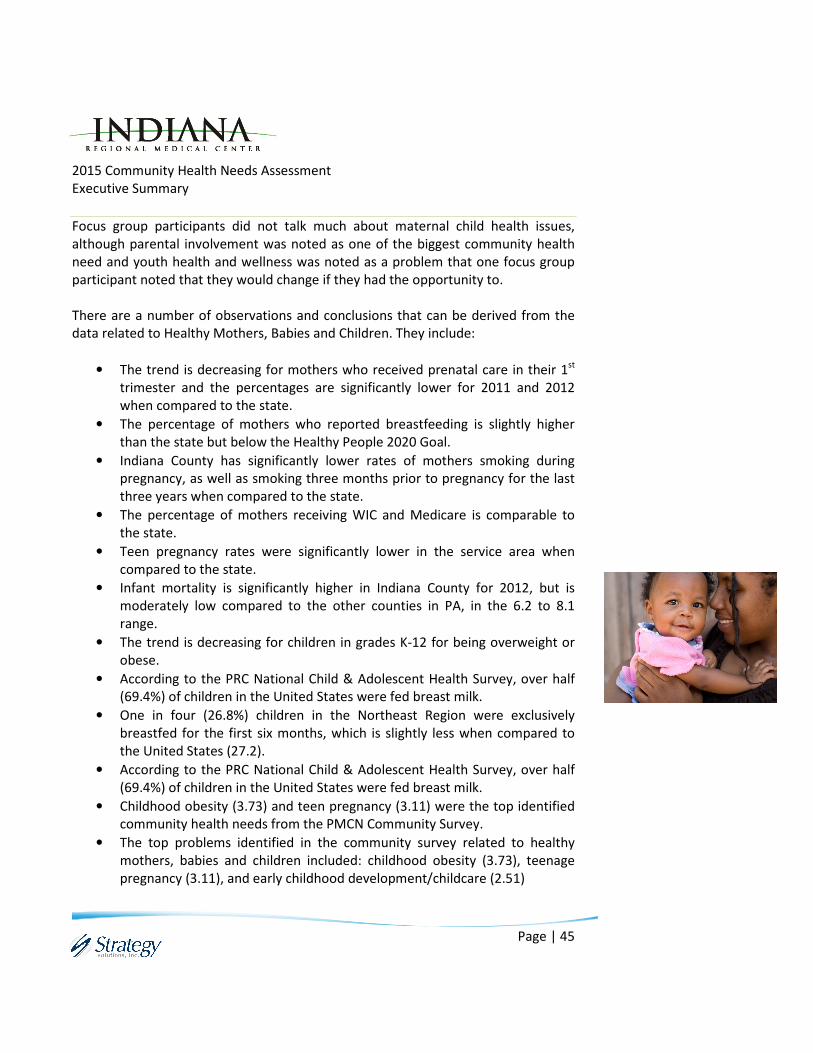
2015 Community Health Needs Assessment
Executive Summary
Page | 45
Focus group participants did not talk much about maternal child health issues,
although parental involvement was noted as one of the biggest community health
need and youth health and wellness was noted as a problem that one focus group
participant noted that they would change if they had the opportunity to.
There are a number of observations and conclusions that can be derived from the
data related to Healthy Mothers, Babies and Children. They include:
• The trend is decreasing for mothers who received prenatal care in their 1st
trimester and the percentages are significantly lower for 2011 and 2012
when compared to the state.
• The percentage of mothers who reported breastfeeding is slightly higher
than the state but below the Healthy People 2020 Goal.
• Indiana County has significantly lower rates of mothers smoking during
pregnancy, as well as smoking three months prior to pregnancy for the last
three years when compared to the state.
• The percentage of mothers receiving WIC and Medicare is comparable to
the state.
• Teen pregnancy rates were significantly lower in the service area when
compared to the state.
• Infant mortality is significantly higher in Indiana County for 2012, but is
moderately low compared to the other counties in PA, in the 6.2 to 8.1
range.
• The trend is decreasing for children in grades K-12 for being overweight or
obese.
• According to the PRC National Child & Adolescent Health Survey, over half
(69.4%) of children in the United States were fed breast milk.
• One in four (26.8%) children in the Northeast Region were exclusively
breastfed for the first six months, which is slightly less when compared to
the United States (27.2).
• According to the PRC National Child & Adolescent Health Survey, over half
(69.4%) of children in the United States were fed breast milk.
• Childhood obesity (3.73) and teen pregnancy (3.11) were the top identified
community health needs from the PMCN Community Survey.
• The top problems identified in the community survey related to healthy
mothers, babies and children included: childhood obesity (3.73), teenage
pregnancy (3.11), and early childhood development/childcare (2.51)

2015 Community Health Needs Assessment
Executive Summary
Page | 46
Infectious Disease
Pathogenic microorganisms, such as bacteria, viruses, parasites or fungi, cause
infectious diseases; these diseases can be spread, directly or indirectly, from one
person to another. These diseases can be grouped in three categories: diseases
which cause high levels of mortality; diseases which place on populations heavy
burdens of disability; and diseases which owing to the rapid and unexpected nature
of their spread can have serious global repercussions (World Health Organization).
There are a number of observations and conclusions that can be derived from the
data related to Infectious Disease, although the topic was not discussed in the
stakeholder interviews. They include:
• The incidence rates of chlamydia and gonorrhea were significantly lower for
Indiana County when compared to the state, although the trend is increasing for
both infectious diseases.
• Those adults ever tested for HIV is significantly lower than the state, national
and Healthy People 2020 percentages.
• According to the PMCN Community Survey, sexual behaviors (3.30) and Lyme
disease (3.14) were the top identified community health priorities.
• The top problems related to infectious disease identified in the community
survey include sexual behaviors (3.30) and Lyme Disease (3.34)There were no
comments from stakeholder interviews or focus groups noting infectious
disease related issues or problems as top community needs or issues that were
high priority to address.
Mental Health and Substance Abuse
Mental Health refers to a broad array of activities directly or indirectly related to the
mental well-being component included in the World Health Organization's definition
of health: "A state of complete physical, mental and social well-being, and not
merely the absence of disease". Mental health is related to the promotion of well-
being, the prevention of mental disorders, and the treatment and rehabilitation of
people affected by mental disorders.
According to the World Health Organization, substance abuse refers to the harmful
or hazardous use of psychoactive substances, including alcohol and illicit drugs.

2015 Community Health Needs Assessment
Executive Summary
Page | 47
Psychoactive substance use can lead to dependence syndrome - a cluster of
behavioral, cognitive, and physiological phenomena that develop after repeated
substance use and that typically include a strong desire to take the drug, difficulties
in controlling its use, persisting in its use despite harmful consequences, a higher
priority given to drug use than to other activities and obligations, increased
tolerance, and sometimes a physical withdrawal state.
The Addiction Recovery Mobile Outreach Team (ARMOT) program is a collaboration
between the Armstrong-Indiana-Clarion Drug and Alcohol Commission, Inc.
(AICDAC), the Armstrong County Council on Alcohol and Other Drugs, Inc. (d/b/a:
ARC Manor), the Armstrong County Memorial Hospital (ACMH), the Indiana
Regional Medical Center (IRMC), and The Open Door (TOD) treatment agency. The
collaboration grew out of the implementation strategies undertaken by IRMC since
its 2012 CHNA. The mission of ARMOT is to enhance the linkage between rural
hospital emergency department/ inpatient units and substance abuse treatment
service delivery to individuals with substance use disorders in Armstrong and
Indiana Counties in Western Pennsylvania.
Substance abuse and addiction constitute the nation’s number one public health
problem contributing to 70 health conditions and to the 5 leading causes of death.
The National Survey on Drug Use and Health 0f 2010 (NSDUH 2010) reported an
estimated 22.6 million Americans aged 12 or older were current (used in the last 30
days) illicit drug users (8.9% of this population). Of the 22.6 million, 7.1 million (or
33%) met the criteria for substance abuse or dependence of illicit drugs.
The Drug Abuse Warning Network (DAWN) reports that each day nationally 20,000
individuals are seen in emergency departments for alcohol related injuries and 60%
of patients seen in trauma centers are under the influence of alcohol and/or drugs
at the time of admission. When comparing the national drug use rate of 8.9% to the
population of the three Counties (197,809), an average of 17,605 residents could be
current illicit drug users. Of the 17,605 users, an average of 33% or 5,809 county
residents would meet the criteria for substance abuse or dependence on illicit
drugs.
Western Pennsylvania has experienced an epidemic of heroin and opiate abuse in
the past 8-10 years. Pennsylvania now has the 7th highest drug overdose mortality
rate in the United States, with over 3,000 deaths being heroin-related overdoses.

2015 Community Health Needs Assessment
Executive Summary
Page | 48
Drug overdose deaths in Pennsylvania have now exceeded the number of deaths
from automobile accidents.
The heroin epidemic has spread to rural and suburban communities previously
unharmed by such widespread heroin abuse, and instead of this upward trend flat-
lining or decreasing, abuse and overdose continue to escalate, resulting in the loss
of life across every age group and demographic. Locally, ACMH treated 77 overdose
patients in 2013. IRMC treated 109 overdose patients in 2013, more than has ever
been reported at IRMC in the past. In November 2014, Citizen’s Ambulance
Company of Indiana County reported that they have responded to an average of 90
overdoses in the past 90 days.
The majority of stakeholders participating in this CHNA identified mental health and
substance abuse issues as one of the top community health needs. Stakeholders
identified the need for an inpatient mental health unit noting the only available
beds locally are for geriatric mental health needs. They also suggest the need for
education regarding mental health and the stigma that is often associated with
mental health. A few stakeholders commented that although mental health
services are available, people do not seek them out suggesting that something
might be missing from the continuum of care. It was noted that substance abuse is
often involved in cases of abuse and neglect. The need for services for Post-
Traumatic Stress Disorder, as well as Alzheimer’s’ beds was also noted.
The most frequently mentioned top community health need mentioned by focus
group participants was mental health. Substance abuse was also mentioned by
participants as a top need. Mental health and drug use were also identified as
problems that focus group participants would change.
There are a number of observations and conclusions that can be derived from the
data related to Mental Health and Substance Abuse. They include:
• A third of adults reported their mental health not good at least one or more
days in the past month.
• There were no significant differences in heavy drinking between the service
area counties, state, and nation.
• In the child/adolescent population, the use of alcohol, marijuana, and pain
relievers increased with age, as did the prevalence rates of driving under the
influence of these substances.

2015 Community Health Needs Assessment
Executive Summary
Page | 49
• The rate of 12th graders driving under drinking alcohol is increasing over the
past few years.
• Just under half (45.4%) of male PMCN Community Survey respondents
report binge drinking in the past month, compared to 37.7% of overall
survey respondents.
• Over a third (37.1%) of PMCN Community Survey respondents report feeling
depressed in the past two weeks.
• Over half (61.9%) report having difficulty sleeping in the past two weeks.
• The top mental health and substance abuse problems identified in the
community survey include illegal drug use (4.04), prescription drug abuse
(3.73), and alcohol abuse (3.65)
Physical Activity and Nutrition
Regular physical activity reduces the risk for many diseases, helps control weight,
and strengthens muscles, bones, and joints. Proper nutrition and maintaining a
healthy weight are critical to good health.
Stakeholders identified the need for access to programs and services that support a
healthy lifestyle for low income residents. They also noted a need for more focus on
healthy eating and physical activity from the medical community, including
pediatricians. The lack of access to healthy foods has resulted in some community
members growing their own food. One stakeholder also noted that school districts
have reduced or eliminated gym class for children
Several focus group participants noted access to healthy food and poor eating habits
along with lack of outside activity and biggest community health needs. Increasing
education on health and wellness was also identified as a problem to be changed.
There are a number of observations and conclusions that can be derived from the
data related to Physical Activity and Nutrition. These include:
• A third of students in service area schools districts are eligible for free or
reduced price lunches.
• 14% of adults have food insecurity and 4% have limited access to healthy
foods.

2015 Community Health Needs Assessment
Executive Summary
Page | 50
• According to the PRC National Child & Adolescent Health Survey, just under
half (43.2%) of children in the United States are physically active seven days
a week. The majority (97.4%) are active at least one day per week.
• The study found that less than half (41.0%) of children in the Northeast
Region were physically active for an hour or longer in the past week, which
is slightly lower than the United States (43.2%).
• More than half (73.2%) of PMCN Community Survey respondents report
being physically active during the past month.
• According to the PRC National Child & Adolescent Health Survey, just under
half (43.2%) of children in the United States are physically active seven days
a week. The majority (97.4%) are active at least one day per week.
• According to the PRC National Child & Adolescent Health Survey, over half
(59.9%) of children in the United States are spending more than an hour per
day playing video games or watching TV.
• Slightly fewer (49.3%) are spending over an hour on a cell phone or other
hand held device.
• Over half (65.2%) of the children in the Northeast Region are spending over
three hours in on “screen time”, which is higher than the United States
(63.8%).
• According to the PRC National Child & Adolescent Health Survey, one in
three (33.9%) children is receiving five or more servings of fruits and
vegetables per day, which is lower compared to the United States (41.8%).
• The majority of PMCN Community Survey respondents is eating vegetables
(93.8%) and fruit (95.9%) daily.
• Over half (69.9%) of children in the United States are eating fast food at
least one time per week.
• Lack of physical activity/recreation (3.58) was the top identified Physical
Activity and Nutrition priority on the PMCN Community Survey, followed by
access to high quality affordable foods (2.97).
Tobacco Use
Tobacco Use is an important public health indicator as it relates to a number of
chronic disease issues and conditions.
One stakeholder identified tobacco use as a top community health need.

2015 Community Health Needs Assessment
Executive Summary
Page | 51
While not discussed extensively, focus group participants indicated that
tobacco use and smoking were top community needs.
There are a number of observations and conclusions that can be derived from the
data related to Tobacco Use, although the topic was not discussed extensively in
focus groups or stakeholder interviews. These include:
• Over half of the adults in the service area reported never being a smoker.
• The percentage of adults currently using chewing tobacco, snuff, or snus
somewhat or every day is significantly higher in Indiana County.
• The percentage of current smokers is higher than everyday smokers in the
service area.
• One in ten (10.0%) of the PMCN Community Survey respondents report
being a current smoker.
• Of those, one third (35.7%) smoke 10 cigarettes or more per day.
• Very few (4.5) PMCN Community Survey respondents report using chewing
tobacco, snuff or snus.
• Tobacco use (3.74) and tobacco use in pregnancy (3.13) were both
considered priorities from the PMCN Community Survey. Respondents in
the Punxsutawney hospital region rated tobacco use and tobacco use in
pregnancy as significantly higher problems when compared to the other
hospital regions.
• According to the PRC National Child & Adolescent Health Survey, 7.1% of
children in the Northeast region had an injury serious enough to require
medical attention in the past year, which is lower when compared to the
United State (10.6%).
Injury
The topic of injury relates to any intentional or unintentional injuries that can be
suffered by individuals. One stakeholder identified domestic violence as a top
community health need. A few stakeholders also noted child abuse and neglect as
top community needs.
Injury related topics were not discussed by focus group participants as top needs or
problems that they would change if they could.

2015 Community Health Needs Assessment
Executive Summary
Page | 52
There are a number of observations and conclusions that can be derived from the
data related to Injury, although the topic was not discussed in focus groups or
stakeholder interviews. These include:
• Although there was missing data, the mortality rate due to auto accidents
was significantly higher in the service area than the state.
• According to the PMCN Community Survey, domestic violence (3.20) and
child abuse (3.19) were both considered community health problems.
• Respondents from Indiana Regional Medical Center rated crime a
significantly higher problem than the other hospital regions.
• Top problems related to injury identified in the community survey included
domestic violence (3.20), child abuse (3.19), and violence (3.08).
Top Priorities
Figure 7 illustrates the top 10 community health problems identified in the PMCN
survey.
Figure 7: PMCN Survey Top Priorities
Figure 8 shows the open ended responses to the survey. The top priorities identified
included:

2015 Community Health Needs Assessment
Executive Summary
Page | 53
Figure 8: PMCN Survey Top Priorities
Table 3 illustrates the top 20 overall regional priorities identified in the community
survey based on the percentage of respondents who rated the issue as a serious or
very serious problem. The overall regional results are compared with the
respondents from Indiana County only.
Table 3: Community Survey: Top 20 Overall Regional Priorities
2015 Community Survey % Serious & Very Serious Problem
Top 20 Community Health Problems PMCN Region
Indiana
County
1. Illegal Drug Use 76.6% 74.0%
2. Obesity and Overweight 73.5% 68.2%
3. Childhood Obesity 63.3% 58.2%
4. Prescription Drug Abuse 62.8% 59.7%
5. Tobacco Use 62.7% 56.8%
6. Employment Opportunities/Lack of
Jobs 62.2% 57.6%

2015 Community Health Needs Assessment
Executive Summary
Page | 54
2015 Community Survey % Serious & Very Serious Problem
Top 20 Community Health Problems PMCN Region
Indiana
County
7. Alcohol Abuse 58.4% 58.6%
8. Diabetes 57.7% 54.0%
9. Hypertension/High Blood Pressure 57.6% 53.2%
10. Cancer 57.4% 50.5%
11. Lack of Exercise/Physical Activity 56.3% 51.6%
12. High Cholesterol 54.5% 50.2%
13. Heart Disease 54.0% 51.1%
14. Poverty 53.5% 51.2%
15. Cardiovascular Disease and Stroke 52.5% 49.7%
16. Sexual Behaviors (unprotected,
irresponsible/risky) 42.1% 39.6%
17. Access to Affordable Health Care
(related to copays and deductibles) 38.4% 38.5%
18. Dental Hygiene/Dental Problems 37.9% 34.0%
19. Lyme Disease 36.9% 33.2%
20. Domestic Violence 36.6% 37.8%
Figure 9 outlines the top priority community needs identified by the stakeholders
who were interviewed.

2015 Community Health Needs Assessment
Executive Summary
Page | 55
Figure 9: Stakeholder Interviews: Top Priorities
The most frequently identified biggest health need for the community identified by
the focus group participants included the following:
• Access to healthy food/poor eating habits (4)
• Affordability of health care (4)
• Access to health care (3)
• Services for individuals with a disability (3)
• Substance abuse (2)
• Mental health (stress, depression, etc.) (2)
Focus group participants asked to identify the one problem they would change in
the community. Responses included:
• Lack of motivation and accountability
• Drug use
• Youth health and wellness
• Poverty and mental health “perceived” barriers
• Increase education on health and wellness
Focus group participants were also asked to identify top priority community needs.
Reponses are outlined in Figure 10.

2015 Community Health Needs Assessment
Executive Summary
Page | 56
Figure 10: Focus Groups: Top Priority Needs
Prioritization and Significant Health Needs
As a result of the data analysis, the consulting team identified 35 distinct community
needs and issues that demonstrated a disparity, negative trend or gap between the
local/ regional data and the state, national or healthy people goal and/or that
qualitative information suggested that it was a growing need in the community. At
their meeting on May 1, 2015, the IRMC Steering Committee agreed with the list of
potential needs, participated in prioritizing the needs based on the selected criteria
and met again to discuss the prioritization results. Table 4 identified the selected
criteria:

2015 Community Health Needs Assessment
Executive Summary
Page | 57
Table 4: Prioritization Criteria
During the IRMC Steering Committee meetings, the group also discussed the
importance of community collaboration as well as on reducing fragmentation with
the provider network as significant community health needs. When discussing the
top priorities at the Steering Committee meeting on May 29, the group agreed that
one of the top priorities moving forward over the next few years is to focus on
creating a county-wide vision for a healthy community, increasing collaboration, as
well as to engage Indiana County “anchor agencies” to reduce fragmentation of
services and improve community health.
The top needs identified for the Region and IRMC primary service area based on
magnitude, impact and capacity are outlined in Table 5.

2015 Community Health Needs Assessment
Executive Summary
Page | 58
Table 5: Overall Significant Community Needs (Magnitude/Impact/Capacity)
Regional
Rank Issue/Need
IRMC
Rank
1 High Blood Pressure/ Hypertension 3
2 Obesity 1
3
Cardiovascular Disease (Heart
Disease, Cholesterol, etc.) 4
4 Diabetes 2
5 Preventative Care/Screenings 8
6 Breast Cancer 6
6 Colorectal Cancer 6
6 Prostate Cancer 6
7 Flu & Pneumonia 5
8 Prescription Drug Misuse/Abuse 8
9 Lyme Disease 12
10 Drug Abuse/Mortality 9
Based on the data, the IRMC Steering Committee completed an additional analysis
based on the prioritization data, factoring in the hospital role criteria. Figure 11
illustrates the health risks sorted by magnitude and impact with scores of 14.0 or
higher.

2015 Community Health Needs Assessment
Executive Summary
Page | 59
Figure 11: IRMC Health Risks Sorted by Magnitude and Impact
Figure 12 shows the health risks sorted by magnitude and impact scores of 14.0 and
higher and capacity scores of 21.0 and higher.

2015 Community Health Needs Assessment
Executive Summary
Page | 60
Figure 12: IRMC Health Risks Sorted by Magnitude, Impact and Capacity
Table 6 shows the data associated with the top needs identified by the Steering
Committee.

2015 Community Health Needs Assessment
Executive Summary
Page | 61
Table 6: IRMC Top Priority Trends and Disparities

2015 Community Health Needs Assessment
Executive Summary
Page | 62
Using this methodology, and factoring in the role of the health system, the final
priorities selected by the IRMC Steering Committee as most significant include:
1. Lyme Disease
2. Healthy eating
3. Alcohol abuse
4. Drug Abuse
5. Prescription abuse
6. Preventive care
7. Cancer
a. Colorectal
b. Breast
8. Coronary Artery Disease
9. Hypertension
10. Diabetes
11. Obesity
Review and Approval
The 2015 Community Health Needs Assessment and Action Plan will be presented
and approved by the IRMC Board of Directors on June 11, 2015. Following Board
approval, the 2015 IRMC CHNA will be published and made widely available to the
public

2015 Community Health Needs Assessment
Executive Summary
P a g e | 63
In March 2015, IRMC conducted a 3-year evaluation of its 2011 CHNA. Although the status
for most indicators did not move significantly, it is clear that IRMC is working to improve the
health of the community.
Earlier in 2015, IRMC received a grant from the Pennsylvania Office of Rural Health to
implement the Healthy Communities, Inc. data site on their website. This data uses “gas
gauge” graphics to display related indicators that show where Indiana County is in relation
to all of Pennsylvania.
Priority Area 1:
Prenatal Care Goal: Increase to 78 percent Indiana County women that receive early prenatal
care.
Status: 65.5% of Indiana County women received early prenatal care in 2011.
Indicators
Early Prenatal Care Infant Mortality Rate Low Birth Weight Rate
Overall Impact of Strategies on Prenatal Care:
• Improved access to prenatal care through recruitment of 2 female obstetricians.
• Improved access to prenatal care by opening new practice site in southern Indiana
County.
Appendix A
2011 Community Health Needs Assessment Evaluation

2015 Community Health Needs Assessment
Executive Summary
Page | 64
• Improved access and visibility of OB/GYN Care Center by relocating the center onto
hospital grounds.
• Increased awareness of obstetrical medical and nursing staff of statistics for
prenatal care in county.
• Developed internal monitor for women delivering at IRMC that revealed an average
or 84% received early prenatal care.
• Developed a cooperative relationship with Amish midwife to provide additional
resources for prenatal and infant care.
Completed Strategies
• Investigate becoming a provider under DPW Healthy Beginnings Plus.
• Evaluate process for obtaining prenatal information for birth certificates.
• Evaluate the need & work towards recruiting and supporting a 5th
obstetrician/gynecologist.
• Improve visibility and information about the OB/GYN Care Center.
• Improve maternal and infant care in Amish population.
Strategies Not Pursued
• Develop and implement an educational campaign about the importance of early
prenatal care.
• Partner with agencies providing services and education to young teens and women
to include the importance of prenatal care.
• Develop and seek opportunities to promote preconception programs.
• Evaluate implementing Nurse-Family Partnership program.
Priority Area 2:
Improve primary care physician to population ratio. Goal: Decrease the physician to population ratio by 10% to 1:1200 population.
Status: Ratio 1:1,764 population
Primary Care Non-physician Unable to afford Adults with
Primary Care Doctor Insurance
Overall Impact of Strategies on Physician to Population Ratio:
• Increased capacity by successfully recruiting 5 primary care physicians.
• Improved access to care by opening an Urgi-care in southern Indiana County.

2015 Community Health Needs Assessment
Executive Summary
Page | 65
• Improved access and increased visibility by moving Empower 3 to a central county
location.
• Enrolled more than 3, 000 patients in the Indiana Regional Medical Center’s patient
portal.
Completed Strategies
• Conducted semi-annual manpower physician surveys.
• Implemented patient portal to improve access to medical records.
• Evaluated need for new primary care practice.
• Established a second Urgi-care site in southern Indiana County.
• Implemented grant funding to expand services to uninsured residents.
Strategies Not Pursued
• Evaluate feasibility of hospitalist program.
• Explore Family Practice residency program.
Priority Area 3:
Decrease Incidence of Overweight & Obesity Goal: Decrease the percent of overweight & obese in Indiana County to 60%.
Status: Data combined with 2 other counties, 68%
Obese Adults Overweight/Obese Teens Overweight/Obese
Children
Overall Impact of Strategies on Incidence of Overweight and Obesity:
• Expanded and relocated the Wellness Center to provide medically-based fitness
programming.
• Provided physician offices with information about weight loss programming and tool
kit.
• Opened the Center for Weight Loss following recommendation from task force.
• Rebranded diabetes programs as Lifestyle Balance and added second year
programming.
• Secured funding to supplement costs of programs.
• Completed year-long Lose-A-Ton program (winner lost 11% of body weight).
Completed Strategies

2015 Community Health Needs Assessment
Executive Summary
Page | 66
• Enlarged the Wellness Center.
• Evaluated Exercise is Medicine program.
• Provided physicians with resources.
• Established weight loss task force.
• Opened Center for Weight Loss.
• Rebranded diabetes programs.
• Obtained funding to make programs more affordable.
• Held IRMC Seminar with guest speaker from the Biggest Loser television program.
Strategies Not Pursued
• Investigate best practice programming for men and obesity.
Priority Area 4:
Deaths from Influenza and Pneumonia Goal: Reduce death rate to 17 per 100,000 population.
Status: 17.2 deaths per 100,000 population.
Influenza/Pneumonia Deaths
Overall Impact of Strategies on Influenza & Pneumonia Death Rate:
• Increased awareness of need for influenza and pneumonia vaccines.
• Increased access to vaccines through participation in POD exercises and
administration to high-risk, low income residents.
• Increased percent of IRMC employees who get an annual influenza vaccine.
Completed Strategies
• Continued providing annual flu and pneumonia vaccines to low income, high-
risk adult residents.
• Continued to have an annual community flu awareness educational campaign.
• Implemented a mandatory influenza policy for employees at IRMC.
Strategies not Pursued
• Use of standing orders for pneumonia vaccine by home health agencies.
• Evaluate the potential for public pneumonia clinics.

2015 Community Health Needs Assessment
Executive Summary
Page | 67

2015 Community Health Needs Assessment
Executive Summary
Page | 68
Priority Area 5:
Increase percent of residents who have cholesterol
testing. Goal: Increase the percent of adults screened to 82%.
Status: Data not available.
High cholesterol- Medicare Heart Disease Death Rate Stroke Death Rate
Overall Impact of Strategies on Cholesterol Testing:
• Improved access by implementing Wellness Wednesday program and offering
cholesterol all week days at all IRMC lab sites.
• Increased awareness by providing over 1800 residents with cholesterol information.
• Increased awareness by including cholesterol information with stroke education.
Completed Strategies
• Increased the number of community multiphasic blood screenings.
• Developed community education program to increase awareness of
recommendations for cholesterol testing.
• Evaluated feasibility of finger stick cholesterol testing.
• Included cholesterol education information in the Stroke Education program.
Strategies Not Pursued
• Provide physician offices with screening guideline charts.
Priority Area 6:
Decrease Preventable Hospitalizations & Readmission
Rates. Goal: Reduce the readmission rate by 20 percent from 119/1000 Medicare
enrollees.
Status: 92 readmissions/1000 Medicare enrollees.

2015 Community Health Needs Assessment
Executive Summary
Page | 69
Overall Impact of Strategies on Preventable Hospitalizations and Readmission
Rates:
• Improved access to care by opening a Primary Care Resource Center in cooperation
with Pittsburgh Regional Health Initiative.
• Improved discharge process by conducting RIE on processes that impact
readmission.
Completed Strategies
• Identified best practices to lower readmission rates.
• Opened a Primary Care Resource Center focusing on patients with a diagnosis of
pneumonia, congestive heart failure and myocardial infarction.
• Improved access to care by moving Empower3 to a central location.
• Piloted the Coleman model.
Strategies Not Pursued
• Use of health coaches, personal health records and post discharge physician
visits.
• Continued support to the Indiana County Prescription Assistance Program.
Priority Area 7:
Decrease Substance Abuse related visits to the
Emergency Department. Goal: Decrease number of patients by 25%
Status: Number of patients presenting has increased by 10%
Drug Poisoning Death Rate Alcohol Impaired Driving Deaths Adult Excessive
Drinking
Overall Impact of Strategies on Substance Abuse related E.D. Visits:
• Increased addiction awareness and education of ED Staff.
• Increased ED Staff awareness of referral options in community.
• Improved referral for ongoing treatment for patients presenting in ED.
• Improved the transfer of information between community service providers and the
ED.
• Improved the quality of processed used for treatment of patients with mental
health and substance treatment needs.

2015 Community Health Needs Assessment
Executive Summary
Page | 70
• Included representatives from drug and alcohol agencies on tasks forces and RIE
teams.
• Improved care for addiction patient by including certified recovery specialist as
resource.
• Supported the development of a Detox Unit in the community.
Completed Strategies
• Conducted additional addiction training for staff on intervention and referral.
• Developed a process to increase the number of referrals for outpatient services.
• Included drug and alcohol provider representation on monthly PALS meetings.
• Included drug and alcohol provider representation on RIE for care of addicted
patient in ED.
• Included Certified Recovery Specialist as a resource for patients in ED.
Strategies Not Pursued
Implementation of SBIRT (Screening, Brief Intervention, Referral and Treatment) model in
the ED.
Evaluation of SBIRT use in physician offices.
Evaluation of hospital based detox unit.