MEDIA RELEASE FOOD PRICE MONITOR
28
MEDIA RELEASE FOOD PRICE MONITOR: May 2011 EXECUTIVE SUMMARY The April 2011 Consumer Price Index (CPI) released by Statistics South Africa (Stats SA) showed that food and non-alcoholic beverages inflation increased by 4.8 % between April 2010 and April 2011. Headline CPI increased by 4.2 % between April 2010 and April 2011. The food and non- alcoholic beverages index decreased from March 2011 to April 2011, from 5 % to 4.8 % while headline inflation increased from 4.1 % in March 2011 to 4.2 % in April 2011. The annual increase of 4.8 % in the food and non-alcoholic beverages index was largely driven by the annual increases in oils and fats (22.7 %), meat (8.3 %) and sugar (6.3 %). The prices of processed food products increased by 5.1 % from April 2010 to April 2011 and the price of unprocessed food products increased by 4.8 % over the same period. At the retail level, urban consumers paid R 7.30 for a 700g loaf of brown bread and R 8.23 for a loaf of 700g white bread during April 2011, a 4.29 % and 6.61 % increase respectively compared to April 2010. Urban consumers paid 2.99 % more for a super maize meal (5kg) and 7.49 % less for special maize meal (5kg) in April 2011 than during April 2010 at the retail level. Sunflower cooking oil prices showed the largest price increases of all retail food products reported on in both urban and rural areas. Rural consumers paid R 11.44 more than urban consumers for the same food basket, a significantly lower price difference than usually reported. During February 2011, the FAO global food price index reached its peak of 237.2 index points. In March, the food price index decreased for the first time in 8 months. From March to April, the food price index showed a slight increase again and reached 232.1 index points. From April 2010 to April 2011, the cost of a basic food basket used by the NAMC increased by about R 12.28 (+3.3 %) in nominal terms. The cost of this food basket, expressed as a share of the average monthly income of the poorest 30 % of the population, increased from 33.0 % in April 2010 to 34.1 % in April 2011. The cost of the food basket, expressed as a share of the average monthly income of the wealthiest 30 % of the population, increased slightly from 2.6 % to 2.7 %. 536 Schoeman Street Meintjies Plein A Block, 4th Floor Arcadia Pretoria Tel: +27(0)12 341 1115 Fax: +27(0)12 341 1811 Web: www.namc.co.za
Transcript of MEDIA RELEASE FOOD PRICE MONITOR

MEDIA RELEASE
FOOD PRICE MONITOR: May 2011
EXECUTIVE SUMMARY
The April 2011 Consumer Price Index (CPI) released by Statistics South Africa (Stats SA) showed
that food and non-alcoholic beverages inflation increased by 4.8 % between April 2010 and April
2011. Headline CPI increased by 4.2 % between April 2010 and April 2011. The food and non-
alcoholic beverages index decreased from March 2011 to April 2011, from 5 % to 4.8 % while
headline inflation increased from 4.1 % in March 2011 to 4.2 % in April 2011. The annual increase
of 4.8 % in the food and non-alcoholic beverages index was largely driven by the annual increases
in oils and fats (22.7 %), meat (8.3 %) and sugar (6.3 %). The prices of processed food products
increased by 5.1 % from April 2010 to April 2011 and the price of unprocessed food products
increased by 4.8 % over the same period.
At the retail level, urban consumers paid R 7.30 for a 700g loaf of brown bread and R 8.23 for a
loaf of 700g white bread during April 2011, a 4.29 % and 6.61 % increase respectively compared to
April 2010. Urban consumers paid 2.99 % more for a super maize meal (5kg) and 7.49 % less for
special maize meal (5kg) in April 2011 than during April 2010 at the retail level. Sunflower cooking
oil prices showed the largest price increases of all retail food products reported on in both urban
and rural areas.
Rural consumers paid R 11.44 more than urban consumers for the same food basket, a
significantly lower price difference than usually reported.
During February 2011, the FAO global food price index reached its peak of 237.2 index points. In
March, the food price index decreased for the first time in 8 months. From March to April, the food
price index showed a slight increase again and reached 232.1 index points.
From April 2010 to April 2011, the cost of a basic food basket used by the NAMC increased by
about R 12.28 (+3.3 %) in nominal terms. The cost of this food basket, expressed as a share of
the average monthly income of the poorest 30 % of the population, increased from 33.0 % in April
2010 to 34.1 % in April 2011. The cost of the food basket, expressed as a share of the average
monthly income of the wealthiest 30 % of the population, increased slightly from 2.6 % to 2.7 %.
536 Schoeman Street
Meintjies Plein
A Block, 4th Floor
Arcadia
Pretoria
Tel: +27(0)12 341 1115
Fax: +27(0)12 341 1811
Web: www.namc.co.za
1
QUARTERLY FOOD PRICE MONITOR
May 2011
1. Foreword
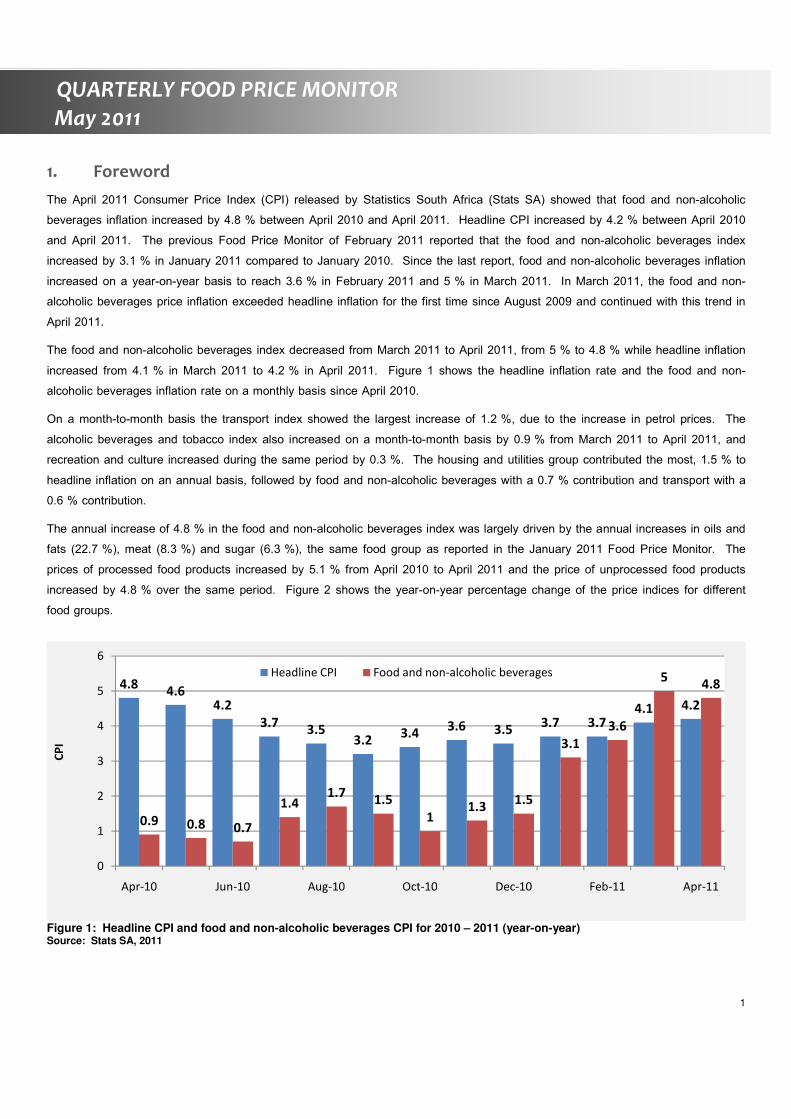
The April 2011 Consumer Price Index (CPI) released by Statistics South Africa (Stats SA) showed that food and non-alcoholic
beverages inflation increased by 4.8 % between April 2010 and April 2011. Headline CPI increased by 4.2 % between April 2010
and April 2011. The previous Food Price Monitor of February 2011 reported that the food and non-alcoholic beverages index
increased by 3.1 % in January 2011 compared to January 2010. Since the last report, food and non-alcoholic beverages inflation
increased on a year-on-year basis to reach 3.6 % in February 2011 and 5 % in March 2011. In March 2011, the food and non-
alcoholic beverages price inflation exceeded headline inflation for the first time since August 2009 and continued with this trend in
April 2011.
The food and non-alcoholic beverages index decreased from March 2011 to April 2011, from 5 % to 4.8 % while headline inflation
increased from 4.1 % in March 2011 to 4.2 % in April 2011. Figure 1 shows the headline inflation rate and the food and non-
alcoholic beverages inflation rate on a monthly basis since April 2010.
On a month-to-month basis the transport index showed the largest increase of 1.2 %, due to the increase in petrol prices. The
alcoholic beverages and tobacco index also increased on a month-to-month basis by 0.9 % from March 2011 to April 2011, and
recreation and culture increased during the same period by 0.3 %. The housing and utilities group contributed the most, 1.5 % to
headline inflation on an annual basis, followed by food and non-alcoholic beverages with a 0.7 % contribution and transport with a
0.6 % contribution.
The annual increase of 4.8 % in the food and non-alcoholic beverages index was largely driven by the annual increases in oils and
fats (22.7 %), meat (8.3 %) and sugar (6.3 %), the same food group as reported in the January 2011 Food Price Monitor. The
prices of processed food products increased by 5.1 % from April 2010 to April 2011 and the price of unprocessed food products
increased by 4.8 % over the same period. Figure 2 shows the year-on-year percentage change of the price indices for different
food groups.
Figure 1: Headline CPI and food and non-alcoholic beverages CPI for 2010 – 2011 (year-on-year) Source: Stats SA, 2011
4.84.6
4.2
3.73.5
3.23.4
3.6 3.53.7 3.7
4.1 4.2
0.9 0.8 0.7
1.41.7
1.5
11.3
1.5
3.1
3.6
54.8
0
1
2
3
4
5
6
Apr-10 Jun-10 Aug-10 Oct-10 Dec-10 Feb-11 Apr-11
CP
I
Headline CPI Food and non-alcoholic beverages

2
QUARTERLY FOOD PRICE MONITOR
May 2011
Figure 2: Year-on-year percentage change for different food categories (April 2010 – April 2011) Source: Stats SA, 2011
2. Overall inflation and food inflation: South Africa and selected countries
Table 1 shows the overall inflation and food inflation rates for South Africa and selected countries for the first months of 2011.
Brazil, Russia, India and China experienced the highest inflation on food and non-alcoholic beverages of all the countries listed in
Table 1.
It is important to note that the BRIC countries (Brazil, Russia, India and China) are experiencing such high levels of food price
inflation, since these countries contain about 40% of the world’s population.
Namibia and Zambia both experienced low levels of food price increases, 1.1% and 3.8% respectively, when compared to the
other countries shown in Table 1. Food price inflation in both these economies was lower than overall inflation.
Table 1: Overall inflation and food inflation
Country Month Overall inflation (%) Inflation of food and non alcoholic beverages (%)
South Africa April 2011 4.2 4.8
Namibia February 2011 3.1 1.1
Zambia March 2011 9.2 3.8
Turkey March 2011 4.3 2.8
Australia March 2011 3.3 4.3
Brazil April 2011 6.39 7.62
United States March 2011 6.1 7.1
United Kingdom March 2011 4 4.5
China April 2011 5.3 11.5
India March 2011 9 9.5
Russia March 2011 9.1 13.3
Source: Central banks and statistics reporting institutions of these countries, as well as the press
5.1 4.8 3.9
8.3
0.1 -0.9
22.7
0.92.4
6.3
3
-5
0
5
10
15
20
25P
roce
sse
d
Un
pro
cess
ed
Bre
ad
an
d c
ere
als
Me
at
Fish
Mil
k,
eg
gs
an
d c
he
ese
Oil
s a
nd
fa
ts
Fru
it
Ve
ga
tab
les
Su
ga
r, s
we
ets
an
d
de
sse
rts
Oth
er
foo
d
Pe
rce
nta
ge
ch
an
ge
April 2010 - April 2011

3
QUARTERLY FOOD PRICE MONITOR
May 2011
3. Urban and rural food price trends: April 2010 – April 2011
This section reports the price trends for 65 different food items sold in urban areas across South Africa, and 39 food items sold in
rural areas. Detailed price data on selected food items in urban and rural areas are presented in Appendix A and Appendix B
respectively. Price changes are reported between January 2010 and April 2011, as well as on a year-on-year basis.
Appendix C ranks the food items included in this report in the urban and rural areas according to the inflation experienced. The
food products highlighted in Table C.1 and Table C.2 are those with annual inflation that exceeded the South African Reserve
Bank’s 6 % inflation target. Food items in urban areas with annual inflation higher than 6 % were the following: medium fat spread
1kg tub (6.23 %), loaf of white bread 700g (6.61 %), instant coffee 750g (7.71 %), white sugar 2.5kg (9.88 %), cake flour 2.5kg
(14.99 %), brick margarine 500g (15.93, %), sunflower oil 750ml (29.50 %), beef mince - fresh per kg (8.54 %), beef chuck - fresh
per kg (11.53 %), beef rump steak -fresh per kg (11.74 %), beef T-bone - fresh per kg (13.88 %), beef brisket - fresh per kg
(14.56 %), lamb - fresh per kg (17.86 %), baked beans - tinned 420g (9.56 %), cauliflower - fresh per kg (10.81 %), sweet
potatoes - fresh per kg (11.05 %), cabbage - fresh per kg (12.06 %), lettuce - fresh per kg (14.12 %), canned peas 410g
(17.16 %), apples - fresh per kg (18.39 %). Food items in rural areas with annual inflation higher than 6 % were the following:
sorghum-meal 500g (6.07 %), sorghum-meal 1kg (6.43 %), loaf of brown bread 700g (6.53 %), margarine 500g (6.87 %),
margarine 125g (7.67 %), loaf of white bread 600g (7.74 %), margarine 250g (11.53 %), maize meal 1kg (12.35 %), sunflower oil
750ml (13.19 %), sunflower oil 500ml (23.70 %), sunflower oil 2l (30.33 %), white sugar 2.5kg (6.49 %), butter beans 420g
(6.49 %), butter beans 410g (15.50 %) and tagless tea bags 250g (16.17 %)
A closer look at food price trends:
As reported in the previous Food Price Monitor of February 2011, agricultural commodities continued to show significant price
increases. The international price of wheat (US No.2, Hard Red Winter ord. Prot, US Fob Gulf) increased by 79.52 % and the
domestic price of wheat increased by 42.81 % from April 2010 to April 2011. At the retail level, urban consumers paid R 7.30 for
a 700g loaf of brown bread and R 8.23 for a loaf of 700g white bread during April 2011, a 4.29 % and 6.61 % increase
respectively compared to April 2010. The real farm to retail price spread for brown bread was R 6.15 and for white bread R 6.40
during April 2011.
The international price of yellow maize (US No.2, Yellow, U.S. Gulf) increased by 101.76 % from April 2010 to April 2011. During
the same period, the price of domestic yellow maize increased by 42.71 %. The domestic price of yellow maize traded on average
at R 1 650.28 per ton during April 2011 and still below the export parity price of R 1 797.56. The domestic white maize price
increased by 47.30 % compared to April 2010. At the retail level urban consumers paid 2.99 % more for a super maize meal
(5kg) and 7.49 % less for special maize meal (5kg) in April 2011 than during April 2010.
The sunflower seed price traded significantly lower in April 2011 at R 3 959.39/ton compared to the price reported in the previous
food price monitor, R 4 918.19/ton. On an annual basis the price of sunflower seed increased by 58.01 % from April 2010 to
April 2011. The increase in the sunflower seed price has also filtered through to the retail level. Sunflower cooking oil prices
showed the largest price increases of all retail food products reported on in both urban and rural areas. In urban areas, the price of
sunflower cooking oil (750 ml) increased by 29.5 %, and the price of sunflower cooking oil (2l) in rural areas increased by 30.33 %.
4
QUARTERLY FOOD PRICE MONITOR
May 2011
Domestic producer prices of beef and lamb continued with its decreasing trend after peaking during the end of 2010/beginning
2011. On an annual basis, however, the producer price of beef for class A2/A3, B2/B3 and C2/C3 increased by 5.01 %, 8.72 %
and 13.31 % respectively from April 2010 to April 2011. The producer price of lamb increased by 12.42 % for class A2/A3,
21.23 % for class B2/B3 and 21.39 % for class C2/C3 from April 2010 to April 2011. The annual increase in retail prices of beef
cuts ranged from 8.54 % for beef mince-fresh per kg to 14.56 % for beef brisket-fresh per kg. Lamb-fresh per kg showed an
annual price increase from April 2010 of 17.86 % at retail level.
The producer price for whole chicken frozen showed a significant increase of 11.63 % on an annual basis from April 2010, and
during the same period the producer price of fresh whole chicken per kg increased by 1.10 %. Retail price increases for frozen
and fresh whole chicken and chicken portions did not show significant changes compared to the previous year. The producer
price for pork baconer increased by 5.88 % while the producer price of pork porker decreased by 2.50 % and the retail price of
pork chops-fresh per kg increased by only 0.6 % annually from April 2010.
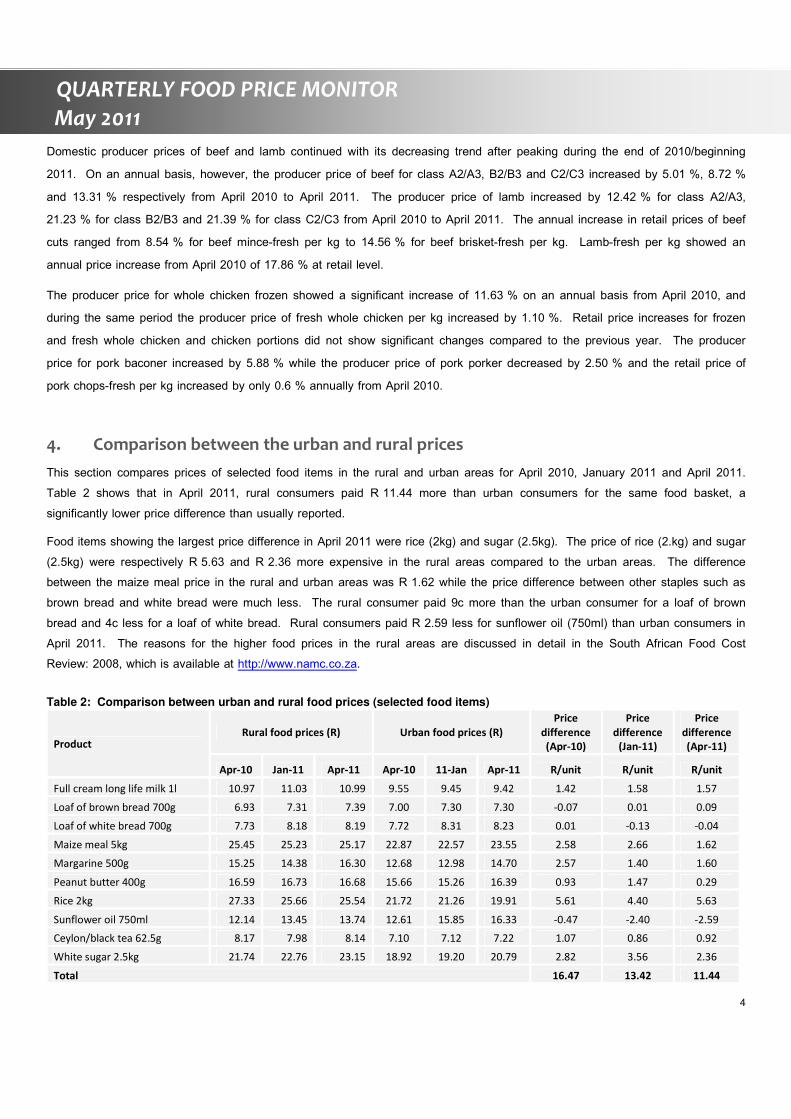
4. Comparison between the urban and rural prices
This section compares prices of selected food items in the rural and urban areas for April 2010, January 2011 and April 2011.
Table 2 shows that in April 2011, rural consumers paid R 11.44 more than urban consumers for the same food basket, a
significantly lower price difference than usually reported.
Food items showing the largest price difference in April 2011 were rice (2kg) and sugar (2.5kg). The price of rice (2.kg) and sugar
(2.5kg) were respectively R 5.63 and R 2.36 more expensive in the rural areas compared to the urban areas. The difference
between the maize meal price in the rural and urban areas was R 1.62 while the price difference between other staples such as
brown bread and white bread were much less. The rural consumer paid 9c more than the urban consumer for a loaf of brown
bread and 4c less for a loaf of white bread. Rural consumers paid R 2.59 less for sunflower oil (750ml) than urban consumers in
April 2011. The reasons for the higher food prices in the rural areas are discussed in detail in the South African Food Cost
Review: 2008, which is available at http://www.namc.co.za.
Table 2: Comparison between urban and rural food prices (selected food items)
Product Rural food prices (R) Urban food prices (R)
Price
difference
(Apr-10)
Price
difference
(Jan-11)
Price
difference
(Apr-11)
Apr-10 Jan-11 Apr-11 Apr-10 11-Jan Apr-11 R/unit R/unit R/unit
Full cream long life milk 1l 10.97 11.03 10.99 9.55 9.45 9.42 1.42 1.58 1.57
Loaf of brown bread 700g 6.93 7.31 7.39 7.00 7.30 7.30 -0.07 0.01 0.09
Loaf of white bread 700g 7.73 8.18 8.19 7.72 8.31 8.23 0.01 -0.13 -0.04
Maize meal 5kg 25.45 25.23 25.17 22.87 22.57 23.55 2.58 2.66 1.62
Margarine 500g 15.25 14.38 16.30 12.68 12.98 14.70 2.57 1.40 1.60
Peanut butter 400g 16.59 16.73 16.68 15.66 15.26 16.39 0.93 1.47 0.29
Rice 2kg 27.33 25.66 25.54 21.72 21.26 19.91 5.61 4.40 5.63
Sunflower oil 750ml 12.14 13.45 13.74 12.61 15.85 16.33 -0.47 -2.40 -2.59
Ceylon/black tea 62.5g 8.17 7.98 8.14 7.10 7.12 7.22 1.07 0.86 0.92
White sugar 2.5kg 21.74 22.76 23.15 18.92 19.20 20.79 2.82 3.56 2.36
Total 16.47 13.42 11.44

5
QUARTERLY FOOD PRICE MONITOR
May 2011
5. Price trends (week 4 of each month)
Prices normally cited in the FPM are obtained from Stats SA and AC Nielsen (see Appendix F for more detail on how the prices
are collected). An important issue to note is that Stats SA and AC Nielsen do their price collection during the first three weeks of
the month. During the fourth week of each month, retailers usually have specials on various items they sell, which is why prices
are not collected during Week 4. In an effort to include food price trends during Week 4 for six retail chains, data was obtained
from Adcheck. Table 3 shows the annual percentage change in the prices of selected food items during Week 4 at the different
retailers. The average price change of all retailers shows the largest increase in the price of cooking oil. On average, the price of
cooking oil increased by 39.99 %, continuing the increasing trend. The Food Price Monitor reported in February 2011 that the
price of the cheapest cooking oil increased by 35.71 %. Other price increases were seen in the price of meat products, such as
frozen whole chicken, which increased by 24.70 % from April 2010 to April 2011. The price of lamb chops increased by 16.17 %
and the price of boerewors increased by 11.52 % from April 2010 to April 2011. Bread prices also increased from April 2010 to
April 2011; the price of the cheapest sliced white bread increased by 10.01 % and the price of the cheapest sliced brown bread
increased by 3.39 %. The maize meal price (5kg) decreased by 0.21 % during the same period. For the period under review,
price decreases were seen for rice, which decreased by 14.56 %, and the cheapest 1l milk sachet, by 2.19 %.
Table 3: April 2010 to April 2011 inflation of selected food items for various retailers (in %).
Retailer A Retailer B Retailer C Retailer D Retailer E
Retailers
average
Cheapest bread brown unsliced 700g 0.53 11.45 -4.14 3.97 5.15 3.39
Cheapest bread white sliced standard 700g 5.45 -2.31 14.21 23.57 9.12 10.01
Cheapest maize meal 5kg -2.68 1.53 4.45 -2.88 -1.49 -0.21
Rice 2kg -16.16 -15.05 -23.45 -24.37 6.24 -14.56
Cheapest cooking oil 750ml 33.59 39.92 43.26 37.29 45.88 39.99
Cheapest milk sachet 1l 0.64 -0.36 -4.51 -5.57 -1.14 -2.19
Cheapest milk long life full cream UHT 1l 0.68 4.30 7.23 -6.31 -3.33 0.52
Cheapest chicken frozen whole per kg 31.60 22.82
20.23 24.70
Cheapest boerewors per kg -2.32 13.34 32.84 -0.35 14.09 11.52
Pork loin chops per kg 14.34 6.98 7.08 -6.59 0.25 4.41
Lamb shoulder/braai chops per kg 17.23 20.35 9.43 19.40 14.43 16.17
Source: Adcheck, 2011
6. International Food Prices
The Food and Agricultural Organization (FAO) of the United Nations publishes their global food price index on a monthly basis.
The food price index consists of five commodity group price indices, namely the meat price index, dairy price index, cereals price
index, oils price index and the sugar price index. These indices are weighted with the average export shares of each of the
groups for 2002–2004. In total, 55 commodity quotations, considered by FAO commodity specialists as representing the
international prices of the food commodities noted, are included in the overall index. Figure 3 shows the overall food price index
and the price indices for five food categories.

6
QUARTERLY FOOD PRICE MONITOR
May 2011
Figure 3: International food price index and price indices for five food categories Source: FAO, 2011
The Food Price Monitor of February 2011 reported that the overall food price index increased by 33 % from January 2010 to
January 2011, reaching its highest level since January 2008. During February 2011, the overall food price index reached its peak
of 237.2 index points. In March, the food price index decreased for the first time in 8 months. From March to April, the food price
index showed a slight increase again and reached 232.1 index points (See figure 3).
Compared to the price indices of April 2010, the meat price index of April 2011 increased by 27.94 %, reaching its highest level to
date. On an annual basis, the price index of cereals showed the largest increase of 71.21 %, the oil price index increased by
49.35 % and the sugar price index increased by 49 % to April 2011. The dairy price index increased by 11.97 % from April 2010
to April 2011.
7. Estimated impact of food inflation on consumers
The purpose of this section is to illustrate the impact of food inflation on consumers. The analysis presented in the first part of this
section is based on the cost of a basic food basket1 (as compiled by the Food Price Monitoring Committee in 2003), based on
monthly average food price data for the period April 2010 to April 2011. From April 2010 to April 2011, the cost of this basic food
basket increased by about R 12.28 (+3.3 %) in nominal terms.
The cost of this food basket, expressed as a share of the average monthly income2 of the poorest 30 % of the population,
increased from 33.0 % in April 2010 to 34.1 % in April 2011, representing the second highest share during this analysis period
(34.3 % for March 2011 being the highest). The cost of the food basket, expressed as a share of the average monthly income of
the wealthiest 30 % of the population, increased slightly from 2.6 % to 2.7 %.
1 Composition of food basket: loaf of white bread (700g), loaf of brown bread (700g), super maize meal (5kg), special maize meal (5kg), rice (2kg),
tinned butter beans (410g), onions (1kg), cabbage (1kg), potatoes (1kg), tomatoes (1kg), apples (1kg), bananas (1kg), orange (1kg), whole fresh chicken, stewing beef, long life full cream milk (1L), extra large eggs (1.5 dozen), sunflower oil (750ml), brick margarine (500g), peanut butter (400g), instant coffee regular (750g) and black / Ceylon tea - tagless tea bags (62.5g) and canned tuna (replacing canned pilchards due to data limitations). 2 The cost of the typical food basket was expressed as a share of estimated average monthly income of Income Deciles 1 to 3, the poorest 30% of the
population, as calculated from the STATSSA survey: ‘Income & Expenditure of households 2005/2006’ (calculations excludes imputed rent on owned dwelling)
120
140
160
180
200
220
240
Jan Feb Mar Apr May Jun Jul Aug Sep Oct Nov Dec
Ind
ex
(20
02
-2
00
4 =
10
0)
2008 2009 2010 2011
100
150
200
250
300
350
400
450
1/2
01
0
2/2
01
0
3/2
01
0
4/2
01
0
5/2
01
0
6/2
01
0
7/2
01
0
8/2
01
0
9/2
01
0
10
/20
10
11
/20
10
12
/20
10
1/2
01
1
2/2
01
1
3/2
01
1
4/2
01
1
Ind
ex
(20
02
-20
04
=1
00
)
Meat Price Index Dairy Price Index
Cereals Price Index Oils Price Index
Sugar Price Index

7
QUARTERLY FOOD PRICE MONITOR
May 2011
Figure 4: The monthly cost of a typical consumer food basket for the period April 2010 to April 2011, expressed in nominal
terms and as share of the average income of the poorest 30 % of households (Income Deciles [ID] 1 to 3) and the wealthiest 30 % of households (ID 8 to 10).
To further explore the impact of inflation on consumers, Figure 5 presents an illustration of the average annual nominal cost of
specific food groups within the basic food basket, for the period April 2010 to April 2011. As could be expected, Figure 5 illustrates
the dominance of animal protein foods, as well as breads and cereals within the cost of the basic food basket. Comparing April
2010 to April 2011, six of the eight food groups within this particular food basket experienced inflation: animal protein, coffee/tea,
vegetables, fruit, bean products and fats/oils. The various food groups within this food basket are discussed in more detail below.
Animal protein:
Animal protein foods in this food basket experienced inflation of 5.9 %, which was mainly driven by inflation on stewing beef
(above 10 %) and to a lesser degree inflation on chicken (around 1 %) – representing two important protein sources for
households in South Africa.
Bread and cereals:
The prices of staple food products within this food basket deflated by 2.2 % from April 2010 to April 2011. However, it is
noteworthy that even though super maize meal and rice prices deflated significantly, high inflation rates were observed for brown
and white bread (4.3 % and 6.6 % respectively).
Vegetables and fruit:
The prices of vegetables within this food basket inflated by 2.1 % during the period, with significant price inflation for cabbage
(12.1 %) but slight deflation for onions, potatoes and tomatoes. From April 2010 to April 2011, the fruit products in this basket
experienced inflation of 5.2 %, mainly driven by high inflation for apples (18.4 %) and bananas (4.8 %), while the price of oranges
deflated by 10.4 %.
0%
5%
10%
15%
20%
25%
30%
35%
40%
0
50
100
150
200
250
300
350
400
Ap
r-1
0
Ma
y-1
0
Jun
-10
Jul-
10
Au
g-1
0
Sep
-10
Oct
-10
No
v-1
0
De
s-1
0
Jan
-11
Feb
-11
Ma
r-1
1
Ap
r-1
1
Est
ima
ted
sh
are
of
inco
me
(%
)
No
min
al f
oo
d b
ask
et
cost
(R
)
Total nominal basket cost Share of income ID1-3 Share of income ID8-10

8
QUARTERLY FOOD PRICE MONITOR
May 2011
Dairy and eggs:
Full cream milk within this food basket experience price deflation of 2.7 % during the analysis period, while price inflation on a 1.5
dozen packet of eggs was 4.2 %.
Other product categories:
Bean products, hot beverages (coffee/tea) and fats/oils experienced price inflation when comparing April 2010 to April 2011 (2.4 %,
1.7 % and 22.7 % respectively).
Thus, when comparing April 2010 to April 2011, the significant price inflation experienced for important products such as bread,
selected fruit, selected vegetables and stewing beef could have a negative impact on household food security in South Africa,
affecting the affordability of an important staple food as well as food items making a major contribution to dietary diversity.
Figure 5: Nominal monthly cost of specific food groups within the basic food basket, comparing April 2010 and April 2011 The impact of inflation on very poor consumers is further explored below, based on the typical portion sizes of very poor
consumers of the five most widely consumed food items in South Africa, represented by maize porridge, brown bread, sugar, tea
and full cream milk (National Food Consumption Survey, Steyn & Labadarios, 20003; Oldewage-Theron et al., 2005
4). Figure 3
illustrates the estimated portion costs for these foods, calculated from monthly food price data for April 2010 and April 2011.
Similar to other Food Price Monitor analysis periods, the significant cost contribution of maize meal and bread to the typical basic
daily food selection for poor consumers is emphasised by the results in Figure 6. Furthermore, despite the relatively low actual
food weight contribution of bread to this ‘food plate’, the bread component costs significantly more than the maize porridge
component. When comparing the costs associated with the typical portion sizes of very poor consumers for the five most widely
consumed food items in South Africa, based on April 2011 versus April 2010 prices, the results in Figure 6 indicated inflation of
3 Steyn NP, Labadarios D. National Food Consumption Survey: Children aged 1–9 years, South Africa, 1999. Cape Town: The Department of Health
Directorate Nutrition, 2000 4 Oldewage-Theron W, Dicks E, Napier C, et al. Situation analysis of an informal settlement in the Vaal Triangle. Development Southern Africa 2005 ; 22
(1): 13-26
0
10
20
30
40
50
60
70
80
90
100
An
ima
l
pro
tein
Bre
ad
&
Ce
rea
ls
Co
ffe
e &
Te
a
Ve
ge
tab
les
Da
iry
& E
gg
s
Fru
it
Be
an
pro
du
cts
Fats
& O
ils
No
min
al c
ost
of
foo
d g
rou
ps
in b
asi
c fo
od
ba
ske
t (R
)
Apr-10 Apr-11
5.9 % 1.7 % 2.1 % -2.4 % 5.2 % 2.4 % 22.7 % -2.2 %

9
QUARTERLY FOOD PRICE MONITOR
May 2011
about 2.5 % (from R 3.07 to R 3.15 for the selection of portions). This was in particular due to inflation in the prices of brown
bread, milk and tea, which was partly offset by price deflation for maize meal.
Figure 6: Average nominal cost for the typical portions of the five food items most widely consumed by very poor consumers
in South Africa, for April 2010 and April 2011
8. June 2011 – August 2011 Outlook
Weather events have been playing havoc on world commodity markets since 2010. The impact of the severe drought in Russia
induced the first rally of world commodity markets in the second half of 2010; adverse weather events across the world have
continued to influence markets. Increasing concerns that this year’s crops in the northern hemisphere will turn out smaller than
expected has sparked a next crop scare rally in recent weeks. Due to excessive rains, US plantings of maize are severely delayed
in several regions and it is becoming increasingly likely that grain planting intentions will not be fully accomplished. In order to
replenish the dwindling world stock levels of maize, it is crucial for the US to produce a larger maize crop, which is becoming less
likely every week as plantings are delayed. Although some farmers could switch to soybeans, their plantings are also likely to be
delayed beyond the optimal planting dates. This has resulted in US maize futures increasing to all-time record highs in early April,
followed by a sharp run in basically all other grain and oilseed prices.
It is likely that world prices will experience some setbacks from record highs over the next month as profit taking on speculative
positions takes place. However, the bottom line is that world grain and oilseed markets are very high and there is significant
fundamental support to maintain the range where markets are currently trading over the next three months. The demand for
feedstock in biofuel plants and the demand for animal feed are growing, which provides further support for prices. Tight stock
levels will result is much higher volatility of soft commodity prices over the outlook period, which will drive the local soft commodity
markets as most commodity prices are either trading at import parity or export parity levels.
The consumer price index for food and non-alcoholic beverages of 4.8 % is in the range of 4-5 % that was predicted in the
previous FPM. The slight decline from the previous month’s inflation rate was mainly driven by lower fruit, vegetable and meat
prices. Fruit prices remain under pressure from the strong exchange rate, and the extremely soft potato prices have a bearish
impact on the prices of vegetable crops. Meat prices have entered the typical cyclical trend of lower prices during winter time and it
is anticipated that meat prices will trade slightly softer during the outlook period. The prices of oils and fats will likely trade
sideways over the next three months as most of the increases in raw materials have been passed through. However, bread and
R 0.00
R 0.50
R 1.00
R 1.50
R 2.00
R 2.50
R 3.00
R 3.50
Apr-10 Apr-11
Po
rtio
n c
ost
(R
)
White sugar (22g)
Tea (2.5g)
Full cream milk
(56g)
Brown bread
(150g)
Maize porridge
cooked (532g)

10
QUARTERLY FOOD PRICE MONITOR
May 2011
maize meal prices could increase by more than in the recent past due to higher maize and wheat prices. Local maize prices are
finding support in much higher export levels as traders manage to secure major deep-sea export agreements on the back of a
local maize price that has been, and still is trading well below export parity levels.
In terms of food price volatility, the period June – August is typically seen as your “most stable” period where much of the volatility
on soft commodity markets is absorbed by the chain. This does not imply that food prices will not rise in the months to come.
There are still a number of inflationary trends within the value chain that have not been passed through fully, especially higher
energy prices.

11
QUARTERLY FOOD PRICE MONITOR
May 2011
APPENDIX A: DATA ON URBAN FOOD PRICE TRENDS
Table A.1: Wheat products
Wheat Products Price level Percentage change
Apr-10 Jan-11 Apr-11 Jan-11 to Apr-11 Apr-10 to Apr-11
Loaf of brown bread 700g 7.00 7.30 7.30 0.00% 4.29%
Loaf of white bread 700g 7.72 8.31 8.23 -0.96% 6.61%
Cake flour 2.5kg 15.74 17.11 18.10 5.79% 14.99%
Spaghetti 500g 10.16 9.19 9.46 2.94% -6.89%
Macaroni plain 500g* 7.71 8.11 7.93 -2.25% 2.81%
Average
1.10% 4.36%
Wheat (R/ton) 2165.11 2964.33 3091.83 4% 43%
Table A.2: Maize products
Maize Products Price level Percentage change
Apr-10 Jan-11 Apr-11 Jan-11 to Apr-11 Apr-10 to Apr-11
Maize special 5kg* 18.01 16.11 16.66 3.38% -7.49%
Maize super 5kg* 22.45 22.83 23.12 1.29% 2.99%
Average
2.34% -2.25%
White Maize (R/ton) 1103.26 1354.43 1625.06 20% 47%
*Data from AC Nielsen
Table A.3: Sunflower products
Sunflower products Price level Percentage change
Apr-10 Jan-11 Apr-11 Jan-11 to Apr-11 Apr-10 to Apr-11
Sunflower oil 750ml 12.61 15.85 16.33 3.03% 29.50%
Medium fat spread 1kg tub* 19.43 20.94 20.64 -1.44% 6.23%
Brick margarine 500g 12.68 12.98 14.70 13.25% 15.93%
Average
4.95% 17.22%
Sunflower (R/ton) 3155.85 4918.19 3959.39 -19% 25%
*Data from AC Nielsen

12
QUARTERLY FOOD PRICE MONITOR
May 2011
Table A.4: Processed vegetables
Processed Vegetables Price level Percentage change
Apr-10 Jan-11 Apr-11 Jan-11 to Apr-11 Apr-10 to Apr-11
Baked beans - tinned 420g 7.53 7.88 8.25 4.70% 9.56%
Butter beans - tinned 410g 10.89 10.69 10.79 0.94% -0.92%
Chopped peeled tomato 410g* 10.71 11.07 11.11 0.39% 3.76%
Tomato & onion mix 410g* 7.99 8.49 7.96 -6.32% -0.46%
Canned peas 410g* 6.79 7.74 7.96 2.78% 17.16%
Baby carrots 1kg* 31.37 31.03 30.88 -0.47% -1.56%
Green peas 1kg* 23.65 27.74 24.99 -9.93% 5.64%
Sliced beans 1kg* 29.32 30.44 26.22 -13.88% -10.59%
Super juicy corn 1kg* 29.14 30.30 28.19 -6.98% -3.26%
Average -3.20% 2.15%
*Data from AC Nielsen
Table A.5: Fresh vegetables
Fresh Vegetables Price level Percentage change
Apr-10 Jan-11 Apr-11 Jan-11 to Apr-11 Apr-10 to Apr-11
Carrots - fresh per kg 11.37 10.82 11.79 8.96% 3.69%
Onions - fresh per kg 7.65 7.45 7.62 2.28% -0.39%
Potatoes - fresh per kg 8.91 8.55 8.84 3.39% -0.79%
Tomatoes - fresh per kg 12.84 12.98 12.81 -1.31% -0.23%
Sweet potatoes - fresh per kg 9.50 10.76 10.55 -1.95% 11.05%
Cabbages - fresh per kg 7.46 7.61 8.36 9.86% 12.06%
Lettuces - fresh per kg 22.67 22.84 25.87 13.27% 14.12%
Pumpkins - fresh per kg 10.06 9.67 9.27 -4.14% -7.85%
Cauliflowers - fresh per kg 26.91 26.15 29.82 14.03% 10.81%
Average
4.93% 4.72%
Table A.6: Processed meat
Processed meat
Price level Percentage change
Apr-10 Jan-11 Apr-11 Jan-11 to Apr-11 Apr-10 to Apr-11
Meatballs in gravy 400g* 13.31 13.55 13.31 -1.76% -0.01%
Picnic ham 300g* 25.93 26.66 26.94 1.06% 3.90%
Pork sausage per kg 53.50 53.79 53.58 -0.39% 0.15%
Polony per kg 25.90 27.65 26.77 -3.18% 3.36%
Average -1.07% 1.85%
*Data from AC Nielsen

13
QUARTERLY FOOD PRICE MONITOR
May 2011
Table A.7: Unprocessed meat
Unprocessed meat
Price level Percentage change
Apr-10 Jan-11 Apr-11 Jan-11 to Apr-11 Apr-10 to Apr-11
Pork chops - Fresh per kg 50.13 50.40 50.43 0.06% 0.60%
Lamb - fresh per kg 72.50 85.44 85.45 0.01% 17.86%
Beef brisket - fresh per kg 45.40 49.61 52.01 4.84% 14.56%
Beef chuck - fresh per kg 47.35 51.16 52.81 3.23% 11.53%
Beef mince - fresh per kg 48.38 49.60 52.51 5.87% 8.54%
Beef rump steak - fresh per kg 76.52 80.39 85.50 6.36% 11.74%
Beef T-bone - fresh per kg 60.39 64.80 68.77 6.13% 13.88%
Whole chicken - fresh per kg 28.67 30.00 28.78 -4.07% 0.38%
Whole chicken - frozen per kg 24.42 25.45 24.73 -2.83% 1.27%
Chicken portions - fresh per kg 37.54 37.73 38.28 1.46% 1.97%
Chicken portions - frozen per kg 22.19 22.75 21.75 -4.40% -1.98%
Average
1.51% 7.30%
Table A.8: Dairy products
Dairy Price level Percentage change
Apr-10 Jan-11 Apr-11 Jan-11 to Apr-11 Apr-10 to Apr-11
Fresh milk full cream 1l sachet* 7.08 6.28 6.61 5.19% -6.66%
Fresh milk full cream 2l* 15.64 14.21 14.83 4.36% -5.19%
Fresh milk low fat 1l sachet* 6.92 5.91 6.41 8.47% -7.34%
Fresh milk low fat 2l* 16.16 14.61 15.54 6.37% -3.85%
Long life milk full cream 1l* 9.09 9.42 9.34 -0.91% 2.68%
Skimmed powder milk 1kg* 56.45 55.15 59.03 7.04% 4.57%
Total butter 500g* 25.61 26.18 26.09 -0.34% 1.87%
Cheddar cheese per kg 86.34 87.99 85.61 -2.70% -0.85%
Average
3.44% -1.84%
*Data from AC Nielsen
Table A.9: Fruits
Fruits Price level Percentage change
Apr-10 Jan-11 Apr-11 Jan-11 to Apr-11 Apr-10 to Apr-11
Apples - fresh per kg 12.02 14.35 14.23 -0.84% 18.39%
Bananas - fresh per kg 10.41 10.36 10.91 5.31% 4.80%
Oranges - fresh per kg 9.77 8.79 8.75 -0.46% -10.44%
Average
1.34% 4.25%

14
QUARTERLY FOOD PRICE MONITOR
May 2011
Table A.10: Fish products
Fishes - tinned Price level Percentage change
Apr-10 Jan-11 Apr-11 Jan-11 to Apr-11 Apr-10 to Apr-11
Fish (excl tuna) - tinned 155g 6.39 6.17 6.26 1.46% -2.03%
Fish (excl tuna) - tinned 425g 12.32 11.44 11.18 -2.27% -9.25%
Tuna - tinned 170g 10.19 10.10 9.52 -5.74% -6.58%
Average
-2.19% -5.95%
Table A.11: Other products
Other products Price level Percentage change
Apr-10 Jan-11 Apr-11 Jan-11 to Apr-11 Apr-10 to Apr-11
King Korn 1kg* 10.08 10.12 10.13 0.08% 0.50%
White sugar 2.5kg 18.92 19.20 20.79 8.28% 9.88%
Rice 2kg 21.72 21.26 19.91 -6.35% -8.33%
Instant coffee regular 750g* 48.98 49.62 52.76 6.34% 7.71%
Ceylon/black tea 62.5g 7.10 7.12 7.22 1.40% 1.69%
Peanut butter 400g 15.66 15.26 16.39 7.40% 4.66%
Soya mince tomato & onion 200g* 8.53 8.57 8.60 0.30% 0.81%
Eggs 1.5 dozen 25.70 24.71 24.61 -0.40% -4.24%
Average 2.13% 1.59%
*Data from AC Nielsen
15
QUARTERLY FOOD PRICE MONITOR
May 2011
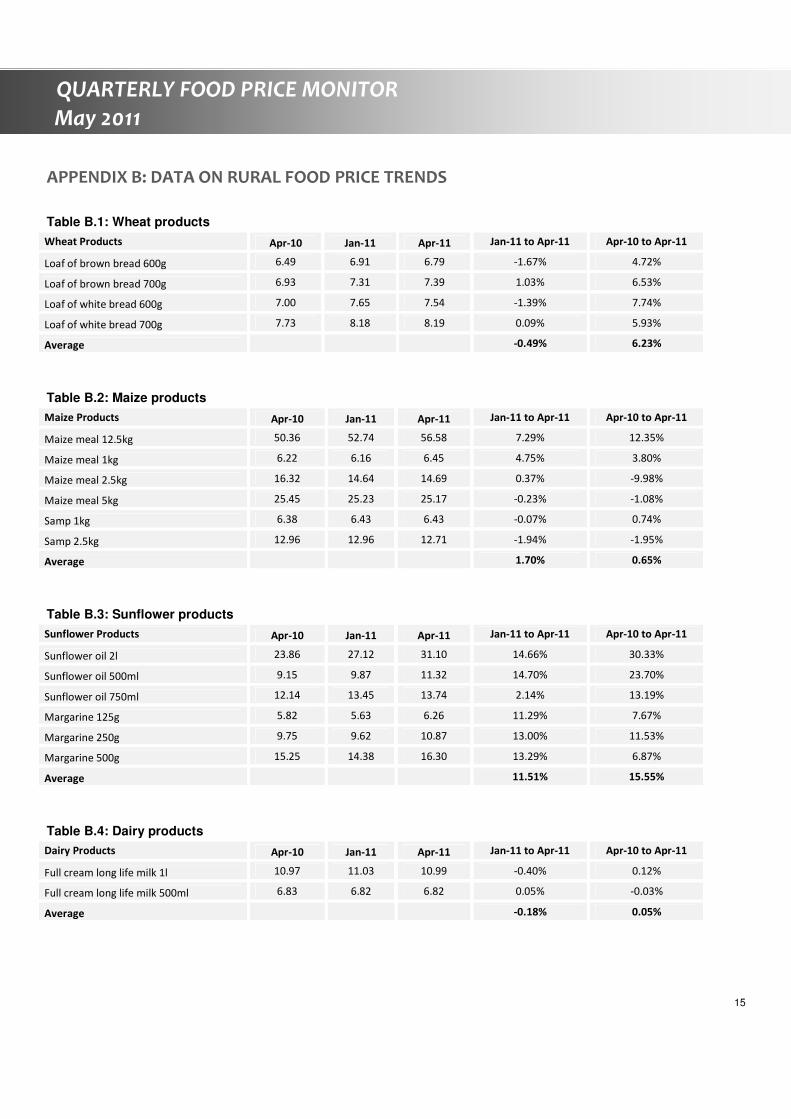
APPENDIX B: DATA ON RURAL FOOD PRICE TRENDS
Table B.1: Wheat products
Wheat Products Apr-10 Jan-11 Apr-11 Jan-11 to Apr-11 Apr-10 to Apr-11
Loaf of brown bread 600g 6.49 6.91 6.79 -1.67% 4.72%
Loaf of brown bread 700g 6.93 7.31 7.39 1.03% 6.53%
Loaf of white bread 600g 7.00 7.65 7.54 -1.39% 7.74%
Loaf of white bread 700g 7.73 8.18 8.19 0.09% 5.93%
Average
-0.49% 6.23%
Table B.2: Maize products
Maize Products Apr-10 Jan-11 Apr-11 Jan-11 to Apr-11 Apr-10 to Apr-11
Maize meal 12.5kg 50.36 52.74 56.58 7.29% 12.35%
Maize meal 1kg 6.22 6.16 6.45 4.75% 3.80%
Maize meal 2.5kg 16.32 14.64 14.69 0.37% -9.98%
Maize meal 5kg 25.45 25.23 25.17 -0.23% -1.08%
Samp 1kg 6.38 6.43 6.43 -0.07% 0.74%
Samp 2.5kg 12.96 12.96 12.71 -1.94% -1.95%
Average
1.70% 0.65%
Table B.3: Sunflower products
Sunflower Products Apr-10 Jan-11 Apr-11 Jan-11 to Apr-11 Apr-10 to Apr-11
Sunflower oil 2l 23.86 27.12 31.10 14.66% 30.33%
Sunflower oil 500ml 9.15 9.87 11.32 14.70% 23.70%
Sunflower oil 750ml 12.14 13.45 13.74 2.14% 13.19%
Margarine 125g 5.82 5.63 6.26 11.29% 7.67%
Margarine 250g 9.75 9.62 10.87 13.00% 11.53%
Margarine 500g 15.25 14.38 16.30 13.29% 6.87%
Average
11.51% 15.55%
Table B.4: Dairy products
Dairy Products Apr-10 Jan-11 Apr-11 Jan-11 to Apr-11 Apr-10 to Apr-11
Full cream long life milk 1l 10.97 11.03 10.99 -0.40% 0.12%
Full cream long life milk 500ml 6.83 6.82 6.82 0.05% -0.03%
Average
-0.18% 0.05%
16
QUARTERLY FOOD PRICE MONITOR
May 2011
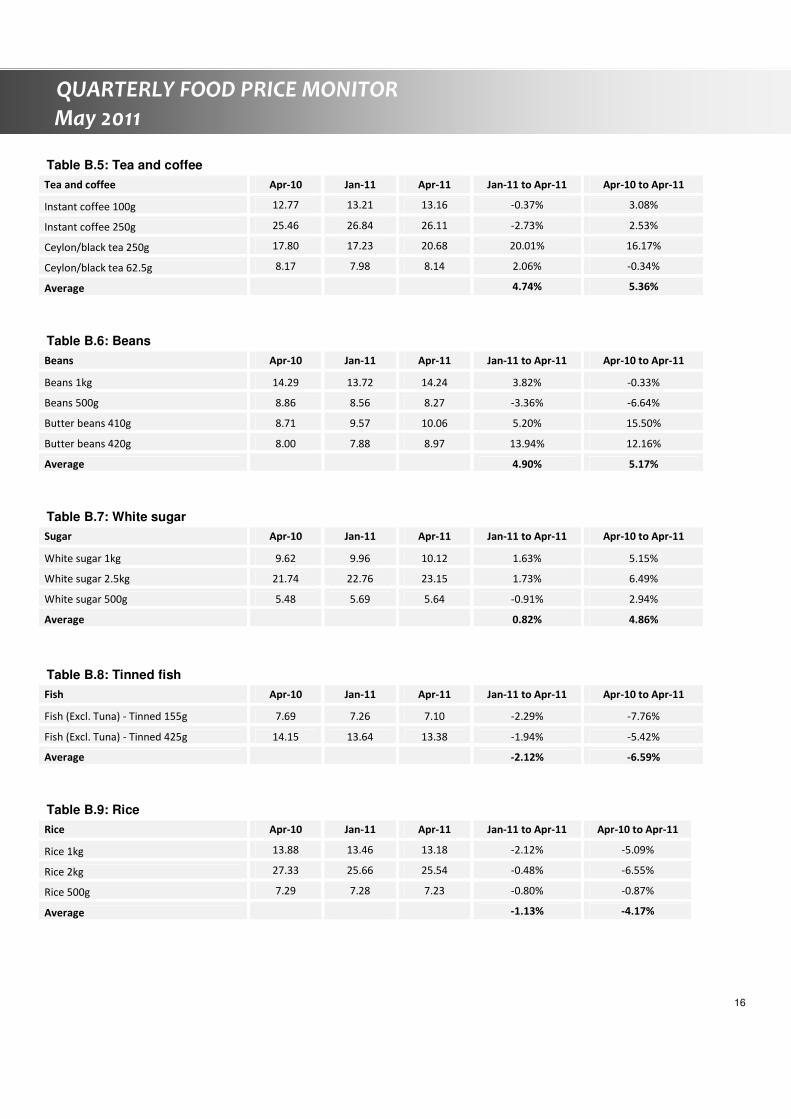
Table B.5: Tea and coffee
Tea and coffee Apr-10 Jan-11 Apr-11 Jan-11 to Apr-11 Apr-10 to Apr-11
Instant coffee 100g 12.77 13.21 13.16 -0.37% 3.08%
Instant coffee 250g 25.46 26.84 26.11 -2.73% 2.53%
Ceylon/black tea 250g 17.80 17.23 20.68 20.01% 16.17%
Ceylon/black tea 62.5g 8.17 7.98 8.14 2.06% -0.34%
Average
4.74% 5.36%
Table B.6: Beans
Beans Apr-10 Jan-11 Apr-11 Jan-11 to Apr-11 Apr-10 to Apr-11
Beans 1kg 14.29 13.72 14.24 3.82% -0.33%
Beans 500g 8.86 8.56 8.27 -3.36% -6.64%
Butter beans 410g 8.71 9.57 10.06 5.20% 15.50%
Butter beans 420g 8.00 7.88 8.97 13.94% 12.16%
Average
4.90% 5.17%
Table B.7: White sugar
Sugar Apr-10 Jan-11 Apr-11 Jan-11 to Apr-11 Apr-10 to Apr-11
White sugar 1kg 9.62 9.96 10.12 1.63% 5.15%
White sugar 2.5kg 21.74 22.76 23.15 1.73% 6.49%
White sugar 500g 5.48 5.69 5.64 -0.91% 2.94%
Average
0.82% 4.86%
Table B.8: Tinned fish
Fish Apr-10 Jan-11 Apr-11 Jan-11 to Apr-11 Apr-10 to Apr-11
Fish (Excl. Tuna) - Tinned 155g 7.69 7.26 7.10 -2.29% -7.76%
Fish (Excl. Tuna) - Tinned 425g 14.15 13.64 13.38 -1.94% -5.42%
Average
-2.12% -6.59%
Table B.9: Rice
Rice Apr-10 Jan-11 Apr-11 Jan-11 to Apr-11 Apr-10 to Apr-11
Rice 1kg 13.88 13.46 13.18 -2.12% -5.09%
Rice 2kg 27.33 25.66 25.54 -0.48% -6.55%
Rice 500g 7.29 7.28 7.23 -0.80% -0.87%
Average
-1.13% -4.17%

17
QUARTERLY FOOD PRICE MONITOR
May 2011
Table B.10: Peanut butter
Peanut Butter Apr-10 Jan-11 Apr-11 Jan-11 to Apr-11 Apr-10 to Apr-11
Peanut butter 270g 12.74 12.63 13.03 3.15% 2.28%
Peanut butter 400g 17.03 16.76 17.04 1.69% 0.08%
Peanut butter 410g 14.44 11.93 13.78 15.56% -4.56%
Average
6.80% -0.73%
Table B.11: Sorghum meal
Sorghum Meal Apr-10 Jan-11 Apr-11 Jan-11 to Apr-11 Apr-10 to Apr-11
Sorghum meal 1kg 10.54 10.97 11.22 2.27% 6.43%
Sorghum meal 500g 5.96 6.57 6.32 -3.71% 6.07%
Average
-0.72% 6.25%

18
QUARTERLY FOOD PRICE MONITOR
May 2011
APPENDIX C: SUMMARY OF INFLATION FOR SELECTED FOOD ITEMS BETWEEN APRIL 2010 AND APRIL 2011
Table C.1: Food items in the urban areas ranked according to price changes (April 2010 to April 2011)
Grain and grain products % Meat and meat products and dairy
and dairy products %
Fresh and processed fruits and
vegetables %
Rice 2kg -8.33 Fish (Excl Tuna) - Tinned 425g -9.25 Sliced Beans 1kg* -10.59
Maize Special 5kg* -7.49 Fresh Milk Low Fat 1Lt Sachet* -7.34 Oranges - Fresh per kg -10.44
Spaghetti 500g -6.89 Fresh Milk Full Cream 1Lt Sachet* -6.66 Pumpkin - Fresh per kg -7.85
King Korn 1kg* 0.50 Tuna - Tinned 170g -6.58 Super Juicy Corn 1kg* -3.26
Soya Mince Tomato & Onion 200g* 0.81 Fresh Milk Full Cream 2Lt* -5.19 Baby Carrots 1kg* -1.56
Ceylon/Black Tea 62.5g 1.69 Eggs 1.5 dozen -4.24 Butter Beans - Tinned 410g -0.92
Macaroni Plain 500g* 2.81 Fresh Milk Low Fat 2Lt* -3.85 Potatoes Bag 10 kg -0.79
Maize Super 5kg* 2.99 Fish (Excl Tuna) - Tinned 155g -2.03 Tomato & Onion Mix 410g* -0.46
Loaf of Brown Bread 700g 4.29 Chicken Portions - Frozen per kg -1.98 Onions -Fresh per kg -0.39
Peanut Butter 410g 4.66 Cheddar Cheese per kg -0.85 Tomatoes - Fresh per kg -0.23
Medium Fat Spread 1kg Tub* 6.23 Bull Brand Meatballs in Gravy 400g* -0.01 Carrots - Fresh per kg 3.69
Loaf of White Bread 700g 6.61 Pork Sausage per kg 0.15 Chopped Peeled Tomato 410g* 3.76
Ricoffy Reg 750g* 7.71 Whole Chicken - Fresh per kg 0.38 Bananas - Fresh per kg 4.80
White Sugar 2.5kg 9.88 Pork Chops - Fresh per kg 0.60 Green Peas 1kg* 5.64
Cake Flour 2.5kg 14.99 Whole Chicken - Frozen per kg 1.27 Baked Beans - Tinned 420g 9.56
Brick Margarine 500g 15.93 Total Butter 500g* 1.87 Cauliflower - Fresh per kg 10.81
Sunflower Oil 750ml 29.50 Chicken Portions - Fresh per kg 1.97 Sweet Potatoes - Fresh per kg 11.05
LongLife Milk Full Cream 1Lt* 2.68 Cabbage - Fresh per kg 12.06
Polony per kg 3.36 Lettuce - Fresh per kg 14.12
Enterprise Picnic Ham 300g* 3.90 Canned Peas 410g* 17.16
Skimmed Powder Milk 1kg* 4.57 Apples - Fresh per kg 18.39
Beef Mince - Fresh per kg 8.54
Beef Chuck - Fresh per kg 11.53
Beef Rump Steak -Fresh per kg 11.74
Beef T-Bone - Fresh per kg 13.88
Beef Brisket - Fresh per kg 14.56
Lamb - Fresh per kg 17.86
* AC Nielsen
** Food items highlighted in the table above experienced price increases above the South African Reserve Bank’s inflation target of 6%

19
QUARTERLY FOOD PRICE MONITOR
May 2011
Table C.2: Food items in the rural areas ranked according to price changes (April 2010 to April 2011)
Grain and grain products % Other products %
Maize Meal 2.5kg -9.98 Fish (Excl. Tuna) - Tinned 155g -7.76
Rice 2kg -6.55 Beans 500g -6.64
Rice 1kg -5.09 Fish (Excl. Tuna) - Tinned 425g -5.42
Samp 2.5kg -1.95 Peanut butter 410g -4.56
Maize Meal 5kg -1.08 Tagless Tea Bags 62.5g -0.34
Rice 500g -0.87 Beans 1kg -0.33
Samp 1kg 0.74 Full Cream Long Life Milk 500ml -0.03
Maize Meal 12.5kg 3.80 Peanut Butter 400g 0.08
Loaf of Brown Bread 600g 4.72 Full Cream Long Life Milk 1L 0.12
Loaf of White Bread 700g 5.93 Peanut Butter 270g 2.28
Sorghum-meal 500g 6.07 Instant Coffee 250g 2.53
Sorghum-meal 1kg 6.43 White Sugar 500g 2.94
Loaf of Brown Bread 700g 6.53 Instant Coffee 100g 3.08
Margarine 500g 6.87 White Sugar 1kg 5.15
Margarine 125g 7.67 White Sugar 2.5kg 6.49
Loaf of White Bread 600g 7.74 Butter Beans 420g 12.16
Margarine 250g 11.53 Butter Beans 410g 15.50
Maize Meal 1kg 12.35 Tagless Tea Bags 250g 16.17
Sunflower Oil 750ml 13.19
Sunflower Oil 500ml 23.70
Sunflower Oil 2L 30.33
* Food items highlighted in the table above experienced price increases above the South African Reserve Bank’s inflation target of 6%

20
QUARTERLY FOOD PRICE MONITOR
May 2011
APPENDIX D: COMMODITY AND PRODUCT PRICE TRENDS
D.1 Wheat price trends
Figure D.1: Domestic market price of wheat against global market price Source: FAO and SAFEX
Figure D.2: Import parity, export parity and domestic prices of wheat Source: SAGIS and SAFEX
050100150200250300350400450500
0
500
1000
1500
2000
2500
3000
3500
4000
4500Ja
n-0
8
Ap
r-0
8
Jul-
08
Oct
-08
Jan
-09
Ap
r-0
9
Jul-
09
Oct
-09
Jan
-10
Ap
r-1
0
Jul-
10
Oct
-10
Jan
-11
Ap
r-1
1
Inte
rna
tio
na
l pri
ce (
US$
/to
n)
Do
me
stic
pri
ce (
R/t
on
)
Domestic price of wheat
Wheat (US No.2, Hard Red Winter ord. Prot, US Fob Gulf (Tuesday))
0
1000
2000
3000
4000
5000
6000
Jan
-08
Ma
r-0
8
Ma
y-0
8
Jul-
08
Sep
-08
No
v-0
8
Jan
-09
Ma
r-0
9
Ma
y-0
9
Jul-
09
Sep
-09
No
v-0
9
Jan
-10
Ma
r-1
0
Ma
y-1
0
Jul-
10
Sep
-10
No
v-1
0
Jan
-11
Ma
r-1
1
(R/t
on
)
Domestic price of wheat Import parity price of wheat Export parity price wheat
Between April 2010 and April 2011: International wheat price ↑ 79.52 % Domestic price of wheat ↑ 42.81 %
Domestic wheat price followed the import parity price of wheat closely, because SA is a net importer of wheat. Between April 2010 and April 2011: Wheat import parity price ↑ 30.87 % Wheat export parity price ↑ 66.27 %

21
QUARTERLY FOOD PRICE MONITOR
May 2011
Figure D.3: Domestic market wheat price and bread price trends Source: Stats SA and SAFEX
D.2 Maize price trends
Figure D.4: Domestic market price of maize against global market price Source: FAO and SAFEX
Figure D.5: Import parity, export parity and domestic prices of maize Source: SAFEX and SAGIS
0
500
1000
1500
2000
2500
3000
3500
4000
4500
0
1
2
3
4
5
6
7
8
9
Jan
-08
Ma
r-0
8
Ma
y-0
8
Jul-
08
Sep
-08
No
v-0
8
Jan
-09
Ma
r-0
9
Ma
y-0
9
Jul-
09
Sep
-09
No
v-0
9
Jan
-10
Ma
r-1
0
Ma
y-1
0
Jul-
10
Sep
-10
No
v-1
0
Jan
-11
Ma
r-1
1
Wh
ea
t p
rice
(R
/to
n)
Bre
ad
pri
ce (
R/l
oa
f)
Loaf of brown bread 700g Loaf of white bread 700g
Domestic price of wheat
0
50
100
150
200
250
300
350
0
500
1000
1500
2000
2500
Jan
-08
Ma
r-0
8
Ma
y-0
8
Jul-
08
Se
p-0
8
No
v-0
8
Jan
-09
Ma
r-0
9
Ma
y-0
9
Jul-
09
Se
p-0
9
No
v-0
9
Jan
-10
Ma
r-1
0
Ma
y-1
0
Jul-
10
Se
p-1
0
No
v-1
0
Jan
-11
Ma
r-1
1
Inte
rna
tio
na
l p
rice
(U
S$/t
on
)
Do
me
stic
pri
ce (
R/t
on
)
Domestic price of yellow maize Maize (US No.2, Yellow, U.S. Gulf (Friday))
0
500
1000
1500
2000
2500
3000
3500
4000
Jan
-08
Ma
r-0
8
Ma
y-0
8
Jul-
08
Sep
-08
No
v-0
8
Jan
-09
Ma
r-0
9
Ma
y-0
9
Jul-
09
Sep
-09
No
v-0
9
Jan
-10
Ma
r-1
0
Ma
y-1
0
Jul-
10
Sep
-10
No
v-1
0
Jan
-11
Ma
r-1
1
(R/t
on
)
Domestic price of yellow maize Import parity price of maize
Export parity price of maize
Between April 2010 and April 2011: Domestic wheat price ↑ 42.81 % Brown bread price ↑ 4.29 % White bread price ↑ 6.61 %
Between April 2010 and April 2011: International price of maize ↑ 101.76 % Domestic price of yellow maize ↑ 42.71%
Between April 2010 and April 2011: Export parity price ↑ 119.96 % Import parity price ↑ 56.74 %

22
QUARTERLY FOOD PRICE MONITOR
May 2011
Figure D.6: Maize price and maize meal price trends Source: SAFEX and AC Nielsen
D.3 Sunflower seeds price trends
Figure D.7: Domestic market price of sunflower seeds against global market price Source: FAO and SAFEX
Figure D.8: Sunflower seeds price and sunflower oil price trends Source: SAFEX and Stats SA
0
500
1000
1500
2000
2500
3000
0
5
10
15
20
25
30
Jan
-08
Ma
r-0
8
Ma
y-0
8
Jul-
08
Sep
-08
No
v-0
8
Jan
-09
Ma
r-0
9
Ma
y-0
9
Jul-
09
Sep
-09
No
v-0
9
Jan
-10
Ma
r-1
0
Ma
y-1
0
Jul-
10
Sep
-10
No
v-1
0
Jan
-11
Ma
r-1
1
Ma
ize
pri
ce (
R/t
on
)
Ma
ize
me
al p
rice
(R
/5k
g)
Maize special 5kg* Maize super 5kg* Domestic price of white maize
0
200
400
600
800
1000
0
1000
2000
3000
4000
5000
6000
Jan
-08
Ma
r-0
8
Ma
y-0
8
Jul-
08
Sep
-08
No
v-0
8
Jan
-09
Ma
r-0
9
Ma
y-0
9
Jul-
09
Sep
-09
No
v-0
9
Jan
-10
Ma
r-1
0
Ma
y-1
0
Jul-
10
Sep
-10
No
v-1
0
Jan
-11
Ma
r-1
1
Inte
rna
l pri
ce (
US
$/t
on
)
Do
me
stic
pri
ce (
r/to
n)
Domestic sunflower Sunflowerseed (EU, cif Lower Rhine)
0
1000
2000
3000
4000
5000
6000
0
5
10
15
20
Jan
-08
Ma
r-0
8
Ma
y-0
8
Jul-
08
Sep
-08
No
v-0
8
Jan
-09
Ma
r-0
9
Ma
y-0
9
Jul-
09
Sep
-09
No
v-0
9
Jan
-10
Ma
r-1
0
Ma
y-1
0
Jul-
10
Sep
-10
No
v-1
0
Jan
-11
Ma
r-1
1
Su
nfl
ow
er
see
ds
(R/t
on
)
Su
nfl
ow
er
oil
(R
/75
0m
l)
Sunflower oil 750mℓ Domestic sunflower
Between April 2010 and April 2011: Super maize meal price ↑ 2.99 % Special maize meal ↓ 7.49 % Domestic price of white maize ↑ 47.30 %
Between April 2010 and April 2011: Domestic price of sunflower seeds ↑ 58.01 % Between March 2010 to March 2011 the international price of sunflower seeds ↑ 48 %
Between April 2010 and April 2011: Sunflower seed price ↑ 25.46 % Retail sunflower oil price ↑ 29.50 %

23
QUARTERLY FOOD PRICE MONITOR
May 2011
D.4 Dairy price trends
Figure D.9: Skim milk powder and whole milk powder price trends Source: FAO
Figure D.10: Domestic producer price and retail prices of milk Source: MPO and AC Nielsen
0
1000
2000
3000
4000
5000
Jan
-08
Ma
r-0
8
Ma
y-0
8
Jul-
08
Sep
-08
No
v-0
8
Jan
-09
Ma
r-0
9
Ma
y-0
9
Jul-
09
Sep
-09
No
v-0
9
Jan
-10
Ma
r-1
0
Ma
y-1
0
Jul-
10
Sep
-10
No
v-1
0
Jan
-11
Ma
r-1
1
US
$/t
on
Dairy_Skim Milk Powder (Oceania, indicative export prices, f.o.b.)
Dairy_Whole Milk Powder (Oceania, indicative export prices, f.o.b.)
2
3
4
5
6
7
8
Jan
-08
Ma
r-0
8
Ma
y-0
8
Jul-
08
Sep
-08
No
v-0
8
Jan
-09
Ma
r-0
9
Ma
y-0
9
Jul-
09
Sep
-09
No
v-0
9
Jan
-10
Ma
r-1
0
Ma
y-1
0
Jul-
10
Sep
-10
No
v-1
0
Jan
-11
Ma
r-1
1
Re
tail
pri
ce (
R/1l)
Fresh milk full cream 1ℓ* Fresh milk low fat 1ℓ* Milk producer price
Between January 2010 and January 2011: Skim milk powder ↑ 14.27 % Whole milk powder ↑ 15.18 %
Between April 2010 and April 2011: Milk producer price ↓ 5.48 % Full cream milk price ↓ 0.70 %
24
QUARTERLY FOOD PRICE MONITOR
May 2011
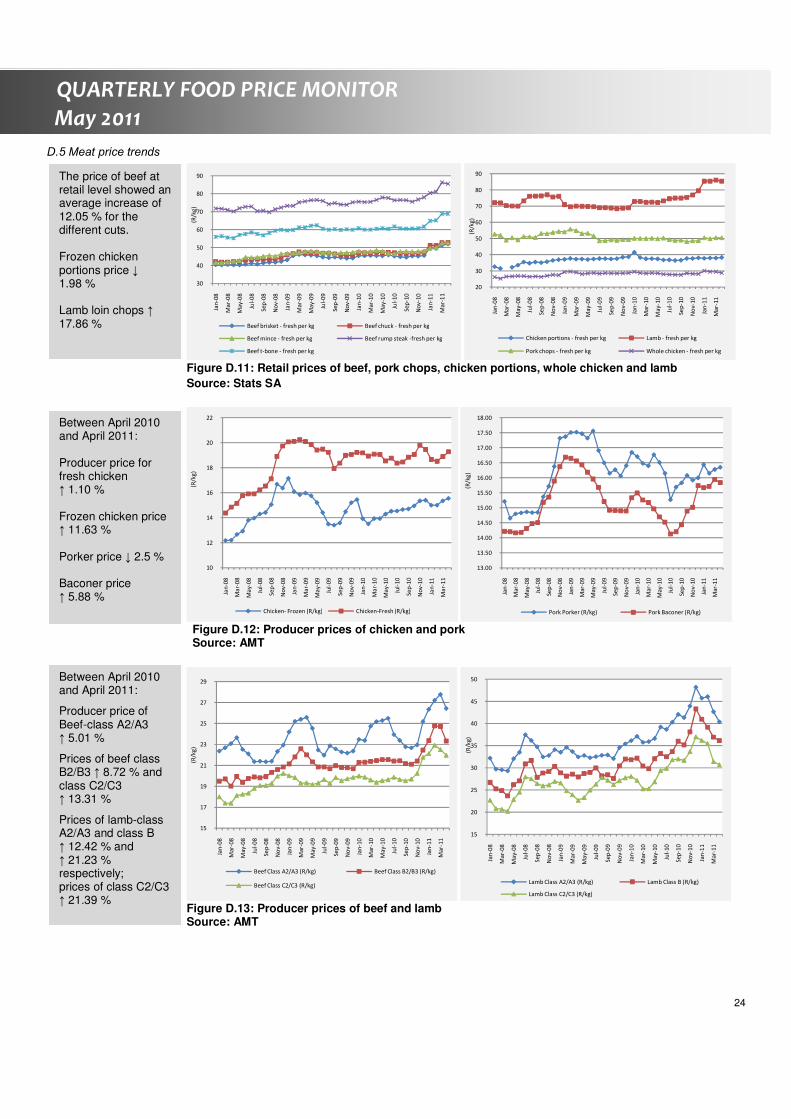
D.5 Meat price trends
Figure D.11: Retail prices of beef, pork chops, chicken portions, whole chicken and lamb
Source: Stats SA
Figure D.12: Producer prices of chicken and pork Source: AMT
Figure D.13: Producer prices of beef and lamb Source: AMT
30
40
50
60
70
80
90
Jan
-08
Ma
r-0
8
Ma
y-0
8
Jul-
08
Sep
-08
No
v-0
8
Jan
-09
Ma
r-0
9
Ma
y-0
9
Jul-
09
Sep
-09
No
v-0
9
Jan
-10
Ma
r-1
0
Ma
y-1
0
Jul-
10
Sep
-10
No
v-1
0
Jan
-11
Ma
r-1
1
(R/k
g)
Beef brisket - fresh per kg Beef chuck - fresh per kg
Beef mince - fresh per kg Beef rump steak -fresh per kg
Beef t-bone - fresh per kg
20
30
40
50
60
70
80
90
Jan
-08
Ma
r-0
8
Ma
y-0
8
Jul-
08
Sep
-08
No
v-0
8
Jan
-09
Ma
r-0
9
Ma
y-0
9
Jul-
09
Sep
-09
No
v-0
9
Jan
-10
Ma
r-1
0
Ma
y-1
0
Jul-
10
Sep
-10
No
v-1
0
Jan
-11
Ma
r-1
1
(R/k
g)
Chicken portions - fresh per kg Lamb - fresh per kg
Pork chops - fresh per kg Whole chicken - fresh per kg
10
12
14
16
18
20
22
Jan
-08
Ma
r-0
8
Ma
y-0
8
Jul-
08
Se
p-0
8
No
v-0
8
Jan
-09
Ma
r-0
9
Ma
y-0
9
Jul-
09
Se
p-0
9
No
v-0
9
Jan
-10
Ma
r-1
0
Ma
y-1
0
Jul-
10
Se
p-1
0
No
v-1
0
Jan
-11
Ma
r-1
1
(R/k
g)
Chicken- Frozen (R/kg) Chicken-Fresh (R/kg)
13.00
13.50
14.00
14.50
15.00
15.50
16.00
16.50
17.00
17.50
18.00
Jan
-08
Ma
r-0
8
Ma
y-0
8
Jul-
08
Sep
-08
No
v-0
8
Jan
-09
Ma
r-0
9
Ma
y-0
9
Jul-
09
Sep
-09
No
v-0
9
Jan
-10
Ma
r-1
0
Ma
y-1
0
Jul-
10
Sep
-10
No
v-1
0
Jan
-11
Ma
r-1
1
(R/k
g)
Pork Porker (R/kg) Pork Baconer (R/kg)
15
17
19
21
23
25
27
29
Jan
-08
Ma
r-0
8
Ma
y-0
8
Jul-
08
Sep
-08
No
v-0
8
Jan
-09
Ma
r-0
9
Ma
y-0
9
Jul-
09
Sep
-09
No
v-0
9
Jan
-10
Ma
r-1
0
Ma
y-1
0
Jul-
10
Sep
-10
No
v-1
0
Jan
-11
Ma
r-1
1
(R/k
g)
Beef Class A2/A3 (R/kg) Beef Class B2/B3 (R/kg)
Beef Class C2/C3 (R/kg)
15
20
25
30
35
40
45
50
Jan
-08
Ma
r-0
8
Ma
y-0
8
Jul-
08
Se
p-0
8
No
v-0
8
Jan
-09
Ma
r-0
9
Ma
y-0
9
Jul-
09
Se
p-0
9
No
v-0
9
Jan
-10
Ma
r-1
0
Ma
y-1
0
Jul-
10
Se
p-1
0
No
v-1
0
Jan
-11
Ma
r-1
1
(R/k
g)
Lamb Class A2/A3 (R/kg) Lamb Class B (R/kg)
Lamb Class C2/C3 (R/kg)
The price of beef at retail level showed an average increase of 12.05 % for the different cuts. Frozen chicken portions price ↓ 1.98 % Lamb loin chops ↑ 17.86 %
Between April 2010 and April 2011: Producer price for fresh chicken ↑ 1.10 % Frozen chicken price ↑ 11.63 % Porker price ↓ 2.5 % Baconer price ↑ 5.88 %
Between April 2010 and April 2011:
Producer price of Beef-class A2/A3 ↑ 5.01 %
Prices of beef class B2/B3 ↑ 8.72 % and class C2/C3 ↑ 13.31 %
Prices of lamb-class A2/A3 and class B ↑ 12.42 % and ↑ 21.23 % respectively; prices of class C2/C3 ↑ 21.39 %

25
QUARTERLY FOOD PRICE MONITOR
May 2011
APPENDIX E: REAL FARM TO RETAIL PRICES SPREAD AND FARM VALUE SHARE OF STAPLE FOOD ITEMS
E.1 Brown bread real farm to retail price spread and farm value share
Figure E.1: Real farm to retail price spread and real farm value share of brown bread. Source: SAFEX, Stats SA and own calculations
E.2 bread real farm to retail price spread and farm value share
Figure E.2: Real farm to retail price spread and real farm value share of white bread. Source: SAFEX, AC Nielsen and own calculations
0
5
10
15
20
25
30
35
40
0
1
2
3
4
5
6
7
8Ja
n-0
8
Ma
r-0
8
Ma
y-0
8
Jul-
08
Sep
-08
No
v-0
8
Jan
-09
Ma
r-0
9
Ma
y-0
9
Jul-
09
Sep
-09
No
v-0
9
Jan
-10
Ma
r-1
0
Ma
y-1
0
Jul-
10
Sep
-10
No
v-1
0
Jan
-11
Ma
r-1
1
Re
al F
arm
Va
lue
Sh
are
(%
/bre
ad
)
Re
al F
TR
PS
(R/b
rea
d)
Real FTRPS Brown Bread (700g)
Real Farm Value Share Brown Bread (700g)
0
5
10
15
20
25
30
35
40
0
1
2
3
4
5
6
7
8
Jan
-08
Ma
r-0
8
Ma
y-0
8
Jul-
08
Sep
-08
No
v-0
8
Jan
-09
Ma
r-0
9
Ma
y-0
9
Jul-
09
Sep
-09
No
v-0
9
Jan
-10
Ma
r-1
0
Ma
y-1
0
Jul-
10
Sep
-10
No
v-1
0
Jan
-11
Ma
r-1
1
Re
al F
arm
Va
lue
Sh
are
(%
/bre
ad
)
Re
al F
TR
PS
(R/b
rea
d)
Real FTRPS White Bread (700g)
Real Farm Value Share White Bread (700g)
Between April 2010 and April 2011: The real farm-to-retail price spread of brown bread decreased by 3.11 % The real farm value share of brown bread decreased by 39.10 %
Between April 2010 and April 2011: The real farm-to-retail price spread of white bread increased by 4.08 % The real farm value share of white bread decreased by 41.81 %

26
QUARTERLY FOOD PRICE MONITOR
May 2011
E.3 Super maize meal real farm to retail price spread and farm value share
Figure E.3: Real farm to retail price spread and real farm value share of super maize meal. Source: SAFEX, AC Nielsen and own calculations.
E.4 Special maize meal real farm to retail price spread and farm value share
Figure E.4: Real farm to retail price spread and real farm value share of special maize meal. Source: SAFEX, AC Nielsen and own calculations.
0
20
40
60
80
100
0
500
1000
1500
2000
2500
Jan
-08
Ma
r-0
8
Ma
y-0
8
Jul-
08
Sep
-08
No
v-0
8
Jan
-09
Ma
r-0
9
Ma
y-0
9
Jul-
09
Sep
-09
No
v-0
9
Jan
-10
Ma
r-1
0
Ma
y-1
0
Jul-
10
Sep
-10
No
v-1
0
Jan
-11
Ma
r-1
1
Re
al F
arm
Va
lue
Sh
are
(R
/to
n)
Re
al F
TR
PS
(R
/to
n)
Real FTRPS Super Maize Meal
Real Farm Value Share Super Maize Meal
0
20
40
60
80
100
0
500
1000
1500
2000
2500
Jan
-08
Ma
r-0
8
Ma
y-0
8
Jul-
08
Sep
-08
No
v-0
8
Jan
-09
Ma
r-0
9
Ma
y-0
9
Jul-
09
Sep
-09
No
v-0
9
Jan
-10
Ma
r-1
0
Ma
y-1
0
Jul-
10
Sep
-10
No
v-1
0
Jan
-11
Ma
r-1
1
Re
al F
arm
Va
lue
Sh
are
(R
/to
n)
Re
al F
TR
PS
(R
/to
n)
Real FTRPS Special Maize meal
Real Farm Value Share Special Maize Meal
Between April 2010 and April 2011: The real farm-to-retail price spread of super maize meal increased by 30.27 % The real farm value share of super maize meal decreased by 26.73 %
Between April 2010 and April 2011: The real farm-to-retail price spread of special maize meal decreased by 8.53 % The real farm value share of special maize meal decreased by 18.43 %

27
QUARTERLY FOOD PRICE MONITOR
May 2011
APPENDIX F: DATA COLLECTION
Urban food prices reported by in this media release are obtained from Statistics South Africa (Stats SA) and AC Nielsen. These prices
obtained from these two sources are regarded as being representative of changes in food prices in South Africa due to:
• Stats SA price data on all products are sampled from approximately 800 different data collections points across the country on a
monthly basis. Food price data is not collected from all the data collection points since some stores that are sampled do not
necessarily sell food. In addition, certain food prices are not sampled in all provinces. For example, the price of cheddar cheese is
collected from Gauteng, Western Cape, Eastern Cape, KwaZulu-Natal, Free State, Northern Cape, North West and Mpumalanga. Food
price data collection by Stats SA also involves field work where price collectors visit stores to collect data, after which such data
undergoes a rigorous process to ensure the integrity of the data. The basket of food products that are included was derived from the
Income and Expenditure Survey of 2005/06 that was compiled by Stats SA to ensure that the basket is representative of consumer
spending on food. For more detailed information on the methodological process involved in the collection of prices visit
http://www.statssa.gov.za/cpi/documents/CPI_Sources_Methods.pdf.
• AC Nielsen collects food price data on a monthly basis from approximately 1000 large food chain stores across the country. Food
prices are collected through scanners at the tellers in the big food chain stores after which it undergoes a rigorous process to ensure
the integrity of the data. As is the case for Stats SA not all prices are collected in all provinces. For example, potato prices are
collected from the core urban areas of Gauteng, KwaZulu-Natal, Eastern Cape, Western Cape and Free State provinces.
This media release also reports food prices in deep rural areas. Rural food prices are collected from 190 outlets/shops by field workers of
the different provincial departments of agriculture on a monthly basis. The number of outlets/shops per province are as follows: 28 outlets
in the Free State, 27 in KwaZulu-Natal, 21 in Mpumalanga, 18 in the Northern Cape, 17 in the Eastern Cape, 16 in Gauteng, 21 in
Limpopo, 23 in North West and 19 in the Western Cape.
Compiled by: Price trends and discussion on selected topics: Outlook: Louise Swart Ferdi Meyer Londiwe Thabethe Hester Vermeulen Christo Joubert André Jooste Nico Scheltema
Enquiries: André Jooste: 012 341-1115 Johann Kirsten: 012 420-3248 Stats SA, AC Nielsen and the rural food price monitoring respondents are acknowledged for assistance provided to the NAMC in terms of food price data. © 2011. Published by National Agricultural Marketing Council. Disclaimer: Information contained in this document results from research funded wholly or in part by the NAMC acting in good faith. Opinions, attitudes and points of view expressed herein do not necessarily reflect the official position or policies of the NAMC. The NAMC makes no claims, promises, or guarantees about the accuracy, completeness, or adequacy of the contents of this document and expressly disclaims liability for errors and omissions regarding the content thereof. No warranty of any kind, implied, expressed, or statutory, including but not limited to the warranties of non-infringement of third party rights, title, merchantability, fitness for a particular purpose or freedom from computer virus is given with respect to the contents of this document in hardcopy, electronic format or electronic links thereto. Reference made to any specific product, process, and service by trade name, trade mark, manufacturer or another commercial commodity or entity are for informational purposes only and do not constitute or imply approval, endorsement or favouring by the NAMC.