Media, Education, and Anti-Americanism in the Muslim...
31
Media, Education, and Anti-Americanism in the Muslim World Matthew A. Gentzkow Harvard University Jesse M. Shapiro ∗ Harvard University PRELIMINARY AND INCOMPLETE September 18, 2003 America has an image problem. Only one percent of people surveyed in June 2003 in Jordan or the Palestinian authority expressed a favorable opinion of the U.S.; favorability ratings elsewhere in the Middle East were almost all below 30 percent. Osama bin Laden was among the top three leaders most often trusted to “do the right thing” by survey respondents in Indonesia, Jordan, Morocco, Pakistan, and the Palestinian Authority (Pew Research Center, 2003). One possible interpretation of these facts is that the residents of these countries are badly informed about important world events. Some evidence exists to support this hypothesis. For example, in survey results we report below, 78 percent of Indonesians, 87 percent of Moroccans, and 96 percent of Pakistanis said that they do not believe that a group of Arabs carried out the attacks on September 11. (This is not to say that residents of Islamic countries are less informed than those of the Western ∗ This paper is dedicated to the memory of Paul J. Battaglia. This paper would not have been possible without the support and encouragement of Martin Feldstein and the National Bureau of Economic Research. We thank Nava Ashraf, Ed Glaeser, Andrei Shleifer, and seminar participants at Harvard University and the NBER for helpful comments and discussion, and Eric Nielsen and Richard Burkholder at the Gallup Organization for their assistance with the data. We acknowledge financial support from the Institute for Humane Studies (Shapiro), National Science Foundation (Shapiro), and Social Science Research Council (Gentzkow). 1
Transcript of Media, Education, and Anti-Americanism in the Muslim...
Media, Education, and Anti-Americanism in theMuslim World
Matthew A. GentzkowHarvard University
Jesse M. Shapiro∗
Harvard University
PRELIMINARY AND INCOMPLETE
September 18, 2003
America has an image problem. Only one percent of people surveyed in June
2003 in Jordan or the Palestinian authority expressed a favorable opinion of the U.S.;
favorability ratings elsewhere in the Middle East were almost all below 30 percent.
Osama bin Laden was among the top three leaders most often trusted to “do the
right thing” by survey respondents in Indonesia, Jordan, Morocco, Pakistan, and the
Palestinian Authority (Pew Research Center, 2003).
One possible interpretation of these facts is that the residents of these countries are
badly informed about important world events. Some evidence exists to support this
hypothesis. For example, in survey results we report below, 78 percent of Indonesians,
87 percent of Moroccans, and 96 percent of Pakistanis said that they do not believe
that a group of Arabs carried out the attacks on September 11. (This is not to
say that residents of Islamic countries are less informed than those of the Western
∗This paper is dedicated to the memory of Paul J. Battaglia. This paper would not have beenpossible without the support and encouragement of Martin Feldstein and the National Bureau ofEconomic Research. We thank Nava Ashraf, Ed Glaeser, Andrei Shleifer, and seminar participantsat Harvard University and the NBER for helpful comments and discussion, and Eric Nielsen andRichard Burkholder at the Gallup Organization for their assistance with the data. We acknowledgefinancial support from the Institute for Humane Studies (Shapiro), National Science Foundation(Shapiro), and Social Science Research Council (Gentzkow).
1

world: according to the Washington Post (2003), 69 percent of Americans believe it
is “somewhat” or “very” likely that Saddam Hussein was personally involved in the
September 11 terrorist attacks, despite the absence of any evidence to that effect).
Would a better informed Muslim world be less hostile to the United States? In
addition to its relevance to the theory of belief and attitude formation,1 this question
has enormous implications for U.S. policy. Unlike many of the possible determinants
of attitudes toward America in the Muslim world—culture, domestic politics, economic
development, and religion—the amount and type of information available is a policy
variable that is at least partially controlled by the American government.2
We use a unique survey dataset on over 10,000 respondents in 9 predominantly
Muslim countries to explore the answers to two questions about the role of information
in anti-American sentiment. First, are more informed individuals more sympathetic
to the United States? Second, does the source of information matter? We study these
questions in two contexts: news media and education.
The answer to the first question is generally negative. Although individuals with
more exposure to the news media are consistently better informed, they are not
necessarily more pro-U.S. in their attitudes. And while more educated individuals
are better informed on all measures, the relationship between education and attitudes
differs considerably across countries in both sign and magnitude.
By contrast, the answer to the second question is consistently positive. Individuals
exposed to relatively more pro-Western media sources tend to be more pro-American
in their attitudes. Evidence from linguistic heterogeneity lends additional credence
to these findings: respondents in Arabic-speaking countries become relatively less1See Becker (2001), Glaeser (2002) and Glaeser (2003) for recent contributions to the economic
analysis of belief formation and manipulation.2For example, the Broadcasting Board of Governors oversees broadcasts of Voice of America
radio in over 50 languages worldwide, and reaches young Arabic-speaking listeners with the recentlylaunched Radio Sawa (Broadcasting Board of Governors, 2002). Also, the government could easilysubsidize satellite broadcasts of existing American networks to the Middle East, and the dubbing orsubtitling of these broadcasts in native languages.
2

favorable to the U.S. the greater is their interest in current events; the pattern is
reversed for residents of countries in which English is a commonly spoken second
language. A similar pattern emerges in the case of education: individuals in former
British colonies (Pakistan and Kuwait) become more favorable to the U.S. with greater
schooling, and the opposite relationship holds in former French colonies (Lebanon and
Morocco).
Overall, then, our findings suggest that information per se is not a solution to
America’s public diplomacy problem. However, they do indicate that makingWestern
news sources more available and attractive to the citizens of the Muslim world could
be a successful intervention.
The rest of the paper is organized as follows. Section 1 describes the 2002 Gallup
Poll of the Islamic World. Section 2 presents our results on the news media, and
section 3 presents findings on education. Section 4 concludes.
1 Data
Our data come from the 2002 Gallup Poll of the Islamic World (The Gallup Orga-
nization, 2002). The survey consists of 10,004 responses from nine predominantly
Muslim countries: Pakistan (2,043), Iran (1,501), Indonesia (1,050), Turkey (1,019),
Lebanon (1,050), Morocco (1,000), Kuwait (790), Jordan (797), and Saudi Arabia
(754). Other than a slight oversampling of urban households, the samples are de-
signed to be representative of the adult (18 and over) population in each country.3
To construct each national sample, official statistics were used to stratify locations
by demographic characteristics. Primary sampling units (PSUs) were then selected
from each stratum, and households were selected in each PSU according to a pre-
3Further details on sample selection and survey methodology are available athttp://www.gallup.com/poll/summits/islam.asp.
3

specified plan. Within a household, respondents were chosen according to the Kish
Grid system to prevent selection bias.
Interviews were conducted in person in the respondent’s home, and each 120-
question interview typically took about one hour to complete. The survey questions
cover a number of areas, including basic demographics, frequency of media use, me-
dia choice, personal and religious values, attitudes toward the West, attitudes toward
contemporary and historical figures, and attitudes toward particular countries. Ap-
pendix Table 1 summarizes the demographic characteristics of the sample, which is
well dispersed across different cohorts and socioeconomic groups.
Our primary measure of attitudes toward anti-American terrorism comes from the
following question:
There are many acts some people may do in life. I will read out to you
number of these acts I would like you to indicate to which extent it can
be morally justified?...Events of September 11 in USA, that is, the attack
on the World Trade Center and the Pentagon.
Respondents report an answer from 1, cannot be justified at all, to 5, completely
justifiable. For ease of interpretation, we will generally code this question as a binary
variable equal to 1 if the respondent feels that the September 11 attacks cannot be
justified at all, and 0 otherwise. Unfortunately, this question was not asked in Jordan
and Saudi Arabia, so those countries will be omitted when our statistical analysis
uses this variable.
We will also make some use of a question about general attitudes toward the U.S.:
In general, what opinion do you have of the following nations?...The
United States.
Respondents answer from 1, very unfavorable, to 5, very favorable. We recode the
response to vary from 0 to 1. Though general opinions about the U.S. are of less
4

obvious policy relevance than feelings about terrorism, this question was asked in all
9 countries, thus allowing us to make more complete use of the available data.
Our measures of knowledge cover two types of information: politically loaded and
politically neutral. Our measure of the first type comes from the following question:
According to news reports groups of Arabs carried out attacks against
USA on September 11th. Do you think that this is true or not?
We code a binary variable equal to 1 if the respondent believes the news reports.
Our measure of politically neutral information is whether the respondent knows
who Kofi Annan is, as derived from a question asking the respondent for opinions
about various world leaders. We code a binary variable equal to 1 if the respondent
expresses an opinion about Kofi Annan and 0 if she indicates that she is “not aware
of” Kofi Annan. While a question quizzing the respondent about broad knowledge
of world affairs would surely be a more useful indicator, this question captures some
variation in attention to current events, is relevant to all countries in the sample and,
as we will see, covaries sensibly with respondent demographics.
Table 1 summarizes the variation in the attitude and information measures across
the countries in the sample. Only about half of respondents consider the September
11 attacks completely unjustifiable, and in Kuwait only about one-fourth of the pop-
ulation feels that way. Roughly 80 percent of respondents believe news reports about
September 11, and about 70 percent claim to be aware of Kofi Annan.
2 News Media
2.1 Frequency of Media Use
One natural approach to measuring the effects of information on attitudes is to exploit
variation in exposure to news media. Survey respondents were asked three questions
5

of the form:
How frequently do you {read daily newspapers/watch TV/listen to the
radio} these days regardless of how much time you spent listening to the
radio in an average day?
Possible responses were 7 days a week, 6 days a week, ..., 1 day a week, less often than
one day a week, or do not read/watch/listen. We have coded measures of media use
to indicate the number of days a week the medium is used, with “less often” coded
as .5 and “do not use” coded as 0.
Table 2 shows the results of regressions of our key attitude and knowledge measures
on these three measures of media use frequency. Each cell presents the coefficient and
standard error from a regression of the form:
Dependent variable = α+ β (number of days a week read/watch/listen) +Xγ + ε
where X is a set of controls including country dummies and dummies for the demo-
graphic characteristics described in Appendix Table 1. In columns (1), (3), and (4),
the dependent variable is binary, so the coefficients represent marginal effects from
probit regressions of the probability that the dependent variable is equal to 1 on the
right-hand-side variables. In column (2), the coefficients reported are from ordinary
least squares (OLS) regressions.
So, for example, the coefficient in the first row of column (1) can be interpreted
as the effect of reading a daily newspaper one more day per week on the probability
that a respondent considers the September 11 attacks unjustified, holding fixed the
respondent’s observable demographic characteristics. The effect is positive and sta-
tistically significant at the 10 percent level, and indicates that reading the newspaper
one more day per week increases the probability of considering the attacks unjustified
by .005.
6

Overall, the results in columns (1) and (2) suggest little or no effect of media use
on attitudes. Within each attitude measure, effects vary wildly in sign and magnitude.
For example, newspaper readership has a marginally statistically significant positive
effect on the probability of thinking the September 11 attacks unjustified, television
viewership has a statistically insignificant positive effect, and listening to the radio has
an insignificant negative effect. None of the media use measures has a statistically
significant effect in the same direction on both opinions about September 11 and
general attitudes toward the U.S., indicating that whatever effects we do observe are
not robust to different measures of attitudes.
One might be tempted to conclude that news media in the countries in our sample
are simply not informative. Many of these countries have tight restrictions on media
ownership (Djankov, McLiesh, Nenova and Shleifer, 2003) which have only recently
been eroded by the rise of satellite television (Alterman, 1998).
The results in columns (3) and (4) refute this hypothesis. As column (3) shows,
the probability of believing U.S. claims about September 11 is increasing in the use of
newspaper, television, and radio. Though only the effect of television is statistically
significant (at the 10 percent level), these findings are consistent with the view that
media use increases knowledge. The evidence shown in column (4) is even more
striking. All three media types have large and statistically significant effects on the
likelihood of knowing who Kofi Annan is. For example, reading a daily newspaper
one more day per week is associated with a 2.8 percent greater chance of knowing
who Kofi Annan is, and this effect is statistically significant at the .1 percent level.
Thus the evidence indicates that although increased use of news media is associ-
ated with more knowledge but not necessarily more pro-U.S. attitudes. Additionally,
knowledge of a politically neutral sort, such as the identity of Kofi Annan, seems
more responsive to the frequency of media use than politically loaded knowledge such
as the identity of the perpetrators of the September 11 attacks. This latter contrast
7

suggests the possibility that media “spin” might make the source of information re-
ceived just as important as its quantity. In the next subsection, we investigate this
issue using data on the choice of television news outlet.
2.2 Source of News
To study the role of the source of information in determining attitudes, we focus
on two international news networks popular in our sample countries: CNN Interna-
tional and Al-Jazeera. CNN International, a twenty-four-hour English-language news
broadcast, is by far the most popular Western news network broadcasting in the
countries in our sample. A subsidiary of AOL Time-Warner, it claims to reach more
than 10 million households and hotel rooms in the Middle East. Programming in
the region originates from London, and is entirely in English, with the exception of
brief segments broadcast in German.4 Content and format are both similar to the
domestic version of CNN.
Al-Jazeera, a twenty-four-hour Arabic language network broadcasting out of Qatar,
is the most popular satellite news network in our sample countries, and claims to reach
35 million viewers as of 2001.5 Broadcasting since 1996, Al Jazeera has been widely
hailed for combining serious, high-quality reporting with a willingness to present al-
ternative viewpoints on contentious issues.6 It is, for example, one of the only Arab
stations to have aired interviews with Israeli officials. With most of its senior staff
having lived or been educated in the west (Alterman 2001), Al-Jazeera is probably
4Information obtained from cnnasiapacific.com/cnni/cnni_corpinfo/cnn/index.asp. September,2003.
5Viewership figure cited in Campagna (2001).6One author calls the station “a startling new experiment... [that] trumpets its bold indepen-
dence and provides a forum for criticisms that otherwise [would] have difficulty finding an outlet”(Alterman 1998). Another writes: “Al-Jazeera has quickly become the most watched—and mostcontroversial—news channel in the region, winning over viewers with its bold, uncensored news cov-erage, its unbridled political debates, and its call-in-show formats that tackle a range of sensitivesocial, political, and cultural issues” (Campagna 2001).
8
the closest thing to independent television journalism the Arab World has ever seen.
While Al-Jazeera and CNN are thus similar in some respects, Al-Jazeera has also
been widely criticized for taking an anti-American and even pro-terrorist stance in its
reporting. Its coverage of the Palestinian conflict and the wars in Afghanistan and
Iraq are said to strongly emphasize the suffering of civilians with limited coverage
of the American or Israeli points of view.7 With regard to the events of September
11, Al Jazeera has frequently replayed taped messages of Osama bin Laden, reported
the charge that Jews were warned in advance of September 11 not to go to work
in the World Trade Center, and broadcast an interview with a French author who
claims the towers were destroyed by US missiles (Campagna, 2001; United Press
International, 2002).8 A New York Times critic, after an extended study of the
station’s coverage, wrote: “Al Jazeera... may not officially be the Osama bin Laden
Channel–but he is clearly its star... The channel’s graphics assign him a lead role...
A huge, glamorous poster of bin Laden’s silhouette hangs in the background of the
main studio set” (Ajami 2001). At least one prominent Al-Jazeera reporter has been
arrested on suspicion of connections to Al-Qaeda (Reuters, 2003).
Both networks are freely available to any household with access to a satellite in
all sample countries except Iran, in which satellite television is illegal, and Indonesia,
in which the networks are available only through paid subscription services. The cost
of a satellite dish is less than $100, making dishes “as common in Cairo slums as
they are in Dubai mansions” (Ajami 2001). Many more people watch the channels in
public places such as cafes and restaurants.
Our study of these news networks takes advantage of two questions asked in the
Gallup poll:
7See Ajami (2001), Campagna (2001), and Waxman (2001).8With regards to the claim that Jews were warned not to go to work, a New York Times editorial
claims this was “reported” on Al Jazeera. A station spokesman said a talk show host cited thecharge and asked guests to respond (Campagna 2001).
9

Which TV channel would you tune first nowadays to catch up on
current world affairs?
Which other TV channels did you watch at anytime in the past seven
days?
Respondents were permitted to give any answer they liked; the surveyor did not
prompt with a list of networks. From these two questions we divided respondents
into four categories: those who watched neither CNN nor Al-Jazeera in the past
seven days, those who watched CNN only, those who watched Al-Jazeera only, and
those who watched both CNN and Al-Jazeera.
Table 3 shows breakdowns of these four categories by country. The low viewership
numbers in Iran and Indonesia are as expected, and those countries are consequently
dropped from our analysis. Overall, both networks are quite popular, with 7 per-
cent of all respondents watching both Al-Jazeera and CNN in the last seven days,
and 62 percent watching neither network. Dropping Iran and Indonesia, these num-
bers change to 10 percent watching both and less than 50 percent watching neither
network.
Table 4 shows the results of regressions of our attitude and knowledge measures
on dummy variables representing three of our four viewership categories. The dummy
for the “neither” category has been omitted from the models, so coefficients in these
regressions can be interpreted as measuring the attitudes or knowledge of a particular
category relative to respondents who watched neither CNN nor Al-Jazeera in the past
seven days. To avoid a confound with total amount of TV watched, we included only
those respondents who indicated that they watch television seven days a week, or
about 77 percent of the sample.
Column (1) shows the relationship between news networks and attitudes about
September 11. Respondents who watched CNN only were 2.1 percent more likely
to say that the attacks on September 11 were completely unjustifiable, although the
10
coefficient is not statistically significant. Al-Jazeera watchers were significantly less
likely to consider the attacks unjustifiable, as were respondents who report having
watched both CNN and Al-Jazeera.
The difference between the coefficients for the “CNN only” and “both” categories
illustrates that the observed relationships are not driven by differences between house-
holds with and without satellite television. Any household with access to CNN also
has access to Al-Jazeera and vice versa, so there is no difference in satellite access
between the “CNN only” and “both” categories. Nevertheless, there is a sizable
difference in attitudes.
The relationship between news network viewing and overall favorability towards
the United States, presented in column (2) of table 4, reveals that CNN watchers are
more favorable to toward the U.S. than Al-Jazeera watchers, with watchers of both
networks closer to the Al-Jazeera only category than to the CNN only category. The
coefficient on the “CNN only” variable approaches significance, and the coefficients
on the “Al-Jazeera only” and “both” variables are significant at the one percent level.
In the case of the propensity to believe stories that Arabs carried out the Septem-
ber 11 attacks, column (3) shows that CNN watchers are more likely to believe these
reports (though the difference is not statistically significant) and Al-Jazeera watch-
ers are significantly less likely to believe them, relative to those who watch neither
network. Respondents who report watching both networks are slightly less likely to
believe that a group of Arabs carried out the attacks as respondents who watched
neither network.
Turning finally to our most direct measure of knowledge, whether the respondent
knows who Kofi Annan is, as column (4) shows those respondents who watch either
or both networks are significantly more likely to know his identity than those who
watch neither. In fact, there is no statistically significant difference in this measure
of knowledge between those watching CNN only and those watching Al-Jazeera only,
11

and those watching both are significantly better informed than those watching either
one alone. This finding is consistent with the view that, while these two networks spin
the news very differently, they both provide similar amounts of basic information.
Overall, the evidence in table 4 suggests that, although CNN and Al-Jazeera con-
vey similar amounts of basic information, that information has very different effects
on attitudes depending on its source. However, our results raise obvious concerns
about reverse causality: it may be that those with relatively more pro-U.S. attitudes
are more likely to watch CNN than Al-Jazeera, and vice versa for those with relatively
less pro-U.S. attitudes.
We address these concerns by using cross-country variation in the ability to access
the two networks. The ideal way to deal with the reverse causality issue would be
to have a source of exogenous variation in access at the individual level. However,
the ubiquity of satellite access, combined with the particular limitations of our data
set, mean we do not have any instruments that could function in this way. Using
cross-country differences is a coarser approach, and the results will be subject to the
criticism that they pick up the effect of other country-level differences unrelated to
media. Keeping these limitations in mind, however, this will be a good check on
whether the effects documented in the media regressions are spurious, or capture a
causal relationship.
The specific country-level difference we exploit is the fraction of people able to
understand English and Arabic. Since CNN broadcasts only in English (or Turkish
in the case of CNN Turkey), and Al Jazeera only in Arabic, language is a strong
constraint on an individual’s ability to access the networks. Our basic approach is
to compare knowledge and attitudes for individuals categorized along two dimen-
sions: propensity to watch television news (captured by reported attention to current
events), and the extent to which English and/or Arabic are widely understood in the
individual’s country. If current events junkies in Arabic-speaking countries differ in
12

knowledge or attitudes, compared to both those less interested in current events and
those following current events in non-Arabic-speaking countries, we interpret this as
an effect of the Arabic-language media (and particularly of Al-Jazeera). Similarly,
we interpret the interaction between current events interest and living in a country
where English is widely spoken as the effect of access to English-language news, for
which CNN is by far the most important source.
The measure of attention to current affairs comes directly from the survey. Re-
spondents were asked:
With respect to how much attention you pay to current affairs, would
you say that you do not pay much attention (code 1),..., pay a lot of
attention (code 5).
For ease of interpretation, we have recoded the response to this question to vary from
0 to 1.
The extent to which Arabic is widely understood is also relatively easy to code. In
five of our countries–Lebanon, Kuwait, Saudi Arabia, Jordan and Morocco–Arabic
is the first language and is spoken by virtually everyone. In the remaining four
countries–Turkey, Pakistan, Iran and Indonesia–Arabic is not the first language.
While it is used to some extent, especially for religious purposes, the majority of
people could not understand a news broadcast in Arabic. We therefore code the
former countries as Arabic-speaking and the latter as not.
Measuring the number of people who understand English is more difficult. Eng-
lish is not the first language in any of the sample countries, and we are unaware of
any accurate data on the fraction of people fluent in it as a second language. Nev-
ertheless, two sources of information suggest strong differences among our countries.
First, data to be discussed in section 3 show that English is a common language of
university instruction in Saudi Arabia, Lebanon, Kuwait, Jordan, and Pakistan. Sec-
13

ond, the Linguasphere Register, a classification of “the world’s languages and speech
communities,” lists Kuwait, Jordan and Pakistan as countries where English is widely
spoken (Dalby et al. 1999). The latter is consistent with the fact that Kuwait, Jor-
dan, and Pakistan are all former British colonies. Since colonial history seems the
clearest way to separate the sample, we will categorize these three as countries where
English is common. However, none of the qualitative results below change if we in-
clude Saudi Arabia and Lebanon as well. Finally, we add Turkey to the “English”
category, not because English is widely spoken but because individuals there have
access to broadcasts from CNN Turkey in their native language.
As a first step, we verify that the language categories relate in the predicted way
to viewership of CNN and Al Jazeera. Table 3 shows that the fraction watching
Al Jazeera in the Arabic-language countries is high, whereas it is essentially zero in
the non-Arabic countries. CNN viewership is high in Kuwait, Turkey, and Pakistan,
significant in Jordan, Lebanon and Saudi Arabia, and negligible in the remaining
countries, roughly consistent with our categorization. A more accurate way to test
the relationship is to run a regression of viewership on the interaction between the
language variables and attention to current events. Focusing on the interaction re-
moves any effect of differences between the country groups in average viewership,
such as might be caused by differences in education or income. The results of this
exercise go in the predicted direction: the interaction between English and current
events has a significant positive effect on CNN viewership, but no effect on Al Jazeera
viewership; the interaction with Arabic has exactly the reverse pattern.
We will estimate models of the form:
Dependent variable = α+ β (current events interest) + γ (country)
+λ (Arabic× current events interest)+ρ (English× current events interest) + ε
14

and test the hypothesis that λ < 0 and ρ > 0 for attitudes, but λ > 0 and ρ > 0 for
knowledge. This approach has the disadvantage relative to the regressions in table 4
that we will not be able to identify the precise networks or publications responsible
for the effects, but has the advantage that our estimates will capture the effects of
the general media environment on attitudes and information.
The results of this test are shown in table 5. In general, they validate our hypothe-
ses. Column (1) shows that the probability that a respondent believes the September
11 attacks are unjustifiable rises more rapidly with current events interest in English-
language countries, and rises less rapidly in Arabic-language countries. The former
effect is statistically significant. Column (2) repeats this specification using general
favorability toward the U.S. as a dependent variable, and finds similar results. In this
case, it is the effect of Arabic-language interacted with current events interest that is
statistically significant; the English-language effect is wrong-signed and statistically
insignificant. As column (3) shows, effects on believing that a group of Arabs car-
ried out the September 11 attacks go in the right direction, although they are not
statistically significant.
Finally, column (4) demonstrates that both being in an Arabic-speaking country
and being in an English-speaking country make respondents interested in current
events relatively more likely to have heard of Kofi Annan. The coefficients on the two
key interaction terms are of similar magnitude and are statistically indistinguishable.
This is consistent with the finding in table 4 that both CNN and Al-Jazeera provide
comparable amounts of information.
On the whole, then, our hypotheses are confirmed: those interested in current
events and living in Arabic-speaking countries tend to be relatively well-informed
but less pro-U.S. in their attitudes, while those who follow current affairs and live in
relatively more English-speaking countries are both better informed and more pro-
U.S. The evidence in table 5 thus serves to strengthen the case made by table 4 that
15

it is the source of information, not information itself, which affects attitudes.
3 Education
Even more than media, perhaps, the education system plays a critical role in deter-
mining the information available to individuals. We therefore study the effects of
educational attainment on knowledge measures and attitudes toward the U.S. as a
second test of our key hypotheses. We predict that more educated individuals will
always be better informed, but will not necessarily be more pro-U.S. in their leanings.
Moreover, we expect that the heterogeneity in the effects of education on attitudes
will be related to the extent of western influence in the school system.
The Gallup dataset codes educational attainment into 7 categories, described in
Appendix Table 2. As a first pass, we have converted these into approximate years
of completed schooling, and estimated models of the form:
Dependent variable = α+ β (years of schooling× country) +Xλ+ ε
where X is a set of controls including country dummies and dummies for the demo-
graphic characteristics described in Appendix Table 1. Table 6 reports the country-
specific education coefficients that result from this exercise. Each column reports the
estimated marginal effect of education on the corresponding dependent variable for
residents of each country. To improve statistical precision, we assume that control
variables have identical effects in all countries.
Column (1) reveals significant cross-country variation in the relationship between
schooling and attitudes about September 11. Out of the seven countries for which
data are available, two (Kuwait and Pakistan) show a statistically significant positive
relationship between schooling and the probability of believing that the September
11 attacks are unjustifiable, three (Turkey, Iran, and Indonesia) show a statistically
16

insignificant positive effect, one (Lebanon) shows a statistically insignificant negative
effect, and one (Morocco) a statistically significant negative effect.9
There is similar variability in the relationship between education and general at-
titudes toward the U.S., as shown in column (2). The association between schooling
and the probability of believing that a group of Arabs carried out the September 11
attacks is somewhat more consistent: the coefficient on years of schooling is negative
only in Indonesia, and it is not statistically significant.
By far the most consistent relationship is between schooling and the probability of
knowing who Kofi Annan is: this relationship is positive and statistically significant
in all 8 countries for which data are available. Thus, the cross-country variation in
the relationship between schooling and attitudes cannot be attributed to variation in
the informativeness of the education system.
What accounts for the differences in the education effect across countries? One
candidate explanation is that some countries’ education systems place relatively more
emphasis on Western information sources. To explore this hypothesis, we have col-
lected data on the share of universities conducting regular instruction in English and
Arabic for our nine sample countries. These data, compiled from Awais (1987) and
summarized in Table 7, provide a proxy for the extent to which Western sources of
knowledge are used in instruction. An individual residing in a country whose univer-
sities use English as a primary or secondary language ought to have more access to
English-language sources, especially if that individual is herself a university graduate.
Table 8 tests formally whether the effects of university education differ systemat-
ically depending on the country’s typical languages of instruction. Here we parallel
9In light of these cross-country differences, it does not seem surprising that Krueger and Maleckova(forthcoming) find no consistent relationship between socioeconomic status and support for terrorismin Palestine.
17

table 5 and estimate models of the form
Dependent variable = α+ β (university education) + γX
+λ (share teaching in English× university education)+ρ (share teaching in Arabic× university education) + ε
where X is a set of controls including country dummies and dummies for the demo-
graphic characteristics described in Appendix Table 1.
Column (1) shows that the effect of having a university education on the probabil-
ity of believing the September 11 attacks are unjustifiable is higher in countries with
more English-language instruction, and lower in countries with more Arabic-language
instruction. These differences are statistically significant and large: a change from
0 universities teaching in English to all universities teaching in English raises the
university effect by 20 percentage points.
With respect to general attitudes toward the U.S., as column (2) shows there is
no significant interaction between English instruction and university education, and a
marginally significant negative interaction between Arabic instruction and university
education.
As column (3) shows, the effect of education on the probability of believing that a
group of Arabs carried out the September 11 attacks increases with the English share
and decreases with the Arabic share, although only the interaction with Arabic-
language is significant.
Finally, column (4) shows that there are no significant interactions between lan-
guage of instruction and university education using as a dependent variable whether
the respondent knows who Kofi Annan is. This result confirms that university educa-
tion makes people generally better informed in all countries, and the differences only
appear in politically charged measures of knowledge and attitudes.
18

4 Discussion
Our findings suggest that increased exposure to Western information sources could
significantly reduce anti-American sentiment in the Muslim world. Encouraging the
growth of Western media in Muslim countries is an attractive policy option, because
it takes advantage of existing technologies (such as satellite television) and does not
require direct military or diplomatic intervention in the affairs of sovereign states.
Whether encouraging the growth of Western media in the Muslim world should take
the form of networks operated directly by the U.S. government, subsidies to existing
satellite networks to broadcast in the Middle East (ideally with translation into the
region’s native languages), or other interventions remains an important topic for
future research.10
10See Peterson et al (2002) for a broader discussion of options for improving American publicdiplomacy.
19

References
[1] Fouad Ajami. What the Muslim world is watching. New York Times Magazine,page 48, November 18 2001.
[2] Jon B. Alterman. New media, new politics? From satellite television to theInternet in the Arab world. The Washington Institute for Near East Policy,Washington, DC, 1998. Policy Paper No. 48.
[3] Ch. Muhammad Awais. Directory of universities and their libraries of the Mus-lim world. Deanship of Library Affairs, Umm Al-Qura University, Makkah Al-Mukarramah, 1987.
[4] Gary S. Becker. Rational indoctrination and persuasion. University of ChicagoMimeo, March 2001.
[5] Joel Campagna. Between two worls: Qatar’s Al-Jazeera satellite channelfaces conflicting expectations. CPJ Press Freedom Reports, October 2001.http://www.cpj.org.
[6] David Dalby, David Barrett, and Michael Mann. The linguasphere register of theworld’s languages and speech communities. Linguasphere Press, Hebron, Wales,UK, 1 edition, 1999.
[7] Simeon Djankov, Caralee McLiesh, Tatiana Nenova, and Andrei Shleifer. Whoowns the media? Journal of Law and Economics, 46(2), October 2003.
[8] The Pew Research Center for the People and the Press. Views of a ChangingWorld: June 2003, volume 2 of Pew Global Attitudes Project. The Pew ResearchCenter for the People and the Press, Washington, DC, June 2003.
[9] Edward L. Glaeser. The political economy of hatred. Harvard Institute forEconomic Research Discussion Paper, 1970, August 2002.
[10] Edward L. Glaeser. Psychology and the market. Harvard University Mimeo,July 2003.
[11] United Press International. Top al Qaida leaders interviewed. September 5 2002.
[12] Alan B. Krueger and Jitka Maleckova. Education, poverty, political violenceand terrorism: Is there a causal connection? Journal of Economic Perspectives.Forthcoming.
[13] Broadcasting Board of Governors. 2002 Annual Report. Washington, DC.
20

[14] The Gallup Organization. The 2002 Gallup Poll of the Islamic World: ExecutiveReport. The Gallup Poll Tuesday Briefing. Princeton, NJ, February 2002.
[15] Peter G. Peterson et al. Public diplomacy: A strategy for reform. A Report ofan Independent Task Force on Public Diplomacy. Council on Foreign Relations,New York, NY, July 2002.
[16] Reuters. Jazeera says spain arrests reporter for Qaeda link. Reuters News Article,September 5 2003.
[17] Sharon Waxman. Arab TV’s strong signal. Washington Post, page C01, Decem-ber 4 2001.
21

Table 1: Summary of key variables
9/11 attacks General attitude Believe stories Know whounjustifiable toward U.S. about 9/11 Kofi Annan is
(%) (Avg.) (%) (%)
Lebanon 62.4 0.474 42.4 96.0
Kuwait 25.7 0.438 11.1 96.5
Saudi Arabia NA 0.275 NA NA
Jordan NA 0.295 NA 94.6
Turkey 55.6 0.492 51.5 37.8
Pakistan 40.9 0.202 4.1 53.0
Iran 55.8 0.224 20.3 60.4
Morocco 54.5 0.398 12.8 63.5
Indonesia 74.3 0.491 21.6 88.9
Total 52.3 0.346 21.5 69.9
Notes:Individuals with missing data have been omitted from the table. Results are weighted
as recommended by the data providers.
22

Table 2: Effects of media use
(1) (2) (3) (4)9/11 attacks General attitude Believe stories Know whounjustifiable toward U.S. about 9/11 Kofi Annan is
Model Probit OLS Probit Probit
Newspaper 0.0053 -0.0007 0.0017 0.0275(0.0031) (0.0015) (0.0023) (0.0026)
Television 0.0041 -0.0038 0.0056 0.0190(0.0037) (0.0019) (0.0033) (0.0029)
Radio -0.0035 0.0021 0.0018 0.0098(0.0025) (0.0013) (0.0019) (0.0020)
N 8102 9607 7583 9203
Notes:Individuals with missing data on dependent variable or key independent variable have
been omitted from the table. Results are weighted as recommended by the data providers.All specifications include dummies for education, gender, age, urban/rural status, maritalstatus, and country of residence, using the categories shown in Appendix Table 1. In probitspecifications, coefficients reported reflect marginal effects.
23

Table 3: News network viewership by countryNeither CNN Al-Jazeera Both(%) Only (%) Only (%) (%)
Lebanon 36.88 5.1 46.25 11.77
Kuwait 7.87 2.58 46.49 43.06
Saudi Arabia 18.08 1.16 68.82 11.94Jordan 39.38 1.08 52.69 6.85
Turkey 77.97 22.03 0 0
Pakistan 78.04 21.96 0 0
Iran 99.01 0 0.99 0
Morocco 61.56 0.24 36.57 1.63
Indonesia 99.39 0.61 0 0
Total 61.94 6.52 24.45 7.09
Notes:Individuals with missing data have been omitted from the table. Results are weighted
as recommended by the data providers.
24

Table 4: Effects of news source
(1) (2) (3) (4)9/11 attacks General attitude Believe stories Know whounjustifiable toward U.S. about 9/11 Kofi Annan is
Model Probit OLS Probit Probit
CNN only 0.0213 0.0259 0.0283 0.0498(0.0324) (0.0165) (0.0285) (0.0194)
Al-Jazeera -0.1018 -0.0430 -0.0678 0.0792only (0.0260) (0.0132) (0.0183) (0.0170)
Both CNN & -0.1753 -0.0818 -0.0091 0.1232Al-Jazeera (0.0339) (0.0194) (0.0282) (0.0210)
N 4262 5576 4150 5108
Notes:Individuals with missing data on dependent variable or key independent variables have
been omitted from the table. Results are weighted as recommended by the data providers.Results exclude respondents living in Indonesia or Iran and watching television fewer thanseven days a week. All specifications include dummies for education, gender, age, ur-ban/rural status, marital status, and country of residence, using the categories shown inAppendix Table 1. In probit specifications, coefficients reported reflect marginal effects.
25

Table 5: Language, attitudes, and knowledge
(1) (2) (3) (4)9/11 attacks General attitude Believe stories Know whounjustifiable toward U.S. about 9/11 Kofi Annan is
Model Probit OLS Probit Probit
English × 0.1741 -0.0531 0.0040 0.3175Current events (0.0695) (0.0508) (0.0222) (0.1759)
Arabic × -0.0330 -0.1450 -0.0814 0.3822Current events (0.0818) (0.0523) (0.0518) (0.1044)
Current events -0.0477 0.0034 0.0515 -0.1012(0.0571) (0.0313) (0.0139) (0.0888)
N 6821 8338 6362 7873
Notes:Individuals with missing data on dependent variable or key independent variable have
been omitted from the table. Results are weighted as recommended by the data providers.Standard errors in parentheses are clustered by country to correct for intercorrelation amongthe error terms. All specifications include controls for country of residence. In probitspecifications, coefficients reported reflect marginal effects.
26

Table 6: Education effects by country
(1) (2) (3) (4)9/11 attacks General attitude Believe stories Know whounjustifiable toward U.S. about 9/11 Kofi Annan is
Model Probit OLS Probit Probit
Lebanon -0.0050 0.0072 0.0353 0.0772(0.0098) (0.0027) (0.0098) (0.0199)
Kuwait 0.0434 0.0163 0.0295 0.0499(0.0148) (0.0030) (0.0192) (0.0209)
Saudi Arabia NA -0.0003 NA NA(0.0035)
Jordan NA 0.0100 NA 0.0954(0.0028) (0.0181)
Turkey 0.0101 0.0042 0.0125 0.1190(0.0102) (0.0021) (0.0109) (0.0137)
Pakistan 0.0499 -0.0039 0.0337 0.1262(0.0086) (0.0017) (0.0177) (0.0113)
Iran 0.0020 0.0174 0.0271 0.1506(0.0072) (0.0016) (0.0100) (0.0085)
Morocco -0.0356 -0.0030 0.0289 0.1961(0.0096) (0.0022) (0.0115) (0.0182)
Indonesia 0.0115 -0.0060 -0.0165 0.1473(0.0211) (0.0039) (0.0231) (0.0220)
N 8102 9607 7583 9203
Notes:Individuals with missing data on dependent variables or education have been omitted
from the table. Results are weighted as recommended by the data providers. All specifi-cations include dummies for gender, age, urban/rural status, marital status, and countryof residence, using the categories shown in Appendix Table 1. Coefficients on controls arerestricted to be identical across countries. In probit specifications, coefficients reportedreflect marginal effects.
27
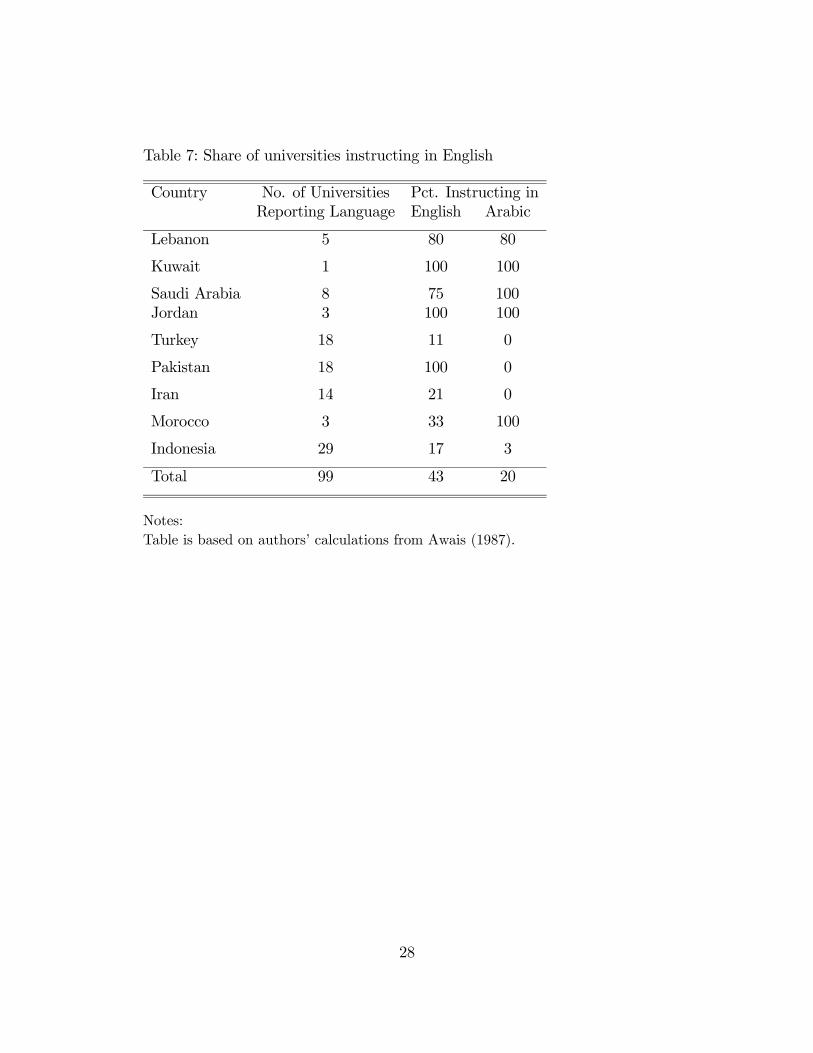
Table 7: Share of universities instructing in English
Country No. of Universities Pct. Instructing inReporting Language English Arabic
Lebanon 5 80 80
Kuwait 1 100 100
Saudi Arabia 8 75 100Jordan 3 100 100
Turkey 18 11 0
Pakistan 18 100 0
Iran 14 21 0
Morocco 3 33 100
Indonesia 29 17 3
Total 99 43 20
Notes:Table is based on authors’ calculations from Awais (1987).
28

Table 8: Language and university education
(1) (2) (3) (4)9/11 attacks General attitude Believe stories Know whounjustifiable toward U.S. about 9/11 Kofi Annan is
Model Probit OLS Probit Probit
English share × 0.2152 -0.0252 0.0542 0.0174University (0.0288) (0.0769) (0.0477) (0.0860)
Arabic share × -0.1467 -0.1022 -0.0820 -0.0438University (0.0238) (0.0551) (0.0392) (0.1075)
University 0.0074 0.1178 0.0578 0.1767education (0.0313) (0.0555) (0.0306) (0.0182)
N 8102 9607 7583 9203
Notes:Individuals with missing data on dependent variable or key independent variable have
been omitted from the table. Results are weighted as recommended by the data providers.Standard errors in parentheses are clustered by country to correct for intercorrelation amongthe error terms. All specifications include dummies for gender, age, urban/rural status,marital status, and country of residence, using the categories shown in Appendix Table 1.In probit specifications, coefficients reported reflect marginal effects.
29

Appendix Table 1: Demographic characteristics
Share (%) Share (%)
Age (years) Urban/rural status
Missing 0.1 Missing 0.3
18-19 9.3 Urban 53.4
20-24 17.3 Sub-urban 18.2
25-29 15.4 Rural 28.2
30-34 14.5
35-39 12.6 Gender
40-44 9.7 Male 50.4
45-49 7.3 Female 49.6
50-54 5.2
55-59 3.4 Marital status
60+ 5.4 Single 32.3
Married with children 59.8
Schooling Married w/o children 6.4
Less than primary 19.8 Other 1.6
Completed primary 35.0
Completed secondary 34.5
Completed university 10.7
Notes:Shares may not add to 100% due to rounding. Results are weighted as recommended
by the data providers.
30

Appendix Table 2: Education codes
Survey question: Could you please tell me the highest level you have reached?Survey responses:Category Description Approximate
completed years
1 Do not have any formal education 0
2 Some elementary education/can read and write 3
3 Finished elementary ed. less than intermediate 6
4 Finished intermediate less than secondary 9
5 Finished secondary 12
6 College some university 14
7 University and above 16
31