Medi-Cal DRG Project: Review of FY 2013-14 Utilization … · Medi-Cal DRG Project: Review of FY...
51
Medi-Cal DRG Project: Review of FY 2013-14 Utilization and Payment Prepared for the California Department of Health Care Services March 9, 2015 W488
Transcript of Medi-Cal DRG Project: Review of FY 2013-14 Utilization … · Medi-Cal DRG Project: Review of FY...
Medi-Cal DRG Project: Review of FY 2013-14 Utilization and Payment
Prepared for the California Department of Health Care Services March 9, 2015
W488

©2015 Xerox Corporation. All rights reserved. Xerox and Xerox and Design are trademarks of Xerox Corporation in the United States and/or other countries. BR13928
Other company trademarks are also acknowledged.
Document Version: 3.0 (March 2015).
® ®
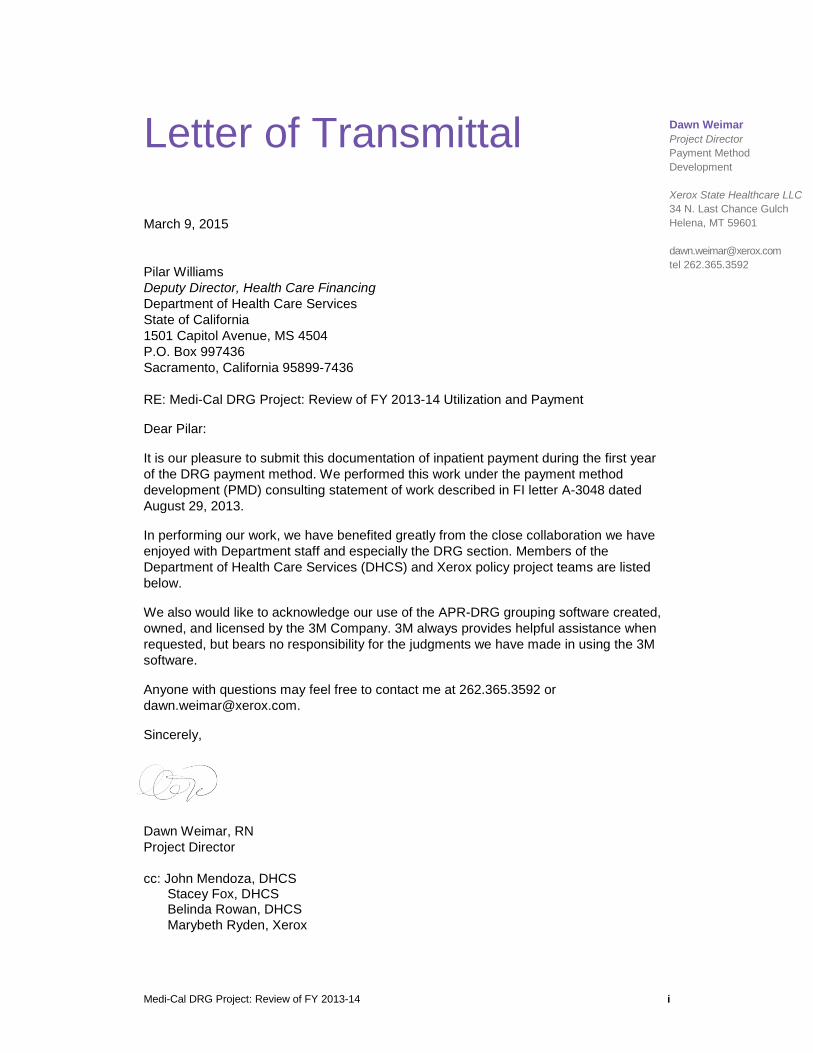
Letter of Transmittal
March 9, 2015
Pilar Williams Deputy Director, Health Care Financing Department of Health Care Services State of California 1501 Capitol Avenue, MS 4504 P.O. Box 997436 Sacramento, California 95899-7436
RE: Medi-Cal DRG Project: Review of FY 2013-14 Utilization and Payment
Dear Pilar:
It is our pleasure to submit this documentation of inpatient payment during the first year of the DRG payment method. We performed this work under the payment method development (PMD) consulting statement of work described in FI letter A-3048 dated August 29, 2013.
In performing our work, we have benefited greatly from the close collaboration we have enjoyed with Department staff and especially the DRG section. Members of the Department of Health Care Services (DHCS) and Xerox policy project teams are listed below.
We also would like to acknowledge our use of the APR-DRG grouping software created, owned, and licensed by the 3M Company. 3M always provides helpful assistance when requested, but bears no responsibility for the judgments we have made in using the 3M software.
Anyone with questions may feel free to contact me at 262.365.3592 or [email protected].
Sincerely,
Dawn Weimar, RN Project Director cc: John Mendoza, DHCS
Stacey Fox, DHCS Belinda Rowan, DHCS Marybeth Ryden, Xerox
Dawn Weimar Project Director Payment Method Development Xerox State Healthcare LLC 34 N. Last Chance Gulch Helena, MT 59601 [email protected] tel 262.365.3592
Medi-Cal DRG Project: Review of FY 2013-14 i

DHCS DRG Section
Stacy Fox, Assistant Division Chief Maria Jaya, Research Program Specialist II Richard Luu, Associate Governmental Program Analyst John Mendoza, Division Chief Belinda Rowan, DRG Section Chief Cyrus Sanchez, Research Analyst II Kelli Shaw, Associate Governmental Program Analyst
Former DHCS DRG Section
Jennifer Brooks, Assistant Division Chief Becky Swol, DRG Section Chief Beverly Yokoi, Research Program Specialist II
Xerox Payment Method Development
Darrell Bullocks, Senior Consultant Bud Davies, Senior Consultant Kevin Quinn, Vice President Angela Sims, Analyst Andrew Townsend, Consultant Dawn Weimar, Project Director
Medi-Cal DRG Project: Review of FY 2013-14 ii
Table of Contents
Letter of Transmittal ................................................................... i
Acronyms.................................................................................. 5
1 Overview of DRG Payment ................................................ 1 1.1 Organization of This Document .......................................................... 1 1.2 Background on DRG Payment ........................................................... 2
1.2.1 DRG Payment ........................................................................ 2 1.2.2 Scope of DRG Payment ......................................................... 3 1.2.3 Transition Period .................................................................... 4
1.3 Summary of Payment Policy Parameters for FY 2013-14 ................... 5 1.4 Data Sources for this Analysis ............................................................ 6 1.5 For Further Information ...................................................................... 7
2 Overview of Utilization and Payment .................................. 8 2.1 Total Stays ......................................................................................... 8 2.2 Total Payment .................................................................................. 10 2.3 Payment Relative to Expectations .................................................... 12
3 DRG Payment .................................................................. 14 3.1 Medicaid Care Category ................................................................... 14 3.2 The Concentration of Spending ........................................................ 16 3.3 How Claims Were Paid .................................................................... 17 3.4 Outlier Payments .............................................................................. 18 3.5 Obstetric Stays ................................................................................. 19 3.6 Normal Newborn Stays .................................................................... 21 3.7 Adult Miscellaneous Stays ............................................................... 22 3.8 Pediatric Miscellaneous Stays .......................................................... 24 3.9 Adult Gastroenterology Stays ........................................................... 26 3.10 Adult Circulatory Stays ..................................................................... 28 3.11 Neonate (Sick Newborn) Stays ........................................................ 30 3.12 Adult Respiratory Stays .................................................................... 33 3.13 Pediatric Respiratory Stays .............................................................. 34 3.14 Other Stays ...................................................................................... 35 3.15 Differences Between Non-ACA and ACA Populations ...................... 36
Medi-Cal DRG Project: Review of FY 2013-14 iii

Appendix A: DRG Pricing Calculator ....................................... 39
Appendix B: Reconciliation of Record Counts ......................... 41
Appendix C: Completion Factors for Medi-Cal DRG Stays ..... 43
Notes ...................................................................................... 44
Medi-Cal DRG Project: Review of FY 2013-14 iv

Acronyms
ALOS Average length of stay
APR-DRG All Patient Refined Diagnosis Related Group
CAMMIS California Medicaid Management Information System
CAH Critical access hospital (Medicare)
CCR Cost-to-charge ratio
CCS California Children’s Services
CMS Centers for Medicare and Medicaid Services
DHCS California Department of Health Care Services
DPH Designated public hospital
DRG Diagnosis related group
GHPP California Genetically Handicapped Persons Program
FFS Fee-for-service
FY California state fiscal year (July-June)
FFY Federal fiscal year (October-September)
LTCH Long-term care hospital (Medicare)
MCC Medicaid Care Category
MDC Major Diagnostic Category
NDPH Non-designated public hospital
NICU Neonatal intensive care unit
NIS Nationwide Inpatient Sample from the Agency for Healthcare Research and Quality
OSHPD California Office of Statewide Health Planning and Development
SNFD/DRG Safety Net Finance Division of the California Department of Health Care Services/DRG Unit
Medi-Cal DRG Project: Review of FY 2013-14 v
1 Overview of DRG Payment
1.1 Organization of This Document Effective for admissions on or after July 1, 2013, Medi-Cal implemented payment by diagnosis related group (DRG) for hospital inpatient services received by fee-for-service (FFS) beneficiaries, replacing the Selective Provider Contracting Program that had been in place for almost 30 years. The change was authorized by Senate Bill 853 of the 2009-2010 Legislature as signed by the Governor on October 19, 2010.
The present document summarizes the first year of experience with the new payment method. It is written for an audience of Medi-Cal beneficiaries, hospital staff, policymakers and others interested in the volume and nature of inpatient hospital services received by FFS beneficiaries.
• The remainder of Chapter 1 provides background on the DRG payment method.
• Chapter 2 provides an overview of DRG payment in state fiscal year 2013-14. The numbers include claims paid by September 24, 2014, plus an estimate of payments yet to occur.
• Chapter 3 provides a more detailed look at utilization, based only on claims paid for FY 2013-14 services. (These claims represent an estimated 94% of all stays in FY 2013-14.)
• An appendix includes related material such as the DRG pricing calculator.
Questions or comments are welcome and may be directed to [email protected].
Medi-Cal DRG Project: Review of FY 2013-14 1
1.2 Background on DRG Payment 1.2.1 DRG Payment
DRGs are often said to describe the “product of a hospital” where the “product” may be care for a patient with appendicitis or cesarean delivery of a baby. A grouping algorithm – Medi-Cal uses All Patient Refined Diagnosis Related Groups or APR-DRGs – assigns each stay to a single DRG based on clinical information on the claim submitted by the hospital, especially diagnosis and procedure data. Payment by DRG was introduced at the national level by Medicare in 1983 and has since been used to calculate more than $2 trillion in payments worldwide.1 More than 35 of the nation’s 51 Medicaid programs use DRG payment. The APR-DRG algorithm is also used by Florida, Illinois, New York, Texas and at least eight other states. Other states may use other DRG algorithms, especially the Medicare algorithm. California chose the APR-DRG algorithm because it is more appropriate for a Medicaid population.2 The algorithm has 314 base DRGs (which may be thought as the reason for admission), each with four severity levels, for a total of 1,256 DRGs. The severity level scale ranges from 1 to 4 with 1 being least and 4 most severe reflecting the complexity of care provided.
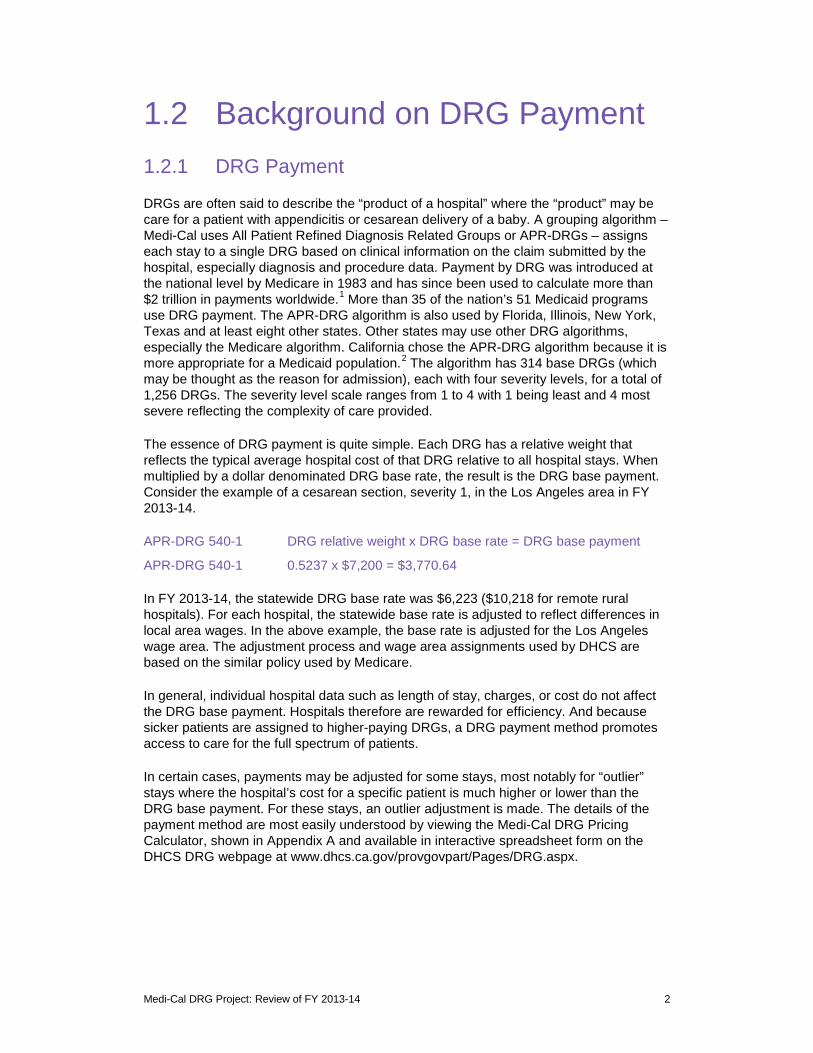
The essence of DRG payment is quite simple. Each DRG has a relative weight that reflects the typical average hospital cost of that DRG relative to all hospital stays. When multiplied by a dollar denominated DRG base rate, the result is the DRG base payment. Consider the example of a cesarean section, severity 1, in the Los Angeles area in FY 2013-14.
APR-DRG 540-1 DRG relative weight x DRG base rate = DRG base payment
APR-DRG 540-1 0.5237 x $7,200 = $3,770.64
In FY 2013-14, the statewide DRG base rate was $6,223 ($10,218 for remote rural hospitals). For each hospital, the statewide base rate is adjusted to reflect differences in local area wages. In the above example, the base rate is adjusted for the Los Angeles wage area. The adjustment process and wage area assignments used by DHCS are based on the similar policy used by Medicare.
In general, individual hospital data such as length of stay, charges, or cost do not affect the DRG base payment. Hospitals therefore are rewarded for efficiency. And because sicker patients are assigned to higher-paying DRGs, a DRG payment method promotes access to care for the full spectrum of patients.
In certain cases, payments may be adjusted for some stays, most notably for “outlier” stays where the hospital’s cost for a specific patient is much higher or lower than the DRG base payment. For these stays, an outlier adjustment is made. The details of the payment method are most easily understood by viewing the Medi-Cal DRG Pricing Calculator, shown in Appendix A and available in interactive spreadsheet form on the DHCS DRG webpage at www.dhcs.ca.gov/provgovpart/Pages/DRG.aspx.
Medi-Cal DRG Project: Review of FY 2013-14 2
1.2.2 Scope of DRG Payment
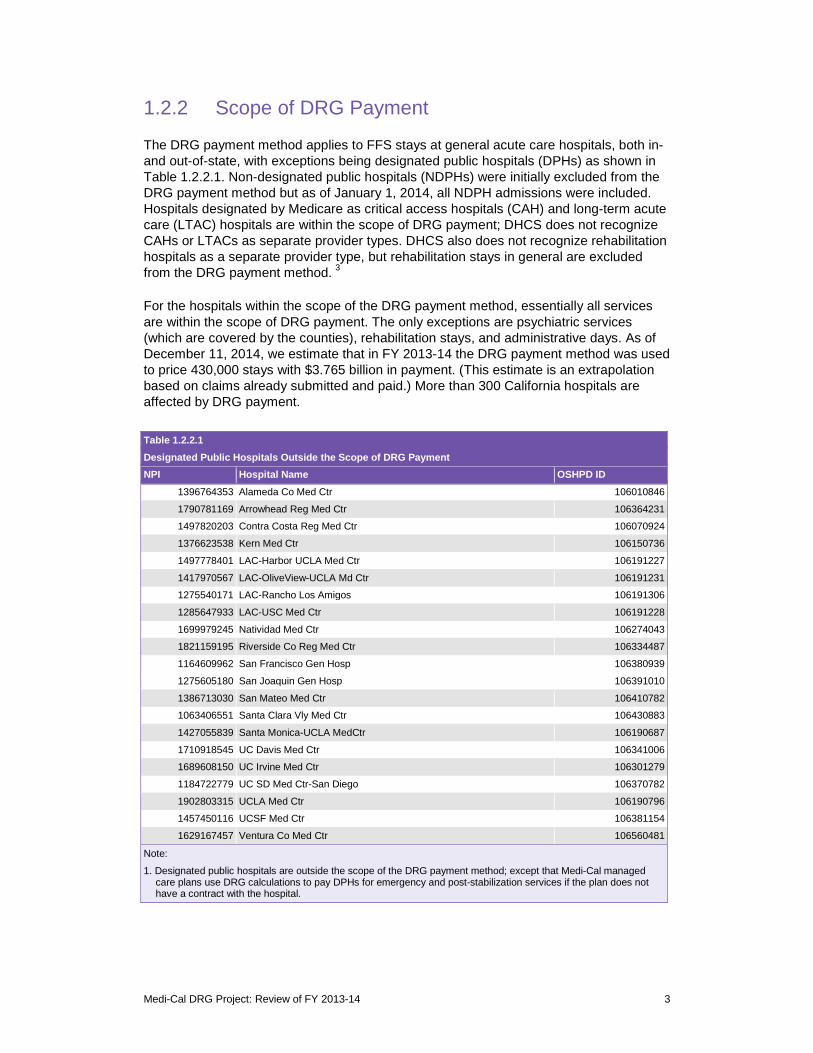
The DRG payment method applies to FFS stays at general acute care hospitals, both in- and out-of-state, with exceptions being designated public hospitals (DPHs) as shown in Table 1.2.2.1. Non-designated public hospitals (NDPHs) were initially excluded from the DRG payment method but as of January 1, 2014, all NDPH admissions were included. Hospitals designated by Medicare as critical access hospitals (CAH) and long-term acute care (LTAC) hospitals are within the scope of DRG payment; DHCS does not recognize CAHs or LTACs as separate provider types. DHCS also does not recognize rehabilitation hospitals as a separate provider type, but rehabilitation stays in general are excluded from the DRG payment method. 3
For the hospitals within the scope of the DRG payment method, essentially all services are within the scope of DRG payment. The only exceptions are psychiatric services (which are covered by the counties), rehabilitation stays, and administrative days. As of December 11, 2014, we estimate that in FY 2013-14 the DRG payment method was used to price 430,000 stays with $3.765 billion in payment. (This estimate is an extrapolation based on claims already submitted and paid.) More than 300 California hospitals are affected by DRG payment.
Table 1.2.2.1 Designated Public Hospitals Outside the Scope of DRG Payment NPI Hospital Name OSHPD ID
1396764353 Alameda Co Med Ctr 106010846
1790781169 Arrowhead Reg Med Ctr 106364231
1497820203 Contra Costa Reg Med Ctr 106070924
1376623538 Kern Med Ctr 106150736
1497778401 LAC-Harbor UCLA Med Ctr 106191227
1417970567 LAC-OliveView-UCLA Md Ctr 106191231
1275540171 LAC-Rancho Los Amigos 106191306
1285647933 LAC-USC Med Ctr 106191228
1699979245 Natividad Med Ctr 106274043
1821159195 Riverside Co Reg Med Ctr 106334487
1164609962 San Francisco Gen Hosp 106380939
1275605180 San Joaquin Gen Hosp 106391010
1386713030 San Mateo Med Ctr 106410782
1063406551 Santa Clara Vly Med Ctr 106430883
1427055839 Santa Monica-UCLA MedCtr 106190687
1710918545 UC Davis Med Ctr 106341006
1689608150 UC Irvine Med Ctr 106301279
1184722779 UC SD Med Ctr-San Diego 106370782
1902803315 UCLA Med Ctr 106190796
1457450116 UCSF Med Ctr 106381154
1629167457 Ventura Co Med Ctr 106560481
Note:
1. Designated public hospitals are outside the scope of the DRG payment method; except that Medi-Cal managed care plans use DRG calculations to pay DPHs for emergency and post-stabilization services if the plan does not have a contract with the hospital.
Medi-Cal DRG Project: Review of FY 2013-14 3
In addition to Medi-Cal FFS beneficiaries, the DRG method is used to pay for care received by patients who are ineligible for Medi-Cal but have coverage through California Children’s Services (CCS) or the Genetically Handicapped Persons Program (GHPP). The DRG method is also used by Medi-Cal managed care plans (MCPs) to pay hospitals (including designated public hospitals) outside their networks for emergency and post-stabilization services. Note that this document only includes FFS stays; all managed care stays, including those paid by APR-DRG for out-of-network care, are excluded.
1.2.3 Transition Period
To mitigate the impacts – positive and negative – of the move from the previous payment method to DRG-based payment, DHCS implemented a three-year transition period.4 Of the 332 California hospitals that were included in the ratesetting simulation for Year 1, 244 were designated as transition hospitals.5 Except for NDPHs, DRG base rates were set with the intention of keeping DRG payment within plus or minus 5% of what would have been paid under the previous method, as estimated using the Year 1 ratesetting simulation dataset.6 Based on the same simulation dataset, hospitals were advised in July 2013 of their projected base rates for Year 2 and Year 3.7 For Year 2, projected DRG base rates were set with the intention that the change in payment per stay would be within plus or minus 5% of Year 1. Similarly, for Year 3, projected DRG base rates were set with the intention that the change in payment per stay would be within plus or minus 5% of Year 2. For NDPHs, Year 1 transition base rates were set with the aim of limiting changes in total payments to no more than plus or minus 2.5% in Year 1, plus or minus 5% in Year 2, and plus or minus 7.5% in Year 3.
Hospitals were advised that the projected rates were subject to change for the updates shown in this report as well as for reasons that stem from DHCS’s monitoring of the new payment method after implementation. Although base rates were set with the intention of keeping changes in average payment per stay within specified bounds, a hospital’s actual experience will depend on volume, casemix, prevalence of outliers, cost per stay, etc. Hospitals were advised that there would be no reconciliation process comparing actual payments with simulated payments. For FY 2014-15, 228 hospitals are paid using the transition methodology. For FY 2015-16, 213 hospitals will be paid using the transition methodology. As of July 1, 2016, the transition period will have ended. Every hospital will be paid based on the statewide base rate (or remote rural statewide base rate if applicable) adjusted for local area wage differences.
Per DHCS direction, DRG rates for FY 2013-14 were set with a goal of budget neutrality relative to the rates that were paid under the previous payment method as of June 30, 2013. Increases in payment due to increased utilization under the Affordable Care Act were not included in the budget neutrality calculation, as we will see in Section 2.3.
Medi-Cal DRG Project: Review of FY 2013-14 4
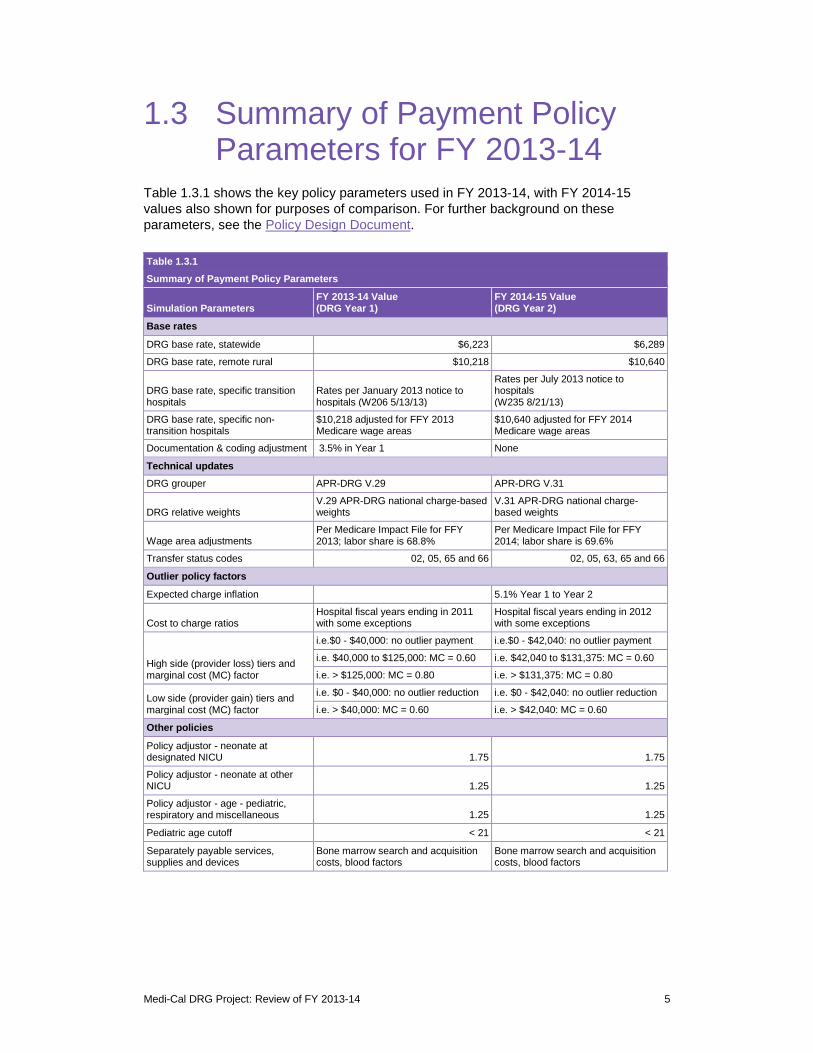
1.3 Summary of Payment Policy Parameters for FY 2013-14
Table 1.3.1 shows the key policy parameters used in FY 2013-14, with FY 2014-15 values also shown for purposes of comparison. For further background on these parameters, see the Policy Design Document.
Table 1.3.1 Summary of Payment Policy Parameters
Simulation Parameters FY 2013-14 Value (DRG Year 1)
FY 2014-15 Value (DRG Year 2)
Base rates
DRG base rate, statewide $6,223 $6,289
DRG base rate, remote rural $10,218 $10,640
DRG base rate, specific transition hospitals
Rates per January 2013 notice to hospitals (W206 5/13/13)
Rates per July 2013 notice to hospitals (W235 8/21/13)
DRG base rate, specific non-transition hospitals
$10,218 adjusted for FFY 2013 Medicare wage areas
$10,640 adjusted for FFY 2014 Medicare wage areas
Documentation & coding adjustment 3.5% in Year 1 None
Technical updates DRG grouper APR-DRG V.29 APR-DRG V.31
DRG relative weights V.29 APR-DRG national charge-based weights
V.31 APR-DRG national charge-based weights
Wage area adjustments Per Medicare Impact File for FFY 2013; labor share is 68.8%
Per Medicare Impact File for FFY 2014; labor share is 69.6%
Transfer status codes 02, 05, 65 and 66 02, 05, 63, 65 and 66
Outlier policy factors
Expected charge inflation 5.1% Year 1 to Year 2
Cost to charge ratios Hospital fiscal years ending in 2011 with some exceptions
Hospital fiscal years ending in 2012 with some exceptions
High side (provider loss) tiers and marginal cost (MC) factor
i.e.$0 - $40,000: no outlier payment i.e.$0 - $42,040: no outlier payment
i.e. $40,000 to $125,000: MC = 0.60 i.e. $42,040 to $131,375: MC = 0.60
i.e. > $125,000: MC = 0.80 i.e. > $131,375: MC = 0.80
Low side (provider gain) tiers and marginal cost (MC) factor
i.e. $0 - $40,000: no outlier reduction i.e. $0 - $42,040: no outlier reduction
i.e. > $40,000: MC = 0.60 i.e. > $42,040: MC = 0.60
Other policies
Policy adjustor - neonate at designated NICU 1.75 1.75
Policy adjustor - neonate at other NICU 1.25 1.25
Policy adjustor - age - pediatric, respiratory and miscellaneous 1.25 1.25
Pediatric age cutoff < 21 < 21
Separately payable services, supplies and devices
Bone marrow search and acquisition costs, blood factors
Bone marrow search and acquisition costs, blood factors
Medi-Cal DRG Project: Review of FY 2013-14 5
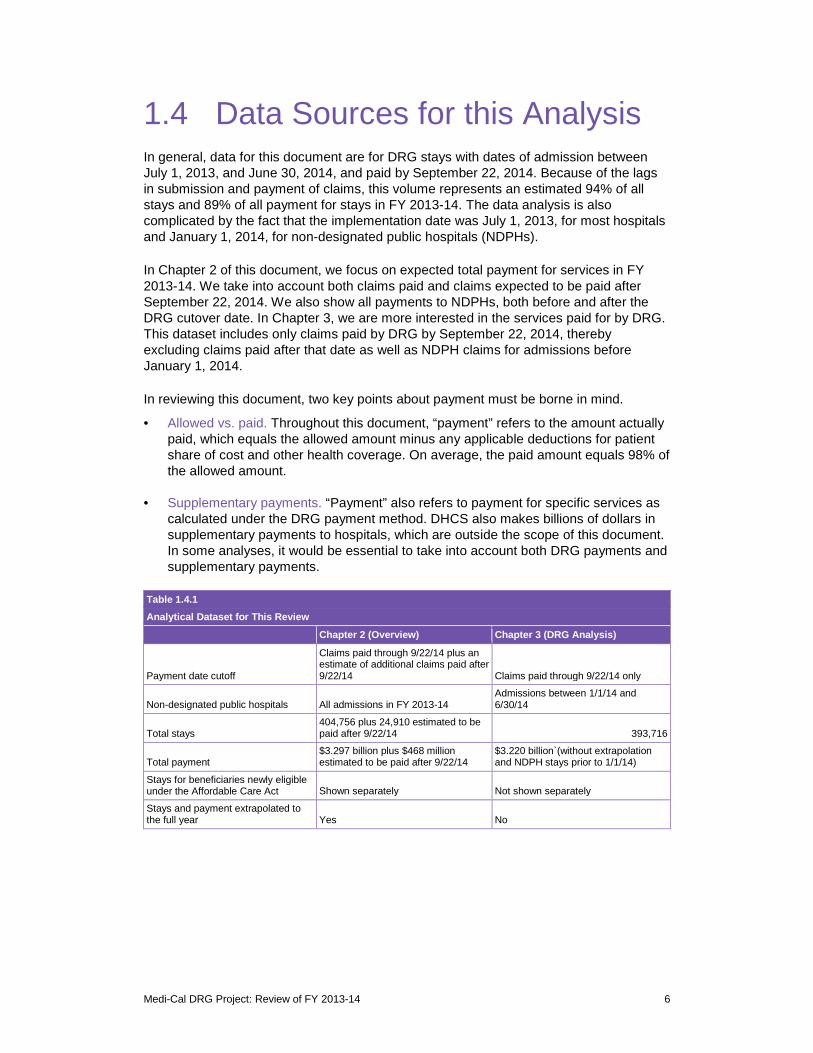
1.4 Data Sources for this Analysis In general, data for this document are for DRG stays with dates of admission between July 1, 2013, and June 30, 2014, and paid by September 22, 2014. Because of the lags in submission and payment of claims, this volume represents an estimated 94% of all stays and 89% of all payment for stays in FY 2013-14. The data analysis is also complicated by the fact that the implementation date was July 1, 2013, for most hospitals and January 1, 2014, for non-designated public hospitals (NDPHs).
In Chapter 2 of this document, we focus on expected total payment for services in FY 2013-14. We take into account both claims paid and claims expected to be paid after September 22, 2014. We also show all payments to NDPHs, both before and after the DRG cutover date. In Chapter 3, we are more interested in the services paid for by DRG. This dataset includes only claims paid by DRG by September 22, 2014, thereby excluding claims paid after that date as well as NDPH claims for admissions before January 1, 2014.
In reviewing this document, two key points about payment must be borne in mind.
• Allowed vs. paid. Throughout this document, “payment” refers to the amount actually paid, which equals the allowed amount minus any applicable deductions for patient share of cost and other health coverage. On average, the paid amount equals 98% of the allowed amount.
• Supplementary payments. “Payment” also refers to payment for specific services as calculated under the DRG payment method. DHCS also makes billions of dollars in supplementary payments to hospitals, which are outside the scope of this document. In some analyses, it would be essential to take into account both DRG payments and supplementary payments.
Table 1.4.1 Analytical Dataset for This Review
Payment
Non-designated public hospitals
Total stays
Total payment
Stays for beneficiaries newly eligible under the Affordable Care Act
Stays and payment extrapolated to the full year
date cutoff
Chapter 2 (Overview)
Claims paid through 9/22/14 plus an estimate of additional claims paid after 9/22/14
All admissions in FY 2013-14
404,756 plus 24,910 estimated to be paid after 9/22/14
$3.297 billion plus $468 million estimated to be paid after 9/22/14
Shown separately
Yes
Chapter 3 (DRG Analysis)
Claims paid
Admissions between 1/1/14 and 6/30/14
$3.220 billion`(without extrapolationand NDPH stays prior to 1/1/14)
Not shown separately
No
through 9/22/14 only
393,716
Medi-Cal DRG Project: Review of FY 2013-14 6
1.5 For Further Information The following documents should be useful to readers interested in more detail on the DRG payment method. Many are available on the DHCS DRG webpage at http://www.dhcs.ca.gov/provgovpart/pages/DRG.aspx.
• DRG Pricing Calculator: An interactive tool to estimate the price of a claim based on the APR-DRG, hospital characteristics, and clinical information.
• Frequently asked questions: A resource that describes the scope of the DRG payment method, impacts on provider billing, and other changes.
• Policy Design Document: A detailed document that describes all aspects leading up to and following the implementation of DRG payment.
• Medicaid State Plan8: The document approved by CMS that authorizes Medi-Cal to implement DRG payment.
Medi-Cal DRG Project: Review of FY 2013-14 7
2 Overview of Utilization and Payment
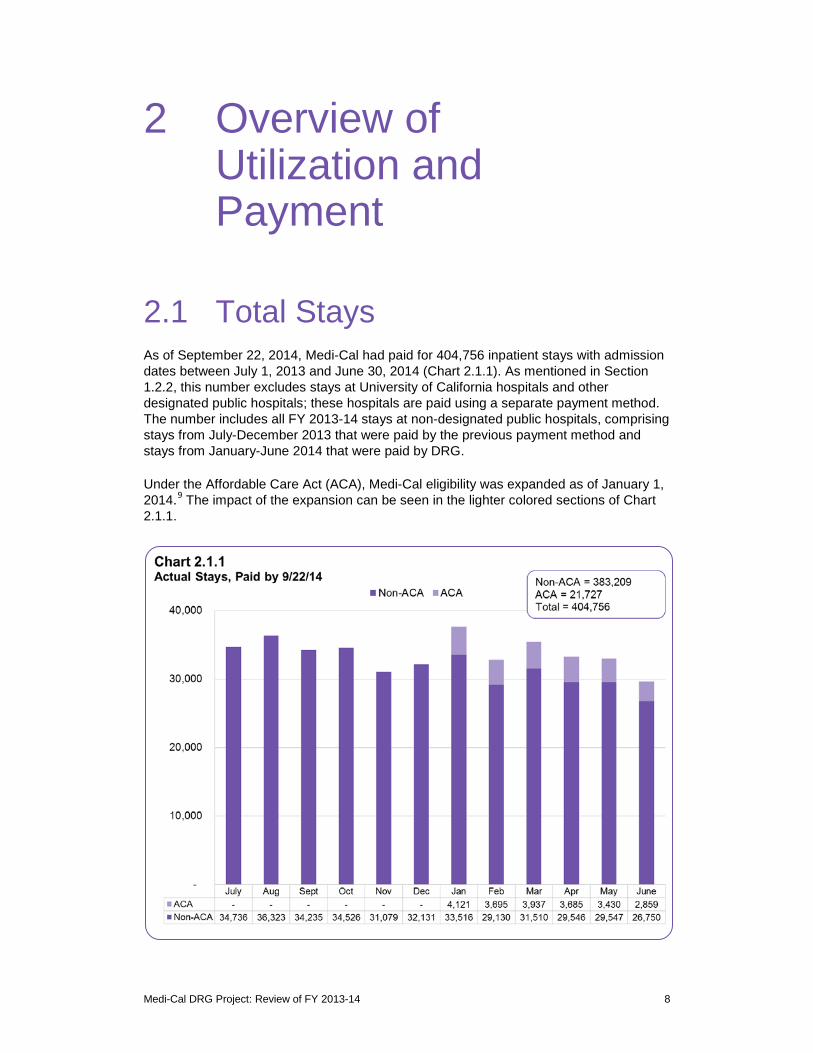
2.1 Total Stays As of September 22, 2014, Medi-Cal had paid for 404,756 inpatient stays with admission dates between July 1, 2013 and June 30, 2014 (Chart 2.1.1). As mentioned in Section 1.2.2, this number excludes stays at University of California hospitals and other designated public hospitals; these hospitals are paid using a separate payment method. The number includes all FY 2013-14 stays at non-designated public hospitals, comprising stays from July-December 2013 that were paid by the previous payment method and stays from January-June 2014 that were paid by DRG.
Under the Affordable Care Act (ACA), Medi-Cal eligibility was expanded as of January 1, 2014.9 The impact of the expansion can be seen in the lighter colored sections of Chart 2.1.1.
Medi-Cal DRG Project: Review of FY 2013-14 8
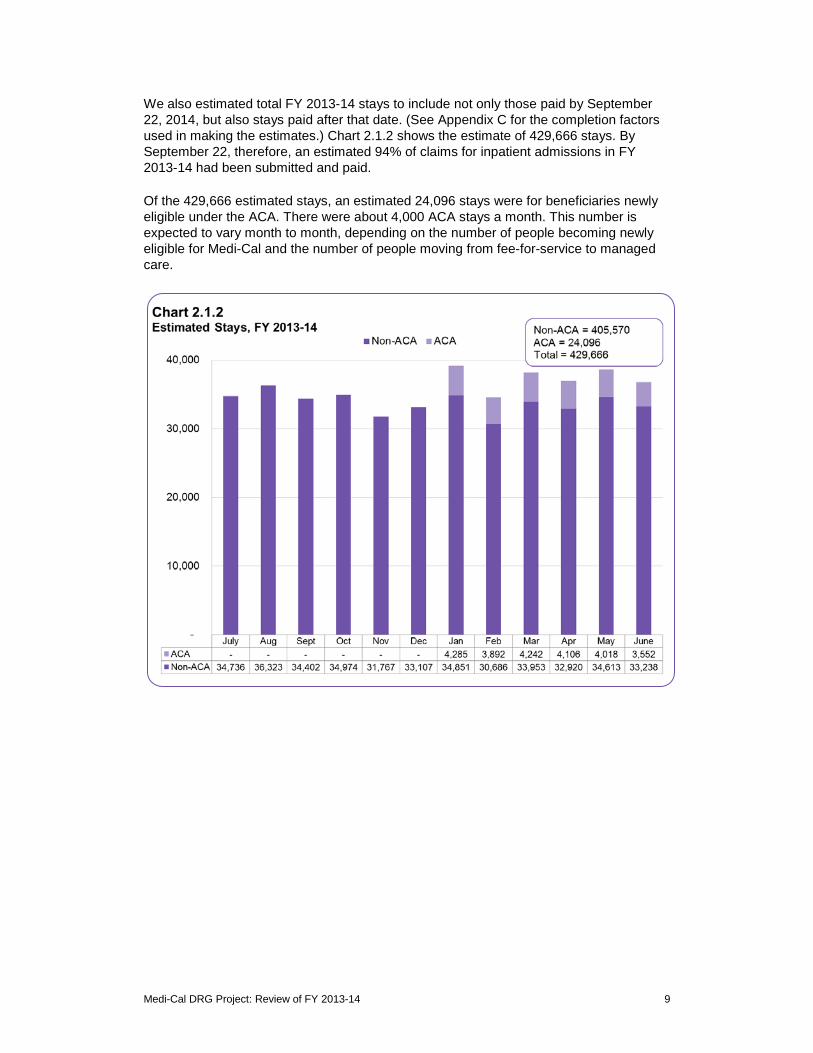
We also estimated total FY 2013-14 stays to include not only those paid by September 22, 2014, but also stays paid after that date. (See Appendix C for the completion factors used in making the estimates.) Chart 2.1.2 shows the estimate of 429,666 stays. By September 22, therefore, an estimated 94% of claims for inpatient admissions in FY 2013-14 had been submitted and paid.
Of the 429,666 estimated stays, an estimated 24,096 stays were for beneficiaries newly eligible under the ACA. There were about 4,000 ACA stays a month. This number is expected to vary month to month, depending on the number of people becoming newly eligible for Medi-Cal and the number of people moving from fee-for-service to managed care.
Medi-Cal DRG Project: Review of FY 2013-14 9
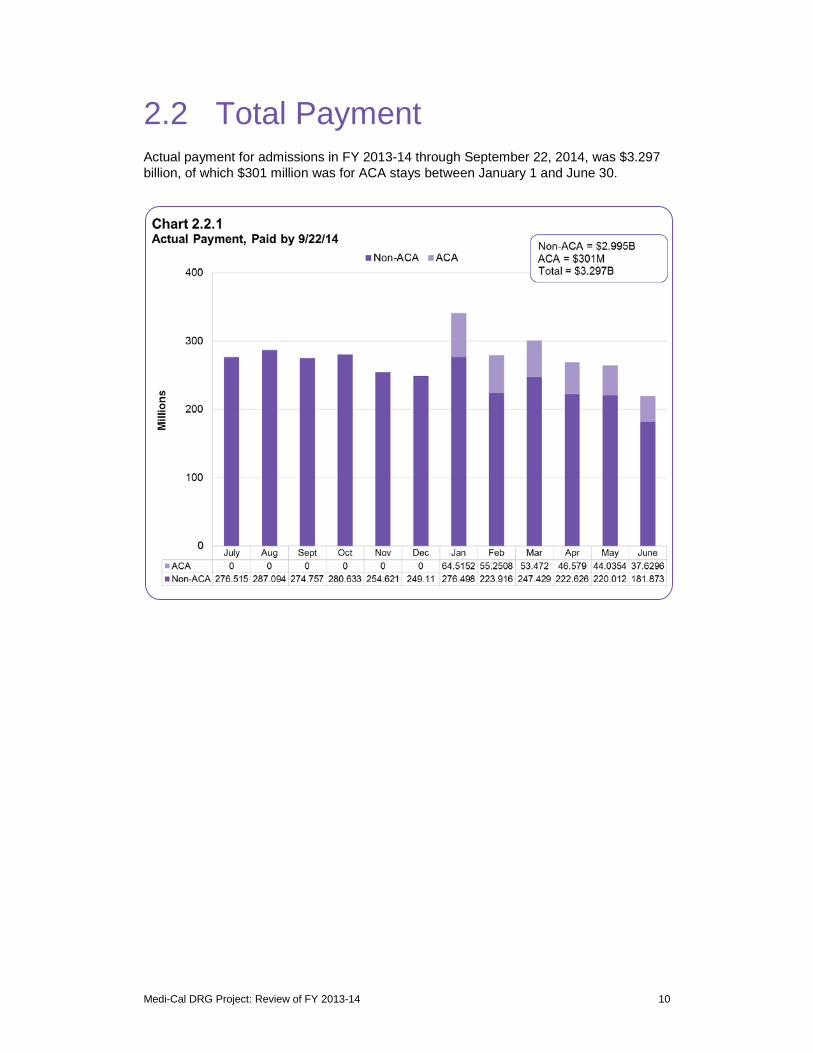
2.2 Total Payment Actual payment for admissions in FY 2013-14 through September 22, 2014, was $3.297 billion, of which $301 million was for ACA stays between January 1 and June 30.
Medi-Cal DRG Project: Review of FY 2013-14 10
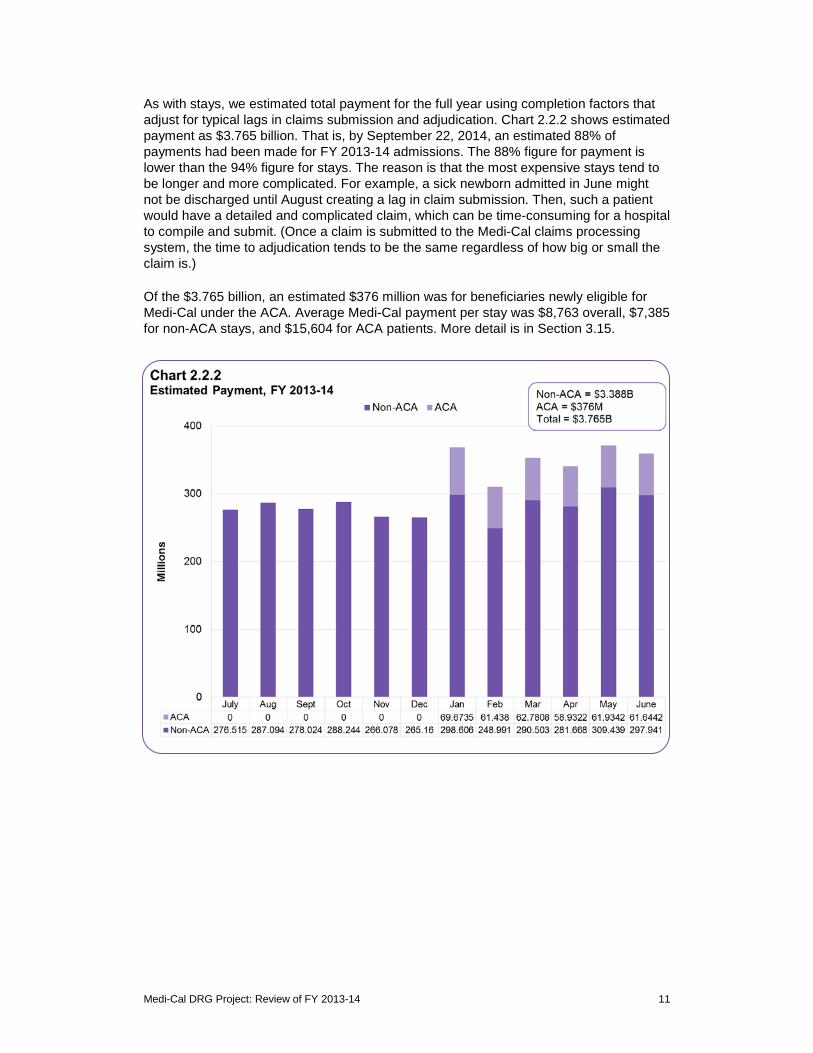
As with stays, we estimated total payment for the full year using completion factors that adjust for typical lags in claims submission and adjudication. Chart 2.2.2 shows estimated payment as $3.765 billion. That is, by September 22, 2014, an estimated 88% of payments had been made for FY 2013-14 admissions. The 88% figure for payment is lower than the 94% figure for stays. The reason is that the most expensive stays tend to be longer and more complicated. For example, a sick newborn admitted in June might not be discharged until August creating a lag in claim submission. Then, such a patient would have a detailed and complicated claim, which can be time-consuming for a hospital to compile and submit. (Once a claim is submitted to the Medi-Cal claims processing system, the time to adjudication tends to be the same regardless of how big or small the claim is.)
Of the $3.765 billion, an estimated $376 million was for beneficiaries newly eligible for Medi-Cal under the ACA. Average Medi-Cal payment per stay was $8,763 overall, $7,385 for non-ACA stays, and $15,604 for ACA patients. More detail is in Section 3.15.
Medi-Cal DRG Project: Review of FY 2013-14 11

2.3 Payment Relative to Expectations
In implementing DRG payment July 1, 2013, the goal was budget neutrality relative to what would have been paid under the previous method as of June 30, 2013. The previous payment method was quite different in many respects, including not only incentives and pricing calculations but also billing rules. Before July 1, 2013, for example, hospitals often submitted multiple claims for different days of the same stay and mothers and normal newborns were billed on the same claim. The Medi-Cal claims processing system also stored only two diagnosis codes and two procedure codes. Moreover, Medi-Cal was also undertaking a significant shift of FFS beneficiaries to managed care plans. Extensive analysis of our CY 2009 baseline dataset was therefore necessary to simulate payment and set rates for implementation July 1, 2013.10
In such a dynamic environment, we analyzed the question of budget neutrality from several perspectives. (In general, we value robustness in analyzing evidence on complex policy questions.) Our conclusion is that budget neutrality was achieved, as evidenced by the following considerations.
• Comparison with FY 2012-13. Chart 2.3.1 shows that FY 2013-14 cumulative weekly payments very closely tracked the previous year, except that the impact of additional ACA stays can be seen starting in January 2014. Increased utilization due to the ACA expansion was budgeted separately, so aggregate payment for non-ACA stays was very similar to what it had been the previous year. These two payment streams are by payment date, including all stays regardless of admission date.
Medi-Cal DRG Project: Review of FY 2013-14 12
• Comparison with previous method. A precise comparison of payment for individual stays under the DRG method vs the previous method was not possible, due to differences in billing practices (especially for newborns), changes in treatment authorization rules, and growth in billed charges at hospitals that previously were non-contract and paid at a percentage of charges. (Payment to non-contract hospitals also was previously subject to cost settlement, whereas payment under the DRG method is final, subject to certain exceptions.) To the extent that a comparison was possible, it showed DRG payment overall was very similar to what would have been paid under the previous method using FY 2012-13 rates.
Although DRG payment overall was budget neutral, some individual hospitals did see payment levels above or below projections. The projections had been based on CY 2009 utilization and payment trended forward to June 30, 2013. Differences between projections and actual experience reflected differences in volume, casemix, the managed care transition, and billed charges (which affect outlier payment under the DRG method). In percentage terms, even if payment changes between the simulation and FY 2013-14 were not always as projected, we expect changes between FY 2013-14 and FY 2014-15 to be quite close to projections for individual hospitals, for two reasons. First, for individual hospitals volume and casemix are less likely to differ between FY 2013-14 and FY 2014-15 than between CY 2009 and FY 2013-14. Second, now that DRG payment is in place, a change of, say, 5% in a hospital’s DRG base rate can be expected to result in a 5% change in total payment, all other things equal. In July 2013, hospitals were advised of their projected DRG base rates for FYs 2014-15, 2015-16, and 2016-17.
Medi-Cal DRG Project: Review of FY 2013-14 13

3 DRG Payment
3.1 Medicaid Care Category Medicaid Care Category (MCC) is an algorithm developed by Xerox for purposes of analyzing Medicaid inpatient utilization.11 Its 10 categories reflect the policy areas of a typical Medicaid program and the internal organization of a typical hospital. In purpose, it is similar to the familiar Major Diagnostic Category (MDC) scheme used by Medicare. The main differences are that we differentiate pediatric vs. adult patients and normal newborns vs. sick newborns. Adult patients are those 21 years old and older; obstetric patients may be of any age. The number of MCCs (10 for California) is also more manageable than the number of MDCs (25).
Charts 3.1.1 and Charts 3.1.2 for Medi-Cal are quite typical of national Medicaid inpatient utilization, except for the exclusion of psychiatric stays that are paid by the counties in California. Obstetrics, pediatrics, and newborns account for 71% of all stays. For these categories, Medi-Cal is a significant part of the market, especially when Medi-Cal managed care plans are also included. (Managed care stays are excluded from all numbers in this report.)
While obstetrics and normal newborns represent 54% of all stays, they represent just 15% of all payments. The reason is that these stays are typically short (two to four days) and relatively inexpensive. Neonate (sick newborn) stays, by contrast, represented 4% of stays but 19% of payment. For neonates, average length of stay was 16.6 days, average hospital charges were $196,620, and average Medi-Cal payment was $35,882. Similarly, the miscellaneous pediatric and adult categories represented 11% and 15% of stays respectively but 20% and 26% of payment.
Medi-Cal DRG Project: Review of FY 2013-14 14

Medi-Cal DRG Project: Review of FY 2013-14 15

3.2 The Concentration of Spending Any analysis of healthcare spending must take into account the so-called concentration of spending. At the national level, 5% of patients account for 50% of health care spending. This pattern tends to repeat itself in less aggregated analyses for different types of services and different populations. So it is with the Medi-Cal FFS inpatient hospital benefit, as shown in Chart 3.2.1. Five percent of the stays accounted for 47% of Medi-Cal payments; indeed, the top 1% accounted for 24% of payments. The most expensive stays tend to be very sick newborns, multisystem traumas, and patients with co-occurring serious conditions such as septicemia and organ failure. The least expensive 50% of stays, by contrast, are almost all deliveries and normal newborns. They accounted for just 10% of payments.
Because the sickest patients are much more likely to have multiple admissions within a year, the spending pattern in Chart 3.2.1 would be even more concentrated if the left-hand column represented patients rather than stays.
12
Medi-Cal DRG Project: Review of FY 2013-14 16
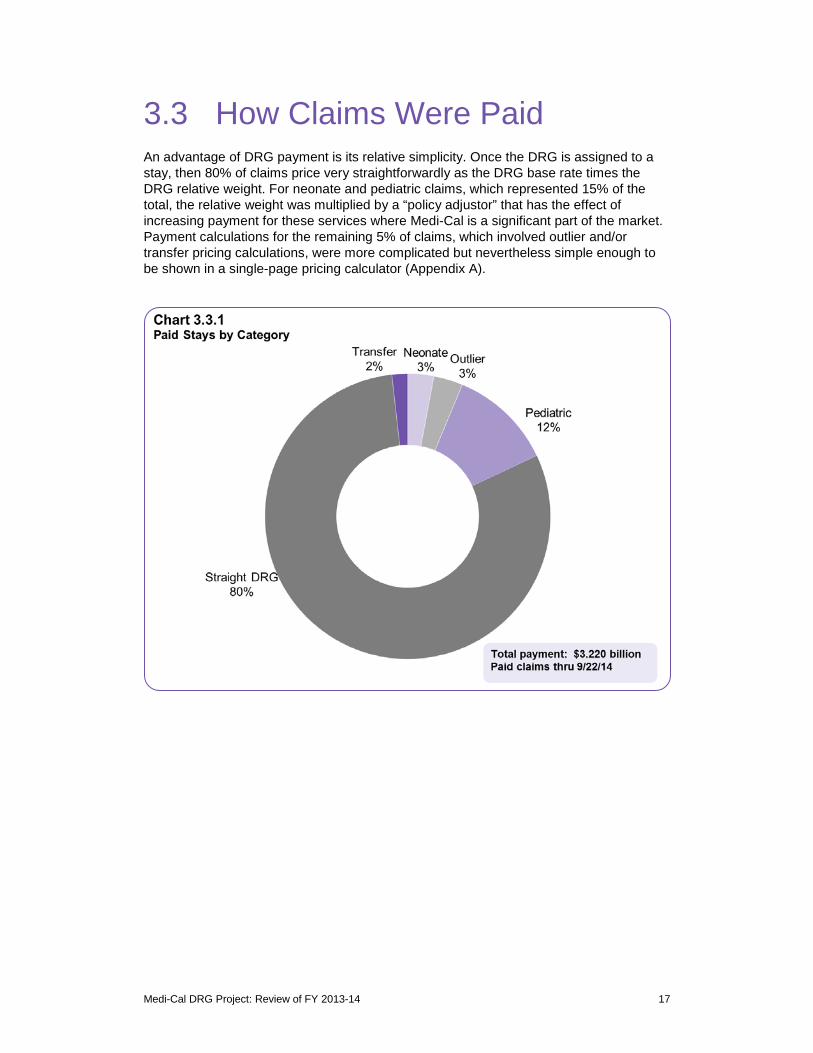
3.3 How Claims Were Paid An advantage of DRG payment is its relative simplicity. Once the DRG is assigned to a stay, then 80% of claims price very straightforwardly as the DRG base rate times the DRG relative weight. For neonate and pediatric claims, which represented 15% of the total, the relative weight was multiplied by a “policy adjustor” that has the effect of increasing payment for these services where Medi-Cal is a significant part of the market. Payment calculations for the remaining 5% of claims, which involved outlier and/or transfer pricing calculations, were more complicated but nevertheless simple enough to be shown in a single-page pricing calculator (Appendix A).
Medi-Cal DRG Project: Review of FY 2013-14 17
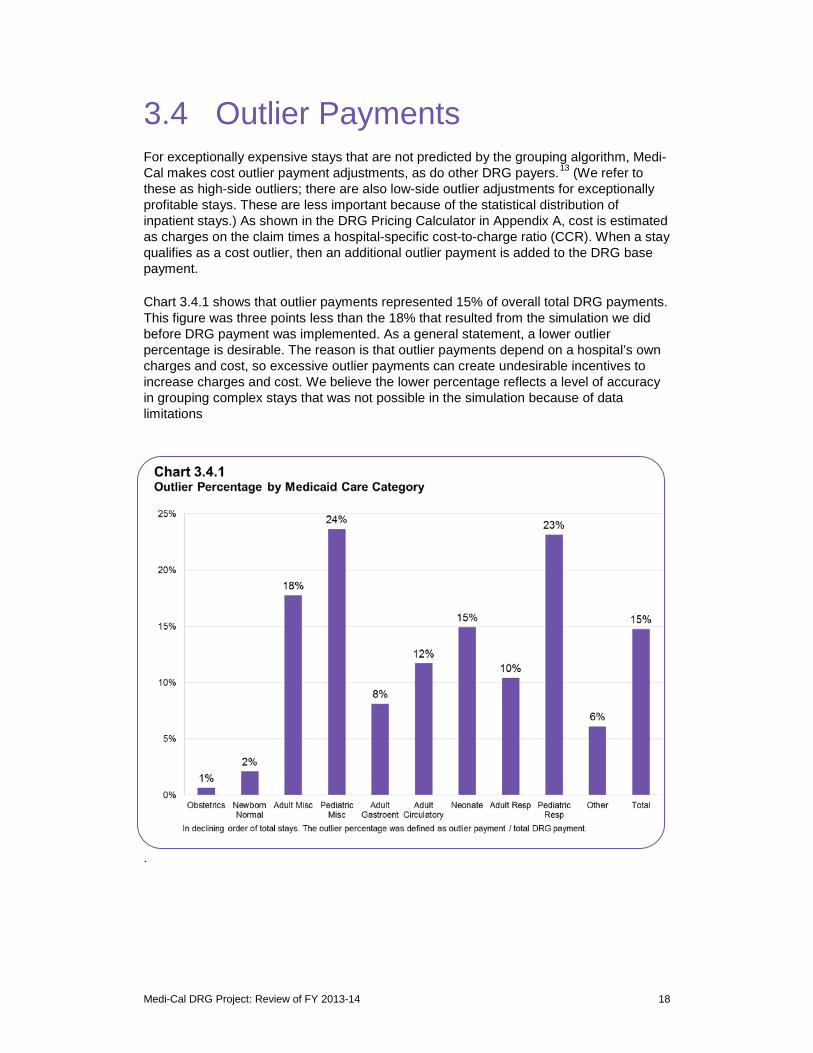
3.4 Outlier Payments For exceptionally expensive stays that are not predicted by the grouping algorithm, Medi-Cal makes cost outlier payment adjustments, as do other DRG payers.13 (We refer to these as high-side outliers; there are also low-side outlier adjustments for exceptionally profitable stays. These are less important because of the statistical distribution of inpatient stays.) As shown in the DRG Pricing Calculator in Appendix A, cost is estimated as charges on the claim times a hospital-specific cost-to-charge ratio (CCR). When a stay qualifies as a cost outlier, then an additional outlier payment is added to the DRG base payment.
Chart 3.4.1 shows that outlier payments represented 15% of overall total DRG payments. This figure was three points less than the 18% that resulted from the simulation we did before DRG payment was implemented. As a general statement, a lower outlier percentage is desirable. The reason is that outlier payments depend on a hospital’s own charges and cost, so excessive outlier payments can create undesirable incentives to increase charges and cost. We believe the lower percentage reflects a level of accuracy in grouping complex stays that was not possible in the simulation because of data limitations
.
Medi-Cal DRG Project: Review of FY 2013-14 18
3.5 Obstetric Stays In this and the following sections, we show data by Medicaid Care Category and by base APR-DRG. Because DRG algorithms have come to define “the product of a hospital,” they enable conversations among clinicians, administrators and policy makers about inpatient hospital care. Table 3.5.1, for example, shows the Obstetrics care category, which represented 28% of stays and 12% of payment FY 2013-14. The table also shows that deliveries (APR-DRGs 540, 541, 542 and 560) represented 92% of obstetric stays and that cesarean sections (APR-DRG 540) represented 33% of deliveries.
In reviewing these tables by Medicaid Care Category, four reminders are pertinent.
• Managed care stays are excluded. This document includes data only for the Medi-Cal FFS hospital inpatient benefit. The managed care plans, of course, pay for a large volume of inpatient hospital care.
• Payments exclude supplementary payments. DHCS pays billions of dollars to hospitals in supplementary payments that are separate from the claim payments shown in these tables. Any analysis of overall payment levels for hospital care must take these payments into account.
• Billed charges are a misleading benchmark. On average, California hospitals set charges about four times higher than their actual costs. Medi-Cal, Medicare, and many commercial payers appropriately pay substantially less than charges.
• DRG detail is at the level of the base APR-DRG. The APR-DRG system includes 314 base DRGs, each with four levels of severity of illness (minor, moderate, severe, and extreme). Table 3.5.1 shows results at the level of the base DRG, which can be thought of as the reason for the visit. For each base DRG, payment varies depends on whether the severity of illness is 1, 2, 3 or 4.
Medi-Cal DRG Project: Review of FY 2013-14 19

Table 3.5.1
Medicaid Care Category: Obstetrics
Averages
APR-DRG Description Stays Days Charges Payment Casemix Outlier Amt Days Charges Payment
560
540
566
541
563
561
545
544
564
546
565
542
Total
Vaginal Del
Cesarean Del
Oth Antepartum Diags
Vag Del w Ster &/or D&C
Threatened Abortion
Postpartum Diags w/o Proc
Ectopic Pregnancy Proc
D&C for Obstetric Diags
Abortion w/o D&C
Oth O.R. Proc for Ob Diag Exc Del
False Labor
Vag Del w Proc Exc Ster &/or D&C
66,900
33,769
4,770
2,154
1,406
783
458
456
314
218
192
166
111,586
144,938
117,894
11,894
5,227
3,417
2,352
929
805
487
683
224
453
289,303
$1,297,938,813
$1,195,229,637
$102,143,321
$74,846,175
$25,334,158
$27,541,529
$20,360,968
$15,184,209
$6,186,784
$10,593,878
$1,473,606
$5,119,987
$2,781,953,066
$181,357,079
$155,722,271
$13,367,985
$9,398,766
$3,550,757
$3,300,329
$2,905,230
$2,424,075
$833,271
$1,727,579
$269,003
$722,209
$375,578,554
0.33
0.57
0.36
0.51
0.33
0.51
0.77
0.63
0.33
0.86
0.16
0.46
0.41
$368,217
$1,446,404
$118,282
$11,089
$31,061
$98,593
$38,161
$29,617
$0
$359,208
$0
$11,863
$2,512,496
2.2 $19,401
3.5 $35,394
2.5 $21,414
2.4 $34,748
2.4 $18,019
3.0 $35,174
2.0 $44,456
1.8 $33,299
1.6 $19,703
3.1 $48,596
1.2 $7,675
2.7 $30,843
2.6 $24,931
$2,711
$4,611
$2,803
$4,363
$2,525
$4,215
$6,343
$5,316
$2,654
$7,925
$1,401
$4,351
$3,366
Note: Total day counts may differ from CA-MMIS data summaries because same-day stays are counted as 1-day stays in this table and as 0-day stays in CA-MMIS.
Medi-Cal DRG Project: Review of FY 2013-14 20
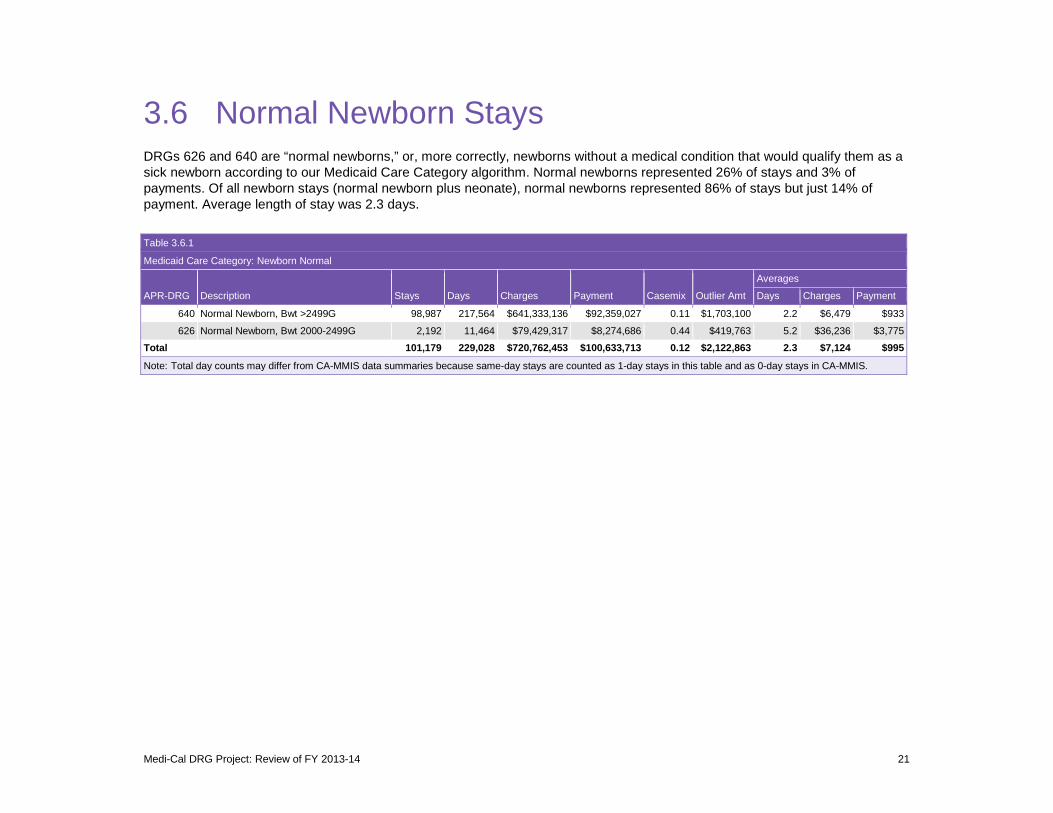
3.6 Normal Newborn Stays DRGs 626 and 640 are “normal newborns,” or, more correctly, newborns without a medical condition that would qualify them as a sick newborn according to our Medicaid Care Category algorithm. Normal newborns represented 26% of stays and 3% of payments. Of all newborn stays (normal newborn plus neonate), normal newborns represented 86% of stays but just 14% of payment. Average length of stay was 2.3 days.
Table 3.6.1
Medicaid Care Category: Newborn Normal
Averages
APR-DRG Description Stays Days Charges Payment Casemix Outlier Amt Days Charges Payment
640 Normal Newborn, Bwt >2499G 98,987 217,564 $641,333,136 $92,359,027 0.11 $1,703,100 2.2 $6,479 $933
626 Normal Newborn, Bwt 2000-2499G 2,192 11,464 $79,429,317 $8,274,686 0.44 $419,763 5.2 $36,236 $3,775
Total 101,179 229,028 $720,762,453 $100,633,713 0.12 $2,122,863 2.3 $7,124 $995
Note: Total day counts may differ from CA-MMIS data summaries because same-day stays are counted as 1-day stays in this table and as 0-day stays in CA-MMIS.
Medi-Cal DRG Project: Review of FY 2013-14 21

3.7 Adult Miscellaneous Stays The Miscellaneous Adult category includes all stays for adults except obstetrics and circulatory, respiratory, and gastroenterological conditions. It represented 15% of stays and 26% of payment.
Table 3.7.1
Medicaid Care Category: Miscellaneous Adult
Sorted in Order of Declining Stays
Averages
APR-DRG Description Stays Days Charges Payment Casemix Outlier Amt Days Charges Payment
720 Septicemia & Disseminated Inf 9,805 79,220 $1,105,672,247 $154,968,378 1.91 $22,207,926 8.1 $112,766 $15,805
383 Cellulitis & Oth Bact Skin Inf 2,959 12,761 $125,246,086 $15,944,016 0.65 $445,292 4.3 $42,327 $5,388
460 Renal Failure 2,331 13,322 $153,092,146 $17,776,670 0.98 $1,375,942 5.7 $65,677 $7,626
463 Kidney & Urinary Tract Inf 2,266 8,296 $86,221,782 $10,480,695 0.66 $160,691 3.7 $38,050 $4,625
420 Diabetes 2,120 6,983 $88,687,809 $11,608,769 0.67 $285,871 3.3 $41,834 $5,476
045 CVA & Precereb Occl w Infarct 2,026 12,744 $166,134,591 $18,059,600 1.13 $1,780,371 6.3 $82,001 $8,914
710 Inf & Parasit Dis Incl HIV w O.R. Proc 1,418 22,818 $348,908,413 $60,789,362 4.52 $13,008,618 16.1 $246,057 $42,870
663 Oth Dis of Blood & Rel Organs 1,348 4,314 $55,183,825 $6,934,255 0.72 $192,107 3.2 $40,938 $5,144
812 Poisoning of Medicinal Agents 1,204 4,823 $71,332,423 $9,978,848 0.83 $1,581,656 4.0 $59,246 $8,288
425 Electrolyte Dis Exc Hypovolemia 1,202 4,097 $50,353,475 $6,034,484 0.70 $204,476 3.4 $41,891 $5,020
053 Seizure 1,162 4,578 $59,947,657 $7,608,478 0.83 $732,622 3.9 $51,590 $6,548
052 Nontraumatic Stupor & Coma 766 3,816 $44,372,462 $6,315,132 1.10 $608,602 5.0 $57,927 $8,244
951 Mod Ext Proc Unrel To Diag 744 6,216 $91,085,426 $14,986,332 2.31 $2,189,334 8.4 $122,427 $20,143
347 Oth Back & Neck Dis, Fx & Injuries 695 2,612 $34,371,550 $3,660,362 0.73 $198,644 3.8 $49,455 $5,267
861 Signs, Symptoms & Oth Factors 688 2,521 $26,249,233 $3,250,376 0.60 $140,077 3.7 $38,153 $4,724
048 Nerve Disorders 687 2,914 $31,335,925 $4,298,151 0.78 $231,541 4.2 $45,613 $6,256
313 Knee & Lower Leg Procs Exc Foot 658 3,414 $71,266,987 $9,004,675 1.48 $951,241 5.2 $108,308 $13,685
721 Post-Op, Post-Trauma, Device Inf 646 5,451 $63,190,222 $7,961,832 1.51 $1,257,993 8.4 $97,818 $12,325
044 Intracranial Hemorrhage 628 5,947 $82,003,559 $9,987,911 1.78 $1,644,047 9.5 $130,579 $15,904
308 Hip & Femur Procs for Trauma 628 4,172 $74,363,931 $8,512,699 1.67 $777,882 6.6 $118,414 $13,555
466 Complic Genitourin Dev or Proc 623 3,375 $45,233,269 $6,110,299 1.28 $552,672 5.4 $72,606 $9,808
351 Oth Muscskl & Connect Tis Diags 615 2,457 $27,439,226 $3,339,302 0.69 $129,583 4.0 $44,617 $5,430
021 Craniotomy Exc for Trauma 579 8,345 $173,579,434 $28,707,488 5.49 $5,885,778 14.4 $299,792 $49,581
047 Transient Ischemia 552 1,255 $21,159,727 $2,572,056 0.65 $22,328 2.3 $38,333 $4,660
468 Oth Kidney & Urinary Diags 546 2,511 $30,918,552 $3,702,673 0.81 $378,806 4.6 $56,627 $6,781
Medi-Cal DRG Project: Review of FY 2013-14 22
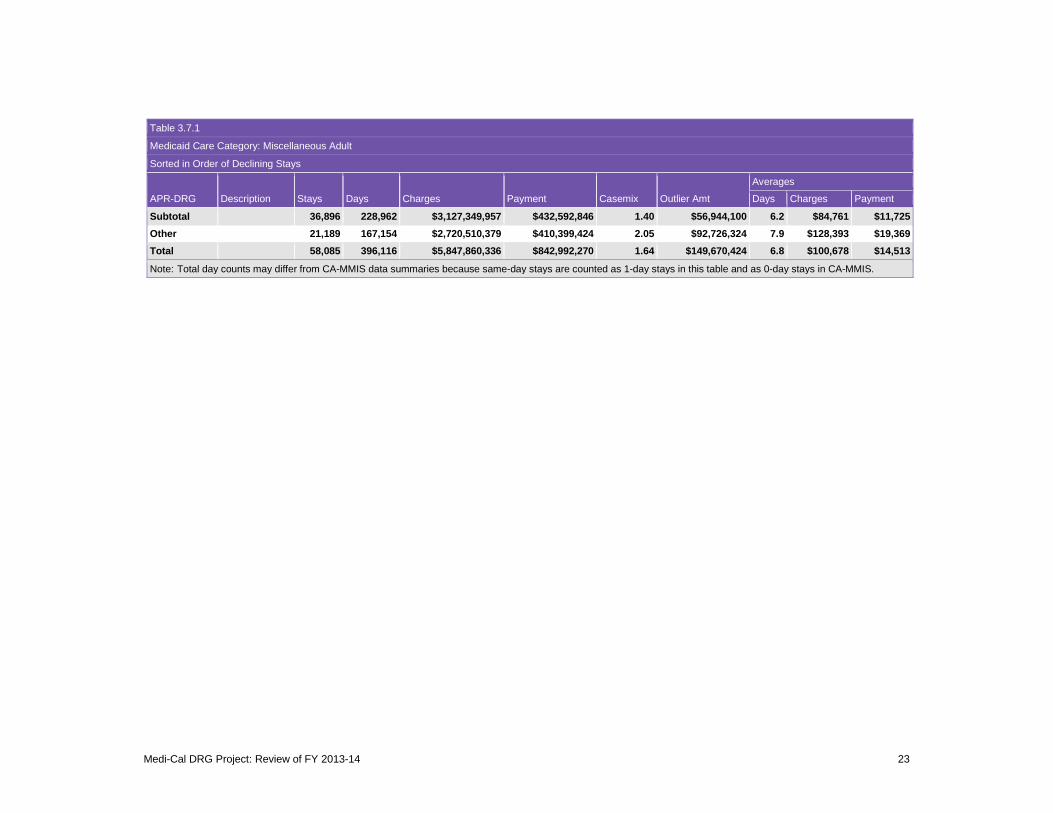
Table 3.7.1
Medicaid Care Category: Miscellaneous Adult
Sorted in Order of Declining Stays
Averages
APR-DRG Description
Stays Days Charges Payment Casemix Outlier Amt Days Charges Payment
Subtotal 36,896 228,962 $3,127,349,957 $432,592,846 1.40 $56,944,100 6.2 $84,761 $11,725 Other 21,189 167,154 $2,720,510,379 $410,399,424 2.05 $92,726,324 7.9 $128,393 $19,369 Total 58,085 396,116 $5,847,860,336 $842,992,270 1.64 $149,670,424 6.8 $100,678 $14,513
Note: Total day counts may differ from CA-MMIS data summaries because same-day stays are counted as 1-day stays in this table and as 0-day stays in CA-MMIS.
Medi-Cal DRG Project: Review of FY 2013-14 23
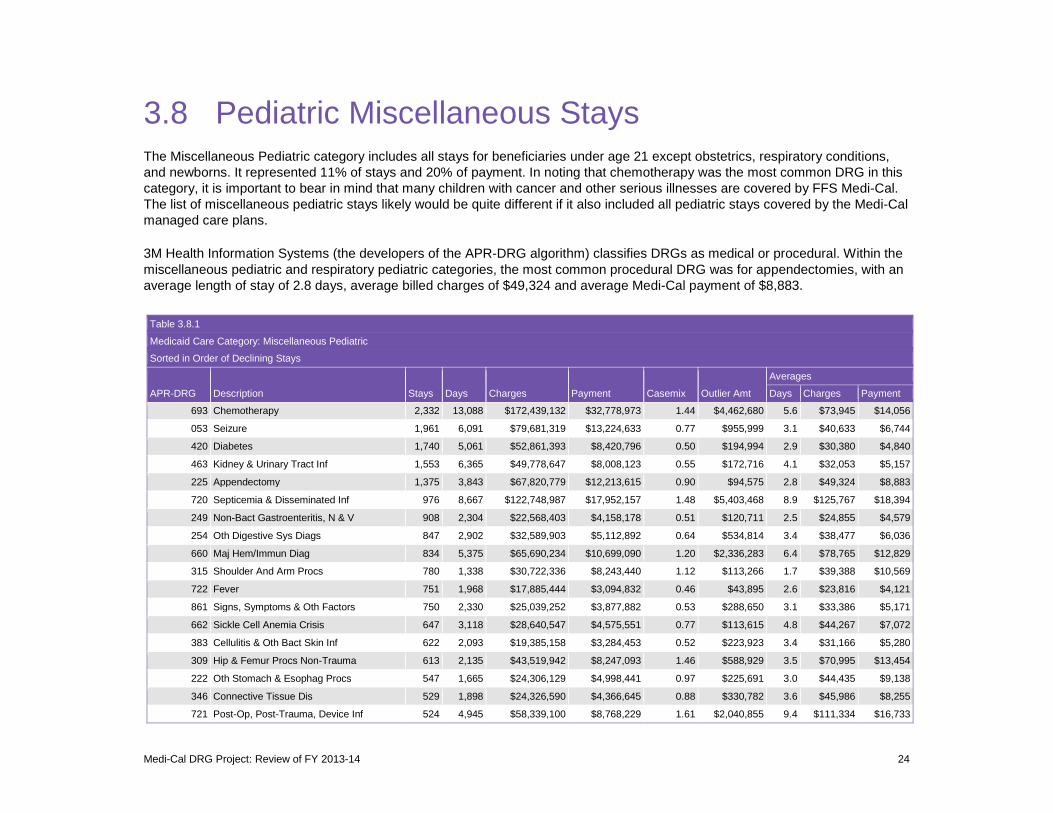
3.8 Pediatric Miscellaneous Stays The Miscellaneous Pediatric category includes all stays for beneficiaries under age 21 except obstetrics, respiratory conditions, and newborns. It represented 11% of stays and 20% of payment. In noting that chemotherapy was the most common DRG in this category, it is important to bear in mind that many children with cancer and other serious illnesses are covered by FFS Medi-Cal. The list of miscellaneous pediatric stays likely would be quite different if it also included all pediatric stays covered by the Medi-Cal managed care plans.
3M Health Information Systems (the developers of the APR-DRG algorithm) classifies DRGs as medical or procedural. Within the miscellaneous pediatric and respiratory pediatric categories, the most common procedural DRG was for appendectomies, with an average length of stay of 2.8 days, average billed charges of $49,324 and average Medi-Cal payment of $8,883.
Table 3.8.1
Medicaid Care Category: Miscellaneous Pediatric
Sorted in Order of Declining Stays
Averages
APR-DRG Description Stays Days Charges Payment Casemix Outlier Amt Days Charges Payment
693 Chemotherapy 2,332 13,088 $172,439,132 $32,778,973 1.44 $4,462,680 5.6 $73,945 $14,056
053 Seizure 1,961 6,091 $79,681,319 $13,224,633 0.77 $955,999 3.1 $40,633 $6,744
420 Diabetes 1,740 5,061 $52,861,393 $8,420,796 0.50 $194,994 2.9 $30,380 $4,840
463 Kidney & Urinary Tract Inf 1,553 6,365 $49,778,647 $8,008,123 0.55 $172,716 4.1 $32,053 $5,157
225 Appendectomy 1,375 3,843 $67,820,779 $12,213,615 0.90 $94,575 2.8 $49,324 $8,883
720 Septicemia & Disseminated Inf 976 8,667 $122,748,987 $17,952,157 1.48 $5,403,468 8.9 $125,767 $18,394
249 Non-Bact Gastroenteritis, N & V 908 2,304 $22,568,403 $4,158,178 0.51 $120,711 2.5 $24,855 $4,579
254 Oth Digestive Sys Diags 847 2,902 $32,589,903 $5,112,892 0.64 $534,814 3.4 $38,477 $6,036
660 Maj Hem/Immun Diag 834 5,375 $65,690,234 $10,699,090 1.20 $2,336,283 6.4 $78,765 $12,829
315 Shoulder And Arm Procs 780 1,338 $30,722,336 $8,243,440 1.12 $113,266 1.7 $39,388 $10,569
722 Fever 751 1,968 $17,885,444 $3,094,832 0.46 $43,895 2.6 $23,816 $4,121
861 Signs, Symptoms & Oth Factors 750 2,330 $25,039,252 $3,877,882 0.53 $288,650 3.1 $33,386 $5,171
662 Sickle Cell Anemia Crisis 647 3,118 $28,640,547 $4,575,551 0.77 $113,615 4.8 $44,267 $7,072
383 Cellulitis & Oth Bact Skin Inf 622 2,093 $19,385,158 $3,284,453 0.52 $223,923 3.4 $31,166 $5,280
309 Hip & Femur Procs Non-Trauma 613 2,135 $43,519,942 $8,247,093 1.46 $588,929 3.5 $70,995 $13,454
222 Oth Stomach & Esophag Procs 547 1,665 $24,306,129 $4,998,441 0.97 $225,691 3.0 $44,435 $9,138
346 Connective Tissue Dis 529 1,898 $24,326,590 $4,366,645 0.88 $330,782 3.6 $45,986 $8,255
721 Post-Op, Post-Trauma, Device Inf 524 4,945 $58,339,100 $8,768,229 1.61 $2,040,855 9.4 $111,334 $16,733
Medi-Cal DRG Project: Review of FY 2013-14 24
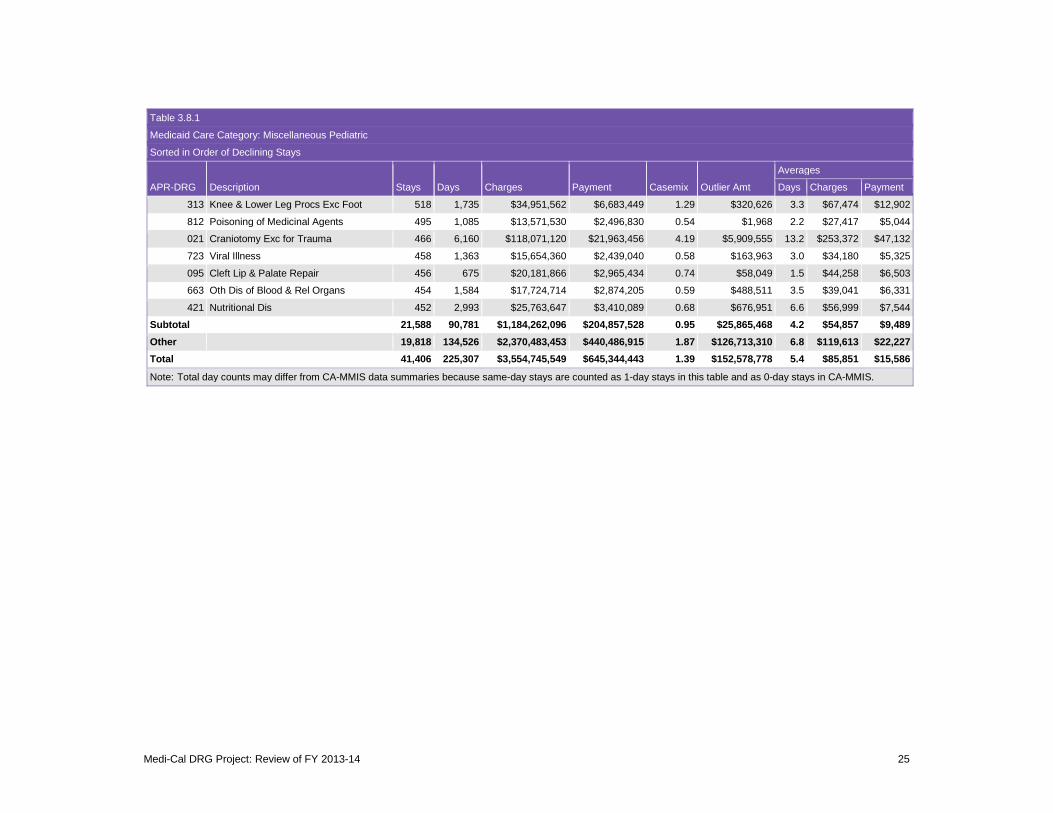
Table 3.8.1
Medicaid Care Category: Miscellaneous Pediatric
Sorted in Order of Declining Stays
Averages
APR-DRG Description Stays Days Charges Payment Casemix Outlier Amt Days Charges Payment
313 Knee & Lower Leg Procs Exc Foot 518 1,735 $34,951,562 $6,683,449 1.29 $320,626 3.3 $67,474 $12,902
812 Poisoning of Medicinal Agents 495 1,085 $13,571,530 $2,496,830 0.54 $1,968 2.2 $27,417 $5,044
021 Craniotomy Exc for Trauma 466 6,160 $118,071,120 $21,963,456 4.19 $5,909,555 13.2 $253,372 $47,132
723 Viral Illness 458 1,363 $15,654,360 $2,439,040 0.58 $163,963 3.0 $34,180 $5,325
095 Cleft Lip & Palate Repair 456 675 $20,181,866 $2,965,434 0.74 $58,049 1.5 $44,258 $6,503
663 Oth Dis of Blood & Rel Organs 454 1,584 $17,724,714 $2,874,205 0.59 $488,511 3.5 $39,041 $6,331
421 Nutritional Dis 452 2,993 $25,763,647 $3,410,089 0.68 $676,951 6.6 $56,999 $7,544
Subtotal 21,588 90,781 $1,184,262,096 $204,857,528 0.95 $25,865,468 4.2 $54,857 $9,489 Other 19,818 134,526 $2,370,483,453 $440,486,915 1.87 $126,713,310 6.8 $119,613 $22,227 Total 41,406 225,307 $3,554,745,549 $645,344,443 1.39 $152,578,778 5.4 $85,851 $15,586
Note: Total day counts may differ from CA-MMIS data summaries because same-day stays are counted as 1-day stays in this table and as 0-day stays in CA-MMIS.
Medi-Cal DRG Project: Review of FY 2013-14 25
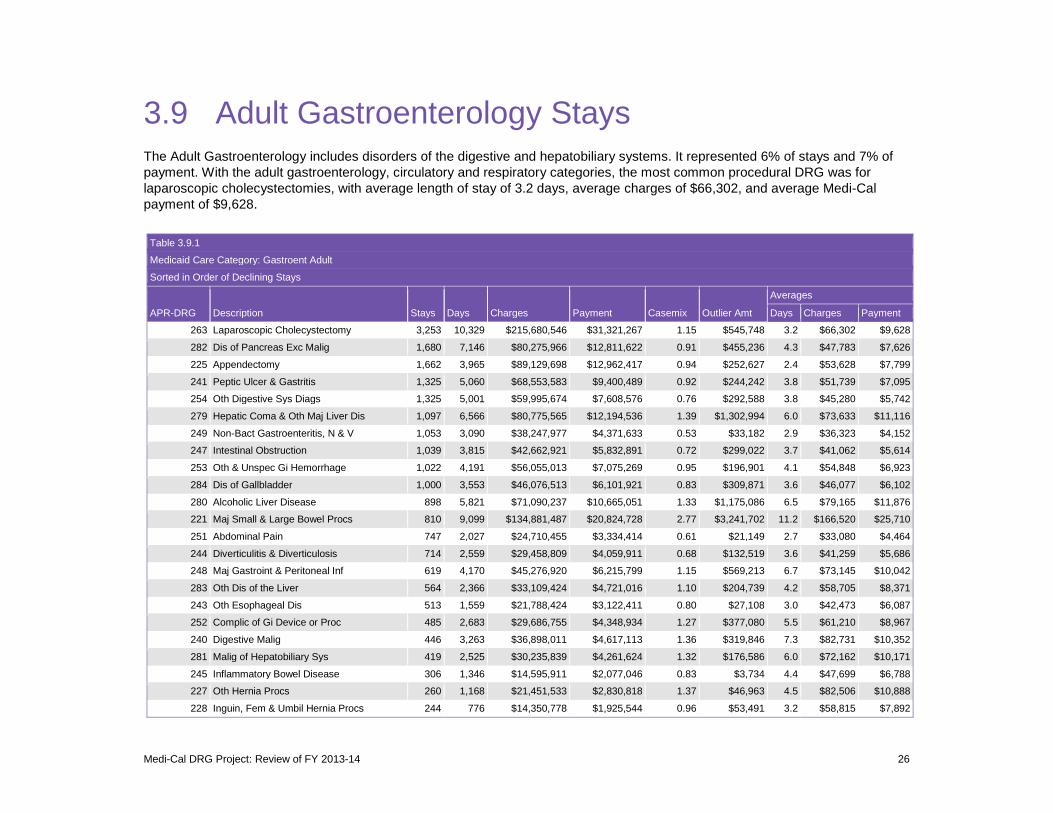
3.9 Adult Gastroenterology Stays The Adult Gastroenterology includes disorders of the digestive and hepatobiliary systems. It represented 6% of stays and 7% of payment. With the adult gastroenterology, circulatory and respiratory categories, the most common procedural DRG was for laparoscopic cholecystectomies, with average length of stay of 3.2 days, average charges of $66,302, and average Medi-Cal payment of $9,628.
Table 3.9.1
Medicaid Care Category: Gastroent Adult
Sorted in Order of Declining Stays
Averages
APR-DRG Description Stays Days Charges Payment Casemix Outlier Amt Days Charges Payment
263 Laparoscopic Cholecystectomy 3,253 10,329 $215,680,546 $31,321,267 1.15 $545,748 3.2 $66,302 $9,628
282 Dis of Pancreas Exc Malig 1,680 7,146 $80,275,966 $12,811,622 0.91 $455,236 4.3 $47,783 $7,626
225 Appendectomy 1,662 3,965 $89,129,698 $12,962,417 0.94 $252,627 2.4 $53,628 $7,799
241 Peptic Ulcer & Gastritis 1,325 5,060 $68,553,583 $9,400,489 0.92 $244,242 3.8 $51,739 $7,095
254 Oth Digestive Sys Diags 1,325 5,001 $59,995,674 $7,608,576 0.76 $292,588 3.8 $45,280 $5,742
279 Hepatic Coma & Oth Maj Liver Dis 1,097 6,566 $80,775,565 $12,194,536 1.39 $1,302,994 6.0 $73,633 $11,116
249 Non-Bact Gastroenteritis, N & V 1,053 3,090 $38,247,977 $4,371,633 0.53 $33,182 2.9 $36,323 $4,152
247 Intestinal Obstruction 1,039 3,815 $42,662,921 $5,832,891 0.72 $299,022 3.7 $41,062 $5,614
253 Oth & Unspec Gi Hemorrhage 1,022 4,191 $56,055,013 $7,075,269 0.95 $196,901 4.1 $54,848 $6,923
284 Dis of Gallbladder 1,000 3,553 $46,076,513 $6,101,921 0.83 $309,871 3.6 $46,077 $6,102
280 Alcoholic Liver Disease 898 5,821 $71,090,237 $10,665,051 1.33 $1,175,086 6.5 $79,165 $11,876
221 Maj Small & Large Bowel Procs 810 9,099 $134,881,487 $20,824,728 2.77 $3,241,702 11.2 $166,520 $25,710
251 Abdominal Pain 747 2,027 $24,710,455 $3,334,414 0.61 $21,149 2.7 $33,080 $4,464
244 Diverticulitis & Diverticulosis 714 2,559 $29,458,809 $4,059,911 0.68 $132,519 3.6 $41,259 $5,686
248 Maj Gastroint & Peritoneal Inf 619 4,170 $45,276,920 $6,215,799 1.15 $569,213 6.7 $73,145 $10,042
283 Oth Dis of the Liver 564 2,366 $33,109,424 $4,721,016 1.10 $204,739 4.2 $58,705 $8,371
243 Oth Esophageal Dis 513 1,559 $21,788,424 $3,122,411 0.80 $27,108 3.0 $42,473 $6,087
252 Complic of Gi Device or Proc 485 2,683 $29,686,755 $4,348,934 1.27 $377,080 5.5 $61,210 $8,967
240 Digestive Malig 446 3,263 $36,898,011 $4,617,113 1.36 $319,846 7.3 $82,731 $10,352
281 Malig of Hepatobiliary Sys 419 2,525 $30,235,839 $4,261,624 1.32 $176,586 6.0 $72,162 $10,171
245 Inflammatory Bowel Disease 306 1,346 $14,595,911 $2,077,046 0.83 $3,734 4.4 $47,699 $6,788
227 Oth Hernia Procs 260 1,168 $21,451,533 $2,830,818 1.37 $46,963 4.5 $82,506 $10,888
228 Inguin, Fem & Umbil Hernia Procs 244 776 $14,350,778 $1,925,544 0.96 $53,491 3.2 $58,815 $7,892
Medi-Cal DRG Project: Review of FY 2013-14 26

Table 3.9.1
Medicaid Care Category: Gastroent Adult
Sorted in Order of Declining Stays
Averages
APR-DRG Description Stays Days Charges Payment Casemix Outlier Amt Days Charges Payment
242 Maj Esophageal Dis 210 897 $13,520,949 $1,845,517 1.11 $54,595 4.3 $64,385 $8,788
220 Maj Stomach & Esophag Procs 206 2,537 $42,030,144 $7,239,680 3.83 $1,875,047 12.3 $204,030 $35,144
Subtotal 21,897 95,512 $1,340,539,132 $191,770,227 1.07 $12,211,271 4.4 $61,220 $8,758 Other 1,158 10,226 $180,140,950 $26,650,868 2.79 $5,518,569 8.8 $155,562 $23,015 Total 23,055 105,738 $1,520,680,082 $218,421,095 1.16 $17,729,840 4.6 $65,959 $9,474
Note: Total day counts may differ from CA-MMIS data summaries because same-day stays are counted as 1-day stays in this table and as 0-day stays in CA-MMIS.
Medi-Cal DRG Project: Review of FY 2013-14 27
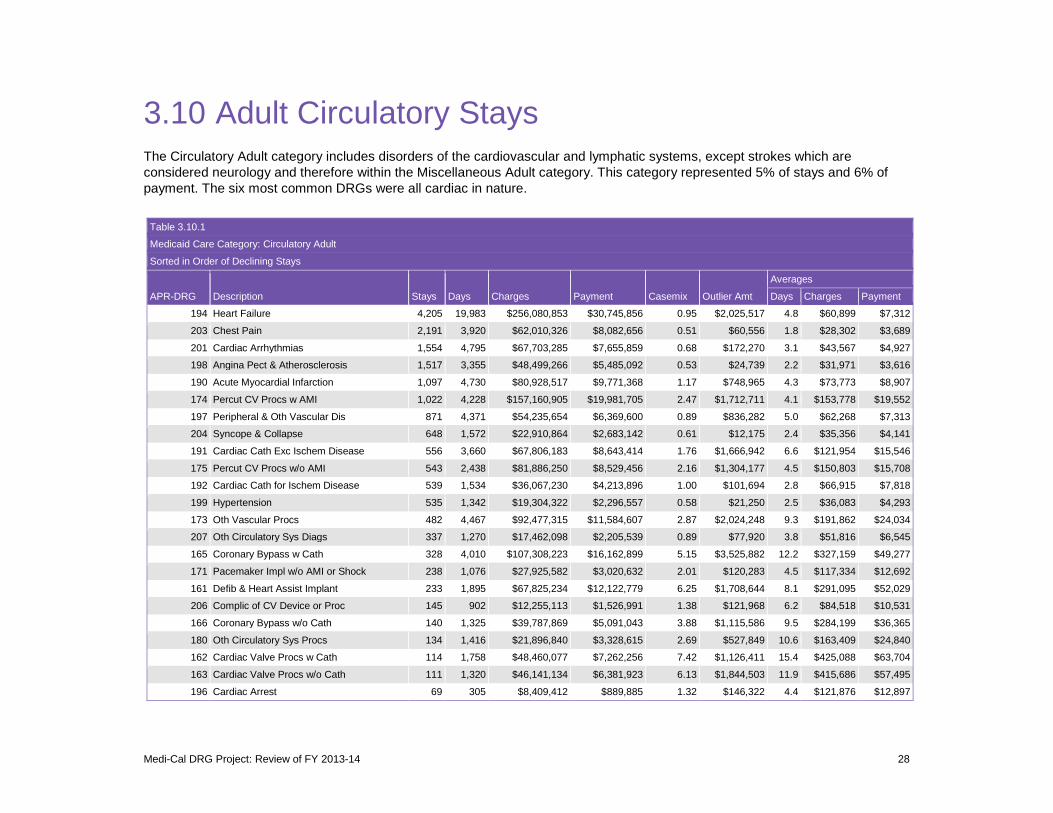
3.10 Adult Circulatory Stays The Circulatory Adult category includes disorders of the cardiovascular and lymphatic systems, except strokes which are considered neurology and therefore within the Miscellaneous Adult category. This category represented 5% of stays and 6% of payment. The six most common DRGs were all cardiac in nature.
Table 3.10.1
Medicaid Care Category: Circulatory Adult
Sorted in Order of Declining Stays
Averages
APR-DRG Description Stays Days Charges Payment Casemix Outlier Amt Days Charges Payment
194 Heart Failure 4,205 19,983 $256,080,853 $30,745,856 0.95 $2,025,517 4.8 $60,899 $7,312
203 Chest Pain 2,191 3,920 $62,010,326 $8,082,656 0.51 $60,556 1.8 $28,302 $3,689
201 Cardiac Arrhythmias 1,554 4,795 $67,703,285 $7,655,859 0.68 $172,270 3.1 $43,567 $4,927
198 Angina Pect & Atherosclerosis 1,517 3,355 $48,499,266 $5,485,092 0.53 $24,739 2.2 $31,971 $3,616
190 Acute Myocardial Infarction 1,097 4,730 $80,928,517 $9,771,368 1.17 $748,965 4.3 $73,773 $8,907
174 Percut CV Procs w AMI 1,022 4,228 $157,160,905 $19,981,705 2.47 $1,712,711 4.1 $153,778 $19,552
197 Peripheral & Oth Vascular Dis 871 4,371 $54,235,654 $6,369,600 0.89 $836,282 5.0 $62,268 $7,313
204 Syncope & Collapse 648 1,572 $22,910,864 $2,683,142 0.61 $12,175 2.4 $35,356 $4,141
191 Cardiac Cath Exc Ischem Disease 556 3,660 $67,806,183 $8,643,414 1.76 $1,666,942 6.6 $121,954 $15,546
175 Percut CV Procs w/o AMI 543 2,438 $81,886,250 $8,529,456 2.16 $1,304,177 4.5 $150,803 $15,708
192 Cardiac Cath for Ischem Disease 539 1,534 $36,067,230 $4,213,896 1.00 $101,694 2.8 $66,915 $7,818
199 Hypertension 535 1,342 $19,304,322 $2,296,557 0.58 $21,250 2.5 $36,083 $4,293
173 Oth Vascular Procs 482 4,467 $92,477,315 $11,584,607 2.87 $2,024,248 9.3 $191,862 $24,034
207 Oth Circulatory Sys Diags 337 1,270 $17,462,098 $2,205,539 0.89 $77,920 3.8 $51,816 $6,545
165 Coronary Bypass w Cath 328 4,010 $107,308,223 $16,162,899 5.15 $3,525,882 12.2 $327,159 $49,277
171 Pacemaker Impl w/o AMI or Shock 238 1,076 $27,925,582 $3,020,632 2.01 $120,283 4.5 $117,334 $12,692
161 Defib & Heart Assist Implant 233 1,895 $67,825,234 $12,122,779 6.25 $1,708,644 8.1 $291,095 $52,029
206 Complic of CV Device or Proc 145 902 $12,255,113 $1,526,991 1.38 $121,968 6.2 $84,518 $10,531
166 Coronary Bypass w/o Cath 140 1,325 $39,787,869 $5,091,043 3.88 $1,115,586 9.5 $284,199 $36,365
180 Oth Circulatory Sys Procs 134 1,416 $21,896,840 $3,328,615 2.69 $527,849 10.6 $163,409 $24,840
162 Cardiac Valve Procs w Cath 114 1,758 $48,460,077 $7,262,256 7.42 $1,126,411 15.4 $425,088 $63,704
163 Cardiac Valve Procs w/o Cath 111 1,320 $46,141,134 $6,381,923 6.13 $1,844,503 11.9 $415,686 $57,495
196 Cardiac Arrest 69 305 $8,409,412 $889,885 1.32 $146,322 4.4 $121,876 $12,897
Medi-Cal DRG Project: Review of FY 2013-14 28

Table 3.10.1
Medicaid Care Category: Circulatory Adult
Sorted in Order of Declining Stays
Averages
APR-DRG Description Stays Days Charges Payment Casemix Outlier Amt Days Charges Payment
169 Maj Vascular Procs 66 681 $17,914,812 $3,319,589 4.67 $876,378 10.3 $271,437 $50,297
200 Cardiac Structural Dis 57 263 $3,428,702 $343,004 0.93 $27,213 4.6 $60,153 $6,018
205 Cardiomyopathy 41 130 $1,916,146 $270,738 0.82 $0 3.2 $46,735 $6,603
193 Acute & Subacute Endocarditis 34 462 $5,055,296 $722,515 2.24 $122,988 13.6 $148,685 $21,250
176 Pacemaker & Defib Replacement 30 109 $3,626,726 $471,558 2.45 $50,576 3.6 $120,891 $15,719
170 Pacemaker Impl w AMI or Shock 28 182 $4,309,563 $597,092 3.19 $12,496 6.5 $153,913 $21,325
167 Oth Cardiothoracic Procs 23 209 $8,375,621 $1,032,782 5.20 $269,148 9.1 $364,157 $44,904
177 Pacemaker & Defib Revision 22 118 $1,912,084 $299,429 1.79 $1,136 5.4 $86,913 $13,610
Total 17,910 77,826 $1,491,081,500 $191,092,476 1.33 $22,386,830 4.35 $83,254 $10,670
Note: Total day counts may differ from CA-MMIS data summaries because same-day stays are counted as 1-day stays in this table and as 0-day stays in CA-MMIS.
Medi-Cal DRG Project: Review of FY 2013-14 29
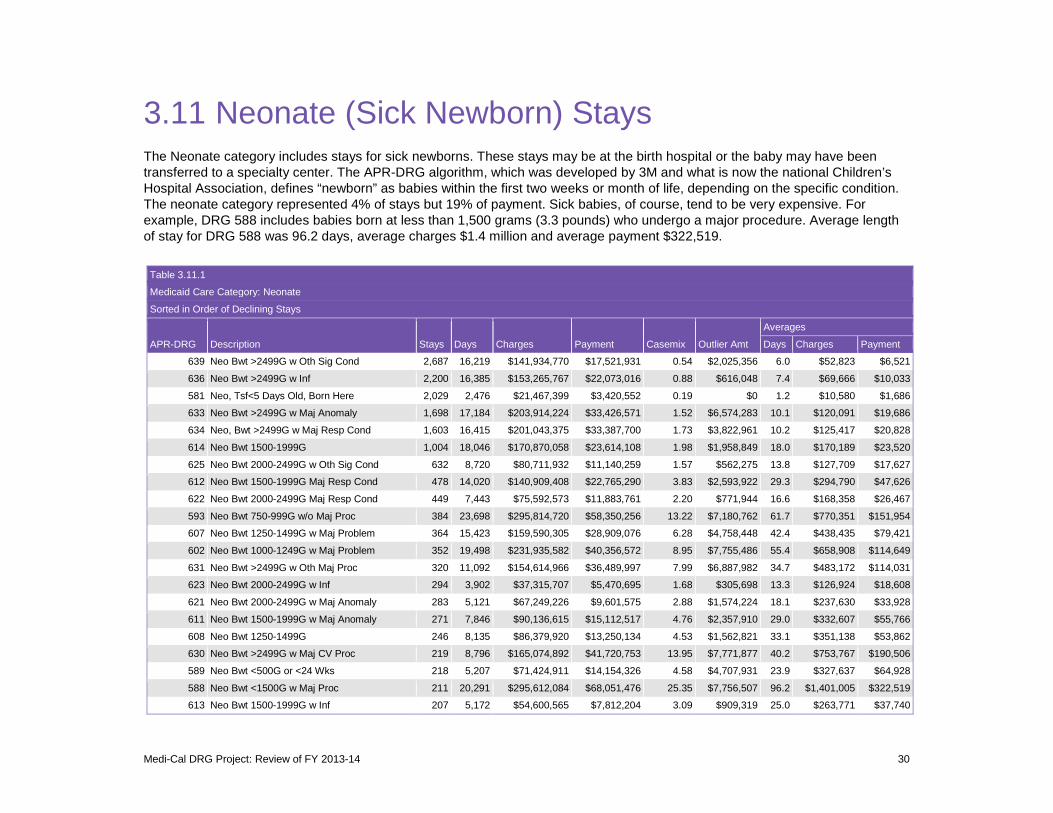
3.11 Neonate (Sick Newborn) Stays The Neonate category includes stays for sick newborns. These stays may be at the birth hospital or the baby may have been transferred to a specialty center. The APR-DRG algorithm, which was developed by 3M and what is now the national Children’s Hospital Association, defines “newborn” as babies within the first two weeks or month of life, depending on the specific condition. The neonate category represented 4% of stays but 19% of payment. Sick babies, of course, tend to be very expensive. For example, DRG 588 includes babies born at less than 1,500 grams (3.3 pounds) who undergo a major procedure. Average length of stay for DRG 588 was 96.2 days, average charges $1.4 million and average payment $322,519.
Table 3.11.1
Medicaid Care Category: Neonate
Sorted in Order of Declining Stays
Averages
APR-DRG Description Stays Days Charges Payment Casemix Outlier Amt Days Charges Payment
639 Neo Bwt >2499G w Oth Sig Cond 2,687 16,219 $141,934,770 $17,521,931 0.54 $2,025,356 6.0 $52,823 $6,521
636 Neo Bwt >2499G w Inf 2,200 16,385 $153,265,767 $22,073,016 0.88 $616,048 7.4 $69,666 $10,033
581 Neo, Tsf<5 Days Old, Born Here 2,029 2,476 $21,467,399 $3,420,552 0.19 $0 1.2 $10,580 $1,686
633 Neo Bwt >2499G w Maj Anomaly 1,698 17,184 $203,914,224 $33,426,571 1.52 $6,574,283 10.1 $120,091 $19,686
634 Neo, Bwt >2499G w Maj Resp Cond 1,603 16,415 $201,043,375 $33,387,700 1.73 $3,822,961 10.2 $125,417 $20,828
614 Neo Bwt 1500-1999G 1,004 18,046 $170,870,058 $23,614,108 1.98 $1,958,849 18.0 $170,189 $23,520
625 Neo Bwt 2000-2499G w Oth Sig Cond 632 8,720 $80,711,932 $11,140,259 1.57 $562,275 13.8 $127,709 $17,627
612 Neo Bwt 1500-1999G Maj Resp Cond 478 14,020 $140,909,408 $22,765,290 3.83 $2,593,922 29.3 $294,790 $47,626
622 Neo Bwt 2000-2499G Maj Resp Cond 449 7,443 $75,592,573 $11,883,761 2.20 $771,944 16.6 $168,358 $26,467
593 Neo Bwt 750-999G w/o Maj Proc 384 23,698 $295,814,720 $58,350,256 13.22 $7,180,762 61.7 $770,351 $151,954
607 Neo Bwt 1250-1499G w Maj Problem 364 15,423 $159,590,305 $28,909,076 6.28 $4,758,448 42.4 $438,435 $79,421
602 Neo Bwt 1000-1249G w Maj Problem 352 19,498 $231,935,582 $40,356,572 8.95 $7,755,486 55.4 $658,908 $114,649
631 Neo Bwt >2499G w Oth Maj Proc 320 11,092 $154,614,966 $36,489,997 7.99 $6,887,982 34.7 $483,172 $114,031
623 Neo Bwt 2000-2499G w Inf 294 3,902 $37,315,707 $5,470,695 1.68 $305,698 13.3 $126,924 $18,608
621 Neo Bwt 2000-2499G w Maj Anomaly 283 5,121 $67,249,226 $9,601,575 2.88 $1,574,224 18.1 $237,630 $33,928
611 Neo Bwt 1500-1999G w Maj Anomaly 271 7,846 $90,136,615 $15,112,517 4.76 $2,357,910 29.0 $332,607 $55,766
608 Neo Bwt 1250-1499G 246 8,135 $86,379,920 $13,250,134 4.53 $1,562,821 33.1 $351,138 $53,862
630 Neo Bwt >2499G w Maj CV Proc 219 8,796 $165,074,892 $41,720,753 13.95 $7,771,877 40.2 $753,767 $190,506
589 Neo Bwt <500G or <24 Wks 218 5,207 $71,424,911 $14,154,326 4.58 $4,707,931 23.9 $327,637 $64,928
588 Neo Bwt <1500G w Maj Proc 211 20,291 $295,612,084 $68,051,476 25.35 $7,756,507 96.2 $1,401,005 $322,519
613 Neo Bwt 1500-1999G w Inf 207 5,172 $54,600,565 $7,812,204 3.09 $909,319 25.0 $263,771 $37,740
Medi-Cal DRG Project: Review of FY 2013-14 30
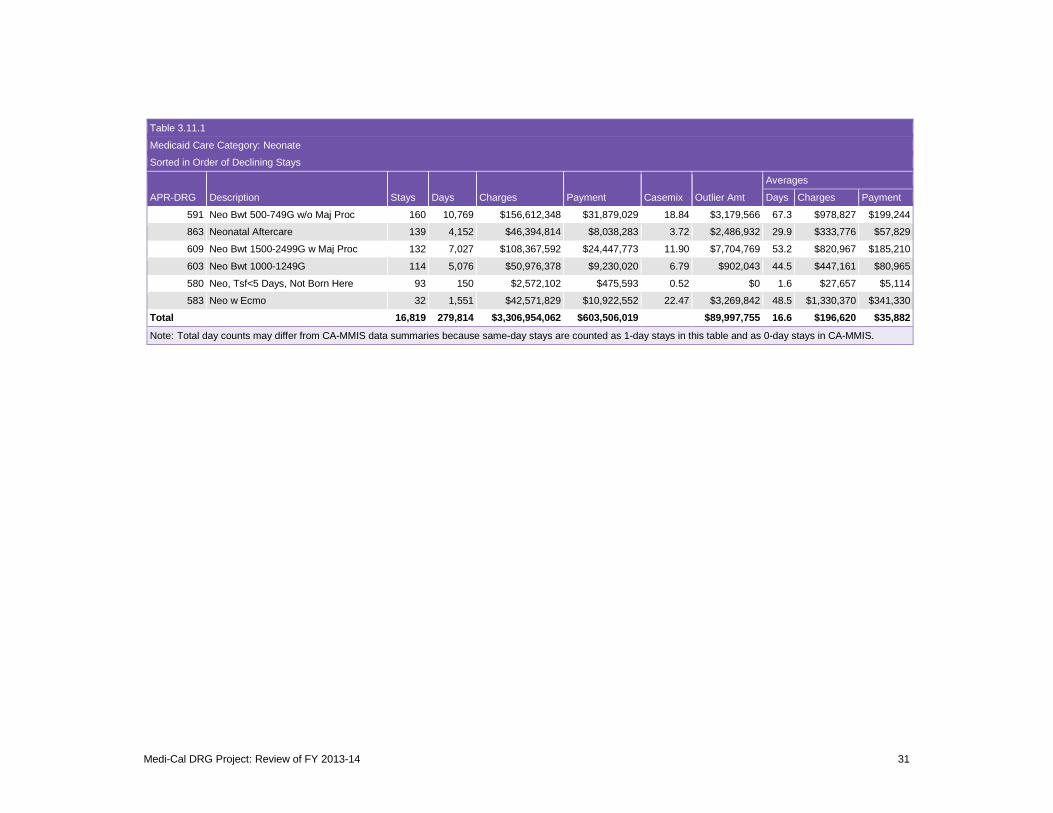
Table 3.11.1
Medicaid Care Category: Neonate
Sorted in Order of Declining Stays
Averages
APR-DRG Description Stays Days Charges Payment Casemix Outlier Amt Days Charges Payment
591 Neo Bwt 500-749G w/o Maj Proc 160 10,769 $156,612,348 $31,879,029 18.84 $3,179,566 67.3 $978,827 $199,244
863 Neonatal Aftercare 139 4,152 $46,394,814 $8,038,283 3.72 $2,486,932 29.9 $333,776 $57,829
609 Neo Bwt 1500-2499G w Maj Proc 132 7,027 $108,367,592 $24,447,773 11.90 $7,704,769 53.2 $820,967 $185,210
603 Neo Bwt 1000-1249G 114 5,076 $50,976,378 $9,230,020 6.79 $902,043 44.5 $447,161 $80,965
580 Neo, Tsf<5 Days, Not Born Here 93 150 $2,572,102 $475,593 0.52 $0 1.6 $27,657 $5,114
583 Neo w Ecmo 32 1,551 $42,571,829 $10,922,552 22.47 $3,269,842 48.5 $1,330,370 $341,330
Total 16,819 279,814 $3,306,954,062 $603,506,019 $89,997,755 16.6 $196,620 $35,882
Note: Total day counts may differ from CA-MMIS data summaries because same-day stays are counted as 1-day stays in this table and as 0-day stays in CA-MMIS.
Medi-Cal DRG Project: Review of FY 2013-14 31

Chart 3.11.1 combines data for normal newborns and neonates to show the dramatic relationship between cost and birthweight. The actual figures reflect an earlier dataset than the dataset used for the rest of this report, but in our experience the relationship is very strong across different states regardless of whether resources are measured using charges, hospital cost, or Medicaid payment. Babies with a birthweight of at least 500 grams (1.1 pounds) have a good chance at viability that comes at great expense. On average, expense falls sharply as gestational age lengthens and birthweight increases. That, in a nutshell, is the economic argument for good prenatal care.
If anything, the chart understates the resource cost of premature birth, since it includes only the hospital charges for the neonatal stay. The cost of neonatal physician care and any subsequent health care costs related to premature birth would be additional.
Medi-Cal DRG Project: Review of FY 2013-14 32
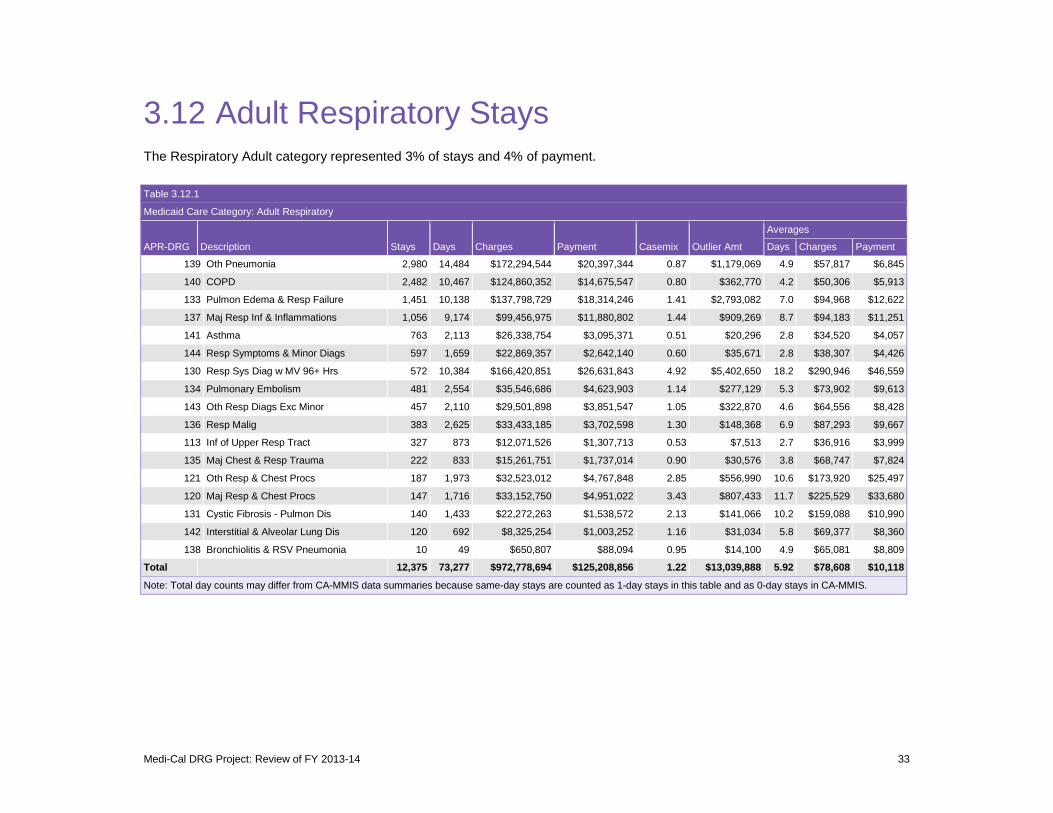
3.12 Adult Respiratory Stays The Respiratory Adult category represented 3% of stays and 4% of payment. Table 3.12.1
Medicaid Care Category: Adult Respiratory
Averages
APR-DRG Description Stays Days Charges Payment Casemix Outlier Amt Days Charges Payment
139 Oth Pneumonia
140 COPD
133 Pulmon Edema & Resp Failure
137 Maj Resp Inf & Inflammations
141 Asthma
144 Resp Symptoms & Minor Diags
130 Resp Sys Diag w MV 96+ Hrs
134 Pulmonary Embolism
143 Oth Resp Diags Exc Minor
136 Resp Malig
113 Inf of Upper Resp Tract
135 Maj Chest & Resp Trauma
121 Oth Resp & Chest Procs
120 Maj Resp & Chest Procs
131 Cystic Fibrosis - Pulmon Dis
142 Interstitial & Alveolar Lung Dis
138 Bronchiolitis & RSV Pneumonia
Total
2,980
2,482
1,451
1,056
763
597
572
481
457
383
327
222
187
147
140
120
10
12,375
14,484
10,467
10,138
9,174
2,113
1,659
10,384
2,554
2,110
2,625
873
833
1,973
1,716
1,433
692
49
73,277
$172,294,544
$124,860,352
$137,798,729
$99,456,975
$26,338,754
$22,869,357
$166,420,851
$35,546,686
$29,501,898
$33,433,185
$12,071,526
$15,261,751
$32,523,012
$33,152,750
$22,272,263
$8,325,254
$650,807
$972,778,694
$20,397,344
$14,675,547
$18,314,246
$11,880,802
$3,095,371
$2,642,140
$26,631,843
$4,623,903
$3,851,547
$3,702,598
$1,307,713
$1,737,014
$4,767,848
$4,951,022
$1,538,572
$1,003,252
$88,094
$125,208,856
0.87
0.80
1.41
1.44
0.51
0.60
4.92
1.14
1.05
1.30
0.53
0.90
2.85
3.43
2.13
1.16
0.95
1.22
$1,179,069
$362,770
$2,793,082
$909,269
$20,296
$35,671
$5,402,650
$277,129
$322,870
$148,368
$7,513
$30,576
$556,990
$807,433
$141,066
$31,034
$14,100
$13,039,888
4.9 $57,817
4.2 $50,306
7.0 $94,968
8.7 $94,183
2.8 $34,520
2.8 $38,307
18.2 $290,946
5.3 $73,902
4.6 $64,556
6.9 $87,293
2.7 $36,916
3.8 $68,747
10.6 $173,920
11.7 $225,529
10.2 $159,088
5.8 $69,377
4.9 $65,081
5.92 $78,608
$6,845
$5,913
$12,622
$11,251
$4,057
$4,426
$46,559
$9,613
$8,428
$9,667
$3,999
$7,824
$25,497
$33,680
$10,990
$8,360
$8,809
$10,118
Note: Total day counts may differ from CA-MMIS data summaries because same-day stays are counted as 1-day stays in this table and as 0-day stays in CA-MMIS.
Medi-Cal DRG Project: Review of FY 2013-14 33

3.13 Pediatric Respiratory Stays The Pediatric Respiratory category represented 2% of stays and 3% of payment. Bronchiolitis and respiratory syncytial virus pneumonia, which is common in infants, was the most common DRG, with average length of stay of 3.3 days, average charges of $31,655 and average payment of $4,452.
Table 3.13.1
Medicaid Care Category: Pediatric Respiratory
Averages
APR-DRG Description Stays Days Charges Payment Casemix Outlier Amt Days Charges Payment
138
139
113
141
137
143
144
131
130
133
132
121
120
135
140
134
136
142
Total
Bronchiolitis & RSV Pneumonia
Oth Pneumonia
Inf of Upper Resp Tract
Asthma
Maj Resp Inf & Inflammations
Oth Resp Diags Exc Minor
Resp Symptoms & Minor Diags
Cystic Fibrosis - Pulmon Dis
Resp Sys Diag w MV 96+ Hrs
Pulmon Edema & Resp Failure
Chronic Resp Dis Fm Perinatal
Oth Resp & Chest Procs
Maj Resp & Chest Procs
Maj Chest & Resp Trauma
COPD
Pulmonary Embolism
Resp Malig
Interstitial & Alveolar Lung Dis
2,262
1,536
1,249
978
559
475
468
453
432
318
284
211
114
78
26
22
14
12
9,491
7,556
6,739
3,395
2,477
4,319
2,171
1,651
5,729
8,337
2,133
2,362
2,963
1,294
274
188
120
143
74
51,925
$71,604,172
$73,032,842
$38,938,302
$30,424,649
$50,094,987
$25,866,267
$20,170,230
$75,721,331
$152,254,215
$37,686,343
$27,037,165
$50,977,202
$20,593,025
$4,649,226
$1,742,851
$1,358,368
$1,900,676
$934,969
$684,986,820
$10,070,877
$11,357,933
$5,990,431
$4,682,289
$7,490,883
$4,075,527
$2,894,158
$10,332,451
$27,120,151
$5,282,333
$4,491,339
$8,694,799
$3,869,432
$681,298
$180,730
$239,285
$190,319
$110,724
$107,754,958
0.46
0.73
0.48
0.49
1.29
0.89
0.72
2.22
4.59
1.50
1.26
2.56
2.93
0.90
0.75
1.24
1.32
1.11
1.01
$451,813
$1,259,687
$721,551
$207,355
$1,207,466
$584,398
$200,869
$1,682,444
$10,619,306
$1,434,205
$1,395,274
$4,229,754
$865,678
$0
$10,330
$0
$42,492
$22,932
$24,935,554
3.3 $31,655
4.4 $47,547
2.7 $31,176
2.5 $31,109
7.7 $89,615
4.6 $54,455
3.5 $43,099
12.6 $167,155
19.3 $352,440
6.7 $118,511
8.3 $95,201
14.0 $241,598
11.4 $180,641
3.5 $59,605
7.2 $67,033
5.5 $61,744
10.2 $135,763
6.2 $77,914
5.47 $72,172
$4,452
$7,394
$4,796
$4,788
$13,401
$8,580
$6,184
$22,809
$62,778
$16,611
$15,815
$41,208
$33,942
$8,735
$6,951
$10,877
$13,594
$9,227
$11,353
Note: Total day counts may differ from CA-MMIS data summaries because same-day stays are counted as 1-day stays in this table and as 0-day stays in CA-MMIS.
Medi-Cal DRG Project: Review of FY 2013-14 34
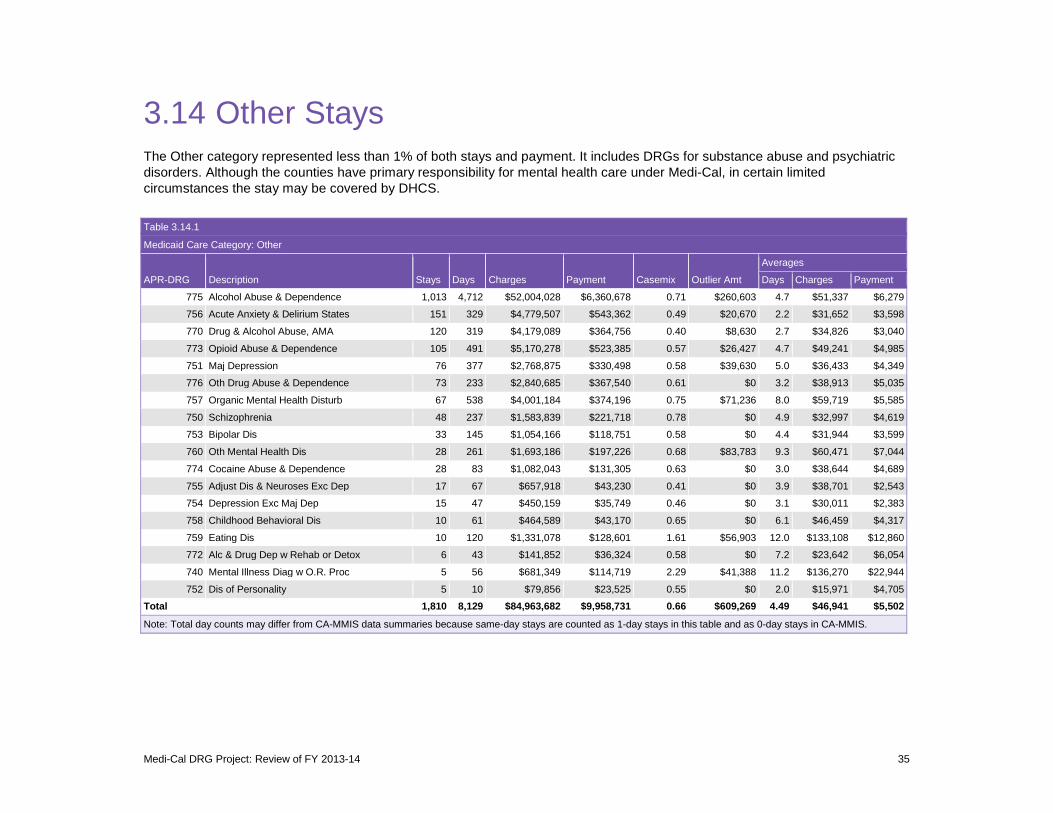
3.14 Other Stays The Other category represented less than 1% of both stays and payment. It includes DRGs for substance abuse and psychiatric disorders. Although the counties have primary responsibility for mental health care under Medi-Cal, in certain limited circumstances the stay may be covered by DHCS.
Table 3.14.1
Medicaid Care Category: Other
Averages
APR-DRG Description Stays Days Charges Payment Casemix Outlier Amt Days Charges Payment
775
756
770
773
751
776
757
750
753
760
774
755
754
758
759
772
740
752
Total
Alcohol Abuse & Dependence
Acute Anxiety & Delirium States
Drug & Alcohol Abuse, AMA
Opioid Abuse & Dependence
Maj Depression
Oth Drug Abuse & Dependence
Organic Mental Health Disturb
Schizophrenia
Bipolar Dis
Oth Mental Health Dis
Cocaine Abuse & Dependence
Adjust Dis & Neuroses Exc Dep
Depression Exc Maj Dep
Childhood Behavioral Dis
Eating Dis
Alc & Drug Dep w Rehab or Detox
Mental Illness Diag w O.R. Proc
Dis of Personality
1,013
151
120
105
76
73
67
48
33
28
28
17
15
10
10
6
5
5
1,810
4,712
329
319
491
377
233
538
237
145
261
83
67
47
61
120
43
56
10
8,129
$52,004,028
$4,779,507
$4,179,089
$5,170,278
$2,768,875
$2,840,685
$4,001,184
$1,583,839
$1,054,166
$1,693,186
$1,082,043
$657,918
$450,159
$464,589
$1,331,078
$141,852
$681,349
$79,856
$84,963,682
$6,360,678
$543,362
$364,756
$523,385
$330,498
$367,540
$374,196
$221,718
$118,751
$197,226
$131,305
$43,230
$35,749
$43,170
$128,601
$36,324
$114,719
$23,525
$9,958,731
0.71
0.49
0.40
0.57
0.58
0.61
0.75
0.78
0.58
0.68
0.63
0.41
0.46
0.65
1.61
0.58
2.29
0.55
0.66
$260,603
$20,670
$8,630
$26,427
$39,630
$0
$71,236
$0
$0
$83,783
$0
$0
$0
$0
$56,903
$0
$41,388
$0
$609,269
4.7 $51,337
2.2 $31,652
2.7 $34,826
4.7 $49,241
5.0 $36,433
3.2 $38,913
8.0 $59,719
4.9 $32,997
4.4 $31,944
9.3 $60,471
3.0 $38,644
3.9 $38,701
3.1 $30,011
6.1 $46,459
12.0 $133,108
7.2 $23,642
11.2 $136,270
2.0 $15,971
4.49 $46,941
$6,279
$3,598
$3,040
$4,985
$4,349
$5,035
$5,585
$4,619
$3,599
$7,044
$4,689
$2,543
$2,383
$4,317
$12,860
$6,054
$22,944
$4,705
$5,502
Note: Total day counts may differ from CA-MMIS data summaries because same-day stays are counted as 1-day stays in this table and as 0-day stays in CA-MMIS.
Medi-Cal DRG Project: Review of FY 2013-14 35
3.15 Differences Between Non-ACA and ACA Populations
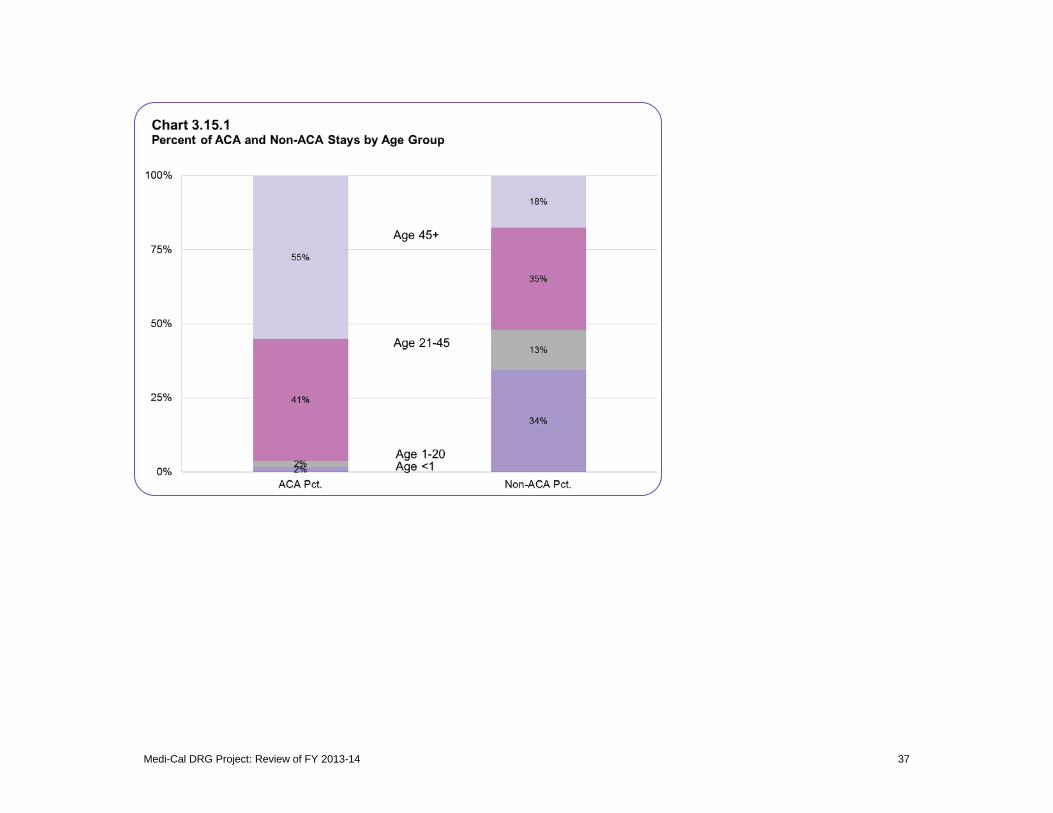
The Medi-Cal expansion under the Affordable Care Act January 1, 2014 meant that several populations became newly eligible for Medicaid. In our analytical dataset, there were 21,727 ACA admissions between January 1 and June 30, not counting any admissions for which the claims were adjudicated and paid after September 22, 2014. Of the 21,727 stays, 81% were for adults age 19-64 (aid code M1), 7% were for people transitioning from the Low Income Health Program (LIHP, aid code L1), 6% were for people eligible for CalFresh but not previously eligible for Medi-Cal or LIHP (7U), and 5% were for undocumented adults age 19-64 with restricted benefits (M2).
Chart 3.15.1 shows the patient age profile of the ACA stays compared with the non-ACA stays. On average, the ACA stays were for markedly older patients, reflecting the predominance of obstetric stays and newborns in the non-ACA population. Another clear difference is that males accounted for 61% of ACA stays while females accounted for 66% of non-ACA stays. (Historically, pregnant women and infants have been priority populations for Medicaid eligibility.) For the same reasons, average casemix, length of stay, and payment were all higher for ACA stays than for non-ACA stays.
Medi-Cal DRG Project: Review of FY 2013-14 36
Medi-Cal DRG Project: Review of FY 2013-14 37
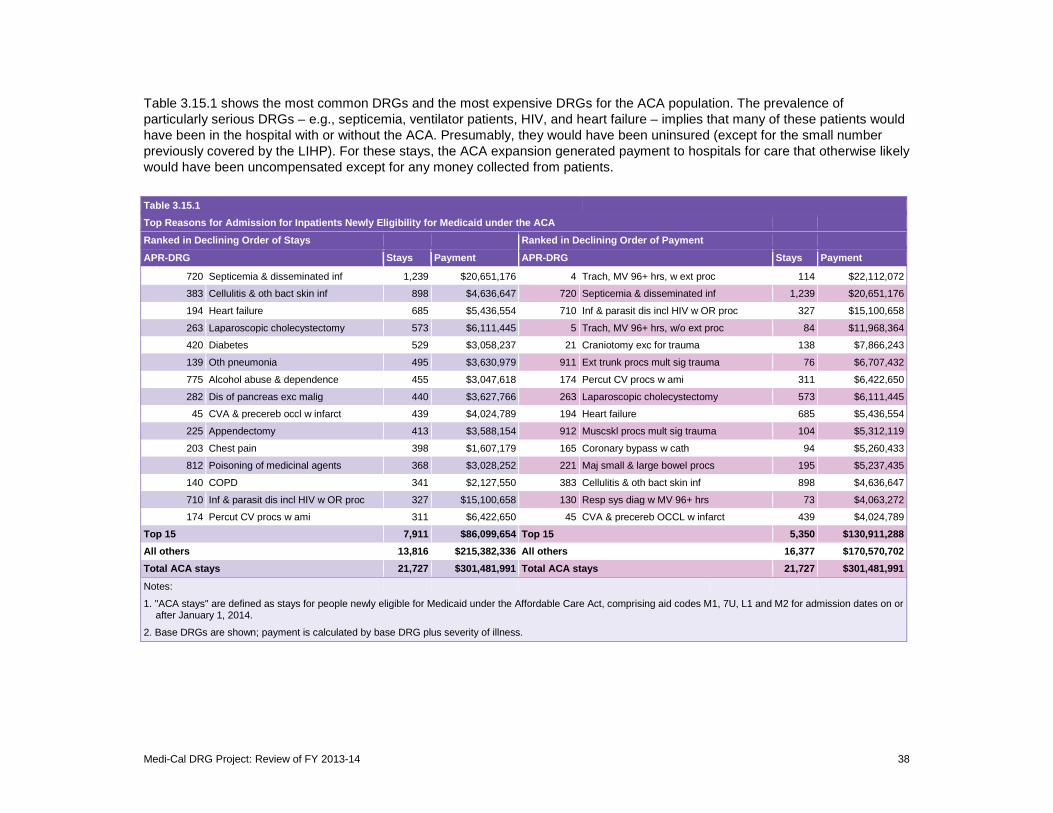
Table 3.15.1 shows the most common DRGs and the most expensive DRGs for the ACA population. The prevalence of particularly serious DRGs – e.g., septicemia, ventilator patients, HIV, and heart failure – implies that many of these patients would have been in the hospital with or without the ACA. Presumably, they would have been uninsured (except for the small number previously covered by the LIHP). For these stays, the ACA expansion generated payment to hospitals for care that otherwise likely would have been uncompensated except for any money collected from patients.
Table 3.15.1 Top Reasons for Admission for Inpatients Newly Eligibility for Medicaid under the ACA
Ranked in Declining Order of Stays Ranked in Declining Order of Payment
APR-DRG Stays Payment APR-DRG Stays Payment
720 Septicemia & disseminated inf 1,239 $20,651,176 4 Trach, MV 96+ hrs, w ext proc 114 $22,112,072
383 Cellulitis & oth bact skin inf 898 $4,636,647 720 Septicemia & disseminated inf 1,239 $20,651,176
194 Heart failure 685 $5,436,554 710 Inf & parasit dis incl HIV w OR proc 327 $15,100,658
263 Laparoscopic cholecystectomy 573 $6,111,445 5 Trach, MV 96+ hrs, w/o ext proc 84 $11,968,364
420 Diabetes 529 $3,058,237 21 Craniotomy exc for trauma 138 $7,866,243
139 Oth pneumonia 495 $3,630,979 911 Ext trunk procs mult sig trauma 76 $6,707,432
775 Alcohol abuse & dependence 455 $3,047,618 174 Percut CV procs w ami 311 $6,422,650
282 Dis of pancreas exc malig 440 $3,627,766 263 Laparoscopic cholecystectomy 573 $6,111,445
45 CVA & precereb occl w infarct 439 $4,024,789 194 Heart failure 685 $5,436,554
225 Appendectomy 413 $3,588,154 912 Muscskl procs mult sig trauma 104 $5,312,119
203 Chest pain 398 $1,607,179 165 Coronary bypass w cath 94 $5,260,433
812 Poisoning of medicinal agents 368 $3,028,252 221 Maj small & large bowel procs 195 $5,237,435
140 COPD 341 $2,127,550 383 Cellulitis & oth bact skin inf 898 $4,636,647
710 Inf & parasit dis incl HIV w OR proc 327 $15,100,658 130 Resp sys diag w MV 96+ hrs 73 $4,063,272
174 Percut CV procs w ami 311 $6,422,650 45 CVA & precereb OCCL w infarct 439 $4,024,789
Top 15 7,911 $86,099,654 Top 15 5,350 $130,911,288 All others 13,816 $215,382,336 All others 16,377 $170,570,702 Total ACA stays 21,727 $301,481,991 Total ACA stays 21,727 $301,481,991
Notes:
1. "ACA stays" are after January 1,
defined as stays for people newly eligible for Medicaid under the Affordable Care Act, 2014.
comprising aid codes M1, 7U, L1 and M2 for admission dates on or
2. Base DRGs are shown; payment is calculated by base DRG plus severity of illness.
Medi-Cal DRG Project: Review of FY 2013-14 38
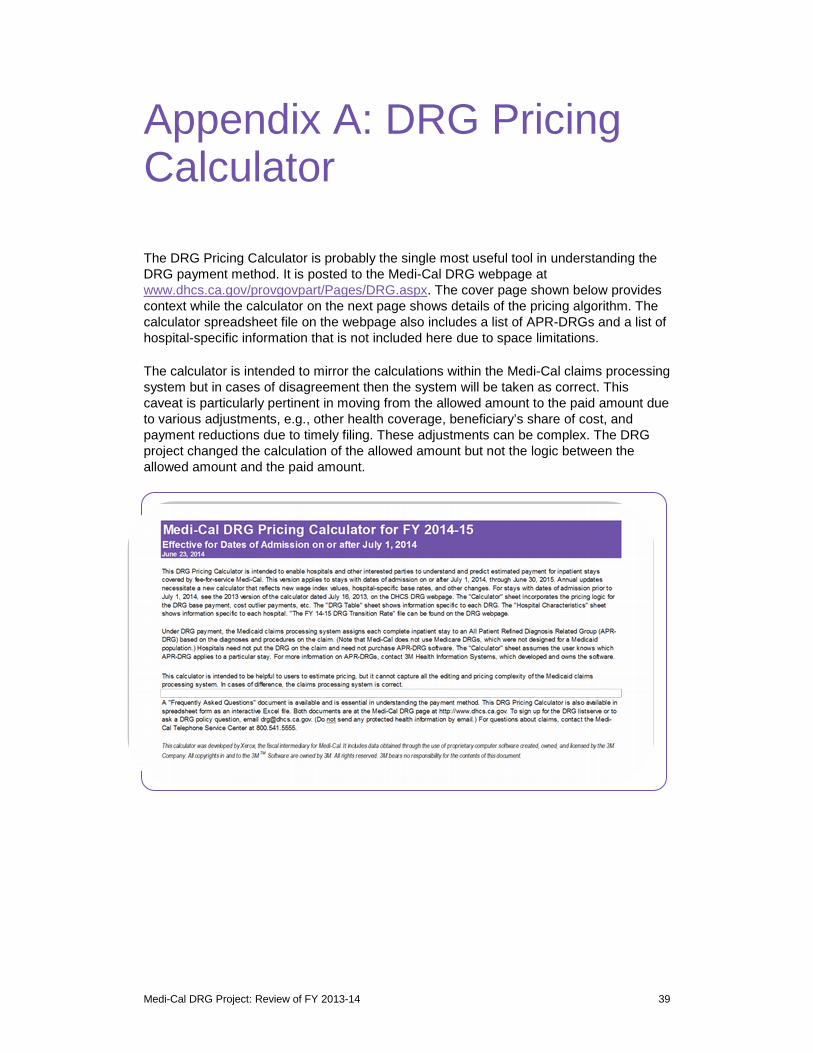
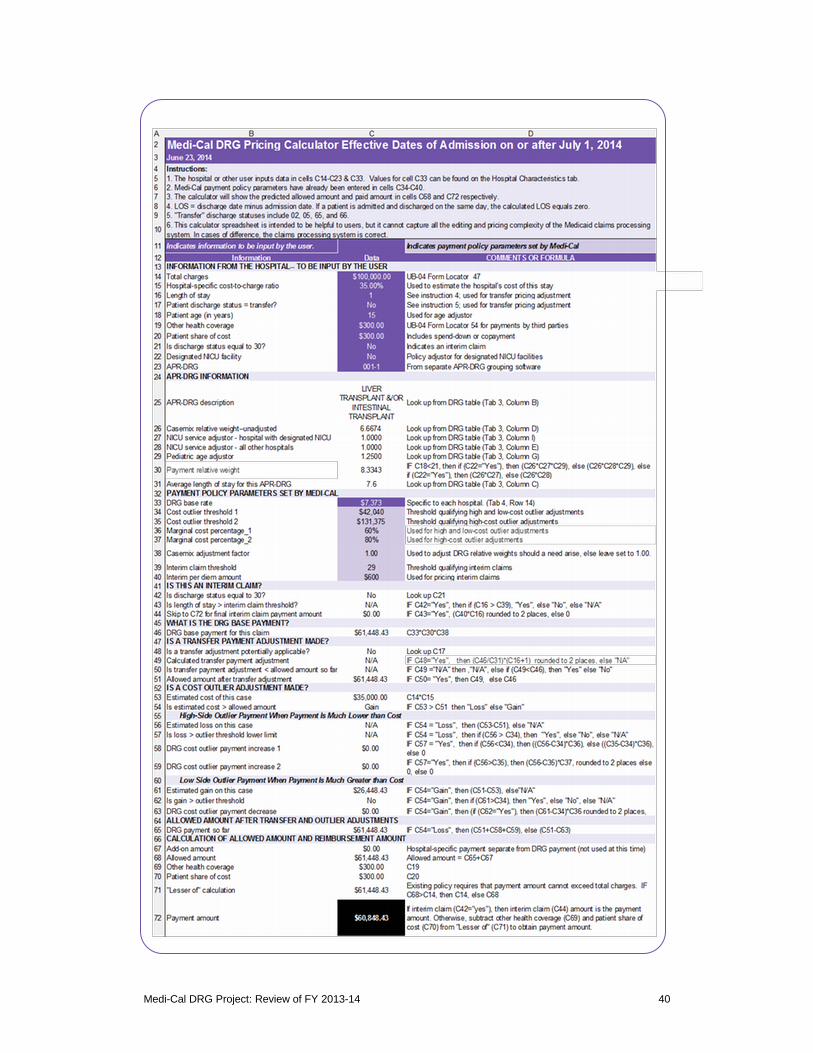
Appendix A: DRG Pricing Calculator
The DRG Pricing Calculator is probably the single most useful tool in understanding the DRG payment method. It is posted to the Medi-Cal DRG webpage at www.dhcs.ca.gov/provgovpart/Pages/DRG.aspx. The cover page shown below provides context while the calculator on the next page shows details of the pricing algorithm. The calculator spreadsheet file on the webpage also includes a list of APR-DRGs and a list of hospital-specific information that is not included here due to space limitations.
The calculator is intended to mirror the calculations within the Medi-Cal claims processing system but in cases of disagreement then the system will be taken as correct. This caveat is particularly pertinent in moving from the allowed amount to the paid amount due to various adjustments, e.g., other health coverage, beneficiary’s share of cost, and payment reductions due to timely filing. These adjustments can be complex. The DRG project changed the calculation of the allowed amount but not the logic between the allowed amount and the paid amount.
Medi-Cal DRG Project: Review of FY 2013-14 39
Medi-Cal DRG Project: Review of FY 2013-14 40
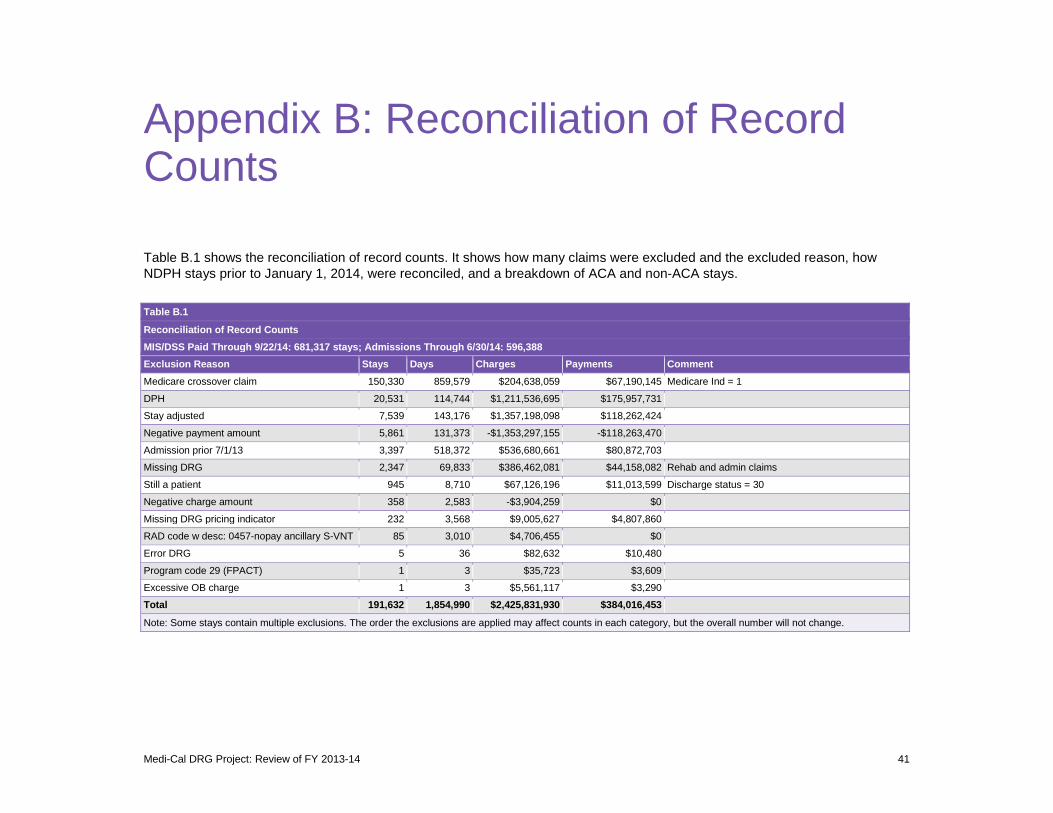
Appendix B: Reconciliation of Record Counts
Table B.1 shows the reconciliation of record counts. It shows how many claims were excluded and the excluded reason, how NDPH stays prior to January 1, 2014, were reconciled, and a breakdown of ACA and non-ACA stays.
Table B.1
Reconciliation of Record Counts MIS/DSS Paid Through 9/22/14: 681,317 stays; Admissions Through 6/30/14: 596,388 Exclusion Reason Stays Days Charges Payments Comment Medicare crossover claim 150,330 859,579 $204,638,059 $67,190,145 Medicare Ind = 1
DPH 20,531 114,744 $1,211,536,695 $175,957,731
Stay adjusted 7,539 143,176 $1,357,198,098 $118,262,424
Negative payment amount 5,861 131,373 -$1,353,297,155 -$118,263,470
Admission prior 7/1/13 3,397 518,372 $536,680,661 $80,872,703
Missing DRG 2,347 69,833 $386,462,081 $44,158,082 Rehab and admin claims
Still a patient 945 8,710 $67,126,196 $11,013,599 Discharge status = 30
Negative charge amount 358 2,583 -$3,904,259 $0
Missing DRG pricing indicator 232 3,568 $9,005,627 $4,807,860
RAD code w desc: 0457-nopay ancillary S-VNT 85 3,010 $4,706,455 $0
Error DRG 5 36 $82,632 $10,480
Program code 29 (FPACT) 1 3 $35,723 $3,609
Excessive OB charge 1 3 $5,561,117 $3,290
Total 191,632 1,854,990 $2,425,831,930 $384,016,453
Note: Some stays contain multiple exclusions. The order the exclusions are applied may affect counts in each category, but the overall number will not change.
Medi-Cal DRG Project: Review of FY 2013-14 41

Table B.1
Reconciliation of Record Counts MIS/DSS Paid Through 9/22/14: 681,317 stays; Admissions Through 6/30/14: 596,388 Exclusion Reason Stays Days Charges Payments Comment
After applying above exclusions: 404,756 stays
Hospital Stays Days Charges Payments Comment
Private/OOS/NDPH (after Jan 1, 2014) 393,716 1,736,463 $20,966,766,244 $3,220,491,113 Includes out-of-state, privates and NDPH hospital stays
NDPH 11,040 43,939 $396,623,448 $76,074,621 7/1/13-12/31/13 Admissions
Total 404,756 1,780,402 $21,363,389,692 $3,296,565,734
Note: NDPH hospitals with admissions 7/1/13-12/31/13 are used in budget analysis only.
ACA Stays Days Charges Payments Comment
No 383,029 1,651,754 $19,357,027,396 $2,995,083,743
Yes 21,727 128,648 $2,006,362,296 $301,481,991 Aid codes: M1, 7U, L1, M2 and admissions on or after 1/1/14
Total 404,756 1,780,402 $21,363,389,692 $3,296,565,734
Medi-Cal DRG Project: Review of FY 2013-14 42
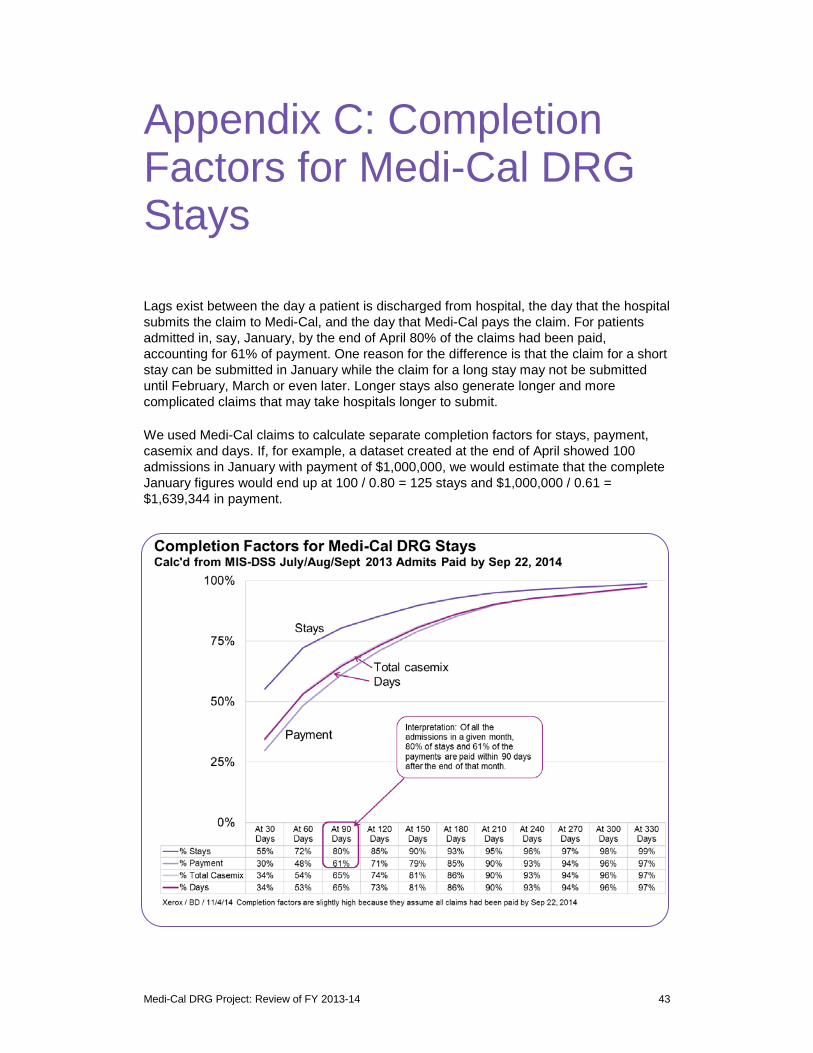
Appendix C: Completion Factors for Medi-Cal DRG Stays
Lags exist between the day a patient is discharged from hospital, the day that the hospital submits the claim to Medi-Cal, and the day that Medi-Cal pays the claim. For patients admitted in, say, January, by the end of April 80% of the claims had been paid, accounting for 61% of payment. One reason for the difference is that the claim for a short stay can be submitted in January while the claim for a long stay may not be submitted until February, March or even later. Longer stays also generate longer and more complicated claims that may take hospitals longer to submit.
We used Medi-Cal claims to calculate separate completion factors for stays, payment, casemix and days. If, for example, a dataset created at the end of April showed 100 admissions in January with payment of $1,000,000, we would estimate that the complete January figures would end up at 100 / 0.80 = 125 stays and $1,000,000 / 0.61 = $1,639,344 in payment.
Medi-Cal DRG Project: Review of FY 2013-14 43
Notes
1 Kevin Quinn, “After the Revolution: DRGs at Age 30,” Annals of Internal Medicine, Vol. 160, No. 6. March 18, 2014.
2 Xerox State Healthcare LLC, Medi-Cal DRG Project: Policy Design Document, Report to the California Department of Health Care Services (West Sacramento, CA: Xerox, May 1, 2012). Hereafter, Policy Design Document. Re Principles in Recommending Payment Policy, see §1.3.
3 Policy Design Document. §5.5. 4 Policy Design Document, §3.6. 5 Medi-Cal DRG Project: Base Prices for FY 2013-14. 6 The bounds for NDPHs differed, being plus or minus in Year 1 (defined as January 1-June 30, 2014),
plus or minus 5% in Year 2, and plus or minus 7.5% in Year 3. Xerox State Healthcare. DRG Base Prices for Years 2, 3 and 4. Document W235. Memorandum to DHCS, August 21, 2013.
7 DRG Base Prices for Years 2, 3 and 4. 8 State Plan Amendment 13-004. 9 “ACA stays” are identified by the aid of the beneficiary. 10 Policy Design Document. 11 Kevin Quinn, “New Directions in Medicaid Payment for Hospital Care,” Health Affairs. Vol. 27, No. 1.
269-280. January 2008. 12 Stephen B. Cohen and Namrata Uberoi, Differentials in the Concentration in the Level of Health
Expenditures across Population Subgroups in the U.S., 2010. Statistical Brief #421. August 2013. Agency for Healthcare Research and Quality, Rockville, MD.
13 Policy Design Document, §4.2.
Medi-Cal DRG Project: Review of FY 2013-14 44