
Mechanized Mastication Effects on Soil Compaction and ...
24
Mechanized Mastication Effects on Soil Compaction and Runoff from Forests in the Western Lake Tahoe Basin B. Hatchett 1 , M. P. Hogan 1 and M. E. Grismer 2 1 Integrated Environmental Restoration Services, Tahoma, CA 2 Hydrologic Sciences, UC Davis Abstract Forest health, wildfire prevention and water quality protection are three interrelated environmental issues in the Lake Tahoe Basin. In this study, approximately 0.61 ha of an overstocked montane mixed conifer forest on the West Shore of the Lake Tahoe Basin was thinned using a Fecon masticator powered by a Cat 235 tracked excavator. Following mastication, soil compaction was measured using a recording penetrometer to a maximum depth of 46 cm (18 in) in five randomly located plots, each consisting of three 15.2 m (50 ft) long transects approximately parallel to the machine tracks onto undisturbed soil. Masticated materials (woodchips, tree shreddings) remained on site as mulch to depths in excess of 30 cm (12 in) above the mineral soil surface, with an estimated mean depth of 10 cm (4 in). No bare soil in machine tracks where mulching occurred was found, while 6 % and 9 % bare soil was measured in a nearby undisturbed or “native” area and in tracks lacking mulch, respectively. Resistance to penetration increased with depth and decreased with distance from the machine track regardless of location. No significant differences in compaction were found in 13 of 15 comparisons of resistance values at particular distances and varying depths. We then measured rainfall runoff, infiltration and erosion from woodchip, native grass and relatively “undisturbed” soil plots corresponding to mulched track, 10-20 ft away from the track and below a tree canopy “treatment” effects on mild slopes of 1520% using the rainfall simulator. Both the grass and “undisturbed” soil areas were covered with a thin layer of pine needles. Rainfall simulation (~73 mm/hr, roughly approximating a 100-yr, 15minute storm) on three plots for each “treatment” were conducted. Due to lack of runoff from the grass, woodchip and undisturbed plots, we also conducted high rainfall intensity (120mm/hr) tests on one plot each of these treatments. Measurements of time to runoff, infiltration and runoff rates, and average sediment concentration (gm/L) and yield (gm of sediment per mm of runoff) were obtained. Measured infiltration rates ranged from ~55-112 mm/hr, relatively high values consistent with the average infiltration rates measured for decomposed granite soils across the Tahoe Basin. Sediment yields were greatest from the bare soils (~1.5 g/mm) followed by that from the woodchip plot (0.48 g/mm at 120 mm/hr), the grass plot (0.36 g/mm at 120 mm/hr) and least from the undisturbed plot (0.14 g/mm at 120 mm/hr). Overall forest stand density decreased and stand sky-view factor increased as a result of the masticator treatment. Keywords: cone penetrometer, forest thinning, erosion, soil density. 1
Transcript of Mechanized Mastication Effects on Soil Compaction and ...

Mechanized Mastication Effects on Soil Compaction and Runoff from Forests in the Western Lake Tahoe Basin
B. Hatchett1, M. P. Hogan1 and M. E. Grismer2
1 Integrated Environmental Restoration Services, Tahoma, CA 2 Hydrologic Sciences, UC Davis
Abstract Forest health, wildfire prevention and water quality protection are three interrelated
environmental issues in the Lake Tahoe Basin. In this study, approximately 0.61 ha of an overstocked montane mixed conifer forest on the West Shore of the Lake Tahoe Basin was thinned using a Fecon masticator powered by a Cat 235 tracked excavator. Following mastication, soil compaction was measured using a recording penetrometer to a maximum depth of 46 cm (18 in) in five randomly located plots, each consisting of three 15.2 m (50 ft) long transects approximately parallel to the machine tracks onto undisturbed soil. Masticated materials (woodchips, tree shreddings) remained on site as mulch to depths in excess of 30 cm (12 in) above the mineral soil surface, with an estimated mean depth of 10 cm (4 in). No bare soil in machine tracks where mulching occurred was found, while 6 % and 9 % bare soil was measured in a nearby undisturbed or “native” area and in tracks lacking mulch, respectively. Resistance to penetration increased with depth and decreased with distance from the machine track regardless of location. No significant differences in compaction were found in 13 of 15 comparisons of resistance values at particular distances and varying depths. We then measured rainfall runoff, infiltration and erosion from woodchip, native grass and relatively “undisturbed” soil plots corresponding to mulched track, 10-20 ft away from the track and below a tree canopy “treatment” effects on mild slopes of 1520% using the rainfall simulator. Both the grass and “undisturbed” soil areas were covered with a thin layer of pine needles. Rainfall simulation (~73 mm/hr, roughly approximating a 100-yr, 15minute storm) on three plots for each “treatment” were conducted. Due to lack of runoff from the grass, woodchip and undisturbed plots, we also conducted high rainfall intensity (120mm/hr) tests on one plot each of these treatments. Measurements of time to runoff, infiltration and runoff rates, and average sediment concentration (gm/L) and yield (gm of sediment per mm of runoff) were obtained. Measured infiltration rates ranged from ~55-112 mm/hr, relatively high values consistent with the average infiltration rates measured for decomposed granite soils across the Tahoe Basin. Sediment yields were greatest from the bare soils (~1.5 g/mm) followed by that from the woodchip plot (0.48 g/mm at 120 mm/hr), the grass plot (0.36 g/mm at 120 mm/hr) and least from the undisturbed plot (0.14 g/mm at 120 mm/hr). Overall forest stand density decreased and stand sky-view factor increased as a result of the masticator treatment. Keywords: cone penetrometer, forest thinning, erosion, soil density.
1

Introduction
Forest health, wildfire prevention and water quality protection are three interrelated
environmental issues in the Lake Tahoe Basin and throughout the Western United States. The
existence of overstocked forests is largely the result of fire suppression practices during the past 100
years by federal, state and private land management agencies. Forest managers are now faced with
forests of high density and a high incidence of insect and stress related die-off resulting in forests of
high fire potential and high fire transmissibility. Fires that do occur in these overstocked stands are
high intensity ‘scouring’ fires that may leave little in-tact understory and can sterilize the soil. Loss of
cover leaves barren soils of extremely high erosion potential, thus negatively affecting downstream
water quality. These issues are generally addressed by a number of approaches including the
reduction of standing biomass (forest thinning) and timber stand density reduction. While commonly
employed methods exist, including hand thinning, piling and burning, or broadcast burning and
logging, a less common but promising method is use of a mechanical masticator that may potentially
address all three management concerns with a single set of practices. The environmental costs and
benefits associated with this type of forest treatment have not been adequately studied.
Considerable research has been conducted regarding soil compaction and erosion that we
briefly highlight here with respect to forest soils. Nolte and Fausey (1986) reported that the infiltration
rates can decrease by a factor of ten if soil compaction (cone penetrometer resistance) doubles. Wall
et. al. (1987) and Frisby and Pfost (1993) noted that decreased infiltration and increased runoff may
result from compacted subsurface soil layers. Imeson and Lavee (1998) examined the influence of
temporal and spatial scale aspects on erosion processes, and found that a key indicator of erosion is
the soil aggregate stability. Aggregate stability was controlled by the extent of shading, or vegetation
and litter coverage, organic matter dynamics, (i.e. the turnover of organic matter and root production),
2

and slope aspect. The presence of aggregates linked to greater aggregate stability results in decreased
erosion as a result of greater infiltration rates and greater resistance of aggregates to shear detachment.
Infiltration is a key process variable in erosion because it is a rate limiting factor for amounts of
runoff entering the soil. The greater the relative infiltration, the lower the runoff rates and thus the
lower the potential erosion from a given site (Radcliffe and Rasmussen, 2000).
Degree of shading is a critical control of erosion, and it has been shown that trees and dense
grasses can reduce erosion to 30% when compared to bare soil (Bonan, 2002). Allred (1950) reported
that rain fed infiltration rates were drastically reduced with reduction in vegetation cover and organic
matter. Plant and litter cover protects the soil from raindrop impact and splash, tends to slow down the
movement of surface runoff and increases the infiltration rate and water holding capacity of the soil
(Wall et. al. 1987, Molinar et. al. 2001). In forests, the erosion factor used to estimate total erosion
losses drops from 0.36 on soil with no litter cover to 0.003 with 100% litter coverage (Bonan, 2002).
Soil under vegetated or litter covered areas had high levels of aggregate stability, as did soil that had
favorable organic matter dynamics. Litter cover also lowers evapotranspiration rates of soil and
prevents higher soil temperatures, thus improving microbial soil habitats and enhancing grass seed
germination and establishment (Molinar et. al. 2001). Slope was found to be important in that it can
act as a buffer depending on aspect and initial stability of the soil. For example, soils with low
aggregate stability and/or low infiltration capacity, on a south-facing slope tend to be more erosion
prone than a similar soils on north-facing slopes.
Excess cover, however, especially in an overstocked forest, can create extreme fire danger
conditions and catastrophic results for the forest habitat and surrounding human habitation areas as well.
Overstocking or decadent forest stands are sometimes treated by a number of thinning practices. Forest
thinning involves removing small to medium diameter trees and shrubs to improve the overall forest
3

health by allowing the remaining stand access to more nutrients, sunlight, water, and space by opening
the canopy and forest floor. The stand tends to grow with increased vigor and health, and will increase
total biodiversity of flora and fauna, reduce the threat of crown fires and available fuels for wildfires,
and improve the overall aesthetic. Open canopies also increase the accumulation of snow on the forest
floor as a result of the absence of the ablation that would otherwise occur as the snowfall is intercepted
by the canopy, leaving an increased quantity of water available for both the ecosystem and beneficial
consumptive use upon melting (Bowling et. al. 2000). Natural forest thinning once occurred with
some regularity through wildfires, but anthropogenic suppression of wildfires in the past century has
allowed the forests to grow dense and overly competitive. Such practices have lessened overall health
and biodiversity of the forest, and have allowed highly destructive crown fires to occur as they
consume vast quantities of available and densely packed fuels.
Several methods of forest thinning have been employed; from crews that hand thin using
chainsaws then pile the slash into burn piles to be burned or chipped, to mechanized thinning using
heavy machinery such as the masticator. The burning process may have the greatest implications
environmentally and socio-economically. Concentrated, intense heat from the burn piles can sterilize
the soil in the immediate vicinity through combustion of nutrients and organic matter. The generated
smoke reduces air quality from the combustion of material, decreases water quality from ash
deposition in water bodies, and results in local complaints in the vicinity of the burn as a response to
health and other ‘quality of life’ issues. Further, burn piles have the potential of becoming
uncontrolled resulting in large scale wildfires, as occurred in the 2000 Cerro Grande Fire near the Los
Alamos National Laboratory in New Mexico.
Mechanized thinning methods utilize heavy equipment to clear out unnecessary brush and
small diameter trees. The purpose of this study was to determine if heavy equipment used for
4

mastication-type stand density reduction in an overstocked forest would result in an increase in soil
compaction and subsequent increased runoff and erosion. Here, a Caterpillar 320C excavator equipped
with low ground-pressure (37.9 kPa or 5.5 psi) triple cleat grousers and a Fecon Bull Hog BH 80
masticator head (see figure 1) were employed. The boom-mounted head was capable of reaching to
approximately 10 m laterally/horizontally and vertically from the excavator so that close proximity to
individual trees was not necessary. The Fecon masticator head utilizes a rotating cylinder attached with
fixed cutting teeth which ‘chew’ the forest material into mulch, which is deposited on the forest floor
during the mastication process. Mastication took place during October when soils tend to be driest
with gravimetric moisture contents less than 10%. During the mastication process, care was taken by
the operator to move in as straight a direction as possible. No pivot turns were made at any time and
all turns were described in as broad an arc as the terrain and surrounding timber would allow. This is
critical towards minimizing soil disturbance during mastication. No burning is required for
mastication work, as all of the fuels are converted to small pieces, generally less than hand size, and
left as a protective mulch layer. On the other hand, use of heavy machinery in the forest may result in
soil compaction at the tracks and establishment of an unintentional “trail” that may last several years.
Mastication enables established tracks to be covered by mulched litter, thereby reducing bare soil
exposure. Further, use of low ground pressure machinery is thought to minimize short-term
compaction and to possibly produce no discernable long term impacts in terms of either soil
compaction or increased runoff.
The purpose of this study was to determine if heavy equipment used for mastication-type stand
density reduction in a mixed conifer forest would result in an increase in soil compaction and
subsequent increased runoff and erosion.
Site description:
5

This study site was located west-southwest of Timber Wolf Drive on the west end of the village
of Tahoma along the west shore of Lake Tahoe. The site consisted of an overstocked, fir dominated
second growth forest on a soil derived from mixed granite and volcanic material common in the area.
This forest stand is typical of many west shore forests logged more than 100 years ago (Wilson, 1992,
and direct ring counting of cut trees, 2004). Subsequent to initial logging in the 1800’s of what was
considered a pine-dominated forest, red and especially white fir trees were first to re-grow and have
since become the dominant species. With fire repression practices and no additional logging following
public (USFS) acquisition of much of the land in the 1960’s and 70’s, forests are typically overstocked
and prone to stress-related diseases and insect attacks. This type of overstocked forest condition is
common in the Tahoe Basin and occurs on all types of soils. In the project area, white and red firs make
up over 90% of the stand, with Pinus jeffreyi (Jeffrey Pine) and Calocedrus decurrens (Incense Cedar)
comprising the remainder. Understory is relatively non-existent in much of the area except where
canopy openings occur, in which case dense covering of Castonopis chrysophylla var minor (Golden
Chinquipin), Ceanothus cordulatus (Whitethorn) and Arctostaphylos patula (Greenleaf Manzanita) are
mixed with scattered forbs and grasses. The forest floor was covered by at least 5 cm (2 in) of needle
litter, duff and other woody debris. In some cases, the mulch-duff layer was as much as 10 cm (4 in)
thick. Prior to treatment (see Figure 2), average (true) stand density was as high as 5043 stems/ha (2020
stems/ac) with an associated average canopy cover of 96.7%. Mean stem diameter was 14.5 cm (5.7 in).
Following treatment (see Figure 3), average stand density was 696 stems/ha (279 stems/ac) or 13.8% of
the original density. The associated average canopy cover was 25.7% but ranged from 6% to 31%.
Soils at the site were mapped as Tallac series gravelly coarse sandy loam derived from glacial
deposits derived from basic and metamorphic rock (Rogers, 1974). It is moderately well drained with a
weakly cemented silica layer at a depth of approximately 1 m (40 in). This soil is classified within the
6

Inceptisol order as a loamy skeletal mixed Entic Cryumbrept. Tahoma is situated at the border between
volcanic, primarily andesitic rock to the north and granitic rock to the south. Further, some basement
metasedimentary rock can be found intermixed in this glacially deposited material. Rocks can be
visibly identified as both granite and andesitic with scattered metasedimentary fragments.
Materials & Methods
Measurements were taken in late June of 2004 at a time when sufficient soil moisture was
present to yield an accurate test of potential compaction and to allow the use of a recording
penetrometer to collect data on soil density (the cone penetrometer measures resistance to force in
pressure units as an index of soil compaction and density). A Spectrum Fieldscout SC 900 soil
compaction meter with a data logger (recording penetrometer) was used to measure resistance to a
depth of 46 cm (18 in). The cone diameter was 1.3 cm (0.505 in) and cone angle was 30°. Recordings
of soil density/resistance in kPa (psi) were taken at 2.5 cm (1 in) intervals at a maximum insertion rate
of 2.5 cm (1 in) per second. Soil strength was measured in each of the 5 plots located randomly along
the equipment tracks. Each plot consisted of three transect lines (see Figure 4) that extended 15.2 m
(50 feet) perpendicular from the middle of the track and spaced 6.1 m (20 feet) apart, yielding a plot
size of approximately 0.019 ha (2000 ft2). Measurements were taken along each transect at 10 ft
intervals and a measurement was taken at 3 m (10 ft) intervals between transects along the machine
track to add samples at the 0 m (0-ft transect). Bulk density samples were not collected due to
funding constraints and sampling problems experienced by Munn (1998) in a similar study that was
conducted several miles south. Comments regarding each transect were recorded and ocular estimates
of percent bare ground on track and off track were recorded. Overall stand density and sky view factor
changes were also noted using ocular estimation following Bonham (1989).
7

Cover point monitoring techniques (Elzinga et. al., 1998) were used to determine extent of
exposed soil (Crocker and Tivner, 1948 and Bonham, 1989; Hogan, 2003). Three 30 meter (100 ft)
transects were surveyed with five points sampled per transect for a total of 150 measurements per
transect. Transects were measured in a track where mulching occurred, and a track where no
mulching occurred, and in a native area to acquire estimates of exposed soil in the tracks and in an
undisturbed area. Upon downloading data from the data logger, raw data were organized into
groups based on plot and transect. Following the work of Landsberg et. al., (2003), all penetration
values greater than five times the standard deviation of the mean resistance or >3400 kPa (>500 psi)
at a given depth for the respective transect were omitted under the assumption that excessive pressure
was used to penetrate past rocks, root systems, or thick organic matter decomposing below the
surface.
Following the cone penetrometer measurements, the rainfall simulator (RS) (see Battany and
Grismer, 2000; Grismer and Hogan, 2004) was used to determine infiltration, runoff and erosion
rates from bare, “native” grass and mulched track soils in the masticator treatment area. The RS plots
corresponded to the penetrometer measurement locations in the mulched track and at distances of 10-
20 ft away from the tracks. After establishment of plots and installation of plot frames (0.8 m x 0.8
m), the RS was centered over the plot frame and leveled. Here, the “midget” RS was employed
which has a 1 m fall height as compared to the 3.5 m fall RS described by the references above. As
the rainfall kinetic energy of the midget RS at a given intensity is approximately 30% of the full-
size RS, a rainfall intensity approximately 25% greater was used here (~73 vs. 60 mm/hr). On three
of the plots, a rainfall intensity of 120 mm/hr (4.7 in/hr) was employed to determine if greater
intensity would effect sediment concentrations and yields. Prior to rainfall simulation, a handheld
TDR probe is used to measure pre-rainfall soil moisture at several locations in each plot. A
8

plexiglass sheet was placed on the simulator structure above the plot frame and that was quickly
removed when the desired rainfall rate was established and rainfall initiated. Rainfall was allowed
to continue until either steady runoff was obtained, or ~30 minutes had elapsed. Following field
measurements, collected runoff samples are taken to the laboratory for filtration. Samples were
vacuum filtered first through a Whatman #1 filter followed by a 0.45 µm filter. The filter papers
with sediment were dried at 105 oC, weighed and total sediment mass per volume of runoff
determined. In addition, suspended sediment particle sizes were determined using laser techniques
(Eshel, et al. 2004) and the amount of organic matter trapped on the Whatman filters was
determined by combustion techniques.
Results & Discussion
We consider the penetrometer measurements first followed by that from the RS.
Penetrometer data was statistically evaluated using a paired t-test to compare resistance
measurements for varying distances from the track at similar depths. The null hypothesis was
that there is no difference in penetration resistance for a given depth at varying distances from the
track. At t values greater than |2.00| and p < 0.05 (95% confidence), the null hypothesis was
rejected. Table 1 summarizes data organized by distance from track, with means and standard
deviation values of penetration resistance for each given depth. The distance and depth classes
analyzed with the resulting hypothesis rejection or acceptance are listed in Table 2. Depths of 0 and
2.5 cm (0 and 1 in) were not analyzed due to inconsistencies in surface depth measurements due to
instrumentation uncertainties, though these issues were much less prevalent at the 2.5 cm (1 in) depth,
they did occur with significant frequency to render the data unreliable. Penetration resistance
increased with depth, and values were 58 %greater at the 10 cm (4 in) depth than at the 5 cm (2 in)
9

depth across all measurements. Penetration resistance generally declined as distance from the track
increased at a given depth. The differences in mean penetration resistance at the 0 m (0 ft), 3 m (10 ft),
and 6.1 m (20 ft) transects can be summarized as follows:
a) There were no significant increase in penetration resistance at the 5 cm (2 in), 15 cm (6 in),
and 20 cm (8 in) depths between penetrometer values from the machine track and those at
the 3 m (10 ft) and 6.1 m (20 ft) transects, nor between resistance values from the 3 m
(10 ft) and 6.1 m (20 ft) transects.
b) There were no significant increase in penetration resistance at the 10 cm (4 in) and 25 cm
(10 in) depths between measurements made in the machine track and measurements
made at the 3 m (10 ft) transect, nor between measurements at the 3 m (10 ft) and 6.1
m (20 ft) transects.
c) There was a significant increase in penetration resistance at the 10 cm (4 in) and 25 cm (10
in) depths between measurements made in the machine track and measurements made at
the 6.1 m (20 ft) transect. The 10 cm (4 in) depth had a 36% increase in soil compaction
while there was a 19 % increase at the 25 cm (10 in) depth.
Finally, no exposed soil was found in tracks where mulching occurred. Where no
mulching occurred in tracks there was 9% bare soil compared to approximately 6% in a nearby
native area. Estimated overall forest stand density was visibly lower while the stand view factor, or
amount of sky visible through the canopy when viewed from the ground was greater in the
masticated area as compared to an adjacent untreated area (see photos 1 and 2).
Results from the cone penetrometer measurements suggest that use of the heavy
machinery did not result in significant compaction at most soil depths, regardless of distance from the
machine tracks. At the 10 cm (4 in) depth, significant increases in soil compaction occurred very
10
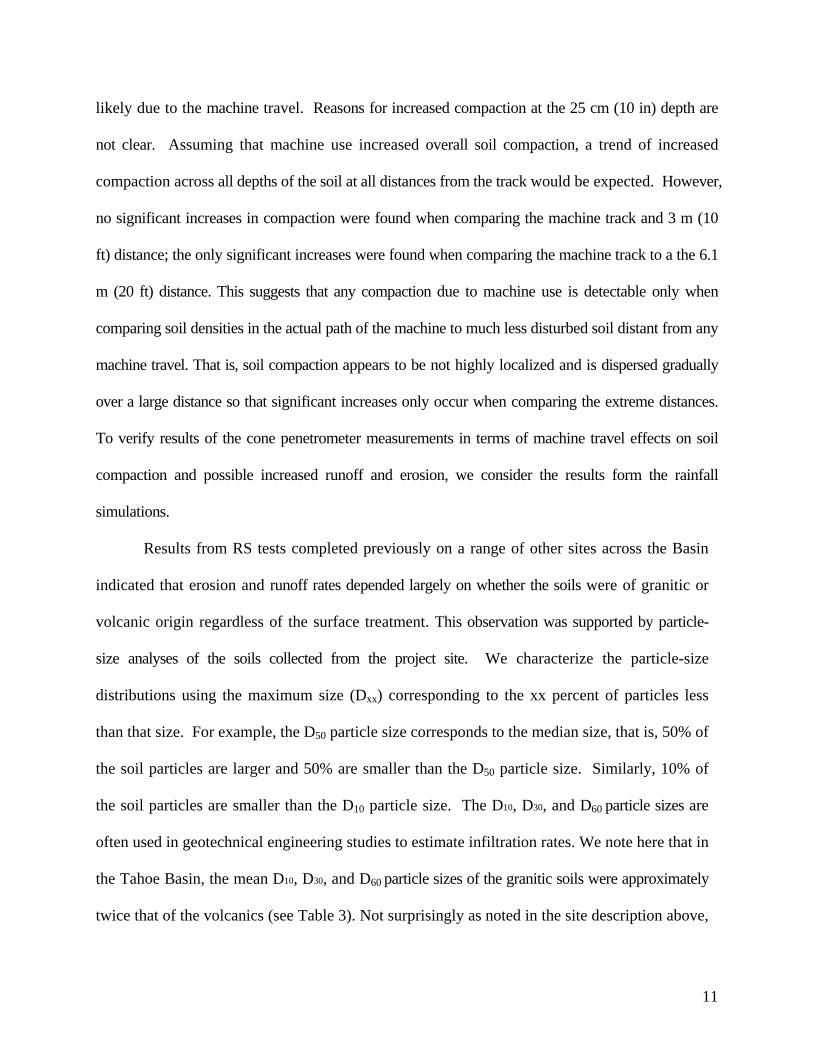
likely due to the machine travel. Reasons for increased compaction at the 25 cm (10 in) depth are
not clear. Assuming that machine use increased overall soil compaction, a trend of increased
compaction across all depths of the soil at all distances from the track would be expected. However,
no significant increases in compaction were found when comparing the machine track and 3 m (10
ft) distance; the only significant increases were found when comparing the machine track to a the 6.1
m (20 ft) distance. This suggests that any compaction due to machine use is detectable only when
comparing soil densities in the actual path of the machine to much less disturbed soil distant from any
machine travel. That is, soil compaction appears to be not highly localized and is dispersed gradually
over a large distance so that significant increases only occur when comparing the extreme distances.
To verify results of the cone penetrometer measurements in terms of machine travel effects on soil
compaction and possible increased runoff and erosion, we consider the results form the rainfall
simulations.
Results from RS tests completed previously on a range of other sites across the Basin
indicated that erosion and runoff rates depended largely on whether the soils were of granitic or
volcanic origin regardless of the surface treatment. This observation was supported by particle-
size analyses of the soils collected from the project site. We characterize the particle-size
distributions using the maximum size (Dxx) corresponding to the xx percent of particles less
than that size. For example, the D50 particle size corresponds to the median size, that is, 50% of
the soil particles are larger and 50% are smaller than the D50 particle size. Similarly, 10% of
the soil particles are smaller than the D10 particle size. The D10, D30, and D60 particle sizes are
often used in geotechnical engineering studies to estimate infiltration rates. We note here that in
the Tahoe Basin, the mean D10, D30, and D60 particle sizes of the granitic soils were approximately
twice that of the volcanics (see Table 3). Not surprisingly as noted in the site description above,
11

soil particle sizes from the masticator treatment site fell between those from other granitic and
volcanic soils, though more similar to other granitic soils in the Basin (Grismer and Hogan,
2005).
Table 4 summarizes the average values of measured parameters from the RS test plots on the
masticator area soils at rainfall intensities of 73 and 120 mm/hr. Down-slopes were quite similar
between plot averages. Not surprisingly, sediment yields were greatest from the bare soil plots,
though we noted that the one plot had unusually deep soil and did not generate any runoff. No runoff
was generated from any of the native grass or woodchip treated plots, nor from the “undisturbed”
(native) plots at the ‘normal’ 73 mm/hr (2.9 in/hr) rainfall rate. This result suggests that for rainfall
events as high as three times the 20-year, 1-hr ‘design’ storm, there is no impact from woodchip
mulched mastication sites of up to ~20% slopes. High-intensity rainfall (120 mm/hr or 4.7 in/hr)
generated runoff from these other plots resulting in sediment yields from the woodchip, grass and
native plots that were 32 %, 24 % and 9.5 %, respectively, of that from the bare soil. Not surprisingly,
organic matter (OM) fractions of the runoff “sediment” were ~60% greater in that from the woodchip,
grass cover and native soil plots as compared to the bare soils. It should be noted that 120 mm/hr rain
events of 15-min durations in the Tahoe Basin are extremely rare.
Particle-size distributions in the runoff sample collected were similar to those from other
granitic soils consistent with the observations in the soil samples collected. Table 5 summarizes the
results of the laser counting of particle size fractions in the runoff samples. Note that runoff particle
sizes from the woodchip plot are much smaller than that from the bare, native, and grass cover soils
suggesting that woodchips may be an effective control of the 3-8 µm particle size fraction associated
with declining Lake water clarity (see “Research Update” in this issue).
When comparing the results for the Masticator site with those from bare ski run sites, it
12

appears that the sediment concentration and yield from the bare soil is much less than that predicted
from the regression equations for ski runs. That is volcanic regression equations developed from the
ski run data suggest a sediment concentration of 2.89 g/L, more than three times greater than the 0.91
g/L measured at the masticator site, and a sediment yield of 3.23 g/mm, or over two times greater than
the 1.48 g/mm observed. On the other hand, it should be noted that the infiltration rate in the grass
cover area was much less than that from the woodchip or native plots resulting in greater runoff and
sediment loss after 15 minutes. This suggests that woodchips may actually increase infiltration and
reduce runoff rate, even compared to a vegetated site. Note that the grassed site consisted of a very
thin, non-contiguous layer of pine needle mulch, visually estimated at less than 20% total cover. That
there is over-prediction of sediment concentrations and yields is not surprising perhaps as ski run soils
are likely to have been more heavily compacted than the forest soils at the masticator site. For
comparison purposes, the granitic soil ski run regression equations suggest a sediment concentration of
0.71 g/L much closer to the 0.91 g/L observed as well as a sediment yield of 0.58 g/mm or about
39% of that observed. As observed elsewhere in the Basin, native grass cover and incorporation of
woodchips dramatically reduces sediment loss from the site as compared to that from bare soils. In
addition, as also found elsewhere in the Basin, the undisturbed forest soils have tremendous
infiltration capacity and minimal runoff or erosion potential.
Rainfall simulations at this site were taken after less than one season after mastication.
Additional assessment will be extremely useful in order to determine how the site responds or
‘rebounds’ from treatment. In sites such as this one, where topsoil is not removed and is very slightly
disturbed, impacts across 1-3 seasons may be quite different than the first season following treatment.
Summary & Conclusions:
13

A mastication pilot project was conducted in June 2004 in the West Shore area of Lake
Tahoe and two related monitoring studies were completed on that pilot project to determine the
environmental and erosion effects of forest mastication on a test site of approximately 0.61 ha. The
overstocked forest was thinned using a Fecon Bull Hog BH 80 Masticator mounted on the boom of a
Caterpillar 235 crawler/excavator.The masticator treatment resulted in an approximately 85% stand
density reduction and approximately 70% reduction in canopy cover. Prior to treatment, average
(true) stand density was approximately 5043 stems/ha (2020 stems/ac). Mean stem diameter was 14.5
cm (5.7 inches). Following treatment, average stand density was 696 stems/ha (279 stems/ac) or
13.8% of the original density. Treatment also resulted in some mechanical equipment impact (tread
compaction) and deposition of a woodchip layer on the soil surface.
A soil compaction study examined the effects of the excavator’s machine tracks on soil
density to determine whether soil compaction was significantly increased by machine travel over the
project site. Resistance was measured using a recording cone penetrometer at five randomly
located plots. Each plot consisted of three 15.2 m (50 ft) transects set perpendicular to the machine
track. Masticated debris left on site as a woodchip/grindings mulch ranged in depth from 2 cm to
depths in excess of 30 cm (12 in). Resistance to penetration increased with soil depth and decreased
with distance from the machine track regardless of surface location. No statistically significant
difference in compaction was found in 13 of 15 comparisons of penetrometer resistance values of
compaction at given distances and varying depths. Statistically significant differences in compaction
were observed in 2 of 15 comparisons. These results suggest that machine impacts on soil density are
relatively minor over the landscape. Furthermore, the increase in surface mulch may result in an
overall higher level of erosion protection.
Subsequent to the compaction study, a portable rainfall simulator (RS) was used to measure
14
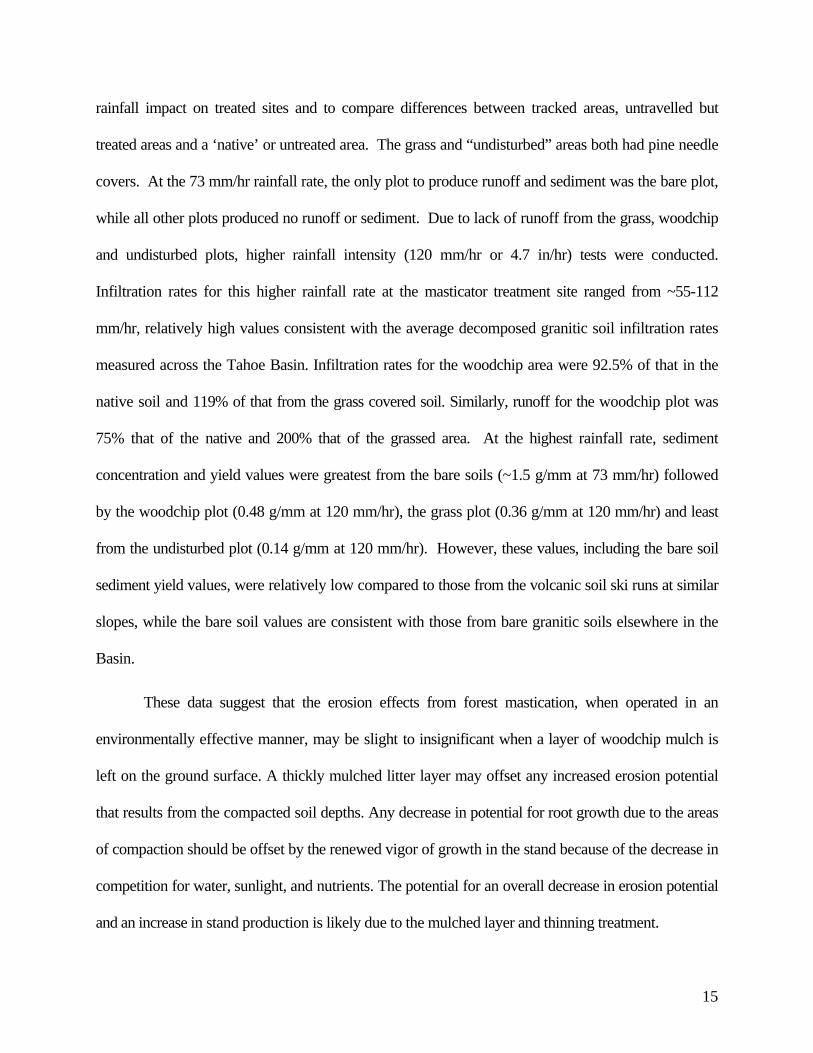
rainfall impact on treated sites and to compare differences between tracked areas, untravelled but
treated areas and a ‘native’ or untreated area. The grass and “undisturbed” areas both had pine needle
covers. At the 73 mm/hr rainfall rate, the only plot to produce runoff and sediment was the bare plot,
while all other plots produced no runoff or sediment. Due to lack of runoff from the grass, woodchip
and undisturbed plots, higher rainfall intensity (120 mm/hr or 4.7 in/hr) tests were conducted.
Infiltration rates for this higher rainfall rate at the masticator treatment site ranged from ~55-112
mm/hr, relatively high values consistent with the average decomposed granitic soil infiltration rates
measured across the Tahoe Basin. Infiltration rates for the woodchip area were 92.5% of that in the
native soil and 119% of that from the grass covered soil. Similarly, runoff for the woodchip plot was
75% that of the native and 200% that of the grassed area. At the highest rainfall rate, sediment
concentration and yield values were greatest from the bare soils (~1.5 g/mm at 73 mm/hr) followed
by the woodchip plot (0.48 g/mm at 120 mm/hr), the grass plot (0.36 g/mm at 120 mm/hr) and least
from the undisturbed plot (0.14 g/mm at 120 mm/hr). However, these values, including the bare soil
sediment yield values, were relatively low compared to those from the volcanic soil ski runs at similar
slopes, while the bare soil values are consistent with those from bare granitic soils elsewhere in the
Basin.
These data suggest that the erosion effects from forest mastication, when operated in an
environmentally effective manner, may be slight to insignificant when a layer of woodchip mulch is
left on the ground surface. A thickly mulched litter layer may offset any increased erosion potential
that results from the compacted soil depths. Any decrease in potential for root growth due to the areas
of compaction should be offset by the renewed vigor of growth in the stand because of the decrease in
competition for water, sunlight, and nutrients. The potential for an overall decrease in erosion potential
and an increase in stand production is likely due to the mulched layer and thinning treatment.
15

While some have suggested that mastication has a high potential for ground compaction and
increased erosion, this study has shown that only where bare ground is present is this clearly the case.
Further, from a watershed perspective, sediment moving from bare areas is likely to be captured in
more heavily mulched areas. It should also be noted that this study only considered conditions at the
site within one season following mastication. Long term impacts are unknown.
Ultimately, the decision to use specific practices for improving forest health depends on
several social, economic and environmental factors. Mastication may be one of the more time and
cost effective methods of forest thinning. Considering the relatively low or non-existent
environmental impacts, properly completed mastication offers a potentially very useful tool to
achieve forest and watershed health goals.
Suggestions for further study
Further studies on the effect of mechanized mastication and soil compaction will be useful in
order to examine the effect of compaction of a forest soil on erosion processes, as well as more
thoroughly analyze the costs and benefits of mastication as a thinning method when compared to hand
crews and burn piles. Studying these sites during at least three years is critical to understanding long-
term change. It will also be useful to study the effects of mastication on forest biogeochemical cycling
of nutrients and carbon, the effects of mulch on the ecosystem, and the transport phenomena of the
mulch with regards to wildfire dynamics.
Agency Contributions and Acknowledgements
We wish to thank the California Tahoe Conservancy for funding this research study and the Meeks Bay Fire Protection District for their support in developing and implementing this project. Appreciation is expressed to Dr. Stephen Hatchett for assistance with the statistical analyses.
16

Table 1. Mean and standard deviation of penetrometer resistance values (psi) at specific distances
from track.
Mean penetration depth (in)
0 1 2 3 4 5 6 7 8 9 10
0-ft Transect 28 55 111 139 162 181 193 200 213 202 195 10-ft Transect 6 18 62 96 136 161 142 170 173 178 172
20-ft Transect 18 39 84 95 103 108 140 139 145 148 158
Std deviations 0-ft Transect 36 64 86 85 85 92 88 129 117 109 65
10-ft Transect 8 18 52 62 98 126 76 98 129 126 107
20-ft Transect 31 57 80 52 59 63 89 79 69 60 66
Table 2. Results of pair-wise t-tests for penetrometer data (significant differences at >95% level in bold).
Transect Depth (in) t-value df p
0-10ft 2 0.6817 14 0.5065 10-20ft 2 -1.0236 14 0.3234 0-20ft 2 -0.2644 14 0.7953
0-10ft 4 0.5169 14 0.6133 10-20ft 4 1.0744 14 0.3008 0-20ft 4 2.3218 14 0.0358
0-10ft 6 1.5787 13 0.1384 10-20ft 6 -0.1172 11 0.9088 0-20ft 6 1.3864 11 0.1931
0-10ft 8 -0.2736 7 0.7923 10-20ft 8 0.3332 6 0.7503 0-20ft 8 1.7085 6 0.1384
0-10ft 10 0.7923 6 0.4583 10-20ft 10 0.3332 6 0.7503 0-20ft 10 2.3446 8 0.0471
17

Table 3. Summary of particle-size distribution measurements for disturbed granitic and volcanic soils in the Tahoe Basin (size fractions).
Granitic Soils n D10 (µm) D30 (µm) D60 (µm) D90 (µm)
Mean values >63 µm 33 117.06 322.48 946.36 ND
Std. Deviation (CV %) 33 20.4 (17.4) 73.9 (22.9) 208 (22.0) ND
Volcanic Soils
Mean values <63 µm 28 4.62 16.37 37.68 68.64
Std. Deviation (CV %) 28 0.99 (21.5) 2.63 (16.1) 5.83 (15.4) 9.31 (13.6)
Table 5. Particle size distributions in runoff samples from RS masticator plots.
Treatment D10 (µm) D30 (µm) D50 (µm) D60 (µm) D90 (µm) Bare 11.68 42.90 114.97 189.42 881.43 Grass 11.40 39.07 78.47 116.93 666.00 Native 10.77 32.07 73.77 123.67 713.00 Woodchips 15.35 57.80 162.50 289.50 1283.00
18

Table 4: Summary of averages of measured parameters from RS test plots on soils at Tahoma masticator site.
Steady Slopes (%) Time to
RunoffCumulative
value @ 15 minTreatment
Down- slope
Cross-slope
(s) Runoff(mm)
Sed. (g)
Infiltration (mm/hr)
Runoff (mm/hr)
S.Conc. (g/L)
OM (%)
Sed. Yield(g/mm)
R2
(%)
Bare Soil 16.47 12.43 369 0.70 1.12 59.77 13.23 0.91 14.3 1.48 89.49
Woodchips 19.05 12.13 No Runoff
Grass Cover 13.49 7.20 No Runoff
Native (undisturbed) 15.48 9.43 No Runoff
High-intensity Rain Woodchips 23.42 13.60 364 1.84 0.91 103.55 16.45 0.76 23.14 0.48 97.92
Grass Cover 17.07 8.41 125 6.48 1.97 87.23 32.77 0.24 21.50 0.36 84.14
Native (undisturbed) 15.48 9.61 136 2.80 0.28 111.84 12.41 0.04 24.28 0.14 79.05
19

References: Allred, B.W. 1950. Practical grassland management. Sheep and Goat Raiser Mag. San Angelo,
Texas, U.S.A. Battany, M.C. and M.E Grismer. 2000. Development of a portable field rainfall simulator
system for use in hillside vineyard runoff and erosion studies. Hydrological Proc. 14:1119-1129.
Bonan, G. 2002. Ecological Climatology. Cambridge, New Jersey, Cambridge University Press.
Bonham, C.D. 1989. Measurements for Terrestrial Vegetation. New York, John Wiley and Sons.
Bowling, L., Storck, P., and Lettenmaier, D. 2000. Hydrologic effects of logging in western Washington, United States. Water Res. Resour. Res. 36, No. 11, 32233240.
Crocker, R.L. and Tivner, N.S. 1948. Survey methods in grassland ecology. Jour. British. Grassl. Soc. 3:1-26.
Elzinga, C.L., Salzer, D.W., and Willoughby, J.W. 1998. Measuring and Monitoring Plant Populations. Washington, D.C., U.S. Government Printing Office.
Eshel, G., Levy, G.J., Mingelgrin, U. and M. J. Singer. 2004. Critical evaluation of the use of laser light scattering for particle size distribution analysis. SSSAJ; In-press.
Frisby, J., and Pfost, D. 1993. Soil Compaction: The Silent Thief. University of Missouri Agricultural Publication G1630. University of Missouri-Columbia Extension.
Grismer, M.E. and M.P. Hogan. 2004. Evaluation of Revegetation/Mulch Erosion Control Using Simulated Rainfall in the Lake Tahoe Basin: 1. Method Assessment. Land Degradation & Dev. 13:573-588.
Grismer, M.E. and M.P. Hogan. 2005. Evaluation of Revegetation/Mulch Erosion Control Using Simulated Rainfall in the Lake Tahoe Basin: 2. Bare Soil Assessment. Land Degradation & Dev. In-press.
Hogan, M. 2003. Luther Pass Monitoring Report: Plant and Soil Cover Monitoring for Evaluating Sediment Source Control Success in the Lake Tahoe Basin. South Lake Tahoe, CA, Lahontan Regional Water Quality Control Board.
Imeson, A.C. and Lavee, H. 1998. Soil Erosion and Climate Change: the transect approach and the influence of scale. Geomorphology 23, 219-227.
Landsberg, J., Miller, R., Anderson, H., and Tepp, J. 2003. Bulk Density and Soil Resistance to Penetration as Affected by Commercial Thinning in Northeastern Washington. Res. Pap. PNW-RP-551. Portland, OR: United States Department of Agriculture, Forest Service, Pacific Northwest Research Station, 35pp.
Molinar, F., Galt, D., and Holechek, J. 2001. Managing for Mulch. Rangelands 23(4), 3-7.
Munn, J. 1998. Angora Highlands Mastication Project Compaction Study. California Dept. Forestry and Fire Protection Res. Pap. 12pp.
Nolte, B.H., and N.R. Fausey. 1986. Soil Compaction and Drainage. AEX 301. Ohio State University Extension.
Radcliffe, D., and Rasmussen, T. 2000. Handbook of Soil Science. Boca Raton, CRC Press. Wall, G., Baldwin, C., Shelton, I. 1987. Soil Erosion-Causes and Effects. Ontario Ministry of
Agriculture and Food Factsheet Agdex# 572. Ontario Ministry of Agriculture and Food, Queens Printer of Ontario.
20

Figure 1. Fecon Bull Hog BH 80 masticator head mounted to the boom of a Caterpiller 235 excavator
21

Figure 2: Treatment area prior to mastication treatment.
22

Figure 3: Treatment area post mastication treatment.
23

Figure 4: typical plot and transect layout (feet).
24