Mechanistic Transmission Modeling of COVID-19 on the ... · 7/13/2020 · Mechanistic Transmission...
17
Mechanistic Transmission Modeling of COVID-19 on the Diamond Princess Cruise Ship Demonstrates the Importance of Aerosol Transmission Parham Azimi, 1,* Zahra Keshavarz, 1 Jose Guillermo Cedeno Laurent, 1 Brent R. Stephens, 2 Joseph G. Allen 1,* 1 Environmental Health Department, Harvard T.H. Chan School of Public Health, Boston, MA USA 2 Department of Civil, Architectural, and Environmental Engineering, Illinois Institute of Technology, Chicago, IL USA * Corresponding authors Abstract Background The current prevailing position is that coronavirus disease 2019 (COVID-19) is transmitted primarily through large respiratory droplets within close proximity (i.e., 1-2 m) of infected individuals. However, quantitative information on the relative importance of specific transmission pathways of the severe acute respiratory syndrome coronavirus 2 (SARS-CoV-2) (i.e., droplets, aerosols, and fomites across short- and long-range distances) remains limited. Methods To evaluate the relative importance of multiple transmission routes for SARS-CoV-2, we leveraged detailed information available from the Diamond Princess Cruise Ship outbreak that occurred in early 2020. We developed a framework that combines stochastic Markov chain and negative exponential dose-response modeling with available empirical data on mechanisms of SARS-CoV-2 dynamics and human behaviors, which informs a modified version of the Reed- Frost epidemic model to predict daily and cumulative daily case counts on the ship. We modeled 21,600 scenarios to generate a matrix of solutions across a full range of assumptions for eight unknown or uncertain epidemic and mechanistic transmission factors, including the magnitude of droplet and aerosol emissions from infected individuals, the infectious dose for deposition of droplets and aerosols to the upper and lower respiratory tracts, and others. Findings A total of 132 model iterations met acceptability criteria (R 2 > 0.95 for modeled vs. reported cumulative daily cases and R 2 > 0 for daily cases). Analyzing only these successful model iterations yields insights into the likely values for uncertain parameters and quantifies the likely contributions of each defined mode of transmission. Mean estimates of the contributions of short- range, long-range, and fomite transmission modes to infected cases aboard the ship across the entire simulation time period were 35%, 35%, and 30%, respectively. Mean estimates of the contributions of large respiratory droplets and small respiratory aerosols were 41% and 59%. Short-range transmission was the dominant mode after passenger quarantine began, albeit due primarily to aerosol transmission, not droplets. . CC-BY-NC-ND 4.0 International license It is made available under a is the author/funder, who has granted medRxiv a license to display the preprint in perpetuity. (which was not certified by peer review) The copyright holder for this preprint this version posted July 15, 2020. ; https://doi.org/10.1101/2020.07.13.20153049 doi: medRxiv preprint NOTE: This preprint reports new research that has not been certified by peer review and should not be used to guide clinical practice.
Transcript of Mechanistic Transmission Modeling of COVID-19 on the ... · 7/13/2020 · Mechanistic Transmission...

Mechanistic Transmission Modeling of COVID-19 on the Diamond Princess Cruise
Ship Demonstrates the Importance of Aerosol Transmission
Parham Azimi,1,* Zahra Keshavarz,1 Jose Guillermo Cedeno Laurent,1 Brent R. Stephens,2
Joseph G. Allen1,*
1Environmental Health Department, Harvard T.H. Chan School of Public Health, Boston, MA
USA
2Department of Civil, Architectural, and Environmental Engineering, Illinois Institute of
Technology, Chicago, IL USA
* Corresponding authors
Abstract
Background
The current prevailing position is that coronavirus disease 2019 (COVID-19) is transmitted
primarily through large respiratory droplets within close proximity (i.e., 1-2 m) of infected
individuals. However, quantitative information on the relative importance of specific transmission
pathways of the severe acute respiratory syndrome coronavirus 2 (SARS-CoV-2) (i.e., droplets,
aerosols, and fomites across short- and long-range distances) remains limited.
Methods
To evaluate the relative importance of multiple transmission routes for SARS-CoV-2, we
leveraged detailed information available from the Diamond Princess Cruise Ship outbreak that
occurred in early 2020. We developed a framework that combines stochastic Markov chain and
negative exponential dose-response modeling with available empirical data on mechanisms of
SARS-CoV-2 dynamics and human behaviors, which informs a modified version of the Reed-
Frost epidemic model to predict daily and cumulative daily case counts on the ship. We modeled
21,600 scenarios to generate a matrix of solutions across a full range of assumptions for eight
unknown or uncertain epidemic and mechanistic transmission factors, including the magnitude of
droplet and aerosol emissions from infected individuals, the infectious dose for deposition of
droplets and aerosols to the upper and lower respiratory tracts, and others.
Findings
A total of 132 model iterations met acceptability criteria (R2 > 0.95 for modeled vs. reported
cumulative daily cases and R2 > 0 for daily cases). Analyzing only these successful model
iterations yields insights into the likely values for uncertain parameters and quantifies the likely
contributions of each defined mode of transmission. Mean estimates of the contributions of short-
range, long-range, and fomite transmission modes to infected cases aboard the ship across the
entire simulation time period were 35%, 35%, and 30%, respectively. Mean estimates of the
contributions of large respiratory droplets and small respiratory aerosols were 41% and 59%.
Short-range transmission was the dominant mode after passenger quarantine began, albeit due
primarily to aerosol transmission, not droplets.
. CC-BY-NC-ND 4.0 International licenseIt is made available under a is the author/funder, who has granted medRxiv a license to display the preprint in perpetuity. (which was not certified by peer review)
The copyright holder for this preprint this version posted July 15, 2020. ; https://doi.org/10.1101/2020.07.13.20153049doi: medRxiv preprint
NOTE: This preprint reports new research that has not been certified by peer review and should not be used to guide clinical practice.

Interpretation
Our results demonstrate that aerosol inhalation was likely the dominant contributor to COVID-19
transmission among passengers aboard the Diamond Princess Cruise Ship. Moreover, close-
range and long-range transmission likely contributed similarly to disease progression aboard the
ship, with fomite transmission playing a smaller role. The passenger quarantine also affected the
importance of each mode, demonstrating the impacts of the interventions. Although cruise ships
represent unique built environments with high ventilation rates and no air recirculation, these
findings underscore the importance of implementing public health measures that target the control
of inhalation of aerosols in addition to ongoing measures targeting control of large droplet and
fomite transmission, not only aboard cruise ships but in other indoor environments as well.
Funding
Funding information is not available.
Introduction Information on the relative importance of specific transmission pathways of the severe acute
respiratory syndrome coronavirus 2 (SARS-CoV-2) remains limited.1 The World Health
Organization’s (WHO) current position is that the COVID-19 virus is transmitted primarily through
respiratory droplets and contact routes, while airborne transmission of the COVID-19 virus is likely
not a major route of transmission other than in settings in which aerosol generating procedures
are occurring.2 Similarly, the U.S. Centers for Disease Control and Prevention (CDC) recently
updated their position to “COVID-19 is thought to spread mainly through close contact from
person-to-person,” which CDC defines as within about 1.8 m (6 feet), and that fomite transmission
and inhalation of respiratory droplets are likely not the main ways that the virus spreads.3
Conversely, numerous researchers4–12 and professional societies (e.g., ASHRAE13) have raised
concerns that longer-range airborne transmission is likely occurring from both symptomatic and
asymptomatic (or pre-symptomatic) individuals through a combination of larger respiratory
droplets that are carried further than 1-2 m via airflow patterns and smaller inhalable aerosols
(i.e., ‘droplet nuclei’) that can easily transport over longer distances. These concerns arise from
a growing understanding of human respiratory emissions,14,15 known transmission pathways of
other respiratory viruses,16 recent empirical evidence detecting SARS-CoV-2 in aerosol and
surface samples in healthcare settings,17–20 and recent case studies demonstrating the likely
importance of longer-range aerosol transmission in some settings.21,22 Understanding the
importance of each transmission pathway for COVID-19 is critical to informing public health
guidelines for effectively managing the spread of the disease.
In the absence of empirical studies using controlled exposures to elucidate transmission
pathways,23 mathematical modeling approaches can offer insights into the likely importance of
the different modes of disease transmission among human populations,24–28 provided that
sufficiently accurate inputs are available. To help fill these knowledge gaps, this work uses a
mechanistic modeling approach to investigate the relative importance of multiple transmission
routes of SARS-CoV-2 among individuals aboard the Diamond Princess Cruise Ship, which
experienced a major outbreak of COVID-19 in early 2020.
. CC-BY-NC-ND 4.0 International licenseIt is made available under a is the author/funder, who has granted medRxiv a license to display the preprint in perpetuity. (which was not certified by peer review)
The copyright holder for this preprint this version posted July 15, 2020. ; https://doi.org/10.1101/2020.07.13.20153049doi: medRxiv preprint

Methods The Diamond Princess Cruise Ship presents a unique built environment case study, with a known
number of passengers, crewmembers, and COVID-19 cases over time, discovered through high
rates of testing, and a relatively high degree of knowledge of several important human and built
environment factors. The Diamond Princess experienced a major outbreak of COVID-19 in early
2020, with 712 of 3711 passengers and crew members on board becoming infected (19% of the
community)29 and at least 57 other passengers who tested positive in the days after they left the
ship and returned to their home countries.30 As reported, the COVID-19 outbreak was traced to a
single passenger from Hong Kong who boarded the ship in Yokohama on January 20 and then
disembarked in Hong Kong on January 25. He had symptoms including coughing before boarding
and was diagnosed with COVID-19 on February 1 in Hong Kong. The first 10 cases were
confirmed on February 4 after the ship arrived in the Yokohama port. Laboratory-confirmed cases
of COVID-19 led to the quarantine of passengers aboard the Diamond Princess for 14 days
beginning on February 5 at 7 am, with all passengers required to remain in their cabins essentially
all of the time. As of February 5, there were a total of 3711 individuals onboard the Diamond
Princess, with 2666 passengers and 1045 crew members.31
To estimate the likely contributions of specific infection transmission modes to the number of
COVID-19 cases among individuals aboard the Diamond Princess Cruise Ship, a combination of
epidemic, mechanistic transmission, and dose-response models was adopted. Full model details
are described in the SI. Briefly, we utilize a stochastic Markov chain process to stochastically trace
close- and long-range transmission by contact with large respiratory droplets, inhalation of smaller
aerosols, and fomite contact under a wide range of possible scenarios constructed from
combinations of unknown or uncertain input parameters. The Markov chain model informs a dose-
response model, which in turn informs an epidemic model to generate estimates of daily and
cumulative daily case counts aboard the ship from January 20 (when there was only one index
case aboard the ship) to February 24 (when all passengers disembarked). We analyze only those
model scenarios that achieved an acceptable agreement between predicted and reported case
numbers for daily cumulative cases (defined as R2 > 0.95) and daily cases (defined as non-
negative R2) to infer likely values of the unknown or uncertain model parameters and to quantify
the contribution of the various modes of transmission in the most successful model scenarios.
Markov Chain Model
The mechanistic transmission model uses a Markov chain process to estimate the number of
SARS-CoV-2 copies present in numerous physical states, as well as the probability of
transmission of SARS-CoV-2 between each defined state, aboard the ship over time (SI Section
1). We considered 12 states for the Markov chain process, including indoor air and surfaces in
cabins and public areas, hands (palms) of individuals, upper and lower respiratory tracts (i.e.,
URT and LRT) of individuals, heating, ventilation, and air-conditioning (HVAC) systems, and
inactivation of viable virus (Figure S1). We generated a new Markov chain matrix (MCM) for each
day in the simulation period to model mechanistic transmission and infection probability based on
a number of assumptions for built environment parameters, crew and passengers’ interactions,
adopted infection control strategies, and the number of infectors and susceptible individuals
estimated from application of the transmission risk model to the previous days.
The modeling framework incorporates available empirical data on key mechanisms of SARS-
CoV-2 dynamics culled from recent literature, including (i) viral RNA emission rates in large
droplets (> 10 µm) and inhalable aerosols (< 10 µm) from infected individuals, which were back-
. CC-BY-NC-ND 4.0 International licenseIt is made available under a is the author/funder, who has granted medRxiv a license to display the preprint in perpetuity. (which was not certified by peer review)
The copyright holder for this preprint this version posted July 15, 2020. ; https://doi.org/10.1101/2020.07.13.20153049doi: medRxiv preprint

calculated from recent reports of air and surface sampling in healthcare settings and were
assumed to be the same ratio for all infected individuals, (ii) viability loss in air and on surfaces
reported in controlled studies, and (iii) estimates of aerosol deposition rates to surfaces based on
typical assumptions for aerosol dynamics.
The framework also leverages estimates and assumptions for several human and built
environment transmission factors, culled from prior literature where possible, including average
rates of face- and surface-touching, inhalation rates, the shape and size of close-contact zones,
time spent in various environments (e.g., public areas and cabins), floor areas and volumes of
cabins and public areas, the probability of uninfected individuals within close proximity of an
infected individual, and the impact of infection control strategies that were implemented during
the quarantine period (e.g., mask wearing, hand washing, and surface disinfection). Detailed
descriptions of all model inputs are provided in the SI, including Section 1 (for relatively certain
parameters) and Section 3 (for relatively unknown or uncertain parameters).
Dose-Response Model
To estimate the infection probability of SARS-CoV-2 viruses deposited to different body sites of
susceptible individuals, we used a negative exponential dose-response model, which implies that
a single particle can start an infection and all single particles are independent of each other. The
probability of infection for one susceptible individual (𝑃𝑖𝑛𝑓𝑒𝑐𝑡𝑖𝑜𝑛) in the cruise ship was calculated
using Equation 1:
𝑃𝑖𝑛𝑓𝑒𝑐𝑡𝑖𝑜𝑛 =𝑁𝑢𝑚𝑏𝑒𝑟 𝑜𝑓 𝑖𝑛𝑓𝑒𝑐𝑡𝑒𝑑 𝑐𝑎𝑠𝑒𝑠
𝑁𝑢𝑚𝑏𝑒𝑟 𝑜𝑓 𝑆𝑢𝑠𝑐𝑒𝑝𝑡𝑖𝑏𝑙𝑒𝑠
= 1 − exp[−(𝛼𝑈𝑅𝑇 × 𝑁𝑈𝑅𝑇 + 𝛼𝐿𝑅𝑇 × 𝑁𝐿𝑅𝑇)]
Equation 1
Where:
𝑁𝑈𝑅𝑇 and 𝑁𝐿𝑅𝑇: Number of viable SARS-CoV-2 RNA copies in upper and lower respiratory tracts
of one susceptible individual, and
𝛼𝑈𝑅𝑇 and 𝛼𝐿𝑅𝑇: Infectivity of SARS-CoV-2 for upper and lower respiratory tracts.
The 50% infectious dose (𝐼𝐷50), or the number of viruses necessary to infect a susceptible
individual in 50% of a sample population, of SARS-CoV-2 for upper and lower respiratory tracts
can be estimated from Equation 2:32,33
𝐼𝐷50 =ln(2)
𝛼 𝑊ℎ𝑒𝑟𝑒 𝐼𝐷50 ≥ ln (2) Equation 2
Estimates of ID50 and infectivity for upper and lower respiratory tracts (URT and LRT) play a critical
role in understanding the transmission of airborne infectious diseases. However, we are not aware
of any clinical studies to date that report these values for SARS-CoV-2 in humans or animals.
Moreover, the proportions of SARS-CoV-2 depositing in the LRT and URT of a susceptible
individual when they inhale infectious aerosols are not yet characterized. Therefore, we tested
three logarithmically spaced assumptions for the ratio of the effective ID50 for SARS-CoV-2 for
aerosol inhalation (assuming deposition in the LRT) and fomite and droplet deposition (assuming
deposition in the URT) (i.e., ID50 URT:LRT = 1:1, 10:1, and 100:1). We rely on our model approach
to back-calculate effective ID50 values (using a basis of RNA copies) by analyzing successful
model results, as described in the SI (Section 1.3). This approach allows us to test scenarios with
this uncertain parameters without knowing (or needing to know) the actual magnitude of ID50,
. CC-BY-NC-ND 4.0 International licenseIt is made available under a is the author/funder, who has granted medRxiv a license to display the preprint in perpetuity. (which was not certified by peer review)
The copyright holder for this preprint this version posted July 15, 2020. ; https://doi.org/10.1101/2020.07.13.20153049doi: medRxiv preprint

which can then be used to infer the likely magnitude of this ratio based on successful model
outcomes.
Transmission Mode Contribution to Infection
In addition to estimating the number of infected cases with the model framework, we also
estimated the contribution of multiple infection transmission modes to the estimated number of
infected cases in both cabins and public areas, including (i) direct deposition of respiratory
droplets (within close range only), (ii) fomite transmission, and (ii) inhalation of aerosols (with both
close- and long-range transmission traced separately) (Equation 3):
𝐶𝑖𝑛𝑓𝑒𝑐𝑡𝑖𝑜𝑛,𝑘,𝑟,𝑝 = ∑ {𝑁𝑖𝑛𝑓𝑒𝑐𝑡𝑒𝑑,𝑟,𝑙
𝑁𝑖𝑛𝑓𝑒𝑐𝑡𝑒𝑑,𝑡𝑜𝑡𝑎𝑙,𝑝×
1 − exp(−𝑁𝑣𝑖𝑟𝑢𝑠,𝑘,𝑟,𝑙 × 𝛼𝑘)
∑ [1 − exp(−𝑁𝑣𝑖𝑟𝑢𝑠,𝑘,𝑟,𝑙 × 𝛼𝑘)]𝑘,𝑟
}
𝐷𝑝
𝑙=0
Equation 3
Where:
𝑘: Four considered scenarios for infection transmission modes, including direct droplet deposition,
fomite, long-range aerosol inhalation, and short-range aerosol inhalation,
𝑟: Two considered micro-environments in the cruise ship including cabins and public areas,
𝑝: Three considered simulation periods including during the entire outbreak duration, before the
passenger quarantine began, and after the passenger quarantine began,
𝐶𝑖𝑛𝑓𝑒𝑐𝑡𝑖𝑜𝑛,𝑘,𝑟,𝑝: Infection contribution associated with transmission mode 𝑘 in microenvironment 𝑟
in simulation period 𝑝,
𝐷𝑝: Number of simulation days in the simulation period 𝑝 (i.e., 36, 16, and 20 for the entire
outbreak duration before all passengers disembarked, before the passenger quarantine began,
and after the passenger quarantine began, respectively),
𝑁𝑖𝑛𝑓𝑒𝑐𝑡𝑒𝑑,𝑟,𝑙: Number of infected cases in microenvironment 𝑟 on day 𝑙 of the simulation period,
𝑁𝑖𝑛𝑓𝑒𝑐𝑡𝑒𝑑,𝑡𝑜𝑡𝑎𝑙,𝑝: Total number of infected cases in the cruise ship during the simulation period 𝑝,
𝑁𝑣𝑖𝑟𝑢𝑠,𝑘,𝑟,𝑙: Number of SARS-CoV-2 RNA copies that reached the relevant respiratory tract region
(i.e., LRT for inhalation and URT for direct deposition and fomite) via transmission mode 𝑘 in
microenvironment 𝑟 on day 𝑙 of the simulation period, and
𝛼𝑘: Infectivity of SARS-CoV-2 for the target respiratory tract (i.e., LRT for inhalation and URT for
direct deposition and fomite)
This approach allows for summarizing estimates of infection contributions by transmission mode,
contact range, micro-environment (i.e., public areas or passenger cabins), and/or simulation
period independently, as needed.
Short-range transmission occurs by direct deposition of respiratory droplets and inhalation of
aerosols only when susceptible individuals were within a defined close-range contact area of
infected individuals. The close-range contact area was defined assuming a conical area in front
of an infector with the head angle of 60° and length of 3 meters (described in detail in the SI,
Section 1.2.2)34,35. The projected surface area of the cone on the floor was ~4.7 m2, which is
equivalent to a surface area of a circle around the infector with a radius of ~1.2 m. The probability
. CC-BY-NC-ND 4.0 International licenseIt is made available under a is the author/funder, who has granted medRxiv a license to display the preprint in perpetuity. (which was not certified by peer review)
The copyright holder for this preprint this version posted July 15, 2020. ; https://doi.org/10.1101/2020.07.13.20153049doi: medRxiv preprint

that a susceptible individual was present within the close-contact cone was estimated based on
the proportion of the zone surface area to the projected surface area of the cone on the floor (SI
Section 1.2.2).
Long-range inhalation transmission occurs via inhalation of aerosols when susceptible individuals
were outside the close-contact area. Fomite transmission occurs when susceptible individuals
came in contact with contaminated surfaces, which could be contaminated by infected individuals
through direct touching, direct deposition of respiratory droplets, and/or deposition of respiratory
aerosols at any time point and location in the model framework.
Combining the Transmission Risk Model with a Developed Epidemic Model
The mechanistic infection transmission model was combined with a modified version of the Reed-
Frost epidemic model to simulate the transmission of COVID-19 aboard the ship. We assumed
that (i) the infection is spread from infected individuals to others by four main transmission
pathways (long-range inhalation, short-range inhalation, direct deposition within close-range, and
fomite), (ii) a portion of susceptible individuals in the group will develop the infection and will be
infectious to others (the portion of ‘susceptibles’ who will develop the infection is estimated by the
transmission risk model), (iii) the probability of coming into adequate contact with any other
specified individual in the group within one time interval depends on the interaction behavior of
the individual and is estimated using the Markov chain method, (iv) the susceptible individuals in
the cruise ship were isolated from others outside the cruise ship, and (v) these conditions remain
constant during one whole day of the outbreak.
To estimate the spread of the disease, we estimated the number of infected cases among
susceptible individuals, some of whom were cabinmates with infected individuals and some were
not, at the end of each simulation day using the transmission risk model. The infected cases were
assumed to develop infection and become ‘infectors’ after the latent period, which was estimated
by reducing the assumed effective sub-clinical infectious period (i.e., the time span between the
onset of the infectious period and the appearance of clinical signs of disease) from the effective
incubation period (i.e., the time span between infection and detection among infected cases). The
number of cabins with at least one infected individual (i.e., ‘infected cabins’) was calculated at the
end of each simulation day by assuming the number of newly infected cabins is equal to the
number of newly infected cases who were not in one of the previously infected cabins at the
beginning of the simulation day. The numbers of susceptible individuals who were not cabinmates
with an infector (𝑁𝑠𝑢𝑠𝑐𝑒𝑝𝑡𝑖𝑏𝑙𝑒𝑠−𝑐𝑜𝑚𝑚𝑜𝑛) and susceptible individuals inside the infected cabins
(𝑁𝑠𝑢𝑠𝑐𝑒𝑝𝑡𝑖𝑏𝑙𝑒𝑠−𝑐𝑎𝑏𝑖𝑛) at the beginning of each simulation day (𝑑) were estimated using the
Equations 4-5 (except for the first period of infection transmission):
𝑁𝑠𝑢𝑠𝑐𝑒𝑝𝑡𝑖𝑏𝑙𝑒𝑠−𝑐𝑜𝑚𝑚𝑜𝑛(𝑑)
= 𝑁𝑡𝑜𝑡𝑎𝑙−𝑜𝑛𝑏𝑜𝑎𝑟𝑑 − [𝑁𝑖𝑛𝑓𝑒𝑐𝑡𝑒𝑑−𝑐𝑎𝑏𝑖𝑛(𝑑) × 𝑁𝑎𝑣𝑒𝑟𝑎𝑔𝑒−𝑐𝑎𝑏𝑖𝑛]
Equation 4
𝑁𝑠𝑢𝑠𝑐𝑒𝑝𝑡𝑖𝑏𝑙𝑒𝑠−𝑐𝑎𝑏𝑖𝑛(𝑑)
= [𝑁𝑖𝑛𝑓𝑒𝑐𝑡𝑒𝑑−𝑐𝑎𝑏𝑖𝑛(𝑑) × 𝑁𝑎𝑣𝑒𝑟𝑎𝑔𝑒−𝑐𝑎𝑏𝑖𝑛] − 𝑁𝑖𝑛𝑓𝑒𝑐𝑡𝑜𝑟(𝑑)
− ∑ 𝑁𝑑𝑒𝑡𝑒𝑐𝑡𝑒𝑑−𝑐𝑎𝑠𝑒𝑠(𝑖)
𝑑−1
𝑖=0
Equation 5
Where:
. CC-BY-NC-ND 4.0 International licenseIt is made available under a is the author/funder, who has granted medRxiv a license to display the preprint in perpetuity. (which was not certified by peer review)
The copyright holder for this preprint this version posted July 15, 2020. ; https://doi.org/10.1101/2020.07.13.20153049doi: medRxiv preprint

𝑁𝑡𝑜𝑡𝑎𝑙−𝑜𝑛𝑏𝑜𝑎𝑟𝑑: Total number of passengers and crew onboard (constant during the outbreak),
𝑁𝑖𝑛𝑓𝑒𝑐𝑡𝑒𝑑−𝑐𝑎𝑏𝑖𝑛: Estimated number of infected cabins at the beginning of each day,
𝑁𝑎𝑣𝑒𝑟𝑎𝑔𝑒−𝑐𝑎𝑏𝑖𝑛: Average number of individuals in one cabin,
𝑁𝑖𝑛𝑓𝑒𝑐𝑡𝑜𝑟: Number of infectors, and
∑ 𝑁𝑑𝑒𝑡𝑒𝑐𝑡𝑒𝑑−𝑐𝑎𝑠𝑒𝑠: Cumulative number of detected infected cases or disembarked individuals
from the cruise ship.
We assumed the infected cases could spread infectious particles only one day after the incubation
period, when their clinical symptoms began. We divided the transmission patterns into four
periods, each of which having different epidemic characteristics, as described in the SI (Section
1.1). Several checkpoint conditions were introduced to the epidemic model to ensure reasonable
bounds (SI Section 2.3).
Analysis
The model framework requires numerous assumptions or estimates for unknown or uncertain
input parameters, which were culled from existing literature where possible and otherwise
estimated or assumed using known information about the Diamond Princess Cruise Ship.
Because there is high uncertainty around several critical model parameters, we utilized a scenario
modeling approach in which values for unknown or uncertain epidemic and transmission modeling
parameters were varied over a wide range of possibilities to generate a matrix of possible
solutions. A total of 21,600 scenarios were modeled across a range of estimates or assumptions
for eight critical unknown or uncertain input parameters (Table 1). Estimates and assumptions for
these parameters are described in detail in the SI (Section 3). We ran the model with each
possible combination of the eight unknown or uncertain input parameters shown in Table 1
(10×5×6×3×3×2×2×2=21,600) in order to search a wide range of possible parameter values and
combinations of parameter values.
Table 1. Summary of the ranges of 8 unknown or uncertain critical model input parameters that defined each model
iteration
Model Inputs
Epidemiological Factors Mechanistic Transmission Factors
Effective incubation
period
Effective sub-
clinical infectious
period
Effective reproduction
number for the index case
Symptomatic vs
asymptomatic emissions
Ratio of aerosol vs.
droplet emissions
Minimum close
interaction time in cabins
Quarantine infection control
efficiency
URT/LRT infectious
doses
No. Scenarios
10 5 6 2 3 2 2 3
Range 6 – 15 (days)
1 – 5 (days)
1 – 6 0.544
1.0
0.3:1 2.4:1 1:1
8 or 12 hours per
day
Moderate
High
1:1 10:1
100:1
Results A total of 132 model iterations met the acceptability criteria of R2 > 0.95 for daily cumulative cases
and R2 > 0 for daily cases (0.6% of the total number of model iterations). The cumulative number
of infected cases reported in various outlets was 765 cases; the average (±SD) cumulative
number of modeled infected cases among iterations meeting acceptability criteria was 736 (±64)
(Figure 1). A total of 611, 495, and 323 model scenarios achieved R2 > 0 for daily cases and R2
> 0.8, 0.85, and 0.9 for daily cumulative cases, respectively.
. CC-BY-NC-ND 4.0 International licenseIt is made available under a is the author/funder, who has granted medRxiv a license to display the preprint in perpetuity. (which was not certified by peer review)
The copyright holder for this preprint this version posted July 15, 2020. ; https://doi.org/10.1101/2020.07.13.20153049doi: medRxiv preprint
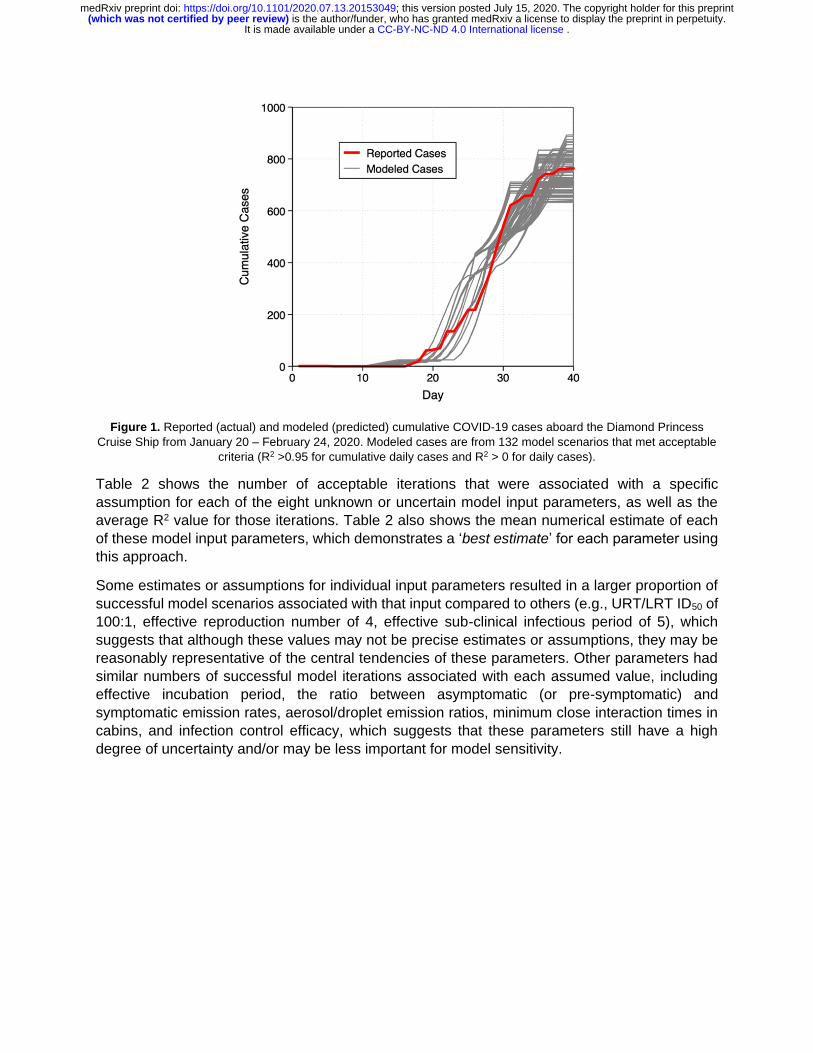
Figure 1. Reported (actual) and modeled (predicted) cumulative COVID-19 cases aboard the Diamond Princess
Cruise Ship from January 20 – February 24, 2020. Modeled cases are from 132 model scenarios that met acceptable
criteria (R2 >0.95 for cumulative daily cases and R2 > 0 for daily cases).
Table 2 shows the number of acceptable iterations that were associated with a specific
assumption for each of the eight unknown or uncertain model input parameters, as well as the
average R2 value for those iterations. Table 2 also shows the mean numerical estimate of each
of these model input parameters, which demonstrates a ‘best estimate’ for each parameter using
this approach.
Some estimates or assumptions for individual input parameters resulted in a larger proportion of
successful model scenarios associated with that input compared to others (e.g., URT/LRT ID50 of
100:1, effective reproduction number of 4, effective sub-clinical infectious period of 5), which
suggests that although these values may not be precise estimates or assumptions, they may be
reasonably representative of the central tendencies of these parameters. Other parameters had
similar numbers of successful model iterations associated with each assumed value, including
effective incubation period, the ratio between asymptomatic (or pre-symptomatic) and
symptomatic emission rates, aerosol/droplet emission ratios, minimum close interaction times in
cabins, and infection control efficacy, which suggests that these parameters still have a high
degree of uncertainty and/or may be less important for model sensitivity.
. CC-BY-NC-ND 4.0 International licenseIt is made available under a is the author/funder, who has granted medRxiv a license to display the preprint in perpetuity. (which was not certified by peer review)
The copyright holder for this preprint this version posted July 15, 2020. ; https://doi.org/10.1101/2020.07.13.20153049doi: medRxiv preprint
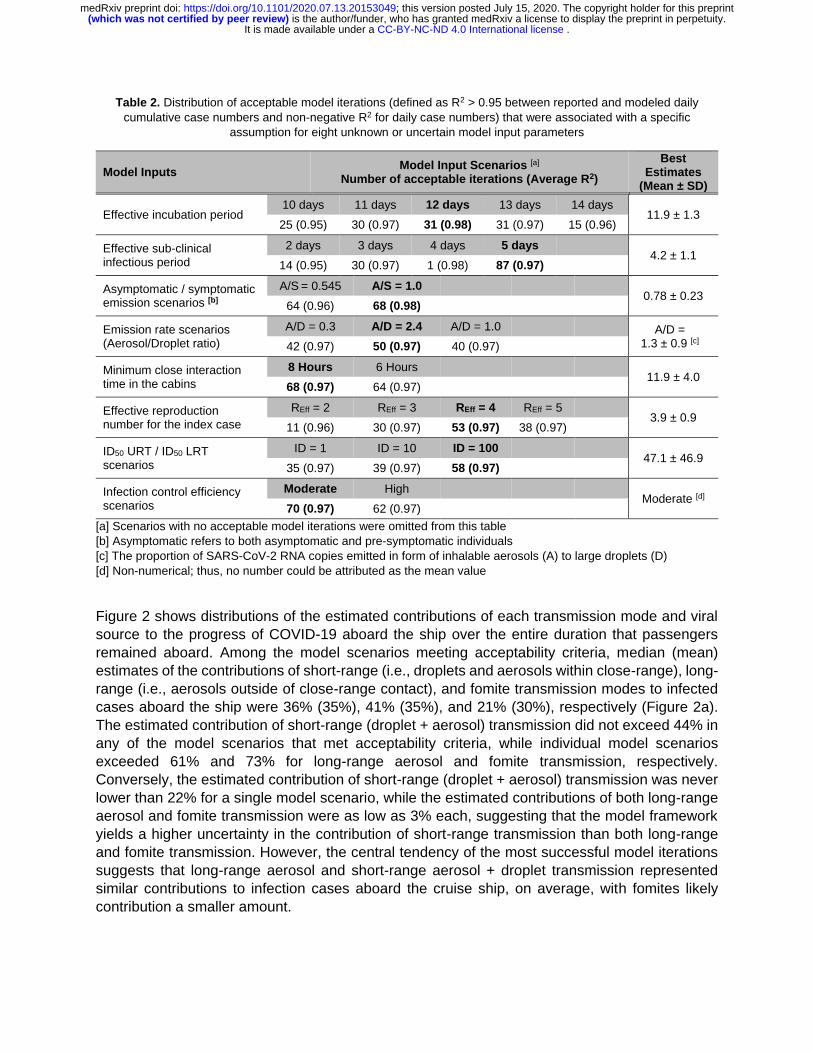
Table 2. Distribution of acceptable model iterations (defined as R2 > 0.95 between reported and modeled daily
cumulative case numbers and non-negative R2 for daily case numbers) that were associated with a specific
assumption for eight unknown or uncertain model input parameters
Model Inputs Model Input Scenarios [a]
Number of acceptable iterations (Average R2)
Best Estimates
(Mean ± SD)
Effective incubation period 10 days 11 days 12 days 13 days 14 days
11.9 ± 1.3 25 (0.95) 30 (0.97) 31 (0.98) 31 (0.97) 15 (0.96)
Effective sub-clinical infectious period
2 days 3 days 4 days 5 days
4.2 ± 1.1 14 (0.95) 30 (0.97) 1 (0.98) 87 (0.97)
Asymptomatic / symptomatic emission scenarios [b]
A/S = 0.545 A/S = 1.0
0.78 ± 0.23 64 (0.96) 68 (0.98)
Emission rate scenarios (Aerosol/Droplet ratio)
A/D = 0.3 A/D = 2.4 A/D = 1.0 A/D = 1.3 ± 0.9 [c] 42 (0.97) 50 (0.97) 40 (0.97)
Minimum close interaction time in the cabins
8 Hours 6 Hours
11.9 ± 4.0 68 (0.97) 64 (0.97)
Effective reproduction number for the index case
REff = 2 REff = 3 REff = 4 REff = 5
3.9 ± 0.9 11 (0.96) 30 (0.97) 53 (0.97) 38 (0.97)
ID50 URT / ID50 LRT scenarios
ID = 1 ID = 10 ID = 100
47.1 ± 46.9 35 (0.97) 39 (0.97) 58 (0.97)
Infection control efficiency scenarios
Moderate High
Moderate [d] 70 (0.97) 62 (0.97)
[a] Scenarios with no acceptable model iterations were omitted from this table
[b] Asymptomatic refers to both asymptomatic and pre-symptomatic individuals
[c] The proportion of SARS-CoV-2 RNA copies emitted in form of inhalable aerosols (A) to large droplets (D)
[d] Non-numerical; thus, no number could be attributed as the mean value
Figure 2 shows distributions of the estimated contributions of each transmission mode and viral
source to the progress of COVID-19 aboard the ship over the entire duration that passengers
remained aboard. Among the model scenarios meeting acceptability criteria, median (mean)
estimates of the contributions of short-range (i.e., droplets and aerosols within close-range), long-
range (i.e., aerosols outside of close-range contact), and fomite transmission modes to infected
cases aboard the ship were 36% (35%), 41% (35%), and 21% (30%), respectively (Figure 2a).
The estimated contribution of short-range (droplet + aerosol) transmission did not exceed 44% in
any of the model scenarios that met acceptability criteria, while individual model scenarios
exceeded 61% and 73% for long-range aerosol and fomite transmission, respectively.
Conversely, the estimated contribution of short-range (droplet + aerosol) transmission was never
lower than 22% for a single model scenario, while the estimated contributions of both long-range
aerosol and fomite transmission were as low as 3% each, suggesting that the model framework
yields a higher uncertainty in the contribution of short-range transmission than both long-range
and fomite transmission. However, the central tendency of the most successful model iterations
suggests that long-range aerosol and short-range aerosol + droplet transmission represented
similar contributions to infection cases aboard the cruise ship, on average, with fomites likely
contribution a smaller amount.
. CC-BY-NC-ND 4.0 International licenseIt is made available under a is the author/funder, who has granted medRxiv a license to display the preprint in perpetuity. (which was not certified by peer review)
The copyright holder for this preprint this version posted July 15, 2020. ; https://doi.org/10.1101/2020.07.13.20153049doi: medRxiv preprint

Median (mean) estimates of the contributions of larger droplets (which includes only short-range
and fomite transmission in the model framework) and smaller aerosols (which includes all possible
modes of transmission) were 28% (41%) and 72% (59%), respectively (Figure 2b). Differences
between droplet and aerosol transmission were significant (Mann-Whitney U-test p<0.0001).
Individual model scenarios resulted in at least one scenario in which only one viral source
dominated the other (up to 96% for each mode), but the central tendencies again suggest that
smaller aerosols contributed to a greater proportion of infected cases aboard the cruise ship, on
average, across all time periods (i.e., both before and after passenger quarantine).
Figure 2. Estimates of the contributions of transmission modes and viral sources to infected
cases aboard the Diamond Princess Cruise Ship over the entirety of the simulation period
Next, we analyzed the model results for periods before and after passenger quarantine started.
Analyzing only the 132 model iterations that met acceptability criteria, the average (±SD) estimate
of the proportion of cases that were transmitted prior to and after the passenger quarantine period
was 58% (±5%) and 42% (±5%), respectively (Figure 3a). The average (±SD) estimate of the
effective reproduction number before and after the quarantine period was 3.8 (±0.9) and 0.1
(±0.2), respectively (Figure 3b).
. CC-BY-NC-ND 4.0 International licenseIt is made available under a is the author/funder, who has granted medRxiv a license to display the preprint in perpetuity. (which was not certified by peer review)
The copyright holder for this preprint this version posted July 15, 2020. ; https://doi.org/10.1101/2020.07.13.20153049doi: medRxiv preprint

Figure 3. Mean (SD) estimates of (a) the proportion of cases and (b) the effective reproduction
number before and after passenger quarantine
Estimates of the contributions of the specific transmission modes considered herein varied
between the time periods before and after the passenger quarantine was in place (Figure 4). Prior
to the passenger quarantine period, when passengers were free to move about both cabin and
public areas, median (mean) estimates of the contribution of long-range, fomite, and short-range
transmission were 42% (34%), 37% (46%), and 22% (19%), respectively, suggesting that close-
contact transmission contributed the least to overall transmission, while long-range aerosol and
fomite transmission were likely similar in magnitude. Conversely, after the quarantine period
began and passengers primarily remained in their cabins, the median (mean) estimates of the
contribution of long-range, fomite, and short-range transmission were 39% (36%), 58% (59%),
and 0.5% (6%), respectively, suggesting that close-contact transmission (via both droplets and
aerosols) dominated during this time period, as expected. Before the quarantine, only the
differences between short- and long-range transmission (Mann-Whitney U-test p<0.0001) and
between long-range and fomite transmission (Mann-Whitney U-test p=0.0004) were significant.
After the quarantine, all transmission mode comparisons were significant (p<0.0001).
. CC-BY-NC-ND 4.0 International licenseIt is made available under a is the author/funder, who has granted medRxiv a license to display the preprint in perpetuity. (which was not certified by peer review)
The copyright holder for this preprint this version posted July 15, 2020. ; https://doi.org/10.1101/2020.07.13.20153049doi: medRxiv preprint

Figure 4. Estimates of the contribution of multiple transmission modes to infected cases aboard
the Diamond Princess Cruise Ship over the entirety of the simulation period as well as before
and after quarantine measures
Estimates of the contributions of the different viral sources considered herein (i.e., droplets vs.
aerosols) also varied between the time periods before and after the passenger quarantine was in
place (Figure 5). Median (mean) estimates of the contribution of droplets and aerosols prior to the
passenger quarantine were 40% (50%) and 60% (50%) (p=0.32), respectively, suggesting that
both larger respiratory droplets and smaller respiratory aerosols contributed approximately
equally to infected cases aboard the ship during this time period. Conversely, median (mean)
estimates of the contribution of droplets and aerosols after the passenger quarantine began were
15% (27%) and 85% (73%) (p<0.0001), respectively, suggesting that even though short-range
transmission likely dominated during this period (Figure 4), smaller aerosol transmission likely
accounted for the vast majority of infected cases post-quarantine, rather than larger droplets.
. CC-BY-NC-ND 4.0 International licenseIt is made available under a is the author/funder, who has granted medRxiv a license to display the preprint in perpetuity. (which was not certified by peer review)
The copyright holder for this preprint this version posted July 15, 2020. ; https://doi.org/10.1101/2020.07.13.20153049doi: medRxiv preprint

Figure 5. Estimates of the contribution of droplets and aerosols to infected cases aboard the
Diamond Princess Cruise Ship over the entirety of the simulation period as well as before and
after quarantine measures
Discussion Although there is high uncertainty around numerous model parameters, the model approach is
designed to identify the most likely values of several unknown or uncertain parameters by
analyzing only those model results that met acceptability criteria, and thereby providing insight
into the likely importance of the various modes of transmission included in the framework. Results
show that the long-range transmission of aerosols containing SARS-CoV-2 was most likely the
dominant mode of COVID-19 transmission aboard the ship even with a very high ventilation rate
(9-12 air changes per hour) and no recirculated air. The long-range and short-range transmission
routes had similar contributions to the total number of infected cases. However, aerosol
transmission across both short- and long-range distances accounted for >70% of disease
transmission overall, which is contrary to the prevailing positions on how COVID-19 is spread.
Although cruise ships represent unique built environments with high ventilation rates and no air
recirculation, these findings underscore the importance of implementing public health measures
that target the control of inhalation of small aerosols in addition to ongoing measures targeting
control of large droplet and fomite transmission. Moreover, our ‘best estimates’ of the model
parameters may be reasonably representative of the central tendencies of these parameters,
particularly for estimates or assumptions of individual input parameters resulted in a larger
proportion of successful model scenarios associated with that input compared to others as shown
in Table 2.
We also conducted sensitivity analyses on the model results, described in detail in the SI (Section
4). Briefly, our sensitivity analyses demonstrate that: (i) aerosol transmission alone provides the
strongest association between measured and reported cases in a mode elimination analysis (SI
Section 4.2), (ii) primary epidemiological inputs among acceptable iterations most commonly
. CC-BY-NC-ND 4.0 International licenseIt is made available under a is the author/funder, who has granted medRxiv a license to display the preprint in perpetuity. (which was not certified by peer review)
The copyright holder for this preprint this version posted July 15, 2020. ; https://doi.org/10.1101/2020.07.13.20153049doi: medRxiv preprint
clustered around effective sub-clinical infection periods of 5 days (with some 2-3 days) and
effective incubation periods of 11-13 days (SI Section 4.3); (iii) the ratio between infectious dose
of URT and LRT is a critical factor in the model and remains to be better understood from clinical
investigations (SI Section 4.4); and (iv) the ratio for aerosol-to-droplet emissions remains an
uncertain parameter, but has less influence on the results than the URT/LRT ID50 assumptions
(SI Section 4.5).
There are several limitations to this modeling approach. For one, there is considerable uncertainty
in our model inputs, as numerous estimates, assumptions, and implications were made because
of a lack of available information, especially related to COVID-19 epidemic and mechanistic
transmission characteristics, the interactions among individuals onboard the ship, and the
effectiveness of infection control strategies adopted during the quarantine period. Some of these
assumptions could have a significant impact on the results. For example, while the average
contribution of fomite transmission among acceptable model iterations was estimated to be lower
than other the other two pathways, under some specific assumptions (e.g., ID50,URT/ID50,LRT = 1,
see SI Section 4.4) or transmission periods (e.g., before passenger quarantine started), fomite
transmission could have been the dominant transmission mode. Second, the model approach
assumes constant and/or average values for numerous inputs in a given model iteration (e.g.,
every passenger was assumed to have the same probabilities of close-range contact with others
and every infected individual was assumed to have the same emission rates of droplets in
aerosols). By not considering variability in these parameters, we cannot directly account for
“super-spreaders” and any underlying biological, physical, or behavioral differences in those
individuals. Instead, the model framework produces average and uniform outcomes, which
remains a limitation. Third, we relied on a conventional discrete size cut-off to define aerosols and
droplets (i.e., 10 µm); however, respiratory droplets and aerosols actually exist on a continuum of
particle sizes influenced by inertia, gravitational settling, and evaporation. We also did not
consider the impacts of potentially influential characteristics such as temperature, humidity,
sunlight, or not-well-mixed conditions in the control volumes considered herein. As more
information becomes available, the model framework should continue to be tested and applied to
other built environment transmission case studies.
Contributors The model development was led by PA, who came up with the original idea and advanced the
framework with help from BRS, ZK, JGCL, and JGA. PA, ZK, and BRS contributed to processing
the model and analyzing the outcomes. PA, BRS, and JGA contributed to writing the manuscript.
PA, BRS, and ZK generated the figures and tables. All authors interpreted the findings and
approved the final version for publication.
Declaration of interests We declare no competing interests.
Acknowledgments
References 1 Lewis D. Is the coronavirus airborne? Experts can’t agree. Nature 2020; 580: 175–175.
. CC-BY-NC-ND 4.0 International licenseIt is made available under a is the author/funder, who has granted medRxiv a license to display the preprint in perpetuity. (which was not certified by peer review)
The copyright holder for this preprint this version posted July 15, 2020. ; https://doi.org/10.1101/2020.07.13.20153049doi: medRxiv preprint

2 WHO. Modes of transmission of virus causing COVID-19: Implications for IPC precaution recommendations. Scientific Brief. 2020. https://www.who.int/publications-detail/modes-of-transmission-of-virus-causing-covid-19-implications-for-ipc-precaution-recommendations.
3 CDC. How COVID-19 Spreads. 2020. https://www.cdc.gov/coronavirus/2019-ncov/prevent-getting-sick/how-covid-spreads.html.
4 Morawska L, Cao J. Airborne transmission of SARS-CoV-2: The world should face the reality. Environ Int 2020; 139: 105730.
5 Bahl P, Doolan C, de Silva C, Chughtai AA, Bourouiba L, MacIntyre CR. Airborne or droplet precautions for health workers treating COVID-19? J Infect Dis 2020; : jiaa189.
6 Prather KA, Wang CC, Schooley RT. Reducing transmission of SARS-CoV-2. Science 2020; : eabc6197.
7 Morawska L, Tang JW, Bahnfleth W, et al. How can airborne transmission of COVID-19 indoors be minimised? Environ Int 2020; : 105832.
8 Dancer SJ, Tang JW, Marr LC, Miller S, Morawska L, Jimenez JL. Putting a balance on the aerosolization debate around SARS-CoV-2. J Hosp Infect 2020; : S0195670120302450.
9 Asadi S, Bouvier N, Wexler AS, Ristenpart WD. The coronavirus pandemic and aerosols: Does COVID-19 transmit via expiratory particles? Aerosol Sci Technol 2020; 54: 635–8.
10 National Academies of Sciences, Engineering, and Medicine. Rapid Expert Consultation on SARS-CoV-2 Viral Shedding and Antibody Response for the COVID-19 Pandemic (April 8, 2020). Washington, D.C.: National Academies Press, 2020.
11 Nardell EA, Nathavitharana RR. Airborne Spread of SARS-CoV-2 and a Potential Role for Air Disinfection. JAMA 2020; published online June 1. DOI:10.1001/jama.2020.7603.
12 Allen J, Marr L. Re-thinking the Potential for Airborne Transmission of SARS-CoV-2. 2020; published online May 7. DOI:10.20944/preprints202005.0126.v1.
13 ASHRAE. ASHRAE Issues Statements on Relationship Between COVID-19 and HVAC in Buildings. 2020. https://www.ashrae.org/about/news/2020/ashrae-issues-statements-on-relationship-between-covid-19-and-hvac-in-buildings.
14 Bourouiba L. Turbulent Gas Clouds and Respiratory Pathogen Emissions: Potential Implications for Reducing Transmission of COVID-19. JAMA 2020; published online March 26. DOI:10.1001/jama.2020.4756.
15 Stadnytskyi V, Bax CE, Bax A, Anfinrud P. The airborne lifetime of small speech droplets and their potential importance in SARS-CoV-2 transmission. Proc Natl Acad Sci 2020; : 202006874.
16 Tellier R, Li Y, Cowling BJ, Tang JW. Recognition of aerosol transmission of infectious agents: a commentary. BMC Infect Dis 2019; 19. DOI:10.1186/s12879-019-3707-y.
. CC-BY-NC-ND 4.0 International licenseIt is made available under a is the author/funder, who has granted medRxiv a license to display the preprint in perpetuity. (which was not certified by peer review)
The copyright holder for this preprint this version posted July 15, 2020. ; https://doi.org/10.1101/2020.07.13.20153049doi: medRxiv preprint

17 for the Singapore 2019 Novel Coronavirus Outbreak Research Team, Chia PY, Coleman KK, et al. Detection of air and surface contamination by SARS-CoV-2 in hospital rooms of infected patients. Nat Commun 2020; 11: 2800.
18 Liu Y, Ning Z, Chen Y, et al. Aerodynamic analysis of SARS-CoV-2 in two Wuhan hospitals. Nature 2020; published online April 27. DOI:10.1038/s41586-020-2271-3.
19 Santarpia JL, Rivera DN, Herrera V, et al. Transmission Potential of SARS-CoV-2 in Viral Shedding Observed at the University of Nebraska Medical Center. Infectious Diseases (except HIV/AIDS), 2020 DOI:10.1101/2020.03.23.20039446.
20 Lednicky JA, Shankar SN, Elbadry MA, et al. Collection of SARS-CoV-2 Virus from the Air of a Clinic within a University Student Health Care Center and Analyses of the Viral Genomic Sequence. Aerosol Air Qual Res 2020; 20. DOI:10.4209/aaqr.2020.02.0202.
21 Li Y, Qian H, Hang J, et al. Evidence for probable aerosol transmission of SARS-CoV-2 in a poorly ventilated restaurant. Infectious Diseases (except HIV/AIDS), 2020 DOI:10.1101/2020.04.16.20067728.
22 Miller SL, Nazaroff WW, Jimenez JL, et al. Transmission of SARS-CoV-2 by inhalation of respiratory aerosol in the Skagit Valley Chorale superspreading event. medRxiv 2020; : 2020.06.15.20132027.
23 Dick EC, Jennings LC, Mink KA, Wartgow CD, Inborn SL. Aerosol Transmission of Rhinovirus Colds. J Infect Dis 1987; 156: 442–8.
24 Lei H, Li Y, Xiao S, et al. Routes of transmission of influenza A H1N1, SARS CoV, and norovirus in air cabin: Comparative analyses. Indoor Air 2018; 28: 394–403.
25 Kraay ANM, Hayashi MAL, Hernandez-Ceron N, et al. Fomite-mediated transmission as a sufficient pathway: a comparative analysis across three viral pathogens. BMC Infect Dis 2018; 18. DOI:10.1186/s12879-018-3425-x.
26 Xiao S, Li Y, Wong T, Hui DSC. Role of fomites in SARS transmission during the largest hospital outbreak in Hong Kong. PLOS ONE 2017; 12: e0181558.
27 Jones RM, Adida E. Influenza Infection Risk and Predominate Exposure Route: Uncertainty Analysis. Risk Anal 2011; 31: 1622–31.
28 Stephens B, Azimi P, Thoemmes MS, Heidarinejad M, Allen JG, Gilbert JA. Microbial Exchange via Fomites and Implications for Human Health. Curr Pollut Rep 2019; published online Aug 31. DOI:10.1007/s40726-019-00123-6.
29 Moriarty LF. Public Health Responses to COVID-19 Outbreaks on Cruise Ships—Worldwide, February–March 2020. MMWR Morb Mortal Wkly Rep 2020; 69.
30 Worldometer. February 2020 Coronavirus News Updates - Worldometer. 2020; published online March. https://www.worldometers.info/coronavirus/feb-2020-news-updates-covid19/ (accessed April 3, 2020).
. CC-BY-NC-ND 4.0 International licenseIt is made available under a is the author/funder, who has granted medRxiv a license to display the preprint in perpetuity. (which was not certified by peer review)
The copyright holder for this preprint this version posted July 15, 2020. ; https://doi.org/10.1101/2020.07.13.20153049doi: medRxiv preprint

31 Princess Plus. Princess Cruises: Diamond Princess Updates - Notices & Advisories. www.princess.com. 2020; published online March 16. https://www.princess.com/news/notices_and_advisories/notices/diamond-princess-update.html (accessed April 2, 2020).
32 Nicas M, Jones RM. Relative contributions of four exposure pathways to influenza infection risk. Risk Anal 2009; 29: 1292–1303.
33 Nicas M, Best D. A study quantifying the hand-to-face contact rate and its potential application to predicting respiratory tract infection. J Occup Environ Hyg 2008; 5: 347–352.
34 Nicas M, Sun G. An Integrated Model of Infection Risk in a Health-Care Environment. Risk Anal 2006; 26: 1085–96.
35 Chen W, Zhang N, Wei J, Yen H-L, Li Y. Short-range airborne route dominates exposure of respiratory infection during close contact. medRxiv 2020; : 2020.03.16.20037291.
. CC-BY-NC-ND 4.0 International licenseIt is made available under a is the author/funder, who has granted medRxiv a license to display the preprint in perpetuity. (which was not certified by peer review)
The copyright holder for this preprint this version posted July 15, 2020. ; https://doi.org/10.1101/2020.07.13.20153049doi: medRxiv preprint