Case report Extramedullary relapse of IgA-lambda myeloma ...

UNIVERSITÀ DEGLI STUDI DI MILANO
SCUOLA DI DOTTORATO IN MEDICINA MOLECOLARE
Curriculum di Oncologia molecolare
CICLO XXVIII
Anno Accademico 2014/2015
TESI DI DOTTORATO DI RICERCA
Settore scientifico disciplinare Patologia generale MED04
Mechanisms of drug-escape and relapse in multiple myeloma:
interplay between ADAR1 and NOTCH in aberrant RNA editing
Dottorando: Elisa LAZZARI
Matricola N° R10151
TUTORE: Prof.ssa Raffaella CHIARAMONTE
CO-TUTORE: Prof.ssa Catriona JAMIESON
DIRETTORE DEL DOTTORATO: Ch.mo Prof.Mario CLERICI

I
ABSTRACT
Multiple myeloma (MM) is a plasma cell malignancy that accounts for more than 10% of all blood cancers. Despite a wide variety of available lines of treatment, virtually all patients experience cycles of remission/relapse or become unresponsive to treatment. A growing body of evidence highlights the contribution of clonal heterogeneity to disease progression and resistance to therapy. In recent years the importance of post-transcriptional regulatory mechanisms (such as RNA editing) in cancer has emerged. RNA editing is particularly intriguing as a potential source of genetic diversity, as can affect several mRNA features, including stability, localization, nuclear retention, and alternative splicing. In mammals, most RNA editing is carried out by Adenosine Deaminases acting on dsRNA (ADAR) that catalyze the hydrolytic deamination of adenosines (A) to inosines (I). In particular, ADAR1 has been associated with disease progression and cancer stem cell maintenance in both solid tumors and hematopoietic malignancies. The central aim of this work was to investigate ADAR1 as a mechanism of clonal heterogeneity and drug resistance in MM. We postulated that ADAR1-dependent aberrant A-to-I RNA editing in MM cells could drive transcriptome “reprogramming” in MM tumor cells, thus contributing to disease relapse and drug resistance. We also sought to identify cell-intrinsic and microenvironment-derived mechanisms that promote aberrant ADAR1-mediated RNA editing. We hypothesized that BM inflammatory signals, promoted by MM deregulated pathways such as Notch, sustain ADAR1-mediated reprogramming. We observed significantly increased ADAR1 expression in plasma cell leukemia (PCL), the advanced, highly drug-resistant stage of MM, and detected aberrant RNA editing in GLI1 and APOBEC3D transcripts by a novel RNA editing site-specific qPCR assay (RESSqPCR) that we developed. Furthermore, we established successful MM xenografts by intrahepatic transplantation of ADAR1-enriched PCL samples, thus providing a robust new in vivo model and platform for testing new therapeutic strategies aimed at treating drug-resistant forms of MM. We showed that continuous in vitro exposure to the anti-MM agent and immunomodulatory drug (IMiD), lenalidomide, induced ADAR1 expression and widespread aberrant RNA editing activity in MM cells, coupled with increased self-renewal capacity and a cancer stem cell phenotype. Furthermore, we observed that pro-inflammatory IL-6 promoted RNA editing, suggesting that MM-associated microenvironmental factors may play a key role in triggering ADAR1-associated malignant transcriptome recoding. Notably, IL-6 production from human BM stromal cells and from MM cells can be inhibited by silencing the overexpressed Notch ligands Jagged1 and Jagged2 in MM cells. In keeping with these findings, ADAR1 overexpression and deregulated RNA editing represents a unique source of RNA and protein diversity, and may endow survival advantages to MM cells in selective environments, such as the BM niche or under the pressure of chemotherapy. This work therefore identifies ADAR1 as a potential new diagnostic and therapeutic target in MM, and inhibition of this pathway, or its regulators and editing substrates, could provide a dynamic avenue to prevent disease relapse and disease progression and achieve long-term survival.

II
SOMMARIO
Il Mieloma Multiplo (MM) è un tumore delle plasma cellule che rappresenta più del 10% dei tumori del sangue. Nonostante gli approcci terapeutici disponibili, quasi tutti i pazienti affrontano cicli di remissione/ricaduta e/o sviluppano resistenza farmacologica. Un numero crescente di osservazioni sottolinea il contributo dell’eterogeneità clonale nella progressione tumorale e nella refrattarietà alla terapia. Negli ultimi anni l’importanza dei meccanismi di regolazione post-trascrizionale (come l’RNA editing), è emersa in oncologia. L’RNA editing è particolarmente interessante come potenziale fonte di diversità genetica, poichè può influenzare diverse caratteristiche dell’mRNA, compreso stabilità, localizzazione, retenzione nucleare e splicing alternativo. Nei mammiferi la maggior parte dell’RNA editing avviene ad opera delle adenosina-deaminasi che agiscono sull’RNA a doppio filamento (ADAR), enzimi che catalizzano la deaminazione delle adenosine in inosine. In particolare, ADAR1 è stato associato alla progressione tumorale e al mantenimento delle cellule tumorali staminali in tumori solidi ed ematologici. Lo scopo principale di questa tesi è stato quello di investigare ADAR1 come meccansimo di supporto all’eterogeneità clonale e alla farmaco-resistenza nel MM. Abbiamo ipotizzato infatti che la deregolazione dell’RNA editing dipendente da ADAR1 possa portare alla “riprogrammazione” del trascrittoma delle cellule di MM, contribuendo alla ricaduta. Inoltre, abbiamo cercato di identificare meccamismi intrinseci e derivanti dal microambinete che potessero promuovere la deregolazione dell’RNA editing mediata da ADAR1. Abbiamo ipotizzato che segnali infiammatori nel midollo osseo, indotti da pathyway deregolati come quello di Notch, sostengano la riprogrammazione ADAR1-mediata. Abbiamo osservato un significativo aumento dell’espressione di ADAR1 in campioni di leucemia delle plasma cellule (PCL), la fase avanzata e altamente resistente alla terapia del MM, e rilevato aberrante RNA editing negli trascrittidi GLI1 e APOBEC3D, grazie ad un nuovo metodo per quantificare RNA editing in siti specifici da noi sviluppato (RESSqPCR). Inoltre, abbiamo xenotrapiantato con successo cellule di PCL, esprimenti alti livelli di ADAR1, tramite inienzione intraepatica, così fornendo un robusto e innovativo modello in vivo e piattaforma per testare nuove strategie terapeutiche finalizzate a trattare le forme refrattarie di MM. Abbiamo mostrato come l’esposizione prolungata in vitro al farmaco immunomodulatorio (IMiD) anti-MM lenalidomide induce l’espressione di ADAR1 e deregolata attività di RNA editing nelle cellule di MM, accompagnate da aumentata capacità di auto-rinnovamento e da un fenotipo tipico delle cellule tumorali staminali. Inoltre abbbiamo osservato che la stimolazione con interleuchina pro-infiammatoria 6 (IL-6) promuove l’RNA editing, suggerendo come fattori microambientali associati al MM possano giocare un ruolo nell’innescare la riprogrammazione maligna associata ad ADAR1. Di particolare rilevanza, la produzione di IL-6 da parte delle cellule midollari stromali e delle cellule di MM può essere inibita dal silenziamento dei ligandi di Notch Jagged1 e Jagged2, overespressi dalle cellule di MM. In linea con questi risultati, l’overespressione di ADAR1 e il deregolato RNA editing rappresentano una eccezionale fonte di diversità a livello trascrizionale e proteico, e portebbero avvantaggiare la sopravvivenza delle cellule di MM in ambienti selettivi, rappresentati dalla nichia midollare o dalla pressione selettiva della chemioterapia. Questo lavoro di conseguenza identifica ADAR1 come potenziale nuovo target diagnostico e terapeutico nel MM; l’inibizione di questo pathway, o dei

III
suoi regolatori e dei target soggetti ad editing, potrebbe fornire un approccio dinamico per prevenire ricadute, l’avanzamento della patologia e raggiungere la sopravvivenza a lungo termine dei pazienti.

IV
INDEX
INTRODUCTION…………………………………………………………...........1
1. MULTIPLE MYELOMA……………………………………………………….2
1.1 Diagnosis……………………………………………………….…….........4
1.2 Pathogenesis.……………………………………………………………...5
1.3 Genetic alterations………………………………………………………...7
1.3.1 Low versus high risk MM…………………………………………...10
1.4 Current therapies………………………………………………………...12
1.4.1 Proteasome inhibitors……………………………………………….15
1.4.2 Immunomodulatory drugs…………………………………………..16
1.4.3 Risk-adapted regimens……………………………………………..18
2. THE BONE MARROW NICHE……………………………………………..19
2.1 Pro-inflammatory signals in MM BM……………………………………21
2.2 Relapsed and refractory MM..…………………………………………..23
2.2.1 BM-dependent drug resistance…………………………………….23
2.2.2 Myeloma cancer stem cells………………………………………...24
2.3 Notch pathway alterations in MM……………………………………….25
3. RNA EDITING………………………………………….…………………….29
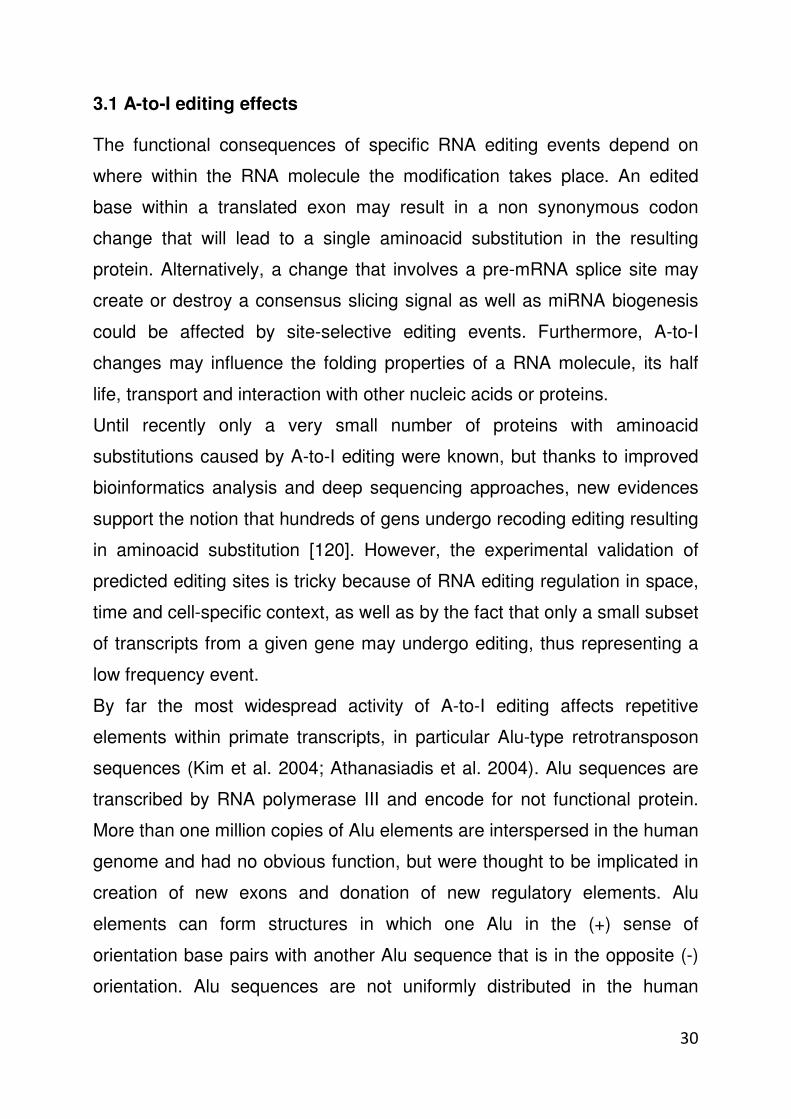
3.1 A-to-I editing effects……………………………………………………...30
3.2 Adenosine Deaminases Acting on RNA: ADARS……………….…....33
3.3 ADAR1 in cancer…………………………………………………………35
AIM OF THE WORK……………………………………………………………36
MATERIALS AND METHODS………………………………………………...38
RESULTS………………………………………………………………………..48
1. ANALYSIS OF ADAR1 EXPRESSION IN MM…………………………..49
1.1 In silico correlation of ADAR1 expression with 1q21 copy number alteration
1.2 Validation of ADAR1 expression in primary MM patient samples
1.3 Detection of aberrant RNA editing by RESSqPCR

V
2. CONTINUOUS IMiD EXPOSURE INDUCES ADAR1 EXPRESSION AND ACTIVITY……………………………………..….……………………57
2.1 Long-term lenalidomide increases ADAR1 mRNA and protein levels in H929 cells
2.2 Lenalidomide induces aberrant RNA editing in H929 cells
2.3 ADAR1-overexpressing cells show increased self renewal capacity
2.4 Lenalidomide-resistant cells harbor a CD138dim cancer stem cell-like subpopulation
3. BONE MARROW NICHE-DEPENDENT FACTORS CONTRIBUTE TO ADAR1 ACTIVATION……………………………….…………………..….66
3.1 Exogenous IL-6 induces ADAR1-dependent RNA editing activity
3.2 Notch-overexpressing MM cells trigger IL-6 production in BM stromal cells
4. ESTABLISHMENT OF MM IN VIVO MOUSE MODELS………………..72
4.1 In vivo monitoring of human cell engraftment
4.2 Evaluation of malignant plasma cell tissue-specific engraftment
4.3 Immunophenotype of MM tumorigenic cells
4.4 Variability of CD138 expression on MM tumor cell surface
4.5 PCL-derived xenografts are serially transplantable
DISCUSSION……………………………………………………………………84
CONCLUSIONS…………………………………………………………….…..95
BIBLIOGRAPHY…………………………………………………………….....97
SCIENTIFIC PRODUCTION AND FUNDING……………………………...114
ACKNOWLEDGMENTS……………………………………………………...115

1
Introduction

2
1. Multiple Myeloma
Multiple myeloma is a neoplastic plasma-cell disorder that is characterized
by clonal proliferation of malignant plasma cells (PCs) in the bone marrow
(BM) microenvironment, monoclonal protein in the blood or urine and
associated organ dysfunction. It belongs to a group of related
paraproteinaemias, namely diseases that produce an immunoglobulin from
a single clone that is present at high levels in the serum. They include
multiple myeloma (MM), monoclonal gammopathy of undetermined
significance (MGUS) and Waldenstrom’s macroglobulinaemia (WM).
MM accounts for 1% of all cancers and 13% of all hematologic cancers [1].
In Western countries the annual incidence is 5.6 cases per 100.000
persons [2], and the median age at diagnosis is about 65 years [3]. The
disease is slightly more common in men than in women and is twice as
common in African-Americans compared to Caucasians [4]. Almost all
patient with MM evolve from the asymptomatic premalignant stage of
MGUS, which affects at least 3% of adults older than 50 years [4].
Moreover, in some cases, MM arises from another asymptomatic but more
advanced premalignant stage, referred as smoldering multiple myeloma
(SMM). The risk to progress from SMM to MM is 10% per year in the first 5
years, 3% per year for the next 5 years and 1% per year for the last 10
years, reaching a cumulative probability of progression of 75% at 15 years
[5]. Tumor cells then can accumulate further cytogenetic and molecular
alterations that contribute to disease progression to secondary plasma cell
leukemia (PCL), the leukemic transformation of end-stage MM [6].

3
Figure 1.1: Multistep pathogenesis of Multiple Myeloma (adapted from [2]).
Early chromosomal abnormalities are shared by plasma cells in MM and in MGUS.
Secondary translocations and mutations involving MYC, RAS and TP53 play a role
in tumor progression and drug resistance. Moreover, abnormal interactions
between plasma cells and bone marrow are hallmarks of disease progression.

4
1.1 Diagnosis
The diagnosis of MM requires at least 10% or more clonal plasma cells on
bone marrow examination or a biopsy-proven plasmacytoma and evidence
of end-organ damage, such as hypercalcemia, renal insufficiency, anemia
and bone lesions that are felt to be related to the underlying plasma cell
disorder. Moreover, the presence of 60% or more clonal plasma cells in the
marrow should also be considered as myeloma, regardless of the
presence/absence of end-organ damage [7]. When MM is clinically
suspected, patients should be tested for the presence monoclonal proteins
(M proteins) through a series of tests, such as serum protein
electrophoresis, serum immunofixation and serum-free light chain (FLC)
assay [1]. However, approximately 2% of patients with MM have non-
secretory disease and no evidence of M protein on any of the mentioned
assays [8]. Three main staging systems have been developed during the
years, namely Durie&Salmon system, the International Staging System
(ISS) [9] and the latest Mayo Stratification of Myeloma and Risk-Adapted
Therapy (mSMART) guidelines [10]. All the three systems split the patients
in three risk categories, termed as stage I, II and III by Durie&Salmon and
ISS classifications, while low, standard and high-risk by mSMART
classification. While the previous staging systems evaluated mainly blood
parameters such as hemoglobin, M proteins, calcium, albumin, creatinine
and β2-microglobulin, mSMART guidelines introduced molecular
cytogenetic markers to assess disease aggressiveness, taking into
consideration hyperdiploidy and several recurrent chromosomal
aberrations. Patients with standard-risk have a median overall survival (OS)
of 6-7 years, while those with high-risk disease have a median OS of less
than 2-3 years, despite therapy (autologous stem-cell transplantation) [11].
Risk stratification also helps to design specific risk-adapted therapeutic

5
regimens that will be discussed more accurately in the following
paragraphs.
1.2 Pathogenesis
As MM is a tumor of antibody-producing PCs, it is fundamental to
understand how B cells develop. During the early B cell differentiation in the
BM, the variable (V), diversity (D) and joining (J) gene segments of the
immunoglobulin (Ig) genes are rearranged to generate the primary Ig
repertoire. Ig heavy chain gene (IGH) rearrangement precedes Ig light
chain, and DH to JH joining precedes VH to DJH joining. The assembly of a
functional IgH-IgL complex on the cell surfaces (the so-called pre B-cell
receptor, BCR), allows B cells to escape apoptosis and exit the BM
environment and move to secondary lymphoid organs. In the lymph node
virgin B cells reach the germinal center (GC), where cells expressing a
functional BCR undergo affinity maturation in response to antigen-
presenting cells (APCs). This process requires the IGH locus to undergo
somatic hypermutation (SHM), to produce highly specific and avid
antibodies, and class switch recombination (CSR), namely the mechanism
that changes the IgM isotype to IgG-, IgA- or IgE-generating antibodies with
different functional characteristics. If illegitimate CSR occurs in the GC, the
cell can still undergo maturation to a memory B cell, and it may exit the
lymph node with an acquired ability to survive and proliferate as a
consequence of oncogene deregulation. The acquired survival/proliferative
ability would allow this premalignant clone of PCs to accumulate secondary
hits, which will eventually occur in and deregulate critical genes, leading to
emergence of a malignant myeloma clone in the BM. The malignant PCs
observed in MM are localized to the BM in the earlier stages of the disease
and most closely resemble long-lived PCs. These cells have undergone
antigen selection outside the BM, as demonstrated by their isotype-

6
switched and somatically hypermutated Ig genes. Myeloma cells have
significantly lower rates of Ig secretion compared with normal PCs;
therefore it appears that critical tumor transformation events take place
after or do not interfere with most of the normal B-cell differentiation
process, leading to long-lived PCs [12],[13]. Moreover, a critical feature
shared by MGUS and MM is an extremely low rate of proliferation [14][15],
usually with no more than a small percentage of cycling cells until
advanced stage disease. This suggest the existence of a malignant, self-
renewing precursor cell as a result of oncogenic transformation and
selection, but the phenotype and features of this population have not yet
been fully elucidated, as discussed in the next paragraphs.
Figure 1.2: The B cell development (adapted from [16]). In the germinal center,
affinity maturation occurs through somatic hypermutation and antigen selection.
Subsequently, class switch recombination leads to the development of
immunoglobulin (Ig) isotypes. After this, the plasmablast migrates to the BM were it
becomes a long-lived plasma cell that produces antibody. The machinery
necessary to generate these physiological DNA rearrangements can malfunction,
leading to malignant change.

7
1.3 Genetic alterations
Myeloma is thought to evolve most commonly from the asymptomatic stage
of MGUS through a multistep process that involves both genetic and
epigenetic changes.
Karyotypes normally seen in this disease are extremely complex; indeed,
while most blood cancer present with single chromosomal translocations,
MM cells from newly diagnosed have an average of seven different
abnormalities in chromosome number and/or structure and the karyotypic
complexity is thought to increase during tumor progression [17].
Genomic instability is intrinsic to B lymphoid cells; thus it is not surprising
that a primary event in many B cell tumors is the translocation of an
oncogene near one of the potent Ig enhancers. MM is a paradigmatic case
as well, indeed primary translocation involving the immunoglobulin heavy
chain locus (IGH) are present in 50% of MGUS tumors, 60% of
intramedullary and 70-80% of PCL tumors. Ig kappa translocations are less
frequent, they are present only in 17% of intramedullary MM, whereas Ig
lambda translocation are very rare [18].
Primary translocations are mediated mainly by errors in the IgH switch
recombination, while sometimes by errors in SHM during PC generation in
GC. As B-cell DNA- modification mechanisms seem to be inactive in
normal and neoplastic PCs, secondary translocations must be mediated by
other mechanisms [19]. Five partner oncogenes commonly placed under
the control of the Ig loci are: cyclin D1 (CCND1) on chromosome 11q13,
CCND3 on 6p21, fibroblast growth factor receptor 3 (FGFR3) and multiple
myeloma SET domain (MMSET) [20],[21] on 4p16, c-MAF (16q23) and
MAFB (20q11). Together, the combined prevalence of these five IgH
translocation partners is about 40% in MM, with approximately 15% 11q13,
3% 6p21, 15% 4p16, 5% 16q23 and 2% 20q11 [22].

8
While primary translocations involve B-cell-specific mechanisms and are
frequently already present in MGUS, secondary translocations happen later
in disease progression. These events are often non reciprocal and can
involve more than two different chromosomes. c-MYC (8q24) is typically
deregulated by such events, and its rearrangements correlate with the
severity of the disease [23]. MYC translocations are absent or rare in
MGUS, but occur in 15% of MM tumors, 45% of advanced tumors and 90%
of human myeloma cell lines (HMCL) [22].
Another common mutation that increases in frequency with disease stage is
the monoallelic loss of 13q, which occurs in approximately 60% of MM.
Nearly half of MM tumors are hyperdiploid (HRD; 48-75 chromosomes) and
often have multiple trisomies. Non HRD tumors (<48 or >75 chromosomes)
are associated to a poorer prognosis than HRD tumors [24].
Moreover, activating mutations of NRAS or KRAS2, mutations in TP53 and
the inactivation of cyclin-dependent kinase inhibitors CDKN2A and
CDKN2C are other secondary late-onset mutations implicated in disease
progression [18],[19].

9
Figure 1.2: The key genetic changes in MM genome (adapted from [16]). The
Circos plot shows the key translocations, copy number abnormalities and mutation
in MM. Chromosome are arranged around the circle starting from chr.1 (brown)
and continuing clockwise. IgH translocations (IGH@) are presented as lines
emerging from chr.14 to their partner chromosomes. Copy number data is
presented on the inside of the circle, while deletions and/or mutations are labeled
outside of the circle.
10
1.3.1 Low versus high risk MM
The advent of new technologies, such as interphase fluorescence in situ
(FISH), comparative genomic hybridization and gene-expression profiling
(GEP) have provided the necessary tools to stratify MM patients in deeper
detail. The combination of the International Staging System (ISS), based on
serum albumin and beta-2 microglobulin, with genetics helped to segregate
patients in three risk groups. Accordingly to the International Myeloma
Working Group (IMWG) high-risk patients with either ISS stage II or III and
the presence of either t(4;14), and/or 17p13 deletion have a median overall
survival of about 2 years, whereas low-risk patients with ISS stage I or II
and absence of these high-risk genetics have 5-and 10-year overall survival
rates of 70% and 51%, respectively [25]. Recent prognostic models include
several other genetic lesions. For example, according to the Medical
Research Council Myeloma IX trial, patients can be classified in three
genetic risk groups as follows: a favorable risk group with no adverse FISH
lesions, an intermediate group with one adverse genetic lesion involving the
immunoglobulin heavy chain gene (IGH) –t(4;14), t(4;16), t(14;20), 17p
deletion, or 1q gain, and a high-risk group with more than one adverse
genetic lesion [26].
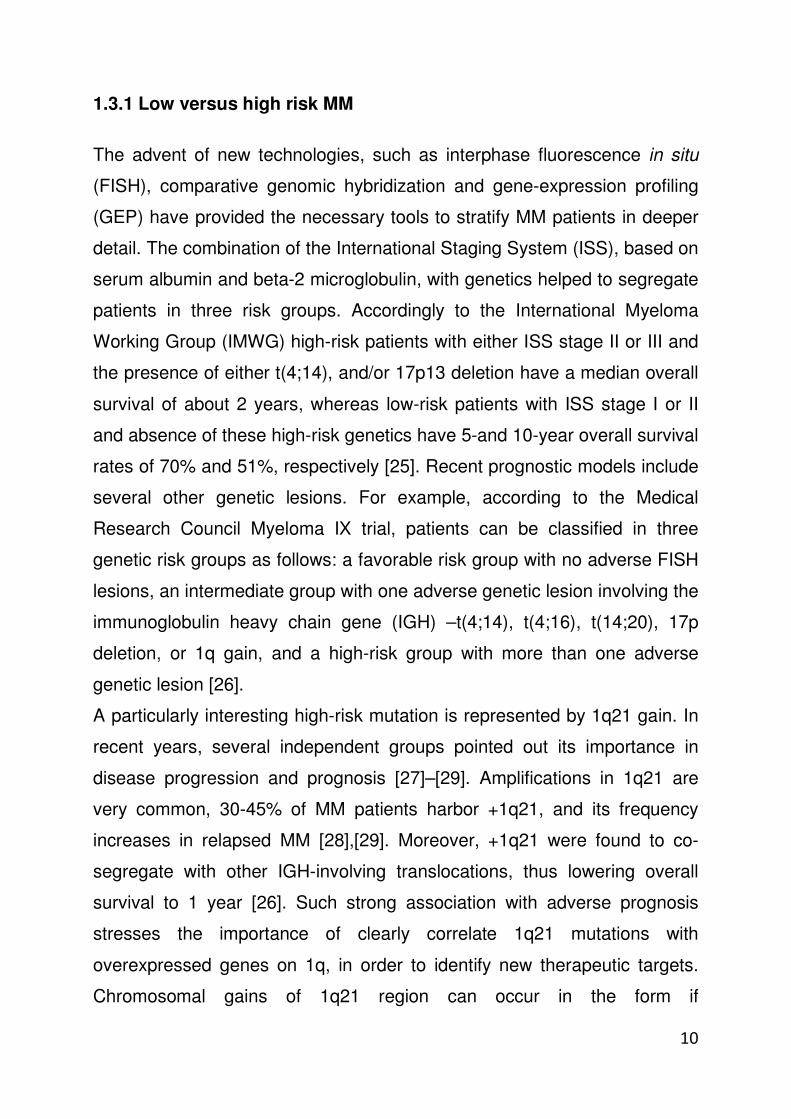
A particularly interesting high-risk mutation is represented by 1q21 gain. In
recent years, several independent groups pointed out its importance in
disease progression and prognosis [27]–[29]. Amplifications in 1q21 are
very common, 30-45% of MM patients harbor +1q21, and its frequency
increases in relapsed MM [28],[29]. Moreover, +1q21 were found to co-
segregate with other IGH-involving translocations, thus lowering overall
survival to 1 year [26]. Such strong association with adverse prognosis
stresses the importance of clearly correlate 1q21 mutations with
overexpressed genes on 1q, in order to identify new therapeutic targets.
Chromosomal gains of 1q21 region can occur in the form if
11
isochromosome, duplications or jumping translocations [30],[31]. One of the
genes located at 1q21 is CKS1B: it codes for an accessory protein to the
E3 ligase SCF-Skp2, which induces degradation of the CDK inhibitor
p27Kip1 by ubiquitination. Elevated expression of CKS1B may lead to
inappropriate degradation of p27, which regulates Cdk2-cyclin E activity
and G1/S cell cycle transition [32]. CKS1B expression increases with 1q21
amplification and elevated levels are associated with more proliferative MM
[29],[34]. CKS1B overexpression may be from increased copy number of
1q21, however, other genes located in this region have been associated
with poor prognosis and/or drug resistance in MM, including IL-6 receptor
(IL-6R), Bcl-2 family member Myeloid Cell Leukemia 1 (MCL-1)[35],[36],
and other not yet identified genes could play a critical role in MM
progression. Furthermore, most of the studies so far focused on isolated
bulk tumor cells, defined as syndecan-1 (CD138) expressing-plasma cells,
while still little is known about 1q overexpressed genes in the context of
myeloma cancer stem cells.
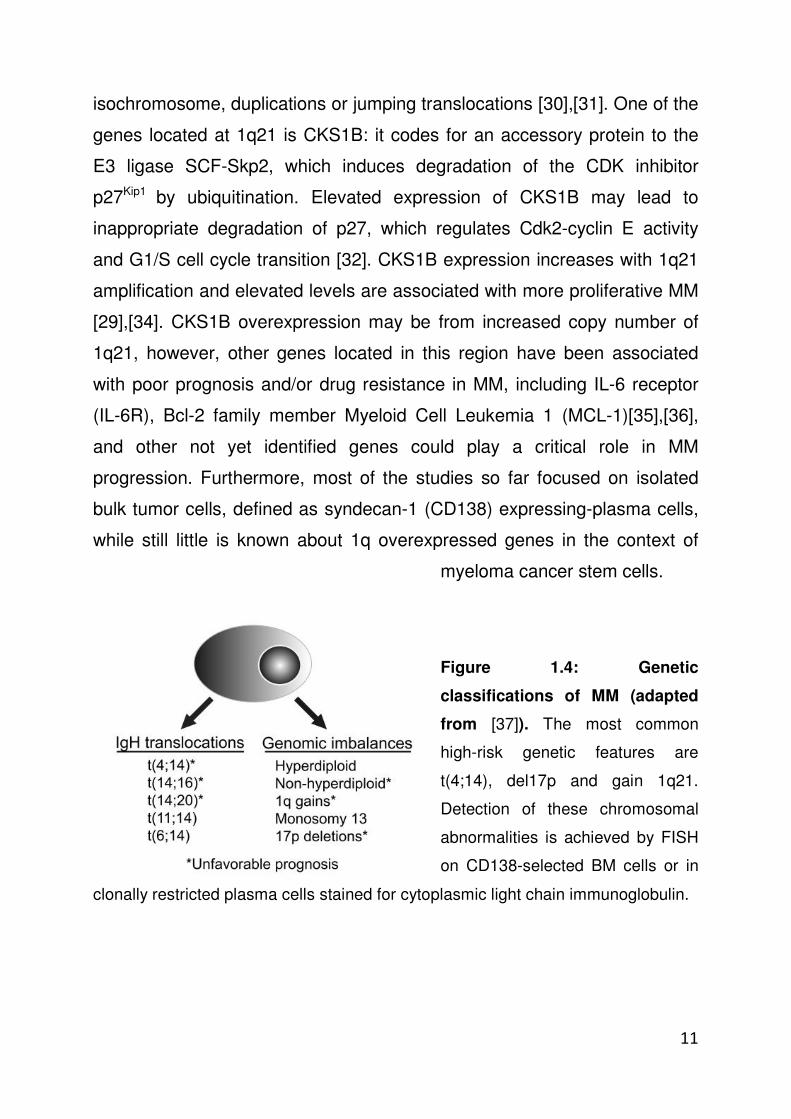
Figure 1.4: Genetic
classifications of MM (adapted
from [37]). The most common
high-risk genetic features are
t(4;14), del17p and gain 1q21.
Detection of these chromosomal
abnormalities is achieved by FISH
on CD138-selected BM cells or in
clonally restricted plasma cells stained for cytoplasmic light chain immunoglobulin.
12
1.4 Current therapies
Initial treatment for newly diagnosed MM depends on eligibility for
autologous stem cell transplant (ASCT) and risk-stratification. If the patient
is younger than 70 years ASCT is taken into consideration, while for
persons older than 70 years, or younger patients in whom transplantation is
not feasible, chemotherapy is the initial treatment of choice. Moreover,
based on risk-stratification, is preferred to achieve complete remission (CR)
in high-risk patient, while standard and low-risk patients have similar overall
survival regardless of whether CR is achieved [38].
ASCT is applicable to more than half of MM patients and has very low
mortally rates (1-2%) [39], but this approach has some pitfalls: on one hand
post-transplantation CR rate is between 30-35% despite large doses of
chemotherapy and/or radiation [40] and on the other hand ASCT could be
contaminated by myeloma cells and/or myeloma cancer stem cells.
Typically patients are treated with two to four cycles of induction therapy in
order to harvest CD34 positive hematopoietic stem cells (HSCs). After
harvest, patients can immediately undergo ASCT or resume induction
therapy delaying the transplant until first relapse [41].
Initial treatments include combination regimens with two/three different kind
of drugs, such as recently introduced immunomodulatory agents (IMiDs),
proteasome inhibitors, and classical chemotherapeutics like alkylating
agents and corticosteroids. While IMiDs and proteasome inhibitors will be
discussed in further detail in the next paragraphs, I will provide here a brief
description about alkylating agents and corticosteroids.

13
The most common alkylating drug used in MM is melphalan, which acts
adding an alkyl group to DNA, inducing DNA damage and duplication
arrest. It is commonly used at low doses in combination with prednisone
and/or bortezomib, or in high doses as part of the condition regimen for
ASCT. As any alkylating agent, this drug cannot distinguish healthy cells
from tumor cells, therefore is associated with severe side effects, such as
myelosuppression and gastrointestinal effects.
Dexamethasone and prednisone are corticosteroids commonly used in MM
therapy: Beside their anti-inflammatory properties, they can also induce
apoptosis in MM cells, by activation of death-inducing genes and by
repression of transcription factor activity [42]. Dexamethasone was shown
to synergize with thalidomide and lenalidomide, prolonging time to
progression and overall survival [43]; notably its activity as single agent was
shown to be reduced by IL-6 [44].

14
Figure 1.5: Treatment approaches of newly diagnosed myeloma patients
(adapted from [1]). Abbreviations: ASCT, autologous stem-cell transplantation;
CR, complete response; Dex, dexamethasone; Rd, lenalidomide plus low-dose
dexamethasone; VCD, bortezomib, cyclophosphamide, dexamethasone; VGPR,
very good partial response; VRD, bortezomib, lenalidomide, dexamethasone.

15
1.4.1 Proteasome Inhibitors
Bortezomib is a first-in-class proteasome inhibitor, it targets the 26S
proteasome, a multicatalytic proteinase complex involved in degradation of
cyclin and cyclin-dependent kinase inhibitor (CKI) proteins, thereby
regulating cell-cycle progression.
Bortezomib inhibits NF-κB activation and nuclear translocation by
protecting from 26S degradation its inhibitor IκBα, a protein that is
constitutively bound to cytosolic NF-κB. Degradation of IκBα by proteasome
activates NF-κB , which in turn up-regulates the transcription of pro-survival
proteins, modulates MM cell-adhesion-induced cytokine transcription and
secretion in BM stromal cells (BMSC), decreases apoptosis susceptibility,
influences the expression of adhesion molecules on BMSCs/MM cells and
their related binding, and induces drug resistance in myeloma cells [45].
Bortezomib can also induce myeloma cell apoptosis through caspase-8 and
-9 activation, inhibits IL-6 and BMSC–MM cell adherence-induced p42/p44
MAPK phosphorylation and proliferation in MM cells. Adverse effects
include lymhopenia, neuropathy, thrombocytopenia and anemia [41].
Second generation proteasome inhibitors, i.e. carfilzomib, have been
recently approved for relapsed patients in order to overcome bortezomib
resistance.

16
1.4.2 Immunomodulatory drugs
Immunomodulatory drugs (IMiDs) are a group of compounds analogue to
thalidomide, derivative of glutamic acid with anti-angiogenic and anti-
inflammatory properties. The two leading IMiDs compounds are
lenalidomide (commercial name Revlimid) and pomalidomide (Actimid); first
tested in clinical trial in MM in 1999 and then expanded for other conditions,
i.e. low-risk myelodysplastic syndrome [46].
Thalidomide (α-N-phthalimido-glutaramide) is a synthetic derivative of
glutamic acid, which was unfortunately famous for causing birth defects
when used as antiemetic in pregnancy in the late ‘50s and early 60’s. After
its withdrawal from markets, it was subsequently found to be effective in the
treatment of erythema nodosum leprosum, a cutaneous complication of
leprosy and its efficacy was proved to be related to TNFα expression
inhibition. Thalidomide was also found to have anti-angiogenic and
immunomodulatory properties, including T-cell stimulation [47]–[49].
Lenalidomide and pomalidomide were then developed in order to achieve
TNFα inhibition with less toxicity compared to thalidomide. These features
helped resurrect thalidomide as potential anti-cancer treatment. In MM
patients, immune surveillance against tumor antigens is impaired, including
antibody responses, impaired antigen-presenting cells and dysfunction of
NK, T and B cells [50].
Figure 1.6: Chemical structure of thalidomide and its analogues,
lenalidomide and pomalidomide (adapted from [50] ). Lenalidomide and
pomalidomide were derived by adding an amino group to the fourth carbon of the
phthaloyl ring of thalidomide.

17
IMiDs can induce proliferation and enhance cytokine production, i.e. IL-2
and IFNγ in partially activated CD3+ T cells [51], increase dendritic cell-
induced NK T cell expansion and NK T IFNγ secretion [52], increase NK
cell proliferation and enhance antibody-dependent cellular cytotoxicity
(ADCC) [53]. Outside the context of MM, other immunomodulatory effects
include downregulation of TNFα production in LPS-stimulated monocytes
[54], therefore IMiDs activity may vary in a disease/cell type-specific
context. Furthermore, IMiDs have a major role in disrupting MM-BM
protective interactions: they were found able to abrogate VEGF and βFGF
secretion in in vitro MM-BMSCs co-cultures (from both cell types) [55] and
to inhibit the expression of cyclo-oxigenase (COX)-2, which synthesize pro-
inflammatory prostaglandins. Lastly, IMiDs also exert direct anti-
proliferative effects on myeloma cells via inhibition of the cyclin-dependent
kinase pathway, activation of Fas-mediated cell death and downregulation
of anti-apoptotic proteins. In HMCL lenalidomide induced the expression of
cyclin-dependent kinase inhibitor p21, thus leading to a G1 cell cycle arrest.
Lenalidomide activity was thought to be dependent on Interferon
Regulatory Factor (IRF) 4 inhibition: IRF4 is a transcription factor required
for the generation of immunoglobulin-secreting plasma cells, which is often
upregulated in MM in coordination with upregulation of MYC [56].
Lenalidomide treatment induces a downregulation of IRF4 mRNA and
protein levels [57]. However, how lenalidomide would inhibit IRF4 was not
fully elucidated. Preclinical studies identified an E3 ligase protein, cereblon
(CRBN) as the direct molecular target of IMiDs. CRBN is a component of
the cullin ring E3 ubiquitin complex, that contains DNA damage-binding
protein 1 (DDB1), cullin (Cul) 4a and regulator of cullins (Roc) 1 [58]. In
vitro long-term selection for lenalidomide resistance is accompanied by a
reduction in CRBN [59]; very interestingly CRBN does not appear to be
frequently mutated in MM patients [60],[61], thus suggesting that
transcriptional or post-transcriptional factors may influence IMiDs

18
responsiveness. Recently two independent groups found that lenalidomide-
bound CRBN acquires the ability to target for proteasomal degradation two
lymphoid transcription factors, Ikaros family zinc finger protein IKZF1 and
IKZF3, essential transcription factors in myeloma [62],[63]. IMiDs are used
both for newly diagnosed as well as relapsed patients, in combination with
other agents, i.e. dexamethasone and/or bortezomib. Side effects include
neutropenia, deep vein thrombosis, infections and increased secondary
tumors [64]
1.4.3 Risk-adapted regimens
Standard-risk patients can be treated with lenalidomide plus low-dose
dexamethasone (Rd) or a bortezomib-containing triplet, such as
bortezomib-cyclophosphamide-dexamethasone (Velcade-Cyclo-Dex).
Standard and high-risk patients require a bortezomib-based triplet regimen,
such as VCD, bortezomib-thalidomide-dex (VTD) or bortezomib-
lenalidomide-dex (VRD). In patients with newly diagnosed MM not eligible
for transplant, initial therapies include the previously mentioned and
melphalan-based regimens, which are falling out of favor due to concerns
about stem cell damage. Unfortunately, almost all MM patients face relapse
and/or become refractory to treatment, with a remission period shortening
with each regimen [65]. The median OS for relapsed/refractory MM is
around 5-9 months. Treatment for these patients include doxorubicin
(topoisomerase inhibitor), carfilzomib (a novel proteasome inhibitor) and
pomalidomide, as single/combination agents [41]. Furthermore novel
agents such as monoclonal antibody (Mab)-based therapies and histone
deacetylase inhibitors are under pre-clinical and clinical evaluation [66],[67].

19
2 The Bone Marrow niche
The bone marrow (BM) microenvironment consists of cellular and non-
cellular elements. Cell components include HSCs, progenitor cells, immune
cells, erythrocytes, BM fibroblast-like stromal cells (BMSCs), vascular
endothelial cells, osteoclasts (OCs) and osteoblasts (OBs). The non-
cellular elements are represented by extracellular matrix (ECM) proteins,
such as fibronectin, collagen, laminin and osteopontin. The direct
interaction of MM cells with BM microenvironment cells activate signaling
pathway mediating growth, survival, drug resistance and the migration of
MM cells [68], as well as osteoclastogenesis [69] angiogenesis [70] and
secretion of several soluble factors, such as interleukin 6 (IL-6) [71],
vascular endothelial growth factor (VEGF) [72], stromal cell-derived factor 1
(SDF-1) [73] and insulin-like growth factor (IGF1) [74]. Both homotypic and
heterotypic adhesion of MM cells to either BMSCs or ECM are mediated
through several adhesion molecules, i.e. CD44, very late antigen 4 (VLA-4,
also known as integrin α4β1), VLA-5 (α5β1), intracellular adhesion
molecule (ICAM-1), NCAM, syndecan 1 (CD138) and MPC-1. Furthermore,
several developmentally conserved signaling pathways have emerged as
important signaling circuits for tumor bulk and cancer stem cells, including
Notch, Wingless-type (Wnt) and Sonic hedgehog (Shh), thus contributing in
the creation of a niche that balances signals of differentiation and self
renewal [75].

20
Figure 2.1: Interactions between tumor plasma cells and the BM in MM
(adapted from [2]). Interactions are mediated by cell-adhesion molecules such as
VCAM1 and integrin VLA-4. Cell-cell contact increases the production of growth
factors IL-6 and VEGF. Chromosomal abnormalities can cause overproduction of
cytokines receptors, such as IL-6 receptor (1q21).

21
2.1 Pro-inflammatory signals in MM BM
Since MM mainly progresses in the BM, signals from this microenvironment
play a critical role in maintaining plasma cell growth, survival, migration,
drug resistance and angiogenesis. Reciprocal interactions between PCs
and BM cells are mediated by an array of cytokines and receptors. PCs in
the BM secrete tumor necrosis factor-α (TNFα), transforming growth factor-
β (TGF-β), VEGF, angiopoietin-1, FGF-2 and matrix metalloproteases
(MMPs). Moreover, the cell-cell interactions mediated by adhesion
molecules between PCs and BM cell trigger transcription and secretion by
the latter of cytokines, such as IL-6, VEGF, SDF-1 (CXCL12), Hepatocyte
growth factor-scatter factor (HGF-SF) and IGF-1[70],[73],[76]–[79].
One of the most important cytokines in myeloma is IL-6: in the 90’s IL-6
was shown to induce in vitro growth of freshly isolated MM cells, which
expressed IL-6 receptor (IL-6R). In the same decade, many studies showed
that BMSCs are the major source of IL-6 and that, virtually all human MM-
derived cell lines express IL-6R mRNA [71],[80],[81]. Notably, several MM
cell lines have also been described to produce IL-6, thus leading to
hypothesize also an autocrine signaling pathway.
Various soluble factors have been shown to mediate IL-6 secretion by
BMSCs or MM cells, e.g. IL-1α, IL-1β, TNFα and VEGF. In MM, VEGF is
expressed and secreted by tumor cells as well as BMSCs. It induces
proliferation through Raf-1-MEK-extracellular-signal-regulated protein
kinase (ERK) pathway, it triggers migration of human MM cells through a
protein kinase C (PKC)-dependent cascade [72] and it stimulates the
expression of IL-6 by microvascular endothelial cells and BMSCs [77].
IL-6 is not only important for myeloma cell proliferation but also plays a
critical role in OC development. Bone lesions are a hallmark of myeloma,
leading to hypercalcemia, bone pain and increased risk of fractures.
Myeloma growth is associated with increased numbers of OCs and

22
suppression of osteoblastogenesis in areas adjacent to tumor foci. OCs
play an active role, cooperating with MM cells to produce VEGF,
osteopontin and stimulating BM niche cells to secrete IL-6 [82],[83].
Another potent mediator of inflammation and bone resorption expressed by
BMSCs and PCs from myeloma patients is TNFα. Several studies
confirmed a central role for this cytokine in the growth and survival of MM
cells in the BM milieu, given that TNFα induces proliferation expression of
ICAM-1, VCAM-1 and VLA-4 and MAPK/ERK activation in MM cells, and
on the other hand IL-6 secretion, NF-κB activation and expression of ICAM-
1 and VCAM-1 in BMSCs [84].

23
2.2. Relapsed and refractory MM
In spite of current efficient therapies drug resistance (DR) is a major
concern in MM. During the past years many studies were focused on the
mechanisms underlying DR, and several factors appear to contribute to this
process, including cytogenetic and epigenetic alterations, deregulated
signaling in the BM niche and MM cancer stem cells maintenance. As
discussed previously, MM has a high level of genomic instability, indeed
patients who relapse or become refractory to therapy carrying any high-risk
marker may be referred as intrinsically drug-resistant.
In the following paragraphs we will discuss more extensively
microenvironment-induced and cancer stem cell-dependent drug
resistance.
2.2.1 BM-dependent drug resistance
The contribution of BM niche components such as BMSCs and extracellular
ECM proteins is critical in MM pathogenesis. The mechanisms of MM drug-
resistance due to BM niche effects can be grouped in soluble factor-
mediated DR (SFM-DR) and in cell-adhesion-mediated DR (CAM-DR).
SFM-DR can be highly ascribed to IL-6, but also other cytokines, including
Insulin-like Growth Factor (IGF) 1 [85] and TGF-β (Hideshima et al., 2007)
have been implicated in drug-resistance.
MM cells exhibit preferred adhesion to several ECM constituents, including
laminin, collagens and fibronectin (FN), via β1 integrin-mediated adhesion.
Adhesion molecules are responsible for the development of MM cells
resistance to front-line chemotherapeutic drugs.
CAM-DR to doxorubicin, melphalan, bortezomib and mitoxantrone has
been induced in vitro through adhesion to fibronectin (FN) or BMSCs, which
is mostly mediated by VLA-4 [86]–[88], and by other integrins, i.e. β7 [89].

24
2.2.2 Myeloma Cancer Stem Cells
The high relapse rates in MM led researcher to investigate the hypothesis
of a quiescent, tumor-initiating cancer stem cell population within the bulk of
malignant plasma cells. In the early 90’s studies on the B cell repertoire in
MM patients led to believe that clonotypic B cells were represented by a
proportion of circulating CD19+ B cells since these peripheral blood B cells
shared the same IgH rearrangements of BM plasma cells. Scientific
literature on myeloma cancer stem cells (CSC) is highly conflicting. On one
hand, a convincing amount of data supports the fact that tumor-initiating
cells expressing syndecan-1 on their surface (CD138+) (CD138+/CD19-
/CD38+/CD45low in primary human samples) have increased clonogenic
ability in vitro, are able to propagate in immunocompromised mice and in
syngenic immunocompentent mouse model of MM (5T33) [90]–[92]. On the
other hand, several groups confirm Matsui’s studies, which identified
CD138- (CD138-, CD19+ and CD20+) as myeloma putative CSCs. His
work suggests that MM cells contain a rare subpopulation which is
clonotypic, drug resistant and expressing memory B cell-like phenotypic
markers (CD138-/CD19+/CD20+/CD27+). CD138- cells appear to have
clonogenic potential, are able to propagate MM tumor in NOD/SCID mice,
are drug-resistant and enriched in a side population (SP) with high ALDH1
activity and drug-efflux pump [93]–[97].

25
2.3. Notch pathway alterations in MM
Normal stem-cell fate is controlled by several developmental conserved
pathways, such as Sonic hedgehog (SHH), Wingless-type (Wnt) and Notch
[98]. Notch is an evolutionary conserved pathway that regulates stem cell
fate and self-renewal, both in physiological and malignant
contexts[99],[100]. Notch receptors are single pass type I transmembrane
proteins that are evolutionary conserved. Four paralogs exist in mammals,
namely NOTCH1, NOTCH2, NOTCH3 and NOTCH4, which display both
redundant and unique functions. The mature form of Notch on the cell
surface is a large heterodimer, held together by non-covalent calcium-
dependent interactions through the heterodimerization domain (HD). Most
Notch ligands are themselves type I transmembrane proteins. They can be
grouped based on the presence or absence of a cysteine-rich domain in
Jagged/Serrate or Delta, respectively. Mammals display five Notch ligands,
JAGGED1-2 and DELTA-like -1,-3,-4 (DLL-1, DLL-3; DLL-4).
It is well established that Notch activation occurs in a ligand-dependent
fashion and it involves a series of proteolytic events that culminate with a
cleavage within the transmembrane domain mediated by γ-secretase, a
multi-component protease complex [101],[102]. This cascade of proteolytic
activation releases the NICD (Notch IntraCellular Domain), which is able to
translocate in the nucleus, where it binds to CLS (CBF-1/Suppressor of
Hairless/Lag1) proteins, through RAM and ANK domains. In absence of
activation by Notch, CSL acts as a transcriptional repressor. Upon NICD
binding, co-repressor complexes are removed and CSL is converted into a
transcriptional activator by SKIP (Ski-interacting protein). Additional
engagement of co-activator Mastermind-like 1 (MAML1), histone
acetyltransferases p300, PCAF and GCN5 might occur through the ANK
domain [103].

26
Given that Notch receptor can only signal once after proteolytic-activation,
regulation of either ligand or receptor availability at the cell surface are
tightly regulated. DSL ligand endocytosis is triggered by monoubiquitination
mediated by the E3 ubiquitin ligases Neuralized (which preferentially
recognizes Delta ligands) and Mindbomb (which recognizes
Serrate/Jagged). Endocytosis of the Notch receptor is controlled in time
and space by Numb, a conserved membrane-associated protein that acts
upstream of the γ-secretase cleavage, to block Notch signaling in
daughters of a asymmetric dividing cells. Moreover, several E3 ubiquitin
ligases, e.g. Deltex, API/Itch and Su(dx), can control Notch receptor
trafficking either towards lysosomal degradation or recycling [104].
At the nuclear level, during the transcriptional activation process, NICD is
phosphorylated on its PEST domain by the CDK8 kinase and targeted for
proteasomal degradation by the E3 ubiquitin ligase Fbw7Sel10 [105].

27
Figure 2.2: The Notch pathway (adapted from [100]). Notch receptors are
single-pass, hetero-dimeric proteins consisting of two peptides: one extracellular
(extracellular domain (ECD)) and one intracellular, the latter containing a
transmembrane domain (TD) and an intracellular domain (ICD). The ECD blocks
Notch activation, unless it binds the ligands (Jagged or DLLs) expressed by an
adjacent cell (4). Such interaction disrupts the hetero-dimer conformation (5),
allowing the ADAM (a disintegrin and metallo- proteinase domain) proteinase to cut
the TD-ICD extracellularly (6). Immediately after that, the g-secretase complex cuts
the TD-ICD (7) releasing the ICD, which translocates to the cell nucleus (8). This
third proteolytic processing is inhibited by gamma secretase inhibitors (GSI). Here,
the ICD interacts with the CSL DNA-binding proteins (from CBF1/RBP-J in
vertebrates), converting CSL from a transcriptional repressor to an activator (9) by
displacing corepressors (Co-R) and recruiting histone acetyltransferases and co-
activators, such as mastermind- like proteins (MAML). Notch targets genes, such
as HES-1 and C-MYC, are then activated.

28
MM cells express Notch-1, -2 and-3 receptors and their ligands, leading to
homotypic interactions. Among ligands, Jagged-2 is overexpressed in MM
and MGUS patients, and its levels of expression increase with the stage of
the disease. Moreover, in vitro interaction between stromal cells and MM
cells that overexpressed Jagged-2 can increase secretion of IL-6, VEGF
and IGF-1 by the stromal cells [106]–[109]. Notch ligands are also
expressed by stromal cells and macrophages, which can activate Notch in
MM cells thorough heterotypic interactions [110].
Noteworthy, Notch signaling promotes β1 integrins activation and the
expression and function of several chemokine receptors involved in MM
[111],[112], thus contributing to BM-dependent drug resistance [113],[114].
In the last few years the importance of Notch signaling in bone remodeling
has emerged. Indeed Notch overexpression blocks the maturation of OB
precursors by opposing canonical Wnt/ β-catenin signaling [115]. On the
other side, myeloma can drive osteoclastogenesis by activating Notch
signaling in tumor cells and OCs, through RANKL secretion and direct
interactions.

29
3. RNA editing
In the mid-80’s the term RNA editing was coined to describe a novel
phenomenon in which uridine (U) residues in protozoa mitochondrial RNA
molecules were inserted and deleted. Since then, the term has been used
to describe many cellular processes of enzymatic post-transcriptional RNA
modification. The main types of RNA editing are deletion/insertion of one or
multiple C or U residues, or the substitution of one base by another [116].
In highly developed eukaryotic cells it commonly happens with the
hydrolytic deamination of either C-to-U or A-to-I bases [117],[118]. In
mammals the most prevalent form of RNA editing is the deamination at the
C6 position of adenosine that is subsequently converted into an inosine (A-
to-I). Inosine behaves like guanosine with respect to its base-pairing
properties and translational potential. As a result, any A-to-I modification
within RNA has the same consequence as an A-to-G mutation. The
enzymes responsible for this conversion are the Adenosine Deaminase
Acting on RNA (ADAR) family of editases that catalyze A-to-I editing in
structured or double stranded RNAs.
Figure 3.1: Mechanism of adenosine to inosine modification catalyzed by
ADAR proteins (adapted from [119]).
30
3.1 A-to-I editing effects
The functional consequences of specific RNA editing events depend on
where within the RNA molecule the modification takes place. An edited
base within a translated exon may result in a non synonymous codon
change that will lead to a single aminoacid substitution in the resulting
protein. Alternatively, a change that involves a pre-mRNA splice site may
create or destroy a consensus slicing signal as well as miRNA biogenesis
could be affected by site-selective editing events. Furthermore, A-to-I
changes may influence the folding properties of a RNA molecule, its half
life, transport and interaction with other nucleic acids or proteins.
Until recently only a very small number of proteins with aminoacid
substitutions caused by A-to-I editing were known, but thanks to improved
bioinformatics analysis and deep sequencing approaches, new evidences
support the notion that hundreds of gens undergo recoding editing resulting
in aminoacid substitution [120]. However, the experimental validation of
predicted editing sites is tricky because of RNA editing regulation in space,
time and cell-specific context, as well as by the fact that only a small subset
of transcripts from a given gene may undergo editing, thus representing a
low frequency event.
By far the most widespread activity of A-to-I editing affects repetitive
elements within primate transcripts, in particular Alu-type retrotransposon
sequences (Kim et al. 2004; Athanasiadis et al. 2004). Alu sequences are
transcribed by RNA polymerase III and encode for not functional protein.
More than one million copies of Alu elements are interspersed in the human
genome and had no obvious function, but were thought to be implicated in
creation of new exons and donation of new regulatory elements. Alu
elements can form structures in which one Alu in the (+) sense of
orientation base pairs with another Alu sequence that is in the opposite (-)
orientation. Alu sequences are not uniformly distributed in the human

31
genome, but rather are more frequent in GC-rich and gene-rich regions
[121]. Considering the high sequence similarity between Alu elements,
such highly base-paired double stranded RNA structures are very likely
targets for RNA editing enzymes. Alu editing may be responsible for the
significant differences between inosine levels detected in mRNAs
compared to the few edited transcripts identified so far [123]. Most Alu
repeats are located in introns and non-translated exons (UTRs). The
outcome of editing events in such regions is not immediately predictable.
Several mechanisms have been recently described: on one hand, Alu-
edited RNA can be sequestered in the nucleus by a protein complex with
particular affinity for inosine in RNA molecules[124], while other studies
suggest that other Alu-edited transcripts are exported and associate with
polysomes despite being edited [125],[126].
Non-coding RNAs represent others potential RNA editing targets,
considering that miRNAs go through a base-paired intermediate as part of
their maturation process. miRNAs are constituted by 20-22 nuculeotide
long single stranded RNA molecules regulating the translation of target
mRNAs. The primary transcripts of miRNA genes, called pri-miRNAs, are
generated by RNA polymerase II as long transcript containing an hairpin
structure. Then pri-miRNAs are processed within the nucleus through
cleavage by the RNAse III Drosha into 70-100 nucleotide (nt) pre-miRNA.
Pre-miRNA are exported to the cytoplasm and further processed into a
short 22-25 nt RNA duplex by the RNAse III Dicer. The resulting single
stranded mature miRNA from one of the two strands is incorporated into a
functional complex, named RNA-induced silencing complex (RISC), ready
to target complementary mRNAs. A-to-I editing events can affect the ability
of Drosha and Dicer to bind and cleave pri and/or pre-miRNAs [127].
Hyperedited transcripts are specifically recognized by the RNAse III Tudor-
SN (part of the RISC), leading to their degradation. Editing changes have
also been described to downregulate the downstream processing of the pri-

32
or pre-miRNA, thus repressing miRNA biogenesis (Yang et al. 2006). If the
base alteration occurs within the sequence of the mature miRNA then
editing is able to alter the miRNA target spectrum [129].
Figure 3.2: Illustration of the three major types of A-to-I RNA editing targets
and their fates (adapted from [118]). (a) The pre-mRNA editing of protein-coding
genes with a composite RNA secondary structure leads to highly site-selective
recoding if it affects a non-synonymous codon site. (b) Pairs of repetitive elements,
such as primate Alus located in coding or non-coding exons or introns, can
generate RNA secondary structures targeted by the RNA editing machinery. (c)
The characteristic secondary structure of pre-miRNAs is a frequent target of
ADARs.

33
3.2 Adenosine Deaminases Acting on RNA: ADARS
ADARs were originally identified in Xenopus laevis eggs and embryos as
dsRNA unwinding enzymes, and shortly after it was discovered that this
family encodes for dsRNA-specific adenosine deaminases [130]. In
humans the ADAR family is composed of three highly conserved members,
ADAR1 (chromosome 1), ADAR2 (chromosome 21) and ADAR3
(chromosome 10). They share common domains, namely double-stranded
RNA-binding domains (dsRBD) and the catalytic adenosine deaminase
domain. ADAR1 and ADAR2 are the only ones with confirmed deaminase
activity, while ADAR3 apparently lacks of function, despite its conserved
functional domains.
One to three repeats of the dsRBD, forming a highly conserved α-β- β- β- α
configuration structure, are present among ADARs. The dsRBD makes
direct contact with the dsRNA [131] and it is required for dsRNA binding
[132]. The C-terminal region contains the catalytic domain, consisting of
amino acid residues that are conserved in other deaminases, including the
cytidine deaminases APOBEC1, involved in the C-to-U mRNA editing
mechanism [133],[134]. By crystallography, histidine H394, glutamic acid
E396 and other two cystein residues C451 and C516 were indentified to be
involved in the coordination of a zinc atom and in the formation of the
catalytic center [135].
On the other hand, other structural features are unique to particular ADAR
members. For example, ADAR1 contains two additional Z-DNA binding
domains, Zα and Zβ [136], that have still unclear functional significance.
Notably, ADAR1 maps on chromosome 1q21, a genomic location involved
in high-risk myeloma, and exists in two different isoforms: the constitutively
and ubiquitously expressed ADAR1 p110 and the inducible ADAR1 p150
[137]–[139]. ADAR1 p150 is under an interferon (IFN)-inducible promoter
and contains the Z-DNA binding domain Zα and a unique nuclear export

34
signal, not present in p110. Therefore, while p110 is usually only found in
the nucleus, p150 can localize to both nucleus and cytoplasm
[136],[138],[140],[141]. ADAR1 p150 has also been showed to be induced
by other inflammatory signals, such as TNFα [142].
Figure 3.3: The ADAR family of editases (adapted from [127]). (A) ADAR1
maps to chr.1q21 and can be expressed in two isoforms, p110 and p150. ADAR1
p150 is expressed from an IFN-inducible promoter using a translational start-site in
exon 1A, located after the IFN-inducible promoter. ADAR1 p110 is generated from
mRNA using either exon 1b or exon 1C that follow a constitutive promoter. Exons
1B and 1C do not contain any translational start-sites, and ADAR1 p110 is
produced from a start codon located in exon 2. Exon 1A, exon 1B and exon1C are
spliced to exon 2 at the same junction. (B) ADAR2 maps to chromosome 21 and,
although several different transcript variants have been identified, only one protein
product has been confirmed. (C) ADAR3 maps to the short arm of chromosome 10.
Although it has a deaminase domain, no editing activity has been reported for this
family member.

35
3.3 ADAR1 in cancer
A growing body of evidence shows that A-to-I editing is an important
contributor in tumors, occurring both in hematological and solid
malignancies. The levels of editing in tumors can be either increased or
decreased. For example, A-to-I editing in Alu repeats in the glutamate
receptor subunit 2 (GluA2) has been linked to glioma progression. In this
context, the decrease in editing correlated with the grade of malignancy
[143],[144]. In other solid tumors, especially in epithelial tissues, disease
progression has been associated with increased editing: in hepatocellular
carcinoma and in esophageal squamous cell carcinoma, A-to-I editing led
to a single amino acid substitution in antizyme inhibitor (AZIN) 1, thus
increasing tumor invasiveness and tumorigenic potential [145],[146].
Notably, increased editing was associated with ADAR1 upregulation.
Beside solid tumors, aberrant ADAR1-dependent RNA editing has been
observed also in hematological malignancies, such as acute myeloid
leukemia (AML) [147] and chronic myeloid leukemia (CML). In particular, in
CML RNA editing was linked to therapy resistant leukemia stem cell
generation. Indeed, the progression from chronic to blast crisis phase was
associated with an increased expression of inflammation-responsive
ADAR1 p150 and of IFNγ pathway gene expression in malignant progenitor
cells[148].

36
Aim of the work

37
Multiple myeloma (MM) is the second most common hematological
malignancy after leukemia, affecting a significant percentage of the aging
population. Autologous stem cell transplant is still considered the best
therapeutic option, which is highly limited by the average patient’s age.
Both transplant-eligible and ineligible patients face high dose
chemotherapy, painful adverse effects and the almost 100% chance of
relapse and/or drug unresponsiveness. Myeloma therapy is extremely
expensive, averaging several thousands of dollars per month for a single
therapy cycle; therefore it is crucial to determine the best therapeutic
regimen according to patient-specific risk factors. The mutation patterns of
MM are complex, and more similar to those found in epithelial tumors and
the blast phase of chronic myelogenous leukemia than to those in other
hematopoietic tumors. In these cancers, the contribution of post-
transcriptional mechanisms such as RNA editing have recently emerged as
a key factor in cancer progression, especially in the context of protective
niches such as the BM microenvironment. This study aimed to investigate
post-transcriptional niche-responsive drug escape mechanisms that could
drive MM progression and emergence of malignant clones refractory to
therapy. In particular, we investigated the Adenosine Deaminase Acting on
RNA (ADAR1) RNA editing enzyme as mechanism of drug resistance and
a novel therapeutic target. We postulated that ADAR1-dependent aberrant
A-to-I RNA editing in MM cells could drive transcriptome “reprogramming”
in MM tumor cells, thus contributing to disease relapse and drug resistance.
Moreover, we evaluated whether BM inflammatory signals promoted by
deregulated cell survival pathways in MM cells, such as aberrant Notch
activation, sustain ADAR1-mediated reprogramming.

38
Materials and methods

39
Primary sample processing
MM patient samples and normal age-matched control bone marrow (BM)
samples were obtained from consenting patients in accordance with
Institutional Review Board approved protocols at University of California-
San Diego (UCSD). Peripheral blood (PB) or BM samples were processed
by Ficoll density centrifugation in a SepMate conical tube (StemCell
Technologies). Viable total mononuclear cells (TMNC) were collected for
further analyses and stored in liquid nitrogen. Purified plasma cell leukemia
samples were a kind gift by Dr. Mark Minden, University of Toronto.
Cell lines and culture conditions
NCI-H929 cells (ATCC) were grown in RMPI-1640 Glutamax medium (Life
Technologies) supplemented with 10% FBS and 0.05 mM β-
mercaptoethanol. OPM2 and U266 (from Dr.C.Carlo Stella, University of
Milano, Italy) cells were maintained in complete RPMI-1640 medium
supplemented with 10% V/V FBS, 2mM L-glutamine, 100U/mL penicillin
and 100µg/mL streptomycin. Human bone-marrow derived stromal cell line
HS5 (from Dr. E. Ferrero, University of Milan) and murine stromal cell line
NIH3T3 (ATCC) were grown in DMEM medium supplemented with 10%
V/V FBS, 2mM L-glutamine, 100U/mL penicillin and 100µg/mL
streptomycin.
All cell lines were maintained in T-25 or T-75 culture flasks and were
cultured at dilutions of 1:3-1:6 every 2-4 days.
To generate lenalidomide-resistant NCI-H929 cells, cells were treated twice
a week with fresh lenalidomide (AvaChem Scientific) at a final
concentration of 1µM. Lenalidomide-treated and vehicle-treated control
cells were sub-cultured for up to 10 weeks at the optimal concentration of
5x10⁵ cells/mL (log phase). Once the proliferation of cells was no longer
inhibited by lenalidomide at 1 µM (10 weeks), as determined by Trypan

40
Blue viability, lenalidomide treatment was scaled up to 10 µM, as previously
described.
In IL-6 exogenous stimulation experiments, NCI-H929 wild type cells were
plated at 0.3x10⁶ cells/ml, then IL-6 (R&D Systems) was added to the
complete growth media at 0-5-10-20ng/ml. Cells were collected for further
analysis after 24h/48h of incubation.
In order to discriminate stromal cells from OPM2 and U266 cells in co-
culture experiments, HS5 cells were transduced with a GFP-expressing
lentiviral vector. GFP+ HS5 were selected by puromycin and maintained in
cultured as described for parental cell line.
Nucleic acid isolation, reverse transcription and quantitativePCR
Cell lines (0.5-2 x 10⁶ cells) or primary purified TMNCs (50-10x104 cells)
were harvested in lysis buffer (Qiagen). RNA was purified using RNeasy
extraction kits with a DNase (Qiagen) incubation step to digest any trace
genomic DNA present. For RNA extraction from cell line lysates, samples
were extracted using RNeasy mini columns, and for primary cells, samples
were lysed and extracted using RNeasy micro columns. Immediately prior
to reverse transcription of RNA samples, nucleic acid concentrations were
quantified on a NanoDrop 2000 spectrophotometer (Thermo Scientific).For
standard qPCR analysis of relative mRNA expression levels, cDNA was
synthesized using 50 ng - 1 µg of template RNA in 20-40 µL reaction
volumes using the First-Strand SuperScript III Reverse Transcriptase
Supermix (Life Technologies) followed by incubation with RNase H
according to the manufacturer’s protocol. All cDNA products were stored at
-20°C.
Primers were synthesized by ValueGene (San Diego, CA) and diluted to 10
µM working dilutions in DNase/RNase-free water. qPCR was performed in
duplicate using cDNA (1-2 µL reverse transcription product per reaction) on
an iCycler (Bio-Rad) using SYBR GreenER Super Mix (Life Technologies)

41
in 25-µL volume reactions containing 0.2 µM of each forward and reverse
primer. Cycling conditions were as follows: 50°C for 2 minutes, then 95°C
for 8 minutes and 30 seconds, followed by 40 cycles of 95°C for 15
seconds and 60°C for 60 seconds. Melting curve analysis was performed
on each plate according to the manufacturer’s instructions. For standard
qPCR, HPRT mRNA transcript levels were used to normalize Ct values
obtained for each gene, and relative expression levels were calculated
using the 2-ddCt method. To ensure validity of results, only Ct values <35
were used in gene expression analyses. All primer sets were tested in a no-
template control (NTC) reaction containing only water instead of cDNA, and
all gave Ct values >35 in NTC reactions. For all experiments, assays were
repeated at least three times using separate RNA extracts and cDNA
preparations.
RESSqPCR
RESSq-PCR assay primer design was carried out for specific cancer and
stem cell-associated loci. For this assays, allele-specific primers were
designed using Primer1, generating two outer and two inner primers for
each editing site with melting temperatures ranging from 60-68°C. The
forward (FW) outer and reverse (REV) outer primers flank the editing site
and can be used for Sanger sequencing validation of each editing site, and
also as a qPCR positive control to ensure that the editing region is
detectable in cDNA. The 3’ ends of the FW inner and REV inner primers
match either the WT A or edited G nucleotide, and include an additional
mismatch two nucleotides upstream of the 3’ primer end to enhance allelic
discrimination. All RESSq-PCR primer sequences (outer, WT, edit) are
provided in the following Primers table. RESSq-PCR was performed in
duplicate using cDNA (1-5 µL reverse transcription product per reaction) on
an iCycler (Bio-Rad) using SYBR GreenER Super Mix (Life Technologies)

42
in 25-µL volume reactions containing 0.2 µM of each forward and reverse
primer. Cycling conditions were the same as for standard qPCR. Relative
RNA editing rates (Relative Edit/WT RNA) were calculated using the
following calculation: 2-(Ct Edit – Ct WT).
High-fidelity PCR and Sanger sequencing analysis
For PCR and targeted Sanger sequencing analysis, 1-2 µL of first-strand
cDNA templates were prepared for PCR in 25-50 µL reaction volumes
using the high-fidelity KOD Hot Start DNA Polymerase kit according to the
manufacturer’s instructions (EMD Millipore). “Outer” primers used for
sequencing produce predicted amplicons of approximately 150-250
nucleotides in length, and flank each editing site with approximately 50-100
bp on either side of the editing site to facilitate successful sequencing
analysis. PCR cycling conditions were as follows: 95°C for 2 minutes,
followed by 35 cycles of 95°C for 20 seconds, 62°C for 10 seconds and
70°C for 10 seconds, with a final extension step of 70°C for 30 seconds.
Production of amplicons of the predicted size was verified for each outer
primer set by DNA gel electrophoresis using 10-20 µL of the reaction
mixture separated on 2% agarose gels containing ethidium bromide and
visualized under UV light. Then, 15 µL of each reaction was processed
within 24 hrs for PCR purification and Sanger sequencing was performed
on ABI 3730xl DNA Sequencers (Eton Bioscience, San Diego, CA). Sanger
sequencing was carried out using the reverse outer primer used for PCR
amplification, so edited loci are identified in the reverse complementary
sequence as T/C nucleotides, except in cases where the gene products are
transcribed from the reverse strand (e.g. AZIN1). Sequence
chromatograms were analyzed using Chromas and peak heights calculated
using ImageJ. For RNA editing analysis of sequencing chromatograms,

43
ratios of edited/WT peaks were calculated using the raw peak amplitude of
each sequence trace.
Primers table: Gene Forward primer 5’>3’ Reverse primer 5’>3’
ADAR1 (total) TGCTGCTGAATTCAAGTTGG TCGTTCTCCCCAATCAAGAC
ADAR1 (p150) AACGAAAGCGAAATTGAACC GGGTGTAGTATCCGCTGAGG
ADAR1 (p110) GACTGAAGGTAGAGAAGGCTACG TGCACTTCCTCGGGACAC
ADAR2 TGTTCCGTGTGTGTCCAGTT CGGCAGGTCAGAGTTTTCTC
HPRT1 TCAGGGATTTGAATCATGTTTGTG CGATGTCAATAGGACTCCAGATG
IRF4 GACATCTCAGACCCGTACAAAG GAAGGGTAAGGCGTTGTCAT
APOBEC3D wild type
GTCCAGGCTGGAATGCAATGTCA GAGGCTGAAGCAGAAGAATCGCT
TAAAC
APOBEC3D edit CTCTGGGATCTCTCTGCCTCCAAAT
ATC
GAGGTTGCAGTGAGTCCAGATG
GC
GLI1 wild type GGGGAGGACAGAACTTTGATCCTTA
CCT
CTGGCTCTTCCTGTAGCCCGCT
GLI1 edit ACTGAGAATGCTGCCATGGATGATG AAGTCCATATAGGGGTTCAGACC
ACTGC
AZIN1 wild type CATTCAGCTCAGGAAGAAGACATCT AATACAAGGAAGATGAGCCTCTG
TTTAC
AZIN1 edit ACTGAATGACATCATGTAATAAATG
GCT
GAGCTTGATCAAATTGTGGCAG
MDM2 wild type ATAGGACTGAGGTAATTCTGCACAG
CA
ATAATGCTTGGAGGACCTCCACA
TGT
MDM2 edit CTCTGGGATCTCTCTGCCTCCAAAT
ATC
AAGAGATTCTGCTTGGTTGTAGC
TGAAG
IL-6 TTCAATGAGGAGACTTGCCTGGTGA TCTGCACAGCTCTGGCTTGGTTC
C
HES1 GATGCTCTGAAGAAAGATAGCTCG GTGCGCACCTCGGTATTAAC
JAGGED1 TTCGCCTGGCCGAGGTCCTAT GCCCGTGTTCTGCTTCAGCGT
JAGGED2 CCGGCCCCGCAACGACTTTT CCTCCCTTGCCAGCCGTAGC

44
Western blot
A total of 5-10x106 cells were harvested in RIPA buffer for total protein
extraction. After cell lysis, samples were centrifuged to clear insoluble
material. Protein concentrations were determined using a detergent-
compatible Bradford assay (Bio-Rad). 20 µg of each sample were loaded
onto precast polyacrylamide gels for gel electrophoresis at 100 V. Proteins
were transferred to 0.45 µm PVDF membranes at 400 mA for 1 hr.
Membranes were blocked for 1 hr at room temperature in 5% nonfat milk in
Tris-buffered saline (TBS) containing 0.5% Tween-20 (TBS-T). Primary
antibodies (rabbit anti-ADAR1, 1:2500, Abcam; and chicken anti-actin,
1:1000, Abcam) were prepared in 5% bovine serum albumin (BSA) in TBS-
T. Membranes were incubated overnight at 4°C with primary antibodies,
followed by three 10-minute washes in TBS-T, and secondary antibody
incubation (anti-rabbit HRP, 1:5000, Cell Signaling Technology; and anti-
chicken HRP, 1:5000, Abcam) in 5% nonfat milk in TBS-T for 1 hr at room
temperature. Blots were developed using enhanced chemiluminescence
(Femto Detection kit, Promega) on a Chemidoc digital imaging machine.

45
Flow cytometry analysis
Flow cytometry assays were performed using a BD LSRFortessa Cell
Analyzer, BD FACSVerse™ System (BD Biosciences) and MACSQuant
(Miltenyi). Data were analyzed using FlowJo (Treestar Inc.) software. For
CD138 surface expression on MM cell lines, 1-0.5x10⁶ cells were stained
with anti-human CD138 APC antibody (BD Biosciences) in
PBS+2%FBS+2mM EDTA, while DAPI (1:5000 in PBS) was used for
live/dead cell discrimination. For intracellular IL-6 staining, cells were fixed
in 4% formaldehyde, permeabilized in 0.5% saponin and stained with anti-
human IL-6 APC antibody (eBioscience) or isotype matched control. Single
cells derived from mouse tissues were stained with LIVE/DEAD fixable
near-IR viability dye (Thermofisher) at 1:1000 in PBS. Samples were then
washed and non-specific Fc receptor-mediated antibody binding was
blocked by incubation with mouse and human FcR blocking reagent (BD
Biosciences). Then samples were stained with anti-human CD138-APC
(Miltenyi), CD319-PE (Miltenyi), CD38 PECy7 (BD Biosciences) and CD45
Brilliant Violet 450 (BD Biosciences). All staining were performed at 4°C in
dark. Lastly, samples were washed and fixed with 1% PFA for 10 minutes
at 4°C, then acquired by MACSQuant (Miltenyi).
Colony assay formation assay
Lenalidomide treatment was withdrawn from culture for 5-7 days prior
colony assay as described[57]. A total of 500 wild type or drug-resistant
NCI-H929 cells were plated in methylcellulose (Miltenyi) in 6-well plates.
Colonies (more than 40 cells) were scored after 14 days and serial
replating assays were performed for an additional 14 days in culture. RT-
qPCR on replated cells was performed on RNA extracted from 10 colonies
of the same type (fast/slow).

46
RNA interference
Specific knock-down of Notch ligands Jagged1 and Jagged2 was achieved
by transient Stealth Select RNAiTM siRNA expression (Life Technologies).
SiRNA sequences were designed according to the Manufacturer’s
guidelines. HMCLs were plated at 3,5x10⁵ cells/ml, then after 24h Jagged1
and Jagged2 gene expression was simultaneously silenced by shRNA
transfection; scrambled shRNAs were used as negative control. Optimal
silencing was achieve at 96h (cell were re-transfected at 48h from plating).
Intrahepatic inoculation of tumor cells and tissues collection
New born (1-3 days) Balb/c Rag2-/-γc-/- mice were intrahepatically injected
with a 30 gauge Hamilton syringe (Hamilton Company). Each animal
received 1-2x10⁶ TMNCs isolated from primary samples. Animals were
weaned at 3 week of age and monitored regularly by heath status
assessment; IVIS imaging and peripheral blood screening were regularly
performed until signs of disease were observed, including significant loss of
weight, limited mobility and presence of palpable tumors. Mice were
euthanized by CO2 inhalation. PB was collected by cardiac puncture
immediately after sacrifice. Bones, spleen (SP), liver (LI) and tumors (TU)
were collected in ice cold PBS. Bones were flushed in order to isolate BM,
while SP and LI were manually dissociated in order to obtain a single cell
suspension. TUs were either manually dissociated and incubated with
collagenase IV (Sigma), or processed with a Tumor Dissociation kit
(Miltenyi) according to the Manufacturer’s guidelines.

47
Transduction of primary PCL-derived TMNC
Prior to transplant TMNCs were transduced with a lentiviral GFP-luciferase
(GLF) encoding vector at 100 Multiplicity of Infection (MOI). Cells were
plated in U-bottom 96-well plate and incubated with GFL lentivirus for 48h
in StemPro complete media (ThermoFisher).
In vivo bioluminescence imaging
Mice were i.p. injected with luciferin (1.5mg/mouse, Caliper Life Science)
and anesthetized using isofluorane. Mice were imaged 6-8 minutes after
i.p. injection and images were acquired after 1-5 minutes of exposure by
Xenogen IVIS-200 (PerkinElmer).
Measurement of serum immunoglobulin light chain levels
Peripheral blood was collected from each mouse by retro-orbital bleeding
while animals were anesthetized with isofluorane. 10-50ul of serum were
used in enzyme linked immunosorbent assay (Human lambda or kappa
ELISA kits, Bethyl Laboratoris Inc.) The assay was carried out according to
Manufacturer’s guidelines.
Statistical analysis
Data are represented as mean ± SEM of independent experiments
performed in duplicates or triplicates. Two-tailed Student's t-test or 1-way
ANOVA tests were used to compare the means of normally distributed
values.

48
Results

49
1. Analysis of ADAR1 expression in MM
1.1 In silico correlation of ADAR1 expression with 1q21 copy number
alterations
Previous reports in newly-diagnosed MM patients showed that 20-30% of
cases harbor copy number amplification at chromosome 1q21, which is
associated with more proliferative disease and poor-risk cytogenetic
categories. This genomic region includes the CKS1B gene locus, which is
located directly adjacent to the ADAR1 gene locus on chromosome 1q21.
Figure 3.1: Schematic representation of ADAR1 locus on chromosome 1q21
and distance from prognostic factor CKS1B location.
In order to investigate whether ADAR1 gene expression was correlated
with 1q21 amplification status, we performed in silico analysis of an ADAR1
gene expression dataset from the Multiple Myeloma Genomics Initiative
(MMGI) database [27],[149].
We analyzed expression and array comparative genomic hybridization
(aCGH) data on CD138-enriched cells derived from a well-characterized
cohort of patient samples.
Our analysis revealed an interesting finding: as displayed in Fig.1.2,
ADAR1 gene expression levels were increased in primary patient samples
corresponding with copy number amplification of the 1q21 locus. Indeed,
ADAR1 relative expression was significantly higher in patients with more

50
than 4 copies of the 1q21 locus compared to normal controls. This was the
first evidence that the poorer prognosis associated with 1q21 amplification
may be linked to aberrant ADAR1 expression and/or activity.
Figure 1.2: ADAR1 expression correlates with CKS1B score. Microarray
datasets publicly available through the Multiple Myeloma Genomics Initiative were
analyzed in this study. ADAR1 relative expression correlates with copy number
amplification of 1q21 CKS1B locus (on the x axis as 2, 3 or >4+ copies) which
correlates with poor prognosis; *p<0.05 by unpaired, two-tailed Student’s t-test.

51
1.2 Validation of ADAR1 expression in primary MM patient samples
To confirm our findings in a separate set of primary patient samples, we
investigated ADAR1 expression in total mononuclear cells (TMNCs)
isolated from a collection of primary MM samples (n=11). Patients’ disease
stage and clinical annotations are shown in Table1. In order to evaluate
how ADAR1 expression was modulated in different disease stages, we
collected samples from smoldering MM, newly diagnosed, relapsed BM MM
and extramedullary PCLs. TMNCs from aged-matched (mean age=60,6 /-
16,8 years old) BM (n=3) collected from patients undergoing hip
replacement therapy for reasons other than cancer were used as normal
healthy controls.
Table 1: Clinical information on primary samples used in this study. Diagnosis
was confirmed at the time of the biopsy. DEX, dexamethasone; CyVD,
cyclophosphamide-lenalidomide-dexamethasone; RVD, lenalidomide-bortezomib-
dexamethasone. *=2 years off therapy at the time of biopsy; **=started
dexamethasone, previously on lenalidomide, bortezomib and thalidomide.

52
As shown in Fig.1.3. MM patients expressed significantly higher levels of
ADAR1 compared to age-matched normal controls. In particular, ADAR1
expression was consistently higher in PCL samples while newly diagnosed
and relapsed MM samples had variable expression levels. Interestingly,
smoldering MM patients had similar ADAR1 expression levels compared to
normal controls, suggesting that ADAR1 overexpression may be a later
event related to disease progression or emergence of drug-resistance.
Figure 1.3: ADAR1 expression in primary MM and PCL patient samples.
Histograms represent relative ADAR1 mRNA levels assessed in freshly
isolated/biobanked TMNC from primary samples (M1-M11) compared to normal
controls (C1-C3) of at least three independent qPCR experiments. HPRT gene
expression was used as normalization factor. **p<0.01 compared to normal
controls by unpaired two-tailed Student’s t-test.

53
As anticipated, ADAR1 exists in two isoforms, the constitutively expressed
p110 and the inflammation responsive p150. Considering the central role of
pro-inflammatory signals in MM BM, we performed quantitative PCR to
measure the relative expression of ADAR1 isoforms.
Among the patients analyzed, expression of ADAR1 isoforms was
heterogeneous (Fig.1.4); notably most patients overexpressed both
isoforms (M3, M6, M9, M11), compared to healthy controls, thus suggesting
that transcriptional activation possibly related to amplification at the 1q21
locus along with microenvironmental inflammatory signals may affect
ADAR1 expression in MM.
Figure 1.4: Isoform-specificADAR1 expression analysis in primary MM and
PCL patients. Histograms represent relative ADAR1 inflammation-responsive
p150 (A) and constitutively-expressed p110 (B) mRNA levels in MM and PCL
TMNCs compared to HPRT mRNA levels in at least three qPCR experiments.

54
1.3 Detection of aberrant RNA editing by RESSqPCR
RNA editing is usually detected by traditional Sanger sequencing or by
whole-transcriptome sequencing. Both techniques have significant pitfalls:
Sanger sequencing is generally affordable but is not sufficiently sensitive to
detect rare editing events (rare transcripts per se or normally abundant
transcripts in rare cell populations), while transcriptome-wide profiling is
costly, technically challenging and requires expertise in specialized
bioinformatics methods. To overcome a lack of cost-effective, quantitative
methods to detect endogenous RNA editing activity, we developed a novel
assay, named RNA editing site specific quantitative real time PCR
(RESSqPCR), specifically designed to detect RNA editing even in rare
transcripts/ rare cell populations[150].
Considering our finding that ADAR1 expression was increased in primary
plasma cell neoplasm samples at advanced stages of disease, we sought
to determine whether we could detect increased ADAR1 activity in primary
MM samples. Therefore, we measured RNA editing in four specific cancer
stem cell-associated transcripts: APOBEC3D, GLI1, AZIN1 and MDM2.
These transcripts were previously identified by whole-transcriptome
sequencing and showed to be more edited in response to increased
ADAR1-dependent A-to-I editing during malignant reprogramming and
disease progression in chronic myeloid leukemia (CML)[148]

55
Consistent with increased mRNA levels, MM patients displayed significantly
higher levels of edited transcripts compared to age-matched controls
(Fig.1.5). Among the four targets, editing rates in APOBEC3D and GLI1
were notably higher than controls, and similar to ADAR1 expression levels,
tended to be higher in more advanced stages of disease. Indeed, 100% of
patients showed high levels of editing in APOBEC3D mRNA, while 54%
(6/11) showed increased editing of GLI1 mRNA. AZIN1 and MDM2
transcripts editing rates were more variable among samples.
Figure 1.5: RESSqPCR analysis showed increased APOBEC3D AND GLI1
RNA editing in MM and PCL TMNCs. Horizontal dashed lines represent
comparative average RNA editing activity normal TMNCs. RESSqPCR analysis
was carried out to evaluate relative expression of RNA-edited (G/I) and wild-type
transcripts of APOBEC3D (A) GLI1 (B), AZIN1 (C) and MDM2 (D).

56
We confirmed aberrant RNA editing by Sanger sequencing in the highest
ADAR1-expressing PCL samples. Consistent with RESSqPCR results, we
detected a double peak in APOBEC3D and GLI1 chromatograms, A/G in
GLI1 (editing site on the sense strand) and T/C in APOBEC3D (cDNA
antisense strand). Notably, peak height quantification correlated with
RESSqPCR ratios of wild-type/edited RNA.
Figure 1.6: Representative chromatograms from Sanger sequencing analysis
in high-ADAR1 samples. High-fidelity PCR products were amplified with primers
flanking the APOBEC3D or GLI1 editing site and sequenced using a reverse primer
(APOBEC3D) or a forward primer (GLI1). Chromatograms shows a dual C (=G in
sense strand)/T peak in APOBEC3D cDNA (A) and a dual G/A peak in GLI1 (B).
Figure1.7: Quantification
of peak height ratios in
M9 and M11 PCL
samples. Peak height
ratios of edit (C/G) versus
wild-type (T/A) nucleotides
calculated using ImageJ.

57
2. Continuous IMiD exposure induces ADAR1
expression and activity
Among therapies available for MM, IMiDs are first line treatments used
alone or in combination with other agents for relapsed and refractory MM
and they have been recently approved for newly diagnosed patients. The
ability of this class of drugs to modulate the immune system and pro-
inflammatory signaling is dual: for example lenalidomide can downregulate
TNFα production in monocytes while induce IFNγ secretion in T cells
[47],[49].
We hypothesized that exposure to IMiDs could have cell-intrinsic effects on
inflammation-responsive genes such as ADAR1. Therefore, we
investigated whether prolonged lenalidomide exposure could directly affect
the expression and activity of ADAR1, promoting transcriptome
“reprogramming” of tumor cells. In this context, we speculated that aberrant
RNA editing could promote tumor cell survival and/or the emergence of
drug-resistant malignant clones. Moreover, the combination of a pro-
inflammatory BM niche, together with IMiD treatment, could exacerbate the
disease, especially in high risk patients harboring copy number
amplifications of the ADAR1 gene locus.

58
2.1 Long-term lenalidomide increases ADAR1 mRNA and protein
levels in H929 cells
In order to model the effects of prolonged immunomodulatory therapies in
patients, we derived a lenalidomide-resistant NCI-H929 myeloma cell line.
Cells were continuously exposed to low dose lenalidomide (1µM) until cell
growth was no longer inhibited (data not shown). Then the treatment dose
was increased to 10µM in order to develop fully resistant cells [57]. We
evaluated total ADAR1 expression and expression ofp150 and p110
isoforms expression by qPCR periodically throughout generation of the
drug-resistant cell line.
Prolonged lenalidomide induced a significant increase in ADAR1
expression. Notably, the inflammation-isoform p150 was significantly
upregulated in treated cells compared to controls. Continuous lenalidomide
treatment selectively affected ADAR1 expression, while ADAR2 levels were
not altered (Fig.2.1).
To confirm the efficacy of lenalidomide treatment we assessed the mRNA
levels of interferon regulatory factor 4 (IRF4). Consistent with previous
reports, long-term lenalidomide exposure induced a downregulation ofIRF4
in treated cells[57]. To determine whether increased ADAR1 mRNA
expression coincided with higher protein levels, we investigated ADAR1
protein expression. Western blot analysis revealed that lenalidomide-
treated H929 cells showed increased levels of both isoforms p150 and
p110 (Fig.2.2), thus suggesting possible drug-dependent mechanism
affecting protein stability/degradation of both isoforms.

59
Figure 2.1: qPCR analysis of H929 cells after continuous Lenalidomide (Len)
or vehicle (WT) treatment. (A) ADAR1 increased mRNA expression in
lenalidomide-treated (1 µM, 5-50 weeks; 10 µM, 5-40 weeks) H929 cells and
reduced IRF4 levels in response to treatment. (B) Specific ADAR1 isoform
expression and ADAR2 levels in treated H929 versus vehicle (WT).*p<0.05,
**p<0.01, # not significant by 1-way ANOVA test.
Figure 2.2: Increased protein levels of ADAR1
in H929 after continuous lenalidomide
treatment by Western blot analysis. Upper blot:
anti-ADAR1 antibody reveals two bands at 150kDa
and 110kDa corresponding to isoforms p150 and
p110 in lenalidomide-treated cells (1 µM Len, 20
weeks; 10 µM Len, 10 weeks). Bottom blot: anti-
actin antibody for normalization.

60
2.2 Lenalidomide induces aberrant RNA editing in H929 cells
Consistent with increased levels of mRNA and protein, cells expressing
high ADAR1 levels showed increased RNA editing by RESSqPCR (Fig.2.3)
and Sanger sequencing (Fig.2.4). All four transcripts, APOBEC3D, GLI1,
AZIN1 and MDM2 displayed a higher edited/WT ratio in lenalidomide-
resistant cells.
Figure 2.3 Aberrant RNA editing after continuous Len treatment. cDNA
derived from lenalidomide-treated cells (1 µM, 5-50 weeks, n=8; 10 µM, 5-40
weeks, n=6) compared with H929 WT at paired passages (n=8) was analyzed by
RESSqPCR. *p<0.05, **p<0.01, ***p<0.001 by one-way ANOVA and Dunnett’s
post test.
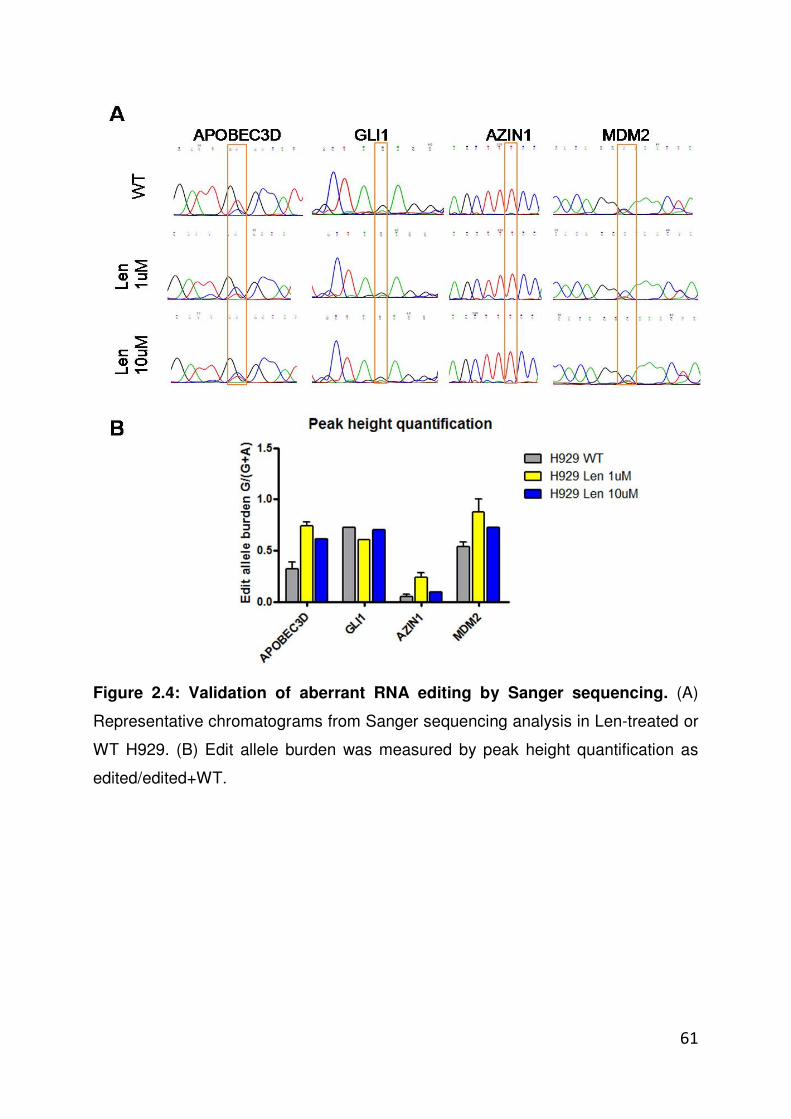
61
Figure 2.4: Validation of aberrant RNA editing by Sanger sequencing. (A)
Representative chromatograms from Sanger sequencing analysis in Len-treated or
WT H929. (B) Edit allele burden was measured by peak height quantification as
edited/edited+WT.

62
2.3 ADAR1-overexpressing cells show increased self renewal capacity
To assess the functional effects of lenalidomide-associated aberrant
ADAR1 activity, we determined H929 self-renewal and proliferation
capacity by colony formation assay. After withdrawal (3-5 days) from IMiD
treatment, the low-dose (1 µM) lenalidomide-resistant cell lines formed a
significantly higher number of colonies compared to control cells (Fig.2.5).
Figure 2.5: Increased colony formation potential of lenalidomide resistant
H929. (A) The survival capacity of Len-resistant versus WT-H929 was evaluated by
methylcellulose colony formation assay; ***p<0.0001 by unpaired two tailed
Student’s t test. (B) Representative pictures of colonies after 1 week of culture (20X
magnification).

63
Notably, in serial replating assays, both low and high dose lenalidomide-
exposed cells displayed increased self-renewal abilities. Moreover, we
could discriminate between “fast” growing colonies, visible after 1 week of
re-plating, and “slow” colonies that could be counted after 2 weeks
(Fig.2.6). When we assessed ADAR1 expression by qPCR in individual
colonies from serial replating assays, we consistently observed that “fast”
growing colonies had higher ADAR1 mRNA levels compared to “slow”
colonies and controls from the parental cell lines.

64
Figure 2.6: Serial replating assay of lenalidomide-resistant H929. (A)
Increased replating ability of Len-treated cells was assessed by percentage of
replated colonies/colonies plated at day0 (30 colonies). Red represents % of
colonies detectable after 1 week of culture, blue represents % colonies grown after
2 weeks. (B) qPCR analysis of ADAR1 expression in “fast” vs “slow” colonies
grown after replating in H929 WT or Len 1µM conditions (n=2). Grey columns
represent the corresponding mRNA values in parental cell lines. *p<0.05;
**p<0.001 by unpaired two tailed Student’s t test

65
2.4 Lenalidomide-resistant cells harbor a CD138dim cancer stem cell-
like subpopulation
Therapeutic failure in MM can be caused by several factors, i.e. high risk
genetic background, protective microenvironment and drug-resistant
dormant cancer stem cells. Cancer stem cells (CSCs) in MM have been a
subject of some debate over the last decade, but most of the scientific
literature supports the existence of a CSC-like subpopulation bearing a
CD138negative/dim immunophenotype[94],[151]. Therefore, to further
investigate the stem-like potential of drug-resistant cells, we assessed the
cell surface expression of CD138 in H929 WT versus Len-resistant cells by
flow cytometry. As shown in Fig.2.7, we observed an increase of CD138dim
(stem cells enriched) sub-fraction in cultures exposed to continuous
lenalidomide treatment compared to wild type controls.
Figure 2.7: Cell surface
expression of CD138 after
prolonged lenalidomide
exposure. (A) Representative
density plots of WT or Len-
treated H929 displaying a
higher fraction of CD138dim
subpopulation in Len-H929.
(B) Quantification of
CD138dim cell percentage
from flow cytometry assays.
*p<0.05 by unpaired two-
tailed Student’s t test
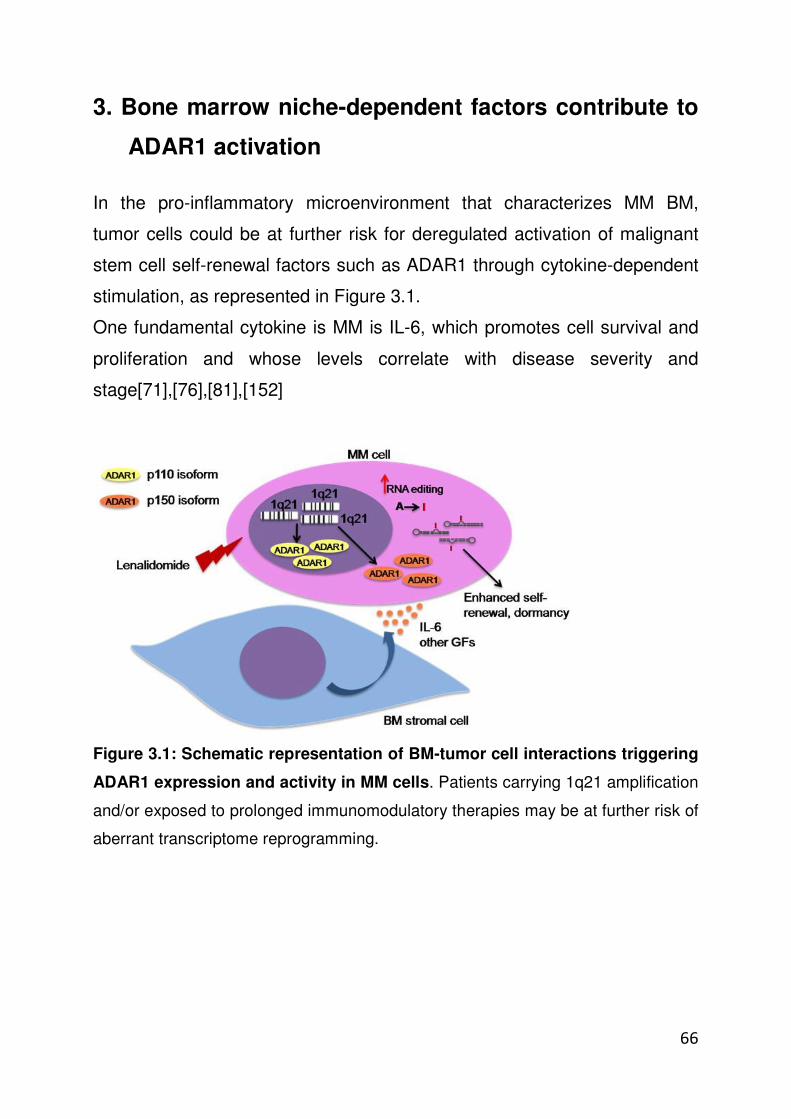
66
3. Bone marrow niche-dependent factors contribute to
ADAR1 activation
In the pro-inflammatory microenvironment that characterizes MM BM,
tumor cells could be at further risk for deregulated activation of malignant
stem cell self-renewal factors such as ADAR1 through cytokine-dependent
stimulation, as represented in Figure 3.1.
One fundamental cytokine is MM is IL-6, which promotes cell survival and
proliferation and whose levels correlate with disease severity and
stage[71],[76],[81],[152]
Figure 3.1: Schematic representation of BM-tumor cell interactions triggering
ADAR1 expression and activity in MM cells. Patients carrying 1q21 amplification
and/or exposed to prolonged immunomodulatory therapies may be at further risk of
aberrant transcriptome reprogramming.

67
3.1 Exogenous IL6 induces ADAR1-dependent RNA editing activity
ADAR1 p150 isoform transcription is under the control of an Interferon
Signaling Responsive Element (ISRE) in its promoter. Inflammatory signals,
such as IFN or TNFα, trigger a signaling cascade through the JAK/STAT
pathway, ultimately culminating in the binding of phosphorylated STAT
homo/hetero dimers to ISRE elements, thus promoting downstream target
gene transcription. Similarly, IL-6 signaling triggers JAK/STAT pathway
activation, and thus it could contribute to inflammation-induced ADAR1
expression. Moreover, a very interesting direct link between IL-6 production
and ADAR1 expression has been described in the context of intestinal stem
cell maintenance, as inducible-ADAR1 knocked out mice showed
progressive intestinal inflammation and increased expression of
inflammatory cytokines IL-6, TNFα and IL-1 in the intestinal mucosa[153],
suggesting a negative feedback mechanism between ADAR1 and
inflammation.
In order to test this hypothesis, H929 wild type cells were stimulated in vitro
with increasing concentrations of IL-6. Cells were collected at different time
points and RNA was isolated to evaluate changes in ADAR1 expression
and in RNA editing activity by qPCR and RESSqPCR.
We observed a dose-dependent increase in ADAR1 mRNA expression
when cells were exposed to IL-6 for 24h (Fig.3.2A), in both p150 and p110
isoforms (Fig.3.2B-C). Notably, we observed an increase in RNA editing
activity after 48h (Fig.3.2D-G). Most CSC-associated sites showed a
significantly higher edit/WT RNA ratio, including APOBEC3D, GLI1 and
AZIN1.

68
Figure 3.2: IL-6-dependent ADAR1 expression and effects on RNA editing in
H929 cells. (A-C) qPCR analysis of total ADAR1 and isoform- specific expression
in H929 WT after IL-6 (0-20ng/ml) stimulation at 24-48 hours (n=3). (D-G)
Evaluation of RNA editing by RESSqPCR in IL-6-stimulated cells after 48h.
*p<0.05, ***p<0.001 compared to vehicle-treated (0 ng/ml IL-6) controls by
unpaired two-tailed Student’s t test.

69
3.2 Notch-overexpressing MM cells trigger IL-6 production in BM
stromal cells
Plasma-cell derived IL-6 expression in MM is regulated by tumor-stromal
interactions. We recently showed that the Notch pathway is a crucial factor
promoting MM cell survival, modulating major chemokine pathways such as
CXCR4/SDF1[112], osteoclasts/osteoblasts balance[154] and drug-
resistance [manuscript under preparation].
Notch is a developmentally conserved pathway that plays a central role in
normal and malignant stem cell survival[90],[155]. Tumor cells expressing
both Notch ligands and receptors find a protective niche in the BM, where
stromal cells also express Notch receptors.
In this environment, MM cells can trigger through overexpressed Notch
ligands[106],[109] the transcription of Notch-downstream targets in nearby
MM cells and healthy BM cells, acquiring survival advantages and
stimulating a tumor-supporting behavior by cells of BM microenvironment.
In order to determine whether BMSCs interactions play a role in pro-
inflammatory cues that might drive malignant reprogramming in MM, we
investigated the ability of MM cells to induce IL-6 production in BMSC in in
vitro co-culture models. To facilitate evaluation of IL-6 mRNA expression
we co-cultured human myeloma cell lines OPM2 and U266 with NIH3T3
fibroblasts (mouse).
Consistent with previous observations[106], we observed that MM cells
overexpressing NOTCH ligands Jagged1 and Jagged2 activate IL-6
production in BMSCs. As shown in Fig.3.3, co-culture of OPM2 and U266
cells with NIH3T3 fibroblasts induced expression of the NOTCH-
downstream target gene HES1, as well as IL-6 mRNA expression. Notably,
these effects were abolished by double silencing of Jagged1 and Jagged2,
achieved through transient siRNA transfection of myeloma cells.

70
Figure 3.3: NOTCH-dependent BM stromal cell-MM cell interactions.
Histograms represent qPCR analysis of human IL-6 and HES1 mRNA expression
in 3T3 mouse stromal cells co-cultured with myeloma cells. OPM2 and U266 cells
were previously transiently transfected with anti-human Jagged1 and Jagged2
siRNA (or scrambled controls) for 48h, then co-cultured with 3T3 for an additional
48h.

71
These observations were then confirmed in myeloma-BMSC co-cultures.
For co-culture experiments OPM2 or U266 MM cell lines were seeded on a
monolayer of human BMSC line previously transduced to express green
fluorescent protein (GFP+HS5) to distinguish the two co-cultured cell types.
OPM2 or U266 cells induced IL-6 production in HS5 cells as measured by
flow cytometry analysis, while double Jagged1 and Jagged2 silencing in
MM cells almost completely abrogated this effect (Fig.3.4).
Figure 3.4: MM-induced IL-6 production in BMSCs. Representative histograms
of intracellular IL-6 levels measured in GFP+ HS5 cells in single culture or in co-
culture with scramble control/ anti-Jagged1 and Jagged2 shRNA transfected OPM2
(A) and U266 cells (B). Anti-IL-6 APC fluorescent signal displayed in black line;
isotype-matched control in gray line Histograms are representative of at least 3
experiments with similar results.

72
4. Establishment of MM in vivo mouse models
Humanized mouse models developed using human cell xenografts or
tissue transplants are extremely useful in basic and applied research. Since
the early 2000’s a series of highly immunodeficient mice has been
successfully developed by introducing the mutant IL2 receptor gamma
chain gene (IL2Rγnull) into conventional non-obese diabetic severe
combined immunodeficient mice (NOD/SCID) or into Balb/c Rag1/2
deficient mice. These highly immunocompromised strains, NSG and RAG2-
/-γc-/-, respectively, showed extremely high engraftment rates and
differentiation of human cells [156]. A number of different animal models
are currently used to study MM, including spontaneous (5T series),
transgenic (Vk*myc) and xenograft models.
It is important to emphasize that there are several key limitations and
obstacles to the existing in vivo models for MM. Most of these models fail to
recapitulate complex features of the disease such as tumor homing to the
BM, microenvironment-dependence and support for patient-derived primary
cell engraftment.
We experienced firsthand some of the current model limitations; indeed,
direct intra-femoral injection of CD138-enriched or TMNC from BM MM
patients resulted in engraftment of very few patient samples and among
those, only low levels of engraftment were detected in highly
immunocompromised mice (Rag2-/-γc-/-) (Table 1). Notably, CD138
expression on the cell surface appeared to be inconsistent, thus deeply
limiting the ability to trace engrafted human cells by flow cytometry.
Another transplantation strategy we tested was intravenous transplants,
which is also limited by the availability of viable primary cells in sufficient
numbers for this transplantation method (>106 cells per mouse).

73
Table 1: Summary of in vivo primary xenografts transplanted by intra-femoral
injection. Rag2-/-γc-/- adult (6-8 weeks old) mice were injected directly in the right
femur with TMNC or Cd138+/- enriched cells from primary BM MM samples.
Considering our findings that aberrant activation of the malignant
reprogramming gene ADAR1 might play a crucial role in MM cell survival,
self-renewal and drug resistance, we hypothesized that primary samples
expressing high levels of ADAR1 might be more prone to efficient
engraftment in immunocompromised mice. Therefore, we aimed to
establish novel MM in vivo models with high ADAR1 expressing primary
samples by intra-hepatic injection in neonatal Rag2-/-γc-/- mice.
Neonatal Rag2-/-γc-/-mice (2-3 days old) lack T, B and NK cells[157] and
support hematopoietic human stem cell (HSC) engraftment by direct
intrahepatic injection in the liver, without myeloablative regimens.
Moreover, human blood-derived cells can efficiently migrate from neonatal
(liver) to adult hematopoietic tissues (BM and spleen).
While newborn Rag2-/-γc-/- mice have been extensively used to establish
humanized models of HSC-derived malignancies such as chronic myeloid
leukemia (CML)[158],[159], no results have been previously reported on
engraftment of more terminally differentiated cells, such as malignant
plasma cells in MM.

74
We selected patient-derived samples M9 and M10 (PCLs expressing high
ADAR1 levels) to assess PCL engraftment capacity after intrahepatic
injection in Rag2-/-γc-/-neonatal mice. We speculated that ADAR1-
overexpressing PCL samples would have a high engraftment potential and
the ability to circulate in the peripheral blood to reach hematopoietic niches,
including the BM, thus recapitulating a critical human myeloma
characteristic.
4.1 In vivo monitoring of human cell engraftment
In order to monitor human cell engraftment in vivo, PCL TMNCs were
transduced with a lentiviral GFP-luciferase vector approximately 48 hrs
prior to transplant. As displayed in Fig.4.1, patient-specific human
immunoglobulin light chains were detected in the serum of the transplanted
mice beginning around 8 weeks post-transplantation (post-tp). Additionally,
human cell localization was monitored by in vivo bioluminescent imaging
(IVIS). Fig.4.2 shows a representative image of M10-transplanted animals
compared to a naïve control mouse, where luciferase-transduced cells are
visible in several tissues, including lower limbs and abdomen. Mice were
then sacrificed when symptoms of distress appeared, including loss of
weight and presence of palpable tumors.

75
Figure 4.1: Screening of tumor engraftment by detection of human
immunoglobulin light chains in mouse serum. ELISA was performed on mouse
serum at a minimum of three separate time points post tp. (A) M9-transplanted
animals and (B) M10-transplanted animals showed steadily increasing levels of Ig
light chains. M9 sample appeared to grow faster (80-100 days post tp.) compared
to M10 sample, which required a longer time frame before animals showed sign of
tumor burden (120-130 days post tp).
Figure 4.2: Representative images of
M10 tumor engraftment by in vivo
bioluminescence assay (IVIS). Mice
were injected intra-peritoneally (i.p.) with
luciferin, and then luciferase signal was
acquired by IVIS. In the top panel,
animals 50 days post transplant show
few or no detectable human cells; while
in the bottom panel, animals 130 days
post tp show human cell migration
throughout the BM and in the abdominal
organs.

76
4.2 Evaluation of malignant plasma cell tissue-specific engraftment
We evaluated primary human cell engraftment by multi-color flow cytometry
analysis on different hematopoietic tissues. Our screening panel included
CD138, the standard marker for MM plasma cells, along with other
malignant plasma cells surface markers, i.e. CD319 and CD38[151],[160].
We also included CD45 in order to discriminate engraftment of other blood-
derived human cells.
We observed that Rag2-/-γc-/-mice successfully supported MM primary
xenografts: as displayed in Fig.4.3, M9-transplanted animals showed high
percentages of human CD138+ cells in the bone marrow (BM) and spleen
(SP), with somewhat lower percentages in the peripheral blood (PB) and in
the liver (LI, site of injection). Notably, mice developed tumors
subcutaneously (ascribable to the needle trajectory), in the abdominal
cavity and in the lower limbs that were constituted by CD138+ plasma cells.
Figure 4.3: Engraftment
of M9 sample in Rag2-/-
γγγγc-/-mice. Graph shows
the percentage of human
CD138 positive cells
detected out of total live
cells in BM), SP, PB, Li
and tumors (TU) of
individual mice at the end
of the experiment (n=3;
105 days post tp).
Samples from all tissues
were stained for human
CD138 and for CD319, CD38 and CD45 (not shown in this panel), acquired on a
MACSQuant flow cytometer and analyzed by FlowJo.

77
M10-transplanted animals consistently showed clear engraftment
represented by CD138+ cells detected in the hematopoietic niches of the
BM and SP, while no measurable engraftment of human cells was detected
in PB or LI (Fig.4.4).
Figure 4.4: Engraftment of M10 sample in Rag2-/-γγγγc-/-mice. Graph shows the
percentage of human CD138+cells detected in bone marrow (BM), spleen (SP),
peripheral blood (PB), and liver (LI) of individual mice at the end point of the
experiment (n=4; 150 days post tp). Samples were stained, acquired and analyzed
as previously described for M9-transplanted animals.

78
4.3 Immunophenotype of MM tumorigenic cells
M9 and M10 PCL samples successfully engrafted in mouse hematopoietic
niches, therefore we aimed to better define the immunophenotype of
tumorigenic MM cells. Consistently with previous reports, we observed that
MM-engrafted cells were CD138+, CD319 (CRACC)+, CD38+ and lacking
CD45 surface expression (Fig.4.5). Interestingly, this phenotype was similar
in both models, despite variable behavior of the samples in aggressiveness
and preference for the vascular and non-hematopoietic niches.
Figure 4.5: Representative flow cytometry analysis of human PCL-derived
cells in mouse BM. Histograms show fluorescence intensity of CD138-APC,
CD319-PE, CD38- PECy7 and CD45- Brilliant Violet 450 stained samples (red line
represents PCL-transplanted mouse; grey dotted line naive control mouse).

79
4.4 Variability of CD138 expression on MM tumor cell surface
In current practice, MM plasma cells are usually isolated based on CD138
cell surface expression. This marker is generally preferred because of its
high plasma cell specificity, as compared with other plasma cell surface
markers that are also found on the surface of other cell types, such asCD38
or CD56, for example. Nevertheless, the CD138 antigen has a major
drawback in that it disappears/decreases rapidly from the cell surface when
the sample is frozen, or even just after a few hours of processing time post-
collection[160]. Moreover, in light of the somewhat controversial markers
available for MM tumor cancer stem cell identification, especially regarding
primary MM xenografts, the stability of CD138 expression on human
plasma cells in non-human microenvironments remains unclear.
Overall, this phenomenon reduces sensitivity of immunophenotype-based
assays, including fluorescence-activated cell sorting (FACS) and magnetic
separation; therefore more robust MM plasma cells markers would facilitate
both research and clinical practice in MM. Therefore, using our panel of
human-specific plasma cell antibodies, we analyzed the variability of
CD138 cell surface expression in engrafted mice tissues compared to
plasma cell markers CD38 and CD319.
In M9-transplanted mice, similar proportions of CD138+, CD319+ and
CD38+ cells were detected in BM, SP and PB, while there were
unexpected differences in tumor cell surface expression. Subcutaneous
and abdominal tumors were processed with two protocols, namely A
(manual dissociation plus collagenase IV incubation) and B (automated
dissociation and Miltenyi enzymatic cocktail incubation).

80
Notably, cell surface CD138 expression was lower than CD319 or CD38
expression when tumors were dissociated with protocol A, while CD138
completely disappeared after tissues were processed with protocol B. In
contrast, both CD319 and CD38 surface expression were consistently
stable, regardless from the dissociation protocol applied, with over 90% of
cells in the tumors likely being malignant plasma cells.
Figure 4.6: Variability of CD138 expression on M9-engrafted tumor cell
surface. Graphs show the average percentage of cells positive for human CD138,
CD319 and CD38 in M9-transplated mice BM (A); SP (B), PB (C) and tumors (D-
E).

81
M10 transplanted mice showed a similar expression of CD138 compared to
CD319 and CD38 in engrafted tissues, as shown in Fig.4.7. This model
showed lower overall engraftment rates than M9, and did not display any
tumor development.
Figure 4.7: Variability of CD138 expression on M10-engrafted tumor cells.
Graphs show the average percentage of cells positive for human CD138, CD319
and CD38 in M10-transplated mice BM (A) and SP (B).
Overall these observations highlight how sensitive the CD138 marker is to
ablation from MM plasma cell surface, depending on tissue processing and
sample handling, thus leading to inconsistent results and underestimation
of actual tumor burden. In our hands, manual tumor dissociation followed
by incubation with collagenase IV (protocol A) gave the best compromise
between cell viability and cell surface marker expression, although CD138
appeared extremely unreliable.

82
4.5 PCL-derived xenografts are serially transplantable
In order to functionally demonstrate whether the established MM models
could serially transplant, thus allowing for future therapeutic treatment
studies in a robust MM model, we performed intrahepatic injection in
secondary Rag2-/-γc-/-recipients. Single cells obtained from engrafted BM
and tumors were pooled together and injected intrahepatically in newborn
mice.
As displayed in Fig.4.8, secondary recipient mice successfully recapitulated
primary M9-transplanted mice. Indeed, after 80 days from transplant, mice
showed signs of distress and presence of palpable tumors.
Once sacrificed, human CD138+/CD319+/CD38+/CD45- cells (Fig.4.8A)
were detected in mouse BM, SP and LI in lower percentages, thus
reproducing a similar phenotype to primary M9-engrafted samples. Serial
transplant recipients developed widespread tumors similar to primary
recipients (Fig.4.8B). Given the more rapid development of tumors, the
serial transplantation of BM and tumor-derived cells appeared to favor more
robust tumor development, which will inform future selection of tissue
sources and timeframes for experimental design with these models. As
observed in M9-derived tumors in primary recipients, CD138 surface
expression in tumor-derived cells from serial transplant recipients was
highly inconsistent compared to CD319 and CD38 markers (Fig.4.8C).

83
Figure 4.8: Engraftment of M9 sample in secondary recipients. (A)
Representative flow cytometry analysis of M9-derived cells in mouse BM (red line
serially transplanted mouse; grey dotted line naive control mouse); (B) Percentage
of human CD138+ cells detected in BM, SP; PB, LI and tumors of individual mice
at the end point of the experiment (n=6; 80 days post tp); (C-D) Average
percentage of cells positive for human CD138, CD319 and CD38 in M9-serially
transplanted mice BM (C) and tumors (D).

84
Discussion

85
Multiple myeloma (MM) is the second most common blood cancer after
leukemia, accounting for approximately 10% of hematologic
malignancies[7]. In 2014 the American Cancer Society estimated more than
24.000 new cases and 11.000 disease-associated deaths[161]. With a
median age at diagnosis of 65 years, this condition affects a significant
percentage of the middle-aged and older population. As for other age-
related conditions, MM incidence will have to be kept under a close watch.
The phenomenon of global aging is changing the demographic composition
over the coming decades and it has the potential to significantly impact
healthcare systems, research and medical decision making. Despite the
introduction of novel therapies and a significant improvement in survival,
MM has still no cure. Virtually all patients experience cycles of
remission/relapse and/or become unresponsive to treatment. For patients
with relapsed or refractory MM (RRMM) many therapeutic options exist but
an effective standard of care is still missing. With each successive line of
treatment therapeutic options become increasingly limited due to
acquisition of drug resistance. Moreover, on each subsequent disease
relapse patients experience lower rates of clinical response and shorter
progression-free survival (PFS); which is the time between the start of
treatment and progression of the disease or death. As more lines of therapy
are available, patients with RRMM are living longer. However, as treatment
is prolonged, the costs of therapy have become an increasing burden to
patients. Autologous stem cell transplant (ASCT) is the current standard of
care for most patients who are eligible for transplant, with a 12-month
improvement in overall survival compared to non-transplanted
patients[162]. The risk of death after ASCT has been declining in the past
few years and it is estimated that approximately 5000 ASCT are performed
for MM patients in the U.S. annually, with an average cost of $25.000
(adjusted to 2012)[163]. Nevertheless, studies endorsing ASCT predated
novel agents; therefore the value of stem cell transplant is currently under

86
reconsideration in randomized trials that include bortezomib and
lenalidomide.
Bortezomib is used as first line therapy and for retreatment in patients who
had achieved durable response before relapse. Similarly, lenalidomide
treatment in induction and as maintenance therapy has gained widespread
use. Lenalidomide-containing regimens are the most expensive in MM
therapy: a recent study calculated that the total cost of one year of
treatment would range between $126.000-256.000[164]. Although drug
costs form a conspicuous portion of treatment cost in MM, myeloma-related
healthcare costs are also significantly driven by disease complications,
which result in inpatient hospitalizations, hospital readmissions, and
medical procedures. Indeed, the same study found that the average length
of hospital stay associated with MM was among the longest of the cancers
that were evaluated[165]. Therefore, prolonging the duration of remission
and/or lengthening PFS remain primary goals of therapy for patients with
MM. Thus, it is essential to identify the most effective therapeutic regimens
according to patient-specific risk factors.
As in other hematologic malignancies, cytogenetic status is one of the most
important prognostic factors in MM. Advances in high-throughput
methodologies in genomic analysis greatly helped in investigating genetic
abnormalities. Nowadays, in addition to the traditional Durie-Salmon
staging criteria and the International Staging System (ISS), MM patients
can benefit from a risk-stratification based on recurrent genetic alterations
in order to make informed decision about treatment. Importantly, the
survival of a particular subgroup of patients with certain cytogenetic
abnormalities, collectively called “high-risk” (HR) MM, has remained poor
despite aggressive therapy.
According to the International Myeloma Working Group, the term “high-risk”
MM should include those patients with at least one of the following features:
deletion of 17p, t(4;14), t(14;16), t(14;20) and 1q gains. In particular, 1q21

87
and del17p were recently described to be associated to a even more
aggressive MM risk category, defined as “ultra high risk” (UHR)[166]. UHR
patients have an overall survival of less than 12 months (median 5 months),
become refractory to therapy after a single induction cycle (30% of cases)
and frequently develop secondary plasma cell leukemia (PCL, 14% of
cases).
Up to 20% of all myeloma patients may be classified as UHR, and while
ISS stage III has been reported to be an effective prognostic indicator, only
about 77% of UHR patients would be classified as ISS stage III.
It is well established that the 1q21 amplification contains numerous
candidate genes that show amplification or deregulated expression in
myeloma, including CKS1B, IL-6R and MCL1[30]. In this study we describe
for the first time the correlation between the expression of the Adenosine
Deaminase Acting on RNA (ADAR)-1 gene located on 1q21 and copy
number amplifications of 1q21 locus itself.
Indeed, our analysis on well-annotated cohorts of patients revealed that
copy number amplification of 1q21 correlates with increased mRNA
expression of the RNA editases ADAR1. Notably, ADAR1 expression was
significantly higher in patients with more than 4 copies of 1q21. These
results are in line with Boyd’s observations[26], which revealed that more
than 3 copies of 1q21 independently predicted poor survival, with a
progression-free survival (PFS) of 17.6 months and a 3-year overall
survival (OS) rate of 52%, while ≤3 copies were only marginally associated
with PFS and OS.
Our new results suggest a novel relationship between ADAR1 expression
and poor prognosis in plasma cell neoplasms, bringing ADAR1 into the
spotlight as a new player in myeloma plasma cell clonal evolution and drug
resistance.
MM is a genetically complex disease. The basic premise underlying the
initiation and progression of myeloma is that multiple mutations in different

88
pathways deregulate the physiological biology of the plasma cell, thus
resulting in the features of myeloma. Many of the genes and pathways
mediating this transformation process have been characterized, however,
recent sequencing data made it clear that there is no single genetic change
underlying this process that can be targeted therapeutically[149].
In addition to the genetic changes, intraclonal heterogeneity of myeloma-
initiating cells is emerging as a further level of complexity. In this respect,
myeloma-initiating cells could acquire additional “survival advantage” both
by genetic and epigenetic events, thus leading to the evolution of this
disease.
Indeed, in the last few decades the Darwinian principles of evolution have
been applied to cancer: first in 1976, Dr. Peter Nowell pioneered the
hypothesis that cancer originates from one founder cell, which
progressively accumulates random somatic genetic mutations, thus giving
rise to a series of branches of subclonal populations existing in
equilibrium[167]. Such subclones compete with each other for the limited
microenvironmental resources and are selected according to their fitness to
survive.
A growing body of evidence is supporting this model of tumor evolution
where several clonal tumor-initiating cells present at diagnosis and
therapeutic or niche-dependent selection pressure drives the alternating
dominance of these clones over time[168]–[170]. Interestingly, clonal
diversity is found to be more prevalent in high-risk MM compared with low-
risk disease[168].
The majority of these observations have been made possible by mutation-
detection methods such as whole exome sequencing, but still little is known
about the role played by epigenetic mechanisms such as RNA editing.
RNA editing provides a post-transcriptional level of genetic regulation that
allows for the expression of gene variants while preserving the original
gene sequence and product. This phenomenon generates incredible

89
potential for RNA and protein diversity, that could contribute further survival
advantages in selective environments, for instance in the context of the BM
niche or under the pressure of chemotherapy.
In the present study we examined ADAR1 gene expression in MM and
PCL-derived mononuclear cells. We showed that ADAR1 was significantly
overexpressed in PCL, while its levels in smoldering MM were not
significantly different from normal controls. Since deregulated RNA editing
can result in transcriptome “recoding”, this could contribute significant
genetic diversity in plasma cell neoplasms, eventually resulting in the
generation of dominant clones with a more aggressive transcriptional
profile. It is believed that CKS1B amplification is associated with
progression to PCL[171], however, the gain of chromosome band 1q21 has
been commonly determined by fluorescence in situ hybridization (FISH),
using a bacterial artificial clone (180kb) carrying the CKS1B gene[29],[172].
Hence, 1q21 amplification has been linked to CKS1B overexpression, but
whether this gene is solely responsible for 1q21 prognostic value is
arguable: as described by Avet-Loiseau and colleagues, 1q gains can in
fact involve a more extended region, up to the 1q23.3 chromosomal
band[173]. As a result of copy number amplifications of the ADAR1 gene
locus on chromosome 1q, HR MM patients would be at risk for more rapid
clonal evolution through transcriptome recoding. Interestingly, ADAR1
appeared to be significantly increased also in a relapsed MM patient (M8)
previously exposed to immunomodulatory treatment (lenalidomide), driving
us to hypothesize those agents could provide the selective pressure
inducing inflammation-responsive ADAR1 isoform expression, as supported
by higher levels of ADAR1 isoform p150 in the same sample.
ADAR1 levels were also increased in a newly diagnosed MM patient (M3)
without previous treatment. In this sample both ADAR1 pro-inflammatory
p150 and constitutive p110 isoforms were overexpressed. FISH analysis on
this patient’s BM biopsy revealed the presence of a cyclin D1-IgH

90
(CCND1/IGH) gene fusion, resulting from translocation (11;14) in CD138-
enriched plasma cells. While this translocation is not considered an
adverse prognostic factor when found in MM BM, it is very common in
PCL[23],[174]. Unfortunately, we were not able to determine 1q21 copy
number variations in our set of primary samples as diagnostic assays at the
time of sample collection did not include this probe. However, future studies
will clarify whether ADAR1 overexpression could be predicted by 1q
amplification and/or by recurrent translocations in PCL, such as t(11;14).
Furthermore, we demonstrated that ADAR1 overexpression was associated
with increased RNA editing by a novel RNA editing detection assay[150],
namely RESSqPCR, and validated our findings by Sanger sequencing.
Identification of a MM-specific RNA editing “fingerprint” would be highly
valuable to tracking its evolution within the course of the disease and in
response to treatment.
In this work we assessed RNA editing in four transcripts previously
associated with ADAR1-induced malignant transformation in other cancers
including CML[148],[145]: apolipoprotein B mRNA editing enzyme, catalytic
polypeptide-like 3D (APOBEC3D), Glioma- associated oncogene 1 (GLI1),
antizyme inhibitor 1 (AZIN1) and murine double minute 2 E3 ubiquitin
protein ligase (MDM2).
In keeping with increased ADAR1 expression, analysis of endogenous RNA
editing levels in primary patient samples revealed abnormal RNA editing
patterns. In particular, APOBEC3D transcripts were highly edited across all
MM and PCL samples compared to controls, which virtually lacked any
detectable editing at this locus. In addition, PCL and newly diagnosed MM
samples showed elevated editing in GLI1 transcript, while editing in AZIN1
and MDM2 sites were heterogeneous among samples. The potential
implications of an increase in edited transcripts for these genes appears
worthy of note as all four genes have been previously associated with
cancer progression.

91
Interestingly, next-generation sequencing analyses have revealed an
important role for genome editing by APOBEC3 family members. For
example, a mutational signature associated with APOBEC3 (A3) has been
identified several cancers, such as HER2-amplified breast cancer and
human papilloma virus (HPV)-associated head and neck squamous
carcinoma [175]–[177]. Notably, a study of B cell-derived chronic
lymphocytic leukemia (CLL) reported that an A3-like mutation signature
was found within CLL samples that had undergone somatic hypermutation
(SHM) but not in samples that had not, whereas the expression of A3
proteins was unchanged[178]. In light of these observations, it is
reasonable to hypothesize a role for other APOBEC3 family members with
genome-editing capacity such as APOBEC3D in post-SHM plasma cell-
derived malignancies as MM as potential driver of further tumor clonal
variation, and the functional impact of RNA editing in this DNA-modifying
gene product is under further examination.
GLI1 is a zinc finger transcription factor downstream of Hedgehog (Hh)
signaling, a highly conserved pathway essential for embryonic development
and adult tissue homeostasis. Aberrant activation of Hh signaling has been
reported in both solid and hematologic tumors, such as cancers of the
pancreas, prostate, lungin and B-cell lymphoma. Moreover, several groups
identified its contribution in MM survival by inhibition of chemotherapy-
induced apoptosis. Notably, bothCD138+[179],[180] and CD138-[181] cell
populations were described to be major producers and secretors of Hh
ligands Sonic hedgehog (SHH), thus inducing Hh pathway activation by
autocrine signaling. Mechanistic studies showed that sonic hedgehog
(SHH) signaling activated the SHH/GLI1/BCL-2 axis, leading to the
inhibition of myeloma cell apoptosis[180]. The edited GLI1 has been shown
to have a higher capacity to activate its transcriptional targets and to be
less susceptible to inhibition by the negative regulator of Hh signaling,
suppressor of fused (SUFU)[182]. As a result, an increase of edited GLI1

92
could support the prolonged activation of Hh signaling in both MM bulk
tumor and cancer stem cells.
AZIN1 hyper-editing provided one of the early clues about the functional
impact of RNA editing in cancerogenesis as Chen and colleagues proved
that AZIN1 editing results in a single amino acid substitution that confers a
“gain of function” phenotype, where the edited form results in increased
protein stability and promotes cell proliferation in hepatocellular carcinoma
(HCC)[145]. As for MDM2, the editing site in located in the 3’ UTR instead
that in the coding region. Therefore, rather than a “gain of function” effect,
increased editing would likely result in a change in microRNA binding site.
MDM2 is an E3 ubiquitin ligase responsible for the ubiquitination and
degradation of p53, therefore editing in the 3’ UTR may hamper the ability
of microRNAs to bind to MDM2, leading to a “lack of inhibition” effect by
which cells could inactivate p53 in the process of transformation.
Overall these findings led us to infer that both genetic (1q21 amplification)
and environmental (inflammation, IMiDs) factors can modulate ADAR1
expression. Moreover, ADAR1 overexpression is associated with aberrant
RNA editing in key pro-tumoral transcripts. The functional consequences of
A-to-I editing are have not been fully elucidated for all of the specific
transcripts we identified, however studies are under way to provide further
insights into the mechanisms of ADAR1-associated aberrant editing of
APOBEC3D, GLI1, AZIN1 and MDM2.
In a parallel series of experiments, we investigated the ability of
lenalidomide, an immunomodulatory agent, to modulate ADAR1 expression
and activity in MM. For this purpose, we developed lenalidomide-resistant
NCI-H929 cells, a HMCL harboring 4 copies of the 1q21 locus. We
observed that continuous exposure to lenalidomide significantly increased
ADAR1 mRNA and protein level, thus sustaining abnormal RNA editing of
APOBEC3D, GLI1, AZIN1 and MDM2. Remarkably, only ADAR1 levels
93
were modulated, while ADAR2 expression was very low in wild type cells
and was not increased by continuous lenalidomide treatment.
Notably, ADAR1-enriched cells harbored increased self-renewal and serial
replating potential in vitro. These results are consistent with previous
findings from our collaborators, where Jiang and colleagues demonstrated
that ADAR1 is an essential self-renewal factor in CML progenitor cells and
that disease progression from chronic to blast crisis phase is associated
with increased A-to-I RNA editing[148].
Consistent with the reported role for ADAR1 in malignant reprogramming
leading to generation of leukemia stem cells in advanced stages of CML,
we demonstrated that prolonged exposure to lenalidomide led to an
increase in the percentage of stem-like CD138dim cells in H929. Our
findings are consistent with Matsui and colleagues’ work, who described
how CD138dim/- subpopulation have been showed to display increased
clonogenic growth compared to CD138+ when exposed to drugs, including
lenalidomide and dexamethasone[94]. In addition to cell-intrinsic changes,
microenvironmental cues could contribute to clonal evolution and drug-
resistance. To address this aspect, we investigated whether pro-
inflammatory signals from the MM BM microenvironment, namely IL-6,
could modulate ADAR1 expression levels. Indeed, we observed that
aberrant RNA editing in H929 cells was induced by exogenous IL-6
exposure. Recently, we and others demonstrated that IL-6 is produced by
BM stromal cells upon contact with malignant plasma cells and that its
levels are modulated by the Notch signaling pathway. In fact, IL-6 secretion
by BMSCs is inhibited when Notch signaling is antagonized by Jagged 1
and Jagged2 silencing in MM cells. These observations led to the
identification of important key factors tuning ADAR1 expression and
consequently RNA editing. In order to further translate these findings in vivo
we developed primary xenografts in Rag2-/-γc-/- mice. To our knowledge
this is the first time that a successful primary PCL xenograft by intrahepatic

94
injection is described. We showed that high-ADAR1 PCL samples
successfully engrafted in primary and secondary Rag2-/-γc-/- recipients and
demonstrated tropism towards hematopoietic tissues. Human
CD138+/CD319+/CD38+ plasma cells engrafted the liver in neonatal
animals and migrated to bone marrow and spleen in adult recipients. We
believe these models could be further employed to investigate therapeutic
approaches for drug resistance plasma cell neoplasms, such as treatment
strategies targeting ADAR1 and aberrant RNA editing, in order to provide
specific therapeutic approaches for HR and advanced MM patients.

95
Conclusions

96
MM is a disease that affects elderly people. As it is estimated that by 2029
more than 20% of the total U.S. population will be over the age of 65[183],
increased demand for healthcare and long-term care for the aging
population will be a major challenge for healthcare professionals. Myeloma
accounts for a small percentage of all cancers (1%) but the associated
costs over the course of the disease are disproportionately high compared
to other cancers that invade the bone marrow niche[164]. In recent years
the Darwinian evolution model proved valid for tumor initiation and
progression. In fact, the presence of clonal heterogeneity at diagnosis and
in response to selective pressure represents a novel paradigm in myeloma
with profound therapeutic implications. RNA editing is an epigenetic
mechanism with the potential to generate vast RNA and protein diversity of
key cancer-regulatory and stem cell-associated gene products. These
molecular alterations can provide further survival advantages to malignant
cells including tumor-initiating populations in selective environments, for
instance in the context of the BM niche or under the pressure of
chemotherapy. In this work we showed that ADAR1, located on the high-
risk associated- 1q21 locus is highly expressed in late stage PCL patient
samples, and that aberrant RNA editing occurs in cancer stem cell-
associated transcripts APOBEC3D and GLI1. Moreover, we showed that
environmental factors such as immunomodulatory treatment (lenalidomide)
or BM niche soluble factors (IL-6) can support ADAR1-induced aberrant
RNA editing and that lenalidomide-sustained ADAR1 overexpression
promotes self-renewal and a cancer stem cell-like phenotype in MM cells.
Together, ADAR1-dependent transcriptome recoding could eventually lead
to further malignant clonal diversity and disease progression in MM.
Therefore, a NOTCH/IL-6/ADAR1 axis, together with ADAR1 editing
substrates, represents novel targets for diagnostic and therapeutic
development in MM and PCL.

97
BIBLIOGRAPHY
1. Rajkumar SV. Multiple myeloma: 2012 update on diagnosis, risk-stratification, and management. Am J Hematol. 2012; 87(1):78–88.
2. Palumbo A, Anderson K. Multiple myeloma. N. Engl. J. Med. 2011; 364(11):1046–60.
3. Kyle R a, Rajkumar SV. Multiple myeloma. N. Engl. J. Med. 2004; 351(18):1860–73.
4. Landgren O, Weiss BM. Patterns of monoclonal gammopathy of undetermined significance and multiple myeloma in various ethnic/racial groups: support for genetic factors in pathogenesis. Leuk. Off. J. Leuk. Soc. Am. Leuk. Res. Fund, U.K. 2009; 23(10):1691–7.
5. Kyle R a, Remstein ED, Therneau TM, et al. Clinical course and prognosis of smoldering (asymptomatic) multiple myeloma. N. Engl. J. Med. 2007; 356(25):2582–90.
6. Donk N Van De. How I treat plasma cell leukemia. Blood. 2012; 120(12):2376–2389.
7. Rajkumar SV. Multiple myeloma: 2013 update on diagnosis, risk-stratification, and management. Am. J. Hematol. 2013; 88(3):226–35.
8. Kyle R a, Gertz M a, Witzig TE, et al. Review of 1027 patients with newly diagnosed multiple myeloma. Mayo Clin. Proc. 2003; 78(January):21–33.
9. Greipp PR, San Miguel J, Durie BGM, et al. International staging system for multiple myeloma. J. Clin. Oncol. 2005; 23(15):3412–20.
10. Kumar SK, Mikhael JR, Buadi FK, et al. Management of newly diagnosed symptomatic multiple myeloma: updated Mayo Stratification of Myeloma and Risk-Adapted Therapy (mSMART) consensus guidelines. Mayo Clin. Proc. 2009; 84(12):1095–110.
11. Kumar SK, Rajkumar SV, Dispenzieri A, et al. Improved survival in multiple myeloma and the impact of novel therapies. Blood. 2008; 111(5):2516–20.
12. Hallek M, Bergsagel PL, Anderson KC. Multiple myeloma: increasing evidence for a multistep transformation process. Blood. 1998; 91(1):3–21.

98
13. O’Connor B, Gleeson MW, Noelle RJ, Erickson LD. The rise and fall of long-lived humoral immunity: terminal differentiation of plasma cells in health and disease. Immunol Rev. 2003; 194:61–76.
14. Witzig TE, Timm M, Larson D, Therneau T, Greipp PR. Measurement of apoptosis and proliferation of bone marrow plasma cells in patients with plasma cell proliferative disorders. Br. J. Haematol. 1999; 104(1):131–137.
15. Hose D, Rème T, Hielscher T, et al. Proliferation is a central independent prognostic factor and target for personalized and risk-adapted treatment in multiple myeloma. Haematologica. 2011; 96(1):87–95.
16. Morgan GJ, Walker B a., Davies FE. The genetic architecture of multiple myeloma. Nat. Rev. Cancer. 2012; 12(5):335–348.
17. Zhou Y, Barlogie B, Shaughnessy JD. The molecular characterization and clinical management of multiple myeloma in the post-genome era. Leukemia. 2009; 23(11):1941–56.
18. Bergsagel PL, Kuehl WM. Chromosome translocations in multiple myeloma. Oncogene. 2001; 20:5611–5622.
19. Kuehl WM, Bergsagel PL. Multiple myeloma: evolving genetic events and host interactions. Nat. Rev. Cancer. 2002; 2(3):175–87.
20. Bergsagel PL, Kuehl WM, Zhan F, et al. Cyclin D dysregulation: An early and unifying pathogenic event in multiple myeloma. Blood. 2005; 106(1):296–303.
21. González D, van der Burg M, García-Sanz R, et al. Immunoglobulin gene rearrangements and the pathogenesis of multiple myeloma. Blood. 2007; 110(9):3112–21.
22. Bergsagel PL, Kuehl WM. Molecular pathogenesis and a consequent classification of multiple myeloma. J. Clin. Oncol. 2005; 23(26):6333–6338.
23. Avet-Loiseau H, Gerson F, Magrangeas F, et al. Rearrangements of the c-myc oncogene are present in 15% of primary human multiple myeloma tumors. Blood. 2001; 98(10):3082–3086.
24. Van Wier S, Braggio E, Baker A, et al. Hypodiploid multiple myeloma is characterized by more aggressive molecular markers than non-hyperdiploid multiple myeloma. Haematologica. 2013; 98(10):1586–1592.

99
25. Chng WJ, Dispenzieri a, Chim C-S, et al. IMWG consensus on risk stratification in multiple myeloma. Leukemia. 2014; 28(2):269–77.
26. Boyd KD, Ross FM, Chiecchio L, et al. A novel prognostic model in myeloma based on co-segregating adverse FISH lesions and the ISS: analysis of patients treated in the MRC Myeloma IX trial. 2012; 26(2):349–355.
27. Carrasco DR, Tonon G, Huang Y, et al. High-resolution genomic profiles define distinct clinico-pathogenetic subgroups of multiple myeloma patients. Cancer Cell. 2006; 9(4):313–25.
28. Hanamura I, Stewart JP, Huang Y, et al. Frequent gain of chromosome band 1q21 in plasma-cell dyscrasias detected by fluorescence in situ hybridization : incidence increases from MGUS to relapsed myeloma and is related to prognosis and disease progression following tandem stem-cell transplantati. Blood. 2006; 108(5):1724–1732.
29. Fonseca R, Van Wier S a, Chng WJ, et al. Prognostic value of chromosome 1q21 gain by fluorescent in situ hybridization and increase CKS1B expression in myeloma. Leukemia. 2006; 20(11):2034–40.
30. Sawyer JR, Tian E, Heuck CJ, et al. Jumping translocations of 1q12 in multiple myeloma: a novel mechanism for deletion of 17p in cytogenetically defined high-risk disease. Blood. 2014.
31. Nemec P, Zemanova Z, Greslikova H, et al. Gain of 1q21 is an unfavorable genetic prognostic factor for multiple myeloma patients treated with high-dose chemotherapy. Biol. Blood Marrow Transplant. 2010; 16(4):548–54.
32. Wu L, Grigoryan A V, Li Y, et al. Specific Small Molecule Inhibitors of Skp2-Mediated p27 Degradation. Chem Biol. 2012; 19(12):1515–1524.
33. Pellat-Deceunynck C, Barillé S, Puthier D, et al. Adhesion molecules on human myeloma cells: significant changes in expression related to malignancy, tumor spreading, and immortalization. Cancer Res. 1995; 55:3647–3653.
34. Chang H, Jiang N, Jiang H, et al. CKS1B nuclear expression is inversely correlated with p27 klp1 expression and is predictive of an adverse survival in patients with multiple myeloma. Haematologica. 2010; 95(9):1542–1547.

100
35. Inoue J, Otsuki T, Hirasawa A, et al. Overexpression of PDZK1 within the 1q12-q22 amplicon is likely to be associated with drug-resistance phenotype in multiple myeloma. Am. J. Pathol. 2004; 165(1):71–81.
36. Sawyer JR, Tian E, Thomas E, et al. Evidence for a Novel Mechanism for Gene Amplification in Multiple Myeloma: 1q12 Pericentromeric Heterochromatin Mediates Breakage-Fusion-Bridge Cycles of a 1q12~23 Amplicon. Br J Heamatol. 2009; 147(4):484–494.
37. Bergsagel PL, Mateos MV, Gutierrez NC, Rajkumar SV, San Miguel JF. Improving overall survival and overcoming adverse prognosis in the treatment of cytogenetically high-risk multiple myeloma. Blood. 2013; 121(6):884–892.
38. Haessler J, Shaughnessy JD, Zhan F, et al. Benefit of complete response in multiple myeloma limited to high-risk subgroup identified by gene expression profiling. Clin. Cancer Res. 2007; 13(23):7073–7079.
39. Anderson KC, Kyle R a., Dalton WS, et al. Multiple Myeloma: New Insights and Therapeutic Approaches. Hematology Am. Soc. Hematol. Educ. Program. 2000:147–165.
40. Bladé J, de Larrea CF, Rosiñol L. Incorporating monoclonal antibodies into the therapy of multiple myeloma. J. Clin. Oncol. 2012; 30(16):1904–6.
41. Rajkumar SV. Multiple myeloma: 2014 Update on diagnosis, risk- stratification, and management. Am. J. Hematol. 2014; 89(10):999–1009.
42. Greenstein S, Ghias K, Krett NL, Rosen ST. Mechanisms of glucocorticoid-mediated apoptosis in hematological malignancies. Clin. Cancer Res. 2002; 8(6):1681–1694.
43. Palumbo a, Dimopoulos M, San Miguel J, et al. Lenalidomide in combination with dexamethasone for the treatment of relapsed\ror refractory multiple myeloma. Blood rev. 2008; In press(1):129–136.
44. Hardin J, MacLeod S, Grigorieva I, et al. Interleukin-6 prevents dexamethasone-induced myeloma cell death. Blood. 1994; 84(9):3063–3070.
45. Hideshima T, Richardson PG, Anderson KC. Mechanism of Action of Proteasome Inhibitors and Deacetylase Inhibitors and the Biological Basis

101
of Synergy in Multiple Myeloma. Mol. Cancer Ther. 2011; 10(11):2034–2042.
46. Fenaux P, Giagounidis A, Selleslag D, et al. A randomized phase 3 study of lenalidomide versus placebo in RBC transfusion-dependent patients with Low- / Intermediate-1-risk myelodysplastic syndromes with del5q. Blood. 2013; 118(14):3765–3776.
47. Sampaio EP, Sarno EN, Galilly R, Cohn Z a, Kaplan G. Thalidomide selectively inhibits tumor necrosis factor alpha production by stimulated human monocytes. J. Exp. Med. 1991; 173(3):699–703.
48. D’Amato RJ, Loughnan MS, Flynn E, Folkman J. Thalidomide is an inhibitor of angiogenesis. Proc. Natl. Acad. Sci. U. S. A. 1994; 91(9):4082–4085.
49. Haslett BP a J, Corral LG, Albert M. Thalidomide Costimulates Primary Human T Lymphocytes, Preferentially Inducing Proliferation, Cytokine Production, and Cytotoxic Responses in the CD8. J. Exp. Med. 1998; 187(11):6–13.
50. Quach H, Ritchie D, Stewart a K, et al. Mechanism of action of immunomodulatory drugs (IMiDS) in multiple myeloma. Leuk. Off. J. Leuk. Soc. Am. Leuk. Res. Fund, U.K. 2010; 24(1):22–32. Available at: http://dx.doi.org/10.1038/leu.2009.236.
51. Davies FE, Raje N, Hideshima T, Al E. Thalidomide and immunomodulatory derivatives augment natural killer cell cytotoicity in multiple myeloma. Blood. 2001; 98(1):210–216.
52. Fujii S, Shimizu K, Steinman RM, Dhodapkar M V. Detection and activation of human Valpha24+ natural killer T cells using alpha-galactosyl ceramide-pulsed dendritic cells. J. Immunol. Methods. 2003; 272(1-2):147–159.
53. Wu L, Adams M, Carter T, et al. Lenalidomide enhances natural killer cell and monocyte-mediated antibody-dependent cellular cytotoxicity of rituximab-treated CD20+ tumor cells. Clin. Cancer Res. 2008; 14(14):4650–4657.
54. Corral LG, Kaplan G. Immunomodulation by thalidomide and thalidomide analogues. Ann. Rheum. Dis. 1999; 58 Suppl 1(Suppl I):I107–I113.

102
55. Gupta D, Treon SP, Shima Y, et al. Adherence of multiple myeloma cells to bone marrow stromal cells upregulates vascular endothelial growth factor secretion: therapeutic applications. Leuk. Off. J. Leuk. Soc. Am. Leuk. Res. Fund, U.K. 2001; 15(12):1950–1961.
56. Shaffer A, Emre N, Lamy L, Ngo V. IRF4 addiction in multiple myeloma. Nature. 2008; 454(7201):226–231..
57. Lopez-Girona A, Heintel D, Zhang L-H, et al. Lenalidomide downregulates the cell survival factor, interferon regulatory factor-4, providing a potential mechanistic link for predicting response. Br. J. Haematol. 2011; 154(3):325–36.
58. Ito T, Ando H, Suzuki T, et al. Identification of a primary target of thalidomide teratogenicity. Science. 2010; 327(5971):1345–1350.
59. Lopez-Girona a, Mendy D, Ito T, et al. Cereblon is a direct protein target for immunomodulatory and antiproliferative activities of lenalidomide and pomalidomide. Leukemia. 2012; 26(11):2326–35.
60. Thakurta A, Gandhi a K, Waldman MF, et al. Absence of mutations in cereblon (CRBN) and DNA damage-binding protein 1 (DDB1) genes and significance for IMiD therapy. Leukemia. 2013:1–3.
61. Schuster SR, Kortuem KM, Zhu YX, et al. The clinical significance of cereblon expression in multiple myeloma. Leuk. Res. 2014; 38(1):23–8.
62. Lu G, Middleton RE, Sun H, et al. The myeloma drug lenalidomide promotes the cereblon-dependent destruction of Ikaros proteins. Science. 2014; 343(January):305–9.
63. Krönke J, Udeshi N, Narla A, Grauman P. Lenalidomide causes selective degradation of IKZF1 and IKZF3 in multiple myeloma cells. Science (80-. ). 2014; 343(6168):301–305.
64. Yang B, Yu R, Chi X, Lu X. Lenalidomide treatment for multiple myeloma: systematic review and meta-analysis of randomized controlled trials. PLoS One. 2013; 8(5):e64354.
65. Kumar SK, Lee JH, Lahuerta JJ, et al. Risk of progression and survival in multiple myeloma relapsing after therapy with IMiDs and bortezomib: A multicenter international myeloma working group study. Leuk. Off. J. Leuk. Soc. Am. Leuk. Res. Fund, U.K. 2011; (May 2011):149–157.

103
66. Di Pauli F, Berger T, Reindl M. Monoclonal antibodies in the treatment of multiple sclerosis. Curr. Med. Chem. 2009; 16(36):4858–4868.
67. Kaufman JL, Fabre C, Lonial S, Richardson PG. Histone deacetylase inhibitors in multiple myeloma: rationale and evidence for their use in combination therapy. Clin. Lymphoma. Myeloma Leuk. 2013; 13(4):370–6.
68. Hideshima T, Anderson KC. Molecular mechanisms of novel therapeutic approaches for multiple myeloma. Nat. Rev. Cancer. 2002; 2(12):927–37.
69. Roodman GD. New potential targets for treating myeloma bone disease. Clin. Cancer Res. 2006; 12(20 Pt 2):6270s–6273s.
70. Ribatti D, Nico B, Vacca a. Importance of the bone marrow microenvironment in inducing the angiogenic response in multiple myeloma. Oncogene. 2006; 25(31):4257–66.
71. Chauhan D, Uchiyama H, Akbarali Y, et al. Multiple myeloma cell adhesion-induced interleukin-6 expression in bone marrow stromal cells involves activation of NF-kappa B. Blood. 1996; 87(3):1104–12.
72. Podar K, Tai YT, Davies FE, et al. Vascular endothelial growth factor triggers signaling cascades mediating multiple myeloma cell growth and migration. Blood. 2001; 98(2):428–35.
73. Hideshima T, Chauhan D, Hayashi T, et al. The Biological Sequelae of Stromal Cell-derived Factor-1 α in Multiple Myeloma. Mol. Cancer Ther. 2002; 1:539–544.
74. Mitsiades CS, Mitsiades NS, McMullan CJ, et al. Inhibition of the insulin-like growth factor receptor-1 tyrosine kinase activity as a therapeutic strategy for multiple myeloma, other hematologic malignancies, and solid tumors. Cancer Cell. 2004; 5(3):221–30.
75. Blank U, Karlsson G, Karlsson S, Dc W. Signaling pathways governing stem-cell fate Review article Signaling pathways governing stem-cell fate. 2013; 111(2):492–503.
76. Barillé S, Collette M, Bataille R, Amiot M. Myeloma cells upregulate interleukin-6 secretion in osteoblastic cells through cell-to-cell contact but downregulate osteocalcin. Blood. 1995; 86(8):3151–9.

104
77. Dankbar B, Padró T, Leo R, et al. Vascular endothelial growth factor and interleukin-6 in paracrine tumor-stromal cell interactions in multiple myeloma Vascular endothelial growth factor and interleukin-6 in paracrine tumor-stromal cell interactions in multiple myeloma. Blood. 2000; (95):2630–2636.
78. Ferlin M, Noraz N, Hertogh C, et al. Insulin-like growth factor induces the survival and proliferation of myeloma cells through an interleukin-6-independent transduction pathway. Br. J. Haematol. 2000; 111(2):626–34.
79. Alsayed Y, Ngo H, Runnels J, et al. Mechanisms of regulation of CXCR4/SDF-1 (CXCL12)-dependent migration and homing in multiple myeloma. Blood. 2007; 109(7):2708–17.
80. Urashima M, Ogata a, Chauhan D, et al. Interleukin-6 promotes multiple myeloma cell growth via phosphorylation of retinoblastoma protein. Blood. 1996; 88(6):2219–2227.
81. Hitzler JK, Martinez-Valdez H, Bergsagel DB, Minden MD, Messner H a. Role of interleukin-6 in the proliferation of human multiple myeloma cell lines OCI-My 1 to 7 established from patients with advanced stage of the disease. Blood. 1991; 78(8):1996–2004.
82. Abe M, Hiura K, Wilde J, et al. Osteoclasts enhance myeloma cell growth and survival via cell-cell contact: A vicious cycle between bone destruction and myeloma expansion. Blood. 2004; 104(8):2484–2491.
83. Tanaka Y, Abe M, Hiasa M, et al. Myeloma cell-osteoclast interaction enhances angiogenesis together with bone resorption: A role for vascular endothelial cell growth factor and osteopontin. Clin. Cancer Res. 2007; 13(3):816–823.
84. Hideshima T, Chauhan D, Schlossman R, Richardson P, Anderson KC. The role of tumor necrosis factor alpha in the pathophysiology of human multiple myeloma: therapeutic applications. Oncogene. 2001; 20(33):4519–27.
85. Kuhn DJ, Berkova Z, Jones RJ, et al. Targeting the insulin-like growth factor-1 receptor to overcome bortezomib resistance in preclinical models of multiple myeloma. 2012; 120(16):3260–3270.
86. Damiano JS, Cress a E, Hazlehurst L a, Shtil a a, Dalton WS. Cell adhesion mediated drug resistance (CAM-DR): role of integrins and

105
resistance to apoptosis in human myeloma cell lines. Blood. 1999; 93(5):1658–1667.
87. Hazlehurst LA, Damiano JS, Buyuksal I, Pledger WJ, Dalton WS. Adhesion to fibrobronectin via b1 integrins regulates p27 kip1 levels and contributes to cell adhesion mediated drug resistance ( CAM-DR ). Oncogene. 2000; (19).
88. Hazlehurst L a, Dalton WS. Mechanisms associated with cell adhesion mediated drug resistance (CAM-DR) in hematopoietic malignancies. Cancer Metastasis Rev. 2001; 20(1-2):43–50.
89. Neri P, Ren L, Azab AK, et al. Integrin {beta}7-mediated regulation of multiple myeloma cell adhesion, migration, and invasion. Blood. 2011; 117(23):6202–13.
90. Chiron D, Maïga S, Descamps G, et al. Critical role of the NOTCH ligand JAG2 in self-renewal of myeloma cells. Blood Cells. Mol. Dis. 2012; 48(4):247–53.
91. Kim D, Park CY, Medeiros BC, Weissman IL. CD19-CD45 low/- CD38 high/CD138+ plasma cells enrich for human tumorigenic myeloma cells. Leukemia. 2012; 26(12):2530–7.
92. Van Valckenborgh E, Matsui W, Agarwal P, et al. Tumor-initiating capacity of CD138- and CD138+ tumor cells in the 5T33 multiple myeloma model. Leukemia. 2012; 26(6):1436–1439.
93. Matsui W, Huff CA, Wang Q, et al. Characterization of clonogenic multiple myeloma cells. Blood. 2004; 103(6):2332–6.
94. Matsui W, Wang Q, Barber JP, et al. Clonogenic multiple myeloma progenitors, stem cell properties, and drug resistance. Cancer Res. 2008; 68(1):190–197.
95. Kirshner J, Thulien KJ, Martin LD, et al. A unique three-dimensional model for evaluating the impact of therapy on multiple myeloma. 2008; 112(7):2935–2945.
96. Pilarski LM, Baigorri E, Mant MJ, et al. Multiple Myeloma Includes Phenotypically Defined Subsets of Clonotypic CD20+ B Cells that Persist During Treatment with Rituximab. Clin. Med. Oncol. 2008; 2:275–287.

106
97. Hosen N, Matsuoka Y, Kishida S, et al. CD138-negative clonogenic cells are plasma cells but not B cells in some multiple myeloma patients. Leukemia. 2012; 26(9):2135–2141.
98. Blank U, Karlsson G, Karlsson S. Signaling pathways governing stem-cell fate. Blood. 2008; 111(2):492–503.
99. Mirandola L, Comi P, Cobos E, et al. Notch-ing from T-cell to B-cell lymphoid malignancies. Cancer Lett. 2011; 308(1):1–13.
100. Colombo M, Mirandola L, Platonova N, et al. Notch-directed microenvironment reprogramming in myeloma: a single path to multiple outcomes. Leuk. Off. J. Leuk. Soc. Am. Leuk. Res. Fund, U.K. 2013; (November 2012):1–10.
101. Mumm JS, Kopan R. Notch signaling: from the outside in. Dev. Biol. 2000; 228(2):151–65.
102. Beel AJ, Sanders CR. Substrate Specificity of γ-Secretase and Other Intramembrane Proteases. Cell Mol Life Sci. 2008; 65(9):1311–1334.
103. Osborne B a, Minter LM. Notch signalling during peripheral T-cell activation and differentiation. Nat. Rev. Immunol. 2007; 7(1):64–75.
104. Le Borgne R. Regulation of Notch signalling by endocytosis and endosomal sorting. Curr. Opin. Cell Biol. 2006; 18(2):213–22.
105. Fryer CJ, White JB, Jones K a. Mastermind recruits CycC:CDK8 to phosphorylate the Notch ICD and coordinate activation with turnover. Mol. Cell. 2004; 16(4):509–20.
106. Houde C, Li Y, Song L, et al. Overexpression of the NOTCH ligand JAG2 in malignant plasma cells from multiple myeloma patients and cell lines. Blood. 2004; 104(12):3697–704.
107. Ghoshal P, Nganga AJ, Moran-Giuati J, et al. Loss of the SMRT/NCoR2 corepressor correlates with JAG2 overexpression in multiple myeloma. Cancer Res. 2009; 69(10):4380–7.
108. Jundt F, Anagnostopoulos I, Förster R, et al. Activated Notch1 signaling promotes tumor cell proliferation and survival in Hodgkin and anaplastic large cell lymphoma Activated Notch1 signaling promotes tumor cell proliferation and survival in Hodgkin and anaplastic large cell lymphoma. Blood. 2002:3398–3403.

107
109. Jundt F, Pröbsting KS, Anagnostopoulos I, et al. Jagged1-induced Notch signaling drives proliferation of multiple myeloma cells. Blood. 2004; 103(9):3511–5.
110. Xu D, Hu J, De Bruyne E, et al. Dll1/Notch activation contributes to bortezomib resistance by upregulating CYP1A1 in multiple myeloma. Biochem. Biophys. Res. Commun. 2012; 428(4):518–24.
111. Hodkinson PS, Elliott P a., Lad Y, et al. Mammalian NOTCH-1 Activates beta1 Integrins via the Small GTPase R-Ras. J. Biol. Chem. 2007; 282(39):28991–29001.
112. Mirandola L, Apicella L, Colombo M, et al. Anti-Notch treatment prevents multiple myeloma cells localization to the bone marrow via the chemokine system CXCR4/SDF-1. Leuk. Off. J. Leuk. Soc. Am. Leuk. Res. Fund, U.K. 2013; (November 2012).
113. Nefedova Y, Cheng P, Alsina M, Dalton WS, Gabrilovich DI. Involvement of Notch-1 signaling in bone marrow stroma-mediated de novo drug resistance of myeloma and other malignant lymphoid cell lines. Blood. 2004; 103(9):3503–10.
114. Nefedova Y, Sullivan DM, Bolick SC, Dalton WS, Gabrilovich DI. Inhibition of Notch signaling induces apoptosis of myeloma cells and enhances sensitivity to chemotherapy. Blood. 2008; 111(4):2220–9.
115. Zanotti S, Smerdel-Ramoya A, Stadmeyer L, et al. Notch inhibits osteoblast differentiation and causes osteopenia. Endocrinology. 2008; 149(8):3890–9.
116. Gott JM, Emeson RB. Functions and Mechanisms of RNA Editing. Annu. Rev. Genet. 2000; 34:499–531.
117. Smith HC. A guide to RNA editing. RNA. 1997; 3:1105–1123.
118. Farajollahi S, Maas S. Molecular diversity through RNA editing: a balancing act. Trends Genet. 2010; 26(5):221–230.
119. Maas S. Posttranscriptional recoding by RNA editing. 1st ed. Elsevier Inc.; 2012.
120. Li JB, Levanon EY, Yoon J-K. Genome-Wide Identifcation of Human RNA Editing Sited by Parallel DNA Capturing and Sequencing. Science (80-. ). 2009; 324.

108
121. Kim DDY, Kim TTY, Walsh T, et al. Widespread RNA Editing of Embedded Alu Elements in the Human Transcriptome Widespread RNA Editing of Embedded Alu Elements in the Human Transcriptome. 2004:1719–1725.
122. Athanasiadis A, Rich A, Maas S. Widespread A-to-I RNA editing of Alu-containing mRNAs in the human transcriptome. PLoS Biol. 2004; 2(12).
123. Maas S, Rich A, Nishikura K. A-to-I RNA editing: recent news and residual mysteries. J. Biol. Chem. 2003; 278(3):1391–4.
124. Zhang Z, Carmichael GG. The fate of dsRNA in the Nucleus: A p54nrb-containing complex mediates the nuclear retention of promiscuously A-to-I edited RNAs. Cell. 2001; 106(4):465–475.
125. Chen L, Carmichael GG. Altered nuclear retention of mRNAs containing inverted repeats in human embryonic stem cells: Functional role of a nuclear noncoding RNA. Mol. Cell. 2009; 35(4):467–478.
126. Hundley H a, Krauchuk A a, Bass BL. C. elegans and H. sapiens mRNAs with edited 3’ UTRs are present on polysomes. RNA. 2008; 14(10):2050–2060.
127. Zipeto MA, Jiang Q, Melese E, Jamieson CHM. RNA rewriting, recoding, and rewiring in human disease. Trends Mol. Med. 2015:1–11.
128. Yang W, Chendrimada TP, Wang Q, Higuchi M, Peter H. Modulation of microRNA processing and expression through RNA editing by ADAR deaminases. Nat Struct Mol Biol. 2006; 13(1):13–21.
129. Kawahara Y, Megraw M, Kreider E, et al. Frequency and fate of microRNA editing in human brain. Nucleic Acids Res. 2008; 36(16):5270–5280.
130. Wagnert RW, Smitht JE, Coopermant BS, Nishikurat K. double-stranded RNA unwinding activity. Proc. Natl. Acad. Sci. 1989; 86(April):2647–2651.
131. Ryter JM, Schultz SC. Molecular basis of double-stranded RNA-protein interactions: Structure of a dsRNA-binding domain complexed with dsRNA. EMBO J. 1998; 17(24):7505–7513.
132. Valente L, Nishikura K. RNA binding-independent dimerization of adenosine deaminases acting on RNA and dominant negative effects of

109
nonfunctional subunits on dimer functions. J. Biol. Chem. 2007; 282(22):16054–16061.
133. Kim U, Wang Y, Sanford T, Zeng Y, Nishikura K. Molecular cloning of cDNA for double-stranded RNA adenosine deaminase, a candidate enzyme for nuclear RNA editing. Proc Natl Acad Sci U S A. 1994; 91(24):11457–11461.
134. Lai F, Drakas R, Nishikura K. Mutagenic analysis of double-stranded RNA adenosine deaminase, a candidate enzyme for RNA editing of glutamate-gated ion channel transcripts. J. Biol. Chem. 1995; 270(29):17098–17105.
135. Macbeth MR, Schubert HL, VanDemark AP, et al. Inositol Hexakisphosphate Is Bound in the ADAR2 Core and Required for RNA Editing. Science (80-. ). 2005; 309(5740):1534–1539.
136. Herbert a, Alfken J, Kim YG, et al. A Z-DNA binding domain present in the human editing enzyme, double-stranded RNA adenosine deaminase. Proc. Natl. Acad. Sci. U. S. A. 1997; 94(16):8421–8426.
137. George CX, Wagner M V., Samuel CE. Expression of interferon-inducible RNA adenosine deaminase ADAR1 during pathogen infection and mouse embryo development involves tissue-selective promoter utilization and alternative splicing. J. Biol. Chem. 2005; 280(15):15020–15028.
138. Patterson JB, Samuel CE. Expression and regulation by interferon of a double-stranded-RNA-specific adenosine deaminase from human cells: evidence for two forms of the deaminase. Mol. Cell. Biol. 1995; 15(10):5376–5388.
139. Weier HU, George CX, Greulich KM, Samuel CE. The interferon-inducible, double-stranded RNA-specific adenosine deaminase gene (DSRAD) maps to human chromosome 1q21.1-21.2. Genomics. 1995; 30(2):372–375.
140. Fritz J, Strehblow A, Taschner A, et al. RNA-regulated interaction of transportin-1 and exportin-5 with the double-stranded RNA-binding domain regulates nucleocytoplasmic shuttling of ADAR1. Mol. Cell. Biol. 2009; 29(6):1487–1497.
141. Herbert a, Rich a. The role of binding domains for dsRNA and Z-DNA in the in vivo editing of minimal substrates by ADAR1. Proc. Natl. Acad. Sci. U. S. A. 2001; 98(21):12132–12137.

110
142. Meltzer M, Long K, Nie Y, et al. The RNA Editor Gene Adar1 is Induced in Myoblasts by Inflammatory Ligands and Buffers Stress Response. Clin. Transalational Sci. 2010; 3(3):73–80.
143. Maas S, Patt S, Schrey M, Rich a. Underediting of glutamate receptor GluR-B mRNA in malignant gliomas. Proc. Natl. Acad. Sci. U. S. A. 2001; 98(25):14687–14692.
144. Cenci C, Barzotti R, Galeano F, et al. Down-regulation of RNA editing in pediatric astrocytomas: ADAR2 editing activity inhibits cell migration and proliferation. J. Biol. Chem. 2008; 283(11):7251–7260.
145. Chen L, Li C, LIn CH, et al. Recoding RNA editing of antizyme inhibitor 1 predisposes to hepatocellular carcinoma. Nat. Med. 2013; 29(6):997–1003.
146. Qin YR, Qiao JJ, Chan THM, et al. Adenosine-to-inosine RNA editing mediated by adars in esophageal squamous cell carcinoma. Cancer Res. 2014; 74(3):840–851.
147. Beghini a, Ripamonti CB, Peterlongo P, et al. RNA hyperediting and alternative splicing of hematopoietic cell phosphatase (PTPN6) gene in acute myeloid leukemia. Hum. Mol. Genet. 2000; 9(15):2297–2304.
148. Jiang Q, Crews L a, Barrett CL, et al. ADAR1 promotes malignant progenitor reprogramming in chronic myeloid leukemia. Proc. Natl. Acad. Sci. U. S. A. 2013; 110(3):1041–6.
149. Chapman M a, Lawrence MS, Keats JJ, et al. Initial genome sequencing and analysis of multiple myeloma. Nature. 2011; 471(7339):467–72.
150. Crews L a, Jiang Q, Zipeto M a, et al. An RNA editing fingerprint of cancer stem cell reprogramming. J. Transl. Med. 2015; 13:1–12.
151. Chaidos A, Barnes CP, Cowan G, et al. Clinical drug resistance linked to interconvertible phenotypic and functional states of tumor-propagating cells in multiple myeloma. Blood. 2013; 121(2):318–28.
152. Bataille R, Jourdan M, Zhang XG, Klein B. Serum levels of interleukin 6, a potent myeloma cell growth factor, as a reflect of disease severity in plasma cell dyscrasias. J. Clin. Invest. 1989; 84(6):2008–11.

111
153. Qiu W, Wang X, Buchanan M, et al. ADAR1 is essential for intestinal homeostasis and stem cell maintenance. Cell Death Dis. 2013; 4(4):e599.
154. Colombo M, Thummler K, Mirandola L, et al. Notch signaling drives multiple myeloma induced osteoclastogenesis. Oncotarget. 2014; 5(21).
155. Xu D, Hu J, Xu S, et al. Dll1/Notch activation accelerates multiple myeloma disease development by promoting CD138+ MM-cell proliferation. Leukemia. 2012; 26(6):1402–5.
156. Ito R, Takahashi T, Katano I, Ito M. Current advances in humanized mouse models. Cell. Mol. Immunol. 2012; 9(3):208–214.
157. Traggiai E, Chicha L, Mazzucchelli L, et al. Development of a human adaptive immune system in cord blood cell-transplanted mice. Science. 2004; 304(5667):104–107.
158. Goff DJ, Recart AC, Sadarangani A, et al. A Pan-BCL2 inhibitor renders bone-marrow-resident human leukemia stem cells sensitive to tyrosine kinase inhibition. Cell Stem Cell. 2013; 12(3):316–28.
159. Ma W, Gutierrez A, Goff DJ, et al. NOTCH1 signaling promotes human T-cell acute lymphoblastic leukemia initiating cell regeneration in supportive niches. PLoS One. 2012; 7(6):e39725.
160. Frigyesi I, Adolfsson J, Ali M, et al. Robust isolation of malignant plasma cells in multiple myeloma. Blood. 2014; 123(9):1336–1340.
161. American Cancer Society. Cancer Facts & Figures 2014. Am. Cancer Soc. 2014.
162. Gwertz MA, Dingli D. How we manage autologous stem cell transplantation for patients with multiple myeloma. Blood. 2014; 124(6):882–890.
163. Pandya C, Hashmi S, Khera N, et al. Cost-effectiveness analysis of early vs. late autologous stem cell transplantation in multiple myeloma. Clin. Transplant. 2014; 28(10):1084–1091.
164. Roy A, Kish JK, Bloudek L, et al. Estimating the Costs of Therapy in Patients with Relapsed and/or Refractory Multiple Myeloma: A Model Framework. Am. Heal. Drug Benefits l www.AHDBonline.com Am Heal. Drug Benefits. 2015; 2048(44):204–215.

112
165. Price R, Stranges E, Elixhauser A. Cancer hospitalizations for adults, 2009. Stat. Briefs. Agency Healthc. Res. Qual. 2012; 61(4):1–11.
166. Zhuang J, Da Y, Li H, et al. Cytogenetic and clinical risk factors for assessment of ultra high-risk multiple myeloma. Leuk. Res. 2014; 38(2):188–93.
167. Bianchi G, Ghobrial IM. Biological and Clinical Implications of Clonal Heterogeneity and Clonal Evolution in Multiple Myeloma. Curr Cancer Ther Rev. 2014; 29(6):997–1003.
168. Keats JJ, Chesi M, Egan JB, et al. Clonal competition with alternating dominance in multiple myeloma. Blood. 2012; 120(5):1067–1077.
169. Walker B a, Wardell CP, Melchor L, et al. Intraclonal heterogeneity and distinct molecular mechanisms characterize the development of t ( 4 ; 14 ) and t ( 11 ; 14 ) myeloma. Blood. 2012; 120(5):1077–1086.
170. Bolli N, Avet-Loiseau H, Wedge DC, et al. Heterogeneity of genomic evolution and mutational profiles in multiple myeloma. Nat. Commun. 2014; 5:2997.
171. Chang H, Yeung J, Xu W, Ning Y, Patterson B. Significant increase of CKS1B amplification from monoclonal gammopathy of undetermined significance to multiple myeloma and plasma cell leukaemia as demonstrated by interphase fluorescence in situ hybridisation. Br. J. Haematol. 2006; 134(6):613–615.
172. Hanamura I, Stewart JP, Huang Y, et al. Frequent gain of chromosome band 1q21 in plasma-cell dyscrasias detected by fluorescence in situ hybridization: Incidence increases from MGUS to relapsed myeloma and is related to prognosis and disease progression following tandem stem-cell transplantatio. Blood. 2006; 108(5):1724–1732.
173. Avet-Loiseau H, Li C, Magrangeas F, et al. Prognostic significance of copy-number alterations in multiple myeloma. J. Clin. Oncol. 2009; 27(27):4585–90.
174. Chiecchio L, Dagrada GP, White HE, et al. Frequent Upregulation of MYC in Plasma Cell Leukemia. Genes. Chromosomes Cancer. 2009; 48:624–636.

113
175. Roberts S a, Lawrence MS, Klimczak LJ, et al. An APOBEC cytidine deaminase mutagenesis pattern is widespread in human cancers. Nat. Genet. 2013; 45(9):970–6.
176. Henderson S, Chakravarthy A, Su X, Boshoff C, Fenton TR. APOBEC-Mediated Cytosine Deamination Links PIK3CA Helical Domain Mutations to Human Papillomavirus-Driven Tumor Development. Cell Rep. 2014; 7(6):1833–1841.
177. Roberts S a., Gordenin D a. Hypermutation in human cancer genomes: footprints and mechanisms. Nat. Rev. Cancer. 2014; 14(12):786–800.
178. Rebhandl S, Huemer M, Gassner FJ, et al. APOBEC3 signature mutations in chronic lymphocytic leukemia. Leukemia. 2014; 28(9):1929–1932.
179. Blotta S, Jakubikova J, Calimeri T, et al. Canonical and non canonical Hedgehog pathway in the pathogenesis of multiple myeloma. Blood. 2012; 120(25):1–4.
180. Liu Z, Xu J, He J, et al. A critical role of autocrine sonic hedgehog signaling in human CD138+ myeloma cell survival and drug resistance. Blood. 2014; 124(13):2061–2072.
181. Peacock CD, Wang Q, Gesell GS, et al. Hedgehog signaling maintains a tumor stem cell compartment in multiple myeloma. Proc Natl Acad Sci U S A. 2007; 104(10):4048–4053.
182. Shimokawa T, Rahman MF-U, Tostar U, et al. RNA editing of the GLI1 transcription factor modulates the output of Hedgehog signaling. RNA Biol. 2013; 10(February):321–33.
183. Colby SL, Ortman JM. The Baby Boom Cohort in the United States : 2012 to 2060. 2014:16.

114
SCIENTIFIC PRODUCTION AND FUNDING
“An RNA editing fingerprint of cancer stem cell reprogramming” L.A. Crews, Q. Jiang, M.A Zipeto, E. Lazzari, A.C. Court, S.Ali, C.L. Barrett, K.A. Frazer, C.H.M. Jamieson. Journal of Translational Medicine, 2015.
“PI3K/AKT signaling inhibits NOTCH1 lysosome-mediated degradation”. Platonova N. Manzo T., Mirandola L., Colombo M., Calzavera E., Vigolo E., Cermisoni G.C., De Simone D., Garavelli S., Cecchinato V., Lazzari E., Neri A., Chiaramonte R. Genes Chromosomes Cancer 2015.
“Notch signaling drives multiple myeloma induced osteoclastogenesis” M. Colombo, K. Thummler, L. Mirandola, S. Garavelli, K. Todoerti, L. Apicella, E. Lazzari, M. Lancellotti, N. Platonova, M. Akbar, M. Chiriva-Internati, R.Soutar, A. Neri, C.S. Goodyear and R. Chiaramonte. Oncotarget, 2014.
“Notch activation increases interleukin-6 expression in multiple myeloma niche” Colombo M., Galletti S., Bulfamante G., Falleni M., Tosi D., Todoerti K., Lazzari E., Crew L., Jamieson C, Garavelli S., Platonova N. , Neri A., Chiaramonte R. (Manuscript in preparation).
“ADAR1 drives disease progression and aberrant RNA editing in multiple myeloma”. L.A. Crews*, E. Lazzari*, C. Wu, H. Leu, S. Ali, M. Minden, R. Chiaramonte and C.H. Jamieson. (Manuscript in preparation).
“Bone marrow-mediated drug resistance is promoted by Jagged-induced Notch pathway in multiple myeloma” E.Lazzari, S.Garavelli, M. Colombo, L.A. Crews, A. Paoli, N. Platonova, S. Galletti, K.Todoerti, C.H. Jamieson, A. Neri, R. Chiaramonte. (Manuscript in preparation).
“Tracking human myeloma cell therapeutic resistance using a novel diagnostic assay for detection of RNA editing biomarkers of cancer stem cell generation” E. Lazzari, L.A. Crews, C. Wu, M.A. Zipeto, H. Leu, S. Ali, R. Chiaramonte and C.H.M. Jamieson. Translational Oncology Symposium, La Jolla, February 2015 (poster).
“Bone marrow-mediated drug resistance is promoted by Jagged-induced Notch pathway in multiple myeloma” S. Garavelli, E. Lazzari, M. Colombo, A. Paoli, N.
Platonova, S. Galletti, K.Todoerti, A. Neri, R. Chiaramonte. 20th Congress of European
Hematology Association, Vienna, June 2015 (poster).
This work has been supported by the Italian Ministry of Education, University and Research (MIUR) doctoral fellowship (2013-2015), by the Multiple Myeloma Research Grant (2014-2015) and the National Cancer Institute Provocative Question Grant 1R21 CA189705-01A1 (2015-2018).

115
ACKNOWLEDGEMENTS
I would like to dedicate my warmest thanks to my mentors, Dr. Raffaella Chiaramonte, who took me under her wing as PhD student at the Doctoral School of Molecular Medicine, University of Milan, and Dr. Catriona Jamieson, who welcomed me in her group as Visiting Student at University of California, San Diego. I am deeply thankful for the opportunities they gave me and for being such passionate, perseverant and confident mentors. Thanks to Dr. Leslie Crews, who has been an amazing guide, friend and foodie pal. She is one of the brightest and most supportive people I know, always able to find the silver lining, which meant a lot to me. Countless thanks to all my lab mates, Michela, Silvia, Serena, Marialuigia, Daria, Natalia and Leonardo from Chiaramonte’s lab and to the San Diego gang, Heather, Tina, Marianna, Cayla, Frida, Fay, Karina, Gabriel, Shawn and Wen from the Jamieson’s lab. They have been an incomparable source of scientific support and thoughtful suggestions, but more importantly I want to thank them for all the laughs, the conversations and the billion coffees we shared, it was great working with all of them.
RINGRAZIAMENTI
Vorrei ringraziare mia madre, Rosanna Pagani, e mio padre, Valerio Lazzari, per avermi supportata e talvolta sopportata durante questo percorso. Vorrei dedicare mille grazie anche a Concetta Frisenna e Valter Dallari, per avermi accolta e fatta sentire in famiglia in un battito di ciglia. Un grazie più speciale degli altri a Simone Dallari, per essere la persona che mi sprona ad esserne una migliore. Grazie per ogni giorno insieme.