Mechanics of the human red blood cell deformed by optical...
22
Journal of the Mechanics and Physics of Solids 51 (2003) 2259 – 2280 www.elsevier.com/locate/jmps Mechanics of the human red blood cell deformed by optical tweezers M. Dao a , C.T. Lim b , S. Suresh a; c ; ∗ a Department of Materials Science and Engineering, Massachusetts Institute of Technology, 77 Massachusetts Avenue, Cambridge, MA 02139, USA b Division of Bioengineering and Department of Mechanical Engineering, The National University of Singapore, 9 Engineering Drive 1, Singapore 117576, Singapore c Department of Mechanical Engineering, Massachusetts Institute of Technology, 77 Massachusetts Avenue, Cambridge, MA 02139, USA Abstract The mechanical deformation characteristics of living cells are known to inuence strongly their chemical and biological functions and the onset, progression and consequences of a number of human diseases. The mechanics of the human red blood cell (erythrocyte) subjected to large deformation by optical tweezers forms the subject of this paper. Video photography of the cell deformed in a phosphate buered saline solution at room temperature during the imposition of controlled stretching forces, in the tens to several hundreds picoNewton range, is used to assess experimentally the deformation characteristics. The mechanical responses of the cell during loading and upon release of the optical force are then analysed to extract the elastic properties of the cell membrane by recourse to several dierent constitutive formulations of the elastic and viscoelastic behavior within the framework of a fully three-dimensional nite element analysis. A parametric study of various geometric, loading and structural factors is also undertaken in order to develop quantitative models for the mechanics of deformation by means of optical tweezers. The outcome of the experimental and computational analyses is then compared with the information available on the mechanical response of the red blood cell from other independent experimental techniques. Potential applications of the optical tweezers method described in this paper to the study of mechanical deformation of living cells under dierent stress states and in response to the progression of some diseases are also highlighted. ? 2003 Elsevier Ltd. All rights reserved. Keywords: Human red blood cell membrane; Large deformation; Optical tweezers; Shear modulus; Bending stiness; Hyperelasticity; Computational model Video clips (see movies 1–3) of the optical trap experiments on the red blood cell showing large deformation and video clips of three-dimensional computational simulations of the biconcave cell membranes subjected to large deformation can be viewed at the supplementary material available along with the electronic archive of this paper. ∗ Corresponding author. Tel.: 617-253-3320; fax: 617-253-0868. E-mail address: [email protected] (S. Suresh). 0022-5096/$ - see front matter ? 2003 Elsevier Ltd. All rights reserved. doi:10.1016/j.jmps.2003.09.019
-
Upload
nguyenkhuong -
Category
Documents
-
view
215 -
download
0
Transcript of Mechanics of the human red blood cell deformed by optical...

Journal of the Mechanics and Physics of Solids51 (2003) 2259–2280
www.elsevier.com/locate/jmps
Mechanics of the human red blood cell deformedby optical tweezers�
M. Daoa, C.T. Limb, S. Suresha;c;∗aDepartment of Materials Science and Engineering, Massachusetts Institute of Technology,
77 Massachusetts Avenue, Cambridge, MA 02139, USAbDivision of Bioengineering and Department of Mechanical Engineering, The National University of
Singapore, 9 Engineering Drive 1, Singapore 117576, SingaporecDepartment of Mechanical Engineering, Massachusetts Institute of Technology, 77 Massachusetts
Avenue, Cambridge, MA 02139, USA
Abstract
The mechanical deformation characteristics of living cells are known to in.uence strongly theirchemical and biological functions and the onset, progression and consequences of a number ofhuman diseases. The mechanics of the human red blood cell (erythrocyte) subjected to largedeformation by optical tweezers forms the subject of this paper. Video photography of the celldeformed in a phosphate bu1ered saline solution at room temperature during the impositionof controlled stretching forces, in the tens to several hundreds picoNewton range, is used toassess experimentally the deformation characteristics. The mechanical responses of the cell duringloading and upon release of the optical force are then analysed to extract the elastic propertiesof the cell membrane by recourse to several di1erent constitutive formulations of the elastic andviscoelastic behavior within the framework of a fully three-dimensional 5nite element analysis. Aparametric study of various geometric, loading and structural factors is also undertaken in order todevelop quantitative models for the mechanics of deformation by means of optical tweezers. Theoutcome of the experimental and computational analyses is then compared with the informationavailable on the mechanical response of the red blood cell from other independent experimentaltechniques. Potential applications of the optical tweezers method described in this paper to thestudy of mechanical deformation of living cells under di1erent stress states and in response tothe progression of some diseases are also highlighted.? 2003 Elsevier Ltd. All rights reserved.
Keywords: Human red blood cell membrane; Large deformation; Optical tweezers; Shear modulus; Bendingsti1ness; Hyperelasticity; Computational model
� Video clips (see movies 1–3) of the optical trap experiments on the red blood cell showing largedeformation and video clips of three-dimensional computational simulations of the biconcave cell membranessubjected to large deformation can be viewed at the supplementary material available along with the electronicarchive of this paper.
∗ Corresponding author. Tel.: 617-253-3320; fax: 617-253-0868.E-mail address: [email protected] (S. Suresh).
0022-5096/$ - see front matter ? 2003 Elsevier Ltd. All rights reserved.doi:10.1016/j.jmps.2003.09.019

2260 M. Dao et al. / J. Mech. Phys. Solids 51 (2003) 2259–2280
1. Introduction
The deformation of human red blood cell (erythrocyte) has long been a topic ofconsiderable scienti5c interest and real-life signi5cance (see, for example, Evans andSkalak, 1980; Fung, 1993; Boal, 2002). The human red blood cell with a biconcaveshape and an average diameter of about 8 �m has a typical life span of 120 days duringwhich time it circulates through the human body nearly half a million times. During thecourse of its circulation, it undergoes severe elastic deformation as it passes throughnarrow capillaries whose inner diameter is as small as 3 �m. The ‘biconcave’ shapeof the red blood cell is transformed into a ‘bullet’ shape during blood .ow throughsmall capillaries, and the cell recovers fully to its original shape when the constraintor loading causing the shape change is released.Studies of the deformation characteristics of the human red blood cell and its mem-
brane have been of interest in the biomechanics literature for several reasons.
(1) The red blood cell has a relatively simple structure in that its membrane compris-ing the phospholipid bilayer with the intervening hydrophobic molecular networkcontains a .uid (cytosol) of 5xed volume and known viscosity. The red blood celldoes not contain a nucleus. Consequently, it has often been regarded as a “modelsystem” in the study of single living cells. In light of these considerations, themammalian red blood cell constitutes a convenient system for fundamental stud-ies of how cell membranes convert mechanical forces into biological responses,and how structural, chemical and biological signals and changes in the cell a1ectthe manner in which cell membranes detect, produce or support mechanical forces(e.g., Bao and Suresh, 2003).
(2) The simple, axisymmetric, biconcave shape of the red blood cell is relatively moreamenable to the development of detailed theoretical/computational models thanother cells of more complex geometry. Early studies of cell mechanics have mostlyvisualized the red cell as a thin elastic membrane which surrounds a viscous .uid(e.g., Hochmuth et al., 1979).
(3) The rounded disc shape of the red blood cell readily facilitates single cell me-chanical deformation experiments such as those involving micropipette aspirationor optical tweezers (see later discussion).
(4) Blood .ow in microcirculation is in.uenced signi5cantly by the deformability ofthe red blood cell which, in turn, is determined by such mechanical and geometricalfactors as the surface area, elasticity and viscosity of the cell membrane and thevolume and viscosity of the cytosol.
(5) There is a direct connection between the progression of certain inherited diseasesand the mechanical deformation characteristics of the red blood cell. Consider thecase of sickle cell disease which is caused by a defect in the haemoglobin struc-ture as a result of the substitution of thymine for adenine in the �-globin gene,and the attendant encoding of valine instead of glutamic acid in the sixth positionof the haemoglobin �-chain (Platt, 1995). As a consequence of this abnormalityhaemoglobin, which transports oxygen to the organs and tissues in the body, clus-ters episodically. The shape of the red cell is altered and its deformability and

M. Dao et al. / J. Mech. Phys. Solids 51 (2003) 2259–2280 2261
biorheology (ability to be transported through the blood vessels normally) are ad-versely a1ected. This can result in severe pain as the tissues surrounding the bloodvessels receive insuHcient oxygen.
(6) It is now realized that the red blood cell can serve as the site for the maturationof intracellular parasites which can lead to the progression of fatal diseases bya1ecting the mechanical deformation and functional properties of the cell itself.Consider the case of malaria, the most widespread parasitic disease of humans thatclaims the lives of some 2–3 million people annually. This disease is caused bythe protozoa of the genus Plasmodium Falciparum (see, for a review, Cooke et al.,2001). The structure of the cell cytoplasm, the shape of the cell and the molecularconstitution of its membrane are altered during the maturation of the parasite in thecell so that red blood cell progressively loses its ability to undergo large deforma-tion (Glenister et al., 2002; Lim et al., 2003); furthermore, the adhesiveness of thered cell with other cells, such as the vascular endothelium, is also increased (Cookeet al., 2001). Interestingly, patients with sickle cell disease exhibit resistance tomalaria.
Characterization of deformation of red blood cell has been achieved through a varietyof experimental techniques. Most common among these methods is the micropipette as-piration technique (Evans, 1973; Hochmuth et al., 1973; Hochmuth and Waugh, 1987),in which the stepwise increase of a suction pressure causes the cell to be drawn intoa glass tube, whose inner diameter, in conjunction with the aspiration pressure, can beappropriately chosen so as to control the extent of deformation. The pressure is heldover a certain duration during which the deformation of the cell is recorded by meansof optical microscopy. The method can also be used, under appropriate conditions, toassess the viscoelastic relaxation characteristics of the cell upon release of the aspira-tion pressure. By matching the experimentally observed geometry changes of the wholecell for given loading and con5gurational parameters of the experiment with theoret-ically predicated responses, the elastic modulus, viscosity and characteristic time forrelaxation of the cell membrane can be extracted from such experiments (Evans andSkalak, 1980). With recent advances in micromechanical and nanomechanical charac-terization tools which can monitor/impose force and displacement to a resolution onthe order of picoNewton (10−12 N) and nm (10−9 m), respectively, there is a constantsearch for additional experimental tools which can provide further insights into themechanical deformation characteristics of living cells (see Van Vliet et al., 2003, for acomprehensive review). In particular, there is a continual need to develop new exper-imental methods that are capable of imposing widely di1ering stress states on livingcells in a controlled mode and with high precision, so that the multiaxial deformationcharacteristics of single cells and membranes in a .uid environment can be accuratelycaptured.Development of experimental techniques based on optical or laser traps (also com-
monly referred to as optical or laser tweezers) has facilitated mechanical deformationof whole biological cells at forces ranging from tens to hundreds of pN. This techniqueis predicated on the phenomenon that upon passing through a high-refractive-index di-electric object, the photons from the laser beam undergo a change in momentum which
2262 M. Dao et al. / J. Mech. Phys. Solids 51 (2003) 2259–2280
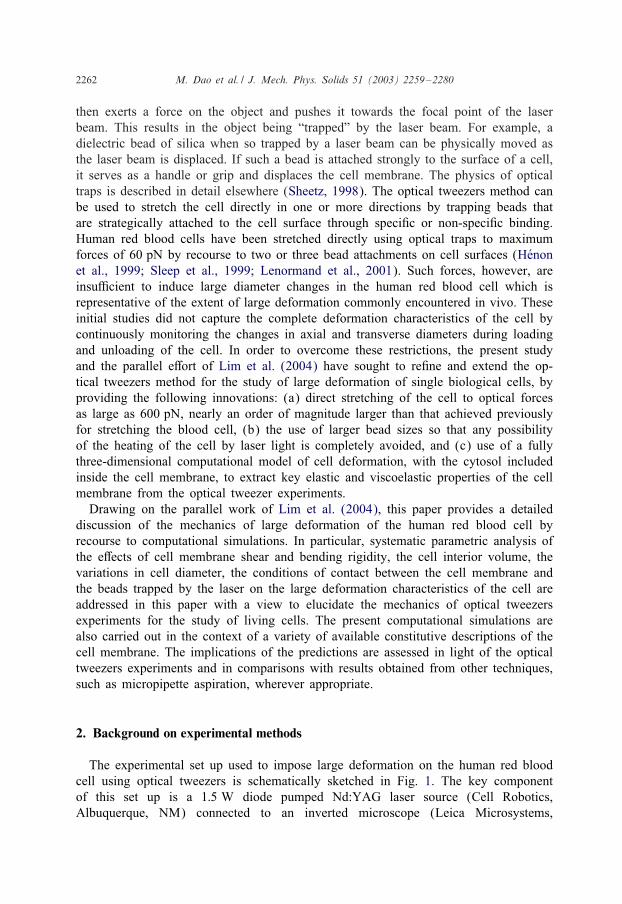
then exerts a force on the object and pushes it towards the focal point of the laserbeam. This results in the object being “trapped” by the laser beam. For example, adielectric bead of silica when so trapped by a laser beam can be physically moved asthe laser beam is displaced. If such a bead is attached strongly to the surface of a cell,it serves as a handle or grip and displaces the cell membrane. The physics of opticaltraps is described in detail elsewhere (Sheetz, 1998). The optical tweezers method canbe used to stretch the cell directly in one or more directions by trapping beads thatare strategically attached to the cell surface through speci5c or non-speci5c binding.Human red blood cells have been stretched directly using optical traps to maximumforces of 60 pN by recourse to two or three bead attachments on cell surfaces (HKenonet al., 1999; Sleep et al., 1999; Lenormand et al., 2001). Such forces, however, areinsuHcient to induce large diameter changes in the human red blood cell which isrepresentative of the extent of large deformation commonly encountered in vivo. Theseinitial studies did not capture the complete deformation characteristics of the cell bycontinuously monitoring the changes in axial and transverse diameters during loadingand unloading of the cell. In order to overcome these restrictions, the present studyand the parallel e1ort of Lim et al. (2004) have sought to re5ne and extend the op-tical tweezers method for the study of large deformation of single biological cells, byproviding the following innovations: (a) direct stretching of the cell to optical forcesas large as 600 pN, nearly an order of magnitude larger than that achieved previouslyfor stretching the blood cell, (b) the use of larger bead sizes so that any possibilityof the heating of the cell by laser light is completely avoided, and (c) use of a fullythree-dimensional computational model of cell deformation, with the cytosol includedinside the cell membrane, to extract key elastic and viscoelastic properties of the cellmembrane from the optical tweezer experiments.Drawing on the parallel work of Lim et al. (2004), this paper provides a detailed
discussion of the mechanics of large deformation of the human red blood cell byrecourse to computational simulations. In particular, systematic parametric analysis ofthe e1ects of cell membrane shear and bending rigidity, the cell interior volume, thevariations in cell diameter, the conditions of contact between the cell membrane andthe beads trapped by the laser on the large deformation characteristics of the cell areaddressed in this paper with a view to elucidate the mechanics of optical tweezersexperiments for the study of living cells. The present computational simulations arealso carried out in the context of a variety of available constitutive descriptions of thecell membrane. The implications of the predictions are assessed in light of the opticaltweezers experiments and in comparisons with results obtained from other techniques,such as micropipette aspiration, wherever appropriate.
2. Background on experimental methods
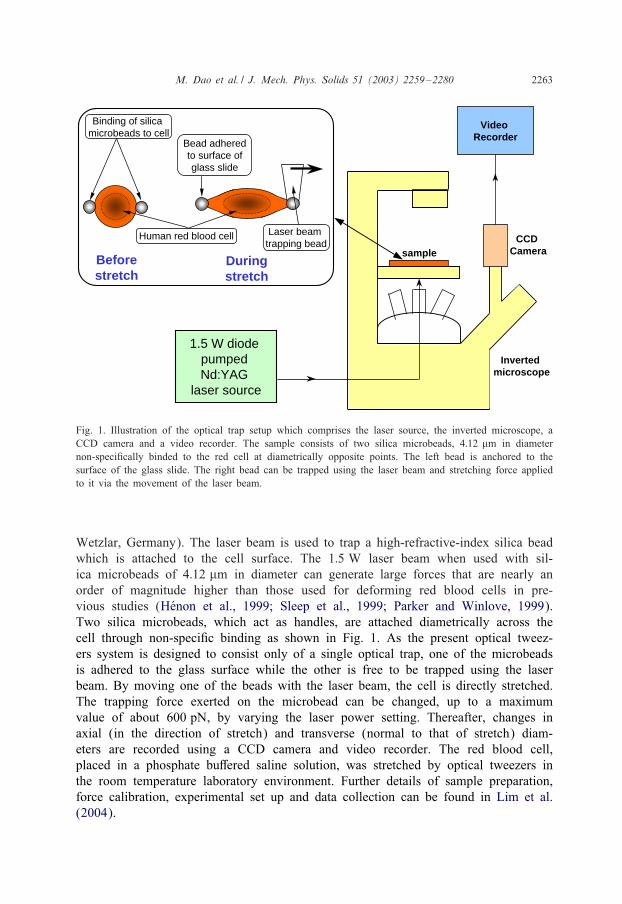
The experimental set up used to impose large deformation on the human red bloodcell using optical tweezers is schematically sketched in Fig. 1. The key componentof this set up is a 1:5 W diode pumped Nd:YAG laser source (Cell Robotics,Albuquerque, NM) connected to an inverted microscope (Leica Microsystems,
M. Dao et al. / J. Mech. Phys. Solids 51 (2003) 2259–2280 2263
Inverted microscope
1.5 W diode pumped Nd:YAG
laser source
CCD Camerasample
Video Recorder
Before stretch
Duringstretch
Human red blood cell
Bead adhered to surface of glass slide
Binding of silica microbeads to cell
Laser beam trapping bead
Fig. 1. Illustration of the optical trap setup which comprises the laser source, the inverted microscope, aCCD camera and a video recorder. The sample consists of two silica microbeads, 4:12 �m in diameternon-speci5cally binded to the red cell at diametrically opposite points. The left bead is anchored to thesurface of the glass slide. The right bead can be trapped using the laser beam and stretching force appliedto it via the movement of the laser beam.
Wetzlar, Germany). The laser beam is used to trap a high-refractive-index silica beadwhich is attached to the cell surface. The 1:5 W laser beam when used with sil-ica microbeads of 4:12 �m in diameter can generate large forces that are nearly anorder of magnitude higher than those used for deforming red blood cells in pre-vious studies (HKenon et al., 1999; Sleep et al., 1999; Parker and Winlove, 1999).Two silica microbeads, which act as handles, are attached diametrically across thecell through non-speci5c binding as shown in Fig. 1. As the present optical tweez-ers system is designed to consist only of a single optical trap, one of the microbeadsis adhered to the glass surface while the other is free to be trapped using the laserbeam. By moving one of the beads with the laser beam, the cell is directly stretched.The trapping force exerted on the microbead can be changed, up to a maximumvalue of about 600 pN, by varying the laser power setting. Thereafter, changes inaxial (in the direction of stretch) and transverse (normal to that of stretch) diam-eters are recorded using a CCD camera and video recorder. The red blood cell,placed in a phosphate bu1ered saline solution, was stretched by optical tweezers inthe room temperature laboratory environment. Further details of sample preparation,force calibration, experimental set up and data collection can be found in Lim et al.(2004).

2264 M. Dao et al. / J. Mech. Phys. Solids 51 (2003) 2259–2280
3. Theoretical background and computational model
3.1. Constitutive response
As illustrated in Fig. 2(a), the human red blood cell membrane comprises the phos-pholipid bilayer, the underlying spectrin network and transmembrane proteins. The(composite) cell membrane structure is commonly modelled as an incompressible ef-fective continuum, Fig. 2(b). Evans (1973) suggested that the relationship between themembrane shear stress Ts (in units of force per unit length) and deformation is of theform:
Ts = 2��s =�2(�21 − �22); (1a)
Ts =12(T1 − T2) and �s ≡ 1
2(�1 − �2) = 1
4(�21 − �22); (1b)
�1�2 = 1; (1c)
where T1 and T2 are the in-plane principal membrane stresses, �1 and �2 are the in-planeprincipal Green’s strains of the membrane, �1 and �2 are the principal stretch ratios,� is the membrane shear modulus (assumed to be constant and expressed in unitsof force per unit length) and �s is the shear strain. Note that Eq. (1c) re.ects theassumption that the total membrane area is constant during deformation. For the case
(a)
(b)
Effective Continuum Material
In-plane shear modulus: µBending stiffness: B
membrane thickness: h0
Spectrin network
Transmembraneproteins
Human Red Blood Cell Membrane Structure
Lipid bilayer
Fig. 2. Illustration of the e1ective continuum shell model. (a) The human red blood cell membrane structurecomprises the lipid bilayer, the spectrin network and transmembrane proteins. (b) The (composite) cellmembrane structure is modelled using a hyperelastic e1ective continuum material.

M. Dao et al. / J. Mech. Phys. Solids 51 (2003) 2259–2280 2265
of uniform deformation, the ratios of the current diameter to the initial diameter inthe axial and transverse directions of the cell correspond approximately to the stretchratios �1 and �2, respectively. However, for the experiments using the micropipetteaspiration and optical trap techniques, the deformation is nonuniform. The constitutivemodel described in Eq. (1) has been used for interpreting the mechanical response ofthe red blood cell in numerous experimental studies conducted using the micropipetteaspiration technique (Evans, 1973; Evans and Skalak, 1980).Large deformation response of the red blood cell has also been analyzed using other
variations of such continuum constitutive models. One such approach is predicated onuse of a hyperelastic e1ective material model (Lim et al., 2004). The simplest 5rstorder formulation in this case is the incompressible (constant volume) neo-Hookeanform where the strain energy potential function (Simo and Pister, 1984) is given by
U =G0
2(�21 + �
22 + �
23 − 3); (2)
where G0 is the initial bulk shear modulus, and �i (i=1; 2; 3) are the principal stretches.If the membrane is assumed to be incompressible, �1�2�3 = 1. The potential functionin Eq. (2) de5nes the nonlinear elastic stress–strain behavior. The neo-Hookean hy-perelastic potential is known to be reasonably accurate when the maximum strain ison the order of 100%. For a hyperelastic thin membrane subjected to uniaxial stretch(T2 = 0), the uniaxial membrane stress T1 can be derived from Eq. (2),
T1 = h@U@�1
= G0h0(�1:51 − �−1:51 ); (3)
where h is the current membrane thickness, and h0 is the initial membrane thickness.Therefore, under uniaxial stretch the membrane shear stress is
Ts =12(T1 − T2) = G0h0
2(�1:51 − �−1:5
1 ) (4)
and the (instantaneous) membrane shear modulus � is given as
�(�1) =12@Ts@�s
=3G0h0(�0:51 + �−2:5
1 )
4(�1 + �−31 )
: (5)
From Eq. (5), the initial in-plane membrane shear modulus is found to be �0=0:75G0h0.Fig. 3(a) schematically shows the shear stress versus shear strain response of such aneo-Hookean hyperelastic material during uniaxial stretch. The membrane shear mod-ulus typically decreases from its initially high value, �0, to a relatively smaller value,�l, at larger strains, before attaining a higher value, �f , again prior to 5nal failure. Theslope of the membrane shear stress (Ts) versus shear strain (2�s) is therefore a de-creasing function of shear strain from the initial to the intermediate region, as shown inFig. 2(b). For the simple 5rst order neo-Hookean material formulated in Eq. (2), onlythe 5rst stage (�0) and the second stage (�l) are present. Speci5cally, �l is taken here ata relatively large stretch ratio of �1=3 under uniaxial tension. As shown later, the strainvalues introduced in the cell membrane during large deformation in the present opticaltrap experiments correspond to the intermediate region of the stress–strain curve in

2266 M. Dao et al. / J. Mech. Phys. Solids 51 (2003) 2259–2280
Shear Strain (2γs)
Mem
bran
eS
hear
Str
ess
µ0
µl
µf µ0
µlMem
bran
eS
hear
Mod
ulus
(a) (b) Shear Strain (2γs)
Fig. 3. Schematic illustration of the hyperelastic constitutive response used in some of the computationalsimulations. (a) Uniaxial stress–strain response. (b) The variation of the membrane shear modulus with theprogression of deformation in the early region and in the in-between region, where strains are representativeof the large deformation response achieved in the present optical tweezer experiments. The 5nal deformationregime with the shear modulus of �f is not shown in this 5gure.
Fig. 3(a) where the membrane shear modulus is close to �l. Therefore, the presentanalysis does not include the deformation response indicated by the dashed line inFig. 3(a) (i.e., that corresponding to the 5nal shear modulus, �f ). When the constantmembrane area constraint, i.e. the condition that �1�2 = 1 (with the third principalstretch, �3 = 1) is enforced in Eq. (2), the constitutive description of Eq. (2) becomesequivalent to that of Eq. (1), where the in-plane membrane shear modulus stays at aconstant value of � = G0h0 throughout the entire deformation history.
For a thin shell structure, the key parameters of interest in the characterization oflarge deformation are the in-plane shear modulus � and the bending modulus B. Forthe accepted range of literature values of B0 = 1:7 × 10⁻¹⁹–7 × 10⁻¹⁹ N m for thehuman red blood cell (Evans, 1983; Sleep et al., 1999), our simulations indicate thatthe force required to produce a given stretch ratio in the axial or transverse directionvaried by less than 5%, when stretching force was larger than 50 pN. Therefore, onlythe results obtained using a typical value of B0 = 2 × 10⁻¹⁹ N m are presented here.In conducting the parameter studies, the initial shear modulus value �0 can be chosen5rst. This subsequently determines the uniaxial large strain membrane shear modulus�l. By incrementally varying the values of �0 (as well as �l), the closest 5t to theexperimental axial and transverse diameters during large deformation stretch determinesthe estimated membrane shear modulus value.The cytosol is assumed to be a .uid which acts to preserve the interior volume (V0)
of the red blood cell during deformation as well as to maintain the even distributionof the internal (hydraulic) .uid pressure (p) on the inner membrane surface, i.e.
V (t) = V0 and pe(t) = p(t); (6)
where V (t) is the current cell interior volume and pe(t) is the normal pressure actingon the internal surface of each shell element (cell membrane) of the 5nite elementmesh at any instantaneous time t. The viscous energy dissipation of the cytoplasm

M. Dao et al. / J. Mech. Phys. Solids 51 (2003) 2259–2280 2267
within the red cell 5lled with concentrated haemoglobin solution is known to be twoorders of magnitude smaller than that of the membrane (Evans and Hochmuth, 1976).The viscosity of the cytosol can therefore be ignored. In order to explore possiblee1ects of cell membrane permeability, companion computations without cytosol werealso carried out in the present work.
3.2. Computational model
Evans and Fung (1972) estimated the shape of human red blood cells and an averagebiconcave shape function was given as
Z =±0:5R0
[1− X 2 + Y 2
R20
] 12[C0 + C1
X 2 + Y 2
R20+ C2
(X 2 + Y 2
R20
)2]; (7a)
R0 = 3:91 �m; C0 = 0:207161; C1 = 2:002558; and
C2 =−1:122762; (7b)
where 2R0 is the average cell diameter in the axial direction. Di1erent initial cell di-ameter values ranging from 7 to 8:5 �m in Eq. (7) can be explored to investigatethe e1ect of cell size variations. Fig. 4(a) shows the original equilibrium shape of thethree-dimensional biconcave model of the red blood cell constructed using the dimen-sions speci5ed in Eq. (7). The stretching force is applied to the silica microbeads whichare attached diametrically at opposite ends of the cell. The silica beads are modelledas rigid spheres and are assumed to be attached to the cell over a small oval regionwith a diameter of between 1 and 2 �m so that the 5nal contact conditions could beproperly simulated. Because of symmetry, it suHces to model only half of the redblood cell. Fig. 4(b) shows the original mesh of the biconcave model which contains12,000 three-dimensional shell elements. Four-noded, bilinear, reduced integration shellelements are used. The simulations have been performed using the commercially avail-able general purpose 5nite element package, ABAQUS (ABAQUS, 2002). Fig. 4(c)shows an axisymmetric spherical shell model which was used for some simulations inan attempt to develop a basis for comparison with the results derived from the morerealistic biconcave cell model. Another reason for performing additional simulationswith the spherical shell model is that some recent studies (Parker and Winlove, 1999)on small deformation of red cells using optical traps invoked analysis of spherical ge-ometry in the interpretation of experiments. Thus, the trends extracted from the presentwork could be systematically compared with prior studies. Similar to the case of thebiconcave model, the silica beads are assumed to be attached to the spherical cell overa small circular region with diameter between 1 and 2 �m. Computations using thered cell model with and without the cytosol were performed. All the results presentedbelow in the parametric studies pertain to conditions where the cytosol is included inthe computational simulations, unless speci5ed otherwise.
2268 M. Dao et al. / J. Mech. Phys. Solids 51 (2003) 2259–2280
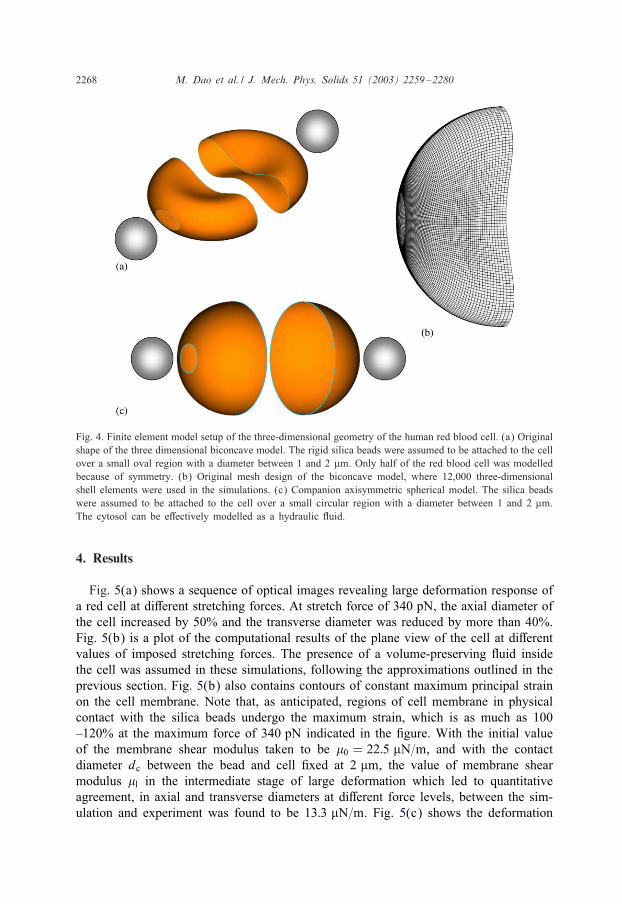
Fig. 4. Finite element model setup of the three-dimensional geometry of the human red blood cell. (a) Originalshape of the three dimensional biconcave model. The rigid silica beads were assumed to be attached to the cellover a small oval region with a diameter between 1 and 2 �m. Only half of the red blood cell was modelledbecause of symmetry. (b) Original mesh design of the biconcave model, where 12,000 three-dimensionalshell elements were used in the simulations. (c) Companion axisymmetric spherical model. The silica beadswere assumed to be attached to the cell over a small circular region with a diameter between 1 and 2 �m.The cytosol can be e1ectively modelled as a hydraulic .uid.
4. Results
Fig. 5(a) shows a sequence of optical images revealing large deformation response ofa red cell at di1erent stretching forces. At stretch force of 340 pN, the axial diameter ofthe cell increased by 50% and the transverse diameter was reduced by more than 40%.Fig. 5(b) is a plot of the computational results of the plane view of the cell at di1erentvalues of imposed stretching forces. The presence of a volume-preserving .uid insidethe cell was assumed in these simulations, following the approximations outlined in theprevious section. Fig. 5(b) also contains contours of constant maximum principal strainon the cell membrane. Note that, as anticipated, regions of cell membrane in physicalcontact with the silica beads undergo the maximum strain, which is as much as 100–120% at the maximum force of 340 pN indicated in the 5gure. With the initial valueof the membrane shear modulus taken to be �0 = 22:5 �N=m, and with the contactdiameter dc between the bead and cell 5xed at 2 �m, the value of membrane shearmodulus �l in the intermediate stage of large deformation which led to quantitativeagreement, in axial and transverse diameters at di1erent force levels, between the sim-ulation and experiment was found to be 13:3 �N=m. Fig. 5(c) shows the deformation

M. Dao et al. / J. Mech. Phys. Solids 51 (2003) 2259–2280 2269
Fig. 5. Large deformation of the stretched red blood cell loaded from 0 to 340 pN. (a) Experimentalobservations. (b) Computed contour maps (plan view) of the constant maximum principal strain distribution(simulations with cytosol). (c) One half of the full three-dimensional biconcave shape of the erythrocyte atdi1erent loading forces (with cytosol). (d) Computed contour maps (plan view) of the constant maximumprincipal strain distribution (simulations without cytosol). (e) One half of the full three-dimensional biconcaveshape of the erythrocyte at di1erent loading forces (without cytosol). All simulations were performed with�0 = 22:5 �N=m (the corresponding �l = 13:3 �N=m).
of the three-dimensional biconcave shape (half model view) in response to di1erentloading forces. It is clear from this 5gure that the cell geometry accommodates largedeformation during unidirectional stretch by the folding of the membrane. The singlecamera view used to record the experimental images did not facilitate clear documen-tation of such folding during the optical trap experiment. However, the existence ofa shaded region in the interior of the cell during large deformation stretching experi-ments (which can be viewed in the video images posted in the supplementary materialavailable electronically along with this paper) appears to suggest possible occurrenceof such folding.
4.1. Parametric analyses
Figs. 5(d) and (e) show computational results of the corresponding plan view andhalf-cell three-dimensional view of the cell deformed at di1erent forces by invokingthe rather hypothetical assumption that the cell interior does not contain any .uid.

2270 M. Dao et al. / J. Mech. Phys. Solids 51 (2003) 2259–2280
0
2
4
6
8
10
12
14
16
18
0 50 100 150 200 250 300 350 400 450Stretching Force (pN)
Dia
me
ter
(µm
) Axial diameter
Transverse diameter
ExperimentsSimulation (with cytosol)Simulation (without cytosol)
Fig. 6. Experimental and computational force versus displacement curves. The black line with error baris the experimental observation. The solid and dashed lines are the computational predictions of the celldiameters using an in-plane shear modulus of �l = 13:3 �N=m (with �0 = 22:5 �N=m), simulated with andwithout cytosol, respectively. Both the axial and transverse diameters are computed. The cytosol is seenhaving limited e1ect on the mechanical properties of the cell structure under large deformation uniaxialstretch, especially along the axial direction.
The absence of the cytosol is found to a1ect only slightly the axial and transversediameters of the cell at di1erent force levels. However, Fig. 5(e) suggests that withoutthe cytosol, the centre of the biconcave disk “caves in”, with the top membrane touchingthe bottom at higher stretching forces. This is not the case for the model with cytosolas shown in Fig. 5(c) where there is never any contact between di1erent parts of thecell membrane. The results of computer simulations of the optical tweezer experimentsthus illustrate how the cytosol serves to maintain the internal cell volume and precludescontact between di1erent parts of the cell.A quantitative comparison of predicted and measured changes in axial and transverse
diameters of the red cell is provided in Fig. 6 for simulations with and without cytosol.This 5gure also shows the experimentally measured changes in axial and transversediameters of the red cell at di1erent stretching forces, along with the typical scatter inexperimental data estimated from at least eight di1erent experiments for each load. Theresponses observed for the change in axial diameters for models with or without cytosolwere very close. However, for changes in the transverse diameter, the response wassti1er for the model with cytosol. The results indicate that for uniaxial direct stretchexperiments, the incompressible cytosol contributes little to the axial deformability ofthe cell but has an important e1ect for deformation in the transverse direction.In order to explore, in a parametric manner, the e1ect of varying the membrane
shear modulus on cell deformation with optical tweezers, additional simulations wereperformed with two di1erent initial values of �0: 18.8 and 30 �N=m. For these twocases, the membrane shear modulus �l in the large deformation range in Fig. 3 was

M. Dao et al. / J. Mech. Phys. Solids 51 (2003) 2259–2280 2271
Fig. 7. Variation of measured axial and transverse diameter (solid line with scatter band) of red cell againststretching force of optical tweezers during large deformation. The solid and dotted lines represent computa-tional predictions for the axial/transverse diameter with �l=11:1 and 17:7 �N=m (the corresponding �0=18:8and 30 �N=m), respectively, invoking the hyperelastic constitutive response, Eq. (2), and assuming constantcell interior volume. The computational model uses the three-dimensional biconcave disk with a contactdiameter of 2 �m. Also shown are the predictions of simulations assuming both constant membrane areaand constant cell interior volume, represented by long dashed lines, using the model given by Eq. (1).
chosen such that the experimental trends of changes in axial and transverse diametersas functions of the variations in stretching force were both matched by computationalpredictions. The resulting values of �l were found to be 11.1 and 17:7 �N=m, respec-tively, for �0 = 18:8 and 30 �N=m. The contact size dc was again taken to be 2 �m.Comparisons of predicted and measured changes in axial and transverse diameters ofthe cell are plotted in Fig. 7. Simulations performed using �l of 11.1 and 17:7 �N=mwere able to encompass the experimental trends reasonably well over the full range oflarge deformation, but less so for axial diameter at small deformations.The in-plane shear modulus range, �l =11:1–17:7 �N=m, estimated from our analysis
using the constitutive description of Eq. (2) for large deformation with optical tweezerscompares with the range of 6–10 �N=m estimated previously from micropipette aspira-tion experiments (Evans and Skalak, 1980; Fung, 1993). Alternatively, if we invoke theconstitutive response given in Eq. (1) with constant area for the cell membrane in ourthree-dimensional computational simulation, the present optical tweezers experimentaldata can be matched by the choice of a 5xed value of the membrane shear modulus,�0 =�l =�f = 20 �N=m over most of the variations in axial and transverse diameter ofthe cell with the applied force (see Fig. 7). It should be considered that the stress state,loading mode and experimental artefacts (e.g., friction between the cell membrane andthe micropipette walls in the aspiration experiments versus the contact loading at theopposite ends of the cell in the tweezers method) are very di1erent in the two cases.It is also interesting to note that Sleep et al. (1999) reported shear modulus values
2272 M. Dao et al. / J. Mech. Phys. Solids 51 (2003) 2259–2280
280 pN
340 pN
145 pN
Simulations with cytosol Simulations without cytosol
µ l = 13.3 µN/m
µ0 = 22.5 µN/m
17.7 µN/m
30 µN/m
13.3 µN/m
22.5 µN/m
11.1 µN/m
18.8 µN/m
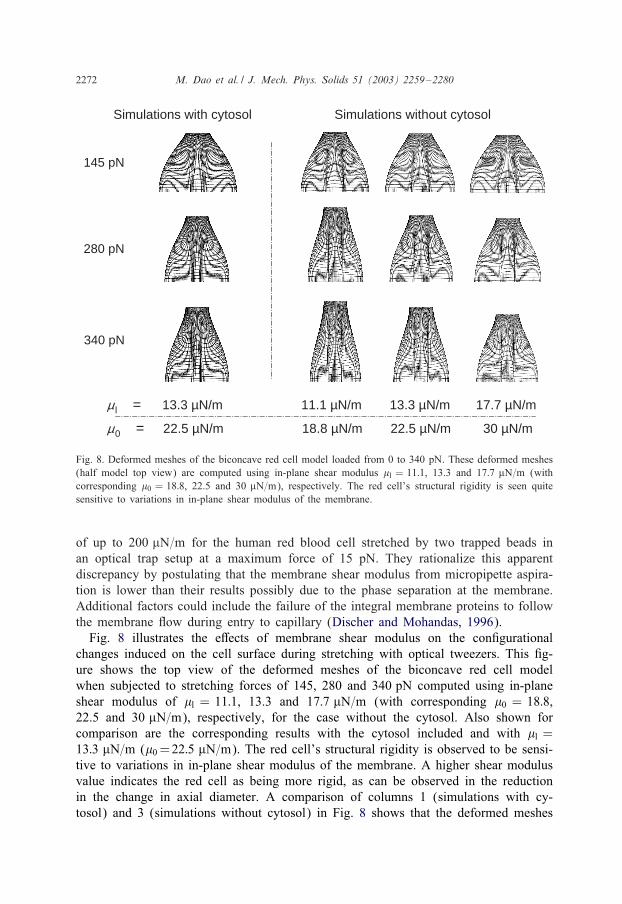
Fig. 8. Deformed meshes of the biconcave red cell model loaded from 0 to 340 pN. These deformed meshes(half model top view) are computed using in-plane shear modulus �l = 11:1, 13.3 and 17:7 �N=m (withcorresponding �0 = 18:8, 22.5 and 30 �N=m), respectively. The red cell’s structural rigidity is seen quitesensitive to variations in in-plane shear modulus of the membrane.
of up to 200 �N=m for the human red blood cell stretched by two trapped beads inan optical trap setup at a maximum force of 15 pN. They rationalize this apparentdiscrepancy by postulating that the membrane shear modulus from micropipette aspira-tion is lower than their results possibly due to the phase separation at the membrane.Additional factors could include the failure of the integral membrane proteins to followthe membrane .ow during entry to capillary (Discher and Mohandas, 1996).Fig. 8 illustrates the e1ects of membrane shear modulus on the con5gurational
changes induced on the cell surface during stretching with optical tweezers. This 5g-ure shows the top view of the deformed meshes of the biconcave red cell modelwhen subjected to stretching forces of 145, 280 and 340 pN computed using in-planeshear modulus of �l = 11:1, 13.3 and 17:7 �N=m (with corresponding �0 = 18:8,22.5 and 30 �N=m), respectively, for the case without the cytosol. Also shown forcomparison are the corresponding results with the cytosol included and with �l =13:3 �N=m (�0 =22:5 �N=m). The red cell’s structural rigidity is observed to be sensi-tive to variations in in-plane shear modulus of the membrane. A higher shear modulusvalue indicates the red cell as being more rigid, as can be observed in the reductionin the change in axial diameter. A comparison of columns 1 (simulations with cy-tosol) and 3 (simulations without cytosol) in Fig. 8 shows that the deformed meshes

M. Dao et al. / J. Mech. Phys. Solids 51 (2003) 2259–2280 2273
0
2
4
6
8
10
12
14
16
18
0 50 100 150 200 250 300 350 400 450Stretching Force (pN)
Dia
me
ter
(µm
) Axial diameter
Transverse diameter
ExperimentsCell Diameter D = 8.5 µmCell Diameter D = 7.82 µmCell Diameter D = 7 µm
µl = 13.3 µN/mµ0 = 22.5 µN/m
Fig. 9. The predicted e1ects of varying the cell diameter D from 7, 7.82 to 8:5 �m, respectively. The axialdiameter is found rather sensitive to the variations in cell diameter, while the transverse diameter is muchless sensitive to the same variations in cell diameter. The result provides an explanation for the much widerscattering in axial response observed experimentally.
modelled with or without cytosol are quite similar, except that the transverse rigid-ity is considerably increased with the cytosol, consistent with the results plotted inFigs. 5 and 6.In order to study the e1ect of the cell size variations, calculations were carried out
using three di1erent cell diameters, D=7:0, 7.82 and 8:5 �m, respectively. The in-planeshear modulus �l was chosen to be 13:3 �N=m (with �0 =22:5 �N=m) and the contactsize dc was taken to be 2 �m. Fig. 9 shows the predicted e1ects of varying the celldiameter D from 7 to 8:5 �m. The axial diameter is found to be rather sensitive to thevariations in cell diameter, while the transverse diameter is less sensitive to the samevariations in cell diameter. The result provides an explanation for the much greaterscatter in the experimentally observed changes in axial diameter than in the trans-verse diameter (see the experimental data and their scatter in both axial and transversedirections in Figs. 6, 7 and 9).Taking the same set of mechanical properties of the membrane at �l = 13:3 �N=m
(with �0 =22:5 �N=m), and the same contact diameter at dc =2 �m, Fig. 10 comparesthe experimental data with the results obtained using the axisymmetric spherical modeland the biconcave model, both computed with cytosol. The initial diameter of thespherical cell model was taken to be the same as the biconcave model at 7:82 �m. Itis clear that the predicted axial diameter from the spherical model matches very wellwith that from the biconcave model as well as experiments. However, the sphericalmodel predicts a much sti1er response in the transverse direction as compared to thebiconcave model and experiments. Using the spherical model, one can easily matcheither the axial diameter or the transverse diameter by tuning the shear modulus, butit is not possible to match diameters in both directions well without using the moreappropriate biconcave model.

2274 M. Dao et al. / J. Mech. Phys. Solids 51 (2003) 2259–2280
0
2
4
6
8
10
12
14
16
18
0 50 100 150 200 250 300 350 400 450
Stretching Force (pN)
Dia
me
ter
(µm
) Axial diameter
Transverse diameter
ExperimentsBiconcave ModelSpherical Model
µl = 13.3 µN/mµ0 = 22.5 µN/m
Fig. 10. Comparison of the axisymmetric spherical model and the biconcave model with respect to theexperimental results. The predicted axial diameter from the spherical model matches excellently with thatfrom the corresponding biconcave model as well as the experimental curve. However, the spherical modelpredicted much more sti1 response in the transverse direction than the biconcave model when being comparedwith the experimental results.
Taking the initial cell diameter at 7:82 �m and the shear modulus at �l =13:3 �N=m(with �0 = 22:5 �N=m), this average biconcave cell shape has an internal volume ofVave=94:1 �m3 (Evans and Fung, 1972). Keeping the same membrane shell and 5llingthe internal cell volume with 75%, 100% and 125% of the cytosol Vave (assuming noair), the change in the axial and transverse diameters of the red cell that containdi1erent initial cell interior volumes were computed. The cell interior volume waskept at the initial value during the entire loading process (i.e. no .ow of cytosolacross membrane during stretching). Fig. 11 shows the predicted e1ects of varying thecell interior volume while assuming no .uid exchange across the cell membrane. Thevolume variation is seen to have little e1ect on the cell’s axial response. However,adding or subtracting 25% of the volume of the cell e1ectively sti1ens or softens,respectively, the responses in the transverse diameter under direct uniaxial stretch.Parametric studies were also performed to consider the experimentally observed scat-
ter in terms of the contact diameter dc while still keeping the cell size at 7:82 �m andthe membrane shear modulus at �l = 13:3 �N=m (with �0 = 22:5 �N=m). Fig. 12(a)demonstrates that more compliant axial responses and almost identical transverse re-sponses are predicted when the contact diameter decreases from 2 to 1:5 �m and thento 1 �m. The result is again consistent with the much narrower scatter in the transverseresponse as observed experimentally. Fig. 12(b) shows the range of �l and �0 valuesextracted for the present optical tweezers experiments assuming di1erent values, dc,for the diameter of contact between the beads and the cell membrane. It is clear thatwhile there is a geometrical e1ect of contact size on the large deformation response,the appropriate range of shear modulus values estimated in Fig. 12(b) is not drastically

M. Dao et al. / J. Mech. Phys. Solids 51 (2003) 2259–2280 2275
0
2
4
6
8
10
12
14
16
18
0 50 100 150 200 250 300 350 400 450Stretching Force (pN)
Dia
mete
r (µ
m)
Axial diameter
Transverse diameter
Cell Interior Volume: 125%VaveCell Interior Volume: 100%VaveCell Interior Volume: 75%Vave
µl = 13.3 µN/mµ0 = 22.5 µN/m
Fig. 11. The predicted e1ects of varying cell interior volume. The cell interior volume is seen having limitede1ect on the cell’s axial response. However, adding or extracting 25 vol% internal .uid e1ectively sti1ensor softens respectively the transverse rigidity of the cell under direct uniaxial stretch.
altered by the particular choice of dc. In this respect, we note that prior studies of smalldeformation of human red blood cells using optical tweezers (HKenon et al., 1999; Sleepet al., 1999; Parker and Winlove, 1999) assumed essentially a point contact betweenthe beads and the cell membrane. It is evident that such an assumption can lead toa more pronounced variation in the shear modulus estimate than that extracted from5nite contact diameter simulations which match experiments more closely.
4.2. E7ect of the membrane viscosity
When the stretching force imposed by the optical tweezers is released at the pointof maximum deformation, the cell returns to its original shape. Using this relaxationresponse of the cell, the viscoelastic properties of the cell membrane can also be esti-mated. Adding the viscoelastic term to the constitutive behavior of the cell membrane,Eq. (1) or (4) can be modi5ed as (Evans and Hochmuth, 1976),
Ts = T 0s + 2�
@ ln �1@t
; tc =��; (8)
where T 0s is the membrane shear stress without taking the membrane viscosity into
account, and � is the coeHcient of surface viscosity of the cell membrane, t is time,and tc is the characteristic time for relaxation.
When the external stretching force by optical tweezers is released, i.e. T 0s = 0 in
Eq. (8), the characteristic time tc for the recovery of the red blood cell can be assessed

2276 M. Dao et al. / J. Mech. Phys. Solids 51 (2003) 2259–2280
0
2
4
6
8
10
12
14
16
18
20
0 50 100 150 200 250 300 350 400 450
Axial diameter
Transverse diameter
Experimentsdc = 2.0 µmdc = 1.5 µmdc = 1.0 µm
µl = 13.3 µN/mµ0 = 22.5 µN/m
0
2
4
6
8
10
12
14
16
18
0 50 100 150 200 250 300 350 400 450
Stretching Force (pN)
Stretching Force (pN)
Dia
mete
r (µ
m)
Dia
mete
r (µ
m)
Axial diameter
Transverse diameter
Experimentsdc = 2.0 µm; µl = 13.3 µN/m, µ0 = 22.5 µN/mdc = 1.5 µm; µl = 15.5 µN/m, µ0 = 26.3 µN/mdc = 1.0 µm; µl = 17.7 µN/m, µ0 = 30 µN/m
(a)
(b)
Fig. 12. The predicted e1ects of varying the contact diameter dc. (a) More compliant responses are observedwhen the contact diameter decreases from 2, 1.5 to 1 �m, respectively. (b) The range of �l and �0 valuesextracted for the present optical tweezers experiments assuming di1erent values, dc, for the diameter ofcontact between the beads and the cell membrane. It is clear that while there is a geometrical e1ect ofcontact size on the large deformation response, the appropriate range of shear modulus values estimated isnot drastically altered by the particular choice of dc.
by recourse to the simple expression proposed by Hochmuth et al. (1979):(�21 − 1)(�21;max + 1)
(�21 + 1)(�21;max − 1)= exp
(− ttc
); (9)
where �1;max is the initial (maximum) value of the stretch ratio of the red cell. Whenthe best 5t to the experimental data on cell relaxation from eight di1erent tests is made

M. Dao et al. / J. Mech. Phys. Solids 51 (2003) 2259–2280 2277
0
0.2
0.4
0.6
0.8
1
0 0.2 0.4 0.6 0.8 1 1.2 1.4
Time (s)
exp(
-t /
t c)
tc = 0.19 0.06 s (ave from 8 experiments)tc = 0.25 stc = 0.13 s
±
Fig. 13. Best 5t to the experimental relaxation data. Using relaxation data from eight di1erent experiments,the characteristic time were estimated to be tc = 0:19± 0:06 s using Eq. (9).
4
6
8
10
12
14
16
18
0 50 100 150 200 250 300 350 400 450
Stretching Force (pN)
Dia
met
er (
µm)
Axial diameter
ExperimentsSimulation (without viscosity)Simulation (with viscosity)
µl = 13.3 µN/mµ0 = 22.5 µN/m
Fig. 14. The e1ect of the membrane viscosity during loading stage assuming the upper bound values oftc = 0:25 s, � = 22:5 �N=m in Eq. (8), and a stretch rate �1 = 0:3 s−1.
using Eq. (9), the characteristic time is estimated to be tc = 0:19± 0:06 s. This rangeof values is slightly higher than the value of 0:1 ∼ 0:13 s estimated from micropipetteaspiration experiments (Chien et al., 1978; Hochmuth and Waugh, 1987). The loadingresponse can also be determined by incorporating the viscoelastic term on the right-handside of the second term of Eq. (8), by recourse to the three-dimensional computationalsimulation. Figs. 13 and 14 shows a comparison of the predicted changes in axialdiameter of the cell as a function of the stretching force, with and without the membrane
2278 M. Dao et al. / J. Mech. Phys. Solids 51 (2003) 2259–2280
viscosity term in Eq. (8). It is evident that the error caused by neglecting membraneviscosity during the loading stage is negligibly small. The transverse diameter change(not shown here) is also not in.uenced in any signi5cant manner because of theaddition of the viscoelastic correction term. Thus the results presented in Figs. 5–12appear to capture reasonably accurately the overall large deformation loading responseof the cell membrane even when the viscoelastic correction factor is ignored.
5. Concluding remarks
We have demonstrated, both in this paper and in our parallel recent work (Limet al., 2004), that optical tweezers can be used to investigate systematically the largedeformation characteristics of the human red blood cell in direct stretch. The presentpaper provides details of the mechanics of such deformation whereby parametric anal-yses of the e1ects of various geometric and material parameters could be examinedwithin the context of loading by means of optical tweezers. The forces through whichthe deformation is induced in this work are nearly an order of magnitude larger thanthose achieved previously on red blood cells with optical tweezers (HKenon et al.,1999; Sleep et al., 1999). The method demonstrated here for large deformation test-ing of living cells provides a potentially powerful new experimental tool, with forcecapabilities in the range of tens to hundreds of pN, which could complement othertechniques such as micropipette aspiration (Evans, 1973; Evans and Skalak, 1980) andatomic force microscopy (Rotsch et al., 1999; Wu et al., 2002). By facilitating directstretching of a biological cell to large strains in direct tension, the optical tweezersmethod provides the .exibility to explore the mechanical responses at stress states thatare signi5cantly di1erent from those possible with other techniques. In addition, the.exibility of the method to load the cell surface at multiple contact points by the appro-priate choice of the number, size and spatial distribution of the beads o1ers additionalcapabilities for mechanical testing.The experimental results obtained for the large deformation of red blood cells in
a phosphate bu1ered saline solution at room temperature have been analysed using avariety of constitutive models and within the framework of a fully three-dimensionalcomputational simulation. An outcome of the exercise is a quantitative assessment ofthe predictions of di1erent hyperelastic and viscoelastic constitutive formulations onthe overall deformation characteristics of the cell subjected to direct tensile stretch byoptical tweezers. Also assessed is the characteristic time for relaxation of the red bloodcell upon release of the applied force. These results, in conjunction with a wealth ofinformation available in the literature on the deformability of red blood cells probedby other techniques such as micropipette aspiration (see the preceding section), alsopoint to the possible e1ects of loading mode and stress state on the inferred mechanicalresponse.The constitutive models used in this study to extract mechanical properties of the cell
membrane have been predicated upon continuum analysis. It is clear from the presentsimulations that, even within the context of continuum analysis, the large deformationresponse is strongly in.uenced by a variety of parameters including the loading mode,
M. Dao et al. / J. Mech. Phys. Solids 51 (2003) 2259–2280 2279
contact conditions, geometry and assumed material constitutive characteristics. Recentapproaches to analyse large deformation response of red cell membranes (Boey et al.,1998; Discher et al., 1998) have also introduced molecular level models of the defor-mation of spectrin network in the cell membrane, within the context of Monte Carlosimulations. The results of these simulations were assessed in light of results obtainedfrom micropipette aspiration experiments where the modulus values were found to beconsistent with the experimentally extracted values (which were discussed earlier). Itshould also be recognized that models of cell membrane deformation alone do notcapture the dynamic structural changes that evolve in the cell interior. For example,the cytoskeleton could also constitute a structural basis for deformation, mechanicalsensing and mechanochemical transduction by providing a mechanical linkage fromthe extracellular matrix to the cell membrane to the cell interior (e.g., Maniotis et al.,1997).Ongoing experimental studies (Lim et al., 2003) have also revealed that the present
optical tweezers method can be successfully used to identify clearly the connectionsbetween red blood cell membrane deformability and the progression of certain types ofdiseases. In particular, direct stretch experiments involving optical tweezers of normalred blood cells and cells infested in a controlled manner with malaria parasites haverevealed quantitative correlations between loss of membrane deformability and exposureto the parasite, at force resolutions on the order of tens of picoNewtons. Such resultso1er appealing possibilities for further extensions of the present work for diagnosticsand drug treatment of diseases.
Acknowledgements
This work was supported by the Nano Biomechanics Laboratory in the Division ofBioengineering at the National University of Singapore, by the Singapore–MIT Al-liance, and by the Laboratory for Experimental and Computational Micromechanics atthe Massachusetts Institute of Technology.
References
ABAQUS User’s Manual, 2002, Version 6.3, ABAQUS Inc., Pawtucket, RI.Bao, G., Suresh, S., 2003. Cell and molecular mechanics of biological materials. Nature Materials 2 (11),
715–725.Boal, D., 2002. Mechanics of the Cell. Cambridge University Press, Cambridge, UK.Boey, S.K., Boal, D.H., Discher, D.E., 1998. Simulations of the erythrocyte cytoskeleton at large deformation.
I. Microscopic models. Biophys. J. 75 (3), 1573–1583.Chien, S., Sung, K.L.P., Skalak, R., Usami, S., THzeren, A., 1978. Theoretical and experimental studies on
viscoelastic properties of erythrocyte membrane. Biophys. J. 24 (2), 463–487.Cooke, B.M., Mohandas, N., Coppel, R.L., 2001. The malaria-infected red blood cell: structural and functional
changes. Adv. Parasitol. 50, 1–86.Discher, D.E., Mohandas, N., 1996. Kinematics of red cell aspiration by .uorescence-imaged
microdeformation. Biophys. J. 71 (4), 1680–1694.Discher, D.E., Boal, D.H., Boey, S.K., 1998. Simulations of the erythrocyte cytoskeleton at large deformation.
II. Micropipette aspiration. Biophys. J. 75 (3), 1584–1597.
2280 M. Dao et al. / J. Mech. Phys. Solids 51 (2003) 2259–2280
Evans, E.A., 1973. New membrane concept applied to the analysis of .uid shear- and micropipette-deformedred blood cells. Biophys. J. 13 (9), 941–954.
Evans, E.A., 1983. Bending elastic-modulus of red-blood-cell membrane derived from buckling instability inmicropipet aspiration tests. Biophys. J. 43 (1), 27–30.
Evans, E.A., Fung, Y.C., 1972. Improved measurements of the erythrocyte geometry. Microvasc. Res. 4,335–347.
Evans, E.A., Hochmuth, R.M., 1976. Membrane viscoelasticity. Biophys. J. 16 (1), 1–11.Evans, E.A., Skalak, R., 1980. Mechanics and Thermal Dynamics of Biomembranes. CRC Press, Boca Raton,
FL.Fung, Y.C., 1993. Biomechanics: Mechanical Properties of Living Tissues, 2nd Edition. Springer, New York.Glenister, F.K., Coppel, R.L., Cowman, A.F., Mohandas, N., Cooke, B.M., 2002. Contribution of parasite
proteins to altered mechanical properties of malaria-infected red blood cells. Blood 99 (3), 1060–1063.HKenon, S., Lenormand, G., Richert, A., Gallet, F., 1999. A new determination of the shear modulus of the
human erythrocyte membrane using optical tweezers. Biophys. J. 76 (2), 1145–1151.Hochmuth, R.M., Waugh, R.E., 1987. Erythrocyte membrane elasticity and viscosity. Ann. Rev. Physiol. 49,
209–219.Hochmuth, R.M., Mohandas, N., Blackshear, P.L., 1973. Measurement of the elastic modulus for red cell
membrane using a .uid mechanical technique. Biophys. J. 13 (8), 747–762.Hochmuth, R.M., Worthy, P.R., Evans, E.A., 1979. Red cell extensional recovery and the determination of
membrane viscosity. Biophys. J. 26 (1), 101–114.Lenormand, G., HKenon, S., Richert, A., SimKeon, S., Gallet, F., 2001. Direct measurement of the area
expansion and shear moduli of the human red blood cell membrane skeleton. Biophys. J. 81 (1),43–56.
Lim, C.T., Dao, M., Suresh, S., Sow, C.H., Chew, K.T., 2004. Large deformation stretching of living cellsusing laser traps. Acta Materialia, in press.
Lim, C.T., Lee, Y.S., Tan, K., Dao, M., Suresh, S., 2003. Unpublished research. National University ofSingapore and Massachusetts Institute of Technology.
Maniotis, A.J., Chen, C.S., Ingber, D.E., 1997. Demonstration of mechanical connections between integrins,cytoskeletal 5laments, and nucleoplasm that stabilize nuclear structure. Proc. Natl. Acad. Sci. USA94 (3), 849–854.
Parker, K.H., Winlove, C.P., 1999. The deformation of spherical vesicles with permeable, constant-areamembrane: applications to the red blood cell. Biophys. J. 77 (6), 3096–3107.
Platt, O.S., 1995. The sickle syndrome. In: Haldin, R.I., Lux, S.E., Stossel, T.P. (Eds.), Blood: Principlesand Practice of Hematology. J. B. Lippincott, Philadelphia, pp. 1592–1700.
Rotsch, C., Jacobson, K., Radmacher, M., 1999. Dimensional and mechanical dynamics of active and stableedges in motile 5broblasts investigated by using atomic force microscopy. Proc. Natl. Acad. Sci. USA96 (3), 921–926.
Sheetz, M.P., 1998. Laser Tweezers in Cell Biology. Academic Press, London, UK.Simo, J.C., Pister, K.S., 1984. Remarks on rate constitutive equations for 5nite deformation problems:computational implications. Computer Methods in Applied Mechanics and Engineering 46 (2), 201–215.
Sleep, J., Wilson, D., Simmons, R., Gratzer, W., 1999. Elasticity of the red cell membrane and its relationto hemolytic disorders: an optical tweezers study. Biophys. J. 77 (6), 3085–3095.
Wu, T., Lee, G.Y.Y., Phan-Thien, N., Lim, C.T., 2002. Investigating the mechanical properties of humanplatelets and erythrocytes using atomic force microscopy. International Congress on Biological andMedical Engineering, Singapore.
Van Vliet, K.J., Bao, G., Suresh, S., 2003. Experimental mechanics techniques for living cells andbiomolecules. Acta Materialia 51 (19), 5881–5905.