Mechanical Redesign - Pennsylvania State University · Mechanical Redesign ... The three 943 MBH...
21
Patrick Dempsey Mechanical Option Eastern High School Renovation Baltimore, PA Final Report Mechanical Redesign 3.1 Re-examining the loads I have praised and I will continue to praise the mechanical system for the Eastern High School Renovation. The system meets the requirements and special conditions of the project while improving sustainability. One area where I do take issue with the original system is the modeling of the space in terms of loadings. The core of the project is the targeted tenant offices spaces which reside on floors one through three. These spaces will represent the bulk of the thermal load for most days throughout the year.(especially when the auditorium/gymnasium are out of use) The ASHRAE 2001 standard restructured the accepted electrical loads for lighting spaces in terms of watts per sq. foot. The new standard called for most spaces to have lighting levels below 1 watt per sq. ft. Eastern High School’s lighting levels according to the design documents were measured at roughly 2.5 watts per sq. foot. This level could not be justified by the types or density of lighting located in the building. The plan was dominated by standard 2’x 2’ fluorescent fixtures and small recessed downlights. Alone, these high lighting levels may be ignorable. However, these loads were accompanied by extremely high electrical equipment loads of roughly 4.0 watts/sq. ft. Any building model with 6.5 w/sq. ft for generic equipment will give you an oversized cooling plant and a relatively small heating load. While I could verify the lighting levels from specifications and rough estimates I was unable to be certain about the equipment levels. High density computer use or upper level laboratory equipment could conceivably register at levels around 4.0 watts/sq. ft. Since these spaces were not excluded from the possible tenant layout I chose not to reduce the equipment loads.
Transcript of Mechanical Redesign - Pennsylvania State University · Mechanical Redesign ... The three 943 MBH...

Patrick Dempsey Mechanical Option Eastern High School Renovation Baltimore, PA Final Report Mechanical Redesign 3.1 Re-examining the loads
I have praised and I will continue to praise the mechanical system for the Eastern High
School Renovation. The system meets the requirements and special conditions of the
project while improving sustainability. One area where I do take issue with the original
system is the modeling of the space in terms of loadings. The core of the project is the
targeted tenant offices spaces which reside on floors one through three. These spaces
will represent the bulk of the thermal load for most days throughout the year.(especially
when the auditorium/gymnasium are out of use)
The ASHRAE 2001 standard restructured the accepted electrical loads for lighting spaces
in terms of watts per sq. foot. The new standard called for most spaces to have lighting
levels below 1 watt per sq. ft. Eastern High School’s lighting levels according to the
design documents were measured at roughly 2.5 watts per sq. foot. This level could not
be justified by the types or density of lighting located in the building. The plan was
dominated by standard 2’x 2’ fluorescent fixtures and small recessed downlights.
Alone, these high lighting levels may be ignorable. However, these loads were
accompanied by extremely high electrical equipment loads of roughly 4.0 watts/sq. ft.
Any building model with 6.5 w/sq. ft for generic equipment will give you an oversized
cooling plant and a relatively small heating load.
While I could verify the lighting levels from specifications and rough estimates I was
unable to be certain about the equipment levels. High density computer use or upper
level laboratory equipment could conceivably register at levels around 4.0 watts/sq. ft.
Since these spaces were not excluded from the possible tenant layout I chose not to
reduce the equipment loads.

Patrick Dempsey Mechanical Option Eastern High School Renovation Baltimore, PA Final Report So I limited my reduction to the lighting levels. Lighting loads throughout the building
were reduced to 0.5-0.6 w/ft^2. Even if I thought this might be small when you consider
it in tandem with the high equipment loads I was fairly comfortable with the adjusted
envelope at 4.5-4.6 w/sq. ft.
Let me reemphasize the lack of culpability on behalf of the original designers. These
design documents were rendered with a very vague tenant description and with older
ASHRAE standards. The design was taken from a shell perspective and simply making
sure that the central plant was large enough for every possible loading was a clear priority
to the original designer. This senior thesis takes advantage of current standards and more
specific information.
3.2 Re-modeling
The principal tool used throughout this mechanical redesign was Carrier’s Hourly
Analysis Program(HAP 4.20). HAP is widely considered the premier system modeling
tool for the early stages of HVAC design or at the very least the free one in our student
labs. Since I only had the basic printouts for the original model and the files were from
an older version I had to clone Schlenger/Pitz original building simulation. After
mimicking the loads and as much of the pre-sets as possible I had a building with a peak
cooling load of roughly 512 tons.
Note: I should mention that this thesis concerned itself primarily with the cooling side of
the building model. The heating central plant which was installed was more than
adequate for my system even after I reduced the electrical loads which acted as heat
sources. The three 943 MBH output oil fired boilers were pretty much overkill for the
load as was modeled using the original w/sq. ft. levels.
This cooling level was slightly smaller than some of the models I had come across but
falls roughly in the same ballpark.( 3 different HAP documents found with varying peak
load levels all from 500-550 tons) Honestly, I was happy with the conservative estimate
Patrick Dempsey Mechanical Option Eastern High School Renovation Baltimore, PA Final Report since I knew the reduced lighting loads would produce some significant results. I was
also leery of producing too massive a reduction from one model to the next.
The second HAP model mimicked everything except the lighting loads. I had even
dabbled with reduced equipment loads at one point to more standard levels(<2.0 w/sq.ft)
but that produced such a drastic reduction that I considered it implausible. HAP
calculated a new peak cooling load of roughly 350 tons for the same system just by
dropping the lighting levels to modern standards.
3.3 Resizing the equipment
The second HAP model required a significant resizing of most of the original equipment.
Starting from the top I resized the chillers using Carrier’s selection criteria, online
catalogs, and my HAP printouts. The two new chillers water cooled chillers have a
capacity of 211 tons. This reduction is rather conservative as the ‘nominal’ capacity of
the original chillers was 246 tons. The smaller selection was only one step down for the
30 HXC type in the Carrier catalog.
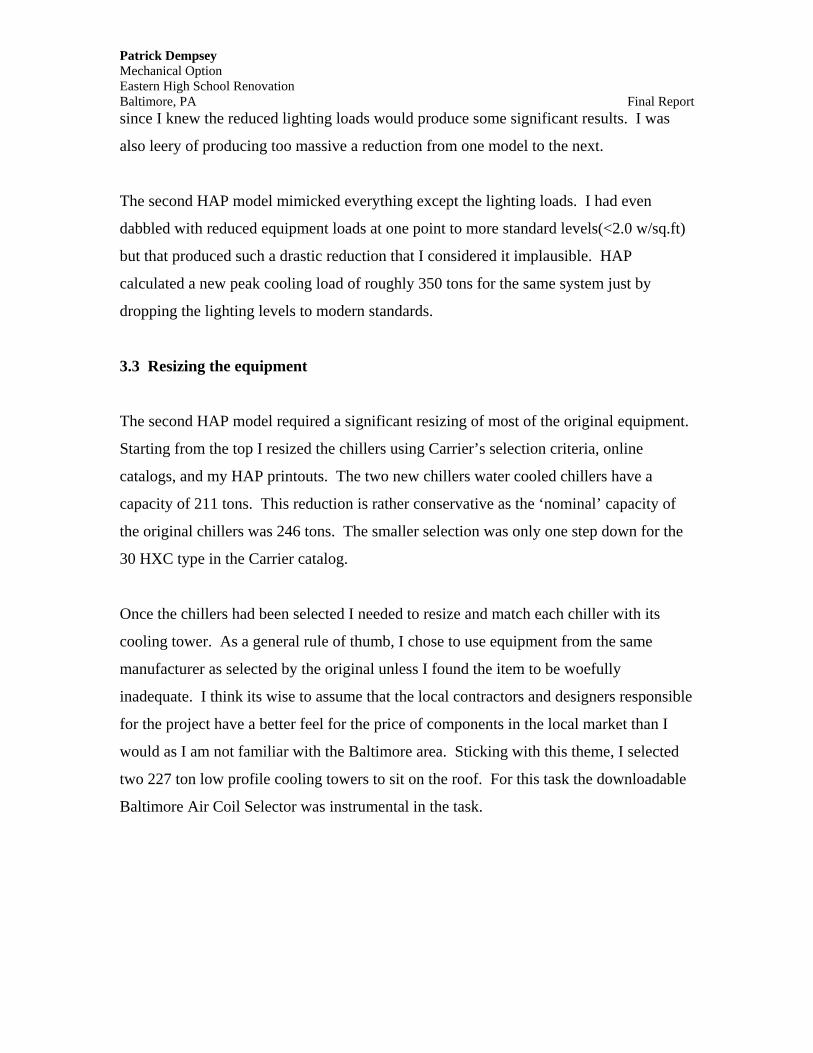
Once the chillers had been selected I needed to resize and match each chiller with its
cooling tower. As a general rule of thumb, I chose to use equipment from the same
manufacturer as selected by the original unless I found the item to be woefully
inadequate. I think its wise to assume that the local contractors and designers responsible
for the project have a better feel for the price of components in the local market than I
would as I am not familiar with the Baltimore area. Sticking with this theme, I selected
two 227 ton low profile cooling towers to sit on the roof. For this task the downloadable
Baltimore Air Coil Selector was instrumental in the task.

Patrick Dempsey Mechanical Option Eastern High School Renovation Baltimore, PA Final Report
Figure 1.0: BAC Cooling Tower Selection Interface
Once these primary system components were in place I moved to reselecting the pumps
of the system. Admittedly these components would not represent a tremendous
difference in either the first cost or the annual costs of running the building. The fluid
flow rates were too similar and the head levels were too close to provide a significant
level of savings. For this task I once again turned to the original manufacturers, PACO
pumps. PACO has been bought out by Sulzer but they pumps retain the PACO name and
the website was exceptionally useful.

Patrick Dempsey Mechanical Option Eastern High School Renovation Baltimore, PA Final Report
Figure 1.1: PACO Express Pump Interface
With the pumps selected for the chilled water, hot water, and condensate loops, I moved
to air side selection. Using the total air flow from the design documentation and a rough
estimate of the number of AHU’s from the designer(The air handlers were considered
part of the tenant fitout and were inaccessible) I determined that the original system
consisted of fifteen 22000 cfm VAV Air handlers.
The redesign resulted in a significantly reduced air flow rate due to the reduced cooling
load. I used fourteen air handlers because I wanted to keep the number significantly
close to the original in order to reduce long duct runs and duct sizes in accordance with
the project goals. Each air handler was VAV and designed to handle 16,500 cfm.
Fan selection was the next logical step. Each AHU needed a supply fan and I used
York’s fan selection guide and fan tables for the selection. Using static pressure and the
cfm that must be transferred I calculated the static pressure. The fan tables narrowed
down the selection. Both designs will be powered by 22”x22” forward curved fans at
approximately 4.0 in wg. of static pressure. For a detailed breakout of this calculation
and the tables examine the Appendices.
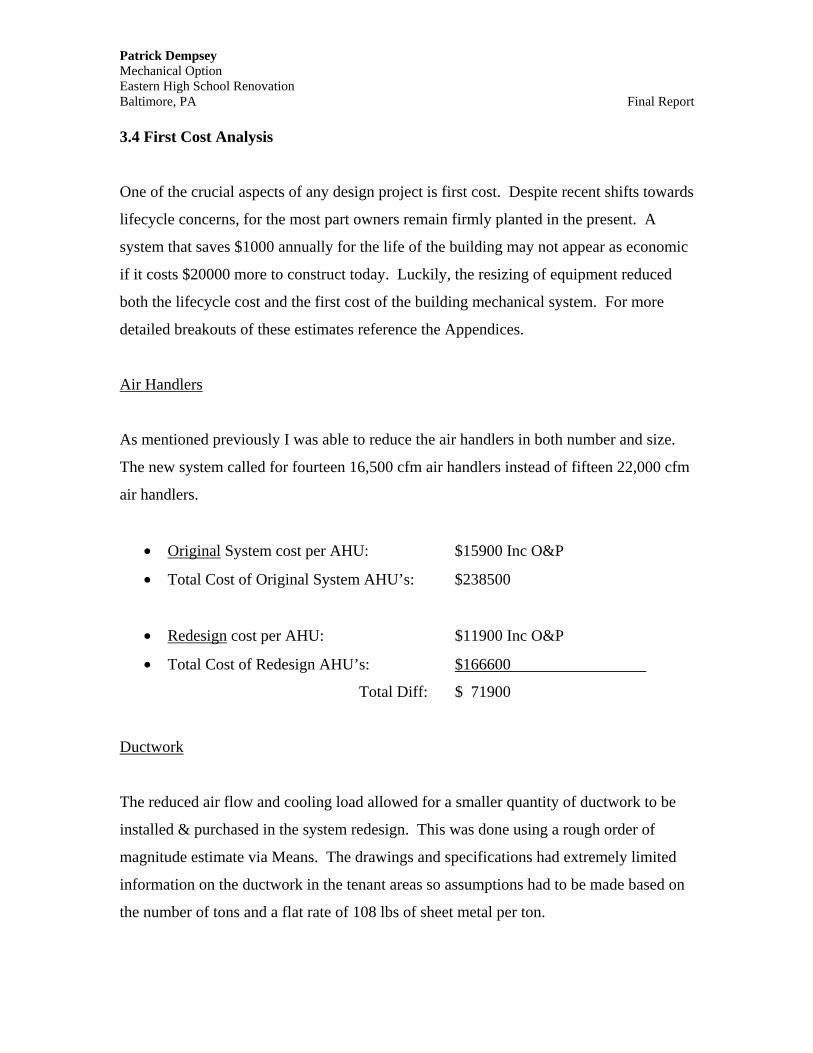
Patrick Dempsey Mechanical Option Eastern High School Renovation Baltimore, PA Final Report 3.4 First Cost Analysis
One of the crucial aspects of any design project is first cost. Despite recent shifts towards
lifecycle concerns, for the most part owners remain firmly planted in the present. A
system that saves $1000 annually for the life of the building may not appear as economic
if it costs $20000 more to construct today. Luckily, the resizing of equipment reduced
both the lifecycle cost and the first cost of the building mechanical system. For more
detailed breakouts of these estimates reference the Appendices.
Air Handlers
As mentioned previously I was able to reduce the air handlers in both number and size.
The new system called for fourteen 16,500 cfm air handlers instead of fifteen 22,000 cfm
air handlers.
• Original System cost per AHU: $15900 Inc O&P
• Total Cost of Original System AHU’s: $238500
• Redesign cost per AHU: $11900 Inc O&P
• Total Cost of Redesign AHU’s: $166600
Total Diff: $ 71900
Ductwork
The reduced air flow and cooling load allowed for a smaller quantity of ductwork to be
installed & purchased in the system redesign. This was done using a rough order of
magnitude estimate via Means. The drawings and specifications had extremely limited
information on the ductwork in the tenant areas so assumptions had to be made based on
the number of tons and a flat rate of 108 lbs of sheet metal per ton.

Patrick Dempsey Mechanical Option Eastern High School Renovation Baltimore, PA Final Report
• Original System lbs of Gal. Steel Ductwork: 55296 lbs
• Price per lb of Ductwork: $5.45
• Total Cost of Ductwork: $301363
• Redesign lbs of Gal. Steel Ductwork: 37800 lbs
• Price per lb of Ductwork: $5.45
• Total Cost of Ductwork: $206010
Total Diff: $ 95353
Diffusers & Registers
I turned to Means once again for a flat rate on the predicted diffusers & return registers
for the original system and system redesign. The rate was 2 diffusers per ton and 1 return
register per ton.
• Original Number of Diffusers: 1024
• Price Per Diffuser: $202
• Original Number of Registers: 512
• Price Per Register: $85.50
Total Combined Cost: $250624
• Redesign Number of Diffusers: 700
• Price Per Diffuser: $202
• Redesign Number of Registers: 350
• Price Per Register: $85.50
Total Combined Cost: $171325
Total Diff: $79299

Patrick Dempsey Mechanical Option Eastern High School Renovation Baltimore, PA Final Report Chillers
The chillers were sized down from 246 nominal tons to 211 by using HAP as a guideline.
I used the nominal tons for the pricing as opposed to the actual rated tons by the designer.
This was done because I didn’t have the rated tons for the 211 ton chillers. I only had the
Carrier design specifications to reference.
• Original Chillers: 2
• Price Per Chiller: $91600
• Total Cost of original Chillers: $183200
• Redesign Chillers: 2
• Price Per Chiller: $88100
• Total Cost of redesign Chillers: $176200
Total Diff: $7000
Cooling Towers
The cooling towers received a similar reduction dropping from 272 tons to 227 tons each.
Once again I used the nominal values for pricing the equipment in Means.
• Original Towers: 2
• Price Per Tower: $27016
• Total Cost of Original Towers: $54032
• Redesign Towers: 2
• Price Per Tower: $23322
• Total Cost of Redesign Towers: $46644
Total Diff: $7388

Patrick Dempsey Mechanical Option Eastern High School Renovation Baltimore, PA Final Report Pumps
The pumps don’t result in a tremendous amount of savings but they are the last real
difference in the first cost between the original system and the reduced system. Pumps
were sized using the web based interface on Sulzer’s website as mentioned previously.
• Original Pump Cost: $42900
• Redesign Pump Cost: $39600
Total Diff: $ 3300
Boilers, Energy Recovery Ventilators, & Ice Storage Tank
These three types of equipment were kept the same for both the redesign and the original.
The ERV’s function for the ventilation air only and I kept the 20 cfm/person standard of
the original design.
• 3 Boilers Total Cost: $36084
• Ice Storage Tank: $71800
• 7 Energy Recovery Ventilators Total Cost: $97950
Total Added Cost: $205834

Patrick Dempsey Mechanical Option Eastern High School Renovation Baltimore, PA Final Report
Total Cost Difference
• Original System Total Cost: $1285453
• Redesigned Total Cost: $1012213
Total Diff: $ 273240
The total cost difference had to be adjusted for location. The cost factor for Baltimore is
92.7 so the total cost must be multiplied by .927.
Adjusted Differential: $ 253294
The first cost savings from a simple reduction in lighting loads were significant.
$253294 saved in addition to the reduced annual energy costs I’ll cover later will please
any owner and satisfy the project requirements.
3.5 Annual Cost Analysis
The reduced lighting loads reduced the size of the system and therefore should reduce the
annual cost of operation for the building. I wanted to separate the results for HVAC vs.
Non-HVAC electrical loads. The Non-HVAC loads will obviously be very disparate due
to the lighting characteristics I changed. A more in-depth analysis of the Non-HVAC
electrical loads and the electrical profile can be found in the Electrical Breadth area of
this report.
As previously mentioned, the total electrical and lighting load for the spaces were
nominally reduced by 2 W/sq. ft in most areas. This resulted in a drop in the peak
cooling load which allowed for the system to be downsized and re-evaluated. In order to
evaluate the annual electrical usage I used HAP and the rates of Baltimore Gas & Electric
for electricity and fuel oil(for the boilers). The full reports and the rates used for
Baltimore Gas & Electric can be found in the Appendices.

Patrick Dempsey Mechanical Option Eastern High School Renovation Baltimore, PA Final Report
Annual Cost Breakdown(Existing System)
• Air System Fans: $16104
• Cooling: $52559
• Heating: $ 5411
• Pumps: $14923
• Cooling Tower Fans: $15248
HVAC Sub Total: $104245
Annual Cost Breakdown(Redesign)
• Air System Fans: $15705
• Cooling: $39267
• Heating: $11739
• Pumps: $11153
• Cooling Tower Fans $11846
HVAC Sub Total: $89710
Annual Cost Diff: $14535
Using a standard 5% rate of interest I calculated the present value of an annual cost
difference of $14535 over 15 years. In order to do this I used the interest rate tables
in the index of Engineering Economic Analysis by Michael R. Lindeburg.
Interest rate(i)= 5.0
Duration in years(n) = 15
Adjustment Factor(P/A)= 10.3797
Annual Value= $14535
Present Value= $14535 * 10.3797 = $150868

Patrick Dempsey Mechanical Option Eastern High School Renovation Baltimore, PA Final Report
Summary
The reduction of lighting loads in accordance with ASHRAE standards resulted in
a significantly different first cost and annual cost. The first cost of the system dropped by
roughly a quarter of a million dollars while the annual cost was reduced by nearly fifteen
thousand dollars per year. I’ll take these results further in my next step: analyzing the
reduced system under the controls of pre-cooling.
3.6 Pre-cooling
The second half of my mechanical depth work consisted of investigating the application
of a relatively new cooling method for the Eastern High School Renovation, pre-cooling.
Pre-cooling has been developed and pioneered by Dr. James Braun of Purdue University.
Dr. Braun is a professor in the mechanical engineering department at Purdue. Pre-
cooling is a control oriented method for altering the load profile of a building in order to
take advantage of thermal mass and off peak hours. This method is an extension of off
peak air conditioning.
The basic tenant of pre-cooling is that you can allow a building with significant thermal
mass to absorb some of the heat of the day by cooling the mass at night or early in the
morning. The indoor air temperature remains comfortable even as your temperature
setpoints hit ranges higher than normal. This phenomenon is because the building has
been tuned to absorb just enough of the thermal load to keep the interior within the
comfort range.
Pre-cooling requires a modeled space with significant structure for use as thermal mass.
Glass curtain wall office buildings are not optimal candidates to be pre-cooled. Eastern
High School was a good project in this case because of the foot and a half thick mason &
brick walls that makeup the exterior. The exterior walls can be used as effective thermal
mass to store cooling much in the same way that the ice storage tank already does.

Patrick Dempsey Mechanical Option Eastern High School Renovation Baltimore, PA Final Report
But, why use the walls as thermal storage if you already have a thermal storage system in
place with the ice tank? The ice storage system was built so that ice could be
manufactured at the same time as the chillers operate to cool the proposed lab space. If
you are going to run your chillers during night hours and the basic equipment is already
in place, why not store some of that cooling in the building itself while making ice? This
way you can fight the rise in temperature during the day in summer months and then turn
some of the cooling over to the ice at the peak of the day.
Here’s an example to explain the controls of pre-cooling. Say you have an 80,000 sq. ft
office complex that has been selected for pre-cooling, the first step would be either to use
night ventilation or set the chiller plant to run during the morning hours. If you use night
ventilation you simply ventilate the building with cool night air and monitor your
setpoints to stop ventilating at 67-68 degrees Fahrenheit in the early morning hours.
This cools the structure and charges or discharges your thermal mass. If you run the
chiller to cool your building you make 67-68 degrees Fahrenheit your setpoint for the
early morning hours and cool the building to that temperature about an hour or half an
hour before the building is going to be occupied. These controls usually setup a morning
peak in your building loading(This becomes my method for HAP modeling later). The
building becomes occupied and the temperature ‘floats’ back up to a setpoint usually
around 74 or 75 degrees. The thermal mass keeps the interior relatively cool until the
new setpoint is hit and then the chillers throttle back up to meet the peak loads of the day.
Essentially you displace some of your peak from the early afternoon to your morning
hours. The morning hours coincide with off peak utility hours and reduce the annual
utility cost to reduce the building. Usually the reduction is accompanied by a smaller
peak cooling load.

Patrick Dempsey Mechanical Option Eastern High School Renovation Baltimore, PA Final Report
Dr. Braun tested this methodology in several different areas with varying utility rates and
temperature profiles. The following graph was taken from “Load Control Using Building
Thermal Mass” published by Dr. Braun in the ASME journal. I located the paper on the
website for the Demand Response Research Center. The graph show the savings
garnered from three levels of pre-cooling in five major cities.
Figure 1.2 Braun’s pre-cooling results
Seattle was the only location that suffered from the pre-cooling setup. The reason for this
is illustrated in the following table also taken from “Load Control Using Building
Thermal Mass.”

Patrick Dempsey Mechanical Option Eastern High School Renovation Baltimore, PA Final Report
Figure 1.3 Rates for Braun’s study This method did not work in Seattle because no savings could be earned per kilowatt-
hour because the price was the same for both off-peak and on-peak hours. In addition
demand charges per KW are universal because the peak envelope is from 6am-10p.m.
This cuts into the savings of a pre-cooling system that is geared towards operating from
5-7 AM cooling the building down to a high 60’s degree setpoint.
This illustrates the second huge caveat of operating a pre-cooling system. If your local
area doesn’t have a utility structure that significantly penalizes peak energy usage then
you probably shouldn’t use any form of off peak air conditioning. An area like California
would be ideal for this type of system. The cooling load dominates the design in
California’s climate and most rate structures(Pacific Gas & Electric for instance) include
costly demand penalties and concentrated peak hour profiles(noon-6pm for example).
The concentrated peak profile allows the pre-cooling system to carry out most of the
heavy lifting during non-peak or non-middle peak hours.
The Baltimore Gas & Electric rates are not as good as the California rates nor are they as
bad as the Seattle rates from 2003. As referenced from the Appendix, the BG&E Peak
Demand Rate is $5.29/KW during the summer and there is a slight increase for kilo-watt
hour usage during the summer peak hours. These rates are acceptable for off peak air
conditioning and pre-cooling.
When examining the utility rates for a building you must also take into account where the
utility rates will be 5, 10, or 15 years down the road. Maryland is most likely going to

Patrick Dempsey Mechanical Option Eastern High School Renovation Baltimore, PA Final Report deregulate the utility industry in the next 2-3 years. The theory of deregulation revolves
around competition driving the market which lowers the price of power. Unfortunately
almost every deregulated state has seen rising energy costs after a short period. The ice
storage system as installed in Eastern High School will pay big dividends 10 years from
now when the peak demand charge is in excess of $10.00/KW.
3.7 Pre-cooling modeling The biggest obstacle I faced during the senior thesis was trying to model the space as a
pre-cooling system. Basically I was trying to set the temperature in the morning to 67
degrees to pre-cool the structure. Then I’d set the occupied temperature to 75 degrees for
the rest of the work day. Then I wanted to set the unoccupied temperature back to 85
degrees over night during unoccupied hours before pre-cooling.
One of my primary sources for pre-cooling information and sustainability tools was the
department of energy website. The DOE website had several energy tools available for
download. The first I tried was EQUEST.
EQUEST is a simulation program that could best be described as a cross between HAP
and Trane System Analyzer. It has a rather detailed interface and focuses on analyzing
the utility usage of a building and compliance issues with recent energy codes on the west
coast. I was impressed by the interface but it was difficult to input different utility rates
from the California rates programmed into the software.
I liked using EQUEST but it shares a limitation with setting the system temperature
setpoints in HAP. The only setpoints you have are the occupied temperature and the
unoccupied temperature for both heating & cooling. Even if you set up unorthodox
occupation profiles, your results will be heavily skewed by the unoccupied cooling or
lack thereof. With these lessons learned I moved back to HAP Analysis.

Patrick Dempsey Mechanical Option Eastern High School Renovation Baltimore, PA Final Report
Figure 1.4 EQUEST Interface
HAP
As mentioned with EQUEST I could not get the setpoints where I wanted them. If I set
occupied cooling to 67 degrees but only labeled the building as occupied for the three
hours of pre-cooling in the morning than I had an incredibly inflated cooling load due to
the fact that the building had to be conditioned to 74 degrees 21 hours a day in
unoccupied mode. The thermostat schedules were too limited as they only have an
occupied/unoccupied setting. One thing I did do to model pre-cooling was max out the
throttling range. The necessity of floating the temperature after pre-cooling and the
flexible envelope necessitated increasing the throttling range to 6.0 degrees. This step
mimics the flexibility of the temperature as detailed previously but I still had to determine
a way to simulate the setpoints.

Patrick Dempsey Mechanical Option Eastern High School Renovation Baltimore, PA Final Report When you can’t simulate the actual phenomenon you have to try to simulate the effect of
that occurrence. I could not simulate the temperature controls but I could simulate the
way those controls would be interpreted.
I had three load inputs and schedules at my disposal: occupation, lighting, and electrical
equipment. I couldn’t directly influence the loads but I could alter the schedule to
simulate pre-cooling vs. ice storage. The load schedules are more intricate and flexible
than the thermostat schedules. You are able to adjust the percentage of the load on a per
hour basis. Using this as my control simulator I modeled a usage profile for both the ice
storage setup and pre-cooling. Figure 1.5 Ice Storage Profile
The Ice Storage schedule simulates the loading associated with building ice over night
and the reduced load profiles during the day due to melting the ice.

Patrick Dempsey Mechanical Option Eastern High School Renovation Baltimore, PA Final Report
Figure 1.6 Precooling load Profile
The pre-cooling schedule is modeled to reflect a low-level cooling load during most
nighttime hours and a peak in the early morning as the cooling load spikes. The hours
following this morning peak reflect the temperature floating back to the setpoint and
feeding off the pre-cooled thermal mass of the building. The load goes back to 90
percent of the peak form 1pm-4pm reflecting only some of the reduction from the ice
created over night. I tried to keep the area under the relative curves to be equal resulting
in any savings being the result of simply shifting the usage to more demand friendly
hours. I did give the pre-cooling setup a very small reduction(<5%) to reflect the effect
of the building envelope. Dr. Braun consistently achieved much larger reductions in load
in the realm of 15-25% so I considered 5% to be conservative.

Patrick Dempsey Mechanical Option Eastern High School Renovation Baltimore, PA Final Report
3.8 Load Profiling Results
I wasn’t sure what kind of results I would get from the load profile. The Baltimore Gas
& Electric rates wouldn’t register landmark savings for one off peak air conditioning
setup over another. These results also take into account the adjusted throttling range.
Annual Cost Summary(HAP Redesign-Reduced Lighting no pre-cooling)
• Air System Fans: $15705
• Cooling: $39267
• Heating: $11739
• Pumps: $11153
• Cooling Tower Fans: $11846
HVAC Sub-Total: $89710
Annual Cost Summary(HAP Redesign + Pre-cooling)
• Air System Fans: $16119
• Cooling: $34980
• Heating: $12830
• Pumps: $10422
• Cooling Tower Fans: $10565
HVAC Sub-Total: $84915
Total Cost Diff: $4795
I ignored the small difference in electrical & lighting annual costs because that difference
wouldn’t be real. Here is a list of the HVAC Sub-Totals in terms of annual cost from the
original system, the redesign without pre-cooling, and the pre-cooled system.
Original System: $104245
1st Redesign: $89710
Pre-cooling: $84915

Patrick Dempsey Mechanical Option Eastern High School Renovation Baltimore, PA Final Report
3.9 Conclusion
The pre-cooled system saves roughly $20,000 annually over the original system but that
is not a fair comparison. Sizing down the lighting saved $15000 so actually the pre-
cooling system saves only $5,000 on its own merits. Taking into account the first cost
the total present value savings of the systems break down as follows:
First Cost Difference: $253294
Annual HVAC only savings: $19930
Present Value of HVAC savings: $207212
Present Value of actual pre-cooling savings: $49853
All of the present values were calculated using the 5.0% interest rate and 15 year duration
used previously. The key number here is the $50000 saved on pre-cooling. This reflects
the actual savings of this methodology. The other results were to be expected due to the
reduced lighting and total cooling loads. I believe that these savings will be more
significant when Maryland deregulates the utility industry and the present value may
increase 3 to 5 years down the road. I’m very pleased with the savings earned by this
system and think that they represent a significant improvement over the original.