Mechanical Properties of Concrete Using Recycled Plastic · recycled plastic in concrete...
64
The Islamic University-Gaza Research and Postgraduate Affairs Faculty of Engineering Civil Engineering Department Design and Rehabilitation of Structures الجبمعتميتس ا– غزةعليبمي والدراسبث العل شئىن البحث ال كليت الهندست قسم الهندست المدنيتيم تصم و تأهيل المنشأثMechanical Properties of Concrete Using Recycled Plastic Submitted by: Ahmed Abu Ishaiba Supervised by: Prof. Samir Shihada Dr. Mohammed Arafa A Thesis Submitted in Partial Fulfillment of the Requirement for the Degree of Master of Science in Civil Engineering Design and Rehabilitation of Structures م2015 - ه1437
Transcript of Mechanical Properties of Concrete Using Recycled Plastic · recycled plastic in concrete...
The Islamic University-Gaza
Research and Postgraduate Affairs
Faculty of Engineering
Civil Engineering Department
Design and Rehabilitation of Structures
غزة – اإلسالميت الجبمعت
شئىن البحث العلمي والدراسبث العليب
الهندست كليت
المدنيت الهندست قسم
المنشأث تأهيلو تصميم
Mechanical Properties of Concrete Using Recycled Plastic
Submitted by:
Ahmed Abu Ishaiba
Supervised by:
Prof. Samir Shihada
Dr. Mohammed Arafa
A Thesis Submitted in Partial Fulfillment of the Requirement for the
Degree of Master of Science in Civil Engineering Design and Rehabilitation of Structures
1437ه - 2015م
I
ABSTRACT
Concrete is the most common material for human beings to use in construction. In this
study, the behavior of the recycled plastic as aggregate in concrete has been investigated
on compressive, tensile, and flexural strengths, weight reduction and workability. Also the
impact resistance of concrete contains plastic aggregate has been carried out deeply in this
study.
Polyethylene terephthalate (PET) bottles, one of the waste plastic types, is used in this
study .The reason to choose the PET bottles to develop a novel method to transfer it to
valuable product and to solve the problem of dumping the tons of plastic waste, also PET
bottles not used to produce any recycled material locally in Gaza Strip due to the
difficulties in recycling it.
A series of four concrete mixes were prepared with replacement ratios of PET 0%, 15%,
30%, and 45% by volume of natural aggregate. Also the same ratios used by adding PET
without replacing the natural aggregate in the impact resistance test. Special impact
machine was designed and fabricated adopting the technique of drop weight impact test in
ACI committee 544.
The results of experiments show the feasibility to use PET plastic in concrete mixes. There
is a possibility to produce concrete with reduction in weight reaches to 12% compared to
traditional concrete in case of replacing 45% of natural aggregate by PET aggregate. No
significant changes are observed for mixtures containing up to 15% of PET-aggregates in
compressive strength results, for 30% and 45% PET replacement there is a noticeable
reduction in compressive strength up to 11% and 24% respectively. The results reveal that
the capacity of concrete to resist impact loading at failure can be improved by
increasing the content of PET.

II
الخالصة
تم فحص سموك البالستيك البناء. في هذه الدراسة، بين مواد واستخداما الخرسانة هي المادة األكثر شيوعا. التشغيميةوخفض الوزن و عزم االنحناءو الشدوقوة لقوة الضغط المعاد تدويره كركام في الخرسانة بالنسبة
كركام. المعاد تدويرة عمي البالستيك االصطدام لمخرسانة التي تحتوي مقاومةتم دراسة أيضا
. الدراسة في هذه التي تم استخدامها من أنواع النفايات البالستيكية ةواحد هي ،البولي ايثمين زجاجاتولحل ولي ايثمين هو لتطوير طريقة جديدة لتحويمها إلى منتجات ذات قيمةبزجاجات ال والسبب في اختيار
النها ال تستخدم إلنتاج أي مواد محميا في قطاع غزة كذلكو ،ت البالستيكيةاالطنان من النفايامشكمة تكدس إعادة تدويرها. صعوبة بسبب
% من 51و %00، %51، %0بنسبة يثمينا استبدال البوليب خرسانية مجموعة من اربع خمطاتتم اعداد
ام الطبيعي في اختبار مقاومة الركام الطبيعي. ايضا تم استخدام نفس النسب ولكن بدون استبدال الركحجم تم تصميم وتركيب جهاز خاص لفحص االصصدام بناءا عمي تقنية اختبار االصطدام باسقاط االصطدام.
.155الموجودة في لجنة المعهد االمريكي لمخرسانة رقم الوزن
امكانية النتاج اظهرت النتائج الجدوي في استخدام بالستيك البولي ايثمين في الخمطات الخرسانية. هناك في حال % مقارنة مع الخرسانة التقميدية51الخرسانة خفيفة الوزن مع انخفاض في الوزن يصل الي
غيرات ممموسة في الخمطات التي تحتوي . لم يالحظ اي ت% من الركام الطبيعي بالبالستيك51استبدال نسبة % هناك 51% و00ا لنسب استبدال % من البولي اثيمين كركام بالنسبة لقوة الضغط, ام51عمي نسبة
. بينت النتائج ان قدرة الخرسانة عمي التوالي %15و %55يصل الي انخفاض ممحوظ في قوة الضغط عمي تحمل االصطدام تتحسن مع زيادة كمية البولي ايثمين.
III
DEDICATION
I dedicate my dissertation work to my family and my friends. A special
feeling of gratitude to my loving parents, my brother and my sisters, whose
words of encouragement and push for tenacity ring in my ears. My wife, the
woman who has been and still encouraging and supporting me. Finally, I
dedicate this work to my unborn daughter.
IV
ACKNOWLEDGMENT
I deeply thank my advisors, Prof. Samir Shihada and Dr. Mohammed
Arafa, whose help, advice and supervision was invaluable.
I would like to extend special thanks to the Islamic University Labs
staff for their effort in helping me during the experimental studies and to
all of the people that made this project possible.
V
TABLE OF CONTENTS
ABSTRACT ............................................................................................................................I
II.………………………………………………………………………………………الخالصت
DEDICATION ..................................................................................................................... III
ACKNOWLEDGMENT ..................................................................................................... IV
TABLE OF CONTENTS ...................................................................................................... V
LIST OF FIGURES ........................................................................................................... VII
LIST OF TABLES ............................................................................................................ VIII
CHAPTER ONE: INTRODUCTION .................................................................................... 1
1.1 Background .................................................................................................................. 1
1.2 Problem Statement: ...................................................................................................... 2
1.3 Objectives of the Proposed Research: ......................................................................... 3
1.4 Methodology: ............................................................................................................... 3
1.5 Research Scope: ........................................................................................................... 3
1.6 Thesis structure: ........................................................................................................... 4
CHAPTER TWO: LITERATURE REVIEW ........................................................................ 5
2.1 Introduction .................................................................................................................. 5
2.2 Types and Uses of Plastic: ........................................................................................... 5
2.3 Previous studies related to using recycled plastic as aggregate: .................................. 7
2.4 Concrete Impact Resistance ....................................................................................... 11
2.5 Concluding Remarks .................................................................................................. 12
CHAPTER THREE: EXPERIMENTAL PROGRAM ........................................................ 13
3.1 Introduction ................................................................................................................ 13
3.2 Materials .................................................................................................................... 13
3.2.1 Cement ................................................................................................................ 13
3.2.2 Water ................................................................................................................... 14
3.2.3 Aggregates .......................................................................................................... 14
3.2.3.1 Coarse aggregate .......................................................................................... 14
3.2.4 Sand ..................................................................................................................... 18
3.2.5 Plastic (PET) Aggregate ...................................................................................... 19
3.3 Mix Preparation ......................................................................................................... 22
3.4 Mix proportions ......................................................................................................... 23
3.5 Testing Program ......................................................................................................... 25
3.6 Equipment and testing procedure .............................................................................. 26
3.6.1 Fresh concrete tests .............................................................................................. 26
3.6.1.1 Slump Test ...................................................................................................... 26
3.6.1.2 Density ............................................................................................................ 26
3.6.2 Hardened concrete tests ........................................................................................ 27
3.6.2.1 Compressive Strength Test ............................................................................. 27
3.6.2.2 Splitting Cylinder Test .................................................................................... 27
3.6.2.3 Flexural strength test ....................................................................................... 28
3.6.2.4 Impact resistance test ...................................................................................... 29
3.6.3 Curing conditions ................................................................................................... 31

VI
CHAPTER 4 ........................................................................................................................ 32
TEST RESULTS AND ANALYSIS ................................................................................... 32
4.1 Introduction ................................................................................................................ 32
4.2 Fresh concrete properties tests results........................................................................ 32
4.2.1 Slump (workability) ............................................................................................. 32
4.2.2 Density ................................................................................................................. 33
4.3 hardened concrete properties tests results .................................................................. 34
4.3.1 Compressive Strength Results ............................................................................. 34
4.3.2 Splitting Tensile Strength Results ........................................................................ 36
4.3.3 Flexural Strength Test Results ............................................................................. 37
4.3.4 Impact Resistance Test Results ............................................................................ 39
CHAPTER FIVE ................................................................................................................. 43
CONCLUSIONS AND RECOMEDATIOS ....................................................................... 43
5.1 Introduction ................................................................................................................. 43
5.2 Conclusion .................................................................................................................. 43
5.3 Recommendations ....................................................................................................... 44
REFERENCES .................................................................................................................... 45
Appendix (A) ....................................................................................................................... 50
Design of Concrete Mixtures ............................................................................................... 50

VII
LIST OF FIGURES
Figure 1.1: The composition of solid wastes in Gaza strip ................................................................ 2
Figure 2.1: Drop-weight impact test [ACI Committee 544-89] ....................................... 12
Figure 3.2: Types of coarse aggregate by max size: (A) 25mm (B) 19mm (C) 9.5mm ................... 15
Figure 3.3: Sieve analysis of aggregate ............................................................................................ 18
Figure 3.4: Natural Sand Sample ..................................................................................................... 18
Figure 3.5: (A) Crushed PET Bottles sample / (B) shredded PET Bottles sample .......................... 20
Figure 3.6: Sieve Analysis of PET Aggregate ................................................................................. 22
Figure 3.7: Slump Value Test .......................................................................................................... 26
Figure 3.8: Compressive strength test machine................................................................................ 27
Figure 3.9: Flexure strength test machine ........................................................................................ 28
Figure 3.10: Center point loading for flexural strength test ............................................................. 29
Figure 3.11: Drop-weight test device ............................................................................................... 30
Figure 3.12: impact test apparatus .................................................................................................... 30
Figure 3.13: impact test specimens .................................................................................................. 31
Figure 4.1: Slump values of plastic concrete mixes ......................................................................... 33
Figure 4.2: 28 day-Average Compressive Strength of concrete mixes ............................................ 36
Figure 4.3: 28 day-Average Splitting Tensile Strength of concrete mixes ...................................... 37
Figure 4.4: 28 day-Average Flexural Strength of Concrete Mixes ................................................. 38
Figure 4.5: Concrete specimen containing PET aggregate after failure in the flexural strength test 39
Figure 4.6: Comparison of first crack and final failure values between concrete specimens .......... 41
Figure 4.7: Comparison of failure patterns of specimens with different PET ratio: (A) PET0; (B)
PET15; (C) PET30; (D) PET45 ....................................................................................................... 42
Figure 4.8: Comparison of first crack and final failure values different PET ratio: (A) PET0; (B)
PET15A; (C) PET30A; (D) PET45A ............................................................................................... 42

VIII
LIST OF TABLES
Table 2.1: Types and uses of plastics and recycled plastics ................................................................ 6
Table 3.1: Physical and mechanical properties of cement (CEM II 42.5 N) in IUG Lab ................. 14
Table 3.2: Specific Gravity values for Coarse Aggregates ............................................................... 16
Table 3.3: Bulk Density values for Coarse Aggregates .................................................................... 16
Table 3.4: Aggregate Absorption ...................................................................................................... 16
Table 3.5: Aggregate Sieve Analysis ................................................................................................ 17
Table 3.6: Sand physical Properties .................................................................................................. 19
Table 3.7: Sand Sieve Analysis ......................................................................................................... 19
Table 3.8: Properties of PET aggregate............................................................................................. 21
Table 3.9: Sieve Analysis of PET Aggregate .................................................................................... 21
Table 3.10: Mixing procedure according to ASTM C 192 ............................................................... 23
Table 3.11: Mix (PET0) proportions ................................................................................................. 23
Table 3.12: Mix (PET15) proportions ............................................................................................... 24
Table 3.13: Mix (PET30) proportions ............................................................................................... 24
Table 3.14: Mix (PET45) proportions ............................................................................................... 24
Table 3.15: Test Program for concrete with different amounts of PET aggregate ............................ 25
Table 4.1: Effect of recycled PET aggregate on slump test results ................................................... 33
Table 4.2: Effect of recycled PET aggregate on concrete density .................................................... 34
Table 4.3: 28 days- Compressive strength results of mix PET 0 (Reference mix) ........................... 34
Table 4.4: 28 days- Compressive strength results of mix PET 15 ................................................... 34
Table 4.5: 28 days- Compressive strength results of mix PET 30 …………………. ...................... 35
Table 4.6: 28 days- Compressive strength results of mix PET 45 .................................................... 35
Table 4.7: Effect of Recycled PET Plastic on Splitting Tensile Strength at Age of 28-days …. ...... 36
Table 4.8: Effect of Recycled PET Plastic on flexural Strength at Age of 28-days ........................ 38
Table 4.9: Drop Weight Impact Test Results (28-days) .................................................................. 40
Table 4.10: Average Drop Weight Impact Test Results (28-days) ................................................ 42

1
CHAPTER ONE
INTRODUCTION
1.1 Background
Concrete is the most widely used construction material in the world. There is a
concern to more understanding and to improve its properties. Using waste and recycled
materials in concrete mixes becoming increasingly important to manage and treat both the
solid waste generated by industry and municipal waste.
Plastic is one of the most significant innovations of 20th century material. The
amount of plastic consumed annually has been growing steadily and becomes a serious
environmental problem. For solving the disposal of large amount of recycled plastic
material, use of plastic in concrete industry is considered as feasible application.
Concrete volume contains from 65–80% aggregate and it plays a substantial role in
concrete properties such as workability, strength, dimensional stability, and durability, so
the use of waste materials in concrete as aggregates can effect in the amount of waste
materials deeply. Lightweight aggregate is an important material in reducing the unit
weight of concrete. A work has already been done on the use of plastic waste as
polyethylene terephthalate (PET) bottle such as Lightweight aggregates (Choi et al 2005).
A review on the use of plastic waste in preparation of cement mortar and concrete
preparation is already available, physical and mechanical properties for the application of
concrete modified with plastic were studied (Siddique et al).
Data about using plastic as aggregate were provided only for some of properties,
several important properties such as impact resistance, toughness, failure characteristics,
thermo-physical properties, durability performance of cement mortar and concrete
containing plastic as aggregate need more study.
This study aims at examining the effect of recycled plastic in concrete as coarse

2
aggregates in the impact resistance, through a better understanding the behavior of
recycled plastic in concrete structures, experimenting fresh and hardened concrete
mixtures containing recycled plastic.
1.2 Problem Statement:
Gaza Strip is a small closed coastal area (365 Km2) and a densely populated
area with population of 1,760,037 according to year 2014 Based on estimates prepared
by Palestinian Central Bureau of Statistics (PCBS).
Solid waste management continues to be seen as an important issue because the areas for
landfill disposal of waste are limited. Figure (1) details the components of solid waste in
Gaza strip (UNDP-PAPP, 2012).
Figure 1.1: The composition of solid wastes in Gaza strip
Pressures experienced on landfills and the hazardous nature of some of these materials
makes the use of these materials as aggregates a very attractive option. One of the new
waste materials used in the concrete industry is recycled plastic.
Few studies carried out in Gaza strip on recycled plastic wastes, focused on using
recycled plastic as shrinkage reinforcement in non-structural concrete slabs (Shihada and
Al_Buhaisi, 2013). Therefore, there is an urgent need to investigate the behavior of
3
recycled plastic as aggregate in concrete, and study the physical and mechanical properties
of this concrete.
1.3 Objectives of the Proposed Research:
The main objective set for this research is to study the potential use of recycled plastic
as a coarse aggregate of concrete material. This can be achieved through the following
objectives:
I. To study the physical and mechanical performance of recycled plastic
used in concrete mixtures in lieu of natural aggregate.
II. To examine the possibility of using recycled plastic in concrete mixes.
III. To find the optimum of plastic coarse aggregate to natural aggregate
replacement ratio, which produces the best concrete properties.
IV. To investigate the impact resistance of concrete with recycled plastic.
1.4 Methodology:
To achieve research objectives the following tasks are needed:
1. To conduct comprehensive literature review related to subject of recycled plastic.
2. Site visit to the recycled plastic plants.
3. Bringing samples of the recycled plastic from the plastic plants.
4. Making sieve analysis of the coarse plastic aggregate samples and natural
aggregate.
5. Performing physical and mechanical laboratory tests on the coarse plastic
aggregate samples and compare the results to the available standards.
6. Analyze the results and draw conclusions.
1.5 Research Scope:
This research is to produce concrete with coarse plastic coarse aggregate in the IUG lab,
and investigates the fresh and hardened properties of this production.
4
1- Characteristics of fresh concrete
The following aspects are considered:
Mix design
Workability
Outstanding flowability
Unit weight
Air content
Homogeneity
2- Characteristics of hardened concrete
In order to obtain the characteristics of hardened concrete the following tests will
be carried out:
Impact resistance
Compressive strength
Splitting tensile strength
Flexural strength
1.6 Thesis structure:
The study consists of seven chapters arranged as shown below. This section presents a
brief description of these chapters.
Chapter (1): In this chapter background, statement of problem, objectives,
methodology and scope of the research are included.
Chapter (2): Provides an overview of previous studies related to the subject of
this research work.
Chapter (3): The experimental details, experimental program, mixes preparation,
materials properties, and used tests are included in this chapter.
Chapter (4): This chapter describes the results of the test program
Chapter (5): Conclusion and Recommendations are included in this chapter
References
Appendices

5
CHAPTER TWO
LITERATURE REVIEW
This chapter provides an overview of previous studies related to the subject of this research
work. This is done in order to scope out the key data collection requirements for the
primary research to be conducted, and it formed part of the emergent research design
process.
2.1 Introduction
Plastics are polymers, a very large molecule made up of smaller units called monomers
which are joined together in a chain by a process called polymerization. The polymers
generally contain carbon and hydrogen with, sometimes, other elements such as oxygen,
nitrogen, chlorine or fluorine (UNEP, 2009).
Plastics have become an integral part of our lives. The amount of plastics consumed
annually has been growing steadily. Its low density, strength, user-friendly designs,
fabrication capabilities, long life, lightweight, and low cost are the factors behind such
phenomenal growth. Plastics have been used in packaging, automotive and industrial
applications, medical delivery systems, artificial implants, other healthcare applications,
water desalination, land/soil conservation, flood prevention, preservation and distribution
of food, housing, communication materials, security systems, and other uses. With such
large and varying applications, plastics contribute to an ever increasing volume in the solid
waste stream. The world’s annual consumption of plastic materials has increased from
around 5 million tons in the 1950s to nearly100 million tons in 2001 (Siddique et al.,
2008).
Quantities of waste plastic have been rising rapidly during the recent decades due to the
high increase in industrialization and the considerable improvement in the standards of
living, but unfortunately, the majority of these waste quantities are not being recycled
but rather abandoned causing certain serious problems such as the waste of natural
resources and environmental pollution.
2.2 Types and Uses of Plastic:
Plastic are classified according to the basis of the polymer, from which they are made.

6
The types of plastics that are most commonly reprocessed are polyethylene (PE),
polypropylene (PP), polyethylene terephthalate (PET), polystyrene (PS), and polyvinyl
chloride (PVC). Table 2.1 details the types and uses of plastic and recycled plastic.
Table (2.1): Types and uses of plastics and recycled plastics (Siddique et al., 2008), (UNEP, 2009)
Type of plastic Description Some uses for
virgin plastic
Some uses for
recycled plastic
Polyethylene
terephthalate(PET)
Clear tough plastic,
may be used as a fiber
Soft drink and mineral
water bottles
clear film for
packaging, carpet
fibers, fleecy jackets
Low density
polyethylene (LDPE)
Soft, flexible plastic,
milky white, unless a
pigment is added
Lids of ice-cream
containers, garbage
bags, and garbage bins
Film for builders,
industry, packaging
and plant nurseries
High density
polyethylene(HDPE)
Very common plastic,
usually white or
coloured
Crinkly shopping bags,
freezer bags, and milk
Compost bins,
detergent bottles,
crates, and mobile
rubbish bins
Unplasticised
Polyvinyl chloride
(UPVC)
Hard rigid plastic,
may be clear
Clear cordial and juice
bottles, plumbing pipes
and fittings
Detergent bottles,
tiles, and plumbing
pipe fittings
Plasticized
Polyvinyl chloride
(PPVC)
Flexible, clear, elastic
Plastic
Garden hose, shoe
soles, blood bags and
tubing
Hose inner core, and
industrial flooring
Polypropylene (PP) Hard, but flexible
plastic
Ice-cream containers,
potato crisp bags,
stools and chairs
Compost bins, kerb
side recycling crates,
and worm factories
Polystyrene (PS)
Rigid, brittle plastic.
May be clear, glassy
cheap, transparent
kitchen ware, light
fittings, bottles, toys,
and food containers
Clothes pegs, coat
hangers, and
video/CD boxes
Polyester (EPS) Foamed, lightweight,
energy absorbing, and
thermal insulation
Hot drink cups, and
takeaway food
containers
spools, rulers, and
video/CD boxes
Polyamides (PA) Nylons fibers, toothbrush
bristles, and fishing
lines

7
2.3 Previous studies related to using recycled plastic as aggregate:
Plastic aggregates used in many studies prepared from plastic waste obtained from
different sources. As example plastic bottles were grinded in the laboratory by using a
grinding machine and then sieved to get the suitable size fraction. (Frigione, 2010),
(Saikia and Brito, 2014)
Al-Manaseer and Dalal, (1997) investigated the effect of plastic aggregates on the bulk
density of concrete. For this purpose, they made 12 concrete mixes with different w/c
containing varying percentages (0%, 10%, 30%, and 50%) of plastic aggregates. Angular
post-consumer plastic aggregates having a maximum size of 13 mm were used. They
concluded that: (i) bulk density of concrete decreased with the increase in plastic
aggregates content; (ii) reduction in bulk density was directly proportional to the plastic
aggregates content; and (iii) density of concrete was reduced by 2.5%, 6%, and 13% for
concrete containing 10%, 30%, and 50% plastic aggregates, respectively. Reduction in
density was attributed to the lower unit weight of the plastics.
Marzouk et al. (2007) reported the bulk density of cement mortar mixes prepared by
replacing 0–100% in volume of sand by two different sizes of PET aggregates. Their
results showed that the reduction of bulk density remained small when the volume
occupied by aggregates varies between 0% and 30%, regardless of their size. However,
when this volume exceeded 50%, the composite bulk densities started to decrease until
reaching a value 1000 kg/ m3. They also found that for the same volumetric percentage
of substitution the bulk density decreased with decreasing particle size.
Ismail and Al-Hashmi,(2008) presented the possibility of using various plastic wastes,
containing approximately 80% polyethylene and 20% polystyrene, as fine aggregates, up
to 4.75 mm in concrete. By increasing the plastic waste content, the compressive tests
showed the tendency for compressive strength values of plastic waste concrete to
decrease below the reference concrete at each curing age. The concrete with 10% of
plastic waste displayed the lowest compressive strength at 28 days curing age, about 30%
lower than that of the reference concrete mixture. Also the study found 5%, 7%, and
8.7% lower densities of concrete mix containing 10%, 15%, and 20% plastic aggregates
respectively.

8
Choi et al. (2005) studied the effects of polyethylene terephthalate (PET) bottles
lightweight aggregate (WPLA) on the density of concrete. Mixture proportions of concrete
were planned so that the water/cement ratios were 45%, 49%, and 53%, and the
replacement ratios of WPLA were 0%, 25%, 50%, and 75% by volume of fine aggregate.
Density of concrete mixtures decreased with the increase in WPLA content. In their study
the influence of polyethylene terephthalate (PET) bottles lightweight aggregate (WPLA)
on the splitting tensile strength of concrete was observed. Mixture proportions of concrete
were planned. The water/cement they concluded that: (i) splitting tensile strength of
concrete mixtures decreased by 19%, 31%, and 54% with the increase in PET aggregates
by 25%, 50%, and 75% respectively; and (ii) for a particular PET aggregate content,
splitting tensile strength increased with the reduction in w/cm ratio. Also the study
investigated the effect of polyethylene terephthalate (PET) bottles lightweight aggregate
(WPLA) on the modulus of elasticity of concrete. According to the authors, modulus of
elasticity of concrete mixtures decreased with the increase in PET aggregates.
Saikia and Brito, (2014) presented the effects of size and shape of recycled polyethylene
terephthalate (PET) aggregate on the fresh and hardened properties. Three types of PET
aggregate, collected from a plastic recycling plant, two were shredded and separated
fractions of similar types of PET bottles and one was a heat-treated product of the same
PET bottles with sieve size from 0.5-11.2mm. 5%, 10% and 15% in volume of natural
aggregate in the concrete mixes were replaced by an equal volume of three differently
shaped and sized PET aggregates with deferent W/C ratios. Test results showed that
density of fresh concrete decreased as the content of plastic aggregate increased.
Differences in the size and shape of PET-aggregates affect the slump of fresh concrete
mixes, which ultimately change the mechanical behavior.
The study also observed a reduction in the compressive strength of concrete due to the
addition of PET-aggregates to replace natural aggregates. For 5% replacement the 28-day
compressive is more than 75% of the compressive strength of reference concrete. For
concrete with 10% and 15% plastic aggregate are respectively 71% and 59%. According
to the authors, natural aggregates and PET-aggregate cannot interact with cement paste
and therefore the interfacial transition zone in concrete containing PET-aggregate is
weaker than that in the reference concrete, which lowers the resulting compressive
strength.

9
The study presented the abrasion behaviour of concrete specimens (depth of wear and
weight loss) containing various types and contents of PET-aggregate, and the reference
concrete. In this paper, 5%, 10% and 15% in volume of natural aggregate in the concrete
mixes were replaced by an equal volume of three differently shaped and sized PET-
aggregates. According to the authors, the abrasion resistance of the concrete mixes with
the various types of PET-aggregate is better than that of the normal concrete, also they
found that the behaviour of the abrasion resistance of concrete arising from the
incorporation of various types and contents of PET-aggregate suggests that this property
depends on the compressive strength of concrete as well as on the properties of plastics.
Albano et al. (2009) carried out a study include concrete with 10% of recycled PET
exhibits a compressive strength that meets the standard strength values for concrete with
moderate strength between 21 and 30 MPa for a curing age of 28 days. They reported
that the compressive strength at the age of 28 days is near the values for 60 days. Several
factors were taken in consideration such as the type of failure and the formation of
honeycombs, low workability, particle size, which are responsible for lower compressive
strength of concrete containing PET aggregate than concrete containing natural
aggregate. The reduction in compressive strength was more in concrete containing larger
flaky PET aggregate than smaller one.
Hannawi et al. (2010) investigated the effect of using Non-biodegradable plastic
aggregates made of polycarbonate (PC) and polyethylene terephthalate (PET) waste as
partial replacement of natural aggregates in mortar. Various volume fractions of sand 3%,
10%, 20% and 50% are replaced by the same volume of plastic. The authors found a
decrease in compressive strength when the plastic aggregates content increases. The drop
in compressive strength seems to be not proportional to the volume fraction of sand
replaced by plastic aggregates. a decrease of 9.8%, 30.5%, 47.1% and 69% for mixtures
with, respectively, 3%, 10%, 20% and 50% of PET-aggregates, and of 6.8%, 27.2%,
46.1% and 63.9% for mixtures containing, respectively,3%, 10%, 20% and 50% of PC-
aggregates is observed. According to authors the drop in compressive strengths due to the
addition of plastic aggregates can be attributed mainly to the poor bond between the
matrix and plastic aggregates.
The study presented the variations in the flexural strength of different mixtures as a
function of the percentage of sand (in volume) replaced by the same volume of plastic

10
aggregate. By comparing to control mixture, no significant changes are observed for
mixtures containing up to 10% of PET-aggregates and up to 20% of polycarbonate (PC)
aggregates. According to the authors, a decrease of 9.5% and 17.9% for mixtures with,
respectively, 20% and 50% of PET-aggregates is observed. For mixtures with 50% of PC-
aggregates, a decrease of 32.8% is measured. The authors found that the calculated flexural
toughness factors increase significantly with increasing volume fraction of PET and PC-
aggregates. Thus, addition of PC and PET plastic aggregates in cementitious materials can
give a good energy absorbing material which is very interesting for several civil
engineering applications like structures subjected to dynamic or impact.
Frigione (2010) founds lower values of splitting tensile strength in concrete containing
PET aggregate prepared using high w/c value than in a similar mix prepared at low w/c
value.By replacing 5% by weight of fine aggregate (natural sand) with an equal weight of
PET aggregates manufactured from the waste un-washed PET bottles. Specimens with
different cement content and water/cement ratio were manufactured.
Kou et al. (2009) investigated the fresh and hardened properties of lightweight aggregate
concretes that are prepared with the use of recycled plastic waste sourced from scraped
PVC pipes to replace river sand as fine aggregates. Concrete mixes were tested, in which
river sand was partially replaced by PVC plastic waste granules in percentages of 0%,
5%, 15%, 30% and 45% by volume. Splitting tensile strength 28-day values are 3.06,
2.89, 2.82, 2.58 and 1.83 MPa, respectively.
Akçaözoglu et al. (2010) carried out a study of using shredded waste PET bottles as
aggregate in lightweight concrete. Investigation was carried out on two groups of mortar
samples, one made with only PET aggregates and, second made with PET and sand
aggregates together. The authors found average values of flexural strength similar to
those of normal weight mortar.
Rahmani et al. (2013) investigated the effects of replacing 5%, 10% and 15% substitution
of sand with PET processed particles. To determine the effect of the percentage of sand
replacement with PET on concrete flexural strength, some beam specimens with
dimensions of 50 × 10 × 10 cm3 were casted.

11
According to the authors, the flexural strength has an increasing trend at first when the
amount of PET particles increases, but it drops after a while.
For example, the 5% replacement of sand volume with PET particles with w/c ratios of
0.42 and 0.54 shows 6.71% and 8.02% increase in flexural strength, respectively.
However, 15% substitution of PET particles with w/c ratio of 0.42 and 0.54 yielded
14.7% and 6.25% reduction in the flexural strength, respectively. Also the study observed
the effects of PET particles on tensile strength. By replacing 15% of sand volume with
PET particles, the reduction occurred in tensile strength were 15.9% and 18.06%,
respectively.
2.4 Concrete Impact Resistance
ACI Committee 544-89 proposed a drop-weight impact test (Fig. 2.1) to evaluate the
impact resistance of fibre concrete. This test yields the number of blows necessary to cause
prescribed levels of distress in the test specimen. This number serves as a qualitative
estimate of the energy absorbed by the specimen at the levels of distress specified. The
equipment for the drop-weight impact test consists of: (1) a standard, manually operated 10
lb. (4.54 kg) compaction hammer with an 18-in. (457-mm) drop, (2) a 2 .5 in. (63.5 mm)
diameter hardened steel ball, and (3) a flat baseplate with positioning bracket. In addition
to this equipment, a mold to cast 6 in. (152 mm) diameter by 2 .5 in. (63.5 mm) thick [±1/8
in., ± (3mm)] concrete specimens is needed.
2.5 in. (63.5 mm) thick by 6 in. (152mm) diameter concrete samples are made in molds
according to procedures recommended for compressive cylinders but using only one layer.
The molds can be filled partially to the 2 .5 in. (63.5 mm) depth and finished, or they can be
sawn from full-size cylinders to yield a specimen size of the proper thickness.
Specimens cut from full-size cylinders are preferred. If fibers longer than 0.80 in. (20 mm)
are used, the test should be cut from a full-size cylinder to minimize preferential fiber
alignment. According to the committee, results of tests exhibit a high variability and may
vary considerably with the different types of mixtures, fiber contents, etc.

12
Figure 2.1: Drop-weight impact test [ACI Committee 544-89]
Soroushian et al. (2003) studied the effect of recycled plastic on the impact resistance of
concrete using the repeated dropping test recommended by ACI Committee 544. The
specimens were moist-cured for 28 days, and then allowed to air dry in the laboratory at
50% relative humidity and 22 °C for an additional 3 months. The mean values and 95%
confidence intervals were derived using nine specimens for each concrete material. It is
evident that all discrete reinforcement systems considered herein yielded important gains
in the impact resistance.
2.5 Concluding Remarks
The previous studies showed that lot of efforts have been done for investigating the
effect of using waste/recycled plastic materials as a component in the concrete mix, but
all of them are trying to confirm the situation and the relevant specifications in their
local areas. This research aims to implement a similar task but with applying the
available locally used materials specially using PET plastic bottles as a coarse aggregate
replacement.

13
CHAPTER THREE
EXPERIMENTAL PROGRAM
3.1 Introduction
This chapter presents the experimental program and the constituent materials used to
investigate the potential usefulness of using recycled plastic in the concrete mixes as
aggregates.
In this experimental work, effects of recycled plastic on different properties of concrete
will be seen by adding different amounts to the concrete. Several parameters were
considered in the test program such as the way of using recycled plastic, the type of
recycled plastic, the particles shape, and the percentages of recycled plastic in concrete
mixes. This work presents the test procedure, details and equipment’s used to assess
concrete properties.
The laboratory investigation consisted of tests for both fresh and hardened concrete
properties. Fresh concrete was tested for slump flow to ensure reasonable workability of
concrete. The tests for hardened concrete included compression tests for strength,
indirect tensile tests (split cylinder and flexural strength tests) and impact resistance test.
The properties of different constituent materials used to produce concrete with plastic
aggregates are also discussed such as moisture content, unit weight, specific gravity and
the grain size distribution. The test procedures, details and equipment used to assess
concrete properties are illustrated in the following sections.
3.2 Materials
The materials were used in the test program include ordinary Portland cement, natural
coarse aggregate, sand, water and recycled plastic . Material properties were as
follows:
3.2.1 Cement
Portland cement type CEM II/A-M (SLV) 42.5 N was used throughout the
investigation. The cement was obtained from local concrete manufacture and kept in dry
location. The cement source is Sanad Company. The cement met the requirements of
14
ASTM C 150 specifications. The results of physical and mechanical analyses of the
cement are summarized in Table 3.1 along with the requirements of relevant ASTM
specifications for comparison purposes.
Table 3.1: Physical and mechanical properties of cement (CEM II 42.5 N) in IUG Lab.
TEST RESULTS ASTM C 150 Requirements
Setting Time (vicat test)
Initial
final
130 min
3 hrs. 30 min
>60 min
<6 hrs. 15 min
Compressive Strength(MPa)
3 days
7 days
28 days
16.47
29.81
44.03
Min. 12
Min. 19
---------
Fineness(cm2
/gm) 3223.6 Min. 2800
Normal Consistency (%) 25.5 ---------
3.2.2 Water
Tap water, potable without any salts or chemicals was used in in all concrete mixtures
and in the curing of specimens. The water source was the soil and material laboratory in
Islamic University Gaza.
3.2.3 Aggregates
Two main categories of aggregate were used, coarse and fine aggregates,
according to ASTM C33 for aggregate classification.
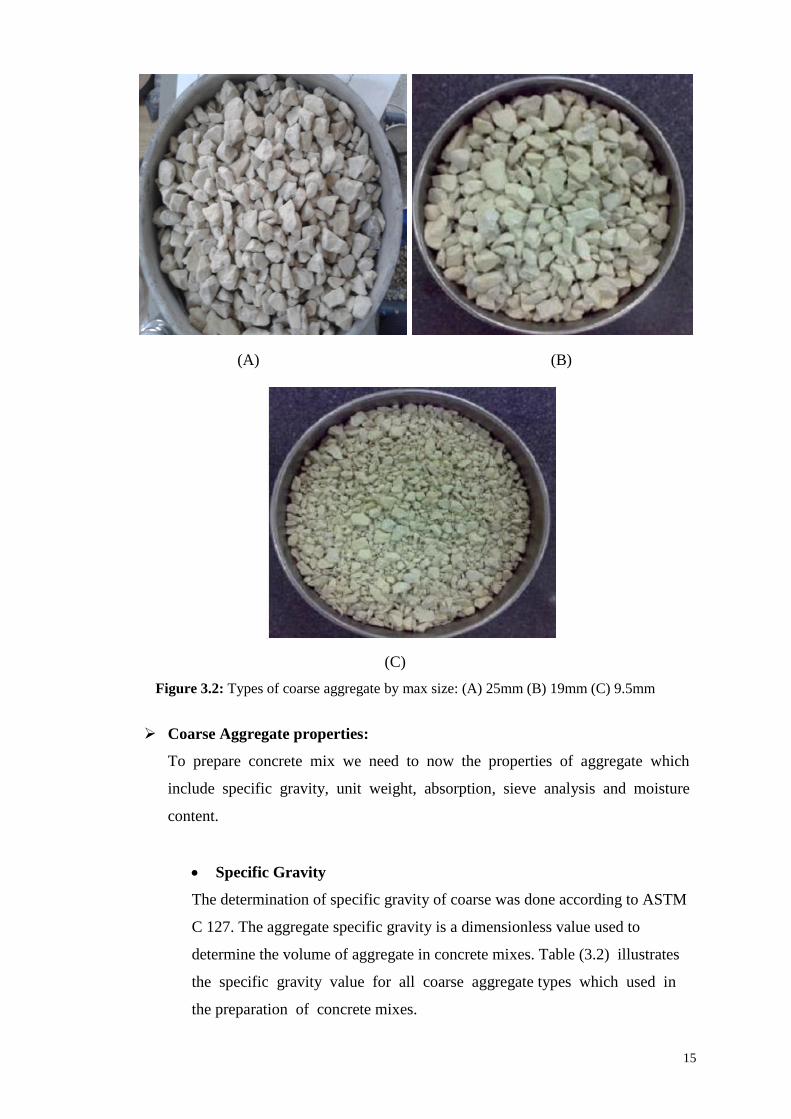
3.2.3.1 Coarse aggregate
Locally available crushed limestone coarse aggregate was used in this study. The
maximum nominal size of coarse aggregate is (25mm). Figure (3.2) shows samples of
various types of coarse natural aggregates that were used for composing the concrete
mixes throughout the experimental testing program for this research study.
15
(A) (B)
(C)
Figure 3.2: Types of coarse aggregate by max size: (A) 25mm (B) 19mm (C) 9.5mm
Coarse Aggregate properties:
To prepare concrete mix we need to now the properties of aggregate which
include specific gravity, unit weight, absorption, sieve analysis and moisture
content.
Specific Gravity
The determination of specific gravity of coarse was done according to ASTM
C 127. The aggregate specific gravity is a dimensionless value used to
determine the volume of aggregate in concrete mixes. Table (3.2) illustrates
the specific gravity value for all coarse aggregate types which used in
the preparation of concrete mixes.
16
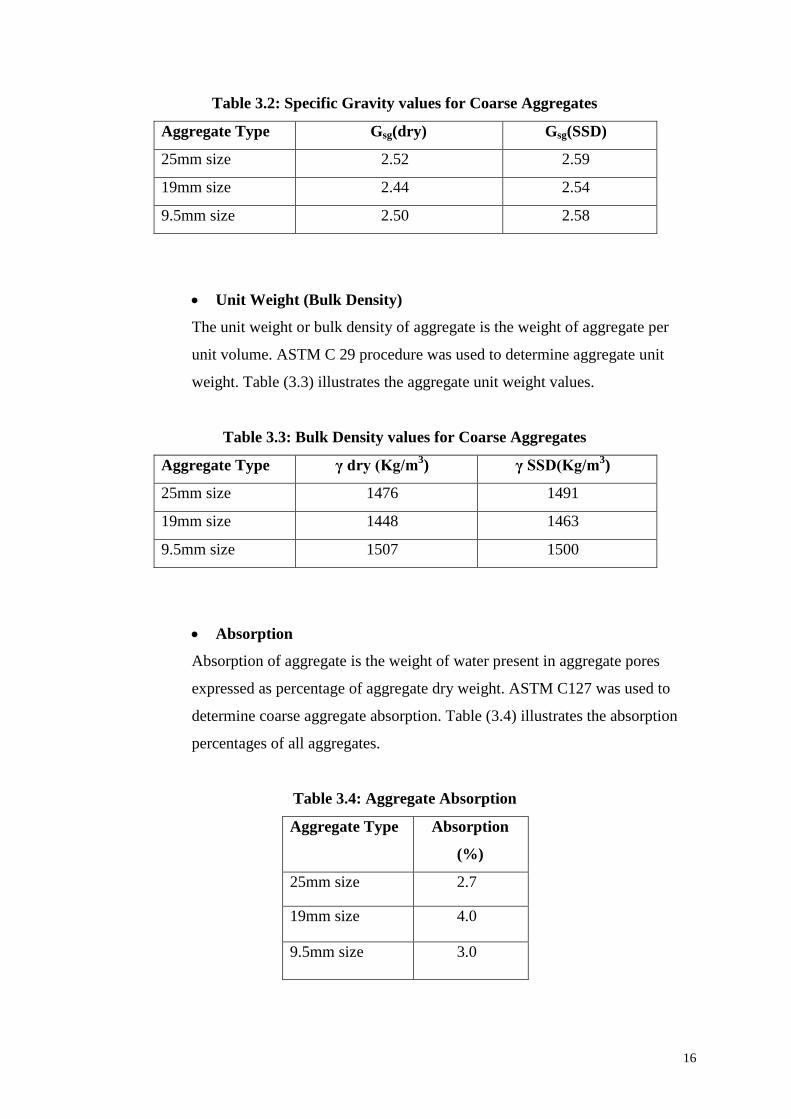
Table 3.2: Specific Gravity values for Coarse Aggregates
Aggregate Type Gsg(dry) Gsg(SSD)
25mm size 2.52 2.59
19mm size 2.44 2.54
9.5mm size 2.50 2.58
Unit Weight (Bulk Density)
The unit weight or bulk density of aggregate is the weight of aggregate per
unit volume. ASTM C 29 procedure was used to determine aggregate unit
weight. Table (3.3) illustrates the aggregate unit weight values.
Table 3.3: Bulk Density values for Coarse Aggregates
Aggregate Type γ dry (Kg/m3) γ SSD(Kg/m
3)
25mm size 1476 1491
19mm size 1448 1463
9.5mm size 1507 1500
Absorption
Absorption of aggregate is the weight of water present in aggregate pores
expressed as percentage of aggregate dry weight. ASTM C127 was used to
determine coarse aggregate absorption. Table (3.4) illustrates the absorption
percentages of all aggregates.
Table 3.4: Aggregate Absorption
Aggregate Type Absorption
(%)
25mm size 2.7
19mm size 4.0
9.5mm size 3.0
17
Moisture Content
The aggregate moisture content is the percentage of water present in a sample
of aggregate either inside pores or in the surface. Moisture content of coarse
and fine aggregate was done according to ASTM C 566. The moisture
content was 1% for all types.
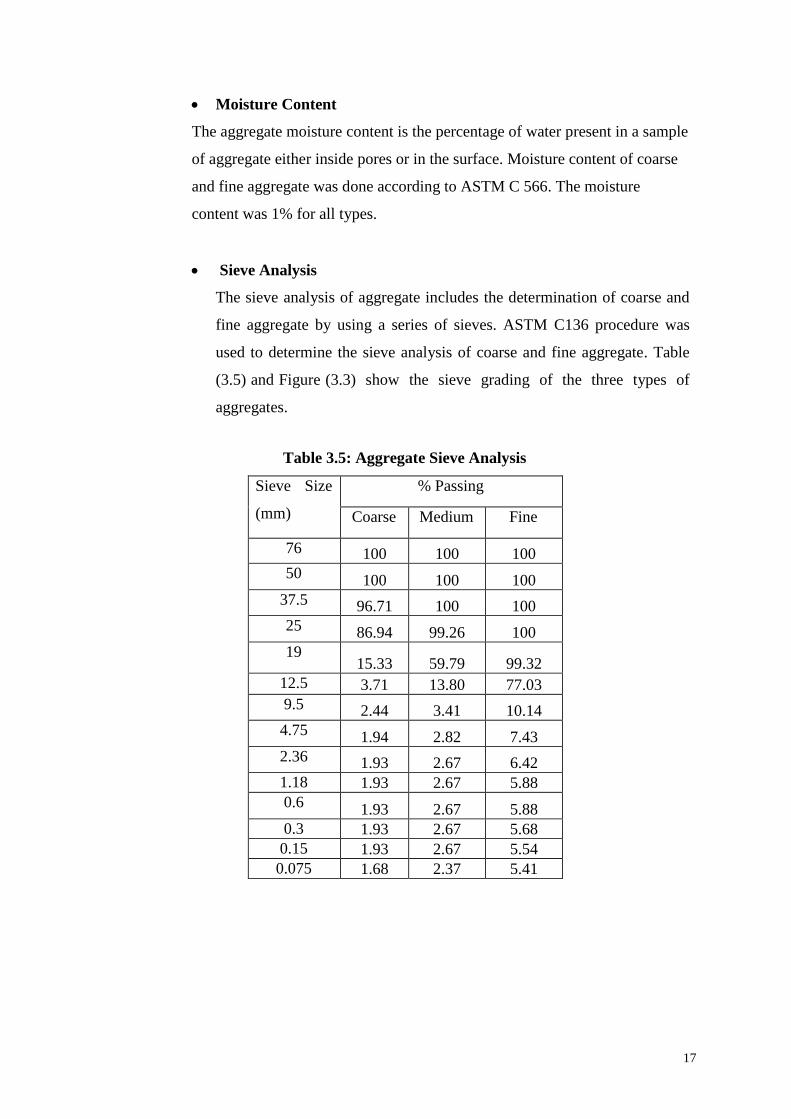
Sieve Analysis
The sieve analysis of aggregate includes the determination of coarse and
fine aggregate by using a series of sieves. ASTM C136 procedure was
used to determine the sieve analysis of coarse and fine aggregate. Table
(3.5) and Figure (3.3) show the sieve grading of the three types of
aggregates.
Table 3.5: Aggregate Sieve Analysis
Sieve Size
(mm)
% Passing
Coarse Medium Fine
76 100 100 100
50 100 100 100
37.5 96.71 100 100
25 86.94 99.26 100
19 15.33 59.79 99.32
12.5 3.71 13.80 77.03
9.5 2.44 3.41 10.14
4.75 1.94 2.82 7.43
2.36 1.93 2.67 6.42
1.18 1.93 2.67 5.88
0.6 1.93 2.67 5.88
0.3 1.93 2.67 5.68
0.15 1.93 2.67 5.54
0.075 1.68 2.37 5.41

18
Figure 3.3: Sieve analysis of aggregate
3.2.4 Sand
Sand is a natural material, and it is available in Gaza strip. Sand was tested for physical
properties as shown in Table(3.6).The appearance of Gaza sand is shown in
Figure(3.4):
Figure 3.4: Natural Sand Sample
0
10
20
30
40
50
60
70
80
90
100
110
0.01 0.1 1 10 100
%
p
a
s
s
i
n
g
sieve size(mm)
Agregate Sieve Analysis
25 mm max. size
19mm max. size
9.5 mm max. size
19
Table 3.6: Sand physical Properties
Gsg(SSD) 2.54
Gsg(Dry) 2.44
Absorption % 4.0
Moisture content 1.4
Dry unit weight (kg/m3) 1656
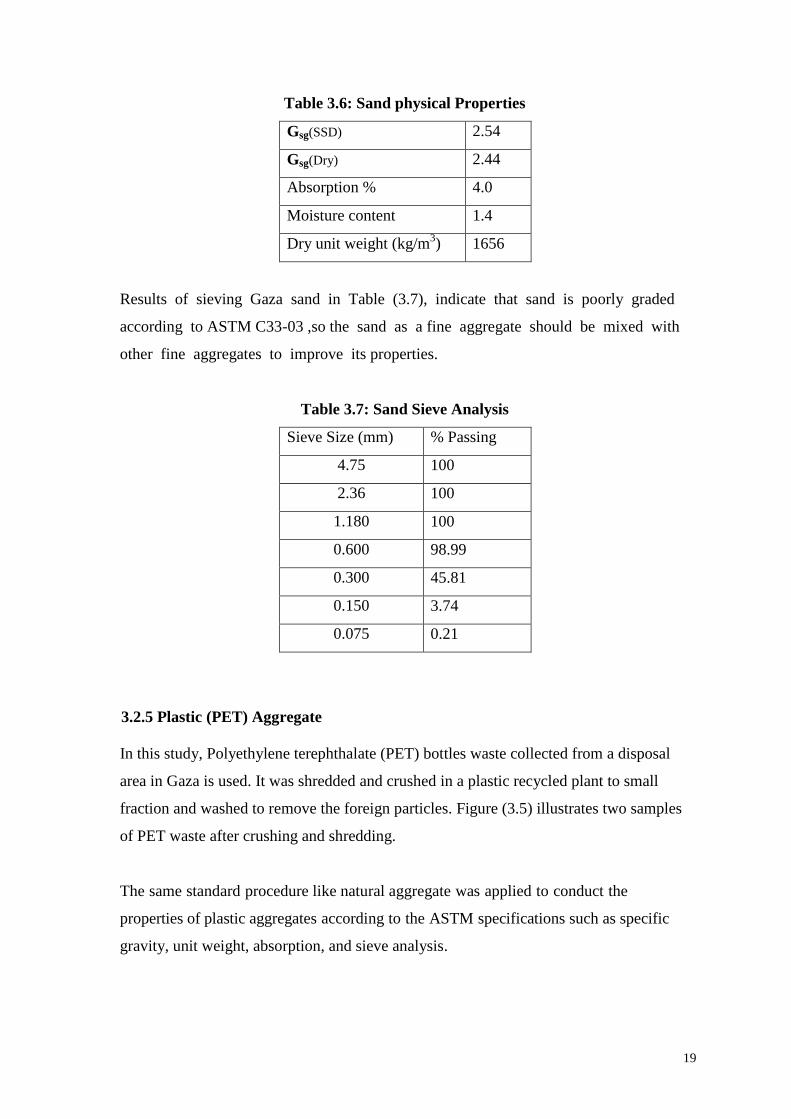
Results of sieving Gaza sand in Table (3.7), indicate that sand is poorly graded
according to ASTM C33-03 ,so the sand as a fine aggregate should be mixed with
other fine aggregates to improve its properties.
Table 3.7: Sand Sieve Analysis
Sieve Size (mm) % Passing
4.75 100
2.36 100
1.180 100
0.600 98.99
0.300 45.81
0.150 3.74
0.075 0.21
3.2.5 Plastic (PET) Aggregate
In this study, Polyethylene terephthalate (PET) bottles waste collected from a disposal
area in Gaza is used. It was shredded and crushed in a plastic recycled plant to small
fraction and washed to remove the foreign particles. Figure (3.5) illustrates two samples
of PET waste after crushing and shredding.
The same standard procedure like natural aggregate was applied to conduct the
properties of plastic aggregates according to the ASTM specifications such as specific
gravity, unit weight, absorption, and sieve analysis.

20
(A)
(B)
Figure 3.5: (A) Crushed PET Bottles sample / (B) shredded PET Bottles sample

21
The experimental results of the PET plastic aggregate properties are presented in Table
(3.8).
Table 3.8: Properties of PET aggregate
Property Result
Specific Gravity 1.348
Absorption % 0.02
Unit weight (kg/m3) 589
Grading and Sieve Analysis
The sieve analysis of plastic PET aggregate includes the determination of
coarse and fine aggregate by using a series of sieves. As natural
aggregate, ASTM C136 procedure was used to determine the sieve
analysis of coarse and fine plastic PET aggregate. Table (3.9) and figure
(3.6) show the sieve grading of the plastic aggregate.
Table (3.9): Sieve analysis of PET Aggregate
Sieve Size % Passing
76 100
50 100
37.5 100
25 100
19 96.23
12.5 72.69
9.5 68.31
4.75 22.72
2.36 2.74

22
Figure 3.6: Sieve Analysis of PET Aggregate
3.3 Mix Preparation
In this study, the mix proportions were prepared according to ACI 211.1 as shown in
appendix (A). The concrete mixes were all prepared using the same method, developed
by
the research team, which implies the use of exactly the same aggregates grading curve
and concrete composition in terms of cement content, coarse and fine aggregate
quantities and slump value.
Four concrete mixes were prepared in this study with compressive strength B300. One
concrete mix contains only natural aggregate as reference and three concrete mixes
contain PET aggregate by replacing 15%, 30% and 45% in volume of natural aggregate
by an equal volume of PET aggregate.
Three samples for every concrete mix were prepared to be tested for compressive
strength at 28 days. Also, Three specimens were prepared for Splitting tensile
strength and the same number for flexural test, these specimens were tested at age
28 day. Concrete containing PET aggregate has to comply with the same requirements as
concrete made with natural aggregate.
The mix operation of concrete for all samples was taken place in a conventional
blade-type mixer according to ASTM C192. Table (3.10) summarized the mix
0
10
20
30
40
50
60
70
80
90
100
0.01 0.1 1 10 100
% P
assi
ng
Sieve Size (mm)
PET Aggregate Sieve Analysis

23
operation procedure which followed for natural aggregate and PET aggregate concrete
mixes.
Table (3.10): Mixing procedure according to ASTM C 192
Step # Description
1. Prior to start mix, add coarse aggregate, some of mixing water
which may contain admixture if required.
2. Start mixer.
3. Add fine aggregate contained sludge, cement, and remaining
water with mixer running.
4. With all ingredients in the mixer, mix for 3 minutes.
5. Stop mixing for 3 minutes.
6. Mix for 2 minutes.
3.4 Mix proportions A total of four concrete mixes(PET0, PET15, PET30, PET45) containing three
percentages of PET-aggregate, plus one reference concrete (exclusively with Natural
Aggregate) mix, were prepared in this work. The compositions of the concrete mixtures
are shown in Tables (3.11) through (3.14). The volume of the PET-aggregate for PET0,
PET15, PET30, and PET45 are 0 m3, 0.065 m
3, 0.13 m
3 and 0.269 m
3 respectively.
Table (3.11): Mix (PET0) proportions
Material
Description
Size/Type Weight
(Kg/m3)
Source
Cement CEM II 300 Nisher
Aggregate 25mm 650 Crushed Limestone
Aggregate 19mm 270 Crushed Limestone
Aggregate 9.5mm 270 Crushed Limestone
water Tap 200 IUG Lab
sand 0.6 630 Gaza
PET 19-4.75 mm 0 Gaza
Total 2320

24
Table (3.12): Mix (PET15) proportions
Material
Description
Size/Type Weight
(Kg/m3)
Source
Cement CEM II 300 Nisher
Aggregate 25mm 560.75 Crushed Limestone
Aggregate 19mm 225.38 Crushed Limestone
Aggregate 9.5mm 225.38 Crushed Limestone
water Tap 200 IUG Lab
sand 0.6 630 Gaza
PET 19-4.75 mm 87.47 Gaza
Total 2228.98
Table (3.13): Mix (PET30) proportions
Material
Description
Size/Type Weight
(Kg/m3)
Source
Cement CEM II 300 Nisher
Aggregate 25mm 471.5 Crushed Limestone
Aggregate 19mm 180.75 Crushed Limestone
Aggregate 9.5mm 180.75 Crushed Limestone
water Tap 200 IUG Lab
sand 0.6 630 Gaza
PET 19-4.75 mm 174.93 Gaza
Total 2137.93
Table (3.14): Mix (PET45) proportions
Material
Description
Size/Type Weight
(Kg/m3)
Source
Cement CEM II 300 Nisher
Aggregate 25mm 332.25 Crushed Limestone
Aggregate 19mm 136.12 Crushed Limestone
Aggregate 9.5mm 136.12 Crushed Limestone
water Tap 200 IUG Lab
sand 0.6 630 Gaza Sand
PET 19-4.75 mm 362.40 Gaza
Total 2096.89

25
3.5 Testing Program
The present study concentrated on developing the most straightforward mix design and
preparation techniques to produce concrete containing recycled/waste PET plastic with
acceptable properties in fresh and hardened states. The influence of recycled PET on
concrete properties was studied by preparing several concrete mixes involving different
amount and shape of recycled PET plastic. In this work, two main sizes of recycled PET
were used in concrete mixes. These two sizes included crushed and shredded
recycled/waste PET.
For the testing program, a series of standard tests were conducted with variable amounts
of PET aggregate as follow:
To evaluate the effect of PET aggregate on compressive strength of concrete, total
of 24(100x100x100 mm) concrete cubes will be made according to ASTM
specifications.
To see the effect of PET aggregate on tensile strength of concrete, total of 12 (150
x 300mm) cylinders will be made based on ASTM specifications.
A total of 12(100 x 100 x 500 mm) concrete beams will be set to check the effect
of PET aggregate on flexural strength of reinforced concrete, in accordance ASTM
specifications. Table (3.15) illustrates the different tests which conducted for every
concrete mix with constant water/cement ratio.
Table (3.15): Test Program for concrete with different amounts of PET aggregate
W/C Ratio % 0.5 TOTAL
Replaced % of Natural Aggregate
by PET aggregate (by volume)
0% 15% 30% 45%
Compressive strength at 28 days 3 3 3 3 23
Splitting tensile strength at 28 days 3 3 3 3 12
Flexural strength at 28 days 3 3 3 3 12
Impact resistance at 28 days 3 3 3 3 35
Slump value 3 3 3 3 12
Bulk density (Unit weight ) 3 3 3 3 12
Total number of different tests 96

26
3.6 Equipment and testing procedure
The laboratory work consists of fresh and hardened concrete tests. Fresh concrete tested
for slump value. Hardened concrete tested for compressive strength, splitting tensile test,
flexural test and impact resistance test.
3.6.1 Fresh concrete tests
3.6.1.1 Slump Test
Slump test was conducted to assess the workability of fresh reference concrete and
concrete containing PET aggregate. The slump test was carried out according to ASTM
C143. For each mix in the experiment program, a sample of freshly mixed concrete is
placed and compacted by rod in a frustum of cone mold. As shown in figure (3.7), the
slump value is equal to vertical distance between the original and displaced position of
the center of the top surface of the concrete after raising a mold.
Figure 3.7: Slump Value Test
3.6.1.2 Density
In this study, the density of concrete cube specimens is the theoretical density. The
density is calculated by dividing the weight of each cube on the cube volume. The same
cube specimens which used to determine compressive strength were used to determine
the density in the same procedure.
27
3.6.2 Hardened concrete tests
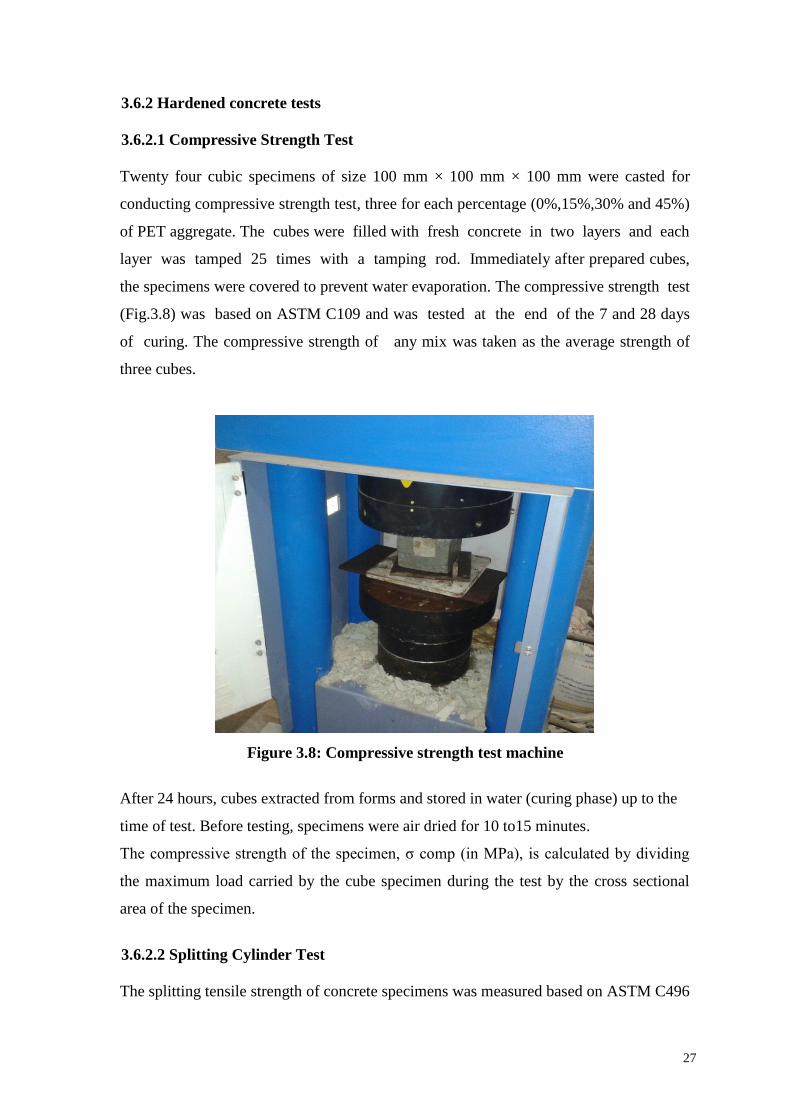
3.6.2.1 Compressive Strength Test
Twenty four cubic specimens of size 100 mm × 100 mm × 100 mm were casted for
conducting compressive strength test, three for each percentage (0%,15%,30% and 45%)
of PET aggregate. The cubes were filled with fresh concrete in two layers and each
layer was tamped 25 times with a tamping rod. Immediately after prepared cubes,
the specimens were covered to prevent water evaporation. The compressive strength test
(Fig.3.8) was based on ASTM C109 and was tested at the end of the 7 and 28 days
of curing. The compressive strength of any mix was taken as the average strength of
three cubes.
Figure 3.8: Compressive strength test machine
After 24 hours, cubes extracted from forms and stored in water (curing phase) up to the
time of test. Before testing, specimens were air dried for 10 to15 minutes.
The compressive strength of the specimen, σ comp (in MPa), is calculated by dividing
the maximum load carried by the cube specimen during the test by the cross sectional
area of the specimen.
3.6.2.2 Splitting Cylinder Test
The splitting tensile strength of concrete specimens was measured based on ASTM C496

28
Standard test. Twelve cylindrical specimens of size 150 mm in diameter and in height
300 mm were cast. Three specimens for each percentage (0%, 15%, 30% and 45%) of
PET aggregate.
The tensile strength of concrete is evaluated using a split cylinder test, in which a
cylindrical specimen is placed on its side and loaded in diametrical compression, so to
induce transverse tension. Practically, the load applied on the cylindrical concrete
specimen induces tensile stresses on the plane containing the load and relatively high
compressive stresses in the area immediately around it. When the cylinder is compressed
by the two plane-parallel face plates, situated at two diametrically opposite points on the
cylinder surface then, along the diameter passing through the two points, the major
tensile stresses are developed which, at their limit, reach the fracture strength value
ASTM C496 indicates that the maximum fracture strength can be calculated based on
the following equation:
F = 2P/ πDL
Where: P is the fracture compression force acting along the cylinder;
D is the cylinder diameter;
π = 3.14;
L is the cylinder length.
3.6.2.3 Flexural strength test
The flexural strengths of concrete specimens are determined by the use of simple beam
(100 x 100 x 500) mm with center point loading in accordance to ASTM C293 as shown
in Figures (3.9) and (3.10). Twelve beam specimens of size 100 x 100 x 500 were casted.
Figure 3.9: Flexure strength test machine

29
Figure 3.10: Center point loading for flexural strength test
The flexural strength of the beam in MPa can be calculated by using the following
equation:
Flexural Strength (MPa) =
Where:
P: Maximum applied load;
L: Material span length between points in the test setup;
b: Width of the material specimen;
h: Average depth of the specimen.
The center point loading device is adjusted so that its bearing edge is at exactly right
angles to the length of the beam and parallel to its top face as placed, with the center of
the bearing edge directly above the center line of the beam and at the center of the span
length. The load contacts with the surface of the specimen at the center. If full contact is
not obtained between the specimen and the load applying or the support blocks so that
there is a gap, the contact surfaces of the specimen are capped. The specimen is loaded
continuously and without shock at until rupture occurs. The maximum load indicated by
the testing machine is recorded.
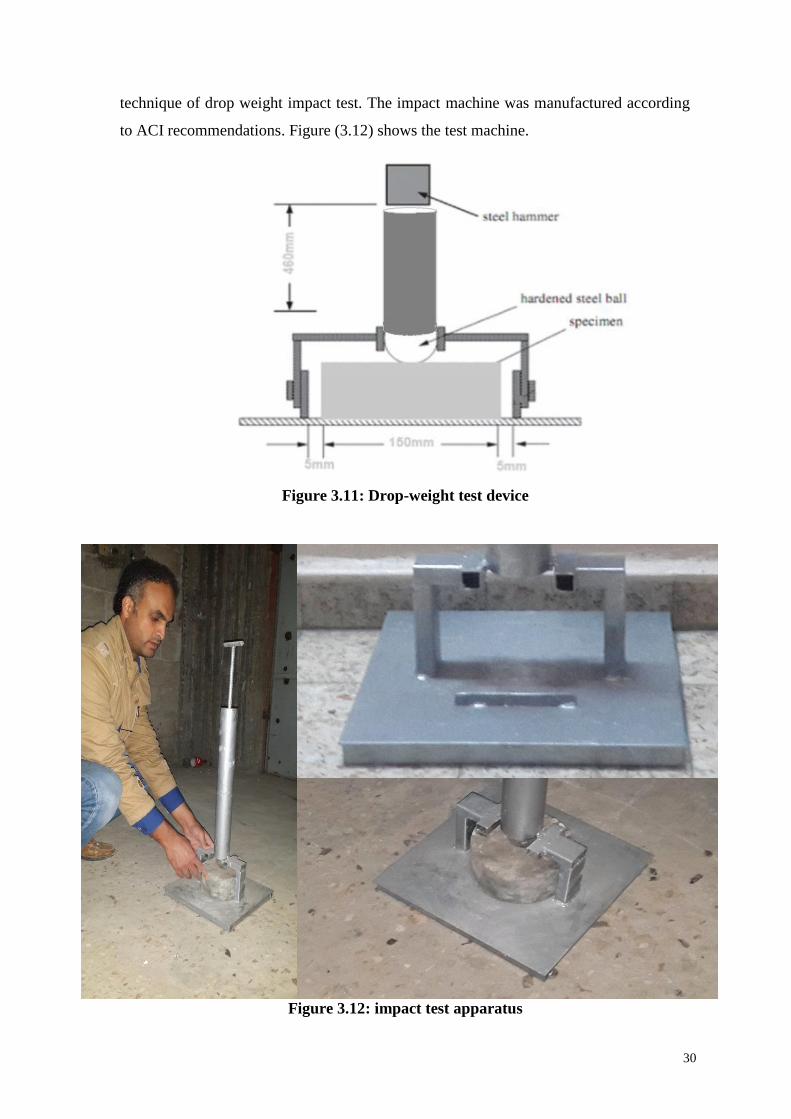
3.6.2.4 Impact resistance test
The impact test was performed in accordance with the impact testing procedures
recommended by ACI Committee 544 as shown in figure (3.11). The test was carried out
by dropping a rod weighing 49 N (11 lb.) in a tube with a height of 460 mm (18.1 inch)
repeatedly on a 48 mm diameter (2 inch) hardened steel ball, which is placed on the top
of the center of the cylindrical specimen (disc).
Special impact machine was designed and fabricated using local materials adopting the
30
technique of drop weight impact test. The impact machine was manufactured according
to ACI recommendations. Figure (3.12) shows the test machine.
Figure 3.11: Drop-weight test device
Figure 3.12: impact test apparatus
31
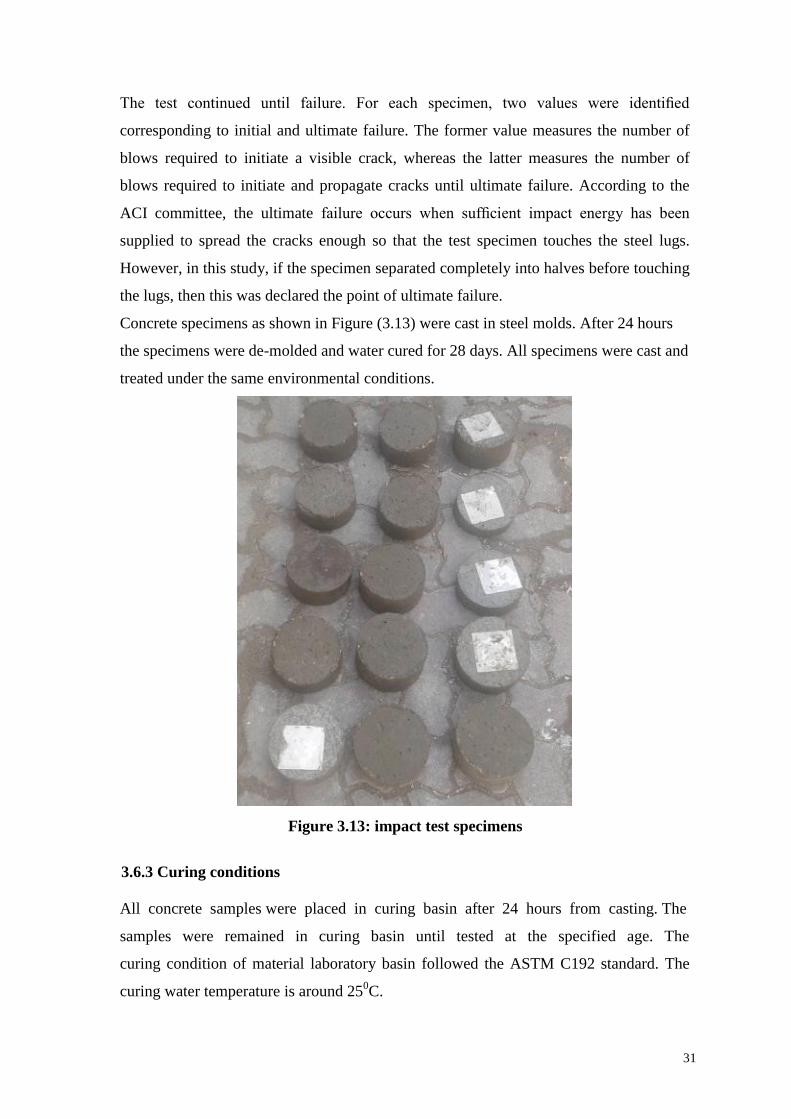
The test continued until failure. For each specimen, two values were identified
corresponding to initial and ultimate failure. The former value measures the number of
blows required to initiate a visible crack, whereas the latter measures the number of
blows required to initiate and propagate cracks until ultimate failure. According to the
ACI committee, the ultimate failure occurs when sufficient impact energy has been
supplied to spread the cracks enough so that the test specimen touches the steel lugs.
However, in this study, if the specimen separated completely into halves before touching
the lugs, then this was declared the point of ultimate failure.
Concrete specimens as shown in Figure (3.13) were cast in steel molds. After 24 hours
the specimens were de-molded and water cured for 28 days. All specimens were cast and
treated under the same environmental conditions.
Figure 3.13: impact test specimens
3.6.3 Curing conditions
All concrete samples were placed in curing basin after 24 hours from casting. The
samples were remained in curing basin until tested at the specified age. The
curing condition of material laboratory basin followed the ASTM C192 standard. The
curing water temperature is around 250C.

32
CHAPTER 4
TEST RESULTS AND ANALYSIS
4.1 Introduction
This chapter describes the results of the test program designed to study the physical and
mechanical properties of the various PET aggregate concrete mixes as described in
chapter 3. Slump test, density, compressive strength, flexural strength, splitting tensile
strength and impact resistance test of concrete specimens were discussed to investigate
the influence of PET aggregate on concrete properties.
The test results of this study, focus on the behavior of recycled PET aggregate in
concrete mixes. The quantity of PET aggregate was calculated according to ACI 211.1
code provisions. Four mixes of concrete were used with 0%, 15%, 30% and 45%
replacing of natural aggregate with recycled PET aggregate. The physical and
mechanical properties were discussed as follows:
4.2 Fresh concrete properties tests results
4.2.1 Slump (workability)
The slump value was used as indication of mix workability and all the mixes
was designed for 80-100mm slump value. Table (4.1); shows the results of the slump
tests of PET plastic aggregate concrete mixtures, these results indicate that the slump
value of fresh concrete is prone to decrease with increasing the plastic aggregate ratio.
The reductions of slump are 10%, 28%, and 50% for 15%, 30%, 45% replacement of
natural aggregate by PET aggregate respectively.
The slump was about 100 mm for concrete without any plastic aggregate and the
slump was about 7 mm for PET aggregate concrete. As shown in Figure (4.1) the
reasons for the lower slump value of the concrete mix containing PET aggregate are the
sharp edges and angular particle size of PET aggregate.

33
Table (4.1): Effect of recycled PET aggregate on slump test results
Mix # % PET
Aggregate
Slump (mm) W/C Ratio
PET 0 (Reference) 0 100 0.67
PET 15 15 90 0.67
PET 30 30 72 0.67
PET 45 45 50 0.67
Figure 4.1: Slump values of plastic concrete mixes
4.2.2 Density
Table (4.2) illustrates the average 28-day density of concrete specimens for all
mixes of concrete. The results indicate that the concrete containing 15%, 30% and 45%
PET aggregate as replacement of natural aggregate tends to decrease in density below
the reference concrete by 2.9%, 5.8%, and 12% respectively. The use of plastic
aggregate reduced the dry densities of all mixtures with increasing the plastic ratio,
because the density of plastic is lower than that of natural aggregate by 51%.
34
Table (4.2): Effect of recycled PET aggregate on concrete density
Mix # % PET
Aggregate
Average Density
(Kg/m3)
W/C Ratio
PET 0 (Reference) 0 2398.6 0.67
PET 15 15 2328.7 0.67
PET 30 30 2258.9 0.67
PET 45 45 2110.6 0.67
4.3 hardened concrete properties tests results
4.3.1 Compressive Strength Results
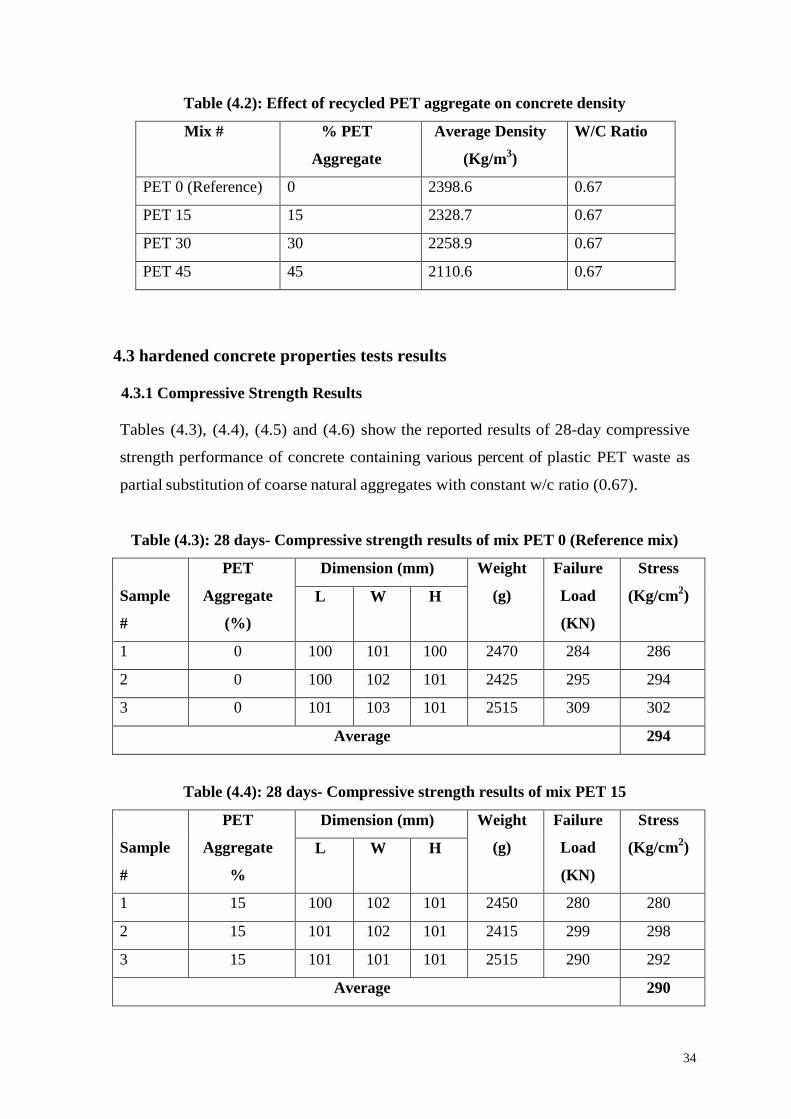
Tables (4.3), (4.4), (4.5) and (4.6) show the reported results of 28-day compressive
strength performance of concrete containing various percent of plastic PET waste as
partial substitution of coarse natural aggregates with constant w/c ratio (0.67).
Table (4.3): 28 days- Compressive strength results of mix PET 0 (Reference mix)
Sample
#
PET
Aggregate
(%)
Dimension (mm) Weight
(g)
Failure
Load
(KN)
Stress
(Kg/cm2) L W H
1 0 100 101 100 2470 284 286
2 0 100 102 101 2425 295 294
3 0 101 103 101 2515 309 302
Average 294
Table (4.4): 28 days- Compressive strength results of mix PET 15
Sample
#
PET
Aggregate
%
Dimension (mm) Weight
(g)
Failure
Load
(KN)
Stress
(Kg/cm2) L W H
1 15 100 102 101 2450 280 280
2 15 101 102 101 2415 299 298
3 15 101 101 101 2515 290 292
Average 290

35
Table (4.5): 28 days- Compressive strength results of mix PET 30
Sample
#
PET
Aggregate
%
Dimension (mm) Weight
(g)
Failure
Load
(KN)
Stress
(Kg/cm2) L W H
1 30 102 102 100 2338 265 260
2 30 102 100 101 2316 262 262
3 30 101 100 101 2314 260 260
Average 261
Table (4.6): 28 days- Compressive strength results of mix PET 45
Sample
#
PET
Aggregate
%
Dimension (mm) Weight
(g)
Failure
Load
(KN)
Stress
(Kg/cm2) L W H
1 45 102 101 100 2128 225 223
2 45 102 100 101 2116 223 223
3 45 101 100 101 2162 217 217
Average 221
The results indicate that the compressive strength at age 28 days of concrete containing
15% plastic PET aggregate exhibits a compressive strength that meets the standard
strength values of the reference concrete mix.
For 30% aggregate replacement compressive strength shows a reduction up to 11% of
the original strength. For 45% aggregate replacement the compressive strength
decreases about 24% from the original strength.
Several factors such as the type of failure and the formation of honeycombs, low w/c
ratio, particle size, which are responsible for lower compressive strength of concrete
containing PET aggregate than concrete containing natural aggregate. Figure 4.2
illustrates the average compressive strength for several mixes of concert containing PET
aggregate. This result agrees with the finding of Saikia and Brito, (2014) and Albano et
al. (2009).

36
Figure 4.2: 28 day-Average Compressive Strength of concrete mixes
4.3.2 Splitting Tensile Strength Results
The splitting tensile strength results were evaluated at 28 days of cure. In table (4.7)
and figure (4.3) the effect of adding PET aggregate was illustrated. From the data
presented we can see that the behavior is similar to the compressive strength,
attributing it to the same reasons mentioned above. For a w/c ratio of 0.67 there is a
decrease in the splitting tensile strength with respect to the reference concrete mix
independently of the amount of the PET added. There was 5%, 17%, and 34%
reduction in the tensile strength for concrete containing 15%, 30%, and 45% plastic
PET aggregates. These results were also observed by Choi et al. (2005).
Table (4.7): Effect of Recycled PET Plastic on Splitting Tensile Strength at Age of 28-days
Mix
PET
Aggregate
%
Dimension (mm) Weight
(g)
Failure
Load
(KN)
D H
PET 0 0 150 300 12389 149.5
PET 15 15 150 300 12323 142.2
PET 30 30 150 300 11298 123.3
PET 45 45 150 300 10879 98.5

37
Figure 4.3: 28 day-Average Splitting Tensile Strength of concrete mixes
4.3.3 Flexural Strength Test Results
The results of the flexural strength tests for the plastic PET concrete mixtures PET0,
PET15, PET30, and PET45 are illustrated in table (4.8) and figure (4.4). These results
show that the flexural strength of PET concrete mixtures at 28-days curing age is
prone to decrease with the increase of the PET ratio in these mixtures. This trend can
be attributed to the decrease in adhesive strength between the surface of waste plastic
particles and the cement paste, as well as the hydrophobic nature of plastic material
which may limit the hydration of cement. Therefore the hydration developed slightly
with time. However the flexural strengths of the waste plastic PET concrete
composites compared similarly with those of previous work (Hannawi et al., 2010;
Rahmani et al., 2013)

38
Table (4.8): Effect of Recycled PET Plastic on flexural Strength at Age of 28-days
Mix
PET
Aggregate
%
Dimension (mm) Failure
Load
(KN)
Flexure
Strength
(MPa)
L W H
PET 0 0 500 100 100 8 4.8
PET 15 15 500 100 100 7.1 4.26
PET 30 30 500 100 100 6.5 3.9
PET 45 45 500 100 100 5 3
Figure 4.4: 28 day-Average Flexural Strength of Concrete Mixes
As shown in Figure (4.5), after reaching the ultimate strength, most of the PET aggregate
in the concrete matrix do not fail, but they are debonded from the cement paste, which is
additional evidence of the poorer bonding between the PET aggregate and the cement
paste.

39
Figure 4.5: Concrete specimen containing PET aggregate after failure in the flexural
strength test
4.3.4 Impact Resistance Test Results
Impact resistance is measured by the number of blows required to enable the first tensile
crack to appear on the test specimen. Ultimate failure is defined by the ACI committee
544.
In terms of the number of blows required to open the cracks in the test specimen to
enable the fractured pieces touch the positioning lugs in the base plate. If the specimen
separated completely into halves before touching the lugs, then this was declared the
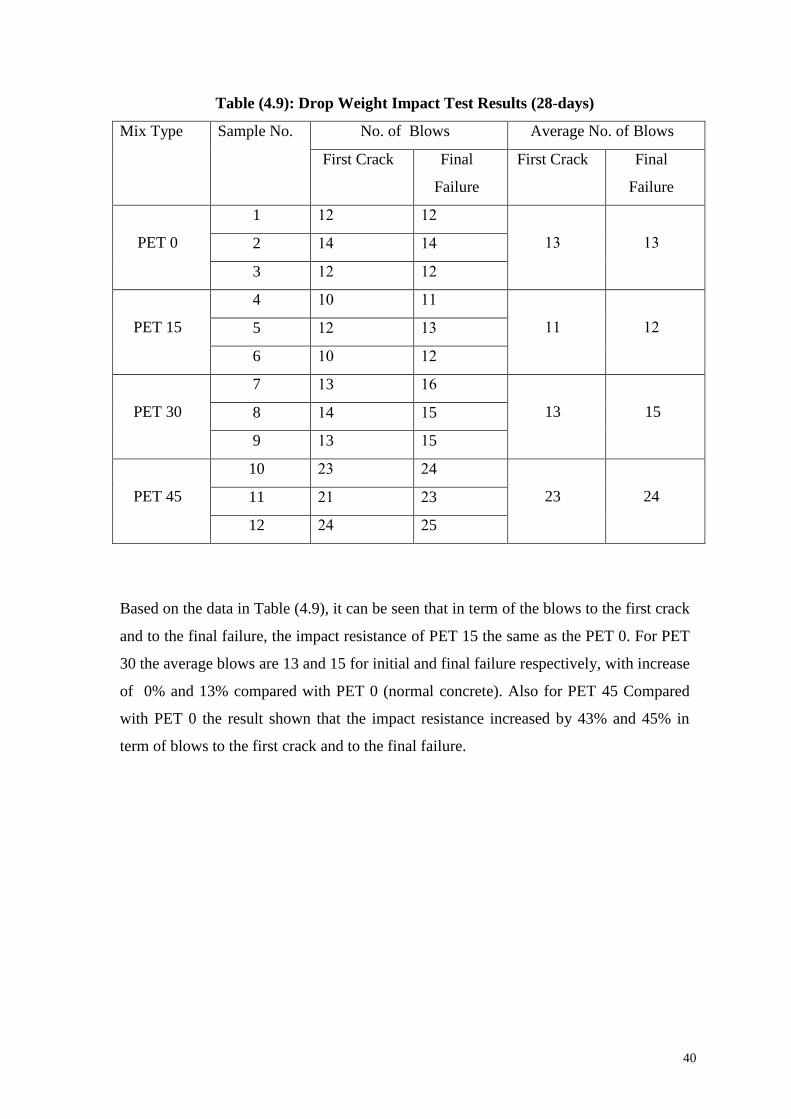
point of ultimate failure. Table (4.9) and figure (4.6) illustrate the results of impact
resistance test for the plastic PET concrete mixtures PET0, PET15, PET30, and PET45
with replacement natural aggregate by 0%, 15%, 30%, and 45% of plastic PET
aggregate by volume.
40
Table (4.9): Drop Weight Impact Test Results (28-days)
Mix Type Sample No. No. of Blows Average No. of Blows
First Crack Final
Failure
First Crack Final
Failure
PET 0
1 23 23
24
24 2 25 25
3 23 23
PET 15
4 21 22
22
23 5 23 24
6 21 23
PET 30
7 23 21
13
15 8 24 25
9 23 25
PET 45
10 34 34
23
24 11 32 33
12 35 35
Based on the data in Table (4.9), it can be seen that in term of the blows to the first crack
and to the final failure, the impact resistance of PET 15 the same as the PET 0. For PET
30 the average blows are 13 and 15 for initial and final failure respectively, with increase
of 0% and 13% compared with PET 0 (normal concrete). Also for PET 45 Compared
with PET 0 the result shown that the impact resistance increased by 43% and 45% in
term of blows to the first crack and to the final failure.

41
Figure 4.6: Comparison of first crack and final failure values between concrete
specimens
Figure (4.7) illustrates the different failure patterns of specimens with different PET
percent. It can be observed that the normal concrete discs are usually show a brittle
behavior, whereas the PET15, PET30, PET45 discs are normally broken into four or
more pieces and show well ductile properties. This phenomenon indicates that the
addition of PET plastic like aggregate allows enhancing the impact resistance of
concrete.
(A) (B)

42
(C) (D)
Figure 4.7: Comparison of failure patterns of specimens with different PET ratio: (A) PET0;
(B) PET15; (C) PET30; (D) PET45
The same specimens was prepared with the same PET aggregate ratios but without
replacing the natural aggregate and tested by the impact machine to see the effects of
PET on concrete. Table (4.10) and Figure (4.8) illustrates the average results of impact
resistance test for the plastic PET concrete mixtures (PET0, PET15A, PET30A, and
PET45A).
Table (4.10): Average Drop Weight Impact Test Results (28-days)
Mix Type Average No. of Blows
First Crack Final Failure
PET0 13 13
PET15A 11 15
PET30A 12 16
PET45A 19 21
Figure 4.8: Comparison of first crack and final failure values different PET ratio: (A) PET0; (B)
PET15A; (C) PET30A; (D) PET45A

43
CHAPTER FIVE
CONCLUSIONS AND RECOMEDATIOS
5.1 Introduction
The increase in the awareness of waste management and environment-related issues
has led to substantial progress in the utilization of waste products like plastic. This
study has presented various aspects on recycled plastic and its usage in concrete.
The main objective of this work was to investigate the use of waste/recycled plastic
and especially PET plastic as aggregate in concrete mix. This study included the
preparation of concrete mixes containing PET aggregate and the evaluation of its
properties in fresh and hardened states. The studying properties involved mix
workability, density, compressive strength, splitting tensile strength, flexural strength
and impact resistance.
5.2 Conclusion
Recycled PET plastic can be used as a partial replacement of natural aggregate
with a percentage can be reached to 45%.
Increasing recycled PET aggregate from 15% to 30% and then to 45% leads to a
decrease in the slump values and the filling ability of the concrete mix.
The use of the recycled plastic in the concrete reduced the overall concrete
bulk density when compared to conventional concrete which lead to produce
light-weight concrete.
Compressive strength decreased with the increase in recycled plastic content.
Reduction in the compressive strength was between 11% and 24% for concrete
containing 15–45% recycled PET plastic.
Splitting tensile strength of concrete made with plastic aggregates was found

44
to decrease with increase in the percentage of plastic aggregates. The splitting
tensile strength was found to decrease by 5%, 17%, and 34% for concrete
containing 15%, 30%, and 45% plastic aggregates, respectively.
Flexural strength decreases as the PET aggregate content increases. By
replacement of 15%, 30%, and 45% of natural aggregate by PET aggregate,
reduction in flexural strength were noticed by 11.2%, 18.7%, and 37.5%,
respectively.
It was observed that the impact resistance of concrete increased against the
first crack initiation and final fracture by addition of PET plastic aggregate
because the recycled plastic enhances the ductility of concrete. For PET 45
Compared with PET 0 the result shown that the impact resistance increased by
43% and 45% in term of blows to the first crack and to the final failure.
5.3 Recommendations
The recycled PTE can be used in concrete mixes as aggregate with 15% without
large reduction in compressive strength.
More types and sizes of recycled plastic need to be taken into consideration.
The effect of different W/C ratios on the mechanical property of concrete with
recycled plastic aggregate need to further research.
Other studies are encouraged to obtain the effect of using different percent of
PET plastic bottles in nonstructural elements.
The influences of the addition of super plastisizers on the mechanical property of
concrete mixes contain recycled plastic need to be taken into consideration.
The durability performance of concrete containing plastic aggregates needs
more studies.

45
REFERENCES

46
ACI 544.2R-89, Measurement of properties of fibre reinforced concrete. ACI Manual of
Concrete Practice 1996; Part 5: Masonry, Precast Concrete and Special
Processes, American Concrete Institute.
Akçaözoglu S., Atis C.D., Akçaözoglu K., 2010., “An investigation on the use of
shredded waste pet bottles as aggregate in lightweight concrete”, Waste
Management 30 (2010), 285–290.
Albano C., Camacho N., Hernandez M., Matheus A., Gutierrez A., “Influence of content
and particle size of waste pet bottles on concrete behavior at different w/c
ratios”. Waste Management 29 (2009), 2707–2716.
Al-Manaseer A.A., Dalal T.R., “Concrete containing plastic aggregates Concrete”.
International 19 (8)1997, 47–52.
ASTM C 143, 2003, Slump of hydraulic cement concrete. American Society for Testing
and Materials Standard Practice C109, Philadelphia, Pennsylvania.
ASTM C109, 2004, “Standard Test Method for Compressive Strength of cube Concrete
Specimens”, American Society for Testing and Materials Standard Practice
C109, Philadelphia, Pennsylvania.
ASTM C127, 2004, “Standard Test Method for Specific gravity and absorption of coarse
aggregate”, American Society for Testing and Materials Standard Practice C127,
Philadelphia, Pennsylvania.
ASTM C150, 2004, “Standard specifications of Portland cement American Society for
Testing and Materials Standard Practice C150”, Philadelphia, Pennsylvania.
ASTM C28, 2004, “Standard Test Method for Specific gravity and absorption of fine
aggregate”, American Society for Testing and Materials Standard Practice C128,
Philadelphia, Pennsylvania.
ASTM C293, 1994, “Standard Test Method for Flexural Strength of Concrete (Using
Simple Beam with center-Point Loading)”, American Society for Testing and
Materials Standard Practice C293, Philadelphia, Pennsylvania .
ASTM C496, 2004, “Standard Test Method for Splitting Tensile Strength of Cylindrical
Concrete Specimens”, American Society for Testing and Materials Standard
Practice C496, Philadelphia, Pennsylvania.
Badra A., Ashourb A. F., Plattena A. K., “Statistical variations in impact resistance of
polypropylene fibre-reinforced concrete”, International Journal of Impact
Engineering 32 (2006) 1907–1920.
Choi, Y.W., Moon, D.J., Chumg, J.S., Cho, S.K., "Effects of waste PET bottles aggregate
on the properties of concrete", Cement and Concrete Research 35, 2005, 776–781.

47
Frigione M., “Recycling of PET bottles as fine aggregate in concrete”, Waste
Management 30 (2010),1101–1106.
Ge Z., Sun R., . Zhang K, Gao Z., Li P.,” Physical and mechanical properties of mortar
using waste Polyethylene Terephthalate bottles”, Construction and Building
Materials 44 (2013) 81–86.
Hannawi K., Bernard S. K., Prince W., “Physical and mechanical properties of mortars
containing PET and waste aggregates”, Waste Management 30 (2010) 2312–
2320.
Ismail Z.Z., AL-Hashmi E.A., “Use of waste plastic in concrete mixture as aggregate
replacement”, Waste Management 28 (2008) 2041–2047.
Kou S.C., Lee G., Poon C.S., Lai W.L.,” Properties of lightweight aggregate concrete
prepared with PVC granules derived from scraped PVC pipes” Waste
Management 29 (2009) 621–628.
Marzouk O.Y., Dheilly R.M., Queneudec M., “Valorisation of post-consumer plastic
waste in cementitious concrete composites”, Waste Management 27 (2007).
Mathew P., Varghese S., Paul T., Varghese E., “Recycled Plastics as Coarse Aggregate
for Structural Concrete”, International Journal of Innovative Research in Science,
Engineering and Technology, vol. 2, Issue 3, March 2013.
Rahmani E., Dehestani M., Beygi M.H.A., Allahyari H., Nikbin I.M.,” On the mechanical
properties of concrete containing waste PET particles”, Construction and
Building Materials 47 (2013) 1302–1308.
Reis J.M.L., Carneiro E.P.,” Evaluation of PET waste aggregates in polymer mortars”,
Construction and Building Materials 27 (2012) 107–111.
Saikia N., de Brito J., “ Use of plastic waste as aggregate in cement mortar and concrete
preparation: A review”, Construction and Building Materials 34 (2012), 385–
401.
Saikia N., de Brito J.,” Mechanical properties and abrasion behaviour of concrete
containing
shredded PET bottle waste as a partial substitution of natural aggregate”, Construction
and Building Materials 52 (2014) 236–244.
Siddique R. , Khatib J., Kaur I., “Use of recycled plastic in concrete: A review”, Waste
Management 28 (2008) , 1835–1852.
Silva R.V., de Brito J., Saikia N., “Influence of curing conditions on the durability-related
performance of concrete made with selected plastic waste aggregates”, Cement
& Concrete Composites 35 (2013) 23–31.

48
Shihada, M.S., Al Buhaisi., "Investigation the Use of Recycled Plastic as Shrinkage
Reinforcement in Non-Structural Concrete Slabs", Master Thesis, Islamic
University, Gaza, 2013.
Soroushian P., Plasencia J., Ravanbakhsh S., “Assessment of reinforcing effects of
recycled plastic and paper in concrete’’, ACI Materials Journal 100 (3)2003, pp.
203–207.
UNDP-PAPP, “Feasibility Study and Detailed Design for Solid Waste Management in the
Gaza Strip’’ 2012.
United Nations Environmental Programme (UNEP), “Converting Waste Plastics
into a Resource”, http://www.unep.or.jp/,2009.

49
APPENDIX A

50
Appendix (A)
Design of Concrete Mixtures
ACI 211.1 Method
The American Concrete Institute (ACI) mix design method is but one of many
basic concrete mix design methods available today. This section summarizes the
ACI absolute volume method because it is widely accepted in the U.S. and continually
updated by the ACI. Keep in mind that this summary and most methods
designated as "mix design" methods are really just mixture proportioning methods.
Mix design includes trial mixture proportioning (covered here) plus performance tests.
This section is a general outline of the ACI proportioning method with specific
emphasis on PCC for pavements. It emphasizes general concepts and rationale over
specific procedures. Typical procedures are available in the following documents:
The American Concrete Institute's (ACI) Standard Practice for Selecting Proportions for
Normal, Heavyweight, and Mass Concrete (ACI 211.1-91) as found in their ACI Manual
of
Concrete Practice 2000, Part 1: Materials and General Properties of Concrete. The
Portland Cement Association's (PCA) Design and Control of Concrete Mixtures, 14th
edition (2002) or any earlier edition.
The standard ACI mix design procedure can be divided up into 8 basic steps:
1. Choice of slump
2. Maximum aggregate size selection
3. Mixing water and air content selection
4. Water-cement ratio
5. Cement content
6. Coarse aggregate content
7. Fine aggregate content
8. Adjustments for aggregate moisture

51
Choice of Slump
The choice of slump is actually a choice of mix workability. Workability can be
described as a combination of several different, but related, PCC properties related to its
theology:
Ease of mixing
Ease of placing
Ease of compaction
Ease of finishing
Generally, mixes of the stiffest consistency that can still be placed adequately
should be used (ACI, 2000). Typically slump is specified, but Table A-1 shows
general slump ranges for specific applications.
Choice of maximum size of aggregate
Large maximum sizes of aggregate produce fewer voids than smaller sizes. Hence,
concrete with the larger-sized aggregate require less mortar per unit volume of concrete,
and of course it is the mortar which contains the most expensive ingredient, cement.
Thus the ACI method is based on the principle that the maximum size of aggregate
should be the largest available so long it is consistent with the dimensions of the
structure. In practice the dimensions of the forms or the spacing of the rebars controls the
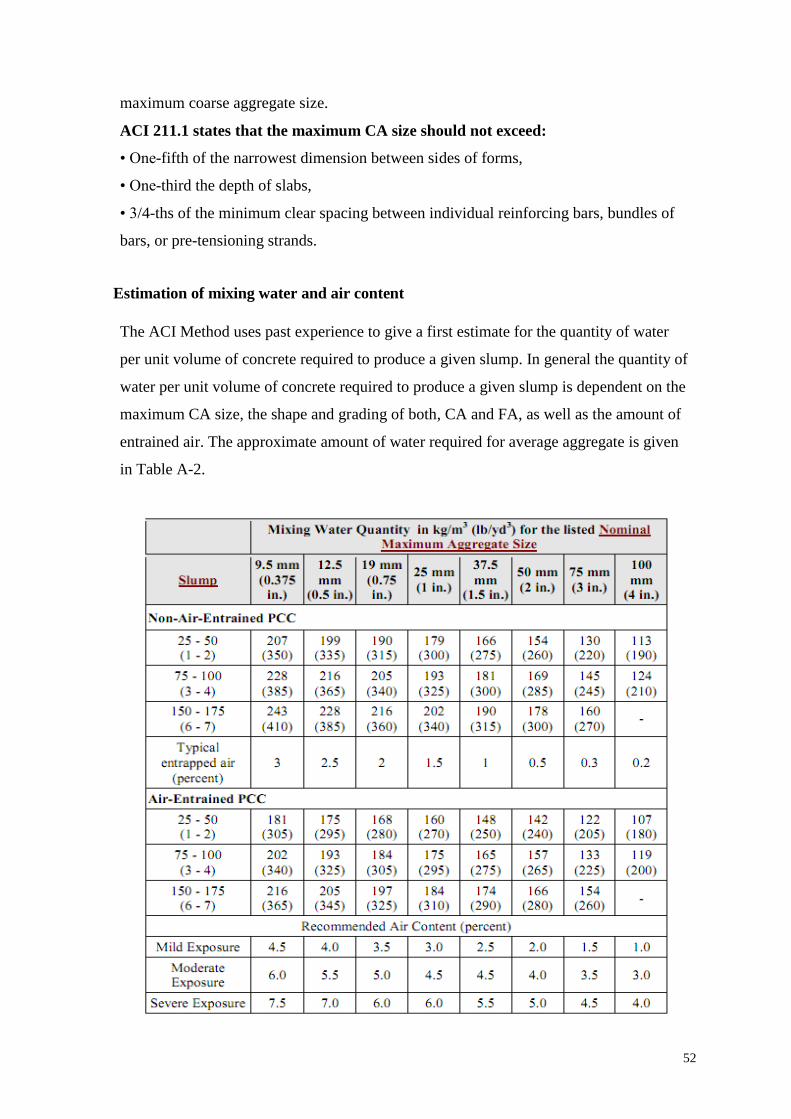
52
maximum coarse aggregate size.
ACI 211.1 states that the maximum CA size should not exceed:
• One-fifth of the narrowest dimension between sides of forms,
• One-third the depth of slabs,
• 3/4-ths of the minimum clear spacing between individual reinforcing bars, bundles of
bars, or pre-tensioning strands.
Estimation of mixing water and air content
The ACI Method uses past experience to give a first estimate for the quantity of water
per unit volume of concrete required to produce a given slump. In general the quantity of
water per unit volume of concrete required to produce a given slump is dependent on the
maximum CA size, the shape and grading of both, CA and FA, as well as the amount of
entrained air. The approximate amount of water required for average aggregate is given
in Table A-2.
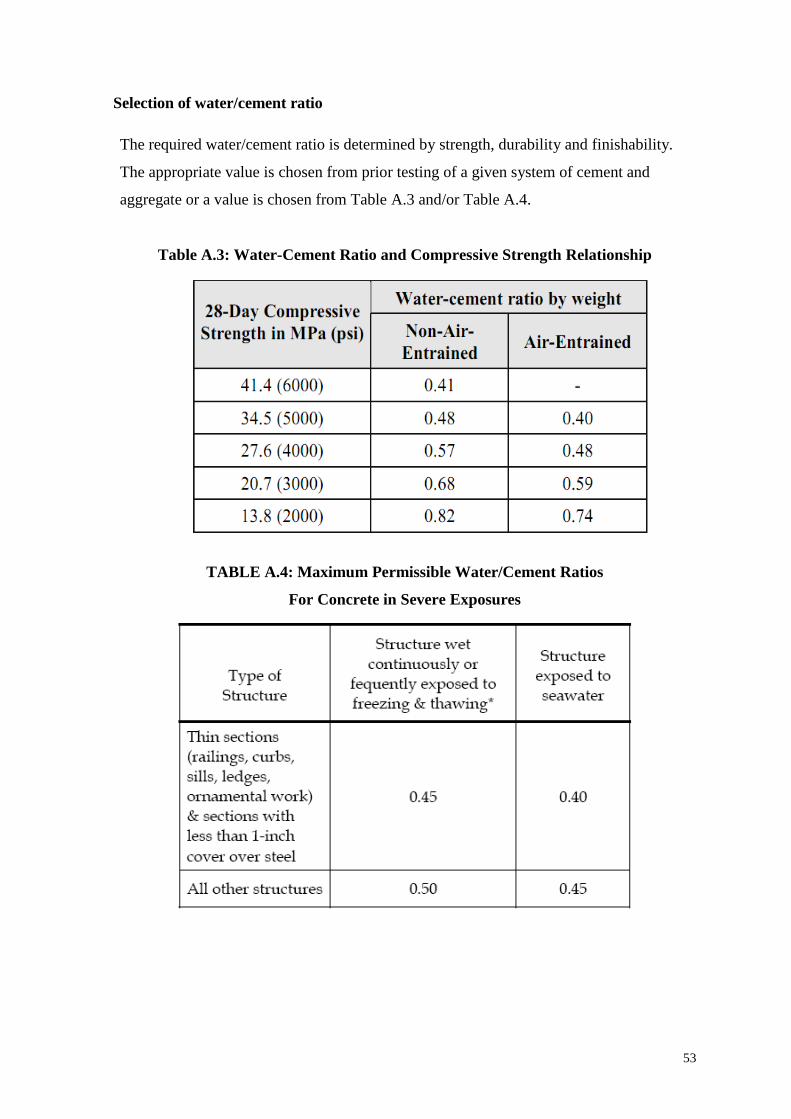
53
Selection of water/cement ratio
The required water/cement ratio is determined by strength, durability and finishability.
The appropriate value is chosen from prior testing of a given system of cement and
aggregate or a value is chosen from Table A.3 and/or Table A.4.
Table A.3: Water-Cement Ratio and Compressive Strength Relationship
TABLE A.4: Maximum Permissible Water/Cement Ratios
For Concrete in Severe Exposures
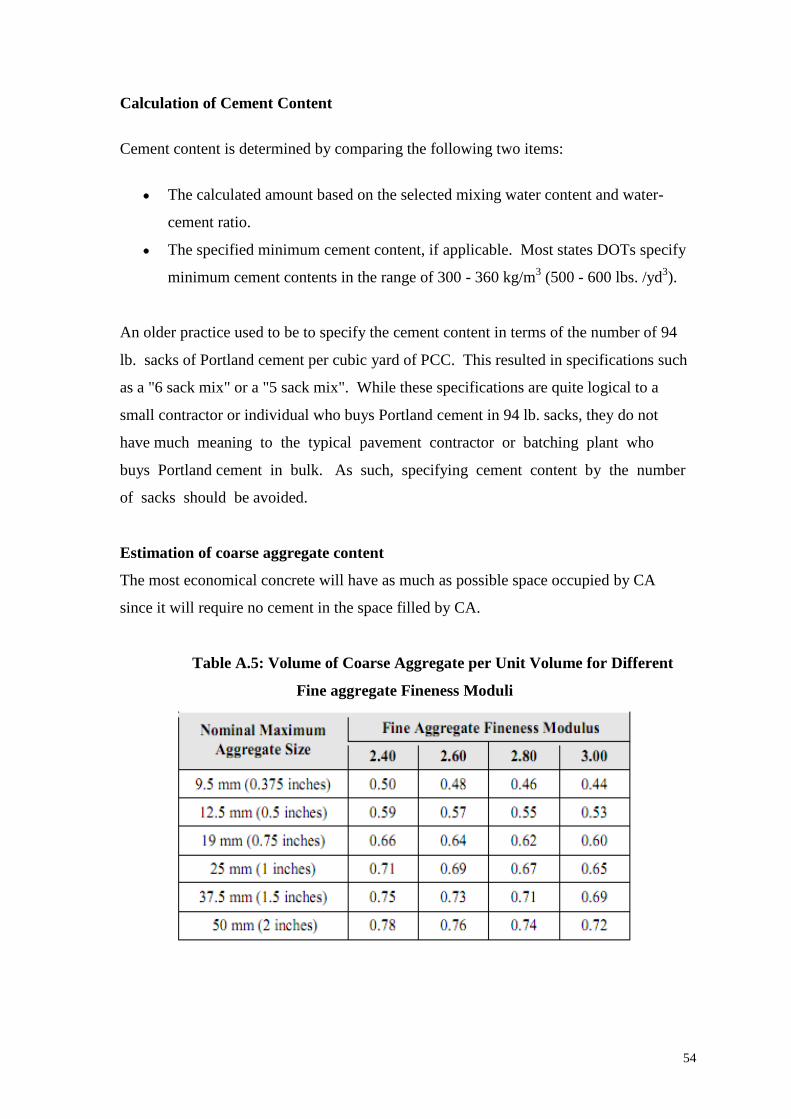
54
Calculation of Cement Content
Cement content is determined by comparing the following two items:
The calculated amount based on the selected mixing water content and water-
cement ratio.
The specified minimum cement content, if applicable. Most states DOTs specify
minimum cement contents in the range of 300 - 360 kg/m3 (500 - 600 lbs. /yd
3).
An older practice used to be to specify the cement content in terms of the number of 94
lb. sacks of Portland cement per cubic yard of PCC. This resulted in specifications such
as a "6 sack mix" or a "5 sack mix". While these specifications are quite logical to a
small contractor or individual who buys Portland cement in 94 lb. sacks, they do not
have much meaning to the typical pavement contractor or batching plant who
buys Portland cement in bulk. As such, specifying cement content by the number
of sacks should be avoided.
Estimation of coarse aggregate content
The most economical concrete will have as much as possible space occupied by CA
since it will require no cement in the space filled by CA.
Table A.5: Volume of Coarse Aggregate per Unit Volume for Different
Fine aggregate Fineness Moduli

55
Notes:
1. These values can be increased by up to about 10 percent for pavement applications.
2. Coarse aggregate volumes are based on oven-dry-rodded weights obtained in
accordance with ASTM C 29.
Estimation of Fine Aggregate Content
At this point, all other constituent volumes have been specified (water, Portland cement,
air and coarse aggregate). Thus, the fine aggregate volume is just the remaining volume:
Unit volume (1 m3 or yd3)
Volume of mixing water
Volume of air
Volume of Portland cement
Volume of coarse aggregate
Volume of fine aggregate
Adjustments for Aggregate Moisture
Aggregate weights: Aggregate volumes are calculated based on oven dry unit weights,
but aggregate is typically batched based on actual weight. Therefore, any moisture in the
aggregate will increase its weight and stockpiled aggregates almost always contain some
moisture. Without correcting for this, the batched aggregate volumes will be incorrect.
Amount of mixing water: If the batched aggregate is anything but saturated surface dry it
will absorb water (if oven dry or air dry) or give up water (if wet) to the cement paste.
This causes a net change in the amount of water available in the mix and must be
compensated for by adjusting the amount of mixing water added.
Trial Batch Adjustments
The ACI method is written on the basis that a trial batch of concrete will be prepared in
the laboratory, and adjusted to give the desired slump, freedom from segregation,
finishability, unit weight, air content and strength.