MECHANICAL INTEGRITY DESIGN FOR FLARE SYSTEM · PDF file1 MECHANICAL INTEGRITY DESIGN FOR...
8
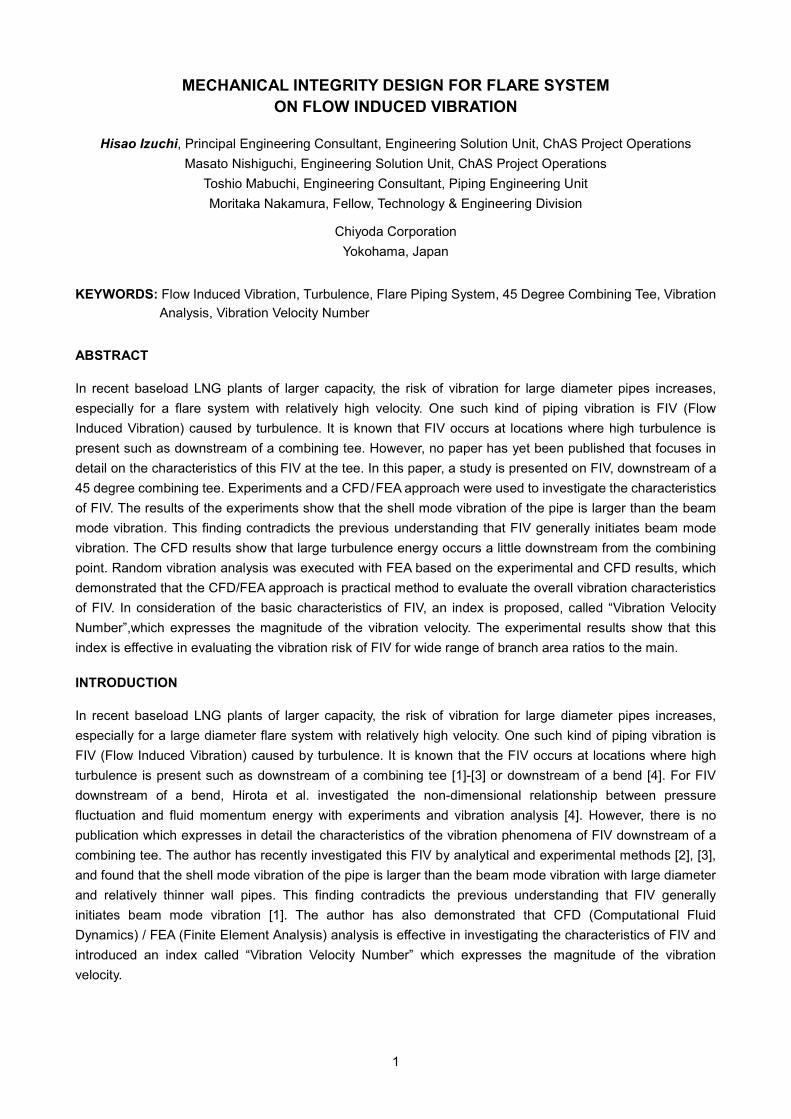
1 MECHANICAL INTEGRITY DESIGN FOR FLARE SYSTEM ON FLOW INDUCED VIBRATION Hisao Izuchi, Principal Engineering Consultant, Engineering Solution Unit, ChAS Project Operations Masato Nishiguchi, Engineering Solution Unit, ChAS Project Operations Toshio Mabuchi, Engineering Consultant, Piping Engineering Unit Moritaka Nakamura, Fellow, Technology & Engineering Division Chiyoda Corporation Yokohama, Japan KEYWORDS: Flow Induced Vibration, Turbulence, Flare Piping System, 45 Degree Combining Tee, Vibration Analysis, Vibration Velocity Number ABSTRACT In recent baseload LNG plants of larger capacity, the risk of vibration for large diameter pipes increases, especially for a flare system with relatively high velocity. One such kind of piping vibration is FIV (Flow Induced Vibration) caused by turbulence. It is known that FIV occurs at locations where high turbulence is present such as downstream of a combining tee. However, no paper has yet been published that focuses in detail on the characteristics of this FIV at the tee. In this paper, a study is presented on FIV, downstream of a 45 degree combining tee. Experiments and a CFD / FEA approach were used to investigate the characteristics of FIV. The results of the experiments show that the shell mode vibration of the pipe is larger than the beam mode vibration. This finding contradicts the previous understanding that FIV generally initiates beam mode vibration. The CFD results show that large turbulence energy occurs a little downstream from the combining point. Random vibration analysis was executed with FEA based on the experimental and CFD results, which demonstrated that the CFD/FEA approach is practical method to evaluate the overall vibration characteristics of FIV. In consideration of the basic characteristics of FIV, an index is proposed, called “Vibration Velocity Number”,which expresses the magnitude of the vibration velocity. The experimental results show that this index is effective in evaluating the vibration risk of FIV for wide range of branch area ratios to the main. INTRODUCTION In recent baseload LNG plants of larger capacity, the risk of vibration for large diameter pipes increases, especially for a large diameter flare system with relatively high velocity. One such kind of piping vibration is FIV (Flow Induced Vibration) caused by turbulence. It is known that the FIV occurs at locations where high turbulence is present such as downstream of a combining tee [1]-[3] or downstream of a bend [4]. For FIV downstream of a bend, Hirota et al. investigated the non-dimensional relationship between pressure fluctuation and fluid momentum energy with experiments and vibration analysis [4]. However, there is no publication which expresses in detail the characteristics of the vibration phenomena of FIV downstream of a combining tee. The author has recently investigated this FIV by analytical and experimental methods [2], [3], and found that the shell mode vibration of the pipe is larger than the beam mode vibration with large diameter and relatively thinner wall pipes. This finding contradicts the previous understanding that FIV generally initiates beam mode vibration [1]. The author has also demonstrated that CFD (Computational Fluid Dynamics) / FEA (Finite Element Analysis) analysis is effective in investigating the characteristics of FIV and introduced an index called “Vibration Velocity Number” which expresses the magnitude of the vibration velocity.
Transcript of MECHANICAL INTEGRITY DESIGN FOR FLARE SYSTEM · PDF file1 MECHANICAL INTEGRITY DESIGN FOR...
1
MECHANICAL INTEGRITY DESIGN FOR FLARE SYSTEM ON FLOW INDUCED VIBRATION
Hisao Izuchi, Principal Engineering Consultant, Engineering Solution Unit, ChAS Project Operations Masato Nishiguchi, Engineering Solution Unit, ChAS Project Operations
Toshio Mabuchi, Engineering Consultant, Piping Engineering Unit Moritaka Nakamura, Fellow, Technology & Engineering Division
Chiyoda Corporation Yokohama, Japan
KEYWORDS: Flow Induced Vibration, Turbulence, Flare Piping System, 45 Degree Combining Tee, Vibration Analysis, Vibration Velocity Number
ABSTRACT
In recent baseload LNG plants of larger capacity, the risk of vibration for large diameter pipes increases, especially for a flare system with relatively high velocity. One such kind of piping vibration is FIV (Flow Induced Vibration) caused by turbulence. It is known that FIV occurs at locations where high turbulence is present such as downstream of a combining tee. However, no paper has yet been published that focuses in detail on the characteristics of this FIV at the tee. In this paper, a study is presented on FIV, downstream of a 45 degree combining tee. Experiments and a CFD / FEA approach were used to investigate the characteristics of FIV. The results of the experiments show that the shell mode vibration of the pipe is larger than the beam mode vibration. This finding contradicts the previous understanding that FIV generally initiates beam mode vibration. The CFD results show that large turbulence energy occurs a little downstream from the combining point. Random vibration analysis was executed with FEA based on the experimental and CFD results, which demonstrated that the CFD/FEA approach is practical method to evaluate the overall vibration characteristics of FIV. In consideration of the basic characteristics of FIV, an index is proposed, called “Vibration Velocity Number”,which expresses the magnitude of the vibration velocity. The experimental results show that this index is effective in evaluating the vibration risk of FIV for wide range of branch area ratios to the main.
INTRODUCTION
In recent baseload LNG plants of larger capacity, the risk of vibration for large diameter pipes increases, especially for a large diameter flare system with relatively high velocity. One such kind of piping vibration is FIV (Flow Induced Vibration) caused by turbulence. It is known that the FIV occurs at locations where high turbulence is present such as downstream of a combining tee [1]-[3] or downstream of a bend [4]. For FIV downstream of a bend, Hirota et al. investigated the non-dimensional relationship between pressure fluctuation and fluid momentum energy with experiments and vibration analysis [4]. However, there is no publication which expresses in detail the characteristics of the vibration phenomena of FIV downstream of a combining tee. The author has recently investigated this FIV by analytical and experimental methods [2], [3], and found that the shell mode vibration of the pipe is larger than the beam mode vibration with large diameter and relatively thinner wall pipes. This finding contradicts the previous understanding that FIV generally initiates beam mode vibration [1]. The author has also demonstrated that CFD (Computational Fluid Dynamics) / FEA (Finite Element Analysis) analysis is effective in investigating the characteristics of FIV and introduced an index called “Vibration Velocity Number” which expresses the magnitude of the vibration velocity.
2
This paper presents the study results of FIV downstream of a 45 degree combining tee using experiments and CFD / FEA analysis. It also demonstrates the concepts of the “Vibration Velocity Number” index which is derived from the basic random vibration theory and expresses the magnitude of the vibration severity. The experimental results show that this index is effective in evaluating the vibration stress of FIV for a wide range of process conditions and the branch flow area ratios to the main pipe.
METHOD OF EXPERIMENT
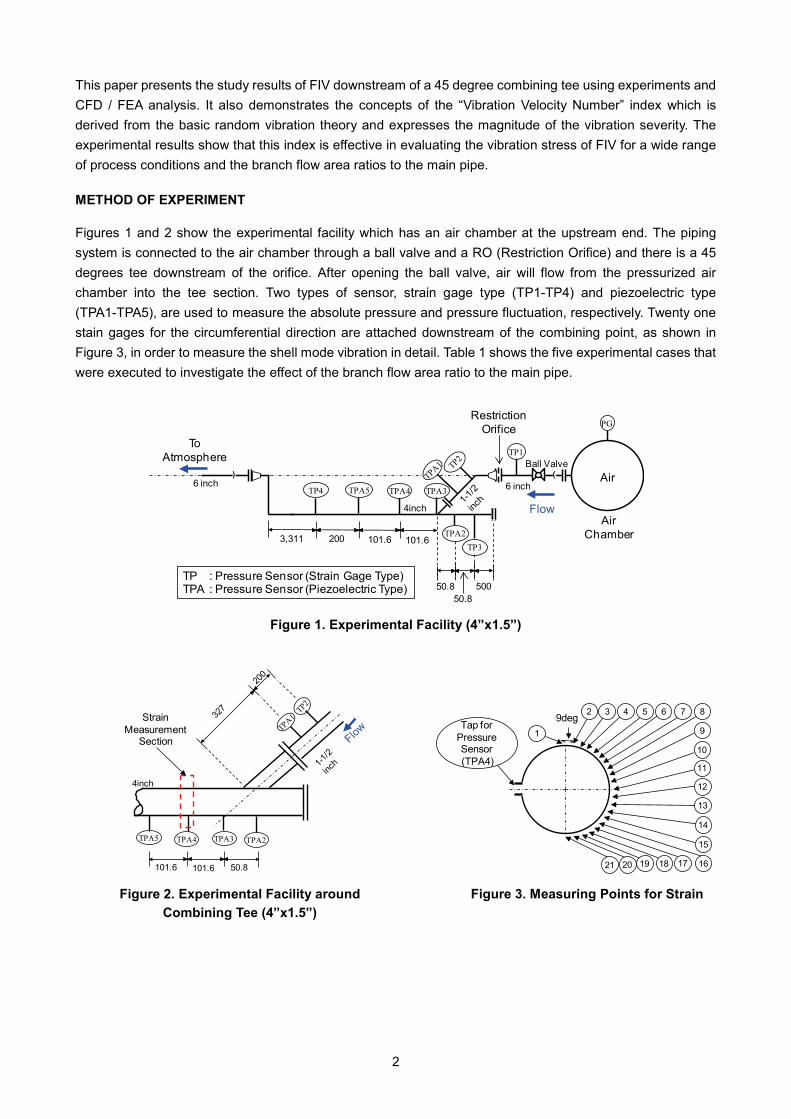
Figures 1 and 2 show the experimental facility which has an air chamber at the upstream end. The piping system is connected to the air chamber through a ball valve and a RO (Restriction Orifice) and there is a 45 degrees tee downstream of the orifice. After opening the ball valve, air will flow from the pressurized air chamber into the tee section. Two types of sensor, strain gage type (TP1-TP4) and piezoelectric type (TPA1-TPA5), are used to measure the absolute pressure and pressure fluctuation, respectively. Twenty one stain gages for the circumferential direction are attached downstream of the combining point, as shown in Figure 3, in order to measure the shell mode vibration in detail. Table 1 shows the five experimental cases that were executed to investigate the effect of the branch flow area ratio to the main pipe.
Figure 1. Experimental Facility (4”x1.5”)
Figure 2. Experimental Facility around Combining Tee (4”x1.5”)
Figure 3. Measuring Points for Strain
PG
TPA3TPA4TPA5
TPA2TP3
Ball Valve
TP4
()6 inch
4inchAir
Chamber
TP1To
Atmosphere
200
50.8
101.6 101.6
50.8
Restriction Orifice
6 inch
3,311
500
Flow
Air
TP : Pressure Sensor (Strain Gage Type)TPA : Pressure Sensor (Piezoelectric Type)
4inch
101.6 50.8
TPA3TPA4TPA5 TPA2
Strain Measurement
Section
101.6
9deg1
2 3 4 5 6 8
9
10
7
11
12
13
14
15
17181921 1620
Tap for Pressure Sensor(TPA4)
3
Table 1. Experimental Cases
Case
Definition
Main Pipe Branch Pipe Branch Area
Ratio to Main O.D. Wall. Thick. D/t O.D. Wall Thick.
4” x 4” 114.3 mm 2.1 mm 54.4 114.3 mm 2.1 mm 1.0
4” x 3” 114.3 mm 2.1 mm 54.4 89.1 mm 2.1 mm 0.60
4” x 1. 5” 114.3 mm 2.1 mm 54.4 48.6 mm 1.65 mm 0.17
4” x 3/4” 114.3 mm 2.1 mm 54.4 27.2 mm 1.65 mm 0.047
4” x 1/4” 114.3 mm 2.1 mm 54.4 13.8 mm 1.2 mm 0.011
METHOD OF NUMERICAL ANALYSIS
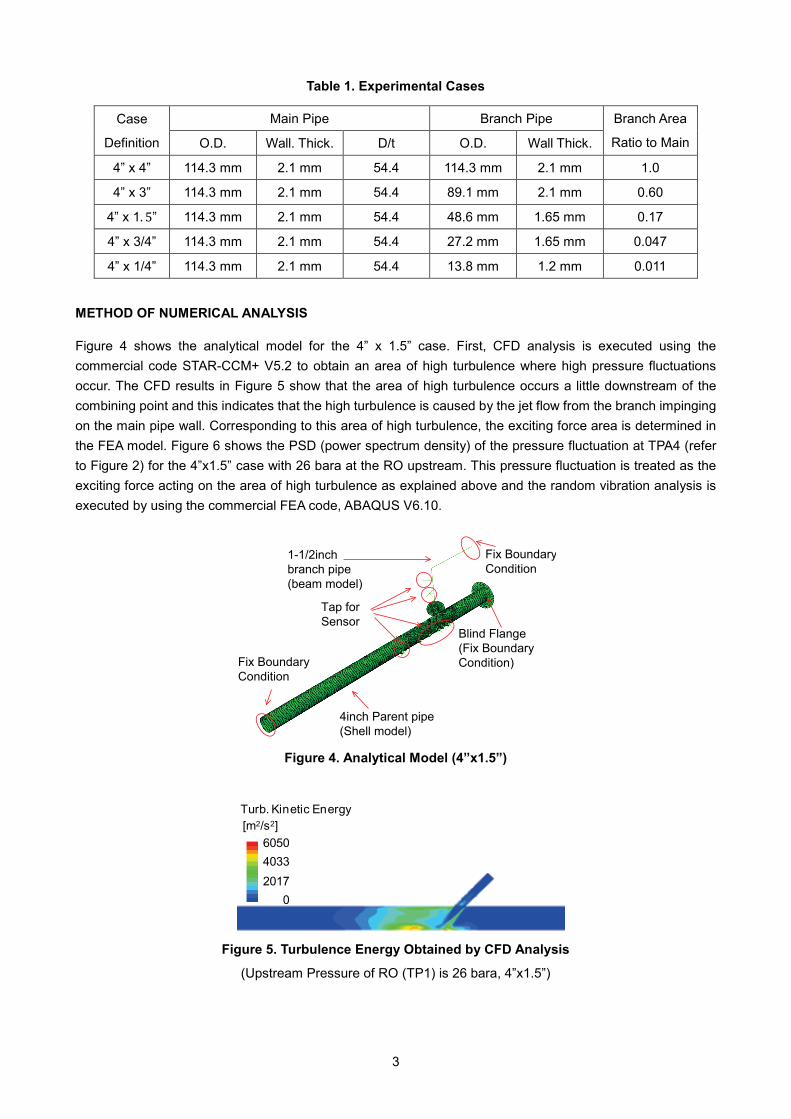
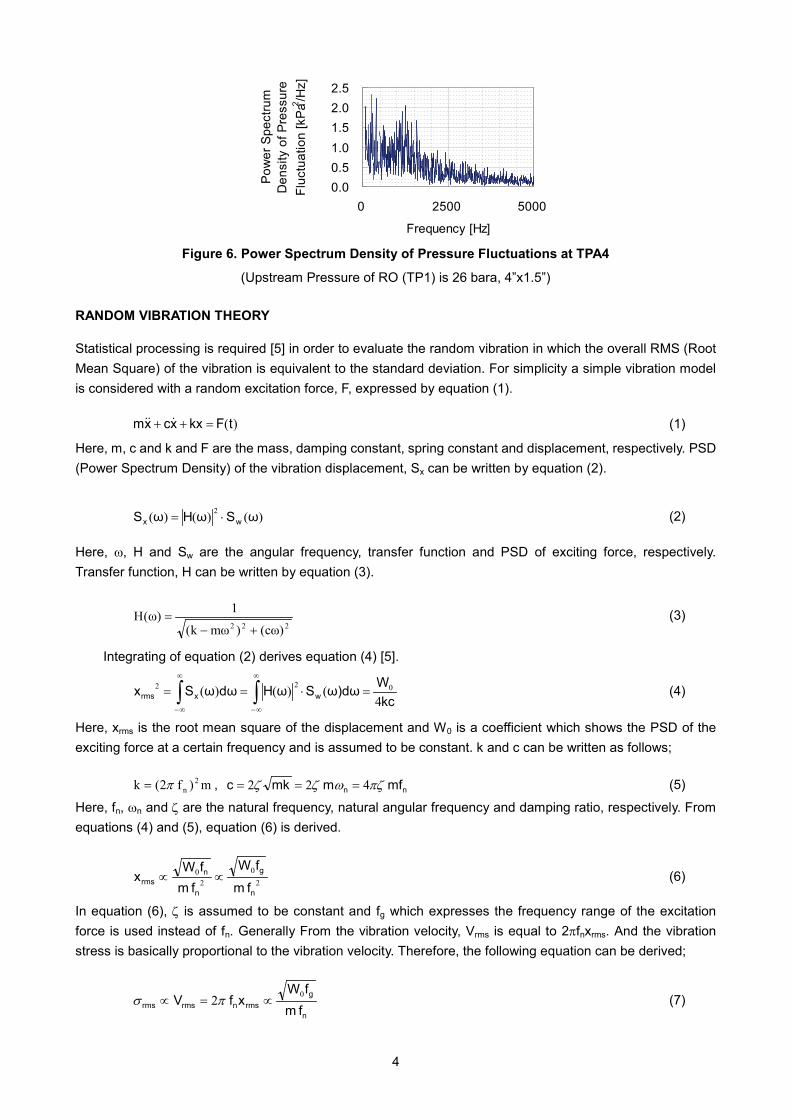
Figure 4 shows the analytical model for the 4” x 1.5” case. First, CFD analysis is executed using the commercial code STAR-CCM+ V5.2 to obtain an area of high turbulence where high pressure fluctuations occur. The CFD results in Figure 5 show that the area of high turbulence occurs a little downstream of the combining point and this indicates that the high turbulence is caused by the jet flow from the branch impinging on the main pipe wall. Corresponding to this area of high turbulence, the exciting force area is determined in the FEA model. Figure 6 shows the PSD (power spectrum density) of the pressure fluctuation at TPA4 (refer to Figure 2) for the 4”x1.5” case with 26 bara at the RO upstream. This pressure fluctuation is treated as the exciting force acting on the area of high turbulence as explained above and the random vibration analysis is executed by using the commercial FEA code, ABAQUS V6.10.
Figure 4. Analytical Model (4”x1.5”)
Figure 5. Turbulence Energy Obtained by CFD Analysis
(Upstream Pressure of RO (TP1) is 26 bara, 4”x1.5”)
1-1/2inch branch pipe (beam model)
4inch Parent pipe (Shell model)
Fix Boundary Condition
Blind Flange (Fix Boundary Condition)
Tap for Sensor
Fix Boundary Condition
Turb. Kinetic Energy[m2/s2]
605040332017
0
4
Figure 6. Power Spectrum Density of Pressure Fluctuations at TPA4
(Upstream Pressure of RO (TP1) is 26 bara, 4”x1.5”)
RANDOM VIBRATION THEORY
Statistical processing is required [5] in order to evaluate the random vibration in which the overall RMS (Root Mean Square) of the vibration is equivalent to the standard deviation. For simplicity a simple vibration model is considered with a random excitation force, F, expressed by equation (1).
)(tFkxxcxm =++ (1)
Here, m, c and k and F are the mass, damping constant, spring constant and displacement, respectively. PSD (Power Spectrum Density) of the vibration displacement, Sx can be written by equation (2).
)()()( 2 ωSωHωS wx ⋅= (2)
Here, ω, H and Sw are the angular frequency, transfer function and PSD of exciting force, respectively. Transfer function, H can be written by equation (3).
222 )cω()mωk(
1)ω(H+−
= (3)
Integrating of equation (2) derives equation (4) [5].
kcWω)dωSωHdωωSx wxrms 4
()()( 022 =⋅== ∫∫∞
∞−
∞
∞−
(4)
Here, xrms is the root mean square of the displacement and W0 is a coefficient which shows the PSD of the exciting force at a certain frequency and is assumed to be constant. k and c can be written as follows;
m)f 2(k 2nπ= , nn mfmmkc 4 22 πζωζζ === (5)
Here, fn, ωn and ζ are the natural frequency, natural angular frequency and damping ratio, respectively. From equations (4) and (5), equation (6) is derived.
20
20
n
g
n
nrms fm
fW
fmfW
x ∝∝ (6)
In equation (6), ζ is assumed to be constant and fg which expresses the frequency range of the excitation force is used instead of fn. Generally From the vibration velocity, Vrms is equal to 2πfnxrms. And the vibration stress is basically proportional to the vibration velocity. Therefore, the following equation can be derived;
n
grmsnrmsrms fm
fWxfV
2 0
∝=∝ πs (7)
0.00.51.01.52.02.5
0 2500 5000
Frequency [Hz]
Pow
er S
pect
rum
Den
sity
of P
ress
ure
Fluc
tuat
ion
[kP
a2 /Hz]
5
Here, srms is the root mean square of the vibration stress. The excitation force is generally proportional to the product of the pressure fluctuation and excitation area which would be proportional to the total fluid momentum rgAV2 at the end of the branch just before the combining point, here, rg, A and V are the fluid density, flow area of branch and velocity at the branch, respectively. Therefore, rgAV2
can be used instead of
gfW0 in equation (7). The mass of the pipe, m can be expressed as πrpD2t, here, rp, D and t are the density of the pipe material, the outside diameter of the main pipe and the wall thickness of the main pipe, respectively. Thus the equation (8) can be derived.
np
gnrms tfD
AVV 2
2
πrr
s =∝ (8)
In equation (8), an index, Vn expresses the magnitude of the vibration velocity which would show the vibration stress, i.e. the vibration severity. From this point of view, the index Vn is named as “Vibration Velocity Number”. Where critical flow occurs with sonic speed at the end of the branch pipe just before entering the main pipe, there would be a pressure discontinuity at the combining point with a rapid expansion of air . This rapid expansion of air would have the effect of increasing the turbulence energy at the combining point. The turbulence energy, including this rapid expansion effect, could be assumed to be proportional to the total pressure change (1/2)rgV2+Dp at the combining point; here, Dp is the pressure discontinuity at the combining tee for the critical flow condition. From this assumption, equation (8) can be modified to equation (9) in case of the critical flow occurrence at the end of the branch.
np
gnrms tfD
pAAVV 2
2 2πr
rs
D+=∝ (9)
RESULTS AND DISCUSSION
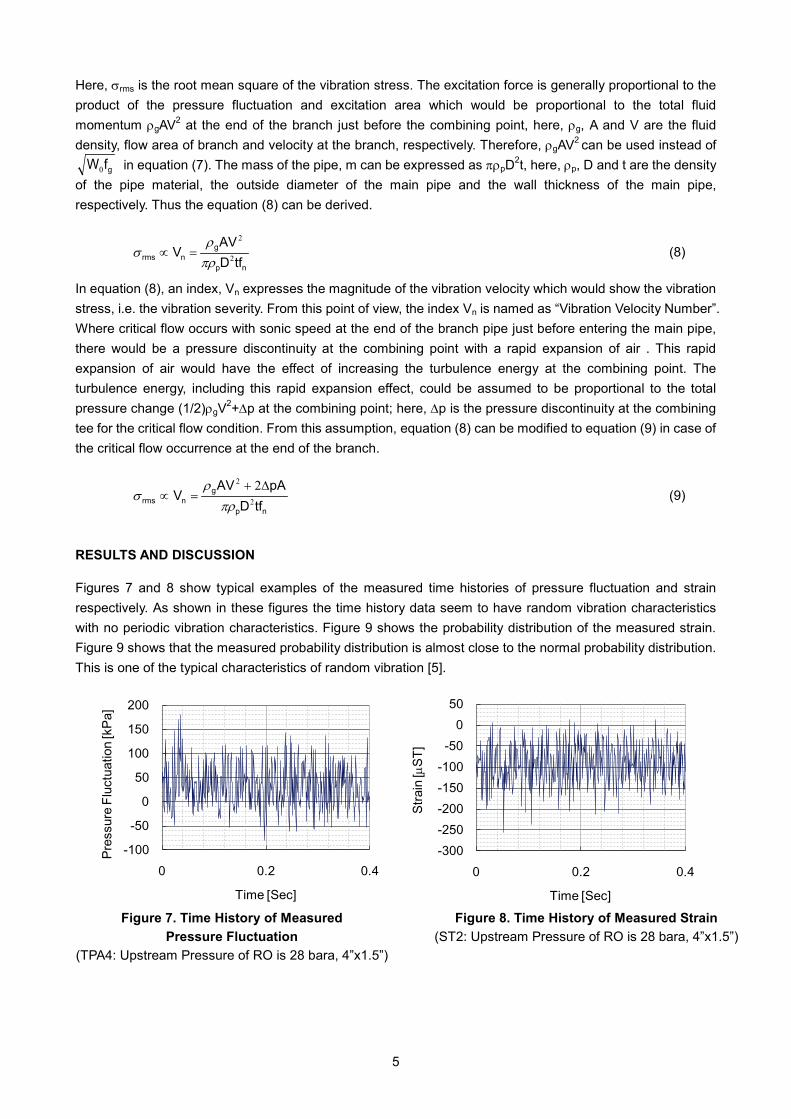
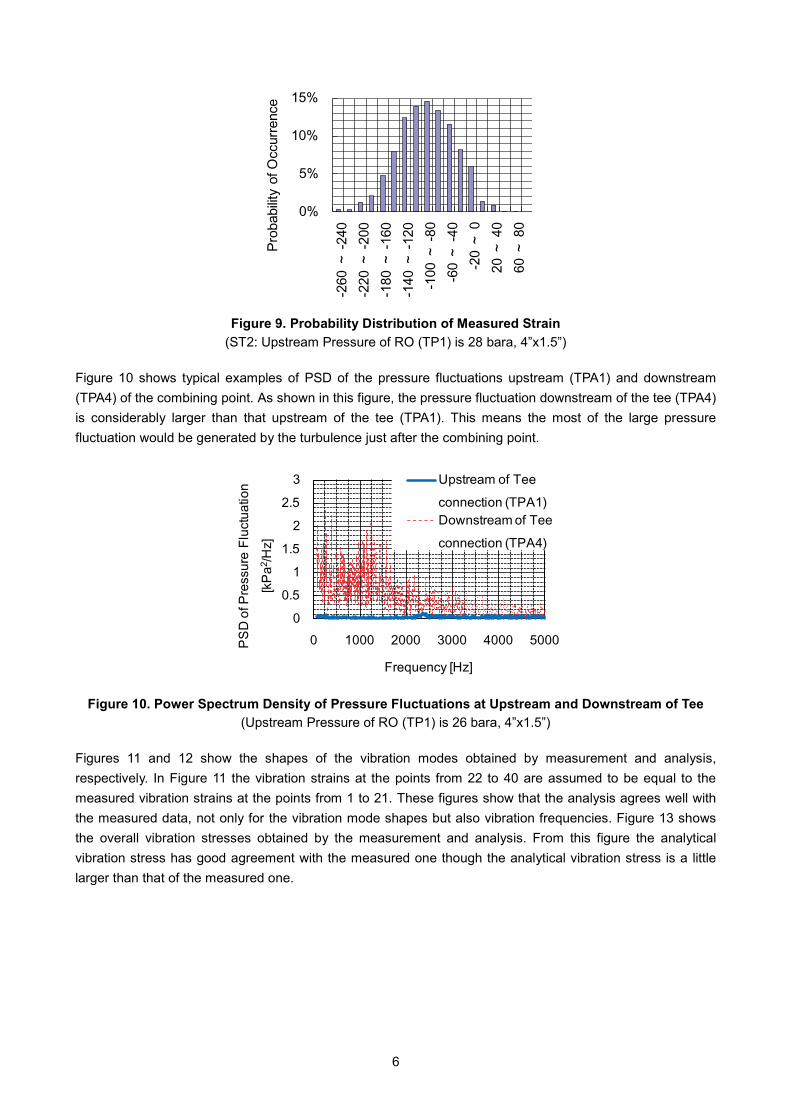
Figures 7 and 8 show typical examples of the measured time histories of pressure fluctuation and strain respectively. As shown in these figures the time history data seem to have random vibration characteristics with no periodic vibration characteristics. Figure 9 shows the probability distribution of the measured strain. Figure 9 shows that the measured probability distribution is almost close to the normal probability distribution. This is one of the typical characteristics of random vibration [5].
Figure 7. Time History of Measured
Pressure Fluctuation (TPA4: Upstream Pressure of RO is 28 bara, 4”x1.5”)
Figure 8. Time History of Measured Strain (ST2: Upstream Pressure of RO is 28 bara, 4”x1.5”)
-100
-50
0
50
100
150
200
0 0.2 0.4
Pres
sure
Flu
ctua
tion
[kPa
]
Time [Sec]
-300-250-200-150-100-50
050
0 0.2 0.4
Stra
in [µ
ST]
Time [Sec]
6
Figure 9. Probability Distribution of Measured Strain
(ST2: Upstream Pressure of RO (TP1) is 28 bara, 4”x1.5”)
Figure 10 shows typical examples of PSD of the pressure fluctuations upstream (TPA1) and downstream (TPA4) of the combining point. As shown in this figure, the pressure fluctuation downstream of the tee (TPA4) is considerably larger than that upstream of the tee (TPA1). This means the most of the large pressure fluctuation would be generated by the turbulence just after the combining point.
Figure 10. Power Spectrum Density of Pressure Fluctuations at Upstream and Downstream of Tee (Upstream Pressure of RO (TP1) is 26 bara, 4”x1.5”)
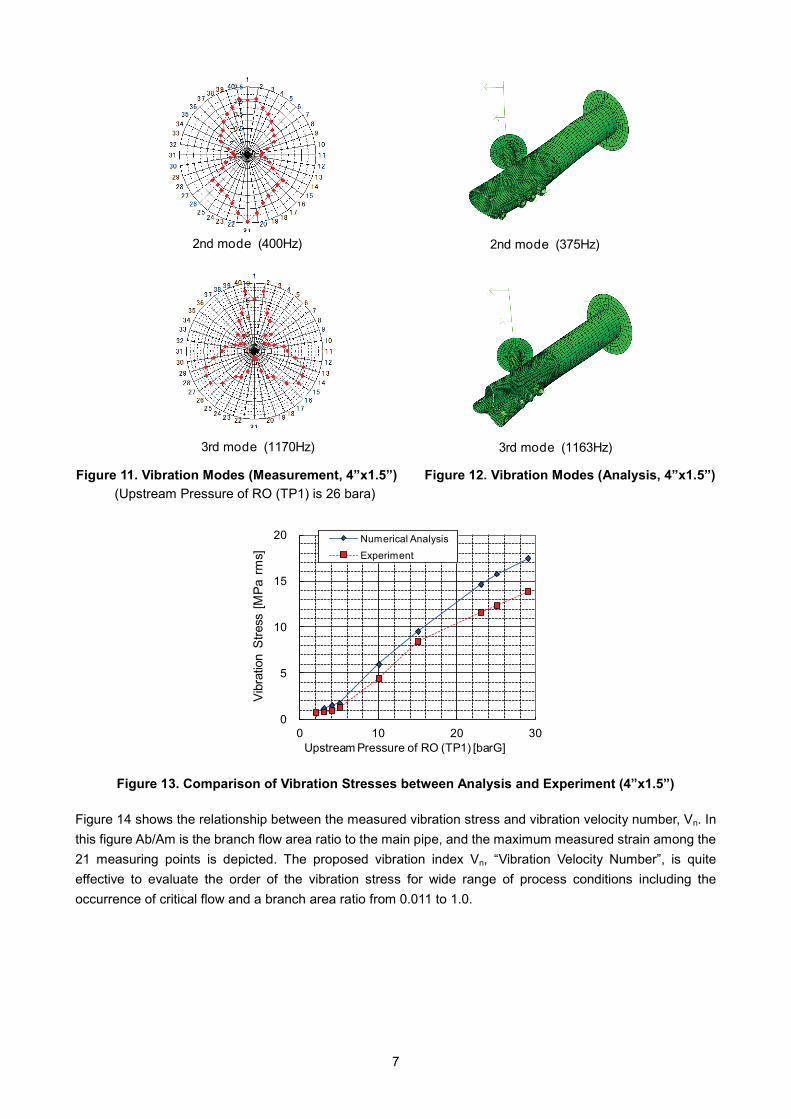
Figures 11 and 12 show the shapes of the vibration modes obtained by measurement and analysis, respectively. In Figure 11 the vibration strains at the points from 22 to 40 are assumed to be equal to the measured vibration strains at the points from 1 to 21. These figures show that the analysis agrees well with the measured data, not only for the vibration mode shapes but also vibration frequencies. Figure 13 shows the overall vibration stresses obtained by the measurement and analysis. From this figure the analytical vibration stress has good agreement with the measured one though the analytical vibration stress is a little larger than that of the measured one.
0%
5%
10%
15%
-260
~-2
40-2
20 ~
-200
-180
~-1
60-1
40 ~
-120
-100
~-8
0-6
0 ~
-40
-20 ~
020
~40
60 ~
80 Pr
obab
ility
of O
ccur
renc
e
0
0.5
1
1.5
2
2.5
3
0 1000 2000 3000 4000 5000PSD
of P
ress
ure
Fluc
tuat
ion
[kPa
2 /Hz]
Frequency [Hz]
Upstream of Tee connection (TPA1)Downstream of Tee connection (TPA4)
7
Figure 11. Vibration Modes (Measurement, 4”x1.5”) Figure 12. Vibration Modes (Analysis, 4”x1.5”) (Upstream Pressure of RO (TP1) is 26 bara)
Figure 13. Comparison of Vibration Stresses between Analysis and Experiment (4”x1.5”)
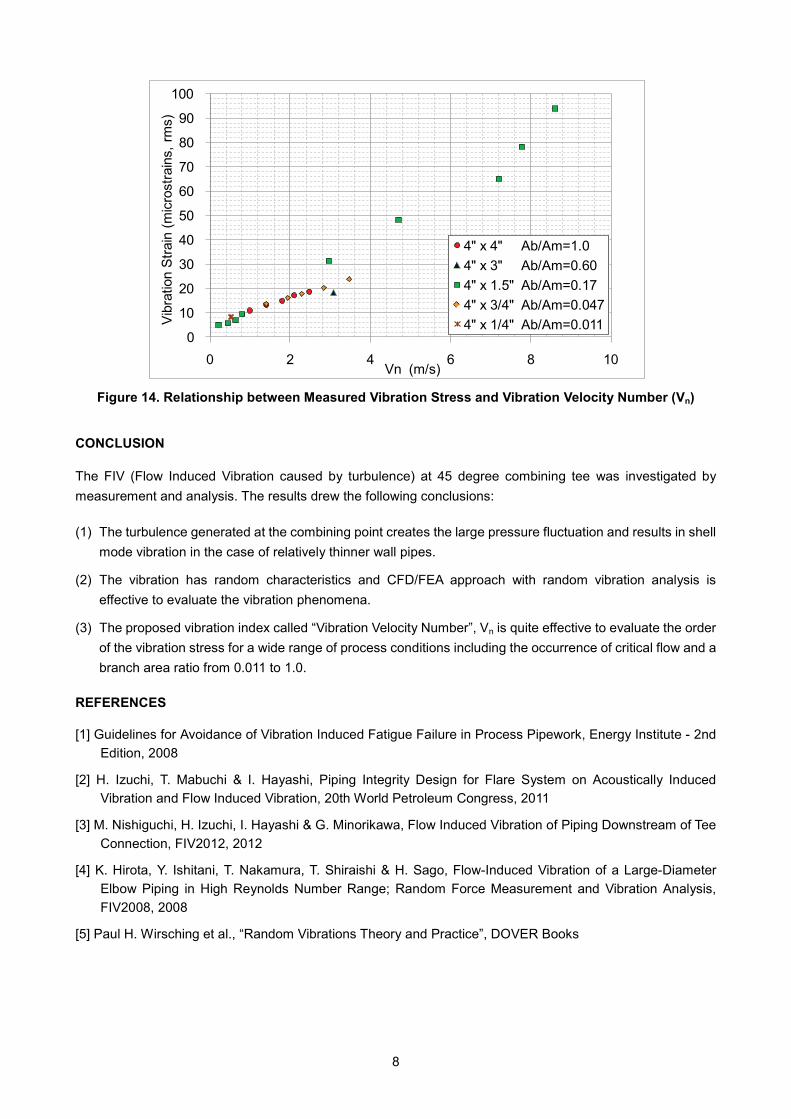
Figure 14 shows the relationship between the measured vibration stress and vibration velocity number, Vn. In this figure Ab/Am is the branch flow area ratio to the main pipe, and the maximum measured strain among the 21 measuring points is depicted. The proposed vibration index Vn, “Vibration Velocity Number”, is quite effective to evaluate the order of the vibration stress for wide range of process conditions including the occurrence of critical flow and a branch area ratio from 0.011 to 1.0.
2nd mode (400Hz)
3rd mode (1170Hz)
2nd mode (375Hz)
3rd mode (1163Hz)
0
5
10
15
20
0 10 20 30
Vibr
atio
n St
ress
[MPa
rm
s]
Upstream Pressure of RO (TP1) [barG]
Numerical AnalysisExperiment
8
Figure 14. Relationship between Measured Vibration Stress and Vibration Velocity Number (Vn)
CONCLUSION
The FIV (Flow Induced Vibration caused by turbulence) at 45 degree combining tee was investigated by measurement and analysis. The results drew the following conclusions:
(1) The turbulence generated at the combining point creates the large pressure fluctuation and results in shell mode vibration in the case of relatively thinner wall pipes.
(2) The vibration has random characteristics and CFD/FEA approach with random vibration analysis is effective to evaluate the vibration phenomena.
(3) The proposed vibration index called “Vibration Velocity Number”, Vn is quite effective to evaluate the order of the vibration stress for a wide range of process conditions including the occurrence of critical flow and a branch area ratio from 0.011 to 1.0.
REFERENCES
[1] Guidelines for Avoidance of Vibration Induced Fatigue Failure in Process Pipework, Energy Institute - 2nd Edition, 2008
[2] H. Izuchi, T. Mabuchi & I. Hayashi, Piping Integrity Design for Flare System on Acoustically Induced Vibration and Flow Induced Vibration, 20th World Petroleum Congress, 2011
[3] M. Nishiguchi, H. Izuchi, I. Hayashi & G. Minorikawa, Flow Induced Vibration of Piping Downstream of Tee Connection, FIV2012, 2012
[4] K. Hirota, Y. Ishitani, T. Nakamura, T. Shiraishi & H. Sago, Flow-Induced Vibration of a Large-Diameter Elbow Piping in High Reynolds Number Range; Random Force Measurement and Vibration Analysis, FIV2008, 2008
[5] Paul H. Wirsching et al., “Random Vibrations Theory and Practice”, DOVER Books
0
10
20
30
40
50
60
70
80
90
100
0 2 4 6 8 10
Vibr
atio
n St
rain
(mic
rost
rain
s, rm
s)
Vn (m/s)
4" x 4" Ab/Am=1.04" x 3" Ab/Am=0.604" x 1.5" Ab/Am=0.174" x 3/4" Ab/Am=0.0474" x 1/4" Ab/Am=0.011