Meat Industry Capacity and Feasibility Study - UCCE Central Sierra
107
Meat Industry Capacity and Feasibility Study of the North Coast Region of California Award No. 07 79 05983 This Report was Prepared under an Award from the U.S. Department of Commerce Economic Development Administration for the Mendocino County Economic Development and Financing Corporation. This publication was prepared by Shermain Hardesty, John Harper, Yoko Kusunose, Morgan Doran, Stephanie Larson, Theresa Becchetti, Roger Ingram, Lauren Gwin and Ed Wright. The statements, conclusions, and recommendations are those of the authors and do not necessarily reflect the views of the Economic Development Administration. March 31, 2009
Transcript of Meat Industry Capacity and Feasibility Study - UCCE Central Sierra

Meat Industry Capacity and Feasibility Study of the North Coast Region of California
Award No. 07 79 05983
This Report was Prepared under an Award from the U.S. Department of Commerce Economic Development Administration for the Mendocino County Economic Development and Financing Corporation. This publication was prepared by Shermain Hardesty, John Harper, Yoko Kusunose, Morgan Doran, Stephanie Larson, Theresa Becchetti, Roger Ingram, Lauren Gwin and Ed Wright. The statements, conclusions, and recommendations are those of the authors and do not necessarily reflect the views of the Economic Development Administration.
March 31, 2009

ii
Project Team
Shermain Hardesty, Cooperative Extension Specialist, Department of Agricultural and Resource Economics, UC Davis and Director, Small Farm Program, University of California
John Harper, Mendocino County Director and Livestock & Natural Resources Advisor U.C. Cooperative Extension Mendocino & Lake Counties
Yoko Kusunose, Graduate Student Researcher, Department of Agricultural and Resource Economics, UC Davis
Morgan Doran, Livestock & Natural Resources Advisor U.C. Cooperative Extension, Yolo, Solano and Napa Counties
Stephanie Larson, Livestock & Natural Resources Advisor U.C. Cooperative Extension, Sonoma and Marin Counties
Theresa Becchetti, Livestock & Natural Resources Advisor U.C. Cooperative Extension, Stanislaus and San Joaquin Counties
Roger Ingram, Placer-‐Nevada County Director and Livestock & Natural Resources Advisor U.C. Cooperative Extension Placer and Nevada Counties
Lauren Gwin, Subcontractor
Ed Wright, Facility Group Inc.
Reference as: Hardesty, S., J. Harper, Y. Kusunose, M. Doran, S. Larson, T. Becchetti, R. Ingram, L. Gwin, and E. Wright. 2009. Meat Industry Capacity and Feasibility Study of the North Coast Region of California. University of California Cooperative Extension Mendocino County, University of California Davis Department of Agricultural and Resource Economics, Mendocino Economic Development and Financing Corporation, Award No. 07 79 05983, U. S. Department of Commerce Economic Development Administration. 107 pgs.
Acknowledgements We want to thank the cooperating ranchers, distributors, chefs, and meat buyers for grocery chains and niche meat markets, who generously gave their time and participated in our surveys. We also thank J.T. Williams for his survey data entry and Linda Blatchford for her editing.
iii
Abstract This report summarizes four separate studies to determine the capacity and feasibility of creating a modern small scale (80 head of cattle and 50 head of lamb or goat kids per day) multi-‐species harvest and meat processing plant (Facility) that is based on “localized” facilities now only found in New Zealand. The advantages of this type of facility include improved safety for workers, humane handling of animals, environmentally-‐ friendly, energy efficient, local production and sale of meat products that are branded in the growing niche meat market. These niche meats include, natural, grass-‐fed, kosher, halal and organic as well as value-‐added products like smoked meats and sausages. The four studies were: Facilities Design, Potential Livestock Supply, Northern California Niche Meat Market Demand and Economic Analysis. The first three studies provided the necessary data to be used in the fourth to determine the economic impact to the region and feasibility based on risk, supply and demand. Details of each study are summarized in the Executive Summary and corresponding section. Establishment of the Facility would have the following impacts:
• Gross value of livestock in region would increase from $15.8 million to $29 million annually
• Production of $58. 2 million of harvested and processed meat
• 682 additional full-‐time equivalent jobs (10% increase; only 44 jobs directly attributable to the Facility)
• Labor income would rise a net $16 Million (31% increase)
• Total value added to regional economy by 3 industries would increase by 47% ($23 million)

iv
Executive Summary This report summarizes four separate studies to determine the capacity and feasibility of creating a modern small scale (80 head of cattle and 50 head of lamb and goat kids per day) multi-‐species harvest and meat processing plant (Facility), based on “localized” facilities now only found in New Zealand. The advantages of this type of facility include improved worker safety, humane animal handling, environmentally friendly, energy efficient, local production and sales of branded meat products in the growing niche meat market. These niche meats include natural, grass-‐fed, kosher, halal and organic, as well as value-‐added products such as smoked meats and sausages. Findings from the first three studies— Facilities Design, Potential Livestock Supply, and Northern California Niche Meat Market Demand—were used as the basis for the fourth study, Economic Analysis.
Facilities Design
The Facility design and cost estimates were developed by the Facility Group, Inc. with specific design considerations provided by GHD of New Zealand. The design criteria included an approximately 44,000 square foot USDA-‐approved structure with livestock receiving and holding areas, two complete kill and evisceration lines for beef and lamb or goat, carcass chill coolers, by-‐products processing , fabrication, further processing and packaging, fresh and frozen product storage, and employee welfare and administrative office space. The Facility Group estimated the Master Plan project budget to total $17,962,000. Extensive details and project drawings are provided in the accompanying Master Planning Report.
Potential Livestock Supply Study
We evaluated the potential livestock supply for the Facility within a two-‐tiered region. Tier 1 includes counties that are geographically located within the traditional concept of locally-‐based for the North Coast Region-‐-‐Mendocino, Lake, Sonoma, Marin and Napa. Tier 2 counties represent the next sphere which many would still consider local production-‐-‐Yolo, Solano, Glenn, Colusa and Contra Costa. Our primary data source for this assessment was a survey that was developed and conducted by University of California Cooperative Extension in 2006. To expand the number of respondents for the North Coast, four of the Cooperative Extension Livestock Advisors conducted facilitated questionnaire completion sessions in 2008 with a slightly modified survey instrument. Our findings are summarized below. • The majority of North Coast ranchers are cow-‐calf producers. Over 85% of the livestock raised by ranchers participating in our survey are marketed traditionally; the weaned calves and feeder cattle are sold through auctions or contracted sales.
• In our survey, most of the respondents are 45 or older (86%). Over 86% of them had gross farm incomes of $250,000 or less. Such small farms usually have limited financial resources, implying that these ranchers have limited capacity to invest as part-‐owners in the Facility.
• USDA’s 2007 Census of Agriculture data indicate that livestock sales volumes are more than adequate to support involvement in the Facility along with continued sales through traditional markets.
• Sixty-‐one percent of the ranchers in our survey rated their access/availability of slaughter and processing facilities as “very deficient”.

v
• While the ranchers in our survey have a strong interest in the Facility, they preferred to participate as suppliers to a branded program, rather than as direct marketers of the custom-‐processed meats or as part-‐owners.
• Ranchers rated their interest in the potential services offered by the Facility on a 5-‐point scale as
follows.
Tier 1 and 2 Counties Combined Service % rating 5 Mean rating Meat delivery to final destination 49 3.9 Animal pick-‐up 41 3.4 Advertising & marketing support 40 3.6 Pasturing finishing 36 3.1 Dry aging 34 3.2 Organic processing 34 3.2 Label design & approval 29 3.1 Smoking & curing 25 3.0 Sausage production 21 2.9 Feedlot grain finishing 21 2.3 Kosher slaughter 15 2.3 Jerky 14 2.6 Halal slaughter 10 2.1
• Although 71% of the ranchers indicated that they would be willing to travel up to 90 minutes one-‐
way to deliver their livestock to the Facility, two of their three most desired services were meat delivery to final destination and animal pick-‐up.
• The expected delivery volumes to the Facility reported by ranchers for beef and the other species
were only 6% and 13% higher, respectively, than the Facility’s planned processing capacities; this leaves little room for changing commitments. The critical unanswered question is how many of the ranchers marketing through traditional channels who did not respond to our survey would be interested in partial or full participation in the Facility.
• The strong seasonality in projected deliveries could be problematic in regard to both processing
capacity and marketing of the meat products. • Ranchers’ finishing capacity is a major consideration since their expected deliveries of finished cattle
represented less than 20% of the Facility’s projected capacity. Furthermore, 60% of the ranchers indicated that they had very little or no finishing capacity. The establishment of multiple small-‐scale local grain-‐finishing feedlots will be necessary.
Northern California Niche Meat Market Demand Study
We assessed market prospects for niche meats in the San Francisco/Sacramento region. After reviewing the recent literature regarding the U.S. niche meat market, we conducted 42 interviews with individuals responsible for meat purchasing in three key sectors of the food distribution system: restaurants and institutional food service providers (IFSPs); retail grocers (primarily regional chains); and distributors. Our findings are summarized below.

vi
• Demand for niche meats is growing rapidly in the U.S. In 2006, sales of natural and organic beef in grocery stores increased over the previous year by 28.4% in dollar value and 24.5% in pound value. Three-‐fourths of our respondents expected their niche meat volumes to increase over the next year and also over the next three years.
• Consumer demand for niche meats is often motivated by beliefs that natural and organic meats are fresher, have better nutritional value, taste, and long-‐term health benefits than conventional meats, and that the animals are healthier and better treated than conventional livestock.
• The most popular red meats are beef, pork and lamb. The most popular niche categories are
naturally-‐raised (no hormones or antibiotics administered during the animal’s lifetime, often referred to as “never/ever”), grass-‐fed, and local.
• Price premiums for niche meats (over conventional) depend on the cut, niche attribute, brand,
and shifts in conventional pricing. Premiums of 10-‐30% were common, though certified organic meats were typically much higher.
• Across all three market sectors, fresh meats are preferred over frozen. Purchases of whole
carcasses are usually limited to hogs and lambs; beef carcasses were typically considered too large to handle in-‐house. Restaurants, IFSPs, and distributors are more willing to work with seasonally available meats than are retailers.
• More than half (59%) of the restaurant/IFSP respondents said that high-‐end cuts were the most
popular, while the rest use more burger and lower end cuts for braised dishes. Nearly half of the retailers sell mostly middle meats. Most distributors found a market for everything and grind any extra end meat.
• Respondents were asked to rate the importance of various attributes, on a scale ranging from 1
to 5, with 5 meaning “very important.” Taste had the highest average rating (4.9), followed by “no hormones/antibiotics” (4.0), “consistent cut size/shape” (4.0), “health benefits” (3.9) and “humanely raised” (3.7). Despite the fact that they are frequently mentioned, the least important attributes were grass-‐fed (2.7) and certified organic (2.6); grass-‐fed is not satisfactory to the typical U.S. consumer palate in terms of taste and texture, and organic is not different enough from other niche meats to justify its high price. “Local,” “family farmed” and “personal connection with producer” had similar average ratings (3.4 and 3.5).
• Although commonly used, there is no common understanding of the terms “naturally raised,”
“local,” and “certified humane.”
• Less than half of respondents are interested in three younger grass-‐fed beef products – vitello, vitellone, and manzo – which are listed in order of declining popularity; restaurants were the most interested.
• The most common challenge with purchasing local meats was volume – having enough and
having it regularly available. The next most common challenge was “quality,” including taste, texture, size of cuts, fat content, and variability among individual cuts.

vii
• The majority of respondents identify their niche meat suppliers in some way to their customers. • Based on the average volumes of niche beef bought and sold by distributors in this study, we
estimate that ten such distributors would account for more than 14 million pounds of niche beef per year.
• A broad range of niche meat offerings, including the “never/ever,” humanely raised and locally
produced attributes, and with pork and lamb in the species mix, is desirable. There is also considerable demand among retailers for kosher and processed niche meats.
Economic Analysis of North Coast Multi-species Niche Meats Processing Facility
This economic analysis examined the Facility’s risks, potential funding sources and economic impact to the region. • Risk management is critical for this long-‐term project, given its $18 million Master Plan budget and
additional land acquisition costs. Most risks during the planning and construction phase should be avoidable with thorough pre-‐development analysis and project management.
• Potential losses associated with internal risks involved with the Facility’s ongoing operations can be
minimized by hiring experienced management, maintaining the facility in good operating condition, continual evaluation of operations and contingency planning. External risks can be mitigated by having a strong trend monitoring program and adjusting product lines in response to changing market conditions and regulatory requirements.
• The Facility’s environmental and social features will enhance its fundability, particularly since there
is growing support for smaller-‐scale regional food processing facilities. • A mix of funding sources appears to be the most likely. Potential private sources include regional
banks, specialized banks such as Shorebank and CoBank, socially-‐minded venture capitalists, ranchers and preferred stock. The 2008 Farm Bill provided for loan guarantees for businesses involved in local and regional food distribution Public funding sources include grants from USDA Rural Development, industrial revenue bonds and Community Development Block Grants.
• We estimated that the direct economic impact of the facility construction activities to be less than $7 million for the $18 million project, primarily because many of the inputs are specialized and will be brought in from other regions.
• We applied the widely-‐used software program, IMPLAN, which utilizes input-‐output analysis to
incorporate the ripple effects of the economic activity in the 10-‐county region associated with the increased values of meat processing and livestock production attributable to the Facility. Our model included two livestock industries — cattle ranching and other livestock (includes sheep, hogs, goats, and various minor species, but not poultry) — and animal slaughter. IMPLAN considered the Project’s direct, indirect and induced effects; induced effects incorporate the local household spending on goods and services resulting from the labor income generated through the direct and indirect effects.
• IMPLAN calculated the following multipliers for economic activity within the region:

viii
Multiplier EMPLOYMENT (full time job equivalents) Cattle ranching and farming 1.4 Other livestock production 1.2 Animal, except poultry, slaughtering 2.9 LABOR INCOME Cattle ranching and farming 3.8 Other livestock production 2.2 Animal, except poultry, slaughtering 2.1 TOTAL VALUE ADDED Cattle ranching and farming 6.0 Other livestock production 3.3 Animal, except poultry, slaughtering 2.5
The cattle ranching employment multiplier of 1.4 means that for every full-‐time equivalent job added in cattle ranching, a 0.4 job is created in the region’s other industries. The 6.0 value-‐added multiplier for cattle ranching implies that every $1.0 million of value added in cattle ranching through employee compensation, indirect business taxes, proprietary and other property type income results in $5.0 million of value added in other industries within the region.
• We estimated that the gross value of livestock sales in the region would increase from $15.8 million to $29.0 million annually and that the Facility would produce $58.2 million of slaughtered and processed meat.
• The Facility’s activities are projected to generate an additional 682 full-‐time equivalent jobs (a 10% increase, including the Facility’s 44 employees), labor income would rise a net $16 million (a 31% increase) and the total value added to the regional economy would increase by 47% ($23 million).

ix
Table of Contents Project Team ...............................................................................................................................................ii
Acknowledgements.....................................................................................................................................ii
Abstract.......................................................................................................................................................iii
Executive Summary ................................................................................................................................. iv
Facilities Design ..................................................................................................................................... iv
Potential Livestock Supply Study.......................................................................................................... iv
Northern California Niche Meat Market Demand Study ......................................................................v
Economic Analysis of North Coast Multi-‐species Niche Meats Processing Facility..........................vii
List of Tables ............................................................................................................................................. xii
List of Figures ........................................................................................................................................... xiv
Introduction ............................................................................................................................................. 15
Potential Livestock Supply .................................................................................................................. 15
Northern California Niche Meat Market Demand .............................................................................. 15
Facilities and Process Design Study.................................................................................................... 16
Economic Analysis ............................................................................................................................... 16
Potential Livestock Supply Study............................................................................................................ 18
Executive Summary ............................................................................................................................. 18
Introduction ......................................................................................................................................... 20
Methodology......................................................................................................................................... 23
Findings ................................................................................................................................................ 23
Respondent Demographics ................................................................................................................ 23
Current Marketing Volumes............................................................................................................... 24
Existing Marketing Channels ............................................................................................................. 26
Use of Existing Facilities..................................................................................................................... 26
Marketing Systems ............................................................................................................................ 28
Interest in New Facility ...................................................................................................................... 28
Potential Animal Supplies .................................................................................................................. 31
Conclusions Regarding North Coast Region Livestock Supply and Processing Needs Assessment33
APPENDIX for Potential Livestock Supply Study ............................................................................... 34
Example Guided Survey ..................................................................................................................... 54
x
Northern California Niche Meat Market Demand Study ....................................................................... 60
Executive Summary ............................................................................................................................. 60
Introduction ......................................................................................................................................... 62
Background .......................................................................................................................................... 62
Methodology......................................................................................................................................... 64
Results & Discussion ............................................................................................................................ 65
Red Meats Sold .................................................................................................................................. 65
Niche Meats Sold ............................................................................................................................... 65
Approximate Volumes of Niche Meats Sold....................................................................................... 67
Increases in Niche Meat Use .............................................................................................................. 68
Niche Meats Wanted If Supply Were Available ................................................................................. 69
Price Premiums Paid For Niche Meat................................................................................................. 70
How Retailers Sell Meats ................................................................................................................... 70
Use of Frozen Meats .......................................................................................................................... 70
Use of Whole Carcasses ..................................................................................................................... 70
Use of Seasonal Meats....................................................................................................................... 71
Most/Least Popular Cuts ................................................................................................................... 71
Attribute Ratings................................................................................................................................ 72
Interest in New Grass-‐fed Beef Products: Vitello, Vitellone, and Manzo ........................................... 73
How to Define “Local” For Meats ...................................................................................................... 74
How Long Respondents Have Carried Local Meats............................................................................ 74
Where They Buy Local Meats............................................................................................................. 74
Challenges in Purchasing Local Meats ............................................................................................... 74
Customer Requests for Niche Meats.................................................................................................. 75
Niche Customer Profile (Retailers Only) ............................................................................................. 76
Number of Meat Suppliers ................................................................................................................. 76
How Respondents Identify Suppliers to Their Customers................................................................... 76
Orders and Deliveries ......................................................................................................................... 77
Biggest Challenges in Purchasing Niche Meats ................................................................................. 77
Conclusions........................................................................................................................................... 78
APPENDIX: Northern California Niche Meat Market Demand Study ............................................... 80
QUESTIONNAIRE/INTERVIEW GUIDE ................................................................................................. 80

xi
References ................................................................................................................................................ 84
Economic Analysis of North Coast Multi-‐species Niche Meats Processing Facility............................. 86
Executive Summary ............................................................................................................................. 86
Assessment of Risk Factors Affecting Project Feasibility.................................................................. 88
Financial Capital Structure and Availability....................................................................................... 90
Private Funding Sources..................................................................................................................... 90
Rancher Investment ........................................................................................................................... 91
Public Funding Sources ...................................................................................................................... 93
Regional Economic Impact of Proposed Facility................................................................................ 95
Construction Impacts ......................................................................................................................... 95
Input-‐Output Analysis of Ongoing Activities ...................................................................................... 95
The Approach..................................................................................................................................... 97
Geographic Area Multipliers .............................................................................................................. 98
Estimating the Economic Impact of the Meat Processing Facility ................................................... 100
Conclusions......................................................................................................................................... 102
APPENDIX: Economic Analysis of North Coast Multi-‐species Niche Meats Processing Facility.. 103
References .............................................................................................................................................. 106

xii
List of Tables Table 1: Age Composition of Respondents Tier 1 & 2 Counties Combined ................................................23 Table 2: Livestock Sales as Reported in 2007 Census of Agriculture -‐ Tier 1 & 2........................................24 Table 3: Comparison of Reported Livestock Sales ......................................................................................25 Table 4: Animal Sales by Marketing Channel Tier 1 & 2 Combined............................................................26 Table 5: Satisfaction with Current Slaughter and Processing Facility Tier 1 and 2 Combined....................26 Table 6: Animals Transported, Mileage and Travel Time to Slaughter and Processing Facility Tier 1 and 2
Combined ......................................................................................................................................27 Table 7: Current Availability/Accessibility of Facilities Tiers 1 & 2 Combined ............................................28 Table 8: Interest in Alternative Marketing Structures Tiers 1 & 2 Combined.............................................28 Table 9: Maximum One-‐way Travel Time to Processing Facility Tiers 1 & 2 Combined .............................29 Table 10: Interest in Services Offered (5 point rating scale).......................................................................31 Table 11: Expected Annual Livestock Deliveries to Facility by Animal Type...............................................31 Table 12: Expected Livestock Deliveries by Species and Month Tiers 1 and 2 Combined..........................32 Table 13: Season Extension Capacity -‐ Tier 1 and 2 Counties Combined ...................................................32 Table 14: Finishing Capacity -‐ Tier 1 and 2 Counties Combined .................................................................33 Appendix Table A: Comparison between 2006 and 2008 Annually Marketed Animals [TIER 1] ................35 Appendix Table B: Comparison between 2006 and 2008 Operation Size Category: Cow-‐Calf [TIER 1] .....38 Appendix Table C: Comparison between 2006 and 2008 Operation Size Category:
Weaned Calves [TIER 1] ...............................................................................................39 Appendix Table D: Comparison between 2006 and 2008 Operation Size Category: Sheep [TIER 1]..........40 Appendix Table E: Comparison between 2006 and 2008 Operation Size Category: Goats [TIER 1]...........41 Appendix Table F: Comparison between 2006 and 2008 Gross Revenue [TIER 1] (Chi-‐squared test) .......42 Appendix Table G: Comparison between 2006 and 2008 Principal Operator Age [TIER 1]........................44

xiii
Appendix Table H: Comparison between 2006 and 2008 Annually Marketed Animals [TIER 1 & 2 COUNTIES COMBINED] (T-‐Test for independent samples) .......................45
Appendix Table I: Comparison between 2006 and 2008 Operation Size Category: Cow-‐Calf
[TIER 1 & 2 COUNTIES COMBINED] .............................................................................47 Appendix Table J: Comparison between 2006 and 2008 Operation Size Category: Weaned Calves
[TIER 1 & 2 COUNTIES COMBINED] .............................................................................48 Appendix Table K: Comparison between 2006 and 2008 Operation Size Category: Sheep
[TIER 1 & 2 COUNTIES COMBINED] .............................................................................49 Appendix Table L: Comparison between 2006 and 2008 Operation Size Category: Goats
[TIER 1 & 2 COUNTIES COMBINED] .............................................................................50 Appendix Table M: Comparison between 2006 and 2008 Age of Principal Operator
[TIER 1 & 2 COUNTIES COMBINED] .............................................................................51 Appendix Table N: Comparison between 2006 and 2008 Annual Gross Revenue
[TIER 1 & 2 COUNTIES COMBINED] .............................................................................52 Table 15: Red Meat Species Marketed .......................................................................................................65 Table 16: Use of Specific Categories of Niche Meats..................................................................................66 Table 17: Pounds of Niche Meats Sold Per Week.......................................................................................68 Table 18: Belief That Niche Meat Volumes Will Increase In 1, 3 Years.......................................................68 Table 19: Knowledge of, Interest in Three Grass-‐fed Beef Products ..........................................................73 Table 20: Challenges in Purchasing Local Meats ........................................................................................74 Table 21: Methods of Identifying Suppliers to Customers .........................................................................76 Table 22: Challenges in Purchasing Niche Meats .......................................................................................77 Table 23: Projected Master Plan Budget ....................................................................................................95 Table 24: Economic Impact Effects and Multipliers Tiers 1 and 2 Combined.............................................98 Table 25: Estimated Regional Economic Impacts of Facility Tier 1 and Tier 2 Counties Combined..........101

xiv
List of Figures Figure 1: Cattle Production Timeline ..........................................................................................................21 Figure 2: Lamb Production Timeline...........................................................................................................21 Figure 3: Map of Tier 1 and Tier 2 Counties ...............................................................................................22 Figure 4: Time to Transport -‐ Tiers 1 & 2 Combined...................................................................................27 Figure 5: Maximum One-‐way Travel Time to Processing Facility Tiers 1 & 2 Combined............................30 Appendix Figure A: Cattle Prices.................................................................................................................34 Appendix Figure B: Gross Revenue Distribution.........................................................................................43 Appendix Figure C Gross Farm Revenues ...................................................................................................53 Figure 6: Red Meat Species Marketed........................................................................................................65 Figure 7: Use of Specific Niche Red Meats .................................................................................................66 Figure 8: Average Attribute Ratings (1-‐5), All Respondents ......................................................................73 Figure 9: Input and Output Flows in a Local Economy ...............................................................................97

15
Introduction Authors: John Harper and Shermain Hardesty A small scale, multi-‐species harvesting and processing facility has been proposed for the North Coast Region of California to rebuild the local meat production industry. It will incorporate the latest innovations in health and safety, optimal energy utilization, humane slaughter, and environmental controls. The University of California Cooperative Extension has contracted with the Mendocino County Economic Development and Financing Corporation to conduct a Meat Industry Capacity and Feasibility Study of the North Coast Region of California to determine the viability of such a facility and the economic impact to the region. There are four components to this study: Potential Livestock Supply, Northern California Niche Meat Market Demand Study, Facilities and Process Design Study, and an Economic Analysis. Each component’s scope of work is described below; and methods, results and conclusions are provided in the respective section for that component. The Facilities and Process Design Study, however, is a separate body of work by the Facility Group, Inc. of the USA and GHD Company of New Zealand. Their information resulted in a Master Planning Report that accompanies our report. It was used in our livestock supply and economic analysis.
Potential Livestock Supply
Our first goal is to establish the capacity of the meat production industry to rebuild in Northern California focusing on the North Coast region. We will look at two distinct tiers within this region. Tier 1 will include Mendocino, Lake, Sonoma, Marin, and Napa Counties. Tier 2 will include Contra Costa, Glenn, Colusa, Yolo and Solano Counties. We will research the current capacity through traditional and guided survey methods to determine:
• The number of animals potentially available for processing • The elasticity of production • The potential production under different pricing scenarios • The potential for custom slaughter by species • The potential use by livestock producers of a new facility
Northern California Niche Meat Market Demand
Our second goal is to assess consumer demand on the West Coast for four species (beef, pork, lamb and goat) of niche meats, such as organic, grass-‐fed, humanely slaughtered, kosher and halal. Along with reviewing information from published sources, interviews with individuals in the food industry (grocery, food service and meat distribution) will be conducted to assess the current and future market on the West Coast for such products. Trends and preferences for niche meats will be measured for key retailers, chefs and distributors of such products. The following approach will be used for this part of the analysis:
• Review information in the popular press, plus meat and restaurant industry publications regarding trends in niche meats
• Conduct approximately 35 interviews with distributors, leading chefs and meat buyers for grocery chains and niche meat markets on the West Coast regarding their buying practices and unmet needs for niche meats (note that Bon Appétit Management and Sodexo Foods will be

16
included in the chef interviews; both of these food service firms have made commitments to support local agriculture)
The distributors, chefs and retail meat buyers will be queried regarding their niche meats buying practices, preferences and needs. Potential interview topics include:
• Current and projected niche meats purchasing volumes by species and niche type (such as organic, grass fed, kosher, halal)
• Price premiums paid for different types of niche meats
• Seasonality of demand
• Sourcing practices
• Packaging and cut preferences, most popular cuts
• Quality factors
• Use of lesser cuts
• Labeling and product information needs
• Niche meat customer demographics
Facilities and Process Design Study
The facilities and process design study will be contracted out to the Facility Group Inc. of Smyrna, GA, USA and they will work in concert with the GHD Company from New Zealand. Their charge is to develop a concept and budget for a unique multi-‐species harvest and processing facility based on the new (to the United States) designs currently being used in New Zealand. Foremost in these designs are support of the regional family farmer by provision of an organized and consolidated approach to production, processing and marketing high quality natural, organic, and grass fed meat products; access to a larger market; and realization of value added products that would be offered to high end specialty, niche and consumer markets. The unique designs and work flow allow workers and animals a safe and humane environment presently not routinely found in typical US facilities.
Economic Analysis The economic analysis will be initiated after the Facilities and Process Design, Northern California Niche Meat Market Demand, and Potential Livestock Supply studies have been completed. There are three components to the economic analysis: assessment of risk factors, capital structure and availability, and the project’s impact on the local economy. Various types of risk factors will be examined—such as those related to project development costs and construction delays, availability of specialized labor, availability of specific types of animals for processing, market demand for products, and regulatory requirements. The review of the capital structure and availability will depend largely on the findings of the Facilities and Process Design Study. Reliable cost estimates for land, plant construction, equipment and

17
operations are essential for determining the amounts of investment capital and working capital needed. Also, sources of public funding for this economic development project will be investigated. Traditional measures of local economic impact include output (gross sales of the new plant), jobs created, labor income, and value added (the sum of all wage and salary payments made to workers, normal profits accruing to investors, and tax payment made by individuals to governments). There are three dimensions of this economic activity: direct, indirect and induced. The direct values are those impacts attributable solely to the new plant. Indirect values are the processing inputs that the plant purchases, such as the animals, feed and energy. The induced effects result from the economic activity that occurs when the new plant’s employees spend their labor income on local household goods and services.

18
Potential Livestock Supply Study Authors: Shermain Hardesty, Yoko Kusunose and John Harper
Executive Summary
We evaluated the potential supply of livestock for the Facility. We defined two tiers of counties that could provide the required resources. Tier 1 includes counties that are geographically located within the traditional concept of locally-‐based and for the North Coast Region-‐-‐Mendocino, Lake, Sonoma, Marin and Napa. Tier 2 counties represent the next sphere out which many would still consider local production. These counties include Yolo, Solano, Glenn, Colusa and Contra Costa. For this assessment of the livestock supply and processing needs of livestock producers on the North Coast, our primary data source was a survey that was developed and conducted by University of California Cooperative Extension in 2006. In order to have a larger set of respondents for the North Coast, four of the Cooperative Extension Livestock Advisors conducted facilitated questionnaire completion sessions in 2008 with a slightly modified survey instrument. We also used the recently released data from USDA’s 2007 Census of Agriculture. Our findings are summarized below. • Prior to World War II, many ranches had small feedlots for local sales of finished cattle. Many farms grew their own grain also. Inexpensive fossil fuel and the post-‐World War II growth of the large retail stores favored transporting cattle-‐-‐and to some extent lambs-‐-‐to the sources of grain production; this resulted in the disappearance of local feedlots and grain production.
• The majority of North Coast commercial cattle producers follow a fall-‐calved production cycle, but some do spring-‐calving too. Most of these cattle producers, regardless of when they calve, are cow-‐calf producers. Over 85% of the livestock raised by ranchers participating in our survey are marketed traditionally; this means they sell weaned calves or feeder cattle through auctions or contracted sales.
• For current cow-‐calf producers to change their marketing, they would need to receive a premium price for either the lighter, younger cattle or the grass-‐finished animal to offset the reduced size of their cow herd, if they cannot expand the forage resource on their ranches. Alternatively, they would need to purchase or raise their own grain and build feedlot facilities. Additionally, selling locally produced meat requires a USDA inspected harvest and processing facility within a cost-‐effective distance to the livestock producer.
• In our survey, most of the respondents are 45 or older (86%); one-‐third are 65 or older. Over 86% of them had gross farm incomes of $250,000 or less, which qualifies them as a “small farm” under USDA’s definition. Most small farms are considered to have limited financial resources; thus, our survey respondents have limited capacity to invest as part owners in the Facility.
• The Census of Agriculture data indicate that livestock sales volumes are more than adequate to support involvement in the Facility along with continuation of sales through traditional markets. • Sales of finished cattle reported in our survey in the Tier 1 and Tier 2 counties were more than double the sales reported in the Census.
• Sixty-‐one percent of the ranchers in our survey rated the access/availability of slaughter and processing facilities as “very deficient”.

19
• Ranchers in our survey have a strong interest in participating in the Facility. Their highest level of interest with the Facility is in participating in a branded program, rather than in direct marketing custom-‐processed meats or in part ownership of the Facility. • Ranchers rated their interest as follows in the services to be offered by the Facility on a 5-‐point scale.
Tier 1 and 2 Counties Combined Service
% rating 5 Mean rating
Meat delivery to final destination 49 3.9 Animal pick-‐up 41 3.4 Advertising & marketing support 40 3.6 Pasturing finishing 36 3.1 Dry aging 34 3.2 Organic processing 34 3.2 Label design & approval 29 3.1 Smoking & curing 25 3.0 Sausage production 21 2.9 Feedlot grain finishing 21 2.3 Kosher slaughter 15 2.3 Jerky 14 2.6 Halal slaughter 10 2.1
• The relatively low interest ratings for the value-‐added products (such as smoking, sausage production and kosher slaughter) should not be construed as a signal to not offer these services at the Facility. Rather, ranchers are currently prevented from utilizing a custom processing facility because of transportation issues. Thus, most of them are currently not marketing their own meats and do not have a framework for understanding the importance of marketing value-‐added products. • Although 71% of the ranchers indicated that they would be willing to travel up to 90 minutes one-‐way to deliver their livestock to the Facility, two of their three most desired services are: meat delivery to final destination and animal pick-‐up. • It is unlikely that the 22% who are currently traveling 30 minutes or less to a facility would be willing to travel longer to a new facility, unless it offered more services and/or charged less. • The Facility is designed with annual slaughter capacity for 20,800 cattle and 13,000 sheep and goat kids. The expected delivery volumes to the Facility reported by ranchers in our survey for beef and the other species were only 6% and 13% higher, respectively, than the Facility’s planned processing capacities; this leaves little room for changing commitments. • Thus, utilization of the Facility needs to extend beyond the ranchers who responded to our survey. One of the critical questions that remains unanswered is how many of the ranchers marketing through conventional channels who did not respond to our survey would be interested in the future in partial or full participation in the Facility.

20
• There is strong seasonality in the projected deliveries could be problematic in regard to both processing capacity and marketing of the meat products. • Ranchers’ finishing capacity is a major consideration since the expected deliveries of finished cattle represented less than 20% of the Facility’s projected capacity. Furthermore, 60% of the ranchers indicated that they had very little or no finishing capacity. • In addition to the small-‐scale feedlot planned for the Facility, similar feedlots scattered throughout the region will be needed. Commitment by UCCE livestock advisors will also be necessary to support ranchers in their efforts to re-‐establish pasture finishing capacity.
Introduction
For a regional multi-‐species niche meat harvest and processing center to be viable, an adequate and adequate and consistent supply of animals is necessary. For organic, natural or traditional grain-‐finished cattle operations, animals typically spend 4-‐6 months in a feedlot. Younger and consequently lighter weight beef could be marketed in one grass production cycle, if that market existed in the United States. There are three classifications for these younger and lighter weight cattle known in Italy as vitello, vitellone, and manzo. They are harvested for meat at 3-‐4 months, 6-‐8 months and 11-‐13 months, respectively. Sheep and goats can be finished on grass within one grass production year usually at slightly lighter weights than California’s average of 133 pounds. Traditional cattle and sheep production cycles are shown in Figures 1 and 2. Meat goat production follows a similar cycle as sheep. The majority of North Coast commercial cattle producers follow a fall-‐calved production cycle, but some do spring-‐calving too. Most of these cattle producers, regardless of when they calve, are cow-‐calf producers. This means they sell weaned calves or feeder cattle. Prior to World War II, many ranches had small feedlots for local sales of finished cattle. Many farms grew their own grain also. Inexpensive fossil and the post-‐World orld Warar II growth of the large retail stores favored transporting cattle – and to some extent lambs – to the sources of grain production; this resulted in the disappearance of local feedlots and grain production. For current cow-‐calf producers to change their marketing, they would need to receive a premium price for either the lighter, younger cattle or the grass-‐finished animal to off-‐set the reduced size of their cowherd, if they cannot expand the forage resource of the ranch. Alternatively, they would need to purchase or raise their own grain and build feedlot facilities. Additionally, Additionally selling locally produced meat requires a USDA inspected harvest and processing facility within a cost-‐effective distance to the livestock producer.

21
Figure 1: Cattle Production Timeline
Adapted from 2007 GIPSA Livestock and Meat Marketing Study Volume 3: Fed Cattle and Beef Industries Final Report prepared by RTI International Health, Social, and Economics Research, Triangle Park, NC 27709
Figure 2: Lamb Production Timeline
Adapted from 2007 GIPSA Livestock and Meat Marketing Study Volume 5: Lamb and Lamb Meat Industries Final Report prepared by RTI International Health, Social, and Economics Research, Triangle Park, NC 27709
22
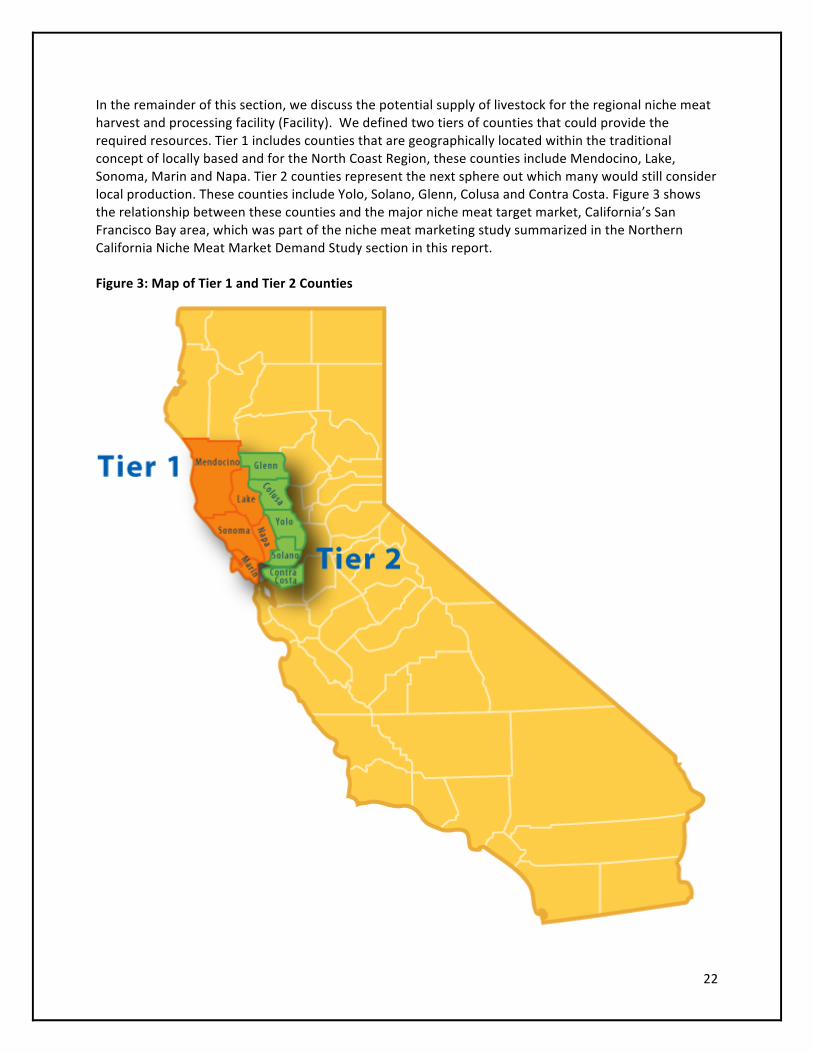
In the remainder of this section, we discuss the potential supply of livestock for the regional niche meat harvest and processing facility (Facility). We defined two tiers of counties that could provide the required resources. Tier 1 includes counties that are geographically located within the traditional concept of locally based and for the North Coast Region, these counties include Mendocino, Lake, Sonoma, Marin and Napa. Tier 2 counties represent the next sphere out which many would still consider local production. These counties include Yolo, Solano, Glenn, Colusa and Contra Costa. Figure 3 shows the relationship between these counties and the major niche meat target market, California’s San Francisco Bay area, which was part of the niche meat marketing study summarized in the Northern California Niche Meat Market Demand Study section in this report. Figure 3: Map of Tier 1 and Tier 2 Counties

23
Methodology
We relied on two sources of data for this assessment of the livestock supply and processing needs of livestock producers on the North Coast. Our primary source was a survey that was developed and conducted by University of California Cooperative Extension in 2006. In order to have a larger set of respondents for the North Coast, four of the Cooperative Extension Livestock Advisors conducted facilitated questionnaire completion sessions in 2008 with a slightly modified survey instrument. This source provided excellent data for those livestock producers who are actively interested in local niche meat sales and a regional harvest and processing plant. This group could be classified as the “early adopters.” Our second source, USDA’s 2007 Census of Agriculture, reports livestock sales, which are not ideal production estimates due to how the data are collected and reported. However, these data include producers who did not participate in our survey but who might possibly become involved with a regional niche meat facility once it is built. Before pooling the responses from our 2006 and 2008 surveys, we tested the hypothesis that the two groups are comparable along the following characteristics: herd size by species, animals marketed annually, gross farm income and principal operator age. The hypothesis was tested for two samples: respondents from the Tier 1 counties and those from the Tier 1 and Tier 2 counties combined. In the combined sample, the annually marketed number of finished sheep was significantly different (at the 5% significance level) between the 2006 and 2008 respondents. Since there were no statistically significant differences between the two groups for four of the five animal types, we concluded that it was appropriate to combine the two data sets. Our detailed test results are discussed in Appendix for Potential Livestock Supply Study. Below, we present the results of our analysis regarding livestock supply and service needs in Northern California. We first discuss the respondents’ demographics, followed by the current situation and the ranchers’ interest in a new facility.
Findings
Respondent Demographics
The respondents are profiled below by their age. Because the age distributions of the respondents in the Tier 1 and Tier 2 counties were similar, only data for Tiers 1 and 2 combined are displayed. Most of the respondents (86%) are 45 or older; one-‐third are 65 or older (Table 1). These proportions mirror the pattern among agricultural producers in general in California and the rest of the nation. The aging population is problematic; managing estate taxation and management transition both require significant planning. Furthermore, making significant changes in livestock production and marketing methods can require substantial investment by the rancher, in terms of both finances and personal energy; this could be especially challenging for older ranchers.
Table 1: Age Composition of Respondents Tier 1 & 2 Counties Combined
Age Frequency
Valid Percent
Cumulative Percent
under 25 years 5 2.3 2.3 25 to 34 years 11 5 7.3 35 to 44 years 15 6.8 14.1 45 to 54 years 52 23.6 37.7 55 to 64 years 62 28.2 65.9 65 years or older 75 34.1 100 Total 220 100

24
In our survey, the income variable is measured as gross farm revenue, rather than as net income. As indicated in Appendix Table F, there are statistically significant differences in the distribution of the gross farm revenues from the previous year for the respondents of the 2006 and 2008 surveys. However, the most significant observation about these revenues for both groups of respondents is that 86% of the respondents in the 2006 survey and 98% of the respondents of 2008 survey had gross farms revenues of under $250,000, which qualifies them as a “small farm” as defined by USDA. Small farms are considered to have limited financial resources. It is quite likely that the ranchers who responded to the UCCE survey are “asset rich but cash poor;” that is, the value of their acreage could be substantial but they lack cash1. Thus, it is likely that the ranchers lack the cash for the feed needed to finish out their livestock, and they have limited capital to invest to become part owners in the proposed Facility.
Current Marketing Volumes
We first reviewed data from the newly released USDA 2007 Census of Agriculture. The number of livestock marketed in 2007 in Tier 1 and Tier 2 are reported in Table 2. These data indicate that sales in each tier exceed the Facility’s planned processing capacities for beef and for other species. With the exception of hogs, total sales of all species in Tier 2 were greater than those in Tier 1. Next, we compare the Census sales volumes with those reported by our survey respondents to determine how much of the overall population we capture through our survey, since one of the major purposes of conducting the survey in 2008 was to gather reliable estimates of producer interest in utilizing the Facility.
Table 2: Livestock Sales as Reported in 2007 Census of Agriculture -‐ Tier 1 & 2
Counties Cattle & Calves
Calves <500 lbs
Cattle >500 Lbs
Fed Cattle
Sheep & Lambs
Meat Goats
Hogs & Pigs
Total Livestock
Sold
Tier 1 Mendocino 8,881 3,048 5,833 104 3,174 195 747 12,997 Lake 1,271 308 963 11 463 280 510 2,524 Sonoma 32,328 9,390 22,938 347 13,397 291 979 46,995 Marin 14,866 4,313 10,553 14 4,918 0 0 19,784 Napa 3,878 740 3,138 0 372 0 189 4,439 Subtotal 61,224 17,799 43,425 476 22,324 766 2,425 86,739 Tier 2 Glenn 31,546 11,086 20,460 444 2,008 627 1,150 33,767 Colusa 8,649 2,556 6,093 0 3,841 83 0 12,573 Contra Costa 12,459 1,179 11,280 0 391 0 94 12,944 Yolo 10,221 2,170 8,051 281 4,929 0 992 16,142 Solano 29,765 1,309 28,456 510 22,798 1,409 228 54,200 Subtotal 92,640 18,300 74,340 1,235 33,967 2,119 2,464 131,190
Total 153,864 36,099 117,765 1,711 56,291 2,885 4,889 217,929 Source: 2007 Census of Agriculture -‐ California County Data, USDA National Agricultural Service
1 Alternatively, they could have nonfarm sources of income that provide cash.
25
Table 3: Comparison of Reported Livestock Sales
Region Cattle & Calves
Calves <500 lbs
Cattle >500 Lbs Fed Cattle
Sheep & Lambs
Meat Goats
Hogs & Pigs
Total Livestock Sold
Tier 1 Census 61,224 17,799 43,425 476 22,324 766 2,425 86,739 Survey 8,960 4,618 4,342 861 4,653 520 527 14,660 Survey/ census 15% 26% 10% 181% 21% 68% 22% 17% Tier 2 Census 92,640 18,300 74,340 1,235 33,967 2,119 2,464 131,190 Survey 13,700 5,127 8,108 3,144 7,936 729 145 22,510 Survey/ census 15% 28% 11% 255% 23% 34% 6% 17%
Tier 1 & 2 Census 153,864 36,099 117,765 1,711 56,291 2,885 4,889 217,929 Survey 22,660 9,745 12,450 4,005 12,589 1,249 672 37,170 Survey/ census 15% 27% 11% 234% 22% 43% 14% 17%
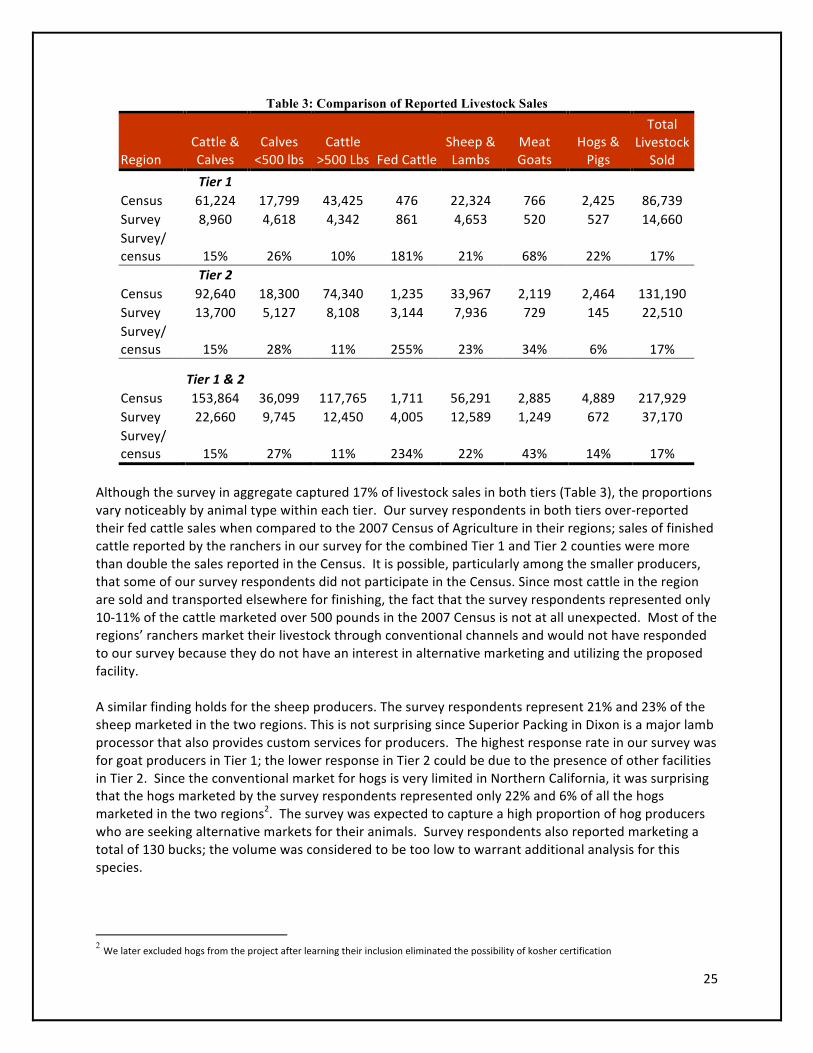
Although the survey in aggregate captured 17% of livestock sales in both tiers (Table 3), the proportions vary noticeably by animal type within each tier. Our survey respondents in both tiers over-‐reported their fed cattle sales when compared to the 2007 Census of Agriculture in their regions; sales of finished cattle reported by the ranchers in our survey for the combined Tier 1 and Tier 2 counties were more than double the sales reported in the Census. It is possible, particularly among the smaller producers, that some of our survey respondents did not participate in the Census. Since most cattle in the region are sold and transported elsewhere for finishing, the fact that the survey respondents represented only 10-‐11% of the cattle marketed over 500 pounds in the 2007 Census is not at all unexpected. Most of the regions’ ranchers market their livestock through conventional channels and would not have responded to our survey because they do not have an interest in alternative marketing and utilizing the proposed facility. A similar finding holds for the sheep producers. The survey respondents represent 21% and 23% of the sheep marketed in the two regions. This is not surprising since Superior Packing in Dixon is a major lamb processor that also provides custom services for producers. The highest response rate in our survey was for goat producers in Tier 1; the lower response in Tier 2 could be due to the presence of other facilities in Tier 2. Since the conventional market for hogs is very limited in Northern California, it was surprising that the hogs marketed by the survey respondents represented only 22% and 6% of all the hogs marketed in the two regions2. The survey was expected to capture a high proportion of hog producers who are seeking alternative markets for their animals. Survey respondents also reported marketing a total of 130 bucks; the volume was considered to be too low to warrant additional analysis for this species.
2 We later excluded hogs from the project after learning their inclusion eliminated the possibility of kosher certification

26
Existing Marketing Channels
As previously noted, most of the livestock produced in the region is sold through traditional marketing channels. Approximately one in seven animals produced in Tier 1 and 2 combined is sold through a nontraditional channel (Table 4). The largest nontraditional channel is branded programs, such as Harris Ranch and Niman Ranch; such programs arrange for the slaughter and processing of their animals. Currently, 7.8% of the beef and 7.2% of the sheep sold by our survey respondents in Tier 1 and 2 combined require the animal to be custom slaughtered and processed.
Table 4: Animal Sales by Marketing Channel Tier 1 & 2 Combined
Species Conventional
Markets Branded Programs
Direct Sales to Individuals
Farmers Markets
Direct Sales to Retail or
Restaurants
Other Nontraditional
Channels Beef 85.7% 6.5% 1.3% 2.9% 1.4% 2.2% Lamb 87.9% 4.9% 4.6% 0.4% 0.1% 2.1%
Use of Existing Facilities
The 98 ranchers engaged in direct sales represent 44% of all of the Tier 1 and Tier 2 respondents in our survey; they were asked about their use of existing slaughter and processing facilities. They rated their satisfaction with the quality of service at existing slaughter and processing facilities, using a 5-‐point rating scale, where 1 represents “not satisfied” and 5 means “very satisfied.” The average satisfaction rating of ranchers in the combined Tier 1 and 2 counties with the quality of service and timeliness of service of existing slaughter and processing facilities was 3.7 and 3.6, respectively (Table 5). One in five ranchers was very dissatisfied with both the quality and timeliness of the service, rating it as either “1” or “2”.
Table 5: Satisfaction with Current Slaughter and Processing Facility Tier 1 and 2 Combined
Average Rating (1-‐5 scale)
Satisfaction with quality of service of existing slaughter and processing facilities
3.7
Satisfaction with timeliness of service of existing slaughter and processing facilities 3.6
The number of animals transported in a single trip to a facility ranged widely, from 1 to 380, and averaged 19 for ranchers in the combined Tier 1 and 2 counties (Table 6). The one-‐way transport distance ranged from 2 to 360 miles and averaged 64 and 61 miles, respectively for the Tier 1 and combined Tier 1 and 2 counties.

27
Table 6: Animals Transported, Mileage and Travel Time to Slaughter and Processing Facility
Tier 1 and 2 Combined N Minimum Maximum Mean
Animals transported to processor per each trip
80 1 380 18.91
Miles (one way) to processor 78 2 360 61.27
One-‐way travel time to transport animals to processor (minutes)
78 5 480 97.31
Although the travel distance of the facility ranged from 2 miles to 360 miles, two-‐thirds of the ranchers in the combined Tier 1 and 2 counties drove 60 miles or less one way. The one-‐way transport time also ranged widely, from 5 minutes to 8 hours; it averaged 97 minutes in the combined Tier 1 and 2 counties (Table 6). However, two-‐thirds of these ranchers drove for one and a half hours or less one way.
Figure 4: Time to Transport -‐ Tiers 1 & 2 Combined
All ranchers responding to the survey (not just those engaged in direct sales of their meat products) were asked to assess the current availability and accessibility of slaughtering and processing facilities in Northern California. The assessments were similar among ranchers in the Tier 1 counties and the combined Tier 1 and 2 counties. The larger group of 204 ranchers in the Tier 1 & 2 counties was noticeably less satisfied with the situation than the subset of ranchers who were actually involved in direct marketing; 61% assessed availability was “very deficient” while 26 percent rated it as “just enough” or “very available” (Table 7). This disparity implies that many of the respondents (particularly the 61% who rate the availability as “very deficient”) would be inclined to utilize a facility that was more accessible.

28
Table 7: Current Availability/Accessibility of Facilities Tiers 1 & 2 Combined
Rating Frequency Valid Percent Cumulative Percent
very deficient 125 61.3 61.3
slightly below 26 12.7 74.0
just enough 37 18.1 92.2
very available 16 7.8 100.0
Total 204 100.0
Marketing Systems
Ranchers were asked to indicate their levels of interest for three potential marketing systems: direct marketing, a branded program, and a part-‐ownership entity. (Two-‐thirds of all ranchers in Tier 1 and Tier 2 counties responded; respondents were limited to those who had stated some interest in small-‐scale processing facilities.) For each of these marketing systems, respondents rated their interest on a scale of 1 to 5, where 1 represented “not at all interested” and 5 meant “very interested.” Ranchers in both study regions express the greatest interest in a branded program, followed by direct marketing, and lastly a part-‐ownership entity. Forty percent of the ranchers in the combined Tier 1 and 2 counties indicated that they were “very interested” in a brand program (Table 8), and 79% rated their interest in branded programs as a “3” or higher.
Table 8: Interest in Alternative Marketing Structures Tiers 1 & 2 Combined Percent Interested
Interest level Direct
Marketing Branded Programs
Part Ownership
not at all interested 22.1 15.4 39.6
2 8.7 5.4 10.4
3 16.8 23.5 18.1
4 12.8 16.1 16.0
very interested 39.6 39.6 16.0
Average rating 3.4 3.6 2.6
Forty percent were very interested in direct marketing (Table 8). Over two-‐thirds (69%) rated their interest in direct marketing as a “3” or higher in the Tier 1 and 2 counties combined. As expected, interest levels for part-‐ownership in a livestock processing entity were lower. Only 16% of the ranchers were “very interested” in this option.
Interest in New Facility
Only ranchers participating in the 2008 survey were asked to indicate their interest in utilizing a hypothetical multi-‐species processing facility in the north coast region of California. They were told that the facility would buy livestock (both feeders and finished animals) from local producers and slaughter, process and market the niche meats in regional markets under its own brand name. It would provide custom slaughter and processing services to producers. Producers would also have the option of

29
becoming part owners. Given the existence of such a facility, ranchers were asked if they would utilize the facility, the maximum time that they would be willing to travel one-‐way to do so, and their level of interest in a broad array of services. Eighty one percent of the ranchers in the combined Tier 1 and 2 counties indicated that they would be interested in selling livestock to the Facility and 75% in using its custom slaughter/processing services for direct marketing. When asked about the maximum amount of time that they would be willing to travel one-‐way in order to use such a facility (Table 9 and Figure 5), 18% of the ranchers in the combined Tier 1 and 2 counties would travel over two hours, 58% would travel over an hour, and 90% over 30 minutes. Among the subset of 78 ranchers in the Tier 1 and 2 counties who are currently having their livestock processed, 26% are traveling over two hours, 47% over an hour and 78% over 30 minutes. It is unlikely that the 22% who are currently traveling 30 minutes or less to a facility would be willing to travel longer to a new facility, unless it offered more services and/or charged less.
Table 9: Maximum One-‐way Travel Time to Processing Facility Tiers 1 & 2 Combined
Frequency Valid Percent
Cumulative Percent
0 to 15 minutes 1 .6 .6
16 to 30 minutes 15 9.1 9.7
31 to 60 minutes 53 32.1 41.8
61 to 90 minutes 48 29.1 70.9
91 to 120 minutes 19 11.5 82.4
121 to 180 minutes 13 7.9 90.3
more than 180 minutes 16 9.7 100.0
Total 165 100.0

30
Figure 5: Maximum One-‐way Travel Time to Processing Facility
Tiers 1 & 2 Combined
Transportation services are highly desired by ranchers (Table 10). The three most desired services are very clear by viewing both the proportion of respondents rating the service as a “5” and the mean rating; they are (in declining order): meat delivery to final destination, animal pick-‐up, and advertising and marketing support. It is not surprising that 40% rating advertising and marketing support as “very important,” since ranchers, like most agricultural producers, lack marketing expertise. The next group of services that ranchers were interested in are: pasture finishing, organic processing and dry aging; one-‐third of the ranchers rated each of these services as “very important.”3 The least desired services were kosher slaughter, grain finishing and halal slaughter. The relatively low interest ratings for the value-‐added products (such as smoking, curing and kosher slaughter) should not be construed as a signal to not offer these services at the Facility. Rather, ranchers are currently prevented from utilizing a custom processing facility because of transportation issues. Thus, most of them are currently not marketing their own meats and do not have a framework for understanding the importance of services to produce value-‐added products.
3 It should be noted, however, that interest in pasture finishing, organic processing and dry aging was bi-‐model; that is, there were relatively
large proportions of ranchers that were either strongly interested or strongly disinterested in these services.

31
Table 10: Interest in Services Offered (5 point rating scale)
Tier 1 and 2 Counties Combined Service
% rating 5 Mean rating
Meat delivery to final destination 49 3.9 Animal pick-‐up 41 3.4 Advertising & marketing support 40 3.6 Pasturing finishing 36 3.1 Dry aging 34 3.2 Organic processing 34 3.2 Label design & approval 29 3.1 Smoking & curing 25 3.0 Sausage production 21 2.9 Feedlot grain finishing 21 2.3 Kosher slaughter 15 2.3 Jerky 14 2.6 Halal slaughter 10 2.1
Potential Animal Supplies
The total volume and timing of animal deliveries are both critically important for efficient facility utilization. Ranchers were asked to indicate the number of animals by species that they expect to deliver monthly to the hypothetical slaughter and processing facility. The annual totals are displayed below. The Facility is designed with annual slaughter capacity for 20,800 cattle (80 head per day, 5 days a week, 52 weeks a year) and 13,000 sheep (50 head per day, 5 days a week, 52 week a year), with future operations to include hogs and goats. As indicated in Table 11, deliveries by ranchers in the Tier 2 counties, as well as the Tier 1 counties, are needed to keep the facility operating at close to full capacity. Deliveries of hogs and goats will fill in the unused sheep processing capacity.
Table 11: Expected Annual Livestock Deliveries to Facility by Animal Type
Cow-‐calf culls (# cows)
Weaned calves Stockers Finished
Sheep culls (# ewes)
Feeder sheep
Finished sheep Goats Hogs
Subtotal, Cattle
Subtotal, Other Species
Tier 1 1,011 4,618 2,470 861 489 1,903 2,261 565 989 8,960 6,207 Tier 1 & 2 combined 1,816 9,745 6,629 4,005 856 4,158 7,575 1,171 990 22,195 14,750
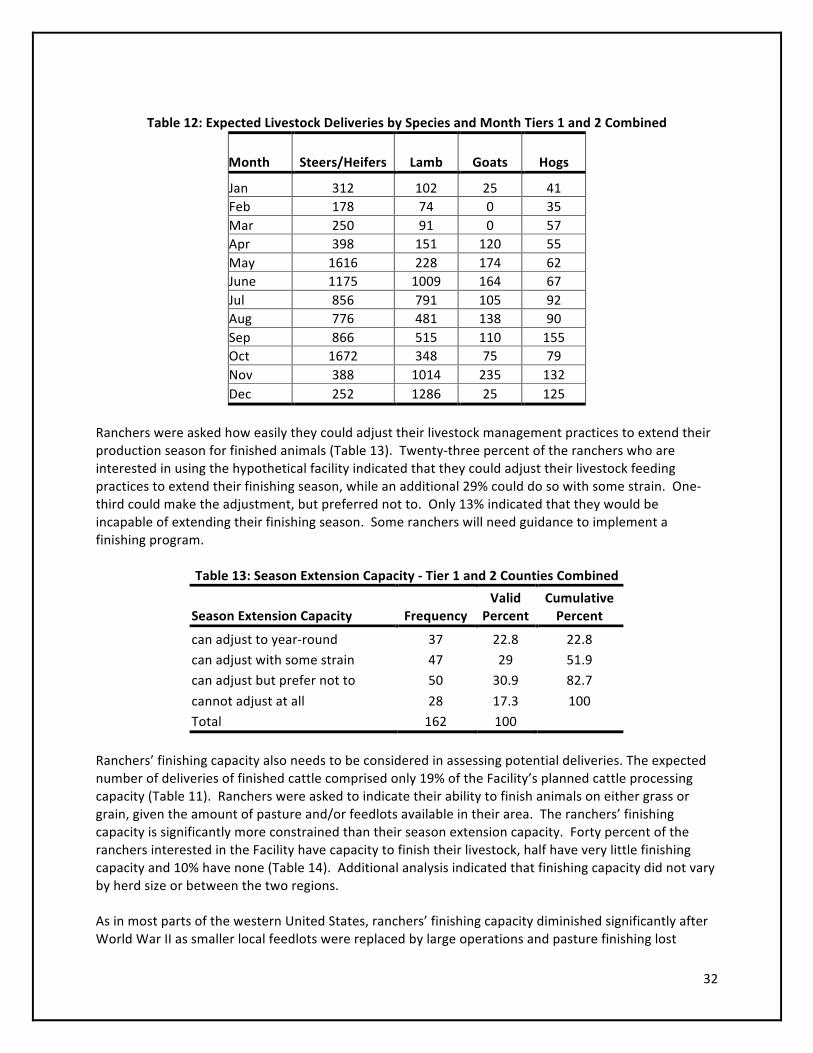
As shown in Table 12, the projected monthly animal delivery totals for ranchers in the combined Tier 1 and Tier 2 counties display strong seasonality. Projected deliveries of cattle could exceed the monthly processing capacity of 1,633 head during October. Also, the combined deliveries of lamb, goats and hogs in June, November and December could be problematic, given the estimated monthly processing capacity of 1,021 head. However, such assessments assume that all of the delivered animals would be ready for slaughter, which is not likely.
32
Table 12: Expected Livestock Deliveries by Species and Month Tiers 1 and 2 Combined
Month Steers/Heifers
Lamb Goats Hogs
Jan 312 102 25 41 Feb 178 74 0 35 Mar 250 91 0 57 Apr 398 151 120 55 May 1616 228 174 62 June 1175 1009 164 67 Jul 856 791 105 92 Aug 776 481 138 90 Sep 866 515 110 155 Oct 1672 348 75 79 Nov 388 1014 235 132 Dec 252 1286 25 125
Ranchers were asked how easily they could adjust their livestock management practices to extend their production season for finished animals (Table 13). Twenty-‐three percent of the ranchers who are interested in using the hypothetical facility indicated that they could adjust their livestock feeding practices to extend their finishing season, while an additional 29% could do so with some strain. One-‐third could make the adjustment, but preferred not to. Only 13% indicated that they would be incapable of extending their finishing season. Some ranchers will need guidance to implement a finishing program.
Table 13: Season Extension Capacity -‐ Tier 1 and 2 Counties Combined
Season Extension Capacity Frequency
Valid Percent
Cumulative Percent
can adjust to year-‐round 37 22.8 22.8 can adjust with some strain 47 29 51.9 can adjust but prefer not to 50 30.9 82.7
cannot adjust at all 28 17.3 100 Total 162 100
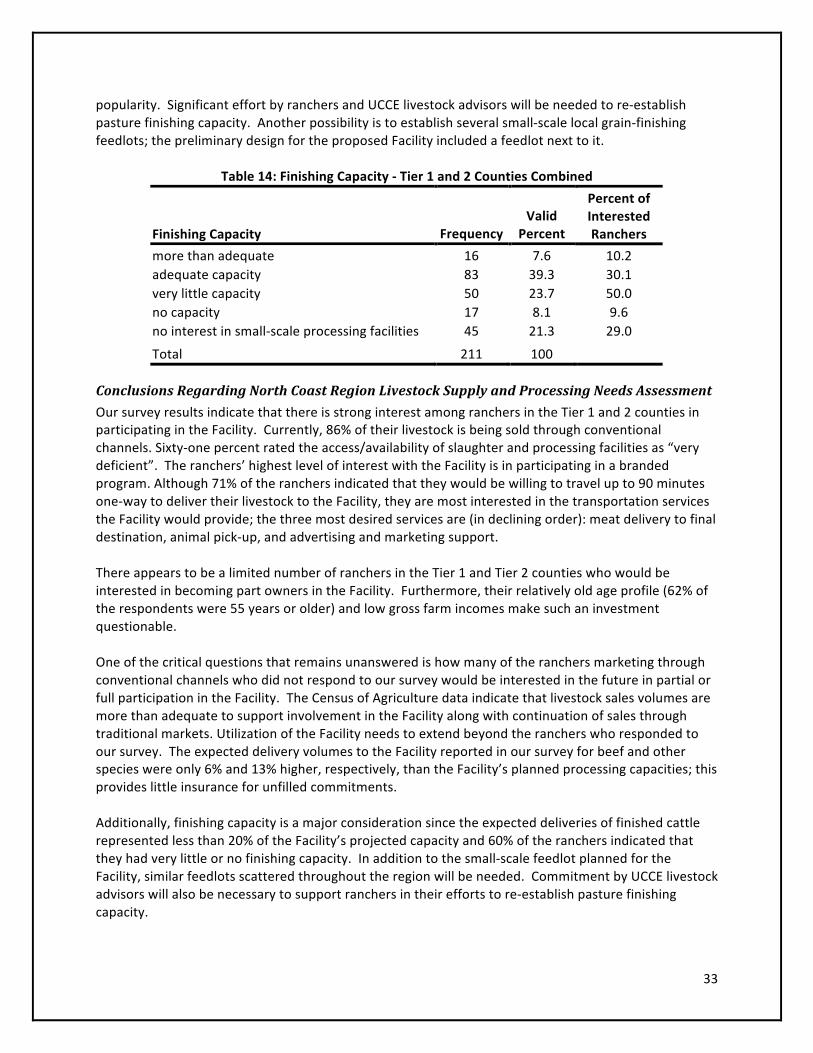
Ranchers’ finishing capacity also needs to be considered in assessing potential deliveries. The expected number of deliveries of finished cattle comprised only 19% of the Facility’s planned cattle processing capacity (Table 11). Ranchers were asked to indicate their ability to finish animals on either grass or grain, given the amount of pasture and/or feedlots available in their area. The ranchers’ finishing capacity is significantly more constrained than their season extension capacity. Forty percent of the ranchers interested in the Facility have capacity to finish their livestock, half have very little finishing capacity and 10% have none (Table 14). Additional analysis indicated that finishing capacity did not vary by herd size or between the two regions. As in most parts of the western United States, ranchers’ finishing capacity diminished significantly after World War II as smaller local feedlots were replaced by large operations and pasture finishing lost
33
popularity. Significant effort by ranchers and UCCE livestock advisors will be needed to re-‐establish pasture finishing capacity. Another possibility is to establish several small-‐scale local grain-‐finishing feedlots; the preliminary design for the proposed Facility included a feedlot next to it.
Table 14: Finishing Capacity -‐ Tier 1 and 2 Counties Combined
Finishing Capacity Frequency
Valid Percent
Percent of Interested Ranchers
more than adequate 16 7.6 10.2 adequate capacity 83 39.3 30.1 very little capacity 50 23.7 50.0 no capacity 17 8.1 9.6 no interest in small-‐scale processing facilities 45 21.3 29.0
Total 211 100
Conclusions Regarding North Coast Region Livestock Supply and Processing Needs Assessment
Our survey results indicate that there is strong interest among ranchers in the Tier 1 and 2 counties in participating in the Facility. Currently, 86% of their livestock is being sold through conventional channels. Sixty-‐one percent rated the access/availability of slaughter and processing facilities as “very deficient”. The ranchers’ highest level of interest with the Facility is in participating in a branded program. Although 71% of the ranchers indicated that they would be willing to travel up to 90 minutes one-‐way to deliver their livestock to the Facility, they are most interested in the transportation services the Facility would provide; the three most desired services are (in declining order): meat delivery to final destination, animal pick-‐up, and advertising and marketing support. There appears to be a limited number of ranchers in the Tier 1 and Tier 2 counties who would be interested in becoming part owners in the Facility. Furthermore, their relatively old age profile (62% of the respondents were 55 years or older) and low gross farm incomes make such an investment questionable. One of the critical questions that remains unanswered is how many of the ranchers marketing through conventional channels who did not respond to our survey would be interested in the future in partial or full participation in the Facility. The Census of Agriculture data indicate that livestock sales volumes are more than adequate to support involvement in the Facility along with continuation of sales through traditional markets. Utilization of the Facility needs to extend beyond the ranchers who responded to our survey. The expected delivery volumes to the Facility reported in our survey for beef and other species were only 6% and 13% higher, respectively, than the Facility’s planned processing capacities; this provides little insurance for unfilled commitments. Additionally, finishing capacity is a major consideration since the expected deliveries of finished cattle represented less than 20% of the Facility’s projected capacity and 60% of the ranchers indicated that they had very little or no finishing capacity. In addition to the small-‐scale feedlot planned for the Facility, similar feedlots scattered throughout the region will be needed. Commitment by UCCE livestock advisors will also be necessary to support ranchers in their efforts to re-‐establish pasture finishing capacity.

34
APPENDIX for Potential Livestock Supply Study
Differences between 2006 and 2008 UCCE Survey Respondents Testing Differences in Responses for the Two Respondent Sets Before pooling responses from the 2006 and 2008 surveys, we tested the hypothesis that the two groups are comparable along the following characteristics: herd size by species, animals marketed annually, gross farm income and principal operator age. The hypothesis was tested for two samples: respondents from the Tier 1 counties and those from the Tier 1 and Tier 2 counties combined. The data tables and test statistics are displayed in this Appendix. Operation Size: For both samples (Tier 1, and Tier 1 and 2 combined) we cannot reject the hypothesis that the two groups represent the same distribution of operation sizes across all species and animal type. Animal Marketed Annually: For both samples, we cannot reject the hypothesis that the number of annually marketed culled cows, weaned calves, feeder calves, finished calves, sheep culls, feeder sheep, goat culls, feeder goats, and finished goats represent the same distribution for the 2006 respondents and the 2008 respondents. In the combined sample, however, the annually marketed number of finished sheep was significantly different (at the 5% significance level) between the 2006 and 2008 respondents. Since there were no statistically significant differences between the two groups for four of the five animal types, we concluded that it was appropriate to combine the two data sets. Operator Age: For both samples we cannot reject the hypothesis that the distribution of operator age is the same between the two groups. Gross Annual Revenue: Respondents in the 2006 survey reported 2005 gross farm revenue, and the respondents in the 2008 survey reported 2007 gross farm revenue. As we expected, we reject the hypothesis that the distribution of gross revenue is the same between the two groups. Cattle-‐Fax data displayed indicate that prices for feeder cattle and calves dropped noticeably between 2004 and 2008 (Appendix Figure A); this had a substantial impact on ranchers’ gross annual incomes. These differences in gross farm revenue did not have a substantive impact on the types of variables we evaluated in the two data sets.
Appendix Figure A: Cattle Prices

35
Appendix Table A: Comparison between 2006 and 2008 Annually Marketed Animals [TIER 1]
(T-‐Test for independent samples) survey N Mean Std. Deviation Std. Error Mean
2006 survey 35 11.09 11.025 1.864 Cow-‐calf culls (# cows marketed annually) 2008 survey 50 12.46 12.316 1.742
2006 survey 37 51.59 44.679 7.345 Weaned calves (# calves marketed annually) 2008 survey 44 61.57 70.274 10.594
2006 survey 17 59.18 86.198 20.906 Stockers (# calves marketed annually) 2008 survey 26 56.31 67.034 13.146
2006 survey 10 42.80 91.988 29.089 Finished (# calves marketed annually) 2008 survey 21 20.62 37.352 8.151
2006 survey 19 12.37 12.549 2.879 Sheep culls (# ewes marketed annually) 2008 survey 23 11.04 11.117 2.318
2006 survey 18 64.72 74.925 17.660 Feeder sheep (# ewes marketed annually) 2008 survey 15 49.20 57.324 14.801
2006 survey 24 56.46 66.938 13.664 Finished sheep (# ewes marketed annually) 2008 survey 25 36.24 59.463 11.893
2006 survey 2 4.00 .000 .000 Goat culls (# does marketed annually) 2008 survey 4 6.75 3.948 1.974
2006 survey 1 50.00 . . Feeder goats (# does marketed annually) 2008 survey 2 45.00 21.213 15.000
2006 survey 3 60.67 78.621 45.392 Finished goats (# does marketed annually) 2008 survey 8 20.38 14.579 5.155

36
Appendix Table A: (continued) Levene's Test for
Equality of Variances t-‐test for Equality of Means
95% Confidence Interval of the Difference
F Sig. t df Sig. (2-‐tailed)
Mean Differen
ce
Std. Error
Difference Lower Upper
Equal variances assumed
1.421 .237 -‐.528 83 .599 -‐1.374 2.602 -‐6.549 3.800 Cow-‐calf culls (# cows marketed annually)
Equal variances not assumed
-‐.539 78.030 .592 -‐1.374 2.551 -‐6.452 3.704
Equal variances assumed
2.686 .105 -‐.745 79 .458 -‐9.974 13.379 -‐
36.604 16.657
Weaned calves (# calves marketed annually) Equal variances not
assumed
-‐.774 73.884 .442 -‐9.974 12.891 -‐
35.661 15.714
Equal variances assumed
.397 .532 .122 41 .903 2.869 23.423 -‐
44.435 50.173
Stockers (# calves marketed annually)
Equal variances not assumed
.116 28.321 .908 2.869 24.696
-‐47.693
53.431
Equal variances assumed
2.627 .116 .964 29 .343 22.181 23.015 -‐
24.890 69.252
Finished (# calves marketed annually)
Equal variances not assumed
.734 10.440 .479 22.181 30.209
-‐44.747
89.109
Equal variances assumed
.762 .388 .363 40 .719 1.325 3.653 -‐6.058 8.708 Sheep culls (# ewes marketed annually)
Equal variances not assumed
.358 36.391 .722 1.325 3.696 -‐6.168 8.818
Equal variances assumed
1.092 .304 .657 31 .516 15.522 23.614 -‐
32.640 63.684
Feeder sheep (# ewes marketed annually)
Equal variances not assumed
.674 30.811 .506 15.522 23.042
-‐31.484
62.529

37
Appendix Table A: (continued) t-‐test for Equality of Means Levene's Test for
Equality of Variances t-‐test for Equality of Means 95% Confidence
Interval of the Difference
F Sig. t df Sig. (2-‐tailed)
Mean Differen
ce
Std. Error
Difference Lower Upper
Equal variances assumed
1.765 .190 1.119 47 .269 20.218 18.070 -‐
16.134 56.570
Finished sheep (# ewes marketed annually)
Equal variances not assumed
1.116 45.838 .270 20.218 18.114
-‐16.247
56.684
Equal variances assumed
12.519 .024 -‐.929 4 .406 -‐2.750 2.961 -‐
10.970 5.470
Goat culls (# does marketed annually)
Equal variances not assumed
-‐1.393 3.000 .258 -‐2.750 1.974 -‐9.031 3.531
Equal variances assumed . . .192 1 .879 5.000 25.981
-‐325.11
7 335.117
Feeder goats (# does marketed annually)
Equal variances not assumed
. . . 5.000 . . .
Equal variances assumed
19.872 .002 1.517 9 .164 40.292 26.558 -‐
19.788 100.371
Finished goats (# does marketed annually)
Equal variances not assumed
.882 2.052 .469 40.292 45.684
-‐151.58
9 232.172

38
Appendix Table B: Comparison between 2006 and 2008 Operation Size Category: Cow-‐Calf [TIER 1]
Cow-‐calf (# cows)
2006 survey 2008 survey Total
Count 21 26 47 less than 50
% within survey 42.9% 45.6% 44.3%
Count 10 10 20 50 to 99
% within survey 20.4% 17.5% 18.9%
Count 13 12 25 100 to 199
% within survey 26.5% 21.1% 23.6%
Count 4 9 13 200 to 499
% within survey 8.2% 15.8% 12.3%
Count 1 0 1 500 or more
% within survey 2.0% .0% .9%
Count 49 57 106 Total
% within survey 100.0% 100.0% 100.0%
Chi-‐Square Tests
Value df
Asymp. Sig. (2-‐sided)
Pearson Chi-‐Square 2.908a 4 .573
Likelihood Ratio 3.328 4 .504
Linear-‐by-‐Linear Association .002 1 .967
N of Valid Cases 106
a. 2 cells (20.0%) have expected count less than 5. The minimum expected count is 0.46.

39
Appendix Table C: Comparison between 2006 and 2008 Operation Size Category: Weaned Calves [TIER 1]
Weaned Calves (# calves)
2006 survey 2008 survey Total
Count 20 36 56 less than 50
% within survey 57.1% 62.1% 60.2%
Count 6 10 16 50 to 99
% within survey 17.1% 17.2% 17.2%
Count 7 8 15 100 to 199
% within survey 20.0% 13.8% 16.1%
Count 2 3 5 200 to 499
% within survey 5.7% 5.2% 5.4%
Count 0 1 1 500 or more
% within survey .0% 1.7% 1.1%
Count 35 58 93 Total
% within survey 100.0% 100.0% 100.0%
Chi-‐Square Tests
Value df
Asymp. Sig. (2-‐sided)
Pearson Chi-‐Square 1.225a 4 .874
Likelihood Ratio 1.553 4 .817
Linear-‐by-‐Linear Association .109 1 .741
N of Valid Cases 93
a. 4 cells (40.0%) have expected count less than 5. The minimum expected count is 0.38.
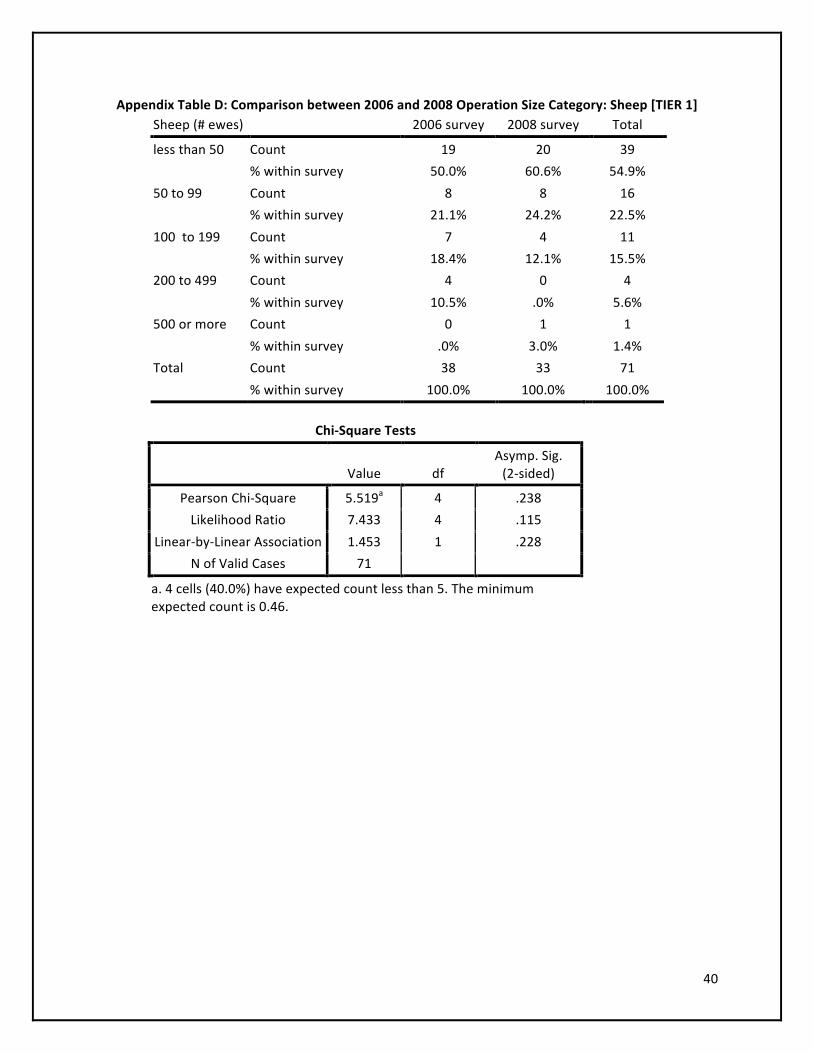
40
Appendix Table D: Comparison between 2006 and 2008 Operation Size Category: Sheep [TIER 1] Sheep (# ewes) 2006 survey 2008 survey Total
Count 19 20 39 less than 50
% within survey 50.0% 60.6% 54.9%
Count 8 8 16 50 to 99
% within survey 21.1% 24.2% 22.5%
Count 7 4 11 100 to 199
% within survey 18.4% 12.1% 15.5%
Count 4 0 4 200 to 499
% within survey 10.5% .0% 5.6%
Count 0 1 1 500 or more
% within survey .0% 3.0% 1.4%
Count 38 33 71 Total
% within survey 100.0% 100.0% 100.0%
Chi-‐Square Tests
Value df
Asymp. Sig. (2-‐sided)
Pearson Chi-‐Square 5.519a 4 .238
Likelihood Ratio 7.433 4 .115
Linear-‐by-‐Linear Association 1.453 1 .228
N of Valid Cases 71
a. 4 cells (40.0%) have expected count less than 5. The minimum expected count is 0.46.

41
Appendix Table E: Comparison between 2006 and 2008 Operation Size Category: Goats [TIER 1]
Goats (# does) 2006 survey 2008 survey Total
Count 4 5 9 less than 50
% within survey 80.0% 55.6% 64.3%
Count 0 4 4 50 to 99
% within survey .0% 44.4% 28.6%
Count 1 0 1 100 to 199
% within survey 20.0% .0% 7.1%
Count 5 9 14 Total
% within survey 100.0% 100.0% 100.0%
Chi-‐Square Tests
Value df
Asymp. Sig. (2-‐sided)
Pearson Chi-‐Square 4.321a 2 .115
Likelihood Ratio 5.884 2 .053
Linear-‐by-‐Linear Association .015 1 .902
N of Valid Cases 14
a. 5 cells (83.3%) have expected count less than 5. The minimum expected count is 0.36.

42
Appendix Table F: Comparison between 2006 and 2008 Gross Revenue [TIER 1] (Chi-‐squared test)
2006 survey 2008 survey Total
Count 33 30 63 less than $9,999
% within survey 40.7% 36.6% 38.7%
Count 17 29 46 $10,000 to $49,999
% within survey 21.0% 35.4% 28.2%
Count 13 10 23 $50,000 to $99,999
% within survey 16.0% 12.2% 14.1%
Count 7 11 18 $100,000 to $249,999
% within survey 8.6% 13.4% 11.0%
Count 2 2 4 $250,000 to $499,999
% within survey 2.5% 2.4% 2.5%
Count 4 0 4 $500,000 to $999,999
% within survey 4.9% .0% 2.5%
Count 5 0 5 $1,000,000 or more
% within survey 6.2% .0% 3.1%
Count 81 82 163
Annual gross revenue
Total
% within survey 100.0% 100.0% 100.0%
Chi-‐Square Tests
Value df
Asymp. Sig. (2-‐sided)
Pearson Chi-‐Square 13.548a 6 .035
Likelihood Ratio 17.069 6 .009
Linear-‐by-‐Linear Association 2.993 1 .084
N of Valid Cases 163
a. 6 cells (42.9%) have expected count less than 5. The minimum expected count is 1.99.

43
Appendix Figure B: Gross Revenue Distribution

44
Appendix Table G: Comparison between 2006 and 2008 Principal Operator Age [TIER 1]
Age of principal operator
2006 survey 2008 survey Total
Count 0 2 2 under 25 years
% within survey .0% 2.4% 1.2%
Count 4 6 10 25 to 34 years
% within survey 4.8% 7.3% 6.1%
Count 6 4 10 35 to 44 years
% within survey 7.2% 4.9% 6.1%
Count 23 17 40 45 to 54 years
% within survey 27.7% 20.7% 24.2%
Count 25 23 48 55 to 64 years
% within survey 30.1% 28.0% 29.1%
Count 25 30 55 65 years or older
% within survey 30.1% 36.6% 33.3%
Count 83 82 165 Total
% within survey 100.0% 100.0% 100.0%
Chi-‐Square Tests
Value df
Asymp. Sig. (2-‐sided)
Pearson Chi-‐Square 4.232a 5 .517
Likelihood Ratio 5.014 5 .414
Linear-‐by-‐Linear Association .002 1 .962
N of Valid Cases 165
a. 4 cells (33.3%) have expected count less than 5. The minimum expected count is 0.99.

45
Appendix Table H: Comparison between 2006 and 2008 Annually Marketed Animals [TIER 1 & 2 COUNTIES COMBINED] (T-‐Test for independent samples)
survey N Mean Std. Deviation Std. Error Mean
2006 survey 59 18.61 33.331 4.339 Cow-‐calf culls (# cows marketed annually) 2008 survey 53 13.55 13.368 1.836
2006 survey 61 106.16 246.976 31.622 Weaned calves (# calves marketed annually) 2008 survey 46 71.07 94.332 13.908
2006 survey 31 163.39 420.498 75.524 Stockers (# calves marketed annually) 2008 survey 27 57.93 66.268 12.753
2006 survey 26 112.77 392.014 76.880 Finished (# calves marketed annually) 2008 survey 24 44.71 104.353 21.301
2006 survey 27 21.37 33.377 6.423 Sheep culls (# ewes marketed annually) 2008 survey 25 11.16 10.676 2.135
2006 survey 24 134.17 257.061 52.472 Feeder sheep (# ewes marketed annually) 2008 survey 16 58.62 66.994 16.749
2006 survey 35 186.83 374.430 63.290 Finished sheep (# ewes marketed annually) 2008 survey 27 38.37 58.455 11.250
2006 survey 7 5.86 2.911 1.100 Goat culls (# does marketed annually) 2008 survey 4 6.75 3.948 1.974
2006 survey 2 27.00 32.527 23.000 Feeder goats (# does marketed annually) 2008 survey 2 45.00 21.213 15.000
2006 survey 10 87.40 153.355 48.495 Finished goats (# does marketed annually) 2008 survey 8 20.38 14.579 5.155

46
Appendix Table H: (continued) Levene's Test for Equality of Variances t-‐test for Equality of Means
95% Confidence Interval of the Difference
F Sig. t df Sig. (2-‐tailed)
Mean Difference
Std. Error Difference
Lower Upper
Equal variances assumed 3.432 .067 1.033 110 .304 5.063 4.900 -‐4.647 14.773 Cow-‐calf culls (# cows marketed annually)
Equal variances not assumed 1.075 77.848 .286 5.063 4.712 -‐4.318 14.444
Equal variances assumed 2.623 .108 .914 105 .363 35.099 38.400 -‐41.041 111.239 Weaned calves (# calves marketed annually) Equal variances not assumed 1.016 81.398 .313 35.099 34.546 -‐33.631 103.829
Equal variances assumed 5.360 .024 1.288 56 .203 105.461 81.885 -‐58.575 269.497 Stockers (# calves marketed annually) Equal variances not assumed 1.377 31.706 .178 105.461 76.593 -‐50.610 261.533
Equal variances assumed 2.392 .129 .823 48 .414 68.061 82.653 -‐98.124 234.246 Finished (# calves marketed annually) Equal variances not assumed .853 28.801 .401 68.061 79.777 -‐95.150 231.271
Equal variances assumed 5.638 .021 1.461 50 .150 10.210 6.989 -‐3.827 24.247 Sheep culls (# ewes marketed annually) Equal variances not assumed 1.508 31.645 .141 10.210 6.769 -‐3.584 24.004
Equal variances assumed 3.677 .063 1.145 38 .259 75.542 65.960 -‐57.988 209.072 Feeder sheep (# ewes marketed annually) Equal variances not assumed 1.371 27.488 .181 75.542 55.080 -‐37.380 188.464
Equal variances assumed 13.145 .001 2.037 60 .046 148.458 72.866 2.705 294.212 Finished sheep (# ewes marketed annually) Equal variances not assumed 2.309 36.135 .027 148.458 64.282 18.105 278.812
Equal variances assumed 1.107 .320 -‐.433 9 .676 -‐.893 2.064 -‐5.562 3.777 Goat culls (# does marketed annually) Equal variances not assumed -‐.395 4.917 .709 -‐.893 2.260 -‐6.731 4.946
Equal variances assumed . . -‐.656 2 .579 -‐18.000 27.459 -‐136.147 100.147 Feeder goats (# does marketed annually) Equal variances not assumed -‐.656 1.720 .589 -‐18.000 27.459 -‐156.602 120.602
Equal variances assumed 4.681 .046 1.224 16 .239 67.025 54.748 -‐49.037 183.087 Finished goats (# does marketed annually) Equal variances not assumed 1.374 9.203 .202 67.025 48.768 -‐42.927 176.977

47
Appendix Table I: Comparison between 2006 and 2008 Operation Size Category: Cow-‐Calf [TIER 1 & 2 COUNTIES COMBINED]
2006 survey 2008 survey Total
Count 37 27 64 less than 50
% within survey 43.5% 45.0% 44.1%
Count 15 10 25 50 to 99
% within survey 17.6% 16.7% 17.2%
Count 19 13 32 100 to 199
% within survey 22.4% 21.7% 22.1%
Count 8 9 17 200 to 499
% within survey 9.4% 15.0% 11.7%
Count 6 1 7 500 or more
% within survey 7.1% 1.7% 4.8%
Count 85 60 145
Cow-‐calf (# cows)
Total
% within survey 100.0% 100.0% 100.0%
Chi-‐Square Tests
Value df
Asymp. Sig. (2-‐sided)
Pearson Chi-‐Square 3.100a 4 .541
Likelihood Ratio 3.397 4 .494
Linear-‐by-‐Linear Association .116 1 .733
N of Valid Cases 145
a. 2 cells (20.0%) have expected count less than 5. The minimum expected count is 2.90.

48
Appendix Table J: Comparison between 2006 and 2008 Operation Size Category: Weaned Calves [TIER 1 & 2 COUNTIES COMBINED]
survey
2006 survey 2008 survey Total
Count 36 36 72 less than 50
% within survey 55.4% 59.0% 57.1%
Count 8 11 19 50 to 99
% within survey 12.3% 18.0% 15.1%
Count 12 8 20 100 to 199
% within survey 18.5% 13.1% 15.9%
Count 4 3 7 200 to 499
% within survey 6.2% 4.9% 5.6%
Count 5 3 8 500 or more
% within survey 7.7% 4.9% 6.3%
Count 65 61 126
Weaned Calves (# calves)
Total
% within survey 100.0% 100.0% 100.0%
Chi-‐Square Tests
Value df
Asymp. Sig. (2-‐sided)
Pearson Chi-‐Square 1.791a 4 .774
Likelihood Ratio 1.803 4 .772
Linear-‐by-‐Linear Association .808 1 .369
N of Valid Cases 126
a. 4 cells (40.0%) have expected count less than 5. The minimum expected count is 3.39.

49
Appendix Table K: Comparison between 2006 and 2008 Operation Size Category: Sheep [TIER 1 & 2 COUNTIES COMBINED]
survey
2006 survey 2008 survey Total
Count 23 21 44 less than 50
% within survey 45.1% 60.0% 51.2%
Count 10 8 18 50 to 99
% within survey 19.6% 22.9% 20.9%
Count 7 4 11 100 to 199
% within survey 13.7% 11.4% 12.8%
Count 5 1 6 200 to 499
% within survey 9.8% 2.9% 7.0%
Count 6 1 7 500 or more
% within survey 11.8% 2.9% 8.1%
Count 51 35 86
Sheep (# ewes)
Total
% within survey 100.0% 100.0% 100.0%
Chi-‐Square Tests
Value df
Asymp. Sig. (2-‐sided)
Pearson Chi-‐Square 4.550a 4 .337
Likelihood Ratio 5.022 4 .285
Linear-‐by-‐Linear Association 4.153 1 .042
N of Valid Cases 86
a. 5 cells (50.0%) have expected count less than 5. The minimum expected count is 2.44.

50
Appendix Table L: Comparison between 2006 and 2008 Operation Size Category: Goats [TIER 1 & 2 COUNTIES COMBINED]
survey
2006 survey 2008 survey Total
Count 10 6 16 less than 50
% within survey 66.7% 60.0% 64.0%
Count 1 4 5 50 to 99
% within survey 6.7% 40.0% 20.0%
Count 2 0 2 100 to 199
% within survey 13.3% .0% 8.0%
Count 2 0 2 200 to 499
% within survey 13.3% .0% 8.0%
Count 15 10 25
Goats (# does)
Total
% within survey 100.0% 100.0% 100.0%
Chi-‐Square Tests
Value df
Asymp. Sig. (2-‐sided)
Pearson Chi-‐Square 6.042a 3 .110
Likelihood Ratio 7.477 3 .058
Linear-‐by-‐Linear Association .727 1 .394
N of Valid Cases 25
a. 6 cells (75.0%) have expected count less than 5. The minimum expected count is 0.80.

51
Appendix Table M: Comparison between 2006 and 2008 Age of Principal Operator [TIER 1 & 2 COUNTIES COMBINED]
Age of principal operator
2006 survey 2008 survey Total
Count 3 2 5 under 25 years
% within survey 2.3% 2.3% 2.3%
Count 5 6 11 25 to 34 years
% within survey 3.8% 6.9% 5.0%
Count 11 4 15 35 to 44 years
% within survey 8.3% 4.6% 6.8%
Count 34 18 52 45 to 54 years
% within survey 25.6% 20.7% 23.6%
Count 37 25 62 55 to 64 years
% within survey 27.8% 28.7% 28.2%
Count 43 32 75 65 years or older
% within survey 32.3% 36.8% 34.1%
Count 133 87 220 Total
% within survey 100.0% 100.0% 100.0%
Chi-‐Square Tests
Value df
Asymp. Sig. (2-‐sided)
Pearson Chi-‐Square 2.926a 5 .711
Likelihood Ratio 2.960 5 .706
Linear-‐by-‐Linear Association .165 1 .684
N of Valid Cases 220
a. 3 cells (25.0%) have expected count less than 5. The minimum expected count is 1.98.

52
Appendix Table N: Comparison between 2006 and 2008 Annual Gross Revenue [TIER 1 & 2 COUNTIES COMBINED]
survey
Annual Gross Revenue
2006 survey 2008 survey Total
Count 45 31 76 less than $9,999
% within survey 35.2% 35.6% 35.3%
Count 33 30 63 $10,000 to $49,999
% within survey 25.8% 34.5% 29.3%
Count 17 10 27 $50,000 to $99,999
% within survey 13.3% 11.5% 12.6%
Count 9 12 21 $100,000 to $249,999 % within survey 7.0% 13.8% 9.8%
Count 8 3 11 $250,000 to $499,999 % within survey 6.2% 3.4% 5.1%
Count 4 1 5 $500,000 to $999,999 % within survey 3.1% 1.1% 2.3%
Count 12 0 12 $1,000,000 or more
% within survey 9.4% .0% 5.6%
Count 128 87 215 Total
% within survey 100.0% 100.0% 100.0%
Chi-‐Square Tests
Value df
Asymp. Sig. (2-‐sided)
Pearson Chi-‐Square 13.718a 6 .033
Likelihood Ratio 18.057 6 .006
Linear-‐by-‐Linear Association 4.869 1 .027
N of Valid Cases 215
a. 4 cells (28.6%) have expected count less than 5. The minimum expected count is 2.02.

53
Appendix Figure C Gross Farm Revenues

54
Example Guided Survey
If you filled out a survey similar to this one a year ago, please check here: Optional Information: Name: _______________________________ Address: _______________________________ _______________________________ Phone: _______________________________ Email: _______________________________ If you’d like a copy of the final Feasibility Report, please check here: 1. In which county is your primary livestock operation? ____________________________________________ 2. For each type of livestock, circle the size category that best reflects the size of operation you have maintained over the past three years. (Note: Finished animals are animals ready for slaughter.)
Cow-‐calf Weaned Calves Sheep Goats
Other: ___________
Other: ___________
# cows # calves # ewes # does # #
0 0 0 0 0 0
Less than 50 Less than 50 Less than 50 Less than 50 Less than 50 Less than 50
50-‐99 50-‐99 50-‐99 50-‐99 50-‐99 50-‐99
100-‐199 100-‐199 100-‐199 100-‐199 100-‐199 100-‐199
200-‐499 200-‐499 200-‐499 200-‐499 200-‐499 200-‐499
500 or more 500 or more 500 or more 500 or more 500 or more 500 or more
2. (a) For each category above, record the number of animals you market annually in the gray boxes below.
Culls
Weane
d Ca
lves
Stockers
Finished
Culls
Feed
ers
Finished
Culls
Feed
ers
Finished
Culls
Other:
____
___
Culls
Other:
____
___
3. In the table below, indicate in the appropriate gray box how many animals you currently sell annually through the following markets.
Number of Animals Sold
Market Beef steers & heifers
Lambs
Goats
Other: _______
Branded programs (i.e. Harris Ranch, Niman Ranch, Western Grasslands Beef)
Direct sales to individuals for meat
Direct sales to farmers markets
Direct sales to retail or restaurants
Other (specify):

55
If you reported direct sales in question 3, answer questions 4-‐8. If you don’t do direct sales, skip to question 9.
Questions 4-‐8 refer to your experience with existing slaughter and processing facilities.
4. Rate your satisfaction with respect to quality of service: ______ (1 to 5: 1=not satisfied, 5=very satisfied) 5. Rate your satisfaction with timeliness of service: ______ (1 to 5: 1=not satisfied, 5=very satisfied) 6. How many animals are you transporting to the processor on each trip? ______ 7. How many miles (one-‐way) do you transport your animals to the processor? ______miles 8. How long (one-‐way) does it take to transport your animals to the processor? ______hours ______minutes 9. How would you describe the current availability and accessibility of livestock slaughtering and processing facilities in Northern California? Check one:
Very deficient for current demand Just enough to meet current demand Slightly below current demand Very available and accessible 10. What barriers limit producers’ participation in alternative niche meat markets, either for sales to branded programs or for direct sales by producers? (Rate each option on a scale of 1 to 5 by filling in the box for the appropriate number next to each option: 1=not a barrier, 5=very significant barrier) To be answered by everyone.
1 2 3 4 5 Lack of land/feed to hold and finish livestock 1 2 3 4 5 Sales negotiations & payment collections 1 2 3 4 5 Access to slaughter services 1 2 3 4 5 Knowledge of customers' preferences/consumer trends
1 2 3 4 5 Access to processing (butchering) services 1 2 3 4 5 Customer education about product 1 2 3 4 5 Transportation to processing facilities 1 2 3 4 5 Matching customer demand with product availability
1 2 3 4 5 Finding customers 1 2 3 4 5 Lack of cash flow while feeding livestock out
1 2 3 4 5 Access to marketing and distribution channels
1 2 3 4 5 Time away from ranching activities
1 2 3 4 5 Capital needed to get started 1 2 3 4 5 Insurance requirements 1 2 3 4 5 Knowledge about doing direct sales 1 2 3 4 5 Other: (specify)____________________________ 1 2 3 4 5 Organic certification process and costs 1 2 3 4 5 Other: (specify)____________________________ 1 2 3 4 5 USDA regulation/label requirements
11. Rate your interest in participating in each of the following marketing systems. (1 to 5: 1=not at all interested, 5=very interested) To be answered by everyone.
Direct marketing in which you, or your business, make all marketing arrangements.
Branded program in which you sell livestock into an existing system with its own protocol and label.
Part-‐ownership entity in which you share ownership of a business through which you market your livestock for a fixed price and you share the profits, but do no direct marketing.
Other: (specify)____________________________________________________________________________

56
12. A new multi-‐species processing facility, North Coast Meats, is proposed to be built in the north coast region of California. North Coast Meats proposes to buy livestock (both feeders and finished animals) from local producers and will slaughter, process and market the niche meats in regional markets under its own brand name. It will also provide custom slaughter and processing services to producers. Producers would have the option to become part-‐owners in North Coast Meats. ___ Check here if you are NOT interested in either of these options:
1) Selling any of your livestock to a niche meats facility; OR 2) Having your livestock processed by a niche meat processing facility for your own direct
marketing program. SKIP TO QUESTION 22. 13. Which of North Coast Meats’ services would you potentially consider utilizing for some or all of your livestock? (Check all that apply) ___ Sell livestock to North Coast Meats ___ Use North Coast Meats’ custom slaughter and/or processing services to direct market the meat yourself. ___ Not interested in working with North Coast Meats 14. If you are interested in using North Coast Meats or another small scale processing facility to direct market your own meat products, which types of direct markets would you target? Check here if you’re not interested in direct marketing. (Rate on scale of 1 to 5: 1= low priority, 5= high priority)
Private individuals Restaurants Farmers markets Other: (specify)______________________________ Specialty grocery stores Other: (specify)______________________________ 15. If you are interested in using North Coast Meats or another small scale processing facility to direct market your own meat products, which geographic regions would you target to market your products? Check here if you’re not interested in direct marketing. (Rate on scale of 1 to 5: 1= low priority, 5= high priority)
Local county Southern California Adjacent counties Internet sales (nationwide) Sacramento region Other: (specify)______________________________ Bay Area Other: (specify)______________________________

57
16. What is the maximum time you are willing to travel (one-‐way) to sell your livestock to a niche meats marketing facility or to deliver it for processing for your own direct marketing program? Check one:
0-‐15 min. 91-‐120 min. 16-‐30 min. 121-‐180 min. 31-‐60 min. More than 180 min. 61-‐90 min. 17. What types of additional services from a livestock processor would you find most important that would encourage you to use the facility? (Rate each option on a scale of 1 to 5 by filling in the box for the appropriate number next to each option: 1= not important, 5=very important)
1 2 3 4 5 Animal pick up 1 2 3 4 5 Advertising & Marketing Support 1 2 3 4 5 Delivery of meat products to final destination 1 2 3 4 5 Organic processing 1 2 3 4 5 Sausage production 1 2 3 4 5 Kosher slaughter 1 2 3 4 5 Smoking and curing 1 2 3 4 5 Halal slaughter 1 2 3 4 5 Dry aging 1 2 3 4 5 Feedlot grain finishing 1 2 3 4 5 Jerky 1 2 3 4 5 Pasture finishing 1 2 3 4 5 Label design and approval 1 2 3 4 5 Other: (specify)______________________ 18. If a slaughter and processing facility were readily available and accessible, how much would you use this facility? Provide your answer by writing in each gray box how many animals of each species you would like to have processed each month of the year.
Class of animal # in Jan
# in Feb
# in Mar
# in Apr
# in May
# in Jun
# in Jul
# in Aug
# in Sep
# in Oct
# in Nov
# in Dec
Steer/heifer
Lamb
Goat
Hog
Other:
19. How easily can you adjust your livestock management practices to extend your production season of finished animals? Check one:
Can adjust to year-‐round Can adjust but prefer not to Can adjust with some strain Cannot adjust at all
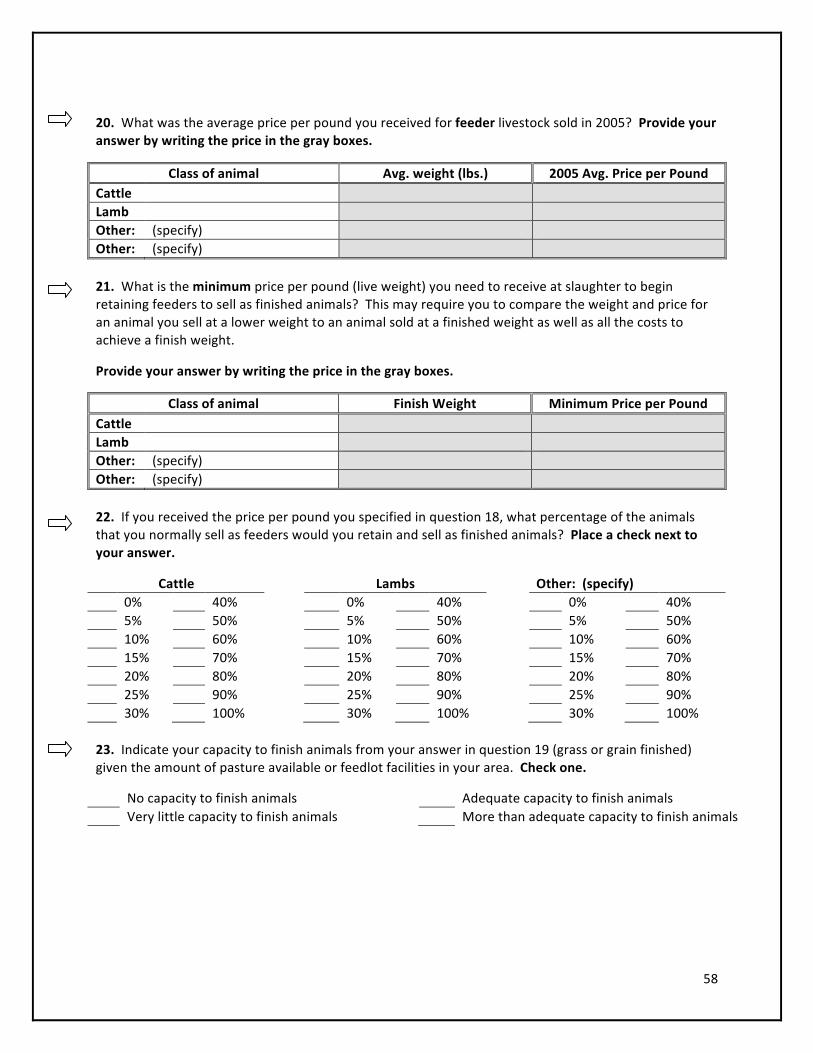
58
20. What was the average price per pound you received for feeder livestock sold in 2005? Provide your answer by writing the price in the gray boxes.
Class of animal Avg. weight (lbs.) 2005 Avg. Price per Pound Cattle Lamb Other: (specify) Other: (specify) 21. What is the minimum price per pound (live weight) you need to receive at slaughter to begin retaining feeders to sell as finished animals? This may require you to compare the weight and price for an animal you sell at a lower weight to an animal sold at a finished weight as well as all the costs to achieve a finish weight.
Provide your answer by writing the price in the gray boxes.
Class of animal Finish Weight Minimum Price per Pound Cattle Lamb Other: (specify) Other: (specify) 22. If you received the price per pound you specified in question 18, what percentage of the animals that you normally sell as feeders would you retain and sell as finished animals? Place a check next to your answer.
Cattle Lambs Other: (specify) 0% 40% 0% 40% 0% 40% 5% 50% 5% 50% 5% 50% 10% 60% 10% 60% 10% 60% 15% 70% 15% 70% 15% 70% 20% 80% 20% 80% 20% 80% 25% 90% 25% 90% 25% 90% 30% 100% 30% 100% 30% 100% 23. Indicate your capacity to finish animals from your answer in question 19 (grass or grain finished) given the amount of pasture available or feedlot facilities in your area. Check one.
No capacity to finish animals Adequate capacity to finish animals Very little capacity to finish animals More than adequate capacity to finish animals
59
24. What was the total market value of all agricultural products sold by your operation in 2005? Check one:
Less than $9,999 $250,000-‐$499,999 $10,000-‐$$49,999 $500,000-‐$999,999 $50,000-‐$99,999 $1,000,000 or more $100,000-‐$249,999 25. How old is the principal operator of your ranch? Check one:
Under 25 years 45-‐54 years 25-‐34 years 55-‐64 years 35-‐44 years 65 or older General comments regarding slaughter and processing facilities: (use additional sheets if necessary) ____________________________________________________________________________________________________________________________________________________________________ __________________________________________________________________________________ If needed, may we contact you about your responses? If yes, provide telephone # _____________________ THANK YOU!

60
Northern California Niche Meat Market Demand Study Authors: Lauren Gwin and Shermain Hardesty
Executive Summary This section is part of a feasibility study for a mid-‐scale, USDA-‐inspected multi-‐species slaughter and processing facility to be built on the northern coast of California. We assessed market prospects for “niche” red meats – such as certified organic, grass-‐fed, naturally-‐raised, local, kosher, and halal – in the San Francisco/Sacramento region. We conducted 42 interviews with individuals responsible for meat purchasing in three key sectors of the food distribution system: restaurants and institutional food service providers (IFSP); retail grocers, primarily regional chains but also one-‐store operations and national chains; and distributors. We also examined the recent literature – articles in academic, trade and mass media publications – regarding the U.S. niche meat market. Below is a summary of our findings.
• Demand for niche meats is growing rapidly in the U.S. In 2006, sales of natural and organic beef in grocery stores increased over the previous year by 28.4% in dollar value and 24.5% percent in pound value. Three-‐fourths of our respondents expected the volume of niche meats they handle to increase over the next year and also over the next three years.
• Consumer demand for niche meats is often motivated by the belief that natural and organic meats are fresher, have better nutritional value, taste, and long-‐term health benefits than conventional meats, and that the animals are healthier and better treated than conventional livestock.
• The most popular red meats are beef, pork, and lamb. The most popular niche categories are
naturally-‐raised (no hormones or antibiotics administered during the animal’s lifetime, often referred to as “never/ever”), grass-‐fed, and local.
• Price premiums for niche meats (over conventional) depend on the cut, niche attribute, brand,
and shifts in conventional pricing. Premiums of 10-‐30% were common, though certified organic meats were typically much higher.
• Across all three market sectors, fresh meats are preferred over frozen. Purchases of whole
carcasses are usually limited to hogs and lambs; beef carcasses were typically considered too large to handle in-‐house. Restaurants, IFSP, and distributors are far more willing to work with seasonally available meats than are retailers.
• More than half (59%) of the restaurant/IFSP respondents said that high-‐end cuts were the most
popular, while the rest use more burger and lower end cuts, e.g. for braised dishes. Nearly half of the retailers sell mostly middle meats. Most distributors found a market for everything and could grind any extra end meat.
• Respondents were asked to rate the importance of various attributes, on a scale ranging from 1
to 5, with 1 for “not important at all” and 5 for “very important.” Taste had the highest average rating (4.9), followed by “no hormones/antibiotics” (4.0), “consistent cut size/shape” (4.0),

61
“health benefits” (3.9), and “humanely raised” (3.7). Despite the fact that they are frequently mentioned, the least important attributes were grass-‐fed (2.7) and certified organic (2.6). Grass-‐fed is not satisfactory to the typical U.S. consumer palate in terms of taste and texture, and organic is not different enough from other niche meats to justify its high price. “Local” (3.5), “family farmed” (3.5), and “personal connection with producer” (3.4) were all rated similarly.
• Although commonly used, there is no common understanding of the terms “naturally raised,”
“local,” and “certified humane.”
• Less than half of respondents are interested in three younger grass-‐fed beef products – vitello, vitellone, and manzo – which are stated in order of declining popularity. Restaurants were the most interested of the three sectors.
• Producers are the most common source for local meats. The most common challenge with
purchasing local meats was volume – having enough and having it regularly available. The next most common challenge was “quality,” including taste, texture, size of cuts, fat content, and variability among individual cuts.
• The majority of respondents did identify their niche meat suppliers in some way; as one said,
“Product identity is important.” Only half of restaurants put supplier names on their menus.
• Based on the average volumes of niche beef bought and sold by distributors in this study, we estimate that ten such distributors would account for more than 14 million pounds of niche beef per year – a substantial portion of the capacity of a plant processing 17.5 million pounds of beef per year (25,000 beef cattle, 700 lbs yield each).
• A broad range of niche meat offerings, marketing the “never/ever,” humanely raised and locally
produced attributes, and with pork and lamb in the species mix, is desirable. There is also considerable demand among retailers for kosher and value-‐added niche meats (cured, smoked, deli, and ingredients for prepared foods).
• Distributors are logical alliance partners for a regional niche meats slaughter and processing facility; they already have resources in place – from well-‐established customer bases and extensive (often decades-‐deep) market knowledge to fleets of trucks and dry-‐aging facilities – that the new facility would not need to build from scratch.

62
Introduction
In this section, we present the results of research on market demand for “niche” red meats – such as certified organic, grass-‐fed, naturally-‐raised, local, kosher, and halal – in the San Francisco/Sacramento region.4 It is one part of a three-‐pronged feasibility study, now underway, for a mid-‐scale, USDA-‐inspected slaughter and processing facility to be built in a coastal Northern California county.5 The purpose of the market study was to determine if there is sufficient market demand for niche meats among restaurants, retailers, and distributors to make such a facility feasible.
Background
Consumer demand for niche meats, such as grass-‐fed, certified organic, or kosher, has grown rapidly during the past five years; it is driven primarily by consumers’ concerns about sustainable production, food safety, traceability, humane animal production, and/or specific health benefits. Furthermore, religious preferences are increasing demand for kosher and halal meats. The rapid rise in U.S. demand for niche meats has been documented in a range of studies. Organic meat, though only 8% of total organic food sales, is the fastest growing segment of the organic food business, expanding by 140% from 2004 to 2006 (Mintel Organic Foods, 2006, quoted in Knudson, 2007). In 2006, sales of natural and organic beef in grocery stores increased over the previous year by 28% in dollar value and 25% percent in pound value, compared to increases, respectively, of 0.4% and 1.7% for all beef (National Cattlemen’s Beef Association, 2007). Grass-‐fed meats are also on the rise: estimates suggest that U.S. production of grass-‐fed beef reached 65,000 head in 2006, rose to 100,000 in 2007, and will rise to 250,000 – 400,000 by 2010 (Gwin, 2007). Grocery sales of brand-‐name beef with a “natural” claim on the label totaled $69.8 million for the 52-‐week period ending March 25, 2006, a 51% increase from the previous year (Food Marketing Institute and ACNielsen, 2006). Looking at buyer behavior, a study released in 2007 showed that more than one in five shoppers bought natural or organic meat, an increase over the previous year (Food Marketing Institute and American Meat Institute, 2007). The study also found that at least 40% of these shoppers are motivated by the belief that these meats are fresher; have better nutritional value, taste, and long-‐term health benefits than conventional meats; and that the animals are healthier and better treated than conventional livestock. Interest in locally grown foods is spreading nationwide, as indicated by the rise in the number of farmers markets, community supported agriculture programs, local meat buying clubs, local food policy councils, and other entities supporting local food systems (Halweil, 2002; Pirog and Larson, 2007; Roosevelt, 2006; Burros, 2007). The “locavore” or “100 mile diet” movement, inspired by books like Gary Nabhan’s Coming Home to Eat (2002), Michael Pollan’s The Omnivore’s Dilemma (2006), and Barbara Kingsolver’s Animal, Vegetable, Miracle (2007), encourages a diet of foods produced within 100 miles of home, and “locavore challenges” have been “popping up all over the country” (Burros, 2007). Locally grown food is increasingly considered an “eco-‐healthy choice” (Roosevelt, 2006), and a 2007 national study found that 69% of respondents believe local food is better for their personal health than food that has traveled across the country (Pirog and Larson, 2007). There is also evidence that consumers “place a high value
4 This study was prepared by University of California Cooperative Extension. It was funded by a grant from the U.S. Department of Commerce’s Economic Development Administration to the Economic Development and Financing Corporation—Mendocino County. 5 The other two elements of the feasibility study are facility design and a supply-‐side analysis.

63
on their perception that purchasing local foods supports local farms” and believe that local foods deliver freshness, taste, and quality (Pirog et al., 2003). The Hartman Group (2008) conducted a nationwide survey in December, 2007, regarding consumers’ interest in buying local. Half of the respondents defined “local” as “made or produced within 100 miles, and 37% chose “made or produced in my state.” Over half reported that they most frequently buy locally produced products at grocery stores (62%), farmers markets (61%) and farm stands (44%), while 28% stated that they buy “direct from the producer.” Locally produced fruits and vegetables were the category for which the greatest proportion of consumers wanted increased variety of offerings (73%), followed by locally produced fresh meats, poultry, and fish (57%)6. More specific to the San Francisco Bay Area and Northern California, market research indicates that this geographic region has the highest potential demand in the nation for grass-‐fed, natural, and/or organic beef products (Spectra Marketing Systems, quoted in Lorenzo et al., 2007). This is consistent with the fact that California – the San Francisco Bay Area in particular – has long been a leader in culinary trends, from sourdough bread and coffee roasting (Saekel, 2005; Bauer, 2001) to organic agriculture (Guthman, 2003). The region was one of the main birthplaces of the alternative food movement (Belasco, 2007). The iconic Chez Panisse, founded by Alice Waters, inspired a “food revolution” with its focus on fresh, local ingredients (McNamee, 2007), and the region is today a hot spot for the “Slow Food” movement (Hopkins, 2003). Even with the rapid growth indicated above, niche meats such as natural, grass-‐fed, and organic are still a small fraction of total beef sales. In the first quarter of 2007, dollar sales of natural and organic beef dollar sales comprised 2.1% of all fresh beef sales and 1.4% of all fresh beef volume in retail supermarkets (National Cattlemen’s Beef Association, 2007).7 Price is part of the story: 63% of shoppers said they would buy more of these products if prices were closer to those for conventional meats (Food Marketing Institute and American Meat Institute, 2007). Yet other factors have also hampered the growth of the niche meat sector, especially limited processing capacity. After World War II, the meat industry in the United States underwent intense consolidation, especially in the processing sector. Many small-‐scale livestock processing facilities closed, limiting the processing capacity necessary for livestock producers focused on niche production, typically small-‐ and mid-‐sized operations, to access markets and provide the products many consumers are demanding. In Northern California, many livestock producers are looking toward niche markets as more profitable outlets for meat products from their livestock. However, their efforts are constrained by the lack of USDA-‐inspected slaughter and processing facilities (Gwin et al., 2005; Kleber et al., 2007).8 Considerable interest has been expressed by ranchers, buyers (e.g. retailers, chefs, distributors), and end consumers, and others involved in the niche meat supply chain to construct new processing facilities in Northern California.
6 Meat, poultry and fish were not separated into different categories. 7 Interestingly, the beefretail.org study says that by 2007, 25% of ground beef in retail meat cases carried labels with “natural” claims, versus 4% for muscle cuts. However, at least some of this beef is likely “natural” per the USDA definition of no additives or preservatives to the meat, which says nothing about antibiotics or hormones used in livestock production. 8 In California, which lacks a state-‐level meat inspection program, meat cannot be sold unless it is slaughtered and processed at USDA-‐inspected facilities.

64
Methodology
We assessed market prospects for niche meats in Northern California by interviewing individuals responsible for meat purchasing in three key segments of the food distribution system: restaurants and institutional food service providers (IFSP) (N=17); retail grocers, primarily regional chains but also one-‐store operations and national chains (N=15); and distributors (N=10). In total, forty-‐two businesses were interviewed. We did not interview consumers because it has been well documented that self-‐reported purchase intentions as gathered through consumer surveys do not match purchase behavior (for two good reviews of this literature, see Wright and MacRae, 2007 and Chandon et al., 2005). Other, potentially more accurate methods of forecasting consumer behavior from intentions are also limited in their predictive capability (Moritz and Fitzsimons, 2004); also, they were beyond the scope (time, expense) of this study. Additionally, research by the National Cattlemen’s Beef Association has indicated that consumers are not very knowledgeable about beef cuts; there is considerable consumer confusion caused by the proliferation of multiple names used to describe a single cut (National Cattlemen’s Beef Association, 1999). Grunert (1997) found that most consumers judge the quality of a cut of beef based on its color and the quantity of fat. All of the businesses interviewed are located in the greater San Francisco Bay Area or the Sacramento metropolitan area (with the exception of the national retail chains and IFSP, all of which have sales units in these regions). Several of the distributors have hundreds of customers throughout northern and central California and even farther afield (e.g. San Diego north to southern Oregon and east to Nevada). The Bay Area is known for its high profile chefs and cutting-‐edge restaurants, many of which have been in the forefront of using and promoting sustainable foods, including meats – Chez Panisse and Acme Chophouse, for example. We intentionally chose not to interview these leaders to avoid bias; many of these chefs had been contacted recently by local niche meat producers and provided with sample product and information. Instead, we focused on the “next tier,” a broader range of operations with highly-‐trained chefs and innovative menus. The grocery firms interviewed can be described as “progressive”; they include many of the operations frequented by the region’s “foodies” and include regional chains as well as specialty meat markets. Although none of the larger grocery firms that specialize in Asian consumers was willing to participate, we believe that we have input about this sector’s demand through the interviews with the distributors. We chose not to interview any of the small ethnic meat markets, recognizing that relationships are needed to obtain credible input in this sector. Of the 42 businesses interviewed, only nine were owned by parent corporations; the rest are independent. Regional retail chains range in size from two stores to more than 100, and several restaurant respondents are responsible for a group of restaurants, typically two to four locations (ten in one case), often with different names and identities. In nearly all multiple-‐unit cases, meat buying is done centrally or is at least coordinated. Interviews were done either in person or by phone. Questions addressed the following topics:
• The company’s current red meat purchasing practices, both conventional and niche • Niche meat sales volumes and estimates of future sales trends • The use of frozen meats, whole carcasses, seasonally available meats, and local meats • The importance of specific product and production attributes to the company and its customers • Perceptions about specific constraints to purchasing and using niche meats
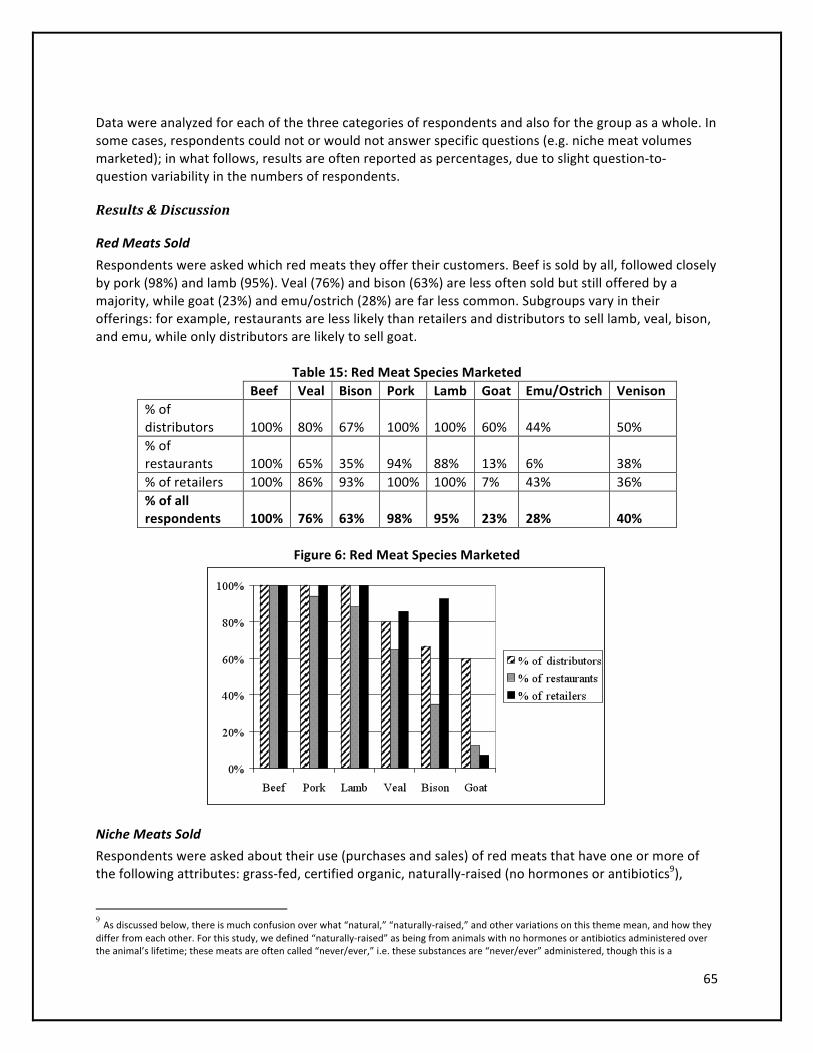
65
Data were analyzed for each of the three categories of respondents and also for the group as a whole. In some cases, respondents could not or would not answer specific questions (e.g. niche meat volumes marketed); in what follows, results are often reported as percentages, due to slight question-‐to-‐question variability in the numbers of respondents.
Results & Discussion
Red Meats Sold
Respondents were asked which red meats they offer their customers. Beef is sold by all, followed closely by pork (98%) and lamb (95%). Veal (76%) and bison (63%) are less often sold but still offered by a majority, while goat (23%) and emu/ostrich (28%) are far less common. Subgroups vary in their offerings: for example, restaurants are less likely than retailers and distributors to sell lamb, veal, bison, and emu, while only distributors are likely to sell goat.
Table 15: Red Meat Species Marketed Beef Veal Bison Pork Lamb Goat Emu/Ostrich Venison % of distributors 100% 80% 67% 100% 100% 60% 44% 50% % of restaurants 100% 65% 35% 94% 88% 13% 6% 38% % of retailers 100% 86% 93% 100% 100% 7% 43% 36% % of all respondents 100% 76% 63% 98% 95% 23% 28% 40%
Figure 6: Red Meat Species Marketed
Niche Meats Sold
Respondents were asked about their use (purchases and sales) of red meats that have one or more of the following attributes: grass-‐fed, certified organic, naturally-‐raised (no hormones or antibiotics9),
9 As discussed below, there is much confusion over what “natural,” “naturally-‐raised,” and other variations on this theme mean, and how they differ from each other. For this study, we defined “naturally-‐raised” as being from animals with no hormones or antibiotics administered over the animal’s lifetime; these meats are often called “never/ever,” i.e. these substances are “never/ever” administered, though this is a
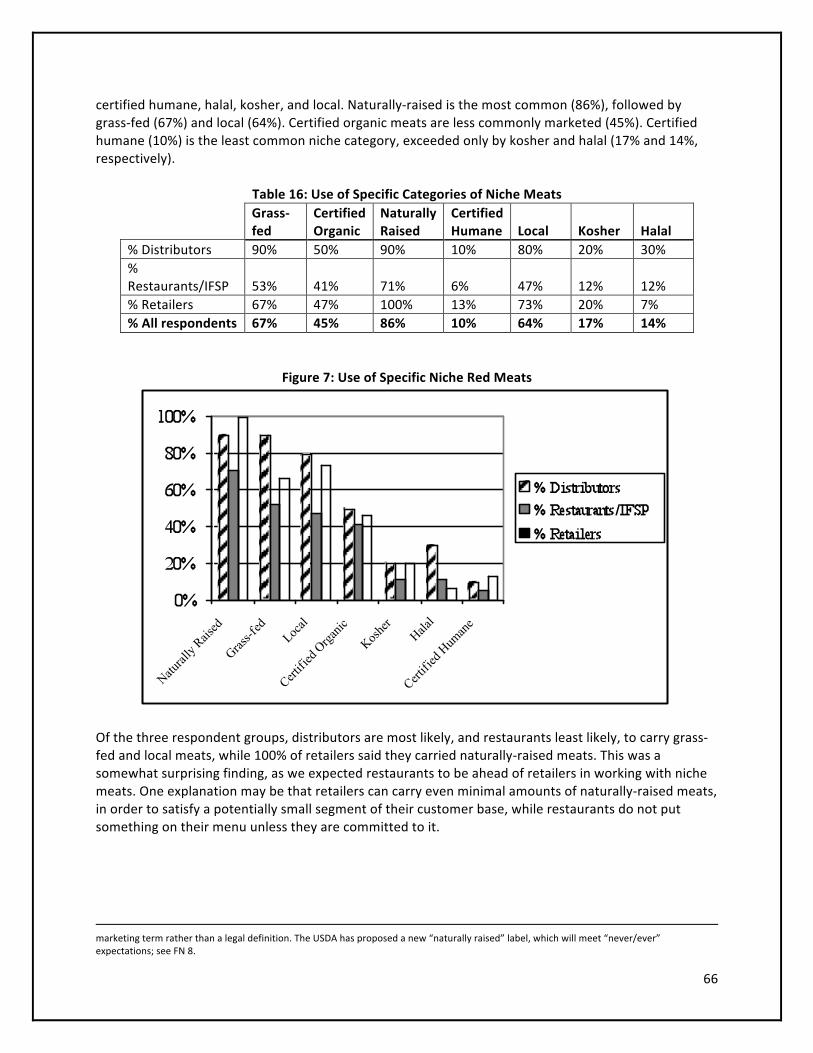
66
certified humane, halal, kosher, and local. Naturally-‐raised is the most common (86%), followed by grass-‐fed (67%) and local (64%). Certified organic meats are less commonly marketed (45%). Certified humane (10%) is the least common niche category, exceeded only by kosher and halal (17% and 14%, respectively).
Table 16: Use of Specific Categories of Niche Meats
Grass-‐fed
Certified Organic
Naturally Raised
Certified Humane Local Kosher Halal
% Distributors 90% 50% 90% 10% 80% 20% 30% % Restaurants/IFSP 53% 41% 71% 6% 47% 12% 12% % Retailers 67% 47% 100% 13% 73% 20% 7% % All respondents 67% 45% 86% 10% 64% 17% 14%
Figure 7: Use of Specific Niche Red Meats
Of the three respondent groups, distributors are most likely, and restaurants least likely, to carry grass-‐fed and local meats, while 100% of retailers said they carried naturally-‐raised meats. This was a somewhat surprising finding, as we expected restaurants to be ahead of retailers in working with niche meats. One explanation may be that retailers can carry even minimal amounts of naturally-‐raised meats, in order to satisfy a potentially small segment of their customer base, while restaurants do not put something on their menu unless they are committed to it.
marketing term rather than a legal definition. The USDA has proposed a new “naturally raised” label, which will meet “never/ever” expectations; see FN 8.

67
However, variation in niche attribute definitions – and knowledge of how their own meats fit those definitions – was apparent, especially regarding naturally-‐raised, local, and certified humane. Respondents generally understood the other niche terms and could answer with certainty about whether their meats fit those categories.10 We defined “naturally-‐raised” as meat from animals with no added hormones and no antibiotics administered during their lifetime; this is often referred to as “never/ever,” i.e. these substances are never, ever administered.11 Some respondents weren’t sure if their meats qualified as never/ever or as the less stringent variation, that no hormones/antibiotics were administered within a given period (often 120 or 240 days) before slaughter (a practice referred to as “withdrawal”). They also did not know if antibiotics were allowed for therapeutic purposes (to treat sick animals) even if feed-‐grade antibiotics (given to healthy animals, to speed growth) were not used. “Local” was also defined differently, geographically-‐speaking, by respondents (as discussed later in this report). In addition, some respondents considered a supplier to be “local” if the processing facility itself was local (e.g. Superior Lamb in Dixon, CA). When asked whether the animals themselves were raised locally, many respondents did not know; of these, most were not concerned. The supplier was local, therefore the meat was local. Finally, “certified humane” caused some confusion, primarily because respondents lacked information about what it meant (and who certifies it) and whether their suppliers were certified. Several indicated that their suppliers used humane treatment, following “Temple Grandin guidelines,” referring to Grandin’s work to overhaul standard operating procedures at large, conventional meat processing facilities; however, this is not the same as “certified humane.” This category may have been slightly under-‐reported; e.g. Meyer, a never/ever meats company, is certified by Humane Farm Animal Care, but no respondent handling Meyer meats identified it as such.
Approximate Volumes of Niche Meats Sold
We asked respondents how much of these niche meats, by volume, they sold. Their answers were typically rough estimates, often given with wide ranges and as combined totals (e.g. X lbs of naturally-‐raised, organic, and grass-‐fed, of all red meat species, together); some respondents were unwilling or unable to share sales data. The following table gives volumes for the three different species and three different attributes for which we had the most complete data.12 The wide range of volumes given for each of the three groups of respondents reflects not only variation in use but variation in business sizes; e.g. a retail chain will use far more meat than a single-‐store grocer.
10 In November 2007, the Agricultural Marketing Service (AMS) of USDA finalized the legal definition of “grass-‐fed” when used on meat labels: 100% forage-‐fed (except in emergencies) and on pasture during the grass-‐growing season. This may actually add to confusion, since it says nothing about the use of hormones or antibiotics, which most grass-‐fed producers do not currently use, at least for growth promotion. 11 In November 2007, AMS issued for public comment a proposed definition for a “naturally raised” voluntary marketing claim for meats; it prohibits any use of antibiotics or hormones and requires a vegetarian diet. This effort is meant to clear up consumer confusion caused by the current USDA definition of “natural,” which says nothing about how livestock are raised and only indicates that the meat has no additives or preservatives, which is true of most conventional meat sold fresh. 12 Volumes for meats both organic AND grass-‐fed are registered in both columns, such that the sums of individual niche categories exceed actual total usage. Head of livestock are converted to pounds of meat based on the following conversion factors: 700 lbs/head for a steer; 50 lbs/head for a lamb; 140 lbs/head for a hog.

68
Table 17: Pounds of Niche Meats Sold Per Week
Pounds of Niche Meats Sold per Week
Beef Pork Lamb Grass-‐fed Organic Naturally Raised
Distributor average 26,718 3225 1916 4804 4482 33,797
Distributor range 525-‐89,500
1400-‐4900
230-‐7500
720-‐10,000
38-‐7500 800-‐86,600
Restaurant average 257 303 105 234 1114** 234 Restaurant range 35-‐650 100-‐640 30-‐200 50-‐490 nd 55-‐200 IFSP average* 6000 5000 nd 1750 nd 9250 Retail average 14,765 5613 835 808 1070 16,164
Retail range 145-‐107,400
65-‐25,000
35-‐2500 60-‐3500
40-‐2100 90-‐105,000
* No range is given for IFSP, as only one IFSP respondent provided volume data. ** Data from only one restaurant respondent with two locations Some respondents measured niche meat volumes in sales dollars or percentages of their total meat purchases. For example, while two IFSP respondents said that niche meats are less than 1% of their total meat sales, one distributor said that niche red meats are 60-‐70% of total meat sales, and three retail estimates ranged from $1-‐2.5 million.
Increases in Niche Meat Use
When asked whether the volume of niche meats they use would increase over the next year and/or over the next three years, 76% of all respondents said yes, for both time periods. Distributors were the most optimistic of the three groups, with 90% saying yes to both time periods. Restaurants/IFSP’s were also enthusiastic, with 75% predicting an increase in the next year, and 69% in the next three years. Retailers were less optimistic in the short-‐term though more so for the longer-‐term, at 64% and 73%, respectively.
Table 18: Belief That Niche Meat Volumes Will Increase In 1, 3 Years
Increase in 1 year
Increase in 3 years
Distributors 90% 90% Restaurants/IFSP 75% 69% Retailers 64% 73% All respondents 76% 76%
When asked to estimate by what volumes their use of niche meats would increase, very few respondents would venture to guess specific numbers, but they had opinions about which niches would grow more than others. Of the restaurant/IFSP group, volume increase estimates ranged from 7-‐10% for “all niches” to 50% growth for naturally-‐raised pork in three years, to 100% growth for grass-‐fed beef in the next six months. Of those who predicted which niches would increase most, 50% said naturally-‐raised, grain-‐fed beef would outstrip organic or grass-‐fed; in the U.S., respondents said, meat eaters were unlikely to shift away from preferring a grain-‐fed taste. Two specifically rated “local” as the highest growth category for

69
the Bay Area. As one executive chef explained, her customers “want the healthy, right thing to eat.” Yet at the same time, “they won’t sacrifice taste for conscience.” The three distributors who ventured specific percentage increases predicted slightly larger growth, of 20% per year for naturally-‐raised, grain-‐fed beef and “all niches.” Opinion about which niche categories would climb the most leaned toward naturally-‐raised, grain-‐fed meats (beef and pork), and local meats. Grass-‐fed and organic were predicted to rise less, both because of popular tastes (the former) and cost (the latter). “Organic is too expensive, and most people don’t think it’s better than never/ever,” said one respondent. “People will pay $25 for [never/ever] Kobe beef, because they see the marbling, the quality. They won’t pay $29/lb for organic beef that has less or no marbling.” Interestingly, one distributor explained that his company expected “exponential growth” in niche meats – local in particular – as it actively shifted to a more “white tablecloth restaurant” client base. “Sysco can’t do local, so that’s a point of differentiation.” Retailers ranged widely in their predictions. The nine respondents who expect annual increases (5-‐30%) in niche meat sales were mixed regarding which niches would grow the most. Four said organics, four said grass-‐fed, three said naturally-‐raised grain-‐fed, and three said local meats. Grass-‐fed was identified as both a booming growth area (“local grass-‐fed beef quickly overtook non-‐local organic beef”) and a static category (“mainstream tastes aren’t going to change”). One respondent said that with the increased availability of natural meats, organics would be a point of differentiation for retailers. The remaining six respondents were pessimistic about increased niche meat sales. For one, this was because, after 10 years of selling niche meats, local demand was saturated. Two others said growth would depend on how the federal government ultimately defined “naturally-‐raised” and “grass-‐fed”: stricter definitions would restrict supplies and keep prices high. Three noted that overall red meat sales were down, due to price hikes and broader economic uncertainty. Though customers might want to buy niche meats, they may not be willing to pay: “It depends on education… everyone’s health conscious, to a certain price point.”
Niche Meats Wanted If Supply Were Available
Respondents were asked what niche meats they would like to offer their customers if they could find a supplier, i.e. products they don’t currently carry. Answers were quite mixed. In the restaurant/IFSP group, the most desired quality (five respondents) was local in several varieties: naturally-‐raised, value-‐added (e.g. cured, smoked, and deli meats), beef and pork. The second most desired quality was naturally-‐raised. In addition, four respondents specifically asked for niche meats at lower prices than they currently paid. Distributors were mixed: three said more organic (beef and pork) at a more affordable price, two said naturally-‐raised grain-‐fed, two said grass-‐fed, and one said local, all species. Two said niche value-‐added meats (e.g. organic beef dogs, organic burrito beef, and local deli meats) were in high demand but difficult to find. Kosher was mentioned most often by retailers (N=4). In addition, three retailers wanted more affordable organic meats; one wanted humanely-‐raised, local pork and lamb. Seven respondents already had what their customers wanted; one of these explained that adding any other offerings to his meat case would simply confuse his customers.

70
Price Premiums Paid For Niche Meat
Respondents reported paying a wide range of premiums (over conventional), depending on cut, niche attribute, brand, and shifts in conventional pricing. Premiums of 10-‐30% were common, though certified organic meats were typically much higher. Retailers reported premiums from 0-‐10% for imported grass-‐fed beef to 200-‐300% for domestic, certified organic middle meats; most said 10-‐30% was typical. Restaurant/IFSP respondents pay from 7-‐10% to 50-‐60%, centering on 15-‐30%. Distributors also commonly paid 10-‐30% more, though this was for naturally-‐raised, non-‐local meats; premiums rose 40-‐60% for local, naturally-‐raised meats and to 60-‐70% for domestic organic meats. Such high premiums were what led at least three respondents to buy imported grass-‐fed and organic-‐grass-‐fed beef, for which they paid little or no premium.
How Retailers Sell Meats
Most retailers sold meats in more than one format: 87% sell fresh meats at a full-‐service counter; 60% sell fresh meat, self-‐service (i.e. pre-‐packaged); 73% sell frozen meat.
Use of Frozen Meats
Across all three sectors, the majority of respondents preferred fresh meats and avoided frozen, except for value-‐added products or meats that sell sporadically. More than half of restaurant/IFSP respondents (56%) did not buy or use frozen meats, citing quality concerns (taste, texture, purge of liquids during defrosting). However, two of these said they would be willing to use frozen meats for braising and sauces. Three respondents that did use frozen meats said they preferred fresh, while two that did not use frozen meats were willing to try. Retailers also preferred to avoid frozen meats. Though 67% did sell such meats, these were primarily burger patties, which freeze well, and also meats (e.g. venison and bison) that do not sell quickly. In general, they said, retail customers demand fresh meat and believe that freezing red meats compromises quality. Half of the distributor respondents did handle frozen meats, though for two, this was mostly value-‐added products (e.g. burger patties, breaded veal cutlets). The rest carried only fresh meats, citing customer preferences or a lack of demand.
Use of Whole Carcasses
Respondents who bought (or were willing to buy) whole carcasses primarily limited this to pigs and lambs; beef carcasses were typically considered too large to handle in-‐house. A majority (56%) of restaurants/IFSP did not buy whole carcasses because they lacked the facilities, skills, and/or time, and/or saw no price advantage. Only 44% bought or were willing to buy whole carcasses, though all but one limited this to lambs and pigs. This outlier, with two restaurants and a third in the works, planned to buy whole animals and split them among the three locations. This was, he said, a way to support local farmers: “if they can’t sell the whole carcass, they’ll have to sell portions of that really good meat into the commodity market… a big waste.” Retailers (53%) were more willing and able to work with whole carcasses, saying this allowed them to get a better price from their suppliers and to provide their customers the highest quality meat possible

71
(“If you know what you’re doing,” said one). The rest lacked facilities and/or skilled staff; most of these also said that there were no cost savings in taking whole carcasses. “You’ll sell more of one part of the carcass than of the other, and you’ll have to raise prices on the former to compensate for the latter.” Another, with 47 years experience in meat retailing, said that “being able to buy only the cuts you sell is such a benefit.” While half of the distributors purchase whole carcasses, two of these said this was rare. The rest did not have facilities or skilled workers. Said one, “I have 65 meat cutters but no butchers except me,” and meat cutters “Don’t know how to make the whole animal go away.”
Use of Seasonal Meats
While restaurant/IFSP and distributors were willing to use meats that are only available seasonally, retailers were far more resistant. More than half (59%) of restaurant/IFSP respondents used or were willing to use such meats. Of the unwilling remainder, several said it was too hard to track what meats were available when. In some cases, they could not easily change menus. Most distributors (70%) were also willing and able. However, one noted, a part-‐time presence with a customer can be risky: “if you’re off the shelf for six months, you don’t know what will happen with that account.” In contrast, 80% of retailers were unwilling to carry seasonal meats, and most pointed to customer expectations. Said one, “when we bring a product in, it has to be here every day of the year. Customers demand it.” Another explained, “You either sell it or you don’t. Customers don’t understand seasonality for meats … except maybe wild salmon.”
Most/Least Popular Cuts
The popularity of specific cuts of meat with the respondents’ customers depended on a variety of factors, including customer demographic and the season, i.e. braising cuts like pot roast sell better in the winter, while porterhouses are popular in late spring. More than half (59%) of the restaurant/IFSP respondents said that high-‐end cuts, such as filet, ribeye, tenderloins, and tri-‐tip, were the most popular, while the rest used more burger and lower end cuts, e.g. for braised dishes. Nearly half of the retailers sold mostly middle meats. As one explained, “90% of the people want 10% of the animal: steaks.” Three retailers sold the whole range, middles and ends, and two said ground meat was most popular, because of its relatively low cost and multiple uses. All distributors sold a wide range of cuts, depending on their specific markets. Only a third identified a “popular” cut: they sold more ground meat overall, as a good way to sell ends otherwise difficult to move. Another third said they have to sell it all, because they handle whole carcasses. The least popular cuts, unsurprisingly, were more typically but not wholly end meats and less familiar cuts (e.g. flatiron and baseball steaks). Among the restaurant/IFSP respondents who identified any unpopular meats, most said end and organ meats (“the good stuff”) moved less quickly. A third of the retailers sell fewer end meats, such as pot roasts and shoulders: “people don’t know how or don’t have time to cook them.” For 27%, sales of middles versus ends were quite balanced – sometimes by necessity, because these retailers buy whole carcasses. In an interesting side note, one

72
retailer said that his customers were far less willing to pay a premium for less desirable cuts of the more expensive niche meats. More than two-‐thirds (70%) of distributors found a market for everything and could grind any extra end meat. As one explained, “Nothing is ‘less popular.’ You have to know how to market the various parts, by finding appropriate markets. Like skirt steaks to the high end Hispanic trade.”
Attribute Ratings
Respondents were asked to rate the importance of various attributes, regarding both the meat products themselves and production practices. The rating scale ranged from 1 to 5, with 1 for “not important at all” and 5 for “very important.” All three respondent groups rated these attributes similarly.13 Not surprisingly, “taste” had the highest average rating. “Price” was the least important product attribute and the third least important attribute overall. This is not unexpected, because the other attributes distinguish the niche products from price-‐driven commodity meats. Price, said one restaurateur, “is the bottom line, but customers are willing.” The highest-‐ranked production practice was no hormones/no antibiotics. Although “health benefits” rated fourth highest, the healthfulness of grass-‐fed meats was not compelling enough to make “grass-‐fed” a highly important attribute; respondents commented that grass-‐fed is not satisfactory to the typical U.S. palate in terms of taste and texture. The average ratings for “local,” “family farmed,” and “personal connection with the producer” were similar, but not as high as “no hormones/ antibiotics,” which provides more direct benefits to consumers. Both “humane treatment” and “local” had higher rating averages than either grass-‐fed or organic. Organic, which had the lowest average rating overall, was said to be not different enough from naturally-‐raised meats to justify the extra cost. Survey respondents consistently ranked “no hormones/antibiotics,” “local,” and “humanely raised” more important than “grass-‐fed” (pairwise t-‐test; p=<0.0001).
13 Per ANOVA. The one possible exception is taste: retailers said taste is less important than did the other two groups. But the difference is not statistically significant (p=0.07).

73
Figure 8: Average Attribute Ratings (1-‐5), All Respondents
Several respondents predicted that certain attributes, such as environmental stewardship and family farming, though not so important to their customers now, would increase in importance in the future. One IFSP respondent said, regarding the production attributes, “If I were king, these would all be a 5”; the company, he explained, was moving that way, albeit slowly.
Interest in New Grass-‐fed Beef Products: Vitello, Vitellone, and Manzo
Seasonality in grass-‐based cattle production in Northern California has prompted some producers to develop new grass-‐fed beef products in order to extend the harvest period for livestock. We asked respondents if they had heard of and/or were interested in trying three products – none of which have been fed grain or formula, and all of which have free access to pasture:
• “vitello,” veal harvested at 3-‐4 months of age, which has pinkish-‐white meat; • “vitellone,” harvested after weaning, at 6-‐8 months; the meat is more red than vitello and
should be dry-‐aged; • “manzo” is harvested at 11-‐13 months; the meat is dark-‐red and should also be dry-‐aged.
Table 19: Knowledge of, Interest in Three Grass-‐fed Beef Products
Heard of (%) Interested (%) Vitello Vitellone Manzo Vitello Vitellone Manzo Distributors 70 50 20 40 50 20 Restaurants/IFSP 87 47 33 60 53 33 Retailers 64 64 36 43 14 14 All respondents 74 54 31 49 38 23
Just under half of all respondents were interested in vitello, more than a third in vitellone, and fewer than a quarter in manzo. One of the concerns expressed about vitello and vitellone was that veal is hard to sell, because of “too much bad publicity.” A distributor with experience in upscale, natural foods

74
retail said that even when customers claim they want veal raised humanely on pasture, they then don’t like the taste … “they don’t accept the uniqueness of that product.” But some respondents were interested if these products were humanely raised on pasture, or family farmed. “The story matters.” A few respondents said they already carry a version of vitello and/or vitellone and were therefore not interested in a new line. The lack of interest in manzo was, in part, due to concerns about the lack of marbling – “sounds like select beef,” said one respondent – and also due to the facilities/cost involved in the recommended dry-‐aging periods. Several retailers and distributors said that all three products are more appropriate for chefs, “who can communicate more directly with customers, talk about the preparation, and then can charge for it. You can’t do that in retail.” In addition, they explained, it can be difficult to educate retail customers on all these points of difference. One retailer said that after a year of education about “never/ever” versus conventional meats, 40% of his customers still did not understand the differences.
How to Define “Local” For Meats
Respondents were asked how they defined “local” for meats, geographically. Answers ranged from “our county” and adjoining counties to “California and Nevada,” reflecting a significant lack of consensus. Most definitions tended to be narrower than the whole state of California, such as within a radius of 50, 100, or 200 miles.
How Long Respondents Have Carried Local Meats
Again, answers ranged widely and were complicated by the varying definitions of “local.” The eight restaurant/IFSP respondents who buy local meats have done so for as long as 25 years to as recently as within the last year. The twelve retailers buying locally have done so over a range from 45 years to six months, and the eight distributors buying local meats range from one year to 30 years.
Where They Buy Local Meats
The most common source for local meats was direct from the producer. Of the eight restaurant/IFSP respondents who use local meats, all sourced directly from producers, while five also bought from distributors and one from farmers markets. Of the twelve retailers buying locally, ten bought from producers and two from distributors. All eight distributors who handle local meats bought directly from producers.
Challenges in Purchasing Local Meats
When the many, wide-‐ranging responses regarding challenges in purchasing local meats were grouped, five basic themes emerged; the frequency of these responses is displayed in the table below.
Table 20: Challenges in Purchasing Local Meats
Restaurant/IFSP (%)
Retail (%)
Distributor (%)
All (%)
Sufficient volume 33 64 67 53 Consistent volume 27 36 11 26 Quality 53 21 11 32 Cost 33 14 22 24 Processing 13 29 22 21

75
Volume – having enough and having it regularly available – was by far the most cited concern. Respondents said they were unable to source an adequate volume of local meats on a regular basis. However, some had adjusted. One restaurateur has learned to be flexible with variable supplies: her distributor can only get 20 rabbits each week, “so we take the 20 and use them, and when the rabbit’s gone, it’s gone.” Similarly, a retailer explained that “It’s not a bad thing to run out of a product – that means it’s in hot demand,” and customers will learn when to come in to get it. “I’m not afraid to run out of anything.” A distributor said it can be difficult to get enough local products to satisfy his larger accounts; but by working with a number of small, local suppliers, he can usually assemble enough volume. Under the heading of “quality” – the next most frequent area of concern – respondents noted an array of factors they often found unsatisfactory with niche meats, including taste, texture, size of cuts, fat content, and variability among individual cuts. One retailer said that small, local farms lacked the technology (e.g. tenderness testing or computerized ration management) to raise meats consistent in taste, texture, and size of cuts. For example, he wanted all the lamb carcasses he buys to be the same size, so that all the chops are the same size. “Everything’s on computer, so you get a consistent product. Locals can’t do that.” Cost, while not the most cited challenge, was still a deterrent. Said one distributor, “It’s not that domestic grass-‐fed is undesirable or low quality. The price is just astronomical.” Cost was mentioned the most by restaurant/IFSP. However, some restaurants explained that if certain meats were too costly, they could alter menus to serve them differently, perhaps in smaller portions and/or not as often. Less cited than the other concerns but still a factor, “processing” was also seen as a challenge for respondents: processing facilities were unavailable, too far away, unreliable, or did not provide desired services, which meant producers were unable to meet the needs of their customers. Related to processing, one large-‐scale IFSP respondent said that insurance was the critical challenge: all of its suppliers are required to have liability insurance, to protect all parties in case of food safety problems. However, he explained, many small producers are unable to afford this insurance, so this IFSP often works with regional suppliers, which can provide umbrella liability coverage for multiple producers.
Customer Requests for Niche Meats
The majority of respondents in all three groups reported that their customers did not ask (or asked very rarely) for specific niche meats. In some cases, this was because the respondents already offered a satisfactory array of niche meats. As one restaurateur explained, “Having [a few] niche meats on the menu satisfies the small percentage of people who care, who ask about those issues.” In other cases, customers didn’t ask, according to respondents, because they were not interested in other options. Of the five restaurant/IFSP respondents that did receive requests, the majority were for meats with no hormones or antibiotics. “In a meat shop, you have to train your customers to buy what you put out there… if they want something special, we can order it.” Only three retailers received requests more than rarely, primarily for organic and grass-‐fed meats, but also for halal. One retailer said that grass-‐fed was “the biggest consumer-‐driven push in the last 10 years.” Only four of the ten distributors reported requests for a range of products: three varieties of niche pork: never/ever, organic, and heirloom; grass-‐fed beef; and game (e.g. venison). However, customer demand

76
was acknowledged as a driver of product offerings: “I hear it all. If there’s enough demand for something, I’ll see what I can do.” However, he continued, “We can’t be all things to all people.”
Niche Customer Profile (Retailers Only)
When asked if their customers who bought niche meats had similar characteristics, retailers described them as highly educated, professional, and affluent; health conscious and concerned about the environment and what they feed their children; and focused on their families and involved in their communities. They are educated about and attentive to food-‐related issues, such as the use of antibiotics and hormones in meat production, humane treatment, and family farming. These customers were also said to have and spend more time (than other customers) on shopping and cooking. One retailer said that, in particular, grass-‐fed meat customers tended to be younger than other customers, because younger shoppers perceive grass-‐fed as more valuable and of higher quality than grain-‐fed.14
Number of Meat Suppliers
In general, restaurants/IFSP’s used the fewest meat suppliers, and distributors used the most. Restaurant/IFSP respondents used an average of three, ranging from one to seven, and up to twelve for IFSP. Retailers use an average of twelve suppliers and ranged from three to forty-‐two. Distributors ranged even more widely, from one to 170.
How Respondents Identify Suppliers to Their Customers
Table 21: Methods of Identifying Suppliers to Customers
Labels Point of Sale Info
Meet Producer Days
Don't ID On Menu
Distributors 10 4 4 0 NA Restaurants/IFSP 0 1 4 5 8 Retailers 13 8 6 2 NA All respondents 23 13 14 7 8 % of all respondents 58% 33% 35% 18% 47%
The most common method of identifying suppliers was the product label/invoice, or the menu for restaurants/IFSP. Only half of restaurants put supplier names on their menus; for some, this depended on how well-‐known the supplier was (Niman would be listed). If not, restaurant staff could often give this information if asked by a customer. Even though most respondents did not have “meet the producer days” for customers, several retailers and distributors did ask suppliers to meet and train their staff. The majority of respondents did identify suppliers in some way; as one said, “Product identity is important.”
14 One retailer offered an interesting perspective on niche buyers, which he estimated as about six percent of his customer base. While they do spend a lot of money, not only on meats but on “attributing items” like wine and cheese that go with those meats, they rarely buy large volumes of any item. They also shop more often and require more service per visit, which in the long run means they are more costly to serve than non-‐niche customers.

77
Orders and Deliveries
Half the restaurant/IFSP respondents made orders and received deliveries of meats every day of the week; the others typically took deliveries at least twice a week. Retailers ranged from once a week to every day, depending on store volume; at least three times a week for half of them. Distributors ordered and received much more often: as needed, every day, “all day,” and typically no less than five times a week.
Biggest Challenges in Purchasing Niche Meats
Respondents were asked what their biggest challenges were in purchasing niche meats. Responses to this question significantly overlapped with challenges in purchasing local meats, discussed above. Again, the table indicates the number of times each theme was mentioned by respondents.
Table 22: Challenges in Purchasing Niche Meats Restaurant/IFSP
(%) Retail (%)
Distributor (%)
All (%)
Volume (sufficient, consistent)
33 53 90 55
Quality 13 40 30 28 Cost 33 27 0 23 Customer education 27 13 20 20 Supply chain 13 17 10 18
As with local meats, accessing niche meats in adequate volumes (and, for many, consistently over time) was the challenge most often cited by respondents. As one chef said, “We really want this stuff – we need the volume.” Distributors were the group most likely to have this problem (90%). One distributor explained that being able to offer a sufficient supply is as important to its customers as price and the niche attribute itself. Yet there were exceptions to this opinion: one IFSP considered limited supply to be almost a given with niche products: “you get what you can get, when you can get it. Is it okay to have it on the menu and then run out? Sure. You have to educate the consumer and the [unit] operator on how best to manage it.” Cost was only slightly more important than quality (again, encompassing a range of factors, from taste and texture to consistency in individual cut size and shape). A retailer said, “People will pay extra for something they value” and may even accept slightly reduced quality in exchange for other perceived values. “These niches will sell if the product quality is consistent and the supply is consistent and large enough.” Supply chain challenges included several difficulties; lack of access to appropriate facilities and distribution systems for small producers and the complexity, for buyers, of managing multiple suppliers. Regarding distribution, one chef knew of producers raising high quality meat, “in all the right ways,” who then can only “throw it in the freezer” after processing, because they don’t have a distribution system to get the meat to local restaurants. Regarding supplier management, the manager of a restaurant group said that each chef had to spend a great deal of time finding and working with multiple sources: “The chefs do it, and they like it, but it’s a big pain.”

78
Respondents discussed two customer education challenges: why niche meats cost more and what all those labels really mean. Customers, respondents said, are confused by the range of definitions, e.g. all the varieties of “natural.” One retailer said, “people still don’t know what ‘marbling’ means, what it contributes.” For customers to be willing to pay the higher price for niche meats, they need to understand the health and taste benefits. The need for education wasn’t limited to customers: respondents said they had to educate their own personnel (especially chefs and kitchen staff) how to handle niche meats. Another challenge mentioned specifically by retailers (4) was a lack of steady demand. One retailer, typical of those who mentioned this problem, explained that when he considers new suppliers, he looks at their marketing strategy. “Are they using billboards…radio? Are they positioning themselves? Are they creating customer demand? … If you take up space in my case, it had better sell!” Niche suppliers, he said, typically did not understand that retail is “all about turns: you gotta get it in and out. If I have to do anything to get rid of that product, it’s not worth it to me to carry it.” Finally, it is worth noting that two respondents who said they had no challenges in sourcing niche meats attributed this to the solid, long-‐term relationships they have built and maintained with their suppliers, both producers and distributors.
Conclusions
This market study offers an assessment of demand – and various aspects of that demand – for niche red meats in the greater San Francisco Bay Area and Sacramento metropolitan area. Primary findings are as follows. The most popular red meats are beef, pork, and lamb, in that order. The most popular niche categories, also in declining order of popularity, are naturally-‐raised, humanely raised, local and grass-‐fed; however, there are varying interpretations, among respondents and their customers, over definitions of some niche attributes, including naturally-‐raised and local (most broadly California but often more narrowly defined). Retail niche meat customers are highly educated, professional, affluent, health-‐conscious, and care about the environment, their families, and their communities. The volume of niche meat demand in this geographic area looks promising in terms of supporting a mid-‐sized processing plant, especially if demand continues to increase, as is predicted by three-‐quarters of all respondents. Difficulty in obtaining accurate volume data, the varying definitions of specific niche categories, and the fact that many of the retail/restaurant/ IFSP respondents are customers of the distributors interviewed in this study, make it challenging to extrapolate the capacity for a slaughter and processing facility that would best fit near-‐term demand in this geographic region. However, some tentative estimates can be made. For example, based on the average volumes of niche beef bought and sold by distributors in this study, ten such distributors would account for more than 14 million pounds of niche beef per year – a substantial portion of the capacity of a plant processing 17.5 million pounds of beef per year (25,000 beef cattle, 700 lbs yield each). A larger plant (e.g. 75,000 head/year) might need to look beyond this region to move all of that meat.

79
Fresh meats are preferred to frozen. About half of respondents can and do purchase whole carcasses, though primarily smaller stock (pigs and lambs) rather than cattle. Restaurants, IFSP, and distributors are far more willing to work with seasonally available meats than are retailers. Price premiums (over conventional meats) depend on the specific niche, brand, meat cut, and sometimes time of year; that said, 10-‐30% premiums were common, and many respondents had to pay far more, especially for organic meats. The biggest challenge in buying and using niche meats – and local meats more specifically – is obtaining them in adequate and regular volumes. Regional and national chains, in particular, may balk at any product they cannot carry in all of their stores. The ability for a regional plant to satisfy those volumes will, of course, depend heavily on the availability of livestock that meet the desired niche categories. Respondents also discussed challenges regarding meat quality, cost, the need for customer education about niche products, and the supply chain/processing. One final important finding that emerged during our interviews – and not from a specific question – is the existence of an enthusiastic and already well-‐functioning link in the niche meat supply chain: distributors. Several of the distributors interviewed were very interested in having a new USDA-‐inspected slaughter and processing plant in this region; they saw the need from both the customer and livestock producer perspectives. Their interest in niche meats appears to be growing for at least two reasons (apart from an overall rise in demand). First, independent distributors see niche products as a way to differentiate themselves from the more consolidated, corporate distribution companies. Second, as fuel prices rise, retail and restaurant buyers may wish to do more of their purchasing with a single distributor, which means that distributors are looking for a wider range of products, including niche meats. Clearly, some consumers and restaurants prefer to purchase their niche meats directly from producers. However, distributors have the capacity to handle larger volumes. They are logical alliance partners for a regional niche meats processing facility, in that they already have resources in place – from well-‐established customer bases and extensive (often decades-‐deep) market knowledge to fleets of trucks and dry-‐aging facilities – that would not need to be built from scratch.

80
APPENDIX: Northern California Niche Meat Market Demand Study
QUESTIONNAIRE/INTERVIEW GUIDE
INTRODUCTION Thank you for agreeing to participate in this research to measure market demand for niche meats in the San Francisco Bay Area. This research is part of a feasibility study, conducted by University of California Cooperative Extension, for a meat processing, distribution, and marketing facility proposed for Northern California. Information you give us will remain confidential. Interview information 1. Interview date/time____________________________________ 2. Interview location_____________________________________ 3. Interviewers__________________________________________ Interviewee information 1. Name_______________________________________________ 2. Position_____________________________________________ 3. Company name_______________________________________ 4. Contact info (phone/email/address)________________________ Company information 1. Type of company
a. distributor b. restaurant/food service c. retail grocer d. other _________________
2. Ownership status
a. chain/franchise b. corporate c. independent d. other _________________
Niche meat purchasing/sales Niche meats are non-‐commodity meats with one or more of these attributes: grass-‐fed/finished, certified organic, no hormones/no antibiotics, free-‐range, certified humane, halal, kosher, local. We’re asking about fresh and frozen meats, plus “value added” products like sausage or jerky. 1. What varieties (species) of red meat do you currently market? Circle all that apply:
beef veal bison pork lamb goat emu venison 2. Which niche meats do you currently market? Circle all that apply:

81
a. Grass-‐fed b. Certified Organic c. Naturally raised (no hormones/no antibiotics) d. Certified Humane e. Locally-‐grown f. Kosher g. Halal h. Other _______________
3. What are the approximate volumes of the niche meats you market? (lbs per week/month) 4. Do you expect the volume of niche meats you sell to increase during the next year? During the next three years? 5. If so, which types of niche meats and approximately how much of an increase? (> or < 5%) 6. What other niche meats would you like to sell if you could find a supplier? 7. Niche meats may often cost more than commodity meats. On average, what kind of premium do you typically pay for the niche meats you market? 8. RETAILERS ONLY: How do you sell meats?
a. Fresh – meat case (full-‐service) b. Fresh – pre-‐packaged (self-‐service) c. Frozen
9. Do you purchase/sell frozen meats? Why or why not? 10. Do you purchase any meats by the whole or half carcass? Why or why not?

82
11. Do you sell any meats that are only available seasonally? If not, why not? 12. What cuts are most popular with your customers? 13. What cuts are least popular? 14. Rate these product qualities on a scale of 1 to 5, with 1 = not important, 5 = very important:
a. Taste 1 2 3 4 5 b. Consistent size and shape of cuts 1 2 3 4 5 c. Health benefits 1 2 3 4 5 d. Price 1 2 3 4 5 e. Year-‐round supply (not seasonal) 1 2 3 4 5
15. Rate these production-‐oriented qualities, 1 to 5, with 1 = not important; 5 = very important:
a. No added hormones or antibiotics 1 2 3 4 5 b. Certified organic 1 2 3 4 5 c. Grass-‐fed 1 2 3 4 5 d. Environmental stewardship 1 2 3 4 5 e. Humane treatment 1 2 3 4 5 f. Family-‐farmed 1 2 3 4 5 g. Locally-‐grown 1 2 3 4 5 h. Personal connection with producer 1 2 3 4 5
16. Have you heard of any of these beef products? Are you interested in them?
a. Vitello = veal, harvested at 3-‐4 mo.; fed on mother’s milk (not formula); calf has free access to pasture; meat is pinkish-‐white, very tender
b. Vitellone = harvested at 6-‐8 mo. (after weaning), fed on mother’s milk supplemented with grazing; meat is pale red & should be hung (dry-‐aged) 1-‐2 wks for best flavor. Tender, low in fat. Must be cooked longer than veal. Once known as “kip.”
c. Manzo or “baby beef” = harvested at 11-‐13 months, when feeding entirely on pasture; meat is dark red & should be dry-‐aged 3-‐4 weeks. Lower fat than mature beef but flavorful & tender. Cook quickly, but chuck & round good for braising, roasting.
17. How do you define “local” for meats? 18. If you do purchase/sell locally-‐grown meats:
a. How long have you done so?

83
b. Where do you purchase them? (e.g. direct from the producer, farmers market, distributor) c. What challenges are most difficult in purchasing locally-‐grown meats?
19. Do your customers ever ask for specific niche meats? If so, which species and qualities? 20. FOR RETAILERS: How would you describe your customers who buy niche meats? Do they have similar characteristics? 21. How many meat suppliers do you use? Who are they? 22. How do you identify your suppliers to your customers?
a. labels b. brochures and other in-‐store information c. meet-‐the-‐producer days d. don’t identify them
23. How often do you place meat orders and receive deliveries? 24. What are your biggest challenges in purchasing niche meats? CONCLUSION: Thank them for their time, remind them that their answers will be kept confidential, discuss any follow-‐up, and ask if they want a summary report.

84
References Bauer, Michael. 2001. “101 Reasons We’re America’s Culinary Mecca.” San Francisco Chronicle, Feb. 7. Accessed 2-‐29-‐08 at: www.sfgate.com/cgi-‐bin/article.cgi?file=/chronicle/archive/2001/02/07/FD164637.DTL Belasco, Warren. 2007. Appetite for Change. Ithaca, NY: Cornell University Press. Burros, Marian. 2007. “Preserving Fossil Fuels and Nearby Farmland by Eating Locally.” New York Times. April 25. Accessed 3-‐1-‐08 at http://www.nytimes.com/2007/04/25/dining/25loca.html. Chandon, P. et al. 2005. “Do Intentions Really Predict Behavior? Self-‐Generated Validity Effects in Survey Research.” Journal of Marketing 69 (April): 1-‐14. Food Marketing Institute and American Meat Institute. 2007. “The Power of Meat: An In-‐Depth Look at Meat Through the Shoppers’ Eyes.” Arlington: VA. Food Marketing Institute/AC Nielsen. “Natural, Organic Labels Bring Gilt Edge to Beef.” Facts, Figures and the Future, June 12, 2006. http://www.factsfiguresfuture.com/archive/june_2006.htm, accessed February 9, 2007. Grunert, K.G. 1997. “What’s in a steak? A cross-‐cultural study on the quality perception of beef.” Food Quality and Preference 8:157-‐174. Guthman, Julie. 2003. “Fast food/organic food: reflexive tastes and the making of ‘yuppie chow’.” Social and Cultural Geography 4:1. Gwin, Lauren. In review. “Scaling up sustainable livestock production: innovation and challenges for grass-‐fed beef in the U.S.” Unpublished manuscript, on file with author. Gwin, Lauren et al. 2005. “Alternative Livestock Production and Marketing.” University of California Cooperative Extension: Novato, CA. Halweil, Brian. 2002. Home Grown: The Case for Local Food In a Global Market. Worldwatch Paper 163. Washington, D.C. Hartman Group. 2008. Consumer Understanding of Buying Local. Bellevue, WA:The Hartman Group.. Hopkins, Jim. 2003. “‘Slow Food’ movement gathers momentum.” USA Today. P. 1B. November 26. Kingsolver, Barbara. 2007. Animal, Vegetable, Miracle. New York: Harper Collins. Kleber, Kristin et al. 2007. Analysis of the Organic and Natural Beef Supply Chain for Om Organics. Stanford University: Palo Alto, CA.
85
Lorenzen, C.L., R. K. Miller, J.F. Taylor, T. R. Neely, J. D. Tatum, J. W. Wise, M. J. Buyck, J. O. Reagan, J. W. Savell. 2003. “Beef customer satisfaction: trained sensory-‐panel ratings and Warner-‐Bratzler shear force values.” Journal of Animal Science. 81(1): 143-‐149. Lorenzo, Connie, et al. 2007. Feasibility of a Natural Meat Industry in Humboldt County. North Coast Small Business Resource Center: Eureka, CA. McNamee, Thomas. 2007. Alice Waters and Chez Panisse. New York: The Penguin Press. Mintel. 2006. Organic Foods – US. Chicago: Mintel. Quoted in Knudson, William A. 2007. The Organic Food Market. The Strategic Marketing Institute, Michigan State University: East Lansing, MI. Morwitz, V.G. and G.J. Fitzsimons. 2004. “The Mere-‐Measurement Effect: Why Does Measuring Intentions Change Actual Behavior?” Journal of Consumer Psychology 14(1&2): 64-‐74. Nabhan, Gary. 2002. Coming Home to Eat. New York: W.W. Norton. National Cattlemen’s Beef Association. 1999. NCBA News, various issues. National Cattlemen’s Beef Association. 2007. Natural/Organic Niche Continues to Grow. http://www.beefretail.org/reseNaturalOrganicNicheContinuestoGrow.aspx (accessed November 11, 2007-‐-‐draws on FreshLook Marketing Data). National Meat Case Study. 2007. Accessed December 10, 2007, at http://www.beefretail.org/reseNationalMeatCaseStudy.aspx. Pirog, R. et al. 2003. Ecolabel Value Assessment: Consumer and Food Business Perceptions of Local Foods. Ames, IA: Leopold Center, Iowa State University. Pirog, Richard and Andy Larson. 2007. Consumer perceptions of the safety, health, and environmental impact of various scales and geographic origin of food supply chains. Leopold Center for Sustainable Agriculture: Ames, IA. Pollan, Michael. 2006. The Omnivore’s Dilemma. New York: Penguin Press. Roosevelt, M. 2006. “The Lure of the 100-‐Mile Diet.” Time Magazine. June 11. Accessed 3-‐1-‐08 at http://www.time.com/time/magazine/article/0,9171,1200783,00.html. Saekel, Karola. 2005. “Culinary Pioneers: From Acme bread to Zuni Café, the Bay Area has shaped how America eats.” San Francisco Chronicle. Sept. 7. Accessed 2-‐29-‐08 at http://www.sfgate.com/cgi-‐bin/article.cgi?f=/c/a/2005/09/07/FDGPVEF5U11.DTL Wright, M. and M. MacRae. 2007. “Bias and variability in purchase intention scales.” Journal of the Academy of Marketing Science 35:617-‐624.

86
Economic Analysis of North Coast Multi-species Niche Meats Processing Facility Author: Shermain Hardesty The economic analysis presented in this section was prepared using the findings from the potential livestock supply study and the facilities and process design study (Facility Group’s Master Plan Report). We included three components in this analysis: assessment of risk factors, financial capital structure and availability, and the project’s impact on the local economy. Each is presented below in a separate section, followed by a conclusion of the economic issues associated with the project. We based this economic analysis on the ~$18.0 million estimates for the Master Plan project budget for the processing facility, which was provided by the Facility Group in its final report dated March 31, 2008. The estimate is for a 44,000 square foot facility that includes livestock receiving and holding areas, two kill and evisceration lines for beef and lamb, carcass chill coolers, by-‐products processing, fabrication and further processing and packaging, fresh meat and fresh product storage, administrative office space and employee welfare space. The estimate does not include land acquisition costs for the Facility site, located at an undetermined location on the North Coast. The Facility has a minimum estimated life of at least forty years. Various types of risk factors were examined—including those related to the project development and to the ongoing operations of the Facility. Our review of the capital structure and availability is largely dependent on the findings of the Facilities and Process Design Study; reliable cost estimates for land, plant construction, equipment and operations are essential for determining the amounts of investment capital and working capital needed. We examined both private and public funding sources for this economic development project. Our assessment of the Facility’s local economic impact included the traditional measures: output (gross sales of the new plant); jobs created; labor income; and value added (the sum of all wage and salary payments made to workers, normal profits accruing to investors and tax payment made by individuals to governments). We applied an input-‐output framework to conduct this review.
Executive Summary
• Risk management is critical for this long-‐term project, given its $18.0 million Master Plan budget and additional land acquisition costs. The Facility faces risks during the planning and construction phase; most of them should be avoidable with thorough pre-‐development analysis and project management.
• The Facility’s ongoing internal risks can be minimized by hiring experienced management and maintaining the facility in good operating condition. Continual evaluation of operations and contingency planning will reduce potential losses associated with internal risks.
• External risks arise from events either upstream or downstream in the supply chain and are
considerably more difficult to mitigate. Thus, the Facility needs to have a strong trends monitoring program and be willing to shift its product line to respond to changing market conditions, as well as regulatory requirements.

87
• Both internal and external risks need to be addressed in depth prior to developing financing proposals for the Facility.
• There are numerous private and public potential funding sources for the Facility. Its environmental
and social features will enhance the fundability, particularly since there is growing support for smaller-‐scale regional food processing facilities.
• A mix of funding sources appears to be the most likely. Potential private sources include regional
banks, specialized banks such as Shorebank, RSF and CoBank, socially-‐minded venture capitalists, ranchers (even if the Facility is not structured as a rancher-‐owned cooperative) and preferred stock. The 2008 Farm Bill provided for loan guarantees for businesses involved in local and regional food distribution; this should enhance the possibility of obtaining bank loans. Public funding sources include USDA’s Rural Business Enterprise Grants and Value Added Program Grants, industrial revenue bonds and Community Development Block Grants. Mountain States Lamb, Country Natural Beef and West Liberty Foods are examples of producer-‐owned meat marketing ventures that have been innovative in obtaining financing.
• We estimated that the direct economic impact of the facility construction activities is likely to be
less than $7 million for the total $18 million project, primarily because many of the inputs, such as equipment and labor, are specialized and will be brought in from other regions.
• We applied the widely-‐used software program, IMPLAN, which utilizes input-‐output analysis to take
into account the ripple effects of the economic activity in the 10-‐county region associated with the increased values of meat processing and livestock production attributable to the Facility. There were two livestock industries: cattle ranching and other livestock (includes sheep, hogs, goats, and various minor species, but not poultry). IMPLAN incorporates the project’s direct, indirect and induced effects. The direct effects represent the direct output of a particular industry (such as animal slaughter). The indirect effects reflect the local inputs required to produce the direct effects; for example, in order to operate the animal slaughter plant, the plant must purchase products, raw materials and services from other companies. The induced effects measure the results of local household spending on goods and services resulting from the labor income generated through the direct and indirect effects. The sum of the direct, indirect and induced effects is the total economic effects.

88
• IMPLAN calculated the following multipliers of economic activity for the region:
Multiplier EMPLOYMENT (full time job equivalents) Cattle ranching and farming 1.4 Animal production, except cattle and poultry 1.2 Animal, except poultry, slaughtering 2.9 LABOR INCOME Cattle ranching and farming 3.8 Animal production, except cattle and poultry 2.2 Animal, except poultry, slaughtering 2.1 TOTAL VALUE ADDED Cattle ranching and farming 6.0 Animal production, except cattle and poultry 3.3 Animal, except poultry, slaughtering 2.5
For example, the cattle ranching employment multiplier of 1.4 means that for every full-‐time equivalent job added in cattle ranching, a 0.4 job is created in other industries in the region. The labor income multiplier of 3.8 means that for every $1.0 million of increased cattle ranching output, $2.8 million of labor income is generated within the region annually. Similarly, the 6.0 value-‐added multiplier for cattle ranching implies that every $1.0 million of value added in cattle ranching through employee compensation, indirect business taxes, proprietary and other property type income results in $5.0 million of value added in other industries within the region.
• We estimated that the gross value of livestock sales in the region would increase from $15.8 million to $29.0 million annually, and that the Facility would produce $58.2 million of slaughtered and processed meat.
• Based on the calculated multipliers and our estimated values for livestock production and meat
processing, we determined that the establishment of the Facility would generate an additional 682 full-‐time equivalent jobs (a 10% increase, with only 44 of the jobs directly attributable to the Facility), labor income would rise a net $16 million (a 31% increase) and the total value added to the regional economy by the three industries would increase by 47% ($23 million).
Assessment of Risk Factors Affecting Project Feasibility
The Facility is a long-‐term project with an $18.0 million master plan budget plus land acquisition costs. There are various risk factors associated with this project that affect its feasibility and viability. The risk factors can be initially categorized into two phases-‐-‐those occurring during the facility’s planning and construction, and then during its operation. Risks for each phase are listed below and discussed briefly. Planning and Construction Phase Risks
• Obtaining appropriate site—the site needs to be zoned for the proposed type of use (or have a strong likelihood of obtaining such zoning) and have access to the necessary support services, such as sewer, water and major roads
89
• Financing availability (this is addressed in the following section on capital structure)
• Availability of specialized construction labor and equipment
• Regulatory delays — since animal slaughter is a contentious issue and sewer and water access can be very costly, extensive project management is essential during the pre-‐development phase of this project
• Cost overruns — as noted on pages 1-‐2 of the Facility Group’s final report, the $18.0 million
Master Plan project budget should be evaluated and that a contingency be included “…to allow for flexibility in dealing with site and process adjustments that may be required once a site is selected and the process design development has been fully coordinated…” (Facility Group, page 1-‐2).
• Planning oversights — the pre-‐development phase project management noted above should
minimize these The risk factors associated with the facility’s ongoing operations are divided into two categories: internal and external (Kiser and Cantrell, 2006). Internal risks are those within the control of the company that operates the facility; they have some potential for mitigation. They can be classified into the following categories: Internal Risks
• Business risks — caused by changes in key personnel or administrative processes, such as communications with ranchers regarding animal delivery schedules
• Processing risks — caused by disruptions of plant operations, such as an employee shortage due
to a flu outbreak.
• Planning and control risks — caused by inadequate assessment and planning, such as failure to recognize the need to schedule more employees for a shift because some employees will be attending training programs.
Internal risks can be reduced by hiring experienced management and maintaining the Facility in good operating condition. Continual evaluations of the operations and contingency planning will minimize the potential losses associated with internal risks. External risks result from events either upstream or downstream in the supply chain, and are considerably more difficult to mitigate. There are five main types of external risk:
External Risks
• Demand risks—due to the unpredictable nature of customer demand. While the demand for meat cuts for barbequing can be expected to increase during the summer months, an unanticipated event, such as a poultry-‐related E. coli outbreak, could cause a sharp increase in the overall demand for beef.
• Supply risks—caused by disturbances in the flow of product within the supply chain, such as
delays in the delivery of animals due to the closure of a major road near the Facility.

90
• “Environmental” risks—these originate from outside of the supply chain. Common sources
include economic, social, government and climatic factors. For example, USDA could change the regulations defining “grass fed.”
• Business risks—related to factors such as suppliers’ financial or management stability, such as
the decision of the new manager of a large ranch to shift to a different processor.
• Physical plant risk—caused by the physical condition of the facility, such as a blockage in the sewer system.
While there is no way to control these external risks, appropriate planning processes can be used by developing contingency plans to minimize the disruptions caused by such risks. Also, there is overlap in the risk areas; disasters often occur because of the combined effects of these factors. For example, if the facility had only one rancher supplying all of its organic beef while its single large customer for organic beef decided to have an unplanned promotion for organic beef, then any disruption in the operations of the organic beef rancher would make the facility highly vulnerable to losing its large organic beef customer. “Environmental” risks can be particularly significant in the long-‐term for a niche meats processing facility. Over time, some niche products can become commodities, which could adversely impact the facility since it is not designed to compete against low-‐cost operations. Similarly, other products can lose favor with consumers. Thus, the Facility needs to have a strong trends monitoring program and be willing to shift its product line to respond to changing market conditions, as well as regulatory requirements. Both internal and external risks need to be addressed in depth prior to developing financing proposals for the Facility.
Financial Capital Structure and Availability
Given the relatively high project cost, it is highly likely that multiple sources of capital will be needed to fund the Facility. Reliable cost estimates for land, plant construction, equipment and operations are essential for determining the amounts of investment capital and working capital needed. As discussed in the next section of this report regarding regional economic impacts (Section 9.4), the Facility qualifies as an economic development project. It has significant social capital features (humane and environmentally friendly slaughter, substantial pollution controls, environmentally sound waste emissions and natural resource utilization practices, and employee-‐friendly management philosophies) that should make it attractive to private social capital funds, as well as government grant programs. As discussed below, both private and public funding sources should be considered for this project.
Private Funding Sources
Private funding sources include banks, venture capital funds, investment from ranchers and preferred stock. Banks

91
Numerous banks provide loans for food processing facilities. Since the proposed project is associated with a new entity, specialized banks are likely to be more receptive. This includes regional banks, such as Umpqua and North Valley. Shorebank differentiates itself as a lender with strong environmental values. It strives to meet three objectives simultaneously: building wealth for all in economically integrated communities, promoting environmental health and operating profitably (Shorebank, 2009). Other lenders with similar objectives include RSF Social Finance and Washington, DC-‐based NCB. RSF is based in San Francisco; it provides medium-‐ and long-‐term asset-‐backed loans at variable or fixed rates, typically ranging from $200,000 to $5 million. While the Farm Credit System’s Cobank is focused on agricultural cooperatives as its primary clientele, it also lends to other agribusinesses. Headquartered in Denver with an office in Sacramento, it is cooperatively-‐owned. Venture Capital As noted above, several of this project’s features could qualify it for partial or complete funding through social venture capital programs. In particular, Investors' Circle is a network of over 200 angel investors, professional venture capitalists, foundations and others using private capital to promote the transition to a sustainable economy. It is striving to steer meaningful quantities of investment capital and sustainable capital to build local food systems, enabling “…the financial and cultural transformation toward rebuilding social and environmental relationships that industrialization has destroyed” (Weiss, 2008). The founder of Investors’ Circle, Woody Tasch, noted that Investors’ Circle is developing small food enterprises as a new asset class, and specifically mentioned local meat processing facilities He expected highly diversified portfolios of small food enterprises to generate modest but predictable long-‐term returns that will look increasingly attractive in the years to come.
Rancher Investment
The individual ranchers who utilize the facility, both as suppliers of livestock and as users of the facility’s custom slaughter and processing services, should be considered as potential sources of capital for the facility. However, as discussed in the Potential Livestock Supply section, this option may be limited given the elderly profile and limited gross farm incomes of most of the ranchers who responded to the UCCE survey. Traditionally, agricultural producers have invested in processing facilities by being members of an agricultural cooperative. The Facility could be owned partially or completely by an agricultural cooperative; that is, the ranchers who used the Facility would be members of the cooperative. As members, they would be required to provide the cooperative’s equity capital; this is the member-‐financed feature of a cooperative. Alternatively, the ranchers could form a limited liability corporation (LLC), which is a specialized form of a partnership. Typically, a producer-‐owned LLC has less rigid structural features and offer greater liquidity than a cooperative; in particular, the owners’ capital investment in an LLC does not need to be proportionate their use of the facility. Given the significant amount of equity capital needed to fund this facility, it is likely that the producer cooperative or LLC could be an equity partner in the facility with venture capitalists or other investors. With such a shared ownership structure, the cooperative would have less governance power, as well as less financial commitment, than if it were the sole owner of the facility. Mountain States Lamb and Wool (MSL&W) is an example of the flexibility provided by the LLC structure over the traditional cooperative structure. Mountain States Lamb Cooperative was organized in 1999 as

92
a traditional, producer-‐owned cooperative by sheep ranchers and feeders in several Western States to develop lamb and sheep products and markets for those products. MSL&W was formed in 2001 after the state of Wyoming adopted the “Wyoming Processing Cooperative Statute” which allows individuals who are not ranchers to be investors in a cooperative (Hardesty, 2004). MSL&W was organized as a separate entity by Mountain States Lamb Cooperative, which is its sole member. A total of 450,000 shares of Class A stock were sold to ranchers at $22 per share, generating $9.9 million in equity capital. These shares entitle and obligate the share owner to deliver one lamb to the co-‐op for every share owned. They can be bought and sold among members as ranchers’ livestock delivery volumes change. The share value changes with market conditions and the cooperative’s financial performance. Class B shares were also sold; they have a guaranteed return of 8% but do not have voting privileges or lamb delivery obligations. Approximately 75% of Class B shareholders also own Class A shares and about 80% of the equity in MSL&W is held by Class A members (Boland, Bosse and Brester, 2007). In March, 2003, MSL&W created a joint venture, Mountain States Rosen (an LLC) by buying a 50% interest in B. Rosen & Sons, a leading supplier to processed lamb meats and products which markets much of its product under the Cedar Springs brand. Lambs are slaughtered at a Swift facility in Greeley, Colorado and processed at Rosen processing and distribution facilities in Greeley and New York. Most MSL&W carcasses are marketed on the West Coast and members share in the profits of Mountain State Rosen’s eastern operations (Boland, Bosse and Brester, 2007). Rancher-‐members of Oregon Country Beef (operating under the name Country Natural Beef) have relatively little equity capital invested in their cooperative. Instead, most of their capital is invested in the production costs they incur while raising their animals. The cattle are fed only a vegetarian diet and raised with no antibiotics or hormones. Oregon Country Beef does not own any feedlots or processing facilities; instead, it contracts for these services. Currently, the members’ cattle are finished at the Beef Northwest Feeders feedlot in Boardman, Oregon and slaughtered and processed at AB Foods (operating as Washington Beef) in Toppenish, Washington (Oregon Country Beef, 2009). The cooperative’s primary purpose is to enhance returns to members by controlling the production, processing and marketing of each animal from birth to the retailer cooler. Many of the members are actively engaged in promoting the Country Natural Beef brand; they are frequently seen talking to consumers at grocery stores throughout the West Coast (known fondly by members as “marketing blitzes”.) Oregon Country Beef is committed to long-‐term relationships with its affiliated feedlot company, slaughter and processing company and retail and foodservice customers. Its customers have agreed to adjust the prices they pay for Oregon Natural Beef as cattle production and processing costs change, because they support the values embraced by the rancher-‐members. This type of relationship is known as a “values-‐based supply chain.” More information about values-‐based supply chains is available at the web site organized by agricultural researchers across the nation, http://www.agofthemiddle.org/. Preferred Stock Preferred stock is also a potential source of equity capital for this project. The dairy marketing cooperative, CROPP, which operates as Organic Valley, is using a unique form of relationship financing to capitalize its growth. It began selling Class E, Series 1 preferred stock in May of 2004. Almost $16 million of stock has been sold in 23 states and the District of Columbia (Figenbaum, 2009.) Organic Valley markets its products extensively through consumer cooperatives, many of which have purchased the stock along with their individual consumer members. The minimum purchase of the non-‐voting stock is $5,000, or 100 shares; the quarterly dividends provide a 6% annual rate of return. As a Section 521 cooperative, Organic Valley is exempt from securities registration requirements. Organic Valley’s CEO

93
noted that the preferred stock offers shareholders steady long-‐term financial value and social/environmental returns without forecasting big year-‐over-‐year growth (Figenbaum, 2009). New USDA Loan Guarantee Program Loan Guarantees can enable firms to obtain loans that they would otherwise not be able to secure. The 2008 Farm Bill provided for loan guarantees for businesses involved in local and regional food distribution, processing, aggregation, and marketing. These guarantees are designed to secure private bank loans of up to $5 million to receive an 80% guarantee. The maximum loan value is $25 million, and up to $40 million for cooperatively-‐organized entities of agricultural ranchers. The average loan value being guaranteed by this program is for $2 million. The projects must be located in rural areas, but there are criteria which can allow producer-‐owned cooperative entities and other urban-‐located cooperatives to be eligible. The “rural” definition includes communities of “rural character.” (USDA-‐Rural Development, 2008).
Public Funding Sources
As described below, there are three primary public sources available to provide financing for the Facility: USDA Rural Development grants, industry development bonds and community development block grants. There is potential for this project to receive funding through a new rural business development initiative under the national Economic Stimulus Program. USDA’s Rural Business Enterprise Grants Program (RBEG) Infrastructure costs could potentially be funded using the RBEG program. Examples of eligible uses for the RBEG program include: acquisition or development of land, easements, or rights of way; construction, conversion, or renovation of buildings, plants, machinery, equipment, access streets and roads, parking areas, utilities; pollution control and abatement; and capitalization of revolving loan funds including funds that will make loans for start-‐ups and working capital (USDA-‐Rural Development, 2009) USDA’s Value Added Producer Grants Program (VAPG) A portion of the planning activities and operating capital for the Facility could be funded through USDA’s Value Added Producer Grants Program, which issues a call for proposals once a year. Eligible projects include those for marketing value-‐added agricultural products. Eligible applicants are independent producers, farmer and rancher cooperatives, agricultural producer groups, and majority-‐controlled producer-‐based business ventures (USDA—Rural Development, VAPG, 2008). Industrial Development Bonds Industrial development bonds (IDBs) can be issued to provide up to $10 million in financing for processing plants; up to 25% of the bond proceeds may be used for land acquisition. The bond maturity cannot exceed 40 years. Benefits of IDBs include interest rates considerably below standard commercial lending rates and long-‐term loans with no balloon or prepayment penalty. Criteria for the issuance of IDBs include public benefits associated with job creation or retention, community economic need and average hourly wage paid to workers; the state is currently considering a proposal to include environmental stewardship criteria. The interest received by bondholders is exempt from both state and federal income taxation. In 2008, California’s Industrial Development Financing Advisory Commission approved the issuance of IDBs totaling $118.3 million for 18 projects.

94
Community Development Block Grants Depending on where this project is located, a portion of its development costs could potentially be covered by Community Development Block Grant (CDBG) funds from the Federal government. The CDBG program allows a city or county to issue grants to local organizations for the implementation of eligible CDBG activities including construction or improvement of public facilities and infrastructure such as streets, sidewalks, sewers and storm drainage, economic development, revitalization efforts, and other activities that benefit low and moderate-‐income individuals and areas. Other Potential Public Funding California could follow Iowa’s lead and established a program similar to Value-‐Added Agricultural Products and Processes Financial Assistance Program (VAAPFAP), which Iowa created in 1994. Iowa’s current economic development program, Iowa Values Fund, has a $35 million annual allocation, part of which is used to fund VAAPFAP (Iowa Department of Economic Development, 2008). No project can receive more than 25% of the program’s annual allocation; private matching funds are required. One of the VAAPFAP’s categories is “Organic Processing and Emerging Markets.” Iowa’s West Liberty Foods is an excellent example of public-‐private ownership. When Oscar Mayer announced that it was closing its processing plant in West Liberty, Iowa at the end of 1996, turkey growers recognized the need to retain a market for their turkeys and organized themselves as a cooperative. In less than a year, financing totaling $16.2 million was raised, divided among more than 16 million shares held by 45 individuals representing 47 enterprises. The financing package included (Holmes and Curry, 2001):
• $2.4 million in cash equity provided by the cooperative’s members • $900,000 grant and loan package from Iowa’s Department of Economic Development (IDED)
through its VAPPFAP program
• $875,000 in forgivable loans from Iowa’s Dept. of Economic Development’s Economic Set-‐Aside Program (using the city of West Liberty and Muscatine County as sponsors)
• $50,000 low interest loan from Iowa Corn Promotion Board
• $50,000 loan from Muscatine County
• $75,000 loan from the city of West Liberty
• $1.25 million loan from the Iowa Farm Bureau Federation
• $15,000 grant from the Iowa Turkey Federation
• $8.0 million loan from Norwest Agricultural Credit
• USDA-‐Rural Development guaranteed 70% of an additional $7.0 million loan from Norwest.
West Liberty Foods endured three recapitalizations during its early years of operation. Originally, members were required to contribute $1 in equity for each bird they processed. A liquidity crisis caused the cooperative to require an additional $1 equity for each bird processed, followed by an additional $1 per bird assessment in the following year. Currently, the unit delivery price paid to members is specified

95
in advance and the cooperative no longer shares the input costs. West Liberty Foods owns and operates three processed meat plants in Iowa and opened a $70 million facility in Utah in 2007 (West Liberty Foods, 2008). The company specializes in slicing and co-‐packing cooked red meat and poultry products, and processed 217.5 million live pounds in 2008.
Regional Economic Impact of Proposed Facility
Public funding programs are often interested in the economic impact a project is expected to have on the local economy. We examined both the direct and indirect impacts of the Facility on the local economy. We defined “local” as the combined Tier 1 and Tier 2 counties previously defined in this report-‐-‐Mendocino, Sonoma, Marin, Napa, Lake, Colusa, Glenn, Yolo, Solano and Contra Costa. First, we derived a simple estimate of the impact of the project construction. Next, we applied an input-‐output framework to assess the economic activity generated by the Facility’s ongoing operations.
Construction Impacts
The impact of the project begins with the construction of the facility. The expenditures included in the Master Plan project budget (without land acquisition costs) of $18.0 million estimated by the Facility Group are listed below.
Table 23: Projected Master Plan Budget
Architectural, engineering and construction mgt. services $1,753,000
Site work $831,000
Wastewater treatment equipment and installation $1,567,000
Building construction $6,997,000
Process Support Utilities $825,000
Refrigeration system equipment and installation $2,177,000
Plant equipment acquisition $2,840,000
Plant equipment installation $972,000
TOTAL PROJECT $17,962,000
It is likely that most of the equipment will be manufactured outside of the region, since it is highly specialized. Similarly, much of the architectural and engineering services will also be procured from outside of the region. The elements that are most likely to be sourced within the region are site work and portions of the building construction expenses-‐-‐particularly the labor and the process support utilities. Thus, we estimate that the direct economic impact of the facility construction activities will be $7 million or less for the total $18 million project. Most of the project’s economic impact will occur because of the facility’s ongoing operations, rather than the one-‐time construction activities. We excluded these construction activities from the remainder of our analysis of the economic impacts of the proposed facility.
Input-‐Output Analysis of Ongoing Activities
IMPLAN software There are two major sources for the ongoing economic impacts related to the Facility: the plant operations and associated livestock production activities. Both types of economic activity are analyzed

96
using an input-‐output analysis software program, IMPLAN Pro® version 2.0 (IMPLAN), and the accompanying 2002 dataset. IMPLAN determines multiplier effects by modeling the interrelationships between various economic sectors. The data sources used to drive the model include the US Bureau of Economic Analysis, the US Bureau of Labor Statistics, the US. Census Bureau and the USDA (Lindahl and Ohlson, undated). We applied the multiplier values derived by IMPLAN to calculate estimates of annual economic activity in the local economy, based on the specific employment and production values we have projected for the Facility. IMPLAN divides the economy into 20 sectors comprised of a total of 509 industries. The three industries of direct interest for this study are: “animal, except poultry, slaughtering” (which also includes meat cutting and processing that is conducted in slaughtering plants); “cattle ranching and farming”; and “animal production, except cattle and poultry” which we will refer to as “other livestock production”. The specific components of each industry are listed in the Appendix for this section. Unfortunately, dairy cattle are included within “cattle ranching and farming”. “Other livestock production” includes aquaculture, horse and pet breeders, and apiaries, in addition to sheep, goats and hogs; however, it is not likely that these “irrelevant” species had much impact in this analysis. The specific components of the IMPLAN processing industry “Animal, except poultry, slaughtering” appear to be a good match to the expected activities involved in the proposed facility. For each industry, IMPLAN measures the value of production, jobs, labor income and value added directly on the entire economy in a specific region (such as a county, group of counties, state or larger area), which is the 10-‐county region for this analysis. IMPLAN also calculates the same indicators after taking into account the ripple effects of the economic activity—direct, indirect and induced effects. The direct effects represent the direct output of a particular industry (such as the gross revenues of an animal slaughter/processing facility). The indirect effects reflect the local inputs required to produce the direct effects. For example, in order to operate the animal slaughter plant, the plant must purchase products, raw materials and services from other companies. The induced effects measure the results of local household spending on goods and services resulting from the labor income generated through the direct and indirect effects. The sum of the direct, indirect and induced effects is the total economic effects. These effects are used to calculate different multipliers. A multiplier measures the total impact of a change in a given economic activity. It is calculated by dividing the total economic effect by the initial change, or direct value. Three multipliers are commonly used to assess impacts of an initial increase in production (or processing): employment, income and value-‐added. An employment multiplier of 1.5 means that for every job in the meat slaughter industry, an additional 0.5 jobs are created in the remainder of the local economy (due to related activities, such as the need for trucking and sanitation services.) The income multiplier reflects the total increase in labor income in the local economy resulting from a one dollar increase in income received by workers at the meat slaughter and processing facility. Finally, the value-‐added multiplier measures the additional value added to the product as a result of this economic activity. IMPLAN (Lindahl and Ohlson, undated) defines “value added” as including employee compensation, indirect business taxes, proprietary and other property type income. Employee compensation includes wages, salaries and benefits. Indirect business taxes consist primarily of sales and excise taxes. Proprietary income is income produced by self-‐employed individuals (such as ranchers). Other property type income consists of royalty payments, rents and dividends, including corporate profits. It is unlikely that there is proprietary income associated with the meat processing facility, but land lease payments are likely to be involved with ranching.

97
IMPLAN is designed to capture the linkages between different industries in a local economy, as illustrated in Figure 9. It demonstrates how a basic industry, such as cattle ranching, can be linked to household income in the local area, and the household component of final demand reflects how cattle ranching is impacted by local household spending. Changes in the cattle ranching industry affect other industries of the local economy through the linkages indicated. Estimating such effects is the focus of economic impact analyses.
Figure 9: Input and Output Flows in a Local Economy
Source: Fadali and Harris, 2005, p. 12.
The Approach
Our analysis is predictive, rather than descriptive, since the Facility is yet to be built. Given its progressive design, the most similar facility is probably in New Zealand. Thus, we lack the actual data to “plug into” the IMPLAN model regarding the actual flow of activity that would occur in the Tier 1 and Tier 2 counties with the establishment of the Facility; our analysis will provide only a rough estimate of

98
the Facility’s economic impacts. As previously noted there are two major components of the economic impact of the proposed facility — the plant operations and associated livestock production activities.
Geographic Area Multipliers
The multipliers calculated through IMPLAN are reported in Table 24 and discussed below, followed by the estimated impacts of the processing facility. Multipliers were derived for the Tier 1 and Tier 2 counties combined. To simplify the presentation in Table 24, we rounded off the values to the nearest tenth value, although the actual impact calculations were derived and applied using values to six decimal points.
Table 24: Economic Impact Effects and Multipliers15 Tiers 1 and 2 Combined
Direct Effects
Indirect Effects
Induced Effects
Total Effects Multiplier
EMPLOYMENT Cattle ranching and farming 17.5 4.9 1.9 24.3 1.4 Other livestock production 35.7 4.0 2.3 42.1 1.2 Animal, except poultry, slaughtering 2.7 3.7 1.5 7.9 2.9 LABOR INCOME Cattle ranching and farming 0.1 0.2 0.1 0.3 3.8 Other livestock production 0.2 0.1 0.1 0.4 2.2 Animal, except poultry, slaughtering 0.1 0.1 0.1 0.3 2.1 TOTAL VALUE ADDED Cattle ranching and farming 0.1 0.3 0.1 0.5 6.0 Other livestock production 0.2 0.3 0.2 0.6 3.3 Animal, except poultry, slaughtering 0.1 0.1 0.1 0.4 2.5 The direct effect value for employment in the cattle ranching indicates that 17.5 jobs are generated for every $1 million increase in cattle production, as well as almost 5 jobs in other industries within the Tier 1 and Tier 2 counties. There are 1.9 jobs resulting from the increased household spending generated by the direct and indirect effects. The employment multiplier of 1.4 for cattle ranching means that for every new job in ranching generated as a result of the new processing facility, 0.4 additional jobs are created outside of cattle ranching in the local economy. Increases in the production value of other livestock generate more jobs than a comparable increase in cattle ranching; this is probably attributable to the higher employee/revenue ratio for sheep, hogs and goats associated with their smaller size and more rapid growth. The values for the other effects and multipliers of other livestock production are similar to those for cattle production. The fact that IMPLAN includes dairy cattle and feedlots within the “cattle ranching and farming” industry may actually give us better employment multipliers for this analysis. Based on the survey findings reported in the Potential Livestock Supply section, we had concluded that additional feeding and finishing capacity will be necessary in the region to provide sufficient livestock for the Facility.
15 We are grateful to Kurt Richter, Graduate Student Researcher with the Agricultural Issues Center-‐-‐University of California, for running the IMPLAN software and deriving these estimates.

99
Additional analysis of the 2007 Census of Agriculture data indicates that the average number of employees on a beef cattle operation in California is 3.5, compared to 12.0 employees for a cattle feeding operation and 13.3 employees for a dairy operation. Thus, the unintentional inclusion of these more worker-‐intensive cattle operations within IMPLAN’s cattle industry (and the associated data in the IMPLAN model) appears to better capture the changes that will be required to increase the number of finished cattle in the region. The employment related effects in the slaughter industry are much different than those for the animal production industries; a $1.0 million increase in slaughter production is associated with an increase of only 2.7 jobs, since processing is considerably more mechanized than animal production. However, the relative values of the indirect and induced effects are higher than for animal production; the jobs multiplier of 2.9 means that for every job created in the processing industry, an additional 1.9 jobs are created in other industries within the Tier 1 and 2 counties. Clearly, there are increases in labor income associated with the jobs created. A $1.0 million increase in cattle production creates only a $100,000 increase in labor income in the cattle production industry, while a similar increase in production of other livestock generates a $200,000 increase in labor income. The higher 3.8 value for the labor income multiplier in the cattle industry, relative to the other livestock production industry reflects the mathematical impact of the lower direct effect value in the cattle industry along with similar values for the other effects (recall that the multiplier is calculated by adding up the direct, indirect and induced effects and dividing this sum by the direct effect). The economic effects associated with labor income in the slaughter industry are similar to those in the two animal production industries. Value-‐added is often the most meaningful measure of economic impact; it represents the amount an industry contributes to the economy in terms of payments to capital, labor and other forms of income (including indirect business taxes). The 6.0 value-‐added multiplier for cattle ranching means that for every $1.0 million dollars of value added in cattle production, $5.0 million dollars of other economic activity occurs within the Tier 1 and Tier 2 counties. Again, this relatively high value could be partially attributable to the high feed costs associated with dairy production and feeding operations; as discussed above, these feed costs are also relevant for our analysis since much of the increased economic activity will relate to finishing the cattle. For other livestock, such as sheep, goats and hogs, the value-‐added multiplier is still a substantial 3.3 value; again, the fact that this multiplier is lower than the comparable value for the cattle is acceptable to us because we do not expect as much incremental feeding for the “other” livestock species. Similarly, each $1.0 million of value added in meat processing generates an additional $1.5 million of economic activity within the Tier 1 and Tier 2 counties; some of this could be attributable to the production of packaging materials for the meat products, property taxes and even vehicle and gas taxes paid for transporting the processed meats. It should be noted that, in recognition of the fact that the animal production and slaughter facilities are vertically connected, animal production costs were specifically excluded in the calculation of the multipliers for the slaughter industry. Otherwise, these expenses would have been double-‐counted in our analysis. The University of California’s Agricultural Issues Center calculated even higher multipliers related to the beef and dairy cattle industry in the Central Valley (University of California, 2006). They reported the following multipliers for beef and dairy cattle industry: Employment — 2.44, Labor income — 9.00; and Value Added — 7.80. They attributed the relatively large magnitude of these multipliers partially to the fact that the IMPLAN database uses national parameters that reflect a large share of activity from “very small, part time cattle farms contributing little or no value added”. The national parameters are more

100
applicable to the types of ranchers who would be most likely to utilize the proposed meat processing facility, than to the large-‐scale cow-‐calf operations dominating California’s Central Valley. Thus, there is a logical and valid explanation of why the estimated multipliers for beef production are large.
Estimating the Economic Impact of the Meat Processing Facility
The multipliers discussed above were derived in order to estimate the dollar value of the Facility’s annual economic impact. First, we assumed that all of the 20,000 cattle and 13,800 sheep, goats and hogs processed at the Facility will be grown in the Tier 1 and Tier 2 counties. As noted in Chapter 7 regarding our survey of ranchers, 74% of the cattle and 33% of the sheep raised in these counties are sold before they reach their finish weights. With the Facility, we assumed that these animals would be kept by the ranchers until they are ready for slaughter. Thus, there is an increase in the value of these animals when they are “sold” to the Facility because of their higher weight, as well as the preservation of their niche characteristics. We obtained current sales data from USDA’s Market News service for live animals to estimate the sales values of the animals. We assumed that 45% of the Facility’s meat will be sold at commodity meat prices. Another 45% will earn the 40% premium we determined for local and naturally-‐raised beef and lamb in our Niche Meats Demand Study. We estimated that 10% of the Facility’s sales volumes will earn an organic premium of 60%. The estimated value of the output from cattle ranching and other livestock production rises by $13.2 million and the value of livestock slaughter and processing increases by $43.9 million within the region. We use the multipliers discussed above to calculate both gross and net estimated economic impacts of this increased value of production attributable to the Facility; they are displayed in Table 25. The gross economic impacts reflect the total economic activity associated with the livestock production and slaughter industries associated with this project. However, this does not reflect the incremental impact of the proposed facility. We need to subtract the impacts of the existing animal production and processing activities. The net estimated impacts dropped to approximately 60 percent of the gross economic impacts. The net impacts of economic activity associated with both the animal production and slaughter facility are substantial; 682 new jobs are projected in the 10-‐county region, which represents a 10% increase in jobs currently attributable to the three industries we evaluated (cattle production, other livestock production, and livestock slaughter and processing). Labor income is estimated to rise by $15.5 million over a variety of industries; this is a 31% gain. Additionally, the total value added in the ten-‐county region will equal $23 million annually, comprising a cumulative 47% increase among the three industries.

101
Table 25: Estimated Regional Economic Impacts of Facility Tier 1 and Tier 2 Counties Combined
Industry
Industry Output ($ mil)
Employment full time equivalent jobs
Employee Compensation
($ mil)
Total Value Added
($ mil) Cattle ranching and farming 318.3 5575.0 32.1 28.4 Direct effect 17.5 0.1 0.1 multipliers 1.4 3.8 6.0 Direct project impact 26.5 463.5 2.3 2.4 Gross multiplier effect 643.3 8.6 14.1 Current value 14.3 347.3 4.6 7.6 Net multiplier effect 12.2 296.1 4.0 6.5
Other livestock production 24.3 869.0 4.5 4.4 Direct effect 35.7 0.2 0.2 multipliers 1.2 2.2 3.3 Direct project impact 2.5 88.6 0.4 0.4 Gross multiplier effect 104.3 1.0 1.5 Current value 1.5 63.7 0.6 0.9 Net multiplier effect 1.0 40.6 0.4 0.6 Animal (except poultry) slaughter 111.1 299.0 13.1 16.0 Direct effect 2.7 0.1 0.1 multipliers 2.9 2.1 2.5 Direct project impact 58.2 156.7 7.0 8.4 Gross multiplier effect 457.9 14.7 21.2 Current value 14.3 112.5 3.6 5.2 Net multiplier effect 43.9 345.4 11.1 16.0 GROSS CUMULATIVE IMPACT 1205.6 24.3 36.7 ADJUSTED CUMULATIVE IMPACT 682.0 15.5 23.0

102
Conclusions
In addition to the regional economic impact analysis, this economic analysis covered the potential risks associated with the construction and operation of the Facility, and the financial capital and funding availability for the Facility. Many of the potential risks can be minimized with thorough pre-‐development project management and experienced managerial oversight during the Facility’s operation. Our review of private and public financing sources indicates that there are numerous avenues to be explored to fund the Facility. The Facility’s environmental and social features should enhance its funding opportunities; in particular, funding sources for local food processing are beginning to expand. A mix of sources, similar to how West Liberty Foods was financed, is probably the most likely. Some rancher investment is important; it will be viewed as a sign of commitment and confidence in the Facility. Our multiplier analysis indicates that the direct addition of the 44 jobs associated the Facility leads to the creation of 682 new full-‐time equivalent jobs and $16 million of increased labor income in the region, due to the ripple effects of the economic activity associated with the Facility. Additionally, we estimate that the Facility will generate an additional $23 million annually of total value added (including employee compensation, indirect business taxes, and proprietary and other property type income) in the region. Given the value added by the slaughter and processing activities, it is not surprising that the Facility will cause the total economic activity in the region’s slaughter and processing industry to exceed the economic activity in the combined livestock production industries in the region. These estimated economic impacts are considerable, given the $18.0 million investment required to construct the Facility. It could serve as an example of the type of project needed to remedy the economic downturn being experienced in many communities across the nation.

103
APPENDIX: Economic Analysis of North Coast Multi-species Niche Meats Processing Facility
IMPLAN Codes Source: www.IMPLAN.com
IMPLAN Industry Description: Cattle ranching and farming (combines NAICS codes 11211, 11212, 11213) Veal calf production Beef cattle feedlots (except stockyards for transportation) Cattle feedlots (except stockyards for transportation) Fattening cattle Feed yards (except stockyards for transportation), cattle Feedlots (except stockyards for transportation), cattle Dual-‐Purpose Cattle Ranching and Farming Dairy cattle farming Stocker calf production Milk production, dairy cattle Milking dairy cattle Dairy heifer replacement production Cattle farming or ranching Cattle conditioning operations Calf (e.g., feeder, stocker, veal) production Beef cattle ranching or farming Backgrounding, cattle Feeder calf production IMPLAN Industry Description: Animal production, except cattle and poultry and eggs (combines NAICS codes 1122, 1124, 1125, 1129) Sheep farming (e.g., meat, milk, wool production) Lamb feedlots (except stockyards for transportation) Dairy sheep farming Goat farming (e.g., meat, milk, mohair production) Dairy goat farming Angora goat farming Weaning pig operations Pig farming Hog feedlots (except stockyards for transportation) Hog and pig (including breeding, farrowing, nursery, and finishing activities) farming Feedlots (except stockyards for transportation), hog Feeder pig farming Farrow-‐to-‐finish operations Bison production Fox production Burro production Donkey production Horse (including thoroughbreds) production Horses and Other Equine Production Mule production

104
Fur bearing animal production Chinchilla production Royal jelly production, bees Apiculture Pony production Queen bee production Propolis production, bees Honey bee production Fur-‐Bearing Animal and Rabbit Production Bee production (i.e., apiculture) Buffalo production Other livestock Production Other Animal Aquaculture Frog production, farm raising Beeswax production Deer production Worm production Rattlesnake production Raising swans, peacocks, flamingos, or other adornment birds Llama production Laboratory animal production (e.g., guinea pigs, mice, rats) Kennels, breeding and raising stock for sale General combination animal farming Elk production Bird production (e.g., canaries, love birds, parakeets, parrots) Dog production Mink production Cricket production Companion animals production (e.g., cats, dogs, parakeets, parrots) Combination livestock farming (except dairy, poultry) Cat production Aviaries (i.e., raising birds for sale) Breeding of pets (e.g., birds, cats, dogs) Animal aquaculture (except finfish, shellfish) Alpaca production Rabbit production Earthworm hatcheries Animal Aquaculture Mohair farming Alligator production, farm raising Feedlots (except stockyards for transportation), lamb Trout production, farm raising Shrimp production, farm raising Shellfish hatcheries Oyster production, farm raising Mussel production, farm raising Mollusk production, farm raising Hatcheries, shellfish

105
Fish farms, shellfish Cultured pearl production, farm raising Crustacean production, farm raising Clam production, farm raising Finfish production, farm raising Goldfish production, farm raising Catfish production, farm raising Baitfish production, farm raising Finfish, hatcheries Crawfish production, farm raising Fish farms, finfish and Tropical fish production, farm raising Hatcheries, finfish and Tilapia production Hybrid striped bass production Ornamental fish production, farm raising
IMPLAN Industry Description: Animal, except poultry, slaughtering (same as NAICS code 311611) Variety meats, edible organs, made in slaughtering plants Lamb carcasses, half carcasses, primal and sub-‐primal cuts, produced in slaughtering plants Lard produced in slaughtering plants Luncheon meat (except poultry) produced in slaughtering plants Meat canning (except poultry) produced in slaughtering plants Meats, cured or smoked, produced in slaughtering plants Pork carcasses, half carcasses, and primal and sub-‐primal cuts produced in slaughtering plants Sausage casings, natural, produced in slaughtering plant Veal carcasses, half carcasses, primal and sub-‐primal cuts, produced in slaughtering plants Tallow produced in a slaughtering plant Inedible products (e.g., hides, skins, pulled wool, wool grease) produced in slaughtering plants Canned meats (except poultry) produced in slaughtering plants Boxed meats produced in slaughtering plants Abattoirs and Custom slaughtering Animal fats (except poultry and small game) produced in slaughtering plants Bacon, slab and sliced, produced in slaughtering plants Beef carcasses, half carcasses, primal and sub-‐primal cuts, produced in slaughtering plants Beef produced in slaughtering plants Boxed beef produced in slaughtering plants Hot dogs (except poultry) produced in slaughtering plants Cured hides and skins produced in slaughtering plants Fats, animal (except poultry, small game), produced in slaughtering plants Hams (except poultry) produced in slaughtering plants Horsemeat produced in slaughtering plants

106
References Boland, Michael A., Alena Bosse, and Gary W. Brester. Review of Agricultural Economics, 29:1 (Spring 2007), 157-‐169.
Fadali, Elizabeth and Thomas R. Harris. 2006. “Estimated Economic Effects of the Cattle Ranching and Farming Sector on the Elko County Economy.” Technical Report UCED 2005/06-‐26, University of Nevada, Reno.
Figenbaum, C. 2009. “Going Green: From Your House to the White House.” Green Money Journal, http://www.greenmoneyjournal.com/article.mpl?newsletterid=44&articleid=607
Ginder, Roger, Brent Hueth and Philippe Marcoul. 2005. Cooperatives and Contracting in Agriculture: The Case of West Liberty Foods. Center for Agricultural and Rural Development, Working paper 05-‐WP 408. http://www.econ.iastate.edu/research/webpapers/paper_12443.pdf
Hardesty, Shermain D. “New State Statute Allow For Nonmember Equity Capital for Cooperatives.”2004. http://cooperatives.ucdavis.edu/reports/report_pdf/wyomimg.htm Holmes, Mary Swalla and Daniel Curry. 2001. “Iowa Turkey Growers Cooperative and West Liberty Foods” in New Generation Cooperatives: Case Study. Illinois Institute for Rural Affairs, Western Illinois University. http://www.iira.org/pubs/publications/IVARDC_CS_198.pdf. Iowa Department of Economic Development. 2009. Value-‐Added Agricultural Products And Processes Financial Assistance Program. http://www.iowalifechanging.com/business/vaapfap.html Kiser, James and George Cantrell. 2006. “6 Steps to Managing Risk”. Supply Chain Management Review. April, 2006. Lindahl, Scott and Douglas Ohlson. Undated. The IMPLAN Input/Output System. MIG, Inc. Oregon Country Beef, 2009. (http://countrynaturalbeef.com/index.php?option=com_content&task=view&id=18&Itemid=68.) Shorebank. 2009. http://www.shorebankcorp.com/bins/site/templates/child.asp?area_4=pages/nav/story/right_side.dat&area_7=pages/titles/shore_story_title.dat&area_2=pages/about/shore_story.dat). USDA-‐-‐Rural Development, 2008. “Business Programs Farm Bill Rural Area Definition.” http://www.rurdev.usda.gov/regs/an/an4406.pdf USDA—Rural Development. 2009. Rural Business Enterprise Grants Program. http://www.rurdev.usda.gov/rbs/busp/rbeg.htm USDA—Rural Development, VAPG. 2008. Value Added Producer Grant. http://www.rurdev.usda.gov/rbs/coops/vadg.htm

107
University of California-‐Agricultural Issues Center. 2006. ““Agriculture’s Role in the Economy” in Measure of California Agriculture. http://www.aic.ucdavis.edu/publications/MOCA_Ch_5.10aPrePrint.pdf Weiss, Jean. 2008. “Is Slow Money the Future of Finance.” MSN Green. http://green.msn.com/Green-‐Living/Is-‐Slow-‐Money-‐The-‐Guture-‐Of-‐Finance/1 West Liberty Foods. 2008. “Our Story.” http://www.wlfoods.com/history.aspx