Measuring Your Department’s Progress in the Advancement of Pharmacy Practice and Patient Safety...
81
Measuring Your Department’s Progress in the Advancement of Pharmacy Practice and Patient Safety CSHP Professional Practice Conference - Jan 2006 Patricia Macgregor, Nancy Roberts Editorial Board members
-
date post
18-Dec-2015 -
Category
Documents
-
view
217 -
download
4
Transcript of Measuring Your Department’s Progress in the Advancement of Pharmacy Practice and Patient Safety...

Measuring Your Department’s Progress in the Advancement of Pharmacy Practice and Patient
SafetyCSHP Professional Practice Conference - Jan 2006
Patricia Macgregor, Nancy RobertsEditorial Board members
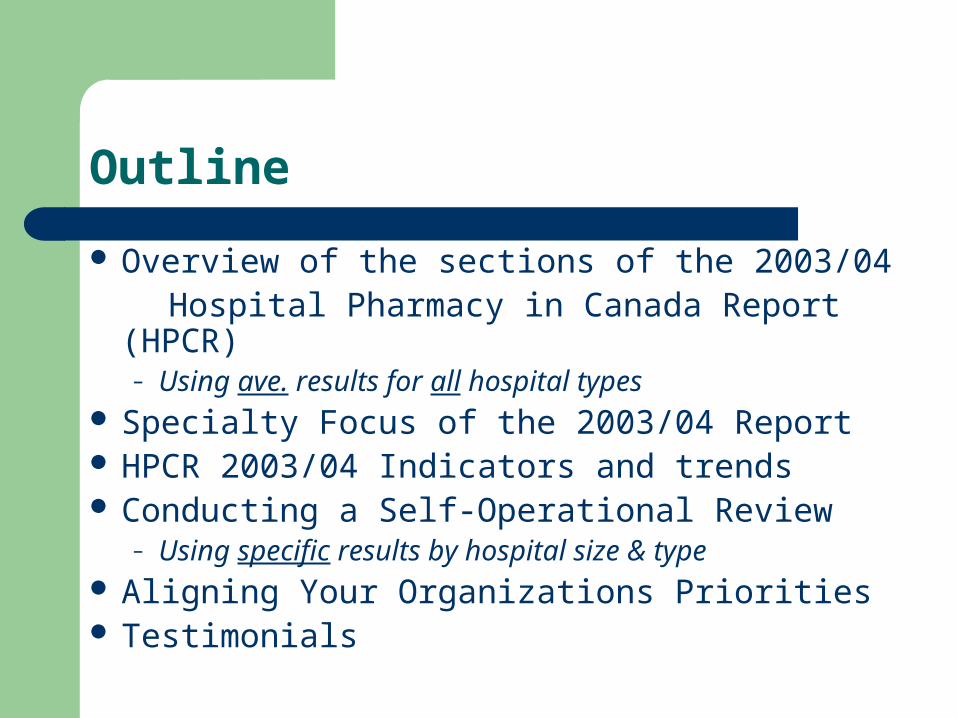
Outline
Overview of the sections of the 2003/04 Hospital Pharmacy in Canada Report (HPCR)
– Using ave. results for all hospital types Specialty Focus of the 2003/04 Report HPCR 2003/04 Indicators and trends Conducting a Self-Operational Review
– Using specific results by hospital size & type Aligning Your Organizations Priorities Testimonials

Hospital Pharmacy in Canada Report (HPCR)
Measuring hospital pharmacy progress Data collection every two years Also known as “Lilly” report
www.lillyhospitalsurvey.ca
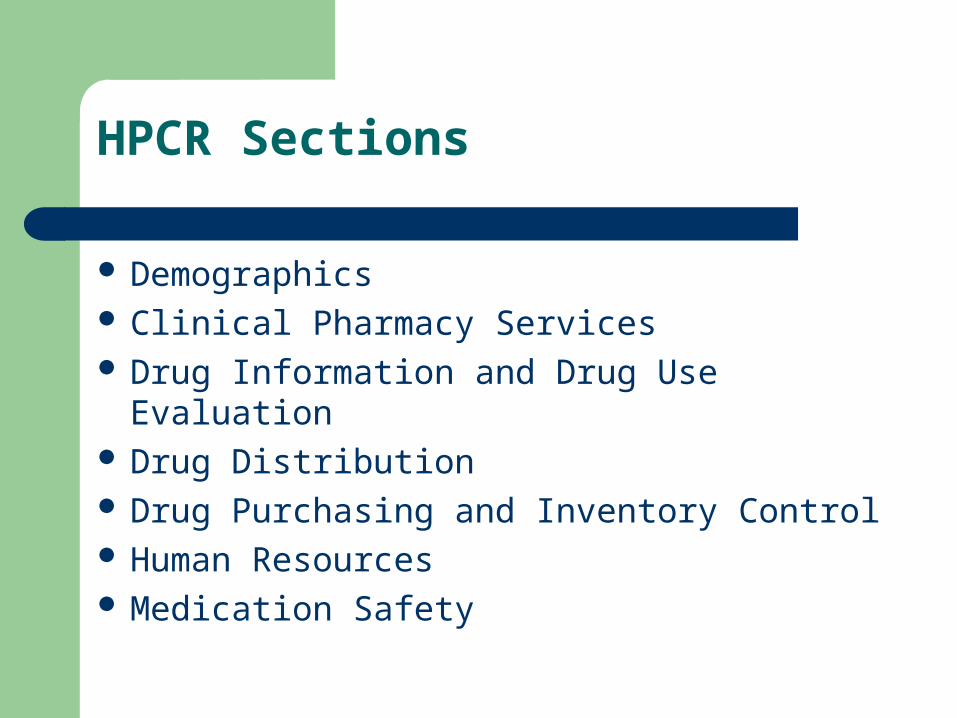
Demographics Clinical Pharmacy Services Drug Information and Drug Use Evaluation Drug Distribution Drug Purchasing and Inventory Control Human Resources Medication Safety
HPCR Sections

HPCR Sections continued
Technology Education and Research Pharmacy Staffing and Drug Costs for
Clinical Programs
- Acute Care Hospitals
- Pediatric Hospitals Benchmarking

2003/04 HPCR Report Focus
Medication safety and role of pharmacy leaders Clinical practice, direct patient care, pharmacist
prescribing Incident reporting and reduction strategies Distribution delivery systems Escalating drug costs - utilization issues Human resources – impacts of shortages Technology applications

Demographics
144 hospitals responded Nationally– Inclusion criteria – 100 beds total, 50 acute beds
77% response rate overall 59% of respondents were multi-site facilities,
similar to previous survey
(higher in BC, Prairies and Atlantic)

Clinical Data Captured
Staffing allocations per specialty program Clinical pharmacy activity by type with
occurrence rate Specific clinical activity priority and service
level Methods and types of practice evaluation Prescribing privileges by profession Pharmacist prescribing authority by activity Clinical practice models and seamless care
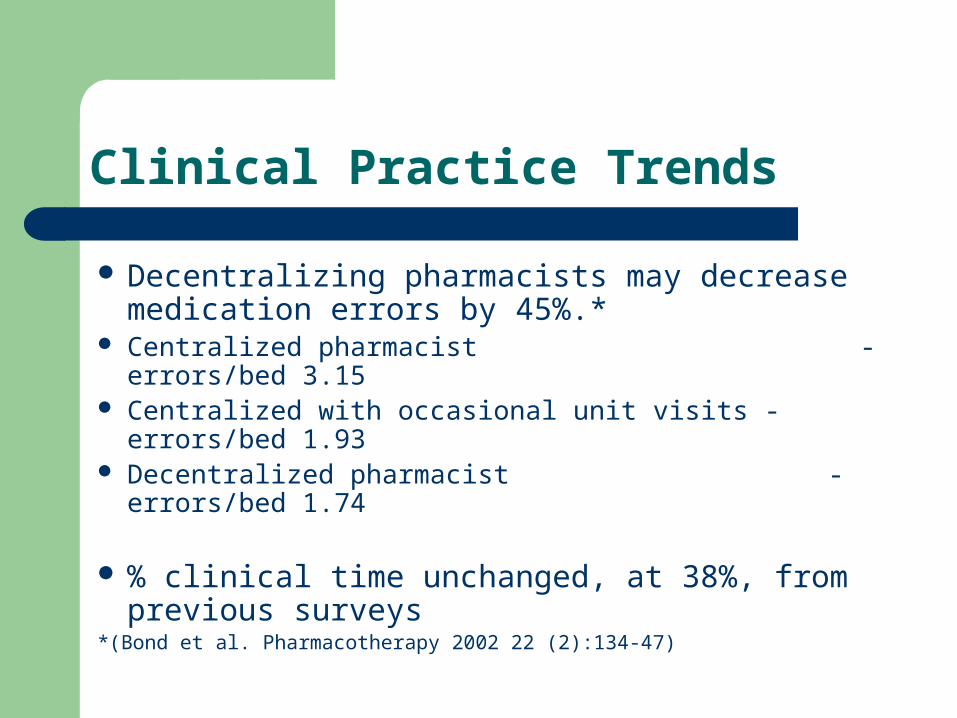
Clinical Practice Trends
Decentralizing pharmacists may decrease medication errors by 45%.*
Centralized pharmacist -errors/bed 3.15
Centralized with occasional unit visits -errors/bed 1.93 Decentralized pharmacist -errors/bed 1.74
% clinical time unchanged, at 38%, from previous surveys
*(Bond et al. Pharmacotherapy 2002 22 (2):134-47)
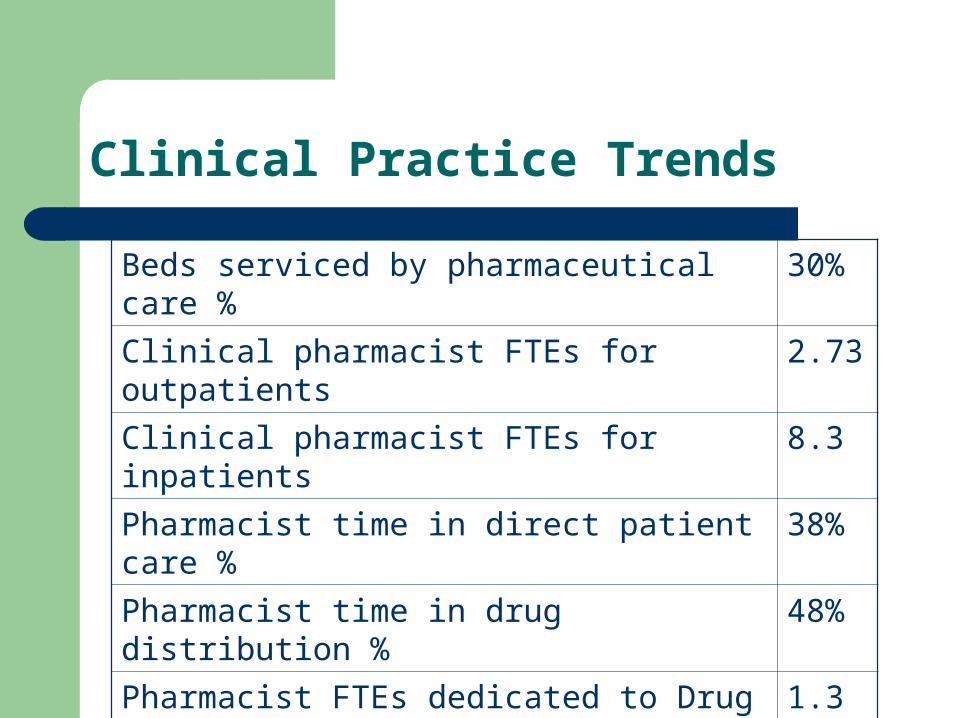
Clinical Practice Trends
Beds serviced by pharmaceutical care % 30%
Clinical pharmacist FTEs for outpatients 2.73
Clinical pharmacist FTEs for inpatients 8.3
Pharmacist time in direct patient care % 38%
Pharmacist time in drug distribution % 48%
Pharmacist FTEs dedicated to Drug Info 1.3
Pharmacist FTEs dedicated to DUE 0.7
Number of undergraduate student days 228
Pharmacist Time spend in research % 1%
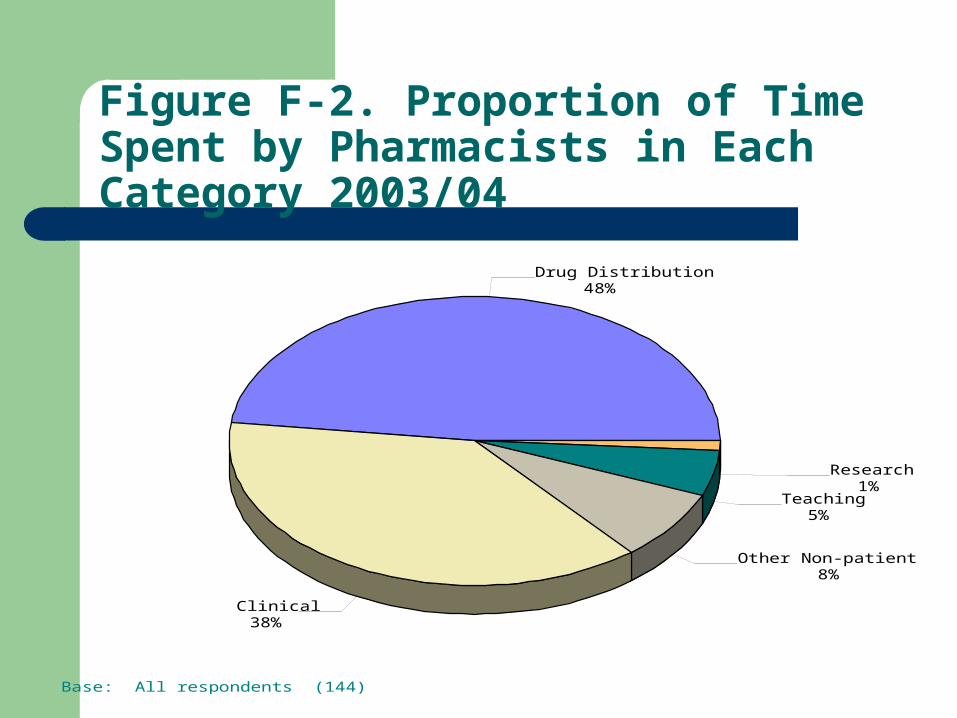
Figure F-2. Proportion of Time Spent by Pharmacists in Each Category 2003/04
Base: All respondents (144)
Drug Distribution48%
Clinical 38%
Other Non-patient Care8%
Teaching 5%
Research 1%

Outpatient Pharmacist FTE Ratios
Average 0.14 FTE pharmacist/10,000 visits DVT/anticoagulation 2.02 FTE/10,000 visit Infectious disease 2.00 FTE Cardiovascular/lipid 1.67 FTE Diabetes 1.16 FTE Hematology/oncology 1.06 FTE Emerg 0.02 FTE
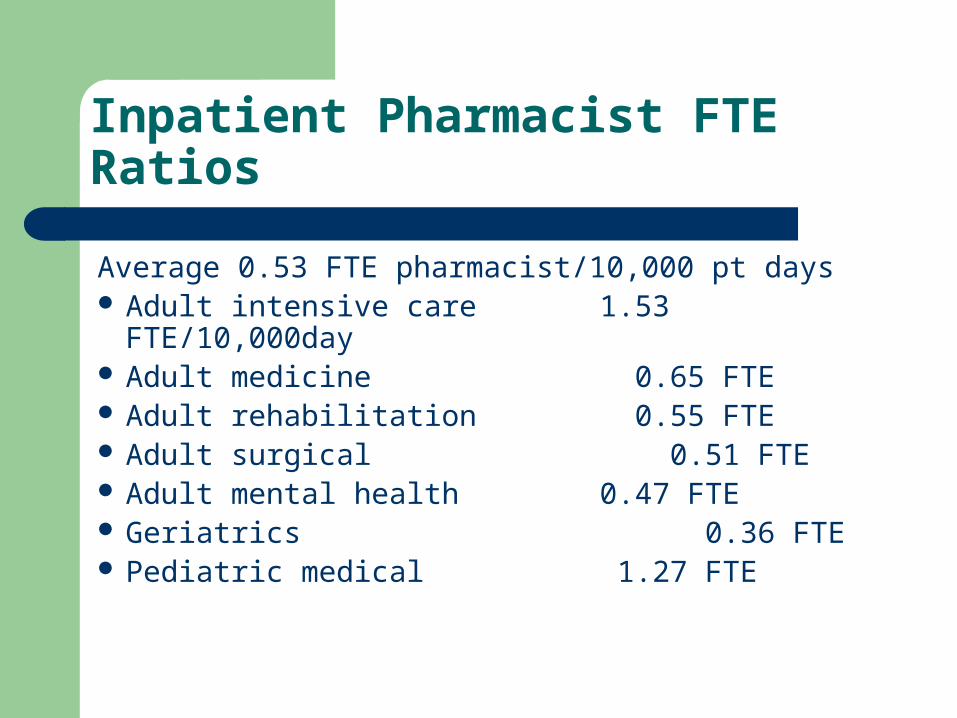
Inpatient Pharmacist FTE Ratios
Average 0.53 FTE pharmacist/10,000 pt days Adult intensive care 1.53 FTE/10,000day Adult medicine 0.65 FTE Adult rehabilitation 0.55 FTE Adult surgical 0.51 FTE Adult mental health 0.47 FTE Geriatrics 0.36 FTE Pediatric medical 1.27 FTE

Clinical Activities Documentation
# interventions per admission – 0.64– Increase from 0.6 in 2001/02 and 0.53 in 1999/00
Annual interventions per pharm FTE – 645 Still 20% respondents who do document
do not do it in the patient chart Pharmacokinetic documentations on the
increase

Priority Ranking vs Actual Activity
Bond et al – 6 clinical services associated with lower total cost of care
– DUE, drug information, ADE monitoring, Drug protocol management, medical rounds participation,
admission drug histories Yet none was reported by more than 70% of
respondents as being among the top 10 priorities
Participants rated clinical services by priority and by extent offered – striking discrepancy
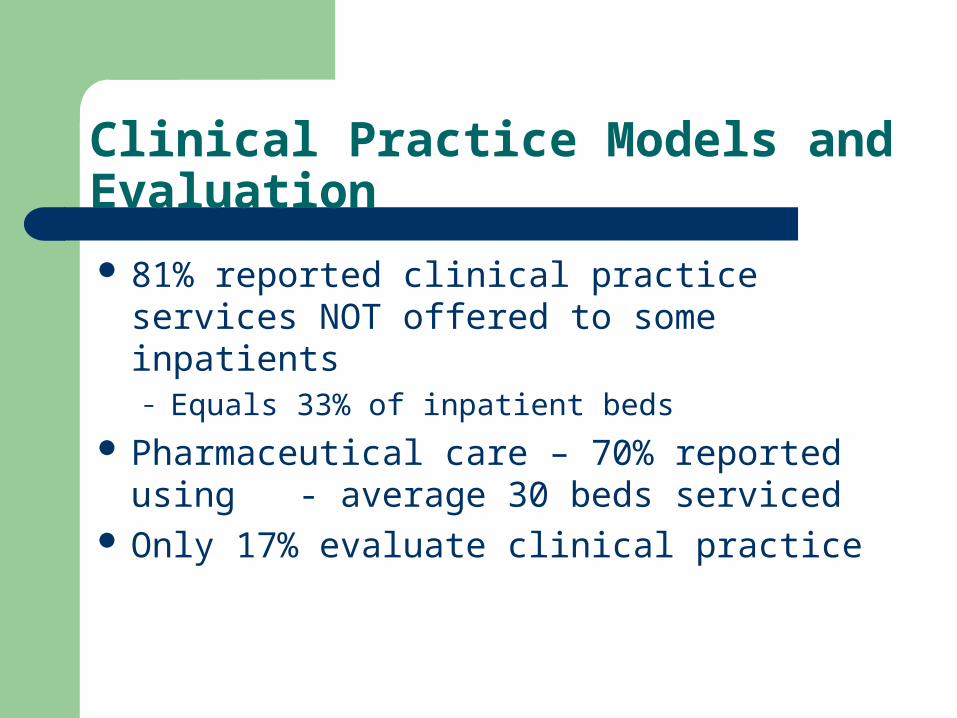
Clinical Practice Models and Evaluation
81% reported clinical practice services NOT offered to some inpatients– Equals 33% of inpatient beds
Pharmaceutical care – 70% reported using - average 30 beds serviced
Only 17% evaluate clinical practice
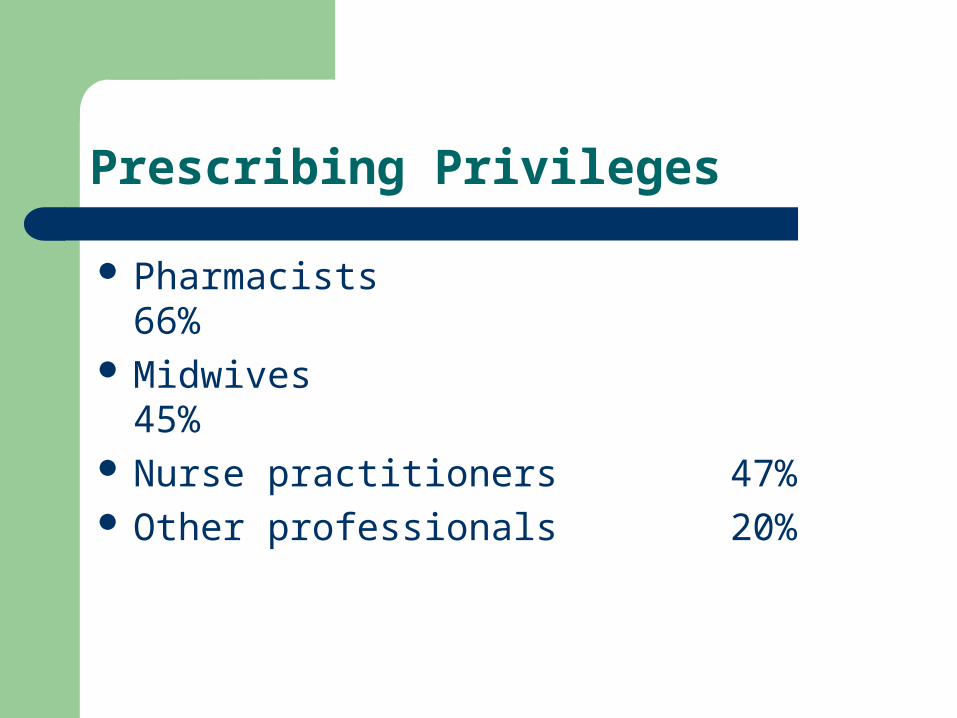
Prescribing Privileges
Pharmacists 66% Midwives 45% Nurse practitioners 47% Other professionals 20%
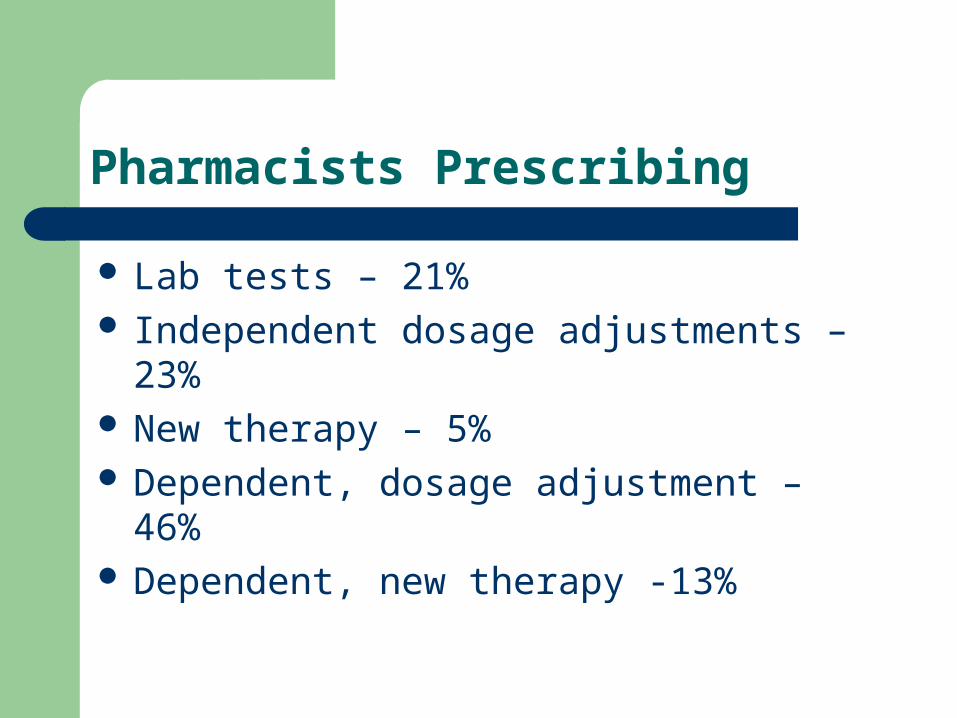
Pharmacists Prescribing
Lab tests – 21% Independent dosage adjustments – 23% New therapy – 5% Dependent, dosage adjustment – 46% Dependent, new therapy -13%

Seamless Care-Discharge Information Provided
Medications at discharge 95% Medications discontinued 68% Care Plan 56% Monitoring Values 59% Diagnosis 46%

Drug Information and DUE
DUE– 0.8 FTE pharmacist– 0.5FTE support staff
Drug Information
- 1.3 FTE pharmacists
- 0.4 FTE support staff

Drug Distribution and Delivery
Systems used Order entry Order verification MARs, medication profiles etc Technician check technician IV admixture Oncology Ambulatory services

Distribution Delivery Systems
Traditional delivery some beds 63% Total wardstock 21% Unit dose, >90% beds 31%

Figure D-2. Proportion of Beds Serviced by Drug Distribution System 2003/04
Base: All respondents (144)
Unit Dose51%
Unit Based Automated8%
Traditional32%
Carded Dose6%
Total Wardstock3%

Order Entry
Pharmacists 79% Technicians 78% Nurses 5% Physicians 3%
Pharmacist verify pharmacist OE -41%*Significant increase from 01/02 report - 27%

Medication Administration Records (MARs)
Electronic, on-line documentation 10% Manual 44% Computer generated 56% Allergy status on MAR 56% Cards, tickets (Ontario 4%) 25%

Figure D-4. Technician Activities Checked by other Technicians 2003/04
Base: Respondents reporting that function is performed
82%
82%
77%
70%
66%
59%
58%
51%
41%
32%
30%
17%
13%
Unit Dose Tray Filling Unit Dose Packaging
Replenishing Automated Cabinets
Cardiac Arrest Tray Filling
Traditional Prescriptions (Refills)
IV Admixture Preparation (Batching)
Interim Dose Filling
Extemporaneous Compounding
IV Admixture Preparation (Patient Specific)
Traditional Prescriptions (New Orders)
TPN Preparation
Medication Order Entry
Chemotherapy Preparation
Activities
0% 10% 20% 30% 40% 50% 60% 70% 80% 90% 100%
% of Respondents

Figure D-5. Certification Required 2003/04
Base: Respondents using technician check technician
86%
83%
82%
81%
77%
76%
75%
72%
67%
54%
41%
39%
31%
IV Admixture Preparation (Patient Specific)
IV Admixture Preparation (Batching)
Chemotherapy Preparation
Traditional Prescriptions (New Orders)
TPN Preparation
Interim Dose Filling
Traditional Prescriptions (Refills)
Unit Dose Tray Filling
Medication Order Entry
Unit Dose Packaging
Extemporaneous Compounding
Cardiac Arrest Tray Filling
Replenishing Automated Cabinets
Activities
0% 10% 20% 30% 40% 50% 60% 70% 80% 90% 100%
% of Respondents

Drug Purchasing and Inventory Control
PMRB reported sales from drugs increased 14.5% in 2003
Since 2001/02 report:– Acute care inpatient drug cost/pt day only
increased 26 cents. (Ave $31.25) – Emerg costs/patient day increased 24%– Ave inventory increased by 10.6%
CIHI - Drugs = 16.2% of total healthcare costs

Figure E-1. Percentage of Drug Expenses by Patient Care Area 2003/04
Base: Respondents who provided relevant drug cost information (82)
Ambulatory (Retail Pharmacy) 3%
Ambulatory (Take Home)3%
Emergency Room8%
Clinic / Medical Day Unit25%
Inpatient Long-Term Care6%
Inpatient Acute Care55%

Human Resources
Paid hours per acute patient day, average unchanged at 0.74
Staffing Ratios– Pharmacist 40%– Technician 46%– Support staff 7%– Management 5%– Residents 2%

Human Resource Shortages
63% of respondents reported vacancies as follows:– Pharmacist vacancies 12.9% – Management 6.9% – Technicians 0.9% – Residency vacancies 13.8%
*Concern expressed re reduced student applications

Impact of Human Resource shortages on Patient Care
67% respondents reduced services overall 85% reduced direct patient care 56% reduced implementation of approved
service 52% reduced teaching 38% reduced hours 15% reduced distribution

Medication Incident Reporting and Reduction Strategies
100% use med incident reporting tool 67% implemented strategies to increase
reporting 63% disclosure policy 80% have committee to review med safety
DTC, risk, quality, MAC, Pharm/nursing 51% completed self assessment tool 95% of assessment tools used were ISMP

Medication Safety
Verbal and telephone orders limited 76% Med orders conditional until pharmacist review 52% List of non-acceptable abbreviations 40% High alert medication list identified 38% Conc. electrolytes removed from patient care areas 72% Conc. narcotics removed from patient care areas 47% Standardized heparin concs. 81%

Issues for Patient Safety
Medication safety is related to the extent of pharmacist involvement in direct patient care, yet why is:– Time spent in clinical activity unchanged since
1999 (38%)– Clinical services still NOT provided to some
inpatients (33% inpatient beds)– Specific safety initiatives only partially
implemented– ? Related to pharmacist shortage

Technology
Pharmacy systems with clinical
decision support 40% Automated max. dosage alerts 28% Fully interfaced lab results 25% CPOE 5% Handheld devices 49% Wireless network with handheld 8%

Figure H-1 Functions for which handheld devices are used
Base: Respondents reporting the use of handheld devices (71)
94%
68%
37%
23%
17%
3%
3%
1%
11%
Clinical database consultation
Mail, agenda and task management
Formulary information
Workload data collection
Drug utilization activities
Clinical data entry and upload
Clinical data download from pharmacy records
Clinical data download from health records
Other
0% 10% 20% 30% 40% 50% 60% 70% 80% 90% 100%
% of respondents

Bar Code Technology
FDA - USA mandate bar codes at bedside – by May 2006
22% respondents use bar code technology– Up from 11% in 2002

Figure H-2 Uses of Bar Coding
34%
16%
16%
13%
3%
3%
47%
0% 10% 20% 30% 40% 50%
% of respondents
Base: Respondents reporting use of bar coding in medication system (32)
return doses to inventory in the pharmacy
verify drug selection prior to dispensing from the pharmacy
verify stocking of automated dispensing cabinets
verify stocking of unit dose bins
identify the patient during medication administration
verify drug selection prior to patient administration
other

Education and Research
Education - Student training remained a high priority with:– 83% reporting training for under-graduate
pharmacy students– 26% reporting training for pharmacy residents
Research– Sites conducting research decreased to 35% from
43% in 1999/2000 ( may be related to the 13.8% residency position vacancy rate)
Hospital Pharmacy in Canada Annual Report
Analysis of Indicators

Lilly Report User Customizable Benchmarking Report
Paid hours per acute patient day Paid hours per acute patient day by
distribution system Drug costs per acute patient day Drug costs per acute admission Inventory turns IV production per acute patient day Interventions per admission
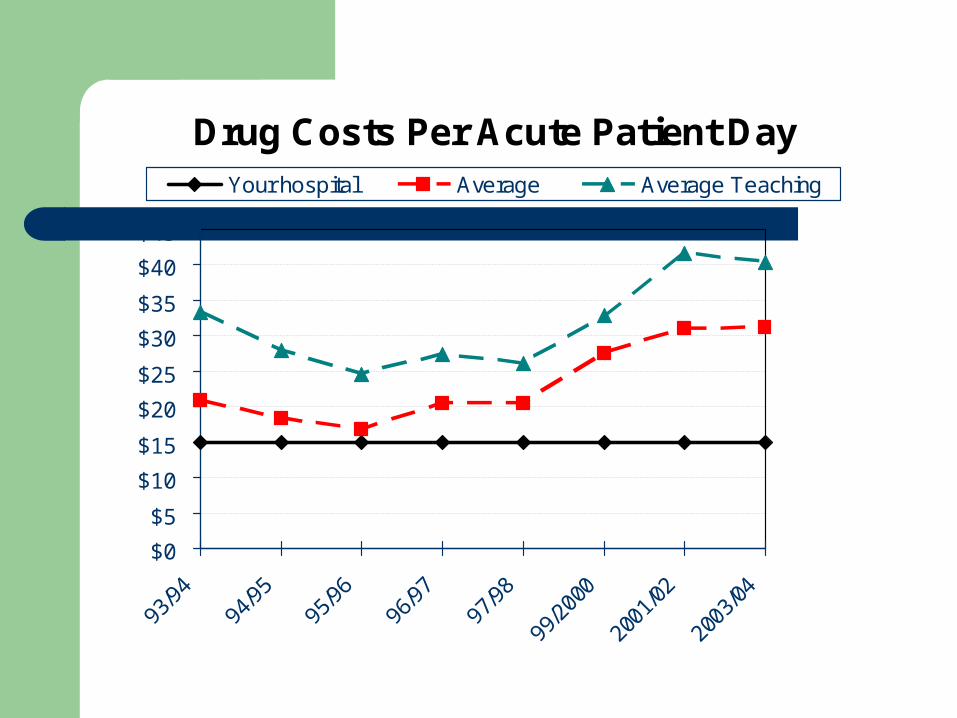
Drug Costs Per Acute Patient Day
$0
$5
$10
$15
$20
$25
$30
$35
$40
$45
Your hospital Average Average Teaching

Interventions per Admission
00.10.20.30.40.50.60.70.80.9
Your hospital Average Average Teaching
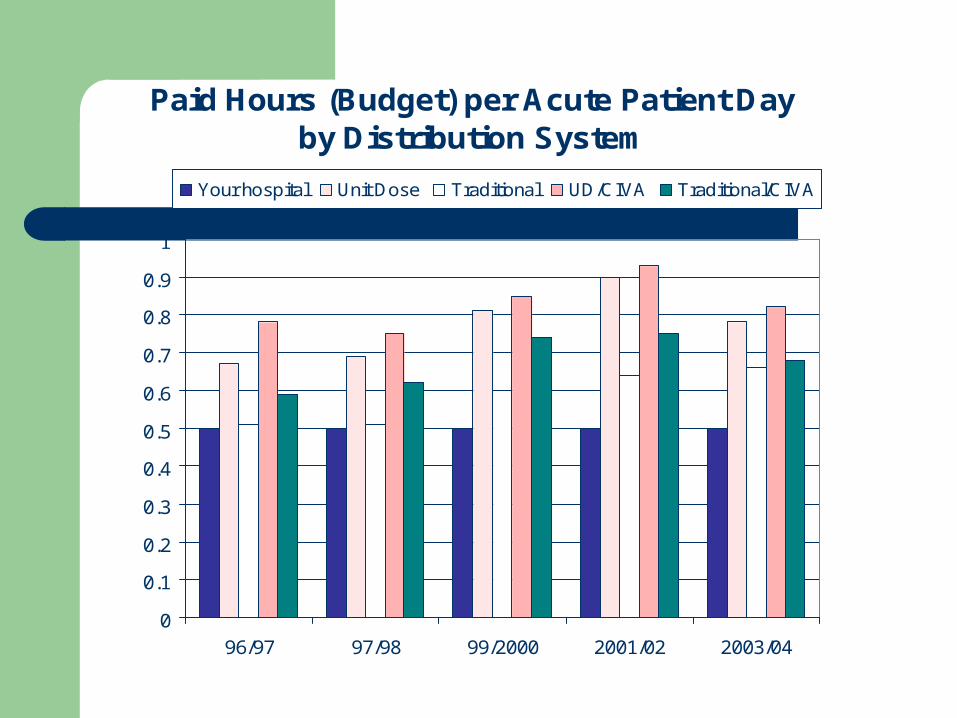
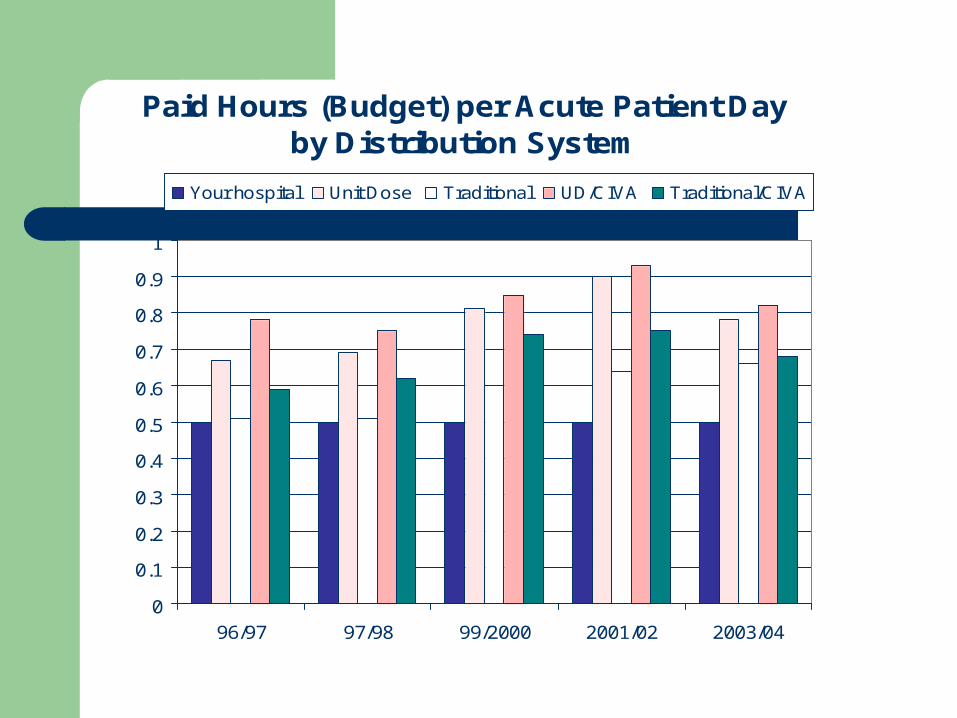
Paid Hours (Budget) per Acute Patient Day by Distribution System
0
0.1
0.2
0.3
0.4
0.5
0.6
0.7
0.8
0.9
1
96/97 97/98 99/2000 2001/02 2003/04
Your hospital Unit Dose Traditional UD/CIVA Traditional/CIVA

Additional benchmarking tables in the Report
Ave drug costs per day by clinical program Ave paid hours per admixture – CIVA, oncology, per
investigational drug study Ave paid hours for inventory/procurement and for
DUE per $1m drug purchases Ave paid hours per patient day for high acuity
programs e.g bone marrow transplant, neonatal or pediatric ICU
Changes in drug expense by patient care area Total drug costs by patient care area

What’s Next?
How does your Organization shape up in comparison to your peers?

Conducting a Self-Operational Review

Leadership and Management
Bar Code Technology
HPCR 03/04 (n= 144) Your Hospital
201 – 500 Beds
Over 500 Beds
Teaching Status
% with some level of Bar-coding implemented
21% 39% 41%

Leadership and Management
Uses of Bar Code Technology (Numbers too small to break down by site size)
HPRC 03/04 ( n=32) Your Hospital
All Hospitals
Returning doses to Inventory 34%
Verify drug, stock, dispense 16%
Verify unit dose bin stocking 13%
Verify drug prior to patient admin 3%

Leadership and Management
Computerized Provider Order Entry - CPOE
HPCR
2003/04 (n = 144)
Your Hospital
201 – 500 Beds
Over 500 Beds
Teaching Status
Operational CPOE
Sites (%) with approved plan to implement CPOE
1%
15%
13%
26%
11%
25%

Leadership and Management
Clinical Decision Support
HPCR
2003/04 (n = 144)Your Hospital
201-500 beds
Over 500 Beds
Teaching Status
Pharmacy systems with clinical decision
34% 42% 32%
Automated Max dosage Alerts
31% 26% 38%
Fully Interfaced Lab results
29% 24% 20%

Trend Table 1 - Human Resource Shortages
Type Vacancy (%)
Pharmacist 12.9%
Technician 6.9%
Residents 0.9%
Management 13.8%

Human Resources
TechniciansCertification programs for technician checking functions
HPCR
2003/04 ( n = 144)
Your Hospital
All Hospitals
Respondents (%) with technician certification
Respondents (%) with fully implemented re-certification program (36/102)
71%
35%

Trend Table 2- Direct Patient Care/Clinical Pharmacy Services
Your
Hospital
201-500 beds
Over 500 beds
Teach
Beds serviced by pharmaceutical care %
27 33 35
Clinical pharmacist FTEs for outpatients
1.89 4.83 4.32
Clinical pharmacist FTEs for inpatients
5.4 15.8 12.7
Pharmacist time in direct patient care %
38 44 38
Pharmacist time in drug distribution %
49 41 38
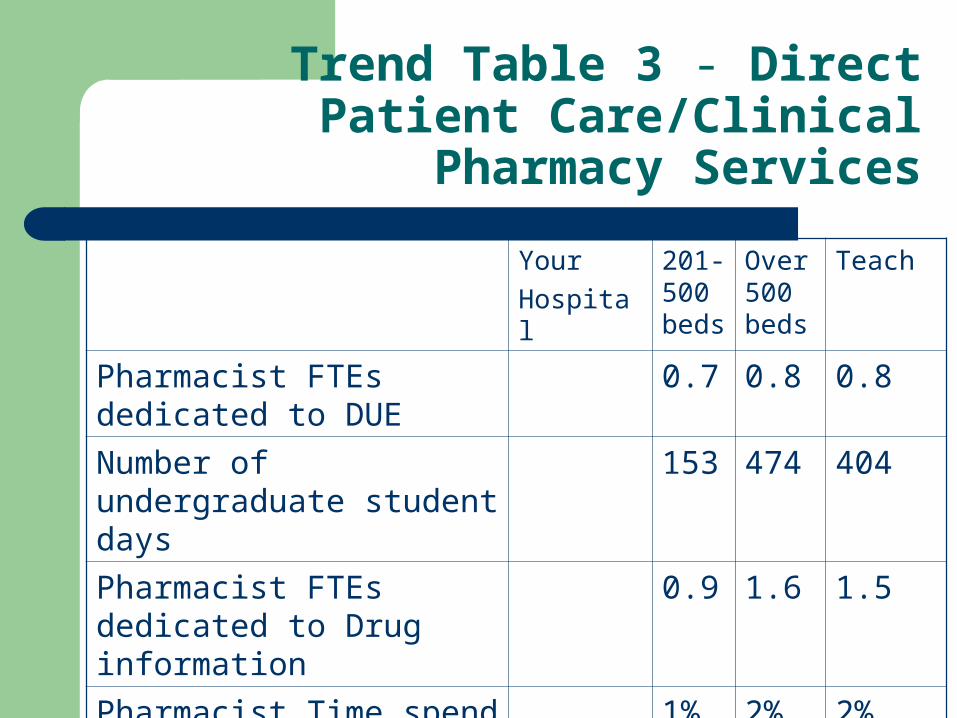
Trend Table 3 - Direct Patient Care/Clinical Pharmacy Services
Your
Hospital
201-500 beds
Over 500 beds
Teach
Pharmacist FTEs dedicated to DUE
0.7 0.8 0.8
Number of undergraduate student days
153 474 404
Pharmacist FTEs dedicated to Drug information
0.9 1.6 1.5
Pharmacist Time spend in research %
1% 2% 2%

Direct Patient Care/Clinical Pharmacy Services
Targeted Inpatient Clinical Practice Sites
HPCR 03/04
(n = 100)
Your Hospital
201- 500
Beds
Over 500 Beds
Teaching Status
Gen Medicine
Other acute
Adult Surgical
Adult ICU
Haem-Onc
1.9 FTE
1.5
1.2
0.6
0.5
5.8 FTE
4.0
3.1
2.5
1.8
5.0 FTE
3.9
2.8
2.0
1.5

Direct Patient Care/Clinical Pharmacy Services
Targeted Inpatient Clinical Practice Sites
HPCR 03/04
(n = 100)
Your Hospital
201- 500
Beds
Over 500 Beds
Teaching Status
Adult Mental Health
Geriatrics
Obs/Gyn
Pediatric medical
Pediatric ICU
Pediatric haem-onc
0.5 FTE
0.5
0.5
1.1
1.5
1.7
1.0 FTE
0.8
0.4
0.5
0.8
0.8
0.8 FTE
0.6
0.6
1.3
1.2
1.3
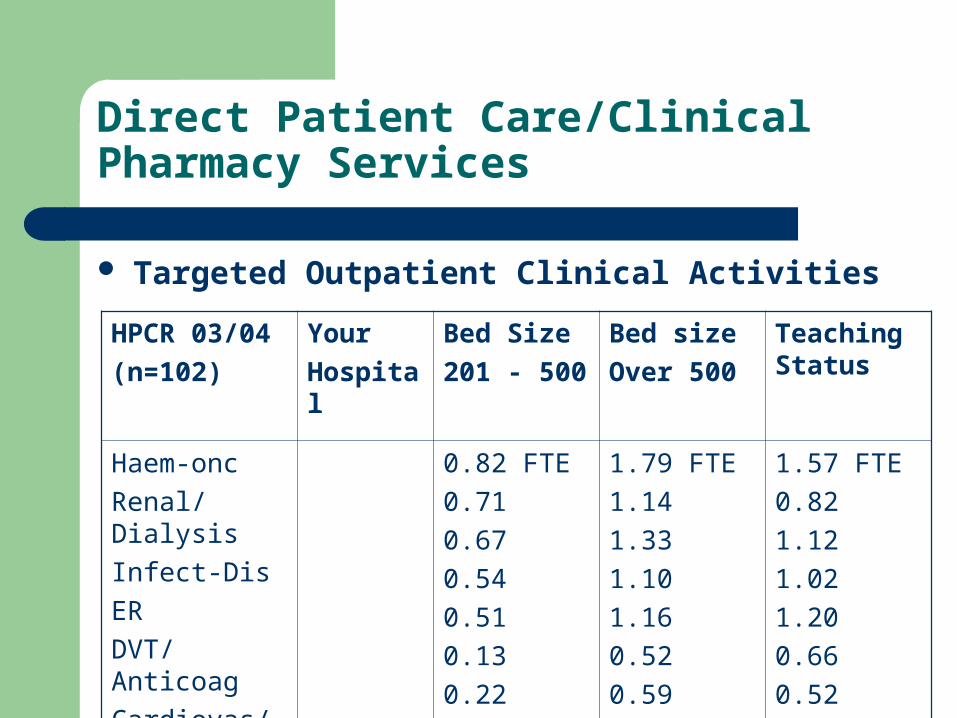
Direct Patient Care/Clinical Pharmacy Services
Targeted Outpatient Clinical Activities
HPCR 03/04
(n=102)
Your
Hospital
Bed Size
201 - 500
Bed size
Over 500
Teaching Status
Haem-onc
Renal/Dialysis
Infect-Dis
ER
DVT/Anticoag
Cardiovas/lipid
Diabetes
0.82 FTE
0.71
0.67
0.54
0.51
0.13
0.22
1.79 FTE
1.14
1.33
1.10
1.16
0.52
0.59
1.57 FTE
0.82
1.12
1.02
1.20
0.66
0.52
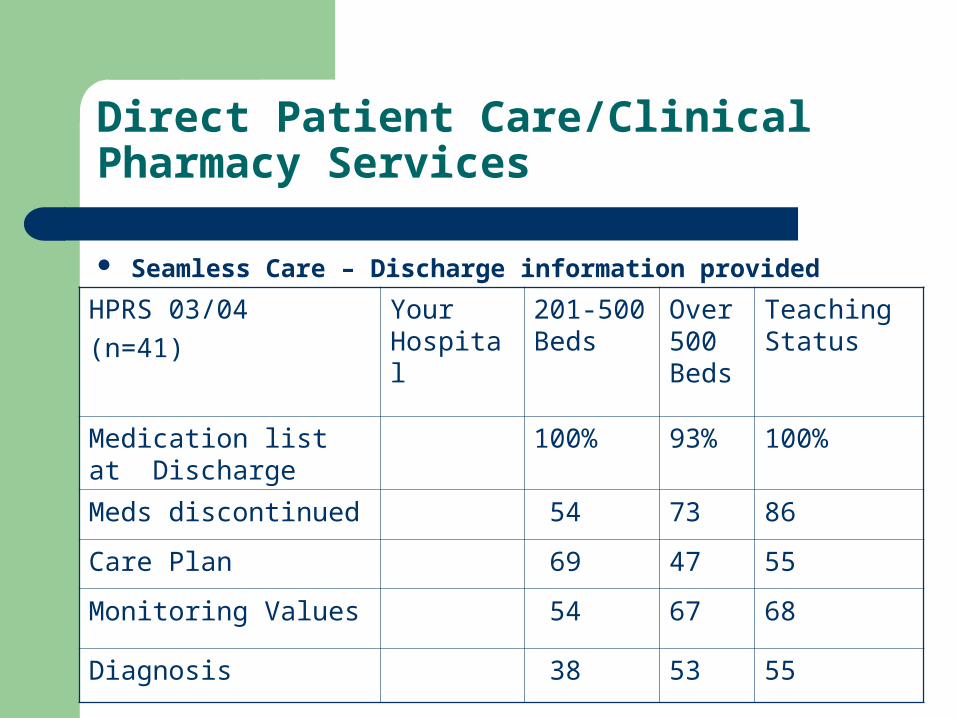
Direct Patient Care/Clinical Pharmacy Services
Seamless Care – Discharge information provided
HPRS 03/04
(n=41)
Your Hospital
201-500 Beds
Over 500 Beds
Teaching Status
Medication list at Discharge
100% 93% 100%
Meds discontinued 54 73 86
Care Plan 69 47 55
Monitoring Values 54 67 68
Diagnosis 38 53 55

Drug Use Management
Drug Information
Hand-held devices supplied to physicians and other professionals for clinical activities
HPCR
2003/04 ( n = 144)
Your Hospital
201-500 Beds
Over 500 Beds
Teaching Status
Respondents (%) supplying hand-held devices for clinical activities
51% 63% 61%

Trend Table 4 - Handheld Device Use
HPCR 2003/04 Your Hospital
201-500 Beds
Over 500 Beds
Teaching Status
Clinical data Base Consult 94% 96% 100%
Mail, Calendar, tasks 60 75 71
Formulary info 34 38 32
Workload 17 25 24
DUE 17 17 24
Clinical Data Entry 3% - only 5 sites total
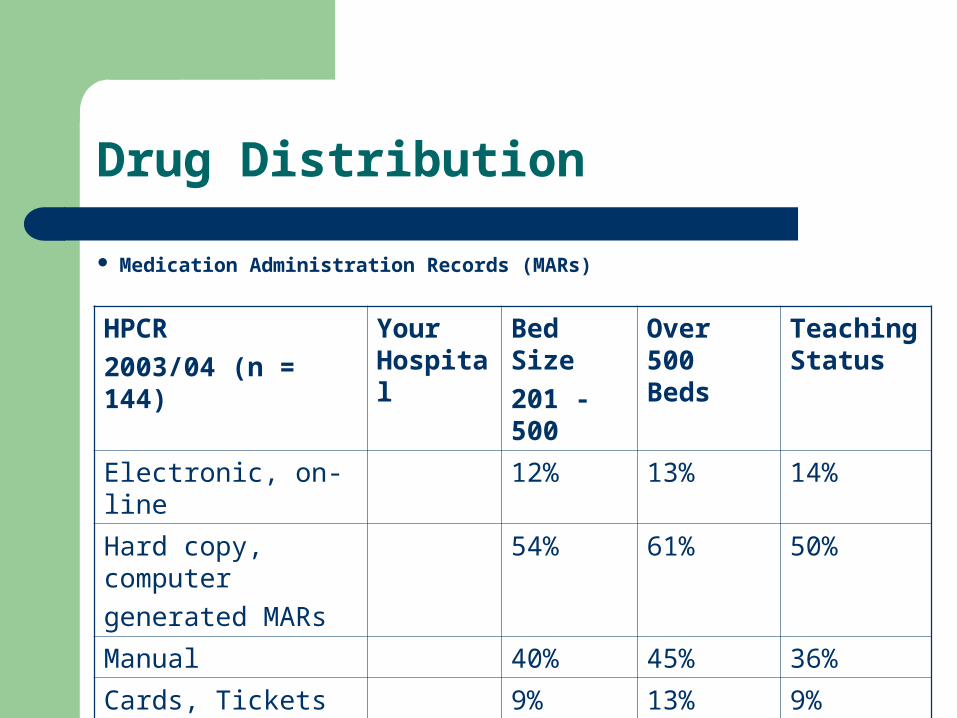
Drug Distribution
Medication Administration Records (MARs)
HPCR
2003/04 (n = 144)
Your Hospital
Bed Size
201 - 500
Over 500 Beds
Teaching Status
Electronic, on-line 12% 13% 14%
Hard copy, computer
generated MARs
54% 61% 50%
Manual 40% 45% 36%
Cards, Tickets
Yes (≥90%)
9% 13% 9%
Allergy on Mar 56% 63% 57%

Drug Distribution
Parenteral Drugs
HPCR
2003/04 (n = 65)
Your Hospital
Bed Size
201 - 500
Over 500 beds
Teaching Status
Average No. of admixtures per acute patient day
1.00 1.07 1.37

Drug Distribution
Order EntryHPCR 03/04 (n = 144) Your
Hospital201-500 Beds
Over 500 Beds
Teaching Status
Pharmacists only 76% 82% 77%
Technicians 76% 87% 82%
Nurses 1% 8% 5%
Physicians 3% 4% 6%

Trend Table 5 – Medication Safety and Quality Improvement
HPCR 03/04 (n=144) Your Hospital
201 – 500 Beds
Over 500 Beds
Teaching Status
% completing medication safety Self-Assessment
49% 61% 61%
Strategies to increase error reporting
75% 71% 71%
Disclosure policy 65% 71% 75%
Committee review med safety 78% 87% 91%
Use ISMP assessment tool 97% 87% 91%

Drug Costs
HPCR
2003/04 ( n = 144)
Your Hospital
201- 500
Beds
Over 500 Beds
Teaching Status
Average Total
($1,000,000s)
5.3 17.3 14.7
% increase in Costs 13.3 10.7 11.6
Aligning Your Organizations Priorities

Supporting your Priorities
Canadian Society of Hospital Pharmacists (CSHP) Standards, Statements and Guidelines - www.cshp.ca
Canadian Council on Health Services Accreditation (CCHSA) – New Patient Safety Standards effective 2006 – www.cchsa.ca
Institute for Safe Medication Practices (ISMP) – Canada - www.ismp-canada.org

Supporting your Priorities Cont’d…
Canadian Patient Safety Institute - www.patientsafetyinstitute.ca
Safer Healthcare Now Initiatives - www.saferhealthcarenow.ca
American Society of Health System Pharmacists – www.ashp.org
Institute for Healthcare Improvement (IHI) -www.ihi.org
Institute of Medicine (IOM) - www.iom.edu
Supporting your Priorities Cont’d…
Last but not least…… Hospital Pharmacy in Canada Report –
www.lillyhospitalsurvey.ca – extensive inventory of references at the end of each section of the document.

Hospital Pharmacy in Canada Annual Report
Analysis of Indicators
Paid Hours (Budget) per Acute Patient Day by Distribution System
0
0.1
0.2
0.3
0.4
0.5
0.6
0.7
0.8
0.9
1
96/97 97/98 99/2000 2001/02 2003/04
Your hospital Unit Dose Traditional UD/CIVA Traditional/CIVA

Drug Costs Per Acute Patient Day
$0
$5
$10
$15
$20
$25
$30
$35
$40
$45
Your hospital Average Average Teaching

Drug Costs per Acute Admission
$-
$50
$100
$150
$200
$250
$300
$350
Your hospital Average Average Teaching

Inventory Turns
02468
101214
93/9
494
/95
95/9
696
/97
97/9
8
99/2
000
2001
/02
2003
/04
Your hospital Average Average Teaching

I.V. Production Per Acute Patient Day
0.00
0.25
0.50
0.75
1.00
1.25
1.50
1.75
2.00
Your hospital Average Average Teaching

Interventions per Admission
00.10.20.30.40.50.60.70.80.9
Your hospital Average Average Teaching

Paid Hours (Budget) Per Acute Patient Day
0.00
0.10
0.20
0.30
0.40
0.50
0.60
0.70
0.80
0.90
1.00
93/94 94/95 95/96 96/97 97/98 99/2000 2001/02 2003/04
Your hospital Average Average Teaching

Using the Data - Testimonials
“…it takes 17 years for a new piece of science/evidence to be propagated through the system.” (IOM Report)

Contact Information
Patricia Macgregor - [email protected] Nancy Roberts – [email protected]
THANK-YOU - MERCI