Measuring Work Order Performance
29
PERCEPTION ® Measuring Work Order Performance 1
Transcript of Measuring Work Order Performance

PERCEPTION®
Measuring Work Order
Performance
1
Performance

Shipyards that know their true costs are more likely to be
profitable and are in a better position to challenge their
competition.
They can focus their efforts and resources on those areas
that can benefit the most from productive change.
2
A shipyard would never know this unless it had a means
for measuring benefits and their relative impact upon
profits.

World-class shipyards have a strong focus on
maximizing the efficiency of their manufacturing and
assembly processes. They strive to perform work at
the most productive stages of construction, eliminate
wasted time, and simplify shipyard production
processes.
3
These shipyards execute effective production plans
and work hard to successfully stay on budget and on
schedule. They know where they are and where they
are going.
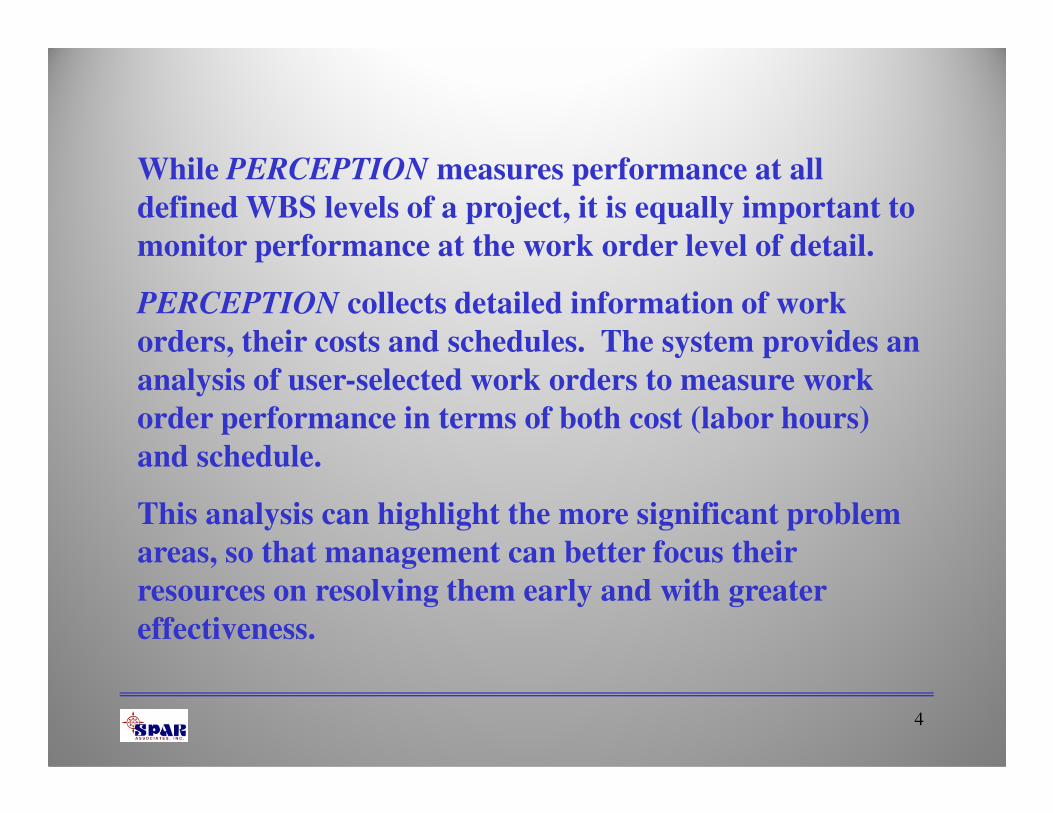
While PERCEPTION measures performance at all
defined WBS levels of a project, it is equally important to
monitor performance at the work order level of detail.
PERCEPTION collects detailed information of work
orders, their costs and schedules. The system provides an
analysis of user-selected work orders to measure work
order performance in terms of both cost (labor hours)
4
order performance in terms of both cost (labor hours)
and schedule.
This analysis can highlight the more significant problem
areas, so that management can better focus their
resources on resolving them early and with greater
effectiveness.
What Additional
Information Can
PERCEPTION Work
5
PERCEPTION Work
Order Data Provide?

Overall Work Order
Performance
PERCEPTION summarizes overall work order
planning status & performance as illustrated by
6
planning status & performance as illustrated by
the following set of graphics.

Overall Work Order Planning Status
253
235
150
200
250
300
Nu
mb
er
of
Wo
rk O
rders
7
18
3 - -0
50
100
150
Total Number of
Work Orders
Total Authorized For
Work
Total Not Authorized
For Work
Total Without
Budgets
Total Without Start
Schedules
Total Without Finish
Schedules
Nu
mb
er
of
Wo
rk O
rders

Overall Work Order Performance Status
253
151
150
200
250
300
Nu
mb
er
of
Wo
rk O
rde
rs
8
51 51
0
50
100
150
Total Number of Work Orders Number of Completed Work
Orders
Number of In-Process Work
Orders
Number of Un-Started Work
Orders
Nu
mb
er
of
Wo
rk O
rde
rs
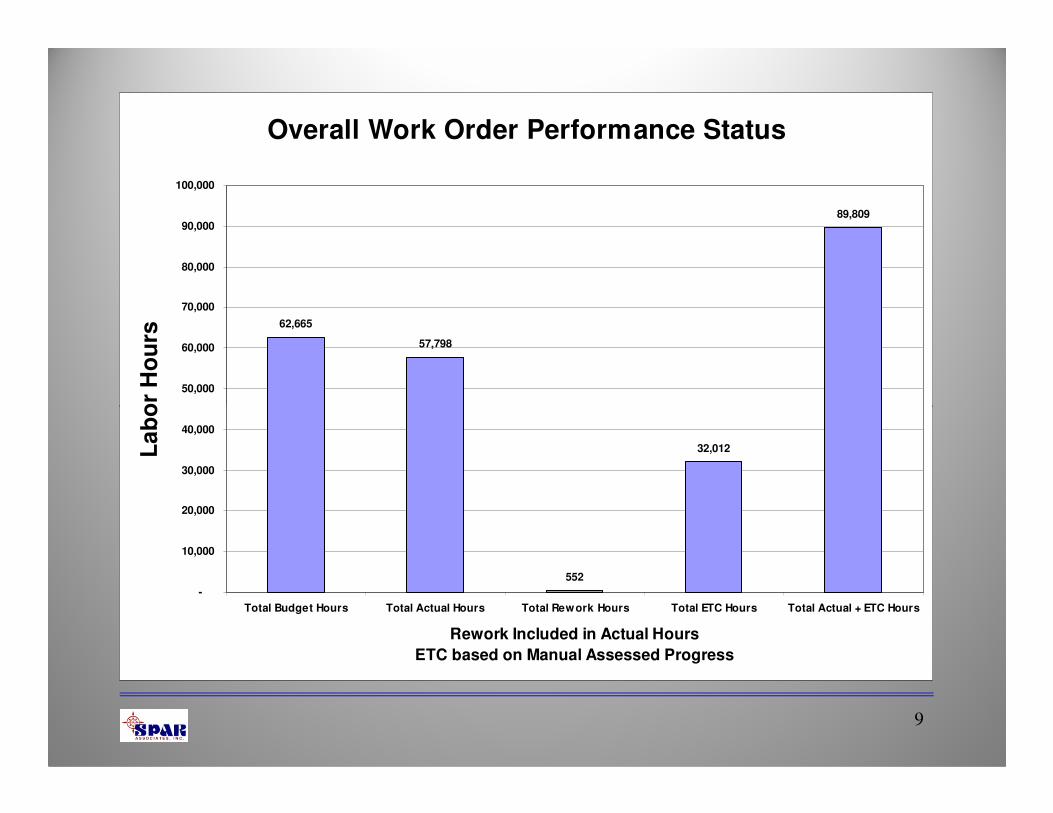
Overall Work Order Performance Status
62,665
57,798
89,809
50,000
60,000
70,000
80,000
90,000
100,000
La
bo
r H
ou
rs
9
552
32,012
-
10,000
20,000
30,000
40,000
Total Budget Hours Total Actual Hours Total Rework Hours Total ETC Hours Total Actual + ETC Hours
Rework Included in Actual Hours
ETC based on Manual Assessed Progress
La
bo
r H
ou
rs
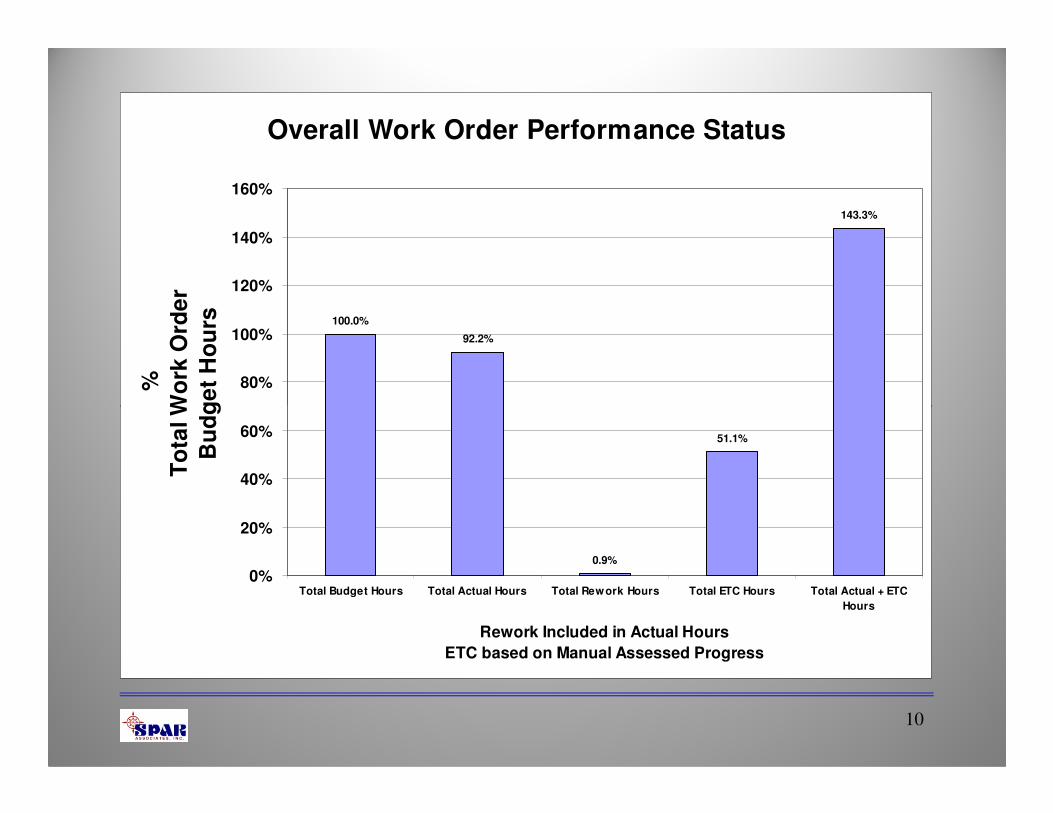
Overall Work Order Performance Status
100.0%
92.2%
143.3%
80%
100%
120%
140%
160%
%
To
tal W
ork
Ord
er
Bu
dg
et
Ho
urs
10
0.9%
51.1%
0%
20%
40%
60%
Total Budget Hours Total Actual Hours Total Rework Hours Total ETC Hours Total Actual + ETC
Hours
Rework Included in Actual Hours
ETC based on Manual Assessed Progress
To
tal W
ork
Ord
er
Bu
dg
et
Ho
urs
Completed Work Order
Performance
As a special subset of work orders, the following
graphics summarize performance of completed
(closed) work orders.
11
(closed) work orders.
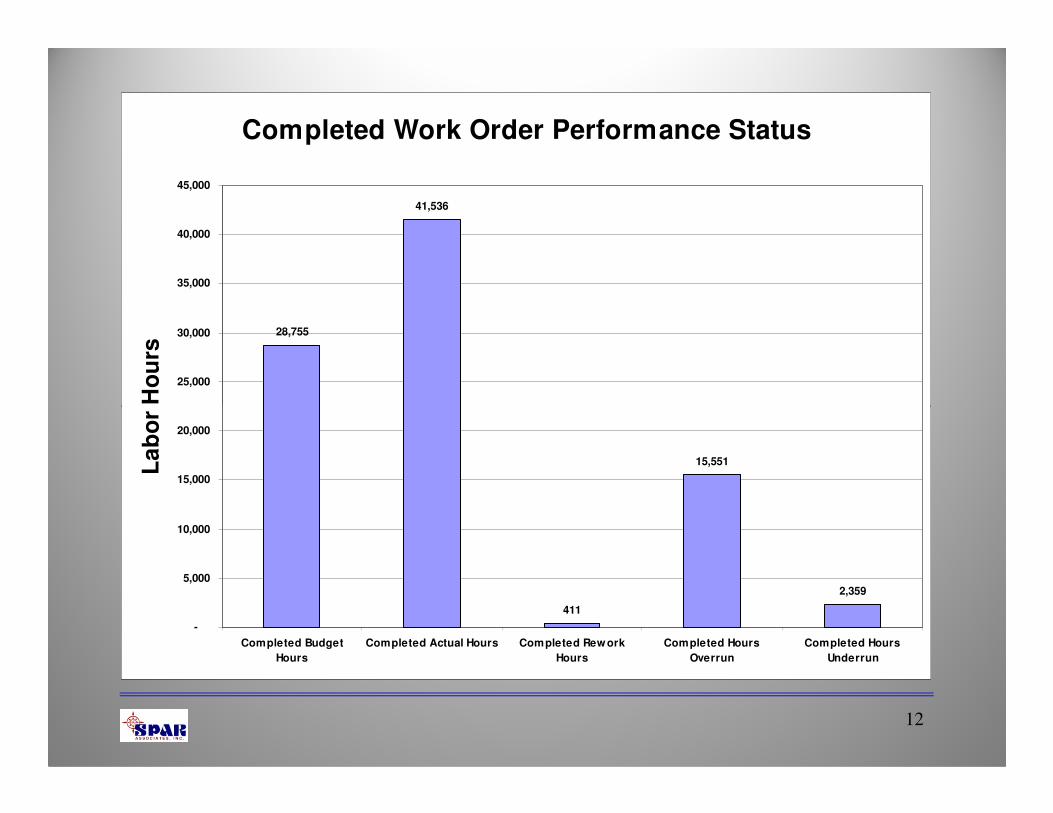
Completed Work Order Performance Status
28,755
41,536
25,000
30,000
35,000
40,000
45,000
La
bo
r H
ou
rs
12
411
15,551
2,359
-
5,000
10,000
15,000
20,000
Completed Budget
Hours
Completed Actual Hours Completed Rework
Hours
Completed Hours
Overrun
Completed Hours
Underrun
La
bo
r H
ou
rs

Completed Work Order Performance Status
100.0%
144.4%
80%
100%
120%
140%
160%
% B
ud
ge
t
of
Co
mp
lete
d W
ork
Ord
ers
13
1.4%
54.1%
8.2%
0%
20%
40%
60%
80%
Completed Budget
Hours
Completed Actual Hours Completed Rework
Hours
Completed Hours
Overrun
Completed Hours
Underrun
% B
ud
ge
t
of
Co
mp
lete
d W
ork
Ord
ers
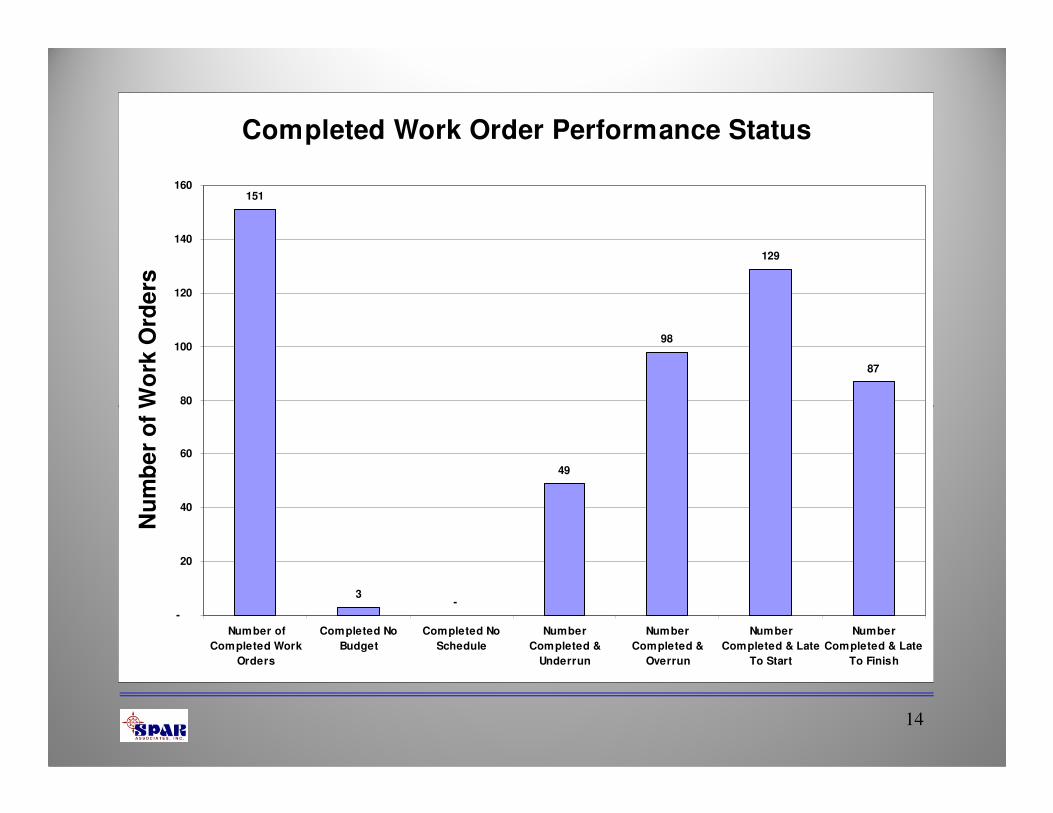
Completed Work Order Performance Status
151
98
129
87
80
100
120
140
160
Nu
mb
er
of
Wo
rk O
rde
rs
14
3-
49
-
20
40
60
Number of
Completed Work
Orders
Completed No
Budget
Completed No
Schedule
Number
Completed &
Underrun
Number
Completed &
Overrun
Number
Completed & Late
To Start
Number
Completed & Late
To Finish
Nu
mb
er
of
Wo
rk O
rde
rs
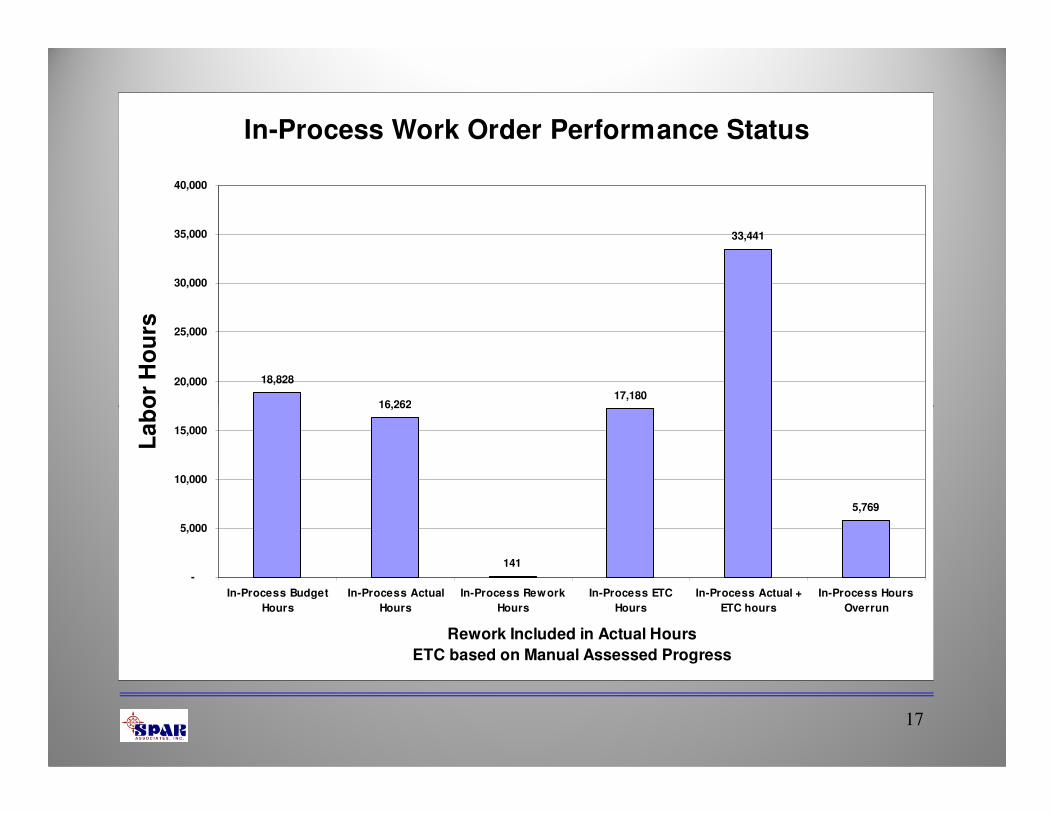
In-Process Work Order
Performance
As a special subset of work orders, the following
graphics summarize performance of in-process
(started, not completed) work orders.
15
(started, not completed) work orders.
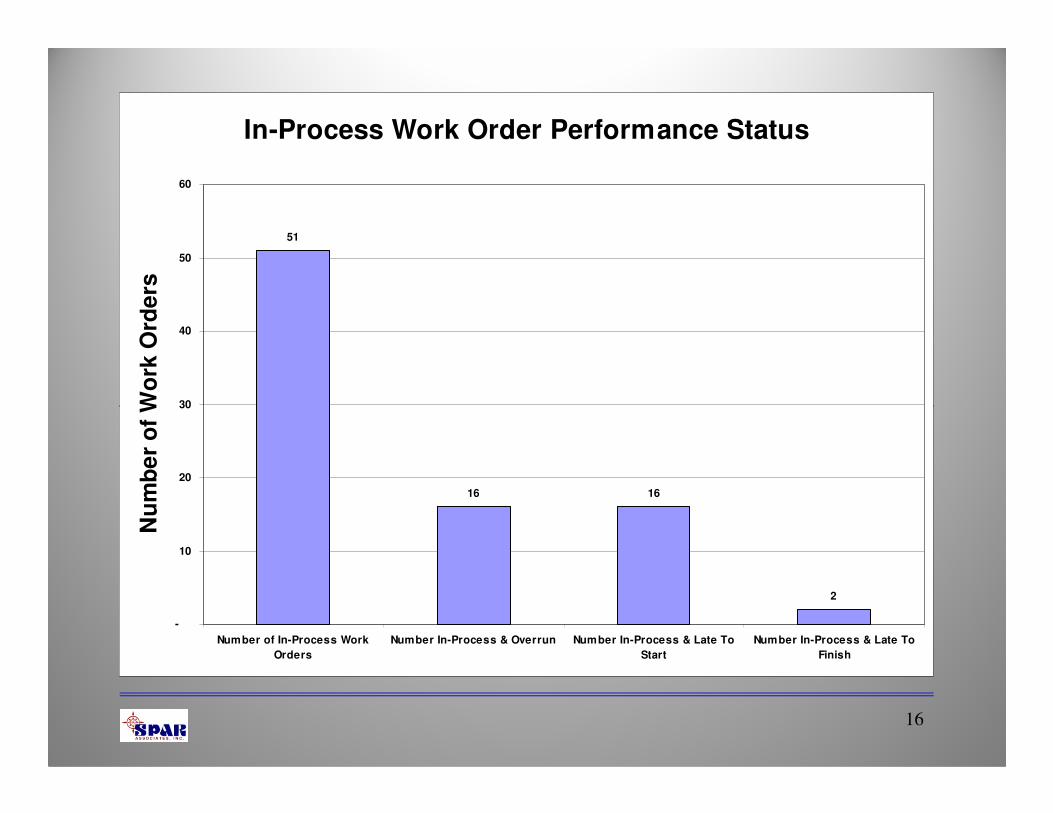
In-Process Work Order Performance Status
51
30
40
50
60
Nu
mb
er
of
Wo
rk O
rde
rs
16
16 16
2
-
10
20
30
Number of In-Process Work
Orders
Number In-Process & Overrun Number In-Process & Late To
Start
Number In-Process & Late To
Finish
Nu
mb
er
of
Wo
rk O
rde
rs
In-Process Work Order Performance Status
18,828
16,26217,180
33,441
20,000
25,000
30,000
35,000
40,000
La
bo
r H
ou
rs
17
16,262
141
5,769
-
5,000
10,000
15,000
In-Process Budget
Hours
In-Process Actual
Hours
In-Process Rework
Hours
In-Process ETC
Hours
In-Process Actual +
ETC hours
In-Process Hours
Overrun
Rework Included in Actual Hours
ETC based on Manual Assessed Progress
La
bo
r H
ou
rs
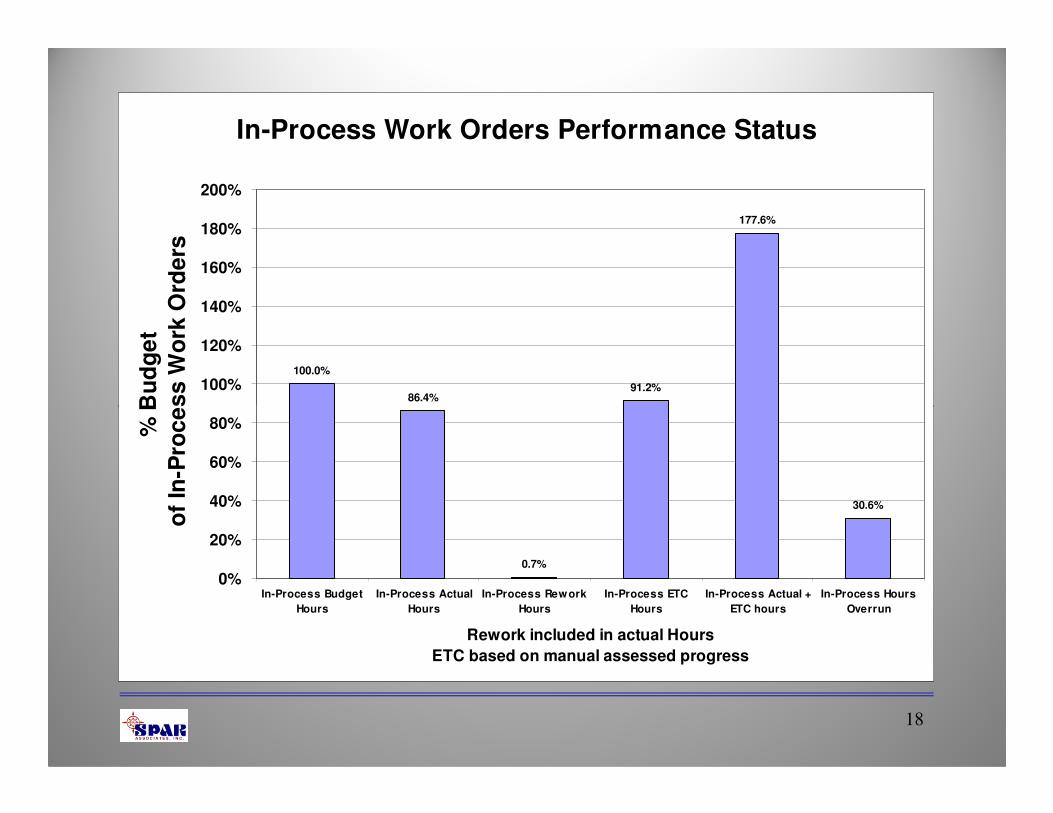
In-Process Work Orders Performance Status
100.0%
86.4%91.2%
177.6%
100%
120%
140%
160%
180%
200%
% B
ud
ge
t
of
In-P
roc
es
s W
ork
Ord
ers
18
0.7%
30.6%
0%
20%
40%
60%
80%
In-Process Budget
Hours
In-Process Actual
Hours
In-Process Rework
Hours
In-Process ETC
Hours
In-Process Actual +
ETC hours
In-Process Hours
Overrun
Rework included in actual Hours
ETC based on manual assessed progress
% B
ud
ge
t
of
In-P
roc
es
s W
ork
Ord
ers

Un-Started Work Order
Performance
As a special subset of work orders, the following
graphics summarize the status of work orders
not yet started.
19
not yet started.
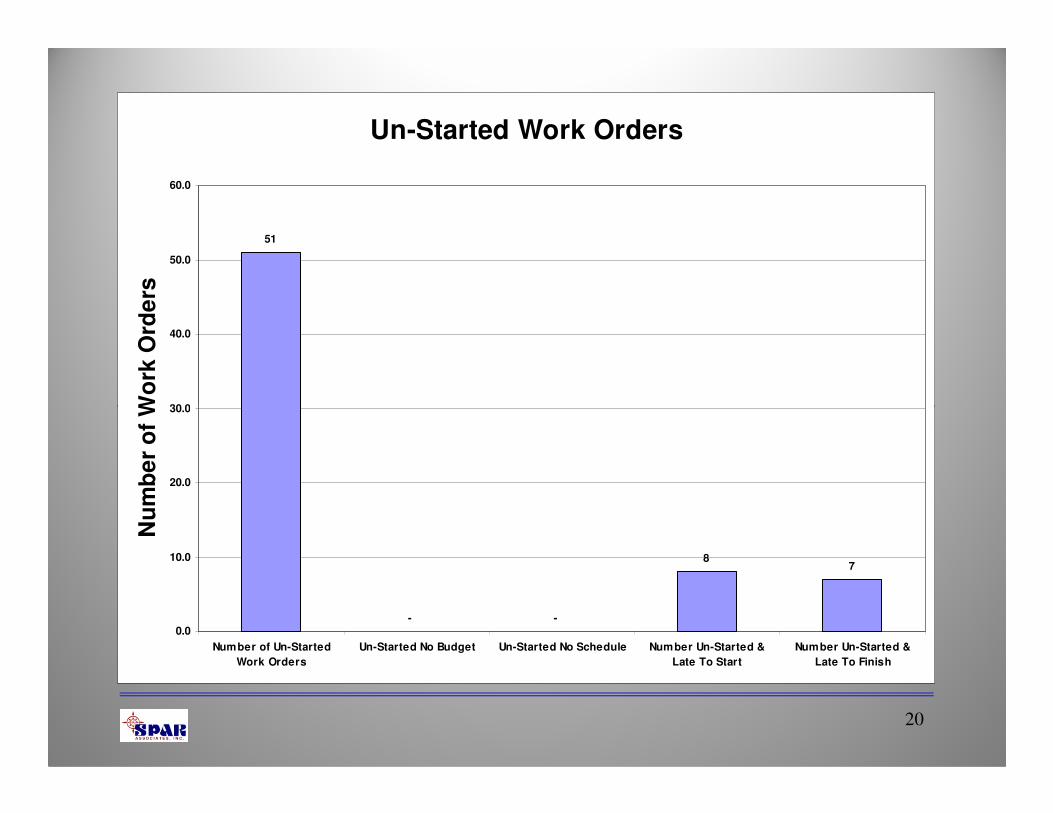
Un-Started Work Orders
51
30.0
40.0
50.0
60.0
Nu
mb
er
of
Wo
rk O
rde
rs
20
- -
87
0.0
10.0
20.0
30.0
Number of Un-Started
Work Orders
Un-Started No Budget Un-Started No Schedule Number Un-Started &
Late To Start
Number Un-Started &
Late To Finish
Nu
mb
er
of
Wo
rk O
rde
rs

Work Order Schedule
Performance
An important part of the analysis is the schedule
performance of the work orders.
21
performance of the work orders.

Work Order Schedule Status
37.08
20.71
20
25
30
35
40
Av
era
ge
Wo
rk W
ee
ks
Du
rati
on
22
4.103.16
6.79
2.75
-
5
10
15
Overall Average
Planned Work
Weeks
Completed
Average
Planned Work
Weeks
Completed
Average Actual
Work Weeks
In-Process
Average
Planned Work
Weeks
In-Process
Average Actual
Work Weeks
Un-Started
Average
Planned Work
Weeks
Av
era
ge
Wo
rk W
ee
ks
Du
rati
on
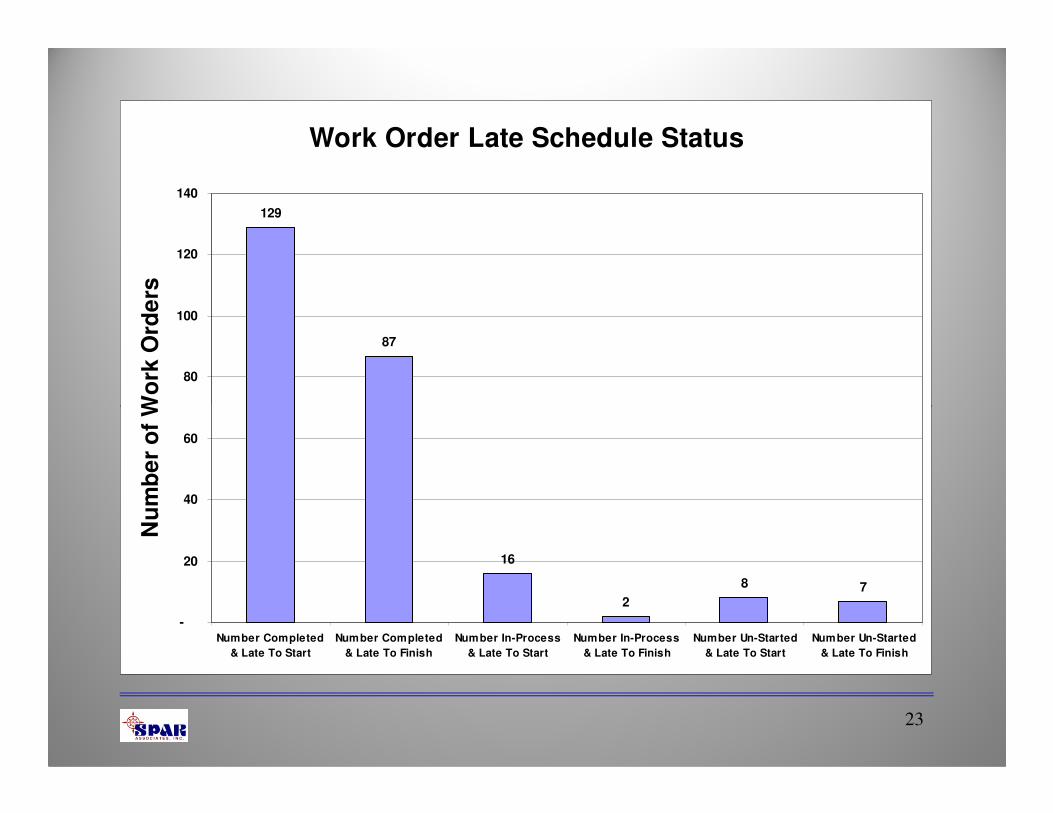
Work Order Late Schedule Status
129
87
80
100
120
140
Nu
mb
er
of
Wo
rk O
rde
rs
23
16
2
8 7
-
20
40
60
Number Completed
& Late To Start
Number Completed
& Late To Finish
Number In-Process
& Late To Start
Number In-Process
& Late To Finish
Number Un-Started
& Late To Start
Number Un-Started
& Late To Finish
Nu
mb
er
of
Wo
rk O
rde
rs

Work Order Late Schedule Status
37
6871
40
50
60
70
80
Da
ys
La
te
24
37
28
12
--
10
20
30
40
Completed Average
Days Late To Start
Completed Average
Days Late To Finish
In-Process Average
Days Late To Start
In-Process Average
Days Late To Finish
Un-Started Average
Days Late To Start
Un-Started Average
Days Late To Finish
Da
ys
La
te
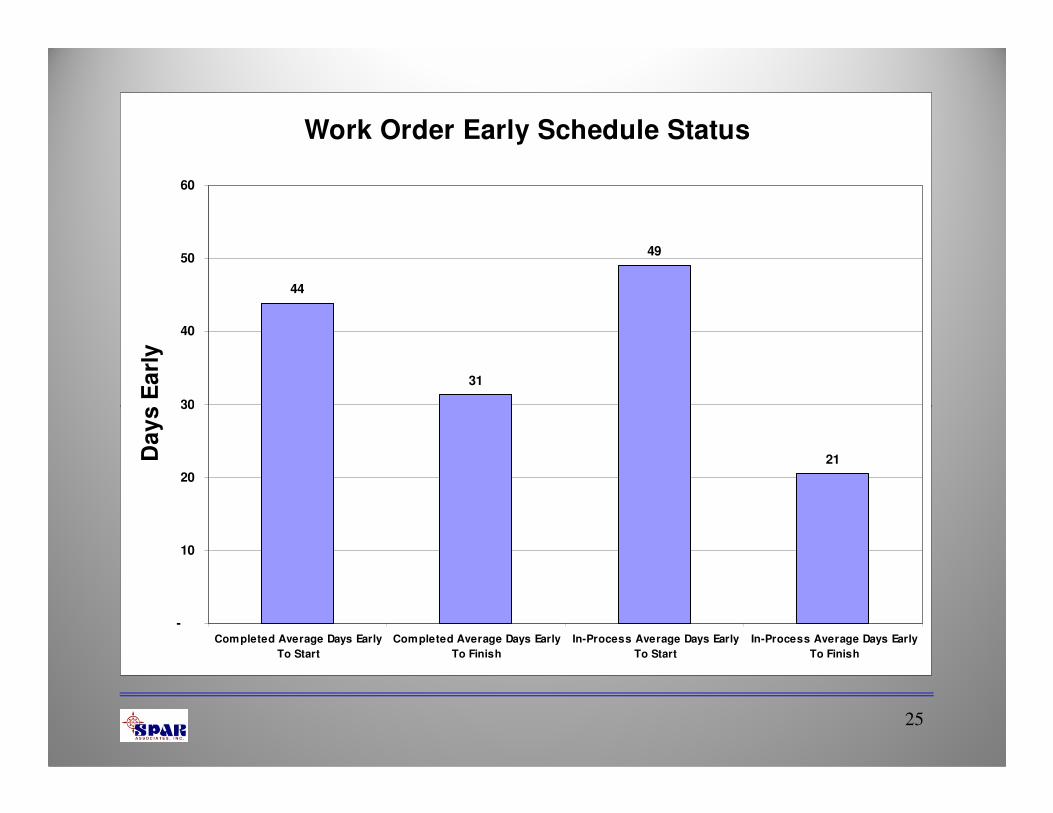
Work Order Early Schedule Status
44
31
49
30
40
50
60
Da
ys
Ea
rly
25
21
-
10
20
30
Completed Average Days Early
To Start
Completed Average Days Early
To Finish
In-Process Average Days Early
To Start
In-Process Average Days Early
To Finish
Da
ys
Ea
rly

Work Orders Early Schedule Status
55
32
47
30
40
50
60
Nu
mb
er
of
Wo
rk O
rde
rs
26
22
-
10
20
30
Number Completed & Early To
Start
Number Completed & Early To
Finish
Number In-Process & Early To
Start
Number In-Process & Early To
Finish
Nu
mb
er
of
Wo
rk O
rde
rs

PERCEPTION summarizes performance at all levels of a project. The
following presentations describe those that are critical to the management of
any project.
•Tracking progress and estimates at completion: these reports track budget,
earned value (BCWP), actual costs (ACWP), budgeted cost of work scheduled
(BCWS), and estimate at completion (EAC), as well as cost/schedule variances
and trends.
•Measuring and summarizing work order performance in terms of costs and
schedules. The system can focus on any selection of work orders for in-depth
27
schedules. The system can focus on any selection of work orders for in-depth
analysis of detail performance.
•Measuring and summarizing work center performance in terms of costs and
schedules. The system can focus on any selection of work orders for in-depth
analysis of production process performance.
•Measuring and summarizing cash flow requirements. The system tracks cash
flow requirements for labor, material & overhead. The system details
commitments, receipts, and usage of direct purchase material, subcontract
work, owner-furnished material and general stock.

SPAR Associates, Inc.
A Full Service Company
• Systems Development
28
• Systems Sales, Training & Support
• Independent Cost Estimating
• Planning & Scheduling Services
• Contract Cost/Schedule Tracking & Performance
Analysis

Over 35 Years Serving the Shipbuilding &
Repair Industry
29