Measuring Trust: Which Measure Can Be Trusted? Measuring Trust: Which Measure Can Be Trusted? 1....
31
1 Measuring Trust: Which Measure Can Be Trusted? Avner Ben-Ner, Freyr Halldorsson * Industrial Relations Center Carlson School of Management University of Minnesota 321 19 th Avenue South Minneapolis, MN 55455, USA Abstract The study examines the relationship of various survey measures of trust and risk taking with trusting behavior in the trust or investment game (Berg, Dickhaut, & McCabe, 1995). We conduct a series of standard trust game experiments from which we derive the standard trust measure – amount sent. We also conduct trust games in which we allow subjects in the role of trustors to make proposals for what they should send and what their counterparts (trustees) should send back, and offer the possibility of asking for costly contracts to support agreements. We use trustors’ request for such contracts as a new operationalization of behavioral trust (not asking for a contract indicates more trusting than asking for one). We compare the two behavioral measures to survey measures of trust and risk preferences. Our results confirm that the amount sent in the trust game is related to common-sense survey measures of trust but not to any measures of risk preferences. In contrast, none of the survey measures predicts asking for a contract. In addition, we investigate the association between risk preferences, gender, personality, cognitive ability and other individual characteristics and trust. We find that male subjects send significantly more than female subjects; risk attitude, the big five personality traits, cognitive ability and other variables show only limited association with the amount sent and asking for a contract. In contrast, survey trust measures are explained well by such variables. JEL classification: C72, C91, D63 PsychINFO classification: 2260; 3020 Keywords: Trust; Trust game; Measurement * Corresponding author. Tel.: +1 612 624 5790; fax: +1 612 624 8360. Email address: [email protected] (F. Halldorsson).
Transcript of Measuring Trust: Which Measure Can Be Trusted? Measuring Trust: Which Measure Can Be Trusted? 1....

1
Measuring Trust: Which Measure Can Be Trusted?
Avner Ben-Ner, Freyr Halldorsson *
Industrial Relations CenterCarlson School of Management
University of Minnesota321 19th Avenue South
Minneapolis, MN 55455, USA
Abstract
The study examines the relationship of various survey measures of trust and risk taking with trusting behavior in the trust or investment game (Berg, Dickhaut, & McCabe, 1995). We conduct a series of standard trust game experiments from which we derive the standard trust measure – amount sent. We also conduct trust games in which we allow subjects in the role of trustors to make proposals for what they should send and what their counterparts (trustees) should send back, and offer the possibility of asking for costly contracts to support agreements. We use trustors’ request for such contracts as a new operationalization of behavioral trust (not asking for a contract indicates more trusting than asking for one).We compare the two behavioral measures to survey measures of trust and risk preferences. Our results confirm that the amount sent in the trust game is related to common-sense survey measures of trust but not to any measures of risk preferences. In contrast, none of the survey measures predicts asking for a contract.In addition, we investigate the association between risk preferences, gender, personality, cognitive ability and other individual characteristics and trust. We find that male subjects send significantly more than female subjects; risk attitude, the big five personality traits, cognitive ability and other variables show only limited association with the amount sent and asking for a contract. In contrast, survey trust measures are explained well by such variables.
JEL classification: C72, C91, D63
PsychINFO classification: 2260; 3020
Keywords: Trust; Trust game; Measurement
* Corresponding author. Tel.: +1 612 624 5790; fax: +1 612 624 8360. Email address: [email protected] (F. Halldorsson).

2
Measuring Trust: Which Measure Can Be Trusted?
1. Introduction
Trust is regarded as a central concept for understanding important economic, social and
political behaviors. It is said to aid economic, business, social and many other types of
interactions; its absence thwarts many relations and causes much harm. Trust has been defined as
the “voluntary transfer of a good or favor to someone else, with future reciprocation expected but
not guaranteed” (Gunnthorsdottir, McCabe, & Smith, 2002: 50). After reviewing trust research in a
number of different fields Rousseau et al. (1998) found that many definitions of trust center on a
person’s willingness to be vulnerable to another party. They proposed a similar 'cross-disciplinary'
definition of trust, which states that “trust is a psychological state comprising the intention to
accept vulnerability based upon positive expectations of the intentions of another" (Rousseau et al.,
1998: 395).
A common operationalization of trust used extensively in the economic literature is based
on the widely known trust or investment game (Berg, Dickhaut and McCabe, 1995, henceforth
BDM). The original version of the trust game involves pairs of participants, one in the role of a
sender (trustor) and the other in the role of a receiver (trustee). The participants are seated in
different rooms and are unaware of each other’s identity. The sender is given a certain amount of
money, usually $10, and has the opportunity to send any amount, or none, to the receiver. Any
amount that the sender does send is tripled (in some versions it is doubled) and given to the
receiver. The receiver then has the opportunity to send any amount of the money he or she
received back to the sender. In most experiments, starting with BDM, the receiver is also given the
same amount as the sender so that if nothing is sent by the sender, the receiver will still end up

3
with the same amount. After both the sender and the receiver have sent their chosen amounts the
game ends. The sender keeps the original amount minus the amount s/he sent, plus the amount the
receiver sent back. The receiver keeps the amount s/he received minus the amount s/he sent back.
The rules of the game are known to both participants prior to starting the game. Given this setup,
the receiver’s payoff decreases as the amount s/he sends back to the sender increases. Based on the
standard assumption that individuals are rational and self-interested the receiver should not send
any money back, and in anticipation of this behavior, the sender should not send any money to the
receiver. Therefore it is argued that any positive amount sent by the sender is a measure of trusting
behavior. However, some researchers argue that the amount sent may reflect also altruism (Cox,
2004) and other dispositions in addition to trusting (Camerer, 2003).
In the psychological literature, where trust has also received a lot of attention, the
commonly employed method to capture a person’s trusting is to use a series of questions that relate
to trust and trusting behavior. Examples of such multi-item measures are Rosenberg’s (1957) faith
in people scale and Rotter’s (1967) interpersonal trust scale. In addition to the multi-item measures
used by psychologists, other researchers have used single-item measures. One example of such a
measure is the trust question on the General Social Survey (GSS). Survey measures require that a
person self-disclose his or her level of trust by responding to the items rather than by exhibiting
actual trusting behavior as in the trust game. But survey measures have been long thought to be
vulnerable to biases of social desirability.
There is no independent way to gauge which approach or measure captures best trusting,
but as an initial step towards their validation, it would be expected that they would correlate highly
if they both indeed measure trusting. However, past studies have generated inconsistent findings

4
concerning the correlation between survey measures of trust and the amount sent by senders in the
trust game. So what trust measures can we trust to measure trust?
In this paper, we examine empirically the relationship between behavioral measures of trust
and several survey measures, controlling for subjects’ personality, risk attitude, cognitive ability,
religious belief and demographic variables. We attempt to carry out a more comprehensive test of
these relationships and are able to replicate disparate studies’ analyses in a unified and consistent
framework. Our results show that the survey measures of trust and the economic-experiment
measure of sending in the trust game are related constructs. However, the constructs appear to
measure different aspect of trusting, as we find some differences in terms of personality and
demographic variables that predict the survey and behavioral measures.
We use an additional measure of trusting derived from a modified version of the trust
game. We allow the subject in the trustor role to propose an amount to be sent by him/her and an
amount to be returned by the subject in the trustee role, and give an opportunity to the trustee to
indicate non-binding agreement or disagreement with the proposal. Next, the subjects have the
option to proceed to the standard trust game, or if the trustee has agreed to the trustor’s proposal, to
ask for a binding contract to back up the agreement. We use trustors’ request for the assurance of a
contract as a measure of distrust, and the absence of such a request, as an indication of trust, but
find that this measure is not related to the amount sent by trustors or to survey measures.
The paper is organized as follows. In the next section we review the literature that relates
survey measures of trusting and measures derived from economic experiments. Next, we described
the collection of survey data from a sample of students 102 undergraduate students at a large US
university and the trust experiments in which they participated, and report the results that relate the
difference types of measures to each other and to a set of personality, cognitive ability and
5
demographic variables. We conclude the paper with a discussion of our results and their
significance for trust research.
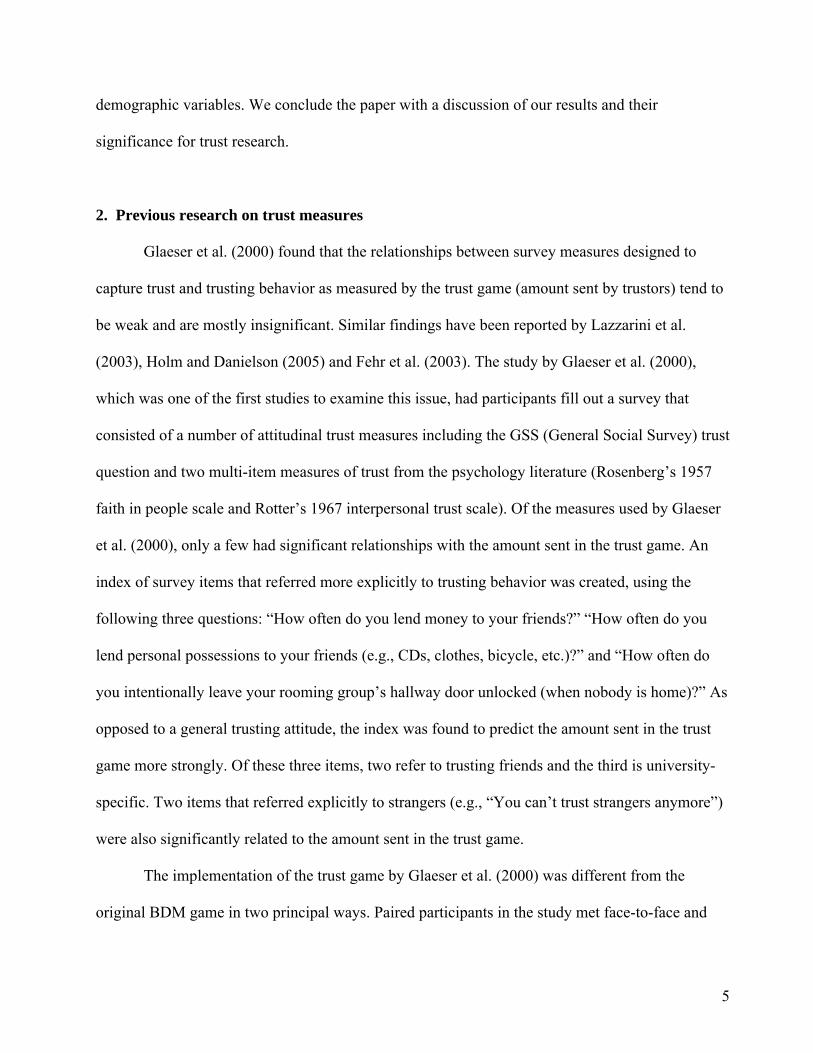
2. Previous research on trust measures
Glaeser et al. (2000) found that the relationships between survey measures designed to
capture trust and trusting behavior as measured by the trust game (amount sent by trustors) tend to
be weak and are mostly insignificant. Similar findings have been reported by Lazzarini et al.
(2003), Holm and Danielson (2005) and Fehr et al. (2003). The study by Glaeser et al. (2000),
which was one of the first studies to examine this issue, had participants fill out a survey that
consisted of a number of attitudinal trust measures including the GSS (General Social Survey) trust
question and two multi-item measures of trust from the psychology literature (Rosenberg’s 1957
faith in people scale and Rotter’s 1967 interpersonal trust scale). Of the measures used by Glaeser
et al. (2000), only a few had significant relationships with the amount sent in the trust game. An
index of survey items that referred more explicitly to trusting behavior was created, using the
following three questions: “How often do you lend money to your friends?” “How often do you
lend personal possessions to your friends (e.g., CDs, clothes, bicycle, etc.)?” and “How often do
you intentionally leave your rooming group’s hallway door unlocked (when nobody is home)?” As
opposed to a general trusting attitude, the index was found to predict the amount sent in the trust
game more strongly. Of these three items, two refer to trusting friends and the third is university-
specific. Two items that referred explicitly to strangers (e.g., “You can’t trust strangers anymore”)
were also significantly related to the amount sent in the trust game.
The implementation of the trust game by Glaeser et al. (2000) was different from the
original BDM game in two principal ways. Paired participants in the study met face-to-face and
6
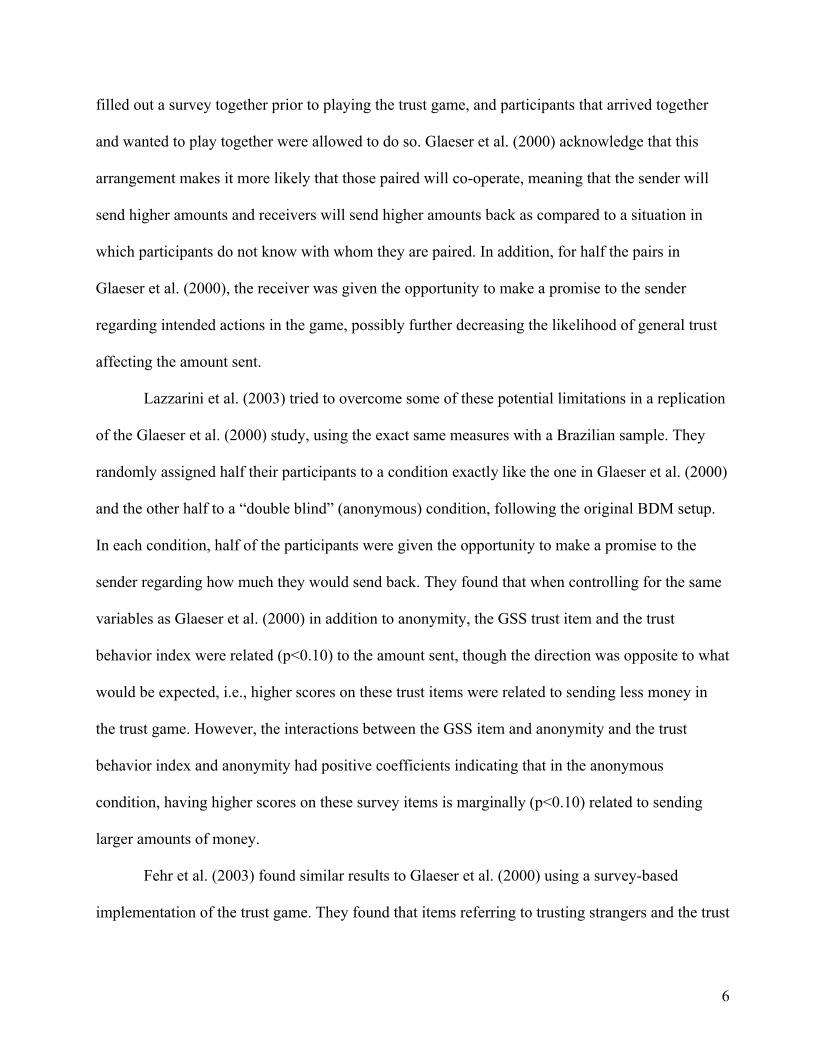
filled out a survey together prior to playing the trust game, and participants that arrived together
and wanted to play together were allowed to do so. Glaeser et al. (2000) acknowledge that this
arrangement makes it more likely that those paired will co-operate, meaning that the sender will
send higher amounts and receivers will send higher amounts back as compared to a situation in
which participants do not know with whom they are paired. In addition, for half the pairs in
Glaeser et al. (2000), the receiver was given the opportunity to make a promise to the sender
regarding intended actions in the game, possibly further decreasing the likelihood of general trust
affecting the amount sent.
Lazzarini et al. (2003) tried to overcome some of these potential limitations in a replication
of the Glaeser et al. (2000) study, using the exact same measures with a Brazilian sample. They
randomly assigned half their participants to a condition exactly like the one in Glaeser et al. (2000)
and the other half to a “double blind” (anonymous) condition, following the original BDM setup.
In each condition, half of the participants were given the opportunity to make a promise to the
sender regarding how much they would send back. They found that when controlling for the same
variables as Glaeser et al. (2000) in addition to anonymity, the GSS trust item and the trust
behavior index were related (p<0.10) to the amount sent, though the direction was opposite to what
would be expected, i.e., higher scores on these trust items were related to sending less money in
the trust game. However, the interactions between the GSS item and anonymity and the trust
behavior index and anonymity had positive coefficients indicating that in the anonymous
condition, having higher scores on these survey items is marginally (p<0.10) related to sending
larger amounts of money.
Fehr et al. (2003) found similar results to Glaeser et al. (2000) using a survey-based
implementation of the trust game. They found that items referring to trusting strangers and the trust

7
behavior index were both significantly related to the amount sent by senders. Another study by
Holm and Danielson (2005) compared trust game findings from Tanzania and Sweden. They found
that none of the trust survey items predicted behavior in the trust game in Tanzania, but in Sweden
trust questions from the General Social Survey (as an index) were predictive of the amount sent.
However, none of the other survey trust items included in the study predicted behavior in the trust
game in Sweden. A related study by Gächter, Herrmann, and Thöni (2004) looked at the
relationship between survey measures of trust, using the same items as Glaeser et al. (2000), and
cooperation in a one-shot public goods game. They found that cooperation could be significantly
predicted using survey responses regarding trust toward strangers and two items from the GSS:
beliefs about the fairness and about the helpfulness of others.
Schechter (in press) examined how risk attitudes affect behavior in the trust game. Her
results indicate that risk attitudes are significantly related to the amount sent in the trust game.
However, another study (Ashraf , Bohnet, and Piankov, 2006) found no significant relationship
between risk preferences and behavior in a trust game. Along similar lines, Gunnthorsdottir,
McCabe, and Smith (2002) found that Machiavellianism did not predict trusting behavior, but that
it did predict trustworthiness in a bargaining game. Eckel and Wilson (2004) found no relationship
between behavioral measures of risk attitudes and the amount of money sent in the trust game and
only a weak relationship between the survey measure of risk attitudes and money sent.
3. Method
3.1 Participants and procedure
The study uses a sample of 102 participants. The majority of the participants were female
(68%) and consisted of undergraduate and graduate university students that were recruited to take

8
part in a study on decision making at the University of Minnesota. Participants are all from the
group of senders in the trust game (trustors).
The study procedure consisted of two parts: an online survey, and an experimental session
that participants attended several days later. The first part involved the sign-up process for “a study
in interactive decision-making,” followed by a survey that included demographic and other
background information, measures of trust, risk-related attitudes and political attitudes. This part
was done on-line at participants’ leisure, several days before they participated in the trust game
(registration closed two days prior to the experiment), and took about 30 – 45 minutes. Separating
the two parts should reduce the possibility that participants’ choices in the trust game would be
affected by how they responded to the survey items. This separation should lower the chance of a
participant’s mood, state of mind or unknown priming leading possibly to higher correlations
between survey responses and behavior in the trust game.
The second part consisted of trust game experiments as well as a cognitive test. Participants
were randomly assigned to play as a trustor (called person in role A in the experiment) or trustee
(role B) in the trust game; participants in the two roles were seated in separate rooms and all
interactions took place over a computer network. This setup ensured that participants were not
aware of the identity of their counterparts. During the experimental sessions, after introduction and
on-screen instructions and questions testing their comprehension of the experiment, each
participant played seven rounds of the experiment, each time paired with a different person. After
the last round participants were asked to complete the Wonderlic Personnel Test, a measure of
general mental ability. Then the $10 show-up fee was paid, along with any earnings (about $15
from the trust game plus about $2 as a random payout for lottery choices, described later). This
part took approximately 45 minutes.

9
3.2 Measures
A. Survey measures of trust and risk preferences
Several measures were used to capture trust and risk-related preferences. The first three measures
and the scale formed form them address directly the question of trusting. These are followed by an
item asking about risk taking, and a risk-attitude measure based on lottery choices. Both risk items
are predicted to affect trusting, with more risk averse individuals willing to send less to their
trustees and more likely to ask for a contract to safeguard an agreement. The next two measures
ask about subjects’ trust in the honesty of others and general pessimism-optimism attitude, with
the expectation that those who believe others to be more honest will be more trusting, as will be
those with a generally more optimistic outlook. Finally, we have a Machiavellian scale (that has
been shown to predict trustworthiness but not trusting) (Gunnthorsdottir, McCabe, and Smith,
2002).
1. General trust – General trust was measured using the trust item from the General Social Survey.
The item is: “Generally speaking, would you say that most people can be trusted, or that you
cannot be too careful when dealing with people?” Responses are made on a binary response scale,
where 0=”You cannot be too careful when dealing with people” and, 1=”Most people can be
trusted.”
2. Trusting attitude – Trusting attitude was captured with a single item: “Which of the following
statements reflects best your view?” The first statement (coded 0) is “I will not trust a person until

10
there is clear evidence that he or she can be trusted,” while the second statement (coded 1) is “I
will trust a person until I have clear evidence that he or she can’t be trusted.”
3. Trust interactions – Using the following question participants were asked to rate how trusting
they are when interacting with others: “On a scale from 1 to 6 where 1 is “Relatively cautious” and
6 is “Relatively trusting,” how would you describe your interactions with other people?”
4. Trust scale – Due to strong correlations and similarities among the three survey measures of
trust – general trust, trusting attitude and trust interactions – a trust scale was created by combining
them. Because the three questions do not all use the same response scale they were standardized
before being combined. Alpha reliability for the scale was 0.78.
5. Risk taking – A single item measured willingness to take risks: “Some people like taking risks,
or are quick to assume risks, such as starting a business or gambling, while other people are more
cautious about taking risks, for example they prefer a secure job with fixed pay to an uncertain
venture. On a scale from 1 to 6 where 1 is “Very reluctant” and 6 is “Very willing,” how would
you describe your attitude towards taking risks?”
6. Risk attitude – A risk attitude score was derived from responses to a series of choices for an
amount with certainty, or a 50/50 chance of getting a similar, higher or lower amount in the
manner of Holt and Laury (2002); participants were paid randomly for one of their choices.1
1 The risk attitude score was only created for subjects who answered the questions in a consistent manner, resulting in 12 subjects not having a score. Including or excluding risk attitude does not change any of the results reported below.

11
7. Trust-honesty – A single item measured if people think that others are honest if given the
opportunity to cheat: “In your opinion, when presented with the opportunity, would most students
cheat on an exam?” Responded to on a yes/no scale (0=No, 1=Yes).
8. Optimism – A single item asked participants to rate their own level of optimism or pessimism:
“On a scale from 1 to 6 where 1 is "Very pessimistic" and 6 is "Very optimistic," how would you
describe yourself?”
9. Machiavellianism – A scale that asks participants to state their level of agreement or
disagreement to 20 statements on a five-point scale ranging from “Strongly disagree” to “Strongly
agree.”
B. Trusting behavior – trust game
All trust games played in the laboratory portion had the same underlying structure as in
BDM. Individuals, assigned roles A and B, were each credited with ten “experiment dollars” (E$),
which converted to real dollars at the rate E$1 = $0.14 at the end of the session. Subject A was
asked to choose a whole number of experiment dollars, E$Xa (0,1,...,10), to send to subject B,
knowing that B would receive triple the amount sent and could send back a proportion (restricted
to sixths of the amount received e.g., 0, 1/6, 1/3, etc.) of that amount, including nothing. Thus, A
would earn any part of the E$10 kept and could earn an additional amount between E$0 and E$30,
depending on B’s choice. B would earn between E$10 and E$(10 + 3Xa – Xb), where Xb ≤ 3Xa is
the amount B sends to A. The version of the trust games used involved multiple rounds, which
differ slightly from each other. The decisions were made on a grid where rows indicate A’s

12
possible choices of how much to send and columns B’s potential choices of how much to return.
The actual choices were carried out by highlighting a row or a column. The grid is replicated in
Appendix A.
In the first round, subjects played the standard BDM game. In the second round, A could
propose a course of action for A and B by highlighting a row and a column. As pre-announced to
them, if B agreed to A’s proposal by highlighting the same row and column, they were offered
separately (and without knowing the other’s response) the chance to enter into a costly contract. If
either or both subjects said no, there was no contract, and they proceeded to make their decisions,
as in the standard BDM interaction. If both subjects said yes to the first question, they were asked
if they wanted a contract with penalties. If both said yes, they entered into such a contract; if at
least one said no, they remained with a contract without penalties. Contracts with penalties cost
each subject E$1, whereas contracts without penalties cost E$2. In some experimental sessions, the
price of contracts was doubled. The remaining five rounds of the experiment explored other issues,
but are not examined in this paper. A detailed description of the experiment can be found in Ben-
Ner and Putterman (2007).2 From these experiments we derived two measures of trusting – amount
sent by A in the first round, and whether A requested a contract if B agreed to his or her (regardless
of whether the request was accepted or rejected) in the second round.
Amount sent in first round – This is the traditional operationalization of trust derived from the trust
game and is the same approach as in Glaeser et al. (2000). Trust is measured as the number of
experimental dollars, ranging from 0 to 10, sent by participants in role A – trustors – in the first
round of the trust game. In the first round participants do not have prior experience with the game
and have no information about the person with whom they are paired. Participants therefore do not 2 Screen shots from the experiment are available at https://netfiles.umn.edu/users/benne001/www/papers/ep/ep-01.pdf.

13
have any game-related information to base their choices on and so are likely to base their choice of
how much to send to the receiver on their propensity to trust others. Sending a larger amount is
commonly interpreted to reflect a greater level of trusting.
Requesting a contract in the second round – This operationalization is whether participants in role
A were not satisfied with only having an agreement (concurrence) by subject B with the proposal
they made but also required additional assurance in the form of a costly contract. Requesting such
a contract is then an indicator of distrust. Of the 102 participants 76 had a partner that agreed to
their proposal and were therefore asked if they wanted a contract.3
Control variables – individual characteristics
A number of control variables were included. Measures of gender, ethnicity, age, being an only
child, and faith in God were included in all analyses. In addition we control for general mental
(cognitive) ability as measured by the Wonderlic Personnel Test and the Big Five personality traits
as captured by the NEO-FFI.4
4. Results
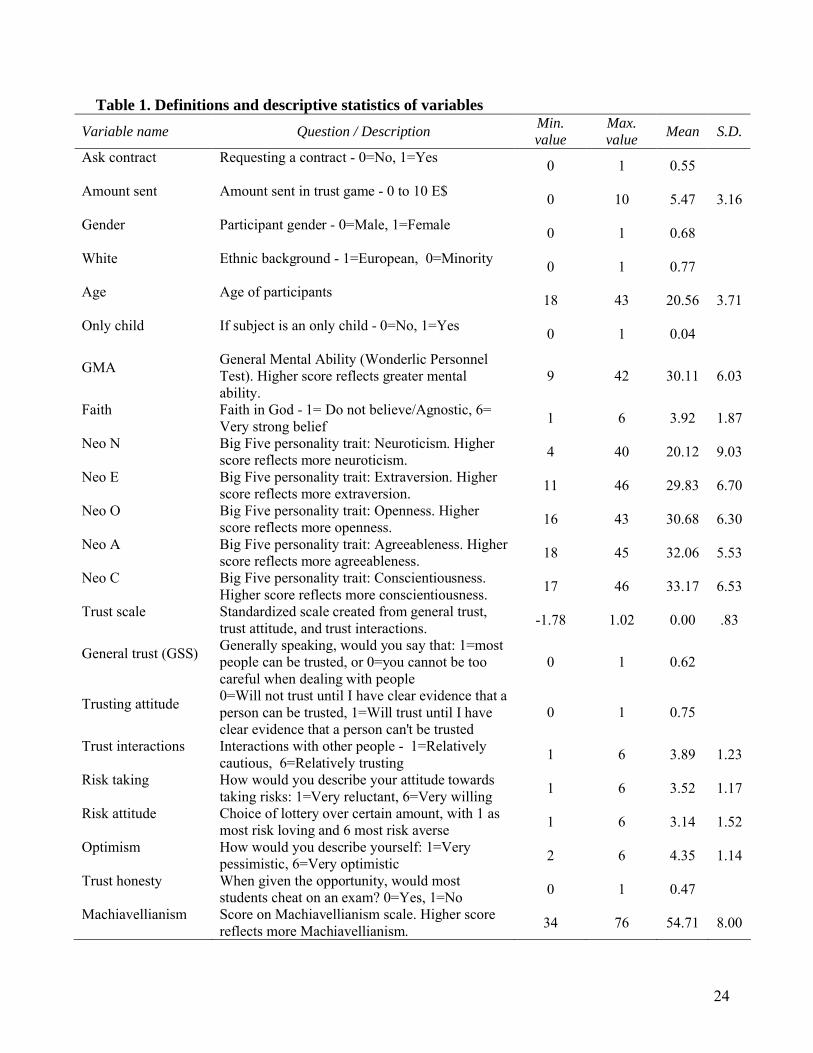
Table 1 displays descriptions of all study variables along with means, standard deviations,
and minimum and maximum values. From the table it can be seen that 55% of participants
requested a contract when asked if they wanted one – so the 45% who did not ask for a contract
may be said to exhibit trust. The average amount sent (in round 1) was 5.46 experimental dollars.
3 In the analysis presented in this paper we do not control for subjects’ experience in round 1 of the experiment, although such experience may affect their degree of trusting and therefore of asking for further assurance in the form of a contract. We have done the analysis that controls for such experience (parallel to Table 5, below) and the results do not differ from those presented in the next section.4 The Wonderlic and NEO are discussed in Ben-Ner, Kong and Putterman (2004).

14
Looking at the trust variables, 62% state that most people can be trusted (GSS trust item) and 75%
say that they tend to trust a person until there is evidence they cannot be trusted. The proportion of
participants claiming to trust is higher here than the 45% Glaeser et al. (2000) found in their
sample for the GSS trust question.
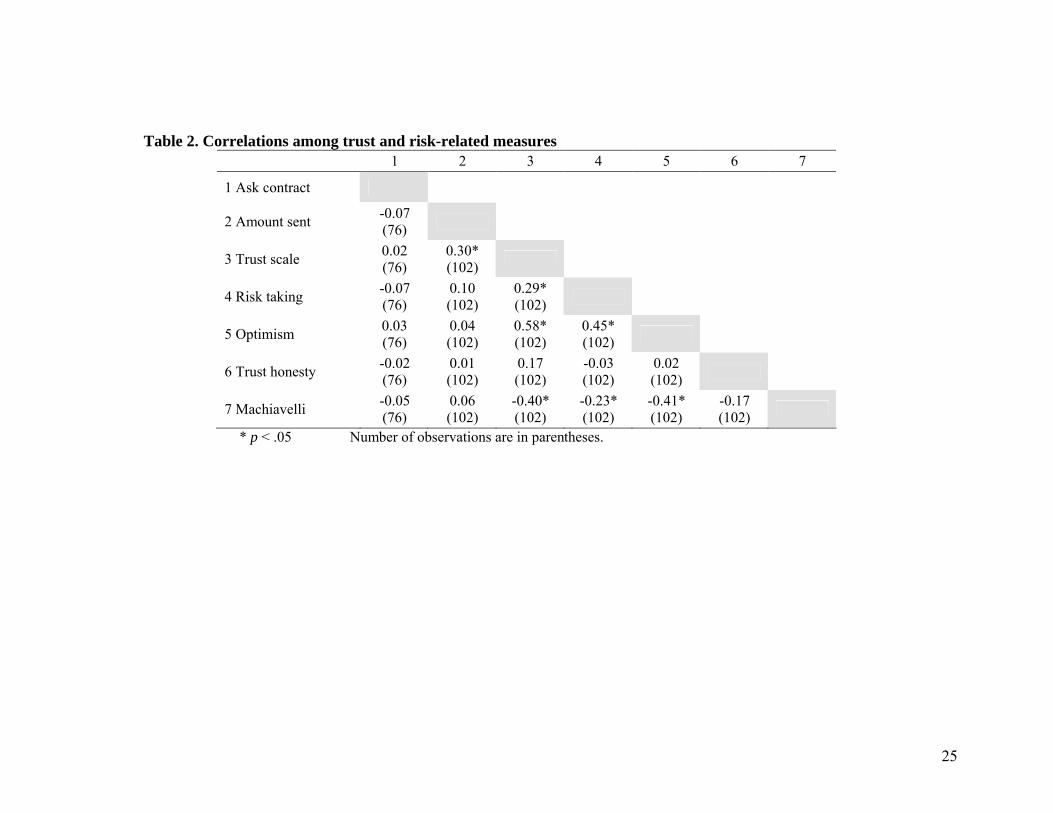
Table 2 shows correlations between all trust and risk-related measures. None of the trust or
risk-taking related variables are significantly correlated with requesting a contract. Only the trust
scale is significantly related with the amount sent. Furthermore, requesting a contract and amount
sent are not significantly correlated with each other, although the direction of the relationship is
negative, as expected.
Age is the only control variable significantly related to asking for a contract, while gender
is significantly related to the amount sent (see Table 3). A number of the trust survey measures
show relationships with other control variables, especially with faith in God, neuroticism,
extraversion, and conscientiousness.
We used regression analysis to test if the survey measures of trust and risk preferences are
associated with participants’ behavior in the trust game. Due to the combined effect of missing
observations for different variables, the number of observations in regressions is short of the full
sample. First, OLS regressions were run with the amount sent as the dependent variable. For each
regression model the control variables were entered first followed by one of the trust-related
survey measures (see Table 4). The final regression in the table includes all control variables and
all the trust and risk-related measures in a single model. The results show that the trust scale is the
only survey measure of trust that significantly predicts the amount sent, with those claiming to be
more trusting on the survey sending larger amounts. (Running the regressions using the questions
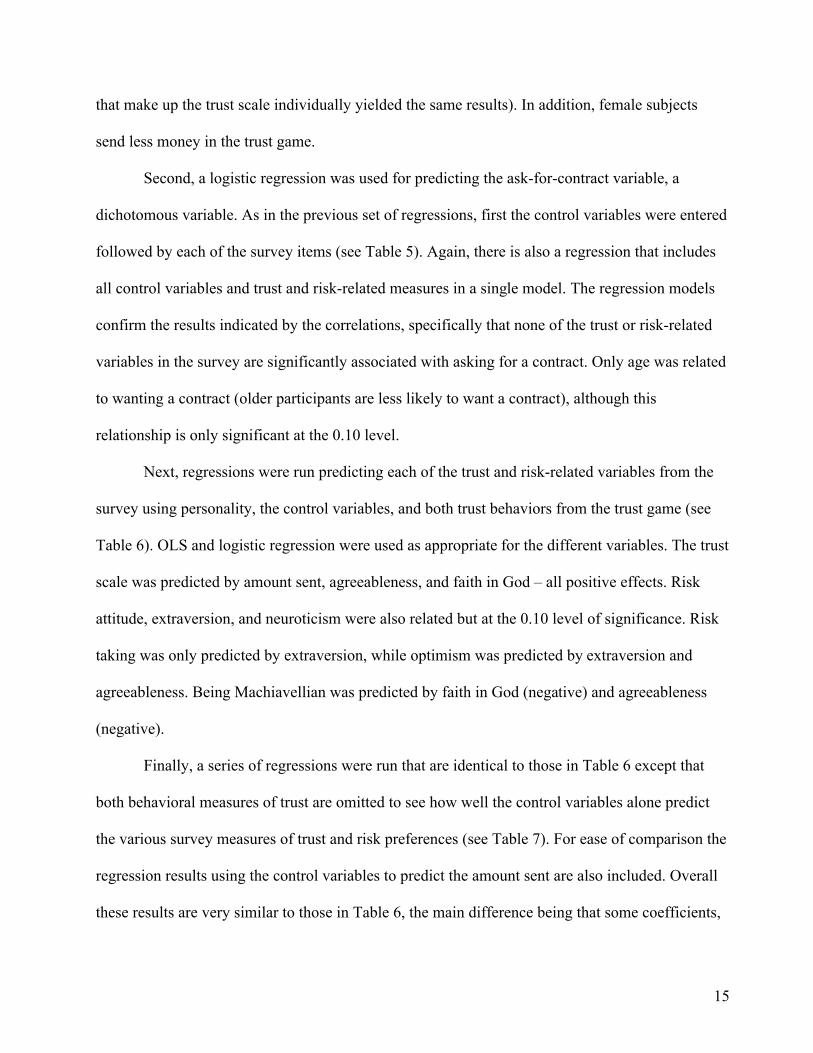
15
that make up the trust scale individually yielded the same results). In addition, female subjects
send less money in the trust game.
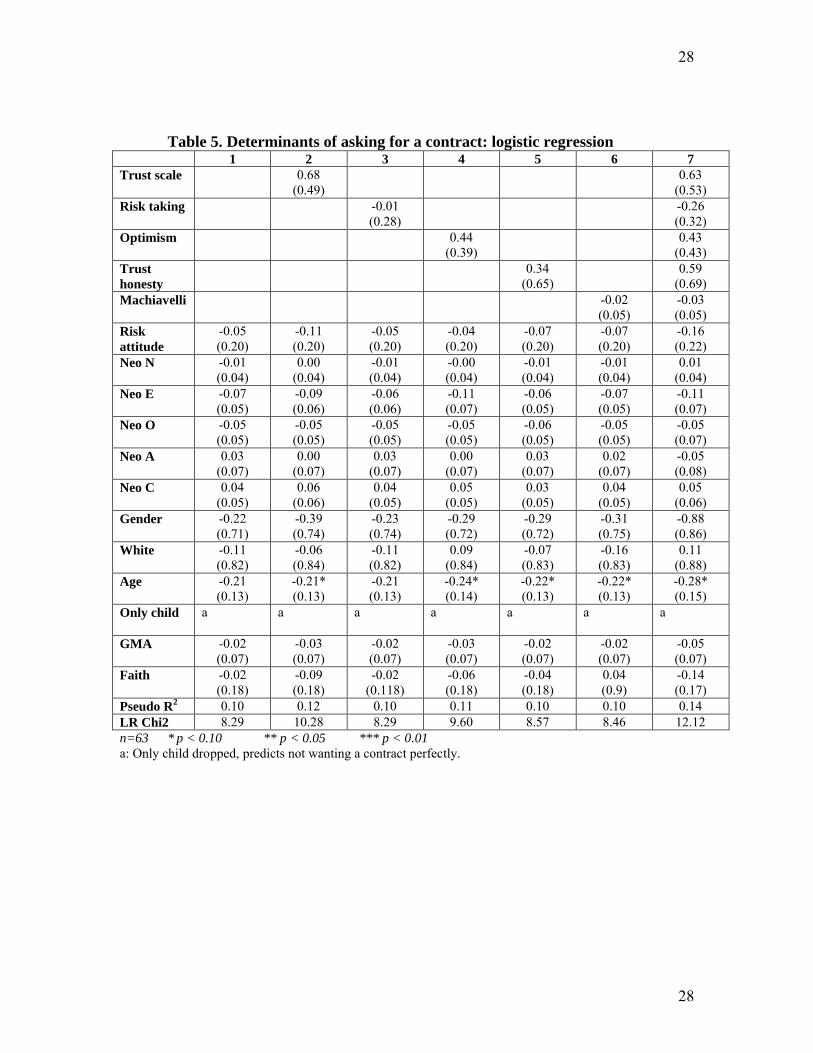
Second, a logistic regression was used for predicting the ask-for-contract variable, a
dichotomous variable. As in the previous set of regressions, first the control variables were entered
followed by each of the survey items (see Table 5). Again, there is also a regression that includes
all control variables and trust and risk-related measures in a single model. The regression models
confirm the results indicated by the correlations, specifically that none of the trust or risk-related
variables in the survey are significantly associated with asking for a contract. Only age was related
to wanting a contract (older participants are less likely to want a contract), although this
relationship is only significant at the 0.10 level.
Next, regressions were run predicting each of the trust and risk-related variables from the
survey using personality, the control variables, and both trust behaviors from the trust game (see
Table 6). OLS and logistic regression were used as appropriate for the different variables. The trust
scale was predicted by amount sent, agreeableness, and faith in God – all positive effects. Risk
attitude, extraversion, and neuroticism were also related but at the 0.10 level of significance. Risk
taking was only predicted by extraversion, while optimism was predicted by extraversion and
agreeableness. Being Machiavellian was predicted by faith in God (negative) and agreeableness
(negative).
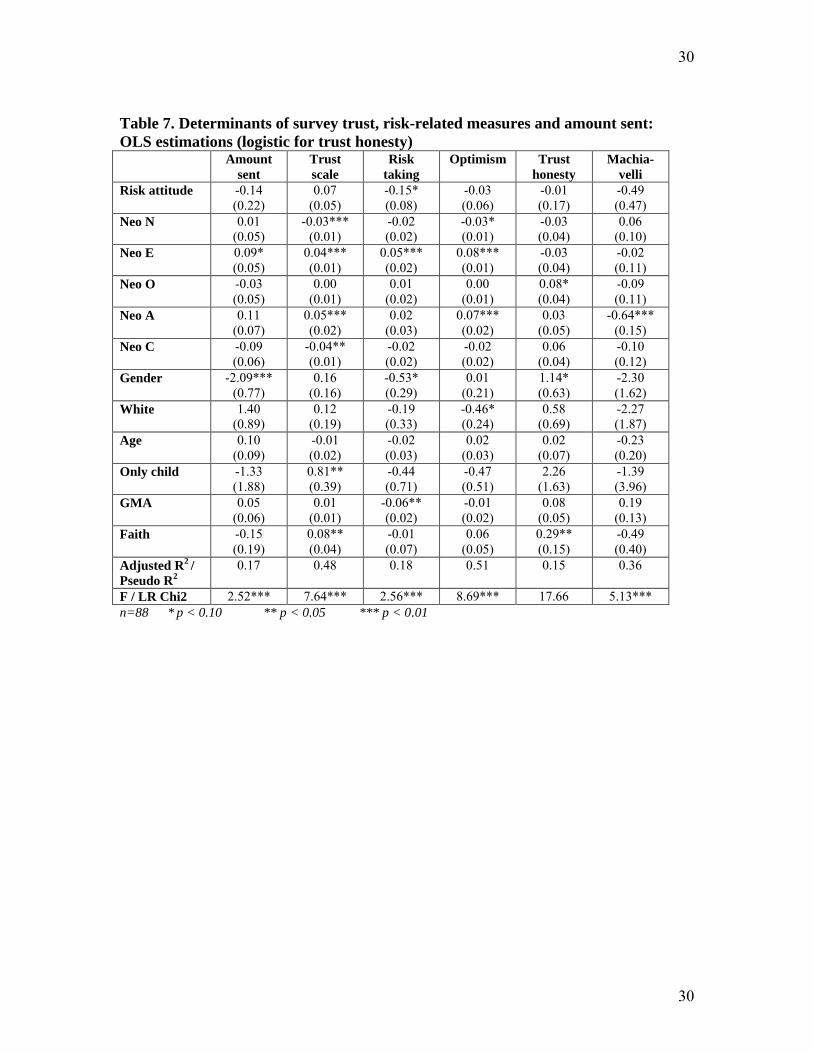
Finally, a series of regressions were run that are identical to those in Table 6 except that
both behavioral measures of trust are omitted to see how well the control variables alone predict
the various survey measures of trust and risk preferences (see Table 7). For ease of comparison the
regression results using the control variables to predict the amount sent are also included. Overall
these results are very similar to those in Table 6, the main difference being that some coefficients,
16
like the big five personality variables, become more significant. The amount of variance explained
by each regression model, while usually a little lower as would be expected, is in fact quite similar
to that in Table 6. Notably, amount sent is not predicted by personality, whereas the trust scale is
explained well by it. As before, faith in God is (positively) associated with the trust scale but not
sending.
5. Discussion and conclusions
There is substantial agreement in the behavioral and social sciences about the meaning of
trust. But how is trust to be measured empirically? One approach consists of surveying people,
more or less directly, whether or to what degree they trust others. Another approach investigates
behaviors that reflect differing degrees of trusting. The empirical literature on trust adopts one
approach or the other, but all the conclusions they draw about trust (e.g., its determinants or
consequences) are of course contingent on the appropriateness of their measures of trust.
A small but growing literature has begun to evaluate the relationship between measures
derived from the two approaches, focusing on survey-based measures and the behavioral measure
of amount sent in trust experiments (especially those based on Berg, Dickhaut and McCabe, 1995).
Our study adds three elements to this literature. First, it examines two behavioral measures, the
amount sent by trustors in the trust game experiment, and a new measure, asking for a contract to
back an agreement between trustor and trustee concerning what each should do. Second, we relate
these behavioral measures to several survey measures that are designed to capture trust with a
different degree of directness and/or capture different dimensions of trust. Our experiment-based
behavioral and survey-based measures were collected from the same participants at different times,
unlike other studies, lowering the likelihood of cross-influences or both types of measures being

17
subject to similar emotional, mood or external priming, which would have caused possibly higher
correlation among them. Third, we relate the various measures of trust to subjects’ age, gender,
personality, general mental ability, having siblings or being an only child, and the degree of faith
in God.
We find that:
- Amount sent by the ‘trustor’ to the ‘trustee’ in the trust game experiment is strongly
associated with the trust scale that we constructed from (a) responses to the familiar
General Social Survey question (“Generally speaking, would you say that most people can
be trusted, or that you cannot be too careful when dealing with people?”), (b) endorsement
of a simple trusting attitude statement (“I will not trust a person until there is clear evidence
that he or she can be trusted” versus “I will trust a person until I have clear evidence that he
or she can’t be trusted”), and (c) responses to “how would you describe your interactions
with other people?” (from “relatively cautious” to “relatively trusting”).
- However, amount sent and the trust scale are not predicted by the same variables,
suggesting the possibility that to some extent they capture difference dimensions of trusting
(or different dispositions that are correlated with trust).
- Amount sent is not associated with other putative measures of trusting (implied by the
commonly-accepted definition quoted at the end of the first paragraph of this paper),
including two measures of the attitude towards risk (related to the willingness to be
vulnerable), belief in others’ honesty vs. opportunism (having a positive perspective on the
intentions of others), optimism (idem), and Machiavellian perspective on social interactions
(therefore not trusting others because of the belief that they are Machiavellian and thus
untrustworthy).

18
- Asking for a binding contract to back-up a non-binding agreement is not correlated with the
trust scale (or the underlying items) or any other items we tested.
- Amount sent and asking for a contract are not correlated. This means that participants who
send more in the trust experiment (and thus exhibited more trust in their counterparts) are
no more likely to exhibit trust by foregoing a contract than participants who sent lower
amounts.
- The amount sent in the trust game is predicted by only one of the background variables
included in our analyses, gender. The relationship is rather strong (men in the trustor role
send on average $2 more than women). Less trusting on the part of women does not show
up in other measures of trusting.
- Personality predicts quite well our trust scale (more agreeable and extrovert and less
conscientious participants are more trusting), but as noted earlier, not the amount sent or
asking for a contract.5
- Risk preferences, captured by the lottery-based risk attitude measure and the risk taking
survey measure, are not associated with behavioral or survey measures of trust.
- Greater faith in God translates into a greater score on the trust scale.
- General mental ability has no association with our measures (an exception is the survey
question about risk taking; suggesting that higher ability is associated with less risk taking).
These findings lend support to the usage of the amount sent in the trust game and the trust
scale composed of three questions probing directly about trusting. However, while being related to
each other, the two types of trust measures – amount sent and survey items – are still different in
some important ways. One possibility is that participants are not very good at evaluating their own
5 It is possible the relationships between the trust scale and other survey measures used here are affected by common method bias. Unlike the trust game measures, all the survey items were part of the same questionnaire and were completed at the same point in time.

19
level of trusting as they are required to do when answering survey items relating to trust. Another
possibility is that people claim to be more trusting when answering such survey questions than
they really are when given the chance to actually exhibiting trusting behavior, such as sending real
amounts of money in the trust game. There is indirect evidence that personality factors may play a
role in such behavior: Ben-Ner, Kramer and Levy (2007) found that individuals high on
extraversion tend to say that they would send larger amounts in a hypothetical dictator game then
they do in a dictator game when real money is involved. This being the case it could at least
partially explain why the relationship between survey measures of trust and behavior in the trust
game is weaker then expected. On the other hand, it is also possible that the amount sent in the
trust game is not a good measure of trust as choices made by participants in the game may be
affected by aspects of the game itself. Senders may choose an amount to send based on their sense
that their counterpart will act fairly rather than it being purely based on trust, that is, participants
may expect that most people in this situation will choose to send some money back because it is
the fair and equitable thing to do. If such factors have an effect, it might result in behavior that is to
some extent related to trust, but that is also influenced by other factors. Yet another possibility is
that the survey measures and behavioral measures are not capturing the same type of trust. Survey
measures of trust might be capturing trust in a more general manner and thus being applicable to a
broad range of situations while behavior in the trust game might reflect a more specific trust within
the context of mutual gain situations. Future research might address the relationship between
different measures of trust and various concrete situations in which trust can be exhibited. It would
therefore be beneficial to find alternative measures of trust. These measures could then be
compared to amount sent in the trust game, to survey measures of trust, and to other variables of
interest, in an effort to shed some light on different ways of capturing trust. To this end we

20
proposed a new behavioral measure of trust, based on whether subjects requested a contract to be
in place if an agreement was reached with their counterpart regarding amounts to be sent and
returned. In the logistic regressions explaining wanting a contract, none of the survey items
predicted it (with the exception of age). Interestingly, amount sent and asking for a contract do not
correlate significantly, although the direction is negative as expected. Furthermore, asking for a
contract shows no correlation with the trust scale or with risk taking, optimism, Machiavellianism,
and belief in others’ honesty. Our intuition suggests that asking for a contract to back up a non-
binding agreement is a strong indicator of lack of trust, and vice versa, that not asking for a
contract indicates trust in others’ intentions. The lack of relationship between asking for a contract
and all other measures of trust is therefore puzzling. One possible answer to this puzzle is that the
three quarters of the pairs of participants who did reach an agreement are different from those who
did not, perhaps in the types of proposals they made, which are correlated with their degree of
trusting, and their proposals are more likely to be accepted by trustees than the proposals made by
trustors in the quarter of pairs that did not reach an agreement. Another possibility is, of course,
that not asking for a contract reflects a different type of trust.
So what trust measures are we to trust? Our research indicates that both survey trust
measures and amount sent measure approximately the same thing, and that must b strongly related
to what we all call trust. It will be useful to understand in greater detail the applicability of these
measures to specific and concrete situations, such as those represented by zero-sum or positive-
sum games.
Acknowledgements
This research was generously supported by The Russell Sage Foundation.

21
References
Ashraf, N., I. Bohnet & N. Piankov. (2006). Decomposing Trust and Trustworthiness.
Experimental Economics, 9, 193-208.
Ben-Ner, A., Kong F., & Putterman L. (2004). Share and Share Alike? Gender-Pairing,
Personality, and Cognitive Ability as Determinants of Giving. Journal of Economic
Psychology, 25, 581-589.
Ben-Ner, A, A. Kramer & O. Levy (2007). Economic and Hypothetical Dictator Game
Experiments: Incentive Effects at the Individual Level. Working Paper, Industrial Relations
Center, Carlson School of Management, University of Minnesota.
Ben-Ner, A., & L. Putterman. (2007). Trust, Communication, and Contracts: An Experiment.
Working Paper, Industrial Relations Center, Carlson School of Management, University of
Minnesota.
Berg, J., J. Dickhaut, & K. McCabe. (1995). Trust, Reciprocity, and Social History. Games and
Economic Behavior, 10, 122-142.
Bigley, G. A. & J.L. Pearce. (1998). Straining for a Shared Meaning in Organization Science:
Problems of Trust and Distrust. Academy of Management Review, 23, 405-421.
Bohnet, I., & R. Zeckhauser. (2004). Trust, Risk, and Betrayal. Journal of Economic Behavior and
Organization, 55, 467-484.
Camerer, Colin, 2003, Behavioral Game Theory. Princeton, New Jersey: Princeton University
Press.
Costa, A. C., (2003). Nature and Antecedents of Trust in Work Teams. In B. Nooteboom & F. Six
(Eds.), The Trust Process in Organizations (pp.105-124). Cheltenham, UK: Edward Elgar.
Cox, J. (2004). How to Identify Trust and Reciprocity. Games and Economic Behavior 46, 260-81.
22
Eckel, C. C., & R.K. Wilson. (2004). Is Trust a Risky Decision? Journal of Economic Behavior
and Organization, 55, 447-465.
Fehr, E., U. Fischbacher, B. von Rosenbladt, J. Schupp, & G.G. Wagner. (2003). A Nation-Wide
Laboratory. Examining Trust and Trustworthiness by Integrating Behavioral Experiments
into Representative Surveys. Institute for Empirical Research in Economics, University of
Zürich, Working Paper No. 141.
Fukuyama, F. (1995). Trust. New York: The Free Press.
Gächter, S., B. Herrmann, & C. Thöni. (2004). Trust, Voluntary Cooperation, and Socio-Economic
Background: Survey and Experimental Evidence. Journal of Economic Behavior &
Organization, 55, 505-531.
Glaeser, E. L., D.I. Laibson, J.A. Scheinkman, & C.L. Soutter. (2000). Measuring Trust. The
Quarterly Journal of Economics, 115, 811-846.
Gunnthorsdottir, A., K. McCabe, & V. Smith. (2002). Using the Machiavellianism Instrument to
Predict Trustworthiness in a Bargaining Game. Journal of Economic Psychology, 23, 49-66.
Holm, H. J., & A. Danielson. (2005). Tropic Trust versus Nordic Trust: Experimental Evidence
from Tanzania and Sweden. The Economic Journal, 115, 505-532.
Holt, C. & S. Laury. (2002). Risk attitude and Incentive Effects. American Economic Review, 92,
1644-1655.
Kee, H. W. & R.E. Knox. (1970). Conceptual and Methodological Considerations in the Study of
Trust and Suspicion. Journal of Conflict Resolution, 14, 357-366.
Lazzarini, S. G., R. C. Madalozzo, R. Artes, & J.O. Siqueira. (2003). Measuring Trust: An
Experiment in Brazil, Ibmec Working Paper No. 40, Ibmec Business School of São Paulo.

23
Mayer, R. C., J.H. Davis, & D. Schoorman. (1995). An Integrative Model of Organizational Trust.
Academy of Management Review, 20, 709-734.
Rosenberg, M. (1957). Occupations and Values. Glencoe, IL: Free Press.
Rotter, J. (1967). A New Scale for the Measurement of Interpersonal Trust. Journal of
Personality, 35, 615-654.
Rousseau, M. T., S. B., Sitkin, S. B. Burt, & C. Camerer. (1998). Not so Different After All: A
Cross-Discipline View of Trust. Academy of Management Review, 23, 393-404.
Schechter, L. (in press).Traditional Trust Measurement and the Risk Confound: An Experiment in
Rural Paraguay. Journal of Economic Behavior and Organization.
24
Table 1. Definitions and descriptive statistics of variables
Variable name Question / DescriptionMin. value
Max. value
Mean S.D.
Ask contract Requesting a contract - 0=No, 1=Yes0 1 0.55
Amount sent Amount sent in trust game - 0 to 10 E$0 10 5.47 3.16
Gender Participant gender - 0=Male, 1=Female0 1 0.68
White Ethnic background - 1=European, 0=Minority0 1 0.77
Age Age of participants18 43 20.56 3.71
Only child If subject is an only child - 0=No, 1=Yes0 1 0.04
GMAGeneral Mental Ability (Wonderlic Personnel Test). Higher score reflects greater mental ability.
9 42 30.11 6.03
Faith Faith in God - 1= Do not believe/Agnostic, 6=Very strong belief
1 6 3.92 1.87
Neo N Big Five personality trait: Neuroticism. Higher score reflects more neuroticism.
4 40 20.12 9.03
Neo E Big Five personality trait: Extraversion. Higher score reflects more extraversion.
11 46 29.83 6.70
Neo O Big Five personality trait: Openness. Higher score reflects more openness.
16 43 30.68 6.30
Neo A Big Five personality trait: Agreeableness. Higher score reflects more agreeableness.
18 45 32.06 5.53
Neo C Big Five personality trait: Conscientiousness. Higher score reflects more conscientiousness.
17 46 33.17 6.53
Trust scale Standardized scale created from general trust, trust attitude, and trust interactions.
-1.78 1.02 0.00 .83
General trust (GSS)Generally speaking, would you say that: 1=most people can be trusted, or 0=you cannot be too careful when dealing with people
0 1 0.62
Trusting attitude0=Will not trust until I have clear evidence that a person can be trusted, 1=Will trust until I have clear evidence that a person can't be trusted
0 1 0.75
Trust interactions Interactions with other people - 1=Relatively cautious, 6=Relatively trusting
1 6 3.89 1.23
Risk taking How would you describe your attitude towards taking risks: 1=Very reluctant, 6=Very willing
1 6 3.52 1.17
Risk attitude Choice of lottery over certain amount, with 1 as most risk loving and 6 most risk averse
1 6 3.14 1.52
Optimism How would you describe yourself: 1=Very pessimistic, 6=Very optimistic
2 6 4.35 1.14
Trust honesty When given the opportunity, would most students cheat on an exam? 0=Yes, 1=No
0 1 0.47
Machiavellianism Score on Machiavellianism scale. Higher score reflects more Machiavellianism.
34 76 54.71 8.00
25
Table 2. Correlations among trust and risk-related measures1 2 3 4 5 6 7
1 Ask contract
2 Amount sent-0.07(76)
3 Trust scale0.02(76)
0.30*(102)
4 Risk taking-0.07(76)
0.10(102)
0.29*(102)
5 Optimism0.03(76)
0.04(102)
0.58*(102)
0.45*(102)
6 Trust honesty-0.02(76)
0.01(102)
0.17(102)
-0.03(102)
0.02(102)
7 Machiavelli-0.05(76)
0.06(102)
-0.40*(102)
-0.23*(102)
-0.41*(102)
-0.17(102)
* p < .05 Number of observations are in parentheses.

26
Table 3. Correlations between trust and risk-related measures and personality and other control variables
Gender White AgeOnly child
GMA Faith Neo N Neo E Neo O Neo A Neo CRisk
attitude
Ask contract-0.06(76)
0.12(75)
-0.26*(76)
-0.14(76)
-0.04(76)
0.02(76)
-0.07(76)
-0.11(75)
-0.22(76)
0.00(76)
0.05(76)
0.04(68)
Amount sent-0.31*(102)
0.19(101)
0.02(102)
-0.13(102)
0.10(102)
0.07(102)
-0.08(102)
0.19(101)
-0.04(102)
0.12(102)
-0.07(102)
0.03(90)
Trust scale-0.09(102)
0.09(101)
0.01(102)
0.06(102)
0.08(102)
0.29*(102)
-0.44*(102)
0.53*(101)
0.01(102)
0.49*(102)
0.14(102)
0.18(90)
Risk taking-0.21*(102)
0.04(101)
-0.01(102)
-0.00(102)
-0.13(102)
0.22*(102)
-0.23*(102)
0.38*(101)
0.08(102)
0.16(102)
0.06(102)
-0.16(90)
Optimism-0.14(102)
0.07(101)
-0.01(102)
-0.06(102)
0.05(102)
0.29*(102)
-0.49*(102)
0.64*(101)
0.02(102)
0.47*(102)
0.27*(102)
0.06(90)
Trust honesty0.11(102)
-0.06(101)
-0.07(102)
0.11(102)
0.09(102)
0.18(102)
-0.08(102)
0.05(101)
0.17(102)
0.18(102
0.21*(102
-0.03(90)
Machiavelli-0.03(102)
-0.13(101)
-0.11(102)
0.00(102)
0.19(102)
-0.12(102)
0.32*(102)
-0.24*(101)
-0.13(102)
-0.59*(102)
-0.36*(102)
-0.16(90)
* p < .05 Number of observations are in parentheses.

27
27
Table 4. Determinants of amount sent: OLS estimations1 2 3 4 5 6 7
Trust scale 1.66***(0.52)
1.81***(0.54)
Risk taking -0.06(0.31)
-0.05(0.30)
Optimism -0.23(0.43)
-0.43(0.43)
Trust honesty
0.67(0.68)
0.39(0.67)
Machiavelli 0.05(0.05)
0.06(0.05)
Risk attitude
-0.14(0.22)
-0.26(0.22)
-0.15(0.23)
-0.14(0.23)
-0.13(0.22)
-0.11(0.23)
-0.26(0.22)
Neo N 0.01(0.05)
0.06(0.05)
0.01(0.05)
0.00(0.05)
0.01(0.05)
0.01(0.04)
0.05(0.05)
Neo E 0.09*(0.05)
0.03(0.06)
0.10*(0.06)
0.11*(0.06)
0.10(0.05)
0.09*(0.05)
0.06(0.06)
Neo O -0.03(0.05)
-0.03(0.05)
-0.03(0.05)
-0.03(0.05)
-0.05(0.05)
-0.03(0.05)
-0.03(0.05)
Neo A 0.11(0.07)
0.03(0.07)
0.11(0.07)
0.12(0.08)
0.10(0.07)
0.14*(0.08)
0.08(0.08)
Neo C -0.09(0.06)
-0.03(0.06)
-0.10(0.06)
-0.10*(0.06)
-0.10*(0.06)
-0.09(0.06)
-0.03(0.06)
Gender -2.09***(0.77)
-2.35***(0.73)
-2.12***(0.79)
-2.08***(0.77)
-2.24***(0.79)
-1.97***(0.78)
-2.35***(0.78)
White 1.40(0.89)
1.20(0.84)
1.39(0.90)
1.29(0.92)
1.32(0.89)
1.51*(0.90)
1.06(0.89)
Age 0.10(0.09)
0.11(0.09)
0.10(0.09)
0.10(0.09)
0.10(0.09)
0.11(0.09)
0.11(0.09)
Only child -1.33(1.88)
-2.67(1.82)
-1.36(1.90)
-1.44(1.90)
-1.62(1.90)
-1.26(1.88)
-3.10*(1.87)
GMA 0.05(0.06)
0.06(0.06)
0.05(0.06)
0.05(0.06)
0.04(0.06)
0.04(0.06)
0.01(0.06)
Faith -0.15(0.19)
-0.29(0.18)
-0.15(0.19)
-0.14(0.19)
-0.19(0.19)
-0.13(0.19)
-0.28(0.19)
Adjusted R2
0.17 0.26 0.16 0.17 0.17 0.17 0.26
F 2.52*** 3.39*** 2.30** 2.33** 2.40*** 2.39*** 2.76*** n=88 * p < 0.10 ** p < 0.05 *** p < 0.01
28
28
Table 5. Determinants of asking for a contract: logistic regression1 2 3 4 5 6 7
Trust scale 0.68(0.49)
0.63(0.53)
Risk taking -0.01(0.28)
-0.26(0.32)
Optimism 0.44(0.39)
0.43(0.43)
Trust honesty
0.34(0.65)
0.59(0.69)
Machiavelli -0.02(0.05)
-0.03(0.05)
Risk attitude
-0.05(0.20)
-0.11(0.20)
-0.05(0.20)
-0.04(0.20)
-0.07(0.20)
-0.07(0.20)
-0.16(0.22)
Neo N -0.01(0.04)
0.00(0.04)
-0.01(0.04)
-0.00(0.04)
-0.01(0.04)
-0.01(0.04)
0.01(0.04)
Neo E -0.07(0.05)
-0.09(0.06)
-0.06(0.06)
-0.11(0.07)
-0.06(0.05)
-0.07(0.05)
-0.11(0.07)
Neo O -0.05(0.05)
-0.05(0.05)
-0.05(0.05)
-0.05(0.05)
-0.06(0.05)
-0.05(0.05)
-0.05(0.07)
Neo A 0.03(0.07)
0.00(0.07)
0.03(0.07)
0.00(0.07)
0.03(0.07)
0.02(0.07)
-0.05(0.08)
Neo C 0.04(0.05)
0.06(0.06)
0.04(0.05)
0.05(0.05)
0.03(0.05)
0.04(0.05)
0.05(0.06)
Gender -0.22(0.71)
-0.39(0.74)
-0.23(0.74)
-0.29(0.72)
-0.29(0.72)
-0.31(0.75)
-0.88(0.86)
White -0.11(0.82)
-0.06(0.84)
-0.11(0.82)
0.09(0.84)
-0.07(0.83)
-0.16(0.83)
0.11(0.88)
Age -0.21(0.13)
-0.21*(0.13)
-0.21(0.13)
-0.24*(0.14)
-0.22*(0.13)
-0.22*(0.13)
-0.28*(0.15)
Only child a a a a a a a
GMA -0.02(0.07)
-0.03(0.07)
-0.02(0.07)
-0.03(0.07)
-0.02(0.07)
-0.02(0.07)
-0.05(0.07)
Faith -0.02(0.18)
-0.09(0.18)
-0.02(0.118)
-0.06(0.18)
-0.04(0.18)
0.04(0.9)
-0.14(0.17)
Pseudo R2 0.10 0.12 0.10 0.11 0.10 0.10 0.14LR Chi2 8.29 10.28 8.29 9.60 8.57 8.46 12.12n=63 * p < 0.10 ** p < 0.05 *** p < 0.01a: Only child dropped, predicts not wanting a contract perfectly.

29
29
Table 6. Determinants of survey trust and risk-related measures including behavioral measures: OLS estimations (logistic for trust honesty)
Trust scale
Risk taking
Optimism Trust honesty
Machia-velli
Ask for contract
0.23(0.16)
-0.01(0.29)
0.19(0.22)
0.24(0.66)
-0.51(1.65)
Amount sent 0.07**(0.03)
0.07(0.05)
-0.01(0.04)
0.09(0.13)
0.39(0.30)
Risk attitude 0.09*(0.05)
-0.11(0.10)
-0.06(0.07)
0.15(0.22)
-0.45(0.56)
Neo N -0.02*(0.01)
-0.01(0.02)
-0.02(0.01)
-0.01(0.04)
-0.02(0.11)
Neo E 0.03*(0.01)
0.06**(0.03)
0.09***(0.02)
-0.04(0.06)
-0.08(0.15)
Neo O 0.00(0.07)
0.02(0.02)
-0.01(0.02)
0.08(0.05)
-0.12(0.13)
Neo A 0.04**(0.02)
-0.00(0.03)
0.08***(0.03)
0.07(0.08)
-0.53***(0.19)
Neo C -0.02(0.01)
-0.03(0.03)
-0.04*(0.02)
0.13*(0.07)
-0.06(0.15)
Gender 0.32*(0.19)
-0.52(0.35)
0.11(0.26)
1.16(0.85)
-2.80(1.97)
White -0.15(0.22)
-0.28(0.41)
-0.39(0.31)
-0.33(0.92)
-3.75(2.36)
Age -0.00(0.03)
-0.07(0.05)
0.03(0.04)
0.11(0.12)
-0.45(0.31)
Only child 0.89**(0.41)
-0.23(0.76)
-0.18(0.58)
1.51(1.69)
-3.36(4.36)
GMA 0.01(0.02)
-0.06*(0.03)
0.00(0.02)
-0.02(0.08)
0.01(0.19)
Faith 0.13***(0.05)
-0.09(0.08)
0.09(0.06)
0.30(0.20)
-1.07**(0.48)
Adjusted R2 / Pseudo R2
0.49 0.23 0.52 0.24 0.29
F / LR Chi2 5.42*** 2.36** 6.08*** 21.71* 2.88***n=66 * p < 0.10 ** p < 0.05 *** p < 0.01
30
30
Table 7. Determinants of survey trust, risk-related measures and amount sent: OLS estimations (logistic for trust honesty)
Amount sent
Trust scale
Risk taking
Optimism Trust honesty
Machia-velli
Risk attitude -0.14(0.22)
0.07(0.05)
-0.15*(0.08)
-0.03(0.06)
-0.01(0.17)
-0.49(0.47)
Neo N 0.01(0.05)
-0.03***(0.01)
-0.02(0.02)
-0.03*(0.01)
-0.03(0.04)
0.06(0.10)
Neo E 0.09*(0.05)
0.04***(0.01)
0.05***(0.02)
0.08***(0.01)
-0.03(0.04)
-0.02(0.11)
Neo O -0.03(0.05)
0.00(0.01)
0.01(0.02)
0.00(0.01)
0.08*(0.04)
-0.09(0.11)
Neo A 0.11(0.07)
0.05***(0.02)
0.02(0.03)
0.07***(0.02)
0.03(0.05)
-0.64***(0.15)
Neo C -0.09(0.06)
-0.04**(0.01)
-0.02(0.02)
-0.02(0.02)
0.06(0.04)
-0.10(0.12)
Gender -2.09***(0.77)
0.16(0.16)
-0.53*(0.29)
0.01(0.21)
1.14*(0.63)
-2.30(1.62)
White 1.40(0.89)
0.12(0.19)
-0.19(0.33)
-0.46*(0.24)
0.58(0.69)
-2.27(1.87)
Age 0.10(0.09)
-0.01(0.02)
-0.02(0.03)
0.02(0.03)
0.02(0.07)
-0.23(0.20)
Only child -1.33(1.88)
0.81**(0.39)
-0.44(0.71)
-0.47(0.51)
2.26(1.63)
-1.39(3.96)
GMA 0.05(0.06)
0.01(0.01)
-0.06**(0.02)
-0.01(0.02)
0.08(0.05)
0.19(0.13)
Faith -0.15(0.19)
0.08**(0.04)
-0.01(0.07)
0.06(0.05)
0.29**(0.15)
-0.49(0.40)
Adjusted R2 / Pseudo R2
0.17 0.48 0.18 0.51 0.15 0.36
F / LR Chi2 2.52*** 7.64*** 2.56*** 8.69*** 17.66 5.13***n=88 * p < 0.10 ** p < 0.05 *** p < 0.01

31
31
Appendix A. Decision (interaction) grid