Measuring the value of forests in a green economy clean · Green Economy (ECE/FAO, 2014) which...
31
Ba ackgroun d paper for the e expert wo orkshop o on 21 Oc ctober 20 016
Transcript of Measuring the value of forests in a green economy clean · Green Economy (ECE/FAO, 2014) which...
Baackground paper f
for the eexpert woorkshop oon 21 Occtober 20016
1
Acknowledgements
The ECE/FAO Joint Secretariat engaged Derek Eaton and Christopher Prins as consultants for the
preparation of this background paper. Alicja Kacprzak was leading the preparation and organization
of the workshop on behalf of the secretariat. She also coordinated the work on the paper with the
support of other members of the secretariat.
Disclaimer
The contents of this paper do not necessarily reflect the views or policies of the United Nations, the
ECE/FAO secretariat, the ECE Committee on Forests and the Forest Industry or the FAO European
Forestry Commission.
September 2016

2
Contents1. Introduction: how can the forest sector contribute to a green economy and why should we
measure this contribution? ..................................................................................................................... 3
2. Green economy related definitions and concepts .......................................................................... 4
3. Internationally developed assessment methods for a green economy ......................................... 6
3.1. Overview of assessment methods ............................................................................................... 7
3.2. UNEP Green Economy Indicators ................................................................................................ 9
3.3. OECD Green Growth Indicators .................................................................................................. 9
3.4. UNEP Green Economy Progress Index ...................................................................................... 10
3.5. National initiatives .................................................................................................................... 12
4. Natural Capital Assessment Methods ........................................................................................... 13
4.1. System of Environmental Economic Accounting .................................................................. 13
4.2. Wealth Accounting and the Valuation of Ecosystem Services (WAVES) .............................. 14
4.3. The Economics of Ecosystems and Biodiversity (TEEB) ........................................................ 14
5. Overview of assessment systems, including criteria and indicators developed by the forest
sector which could be used to measure progress of the forest sector towards a green economy ..... 15
5.1. Can present forest sector monitoring systems assess the sector’s progress towards a green
economy? .......................................................................................................................................... 15
5.2. The role of green national accounting in the work on measuring progress of the forest
sector towards a green economy ..................................................................................................... 18
...................................................................................................................................................... 20
5.3. What is needed to put in place an effective system to measure the progress of the forest
sector towards a green economy?.................................................................................................... 21
5.4. An approach to measuring progress of the forest sector towards a green economy .......... 22
What questions should a measurement system try to answer? .................................................. 22
Structure ....................................................................................................................................... 22
Six main areas of measurement.................................................................................................... 23
Some indicators which might be used to measure progress of the forest sector towards a green
economy ....................................................................................................................................... 24
3
1. Introduction:howcantheforestsectorcontributetoagreeneconomyandwhyshouldwemeasurethiscontribution?The green economy and associated concepts such as the bioeconomy or the circulareconomy are closely linked to sustainable development. The 2030 Agenda forSustainableDevelopmentadopted in2016providedtheUNsystemwithamandate tocontributetoitsimplementation.Transitioningtoagreeneconomyisanambitiousandcomprehensivegoalwhichwillaffectallregions,allsectorsoftheeconomyandallpartsofthesociety,eachinadifferentway.
The forest sector, basedon a renewable rawmaterial,wood, processed in away thatcauseslittlewaste,andisfrequentlyrecoveredandrecycledafteruse,hasanimportantrole in the transition towards a green economy. Carbon is sequestered by growingforests and stored in forests and forest products, or used for energy instead of non‐renewablefuels.IntheECEregion1,almostallnationalandinternationalforestpoliciesand strategies are based on the concept of sustainable forest management whichrequires integrating economic, social and environmental aspects, and has been wellarticulatedinsetsofcriteriaandindicators.
Therearemanyways to increase the forest sector’s contribution toagreeneconomy:theyhavebeenbroughttogetherintheRovaniemiActionPlanfortheForestSectorinaGreen Economy (ECE/FAO, 2014) which describes “how the forest sector in the ECEregioncouldleadthewaytowardstheemerginggreen,bio‐basedeconomyatthegloballevel”. TheRovaniemiAction Plan,which is voluntary, identifies an overall vision andprinciples,andproposesobjectivesandspecificactions,aswellaspotentialactorswhomightcontributetoachievingthestatedobjectives.
Itisessentialforevidence‐basedpolicymakingtobeabletomeasureprogresstowardspolicygoals.TheRovaniemiActionPlanaimstopromoteevidence‐basedpolicymaking,effective,efficientandequitablepolicyinstrumentsandadequatemonitoringinordertomainstream a green economy in forest sector policies (pillar E). In particular ActionE.2.3 of the Rovaniemi Action Plan is to “develop the forest sector’s contribution tobroadergreeneconomyindicatorsets”.Itincludes:
“Explorehow“forestsectorindicatorscanbeusedtoreportonagreeneconomy; Discusswithothersectorshowtheywanttoreportontheircontributiontoagreen
economy; Use the pan European and theMontreal Process criteria and indicators to assess
sustainableforestmanagement; Updateindicatorsanddevelopnewoneswheneverappropriate; Ensure that forest sector indicators for green economymonitoring are consistent
with other forest sector indicators, notably those for sustainable forestmanagement”.
1 ECE Region includes 56 member States from Europe, Central Asia as well as United States and Canada: http://www.regionalcommissions.org/about/the‐regional‐commissions/economic‐commission‐for‐europe‐ece/
4
TheUNECE/FAOForestryandTimberSectioninitiatedtheimplementationoftheActionE.2.3 of the Rovaniemi Action Plan during a workshop on “Measuring andcommunicating thecontribution of the forest sector to a greeneconomy” organisedduring theMetsä2013 ‐ Joint sessionof theECECommitteeonForestsand theForestIndustry and the FAO European Forestry Commission in Rovaniemi, Finland, inDecember2013.Theworkshopprovidedan initialproposalas tohowtomeasure theforest sector’sprogress towardsand contribution toagreeneconomy.Thediscussionon that topic continued during the seventy‐second session of the ECE Committee onForestsandtheForestIndustry,heldinKazan,RussiainNovember2014.
TheworkshopinGenevaorganisedon21October2016is intendedtodiscussmovingthisprocessfurtherwiththeparticipationofpartnersfromoutsidetheforestsector.ForthispurposetheUNECE/FAOForestryandTimberSection invitedtocontributetotheworkshop the Green Growth Knowledge Platform (GGKP), Organisation for EconomicCooperationandDevelopment(OECD),TheEconomicsofEcosystemsandBiodiversity(TEEB) Initiative, United Nations Environment Programme (UNEP) and the WealthAccountingandtheValuationofEcosystemServices(WAVES)PartnershipoftheWorldBank.AlsotheStatisticalDivisionsatUNECEandFAOwereconsulted.
At t this stage theworkshopdoesnotaddresspolicychoicesand the futureoutlook–whichare,toacertainextent,implicitintheRovaniemiActionPlan‐butfocusesonhowtomeasureprogressinthiscomplexfield.
Theobjectiveofthisbackgroundpaperfortheworkshopisto:
Present green economy related definitions and concepts, and internationallydevelopedassessmentmethods,notablynaturalcapitalaccountingapproaches,andinthiswayexplorealigningforestsectorapproachestothosebeingusedinwidercontexts;
Proposepreliminarysuggestionsfordiscussion,basedonthe initialdiscussions inRovaniemiandKazan,onhowtheforestsector’scontributiontoagreeneconomycouldbemeasured;
Articulatesomequestionsfordiscussionbytheworkshop.
Thepaper,liketheworkshop,andtheRovaniemiActionPlan,takesanopenapproach,seekingtolearnfrom,andcommunicatewith,expertsfromothersectors,andtoencouragecooperationbetweenthemanyforestsectoractorsintheECEregion,atthenationalandinternationallevel,notably the Forest Europe andMontréal Process,who also participated in the review of thispaper.
2. GreeneconomyrelateddefinitionsandconceptsSustainable development has been the main policy objective pursued by the internationalcommunity since the 1992 United Nations Conference on Environment and Development(UNCED).Variousstrategieshavebeenelaboratedby internationalorganizationsandnationalgovernmentstoachievesustainabledevelopment, inadditiontoeffortsbyotherstakeholders.In2008,giventherangeofeventstakingplaceatthetimeintermsoffinancialmarkets,nationaleconomies, energyandcommodityprices, theconceptof greeneconomywasgiven increased
5
andrenewedattentionasanalternativestrategytoreviveandreorienteconomicdevelopmentand growth, with the additional aim of staying within the bounds of the planet’s naturalresources.TheUnitedNationsEnvironmentProgramme(UNEP)launchedtheGreenEconomyInitiative (GEI), which consisted of global research and country‐level technical assistance.Subsequently,duetogrowingsupportandeffortsfromotheragenciesandstakeholders,“greeneconomyinthecontextofsustainabledevelopmentandpovertyeradication”wasplacedonthe2012Rio+20agendaandwasacknowledgedasatoolforachievingsustainabledevelopment.2
UNEPdefinedagreeneconomyasone that “results in improvedhumanwell‐beingandsocialequity,whilesignificantlyreducingenvironmentalrisksandecologicalscarcities”(UNEP2011).In its simplest expression, a green economy can be thought of as one which is low carbon,resource efficient and socially inclusive. Other definitions have been proposed by variousstakeholders, including somegovernments and coalition groups, but theygenerally representthesamecoreidea(UNDESA2012).
Green economy can be seen as a broad‐ranging policy agenda that serves as a strategy forachieving sustainable development, with an emphasis on aligning economic with social andenvironmentalpolicy.Thisagendarecognizesthepotentialofnewenvironmentallysustainabletechnologiesandgreensectorstobecomethemotorofaneweconomicdevelopmentpathway.Thus,greeneconomypromotesaneconomictransformationprocess,andthisemphasisisalsoreflectedinthedevelopmentofindicatorsframeworks.
Since 2012, the concept of green economy has evolved in both international and nationalcontexts. A large and growing number of countries have sought to elaborate green economypathways,workingwithUNagenciesandtheirinitiatives,suchasthePartnershipforActiononGreenEconomy(PAGE),thePoverty‐EnvironmentInitiative(PEI),theGreenGrowthKnowledgePlatform (GGKP), as well as other stakeholders, including the Global Green Growth Institute(GGGI) among others. Ownership and flexibility have featured prominently as nationalgovernments have developed their own interpretations and strategies for achieving a greeneconomy, recognizing the need for these to be tailored to a country’s circumstances andpriorities.
FollowingRio+20,theGreenEconomyInitiativehasevolvedtonowbereferredtoas“InclusiveGreenEconomy”,whichrecognizestheequalimportanceofequityandsocialcohesionrelativeto respecting environmental limits and critical ecological thresholds. An inclusive greeneconomyisproposedasanalternativetotoday'sdominanteconomicmodel,“toadvancebothsustainabilityandsocialequityasfunctionsofastableandprosperousfinancialsystemwithinthe contours of a finite and fragile planet”.3 An inclusive green economy is presented as apathwaytowardsachievingthe2030AgendaforSustainableDevelopment,eradicatingpovertywhile safeguarding the ecological thresholds, which underpin human health, well‐being anddevelopment(UNEP2015a).
Theemphasisoninclusivenessandtheneedtoaddresssocialequityconcernsdistinguishesagreen economy from other policy agendas. In addition, a green economy includes othersustainability dimensions, such as biodiversity, waste management, fisheries and forestresourcemanagement,inadditiontoclimatechange.
2 Rio+20 refers to the United Nations Conference on Sustainable Development, held in Rio de Janeiro in 2012.
3 http://web.unep.org/greeneconomy/what‐inclusive‐green‐economy
6
Anumberofotherpolicyagendas,whicharecloselyrelatedtoagreeneconomy,haveemergedover the last decade. The closest is green growth, which emerged in parallel as a flagshipinitiative of the Organisation for Economic Co‐operation and Development (OECD): greengrowth“isabout fosteringeconomicgrowthanddevelopmentwhileensuringthatthenaturalassetscontinuetoprovide theresourcesandenvironmentalservicesonwhichourwell‐beingrelies. To do this it must catalyse investment and innovation which will underpin sustainedgrowth and give rise to new economic opportunities” (OECD 2011). The concepts of greengrowth and green economy are very closely aligned and indeed such a perspective has beenrecognizedinthecollaborationontheGGKP,byOECDandUNEP,togetherwiththeWorldBankandtheGGGI.
Both green economy and green growth can be seen as including the concept of low‐carbondevelopmentandlow‐carbongrowth,whichfocussesspecificallyoninvestmentswhichreducecarbonemissions,orat leasttheirgrowthrate.Greeneconomyandgreengrowthalsoincludeotheraspectssuchasresourceefficiencyingeneral(notonlyenergy),wastereductionandthecontribution of natural capital, including nature and ecosystems, to economic development,well‐beingandinclusiveness.
Circulareconomyisalong‐standingconceptwithvariousoriginsanddefinitions.4Theconceptfocusesontheminimizationofwastethroughresource‐efficiency,reusingandrecycling.Atthecore, it is the concept of closed‐loop systems inwhich all rawmaterials are recaptured as aresponse to both growing resource scarcity andwastemanagement challenges. In 2015, theEuropean Commission adopted a “Circular Economy Package” as one its major policyinitiatives.5Acirculareconomycanbeseenasamorespecificstrategy for thetransformationanddevelopmentof industryandinfrastructuretocontributetosustainableconsumptionandproduction (SCP). UNEP (2015) has recognized a circular economy as one of the keycomponentsofaninclusivegreeneconomy.
Bioeconomy,anothergreeneconomy‐relatedconcept,alsorespondstoconcernsaboutgrowingscarcity of resources, but in this case, biological resources, such as those from agriculture,forestry and fisheries. This policy agenda emphasizes a transition towards an optimal andsustainableuseof renewablebiological resources,asmaterialsandbio‐energy.TheEuropeanCommission adopted a Bioeconomy Strategy in 2012 which focuses on innovation andtechnology development.6 The pursuit of a sustainable bioeconomy can also be seen ascontributingtoSCP,andhenceagreeneconomy.Takingasimpleperspective,bioeconomycanbeseenasaddressingthebiomass‐basedsectorsofagreeneconomy,whilecirculareconomyisconcerned with the more abiotic‐based sectors of a green economy, such as industry andmanufacturing.
3. InternationallydevelopedassessmentmethodsforagreeneconomyInviewoftheattentionbeingplacedonthefindingofwaystooperationalisethegreeneconomyandrelatedconcepts, so that countries canachievesustainabledevelopmentobjectives, therewasaneedtodevelopmethodstoassessprogressinthis.
4 https://www.ellenmacarthurfoundation.org/circular‐economy 5 http://ec.europa.eu/environment/circular‐economy/index_en.htm
6 http://ec.europa.eu/research/bioeconomy/index.cfm?pg=policy&lib=strategy
7
Thischapterprovidesanoverviewofinternationalworkwhichhasbeendevelopedinthelastfewdecades toassess theprogress towardsagreeneconomyandthevalueofnaturalcapitalandecosystemservices.InternationalassessmentmethodswhichincludeforestsectorcouldbeusefulasabasisformeasuringtheimplementationofactivitiesoftheRovaniemiActionPlanfortheForestSectorinaGreenEconomy.
Itisimportanttoconductananalysisofthecomplementarityofpresentapproachesdevelopedinthecontextofthegreeneconomyandthe2030AgendaforSustainableDevelopmentaswellas the existing approaches for measuring the value of natural capital with forest sectorvaluationsystems,becausesuchanalysiscancontributetotheincreaseofsynergiesamongthedifferentassessmentmethodologies.Consequentlyitwillprovidebetterinformationforpolicymakers about the evident contribution of forest sector to a green economy and about thepossibleneedsforpolicyadaptationnecessarytoenhancethiscontribution.
TheworkshoporganisedbytheUNECE/FAOForestryandTimberSectionon21October2016ismeanttoprovidethefirststeptosuchananalysis.
3.1.OverviewofassessmentmethodsAkeyfeatureoftheinclusivegreeneconomyagendahasbeenthatthereisnosingle,one‐size‐fits‐all approach to policy design and implementation. For example, different countries willchoosetoprioritizedifferenteconomicsectorsfortheirgreeneconomypolicyprogramme.Evenfor a given sector, different countriesmay select anddesigndifferent policy instruments andinvestmentstopromoteagreeneconomytransition.Henceit followsthatexistingassessmentmethodsforagreeneconomyalsoallowfortailoringtoacountry’sindividualneeds.
Internationally developed assessment methods for a green economy include a range ofapproachesandframeworks.ThesearesummarizedinTable1below.
Table1:OverviewofexistingapplicationsofmeasurementapproachestoInclusiveGreenGrowth(adaptedfromGGKP2016)
Approaches Global‐levelInitiatives National‐LevelEffortsDashboards OECDGreenGrowthIndicators(OECD,2011;2014)
EurostatSustainableDevelopmentIndicators(Eurostat,2014)
KoreaGreenGrowthMonitoringStrategyOECDframeworkindicatorspreparedbystatisticalofficesinDenmark,Germany,CzechRepublic,Netherlands,SlovakRepublic,Slovenia(OECD,2014)UNIDO/CAF/OECDgreengrowthindicatorsappliedasnationalinstrumentsformonitoringinLACdrawingfromtheavailablemethodologiestoadjustthesetofgreengrowthindicatorstotheLACregionalcontext
CompositeIndices
GreenEconomyProgress(GEP)Index(UNEP)GlobalGreenEconomyIndex(DualCitizenLCC,2014)YaleEnvironmentalPerformanceIndex(Emersonetal.,2012)WEFSustainability‐adjustedGlobalCompetitivenessIndexNotreDameGlobalAdaptationIndexFEEMSustainabilityIndex
ChinaGreenDevelopmentIndexChina’sEnvironmentalPerformanceIndexMalaysia’sEnvironmentalPerformanceIndexBhutan’sGrossNationalHappinessIndex
8
SOPACEnvironmentalVulnerabilityIndexOECDBetterLifeIndexOceanHealthIndexHappyPlanetIndexClimateChangePerformanceIndexLow‐CarbonCompetitivenessIndexEarthSecurityIndex
Footprints GlobalEcologicalFootprintCarbonFootprintGlobalResourceFootprintWaterFootprint
Switzerland’sEnvironmentalImpactScotland’sEcologicalFootprintAFEDEcologicalFootprintforArabCountries
AdjustedEconomicMeasures
IndexofSustainableEconomicWelfareGenuineProgressIndicator(GPI)AdjustednetsavingsTotalwealthincludingproducedandnaturalcapital(WorldBank,2006,2011)Inclusivewealth(UNEP,2012)Environmentallyadjustedmultifactorproductivity(OECD,2016a)
GPIinUSAStatesofMarylandandVermontNaturalaccountsdeveloped,forexample,byAustralia,Austria,Denmark,Finland,France,Germany,Iceland,Ireland,Italy,Netherlands,NewZealand,Norway,RepublicofKorea,Sweden,UnitedKingdom
Amongthesethemes,environmental,economicandsocialinformationcanbecombinedinwaysbroadly classified along four approaches, namely, a dashboard of indicators, compositeindicators, environmental footprints, and “adjusted” economic measures (e.g. green GDP,adjustednetsavingsandextendedwealth).
Recentapplicationsofgreeneconomyassessmentframeworkshighlightseveralmainfeatures,accordingtoarecentreviewpublishedbytheGreenGrowthKnowledgePlatform(GGKP2016):
Dashboardsseemtohavebeenmostwidelyusedformeasuringinclusivegreengrowth(IGG) at the country‐level, and frameworks and indicators have been developed byvariousdevelopedcountries.
Composite indicesmeasuring theprogress towardsa green economyarenotyet fullydeveloped,althoughanumberofenvironmentalindicesexistandhavebeenappliedinvariouscountrycontextstomeasureaspectsofrelevanceforagreeneconomy.
Footprintshaverarelybeenappliedatthenationallevelbutcanbeausefulingredientofgreeneconomymeasurementframeworks.7
Adjusted economic measures that account for environmental information haveadvanced considerably (e.g. through natural capital accounting). Significant gaps,however,remainasexistingapproachesdonotcomprehensivelycovernaturalresourcedepletionandenvironmentaldegradation.
Ingeneral,thedifferentapproachesservedifferentinformationneeds.Dashboardsofindicatorsandcompositeindicesprovideinformationthatmaycharacterizetheprogresstowardsagreeneconomy.Themaindifferencebetweendashboardsandindicesisthatwhiledashboardssimplypresent a selected groupof indicators, indices entail a comparison andweightingofdifferentindicators. Footprints are an assessment of the environmental impacts or resourcerequirements of economic activity. In a green economy transition, it would be expected that
7 Switzerland is a noteworthy exception. The Swiss Statistical Office has included the Ecological Footprint as a sustainable development indicator.
9
suchindicatorscouldbereducedaspartofthedesiredoutcome.Adjustedeconomicmeasuresalso capture the desired outcome by combining some information on environmental impactsandresourcerequirementswithconventionalmeasuresofeconomicoutputorwelfare,suchasGDP.
Some of these principal frameworks are discussed in the following sections, beginning withthosedeveloped internationally, and thenhighlighting somenational effortsmost relevant totheECEregion.
3.2.UNEPGreenEconomyIndicatorsUNEP’s framework has focused on indicators to support a policy process of assessing issues,settingtargetsandgoalsandmonitoringprogress(UNEP2012a):
Issueidentification PolicyFormulation PolicyImplementation PolicyMonitoringandAssessment
At the policy formulation and assessment stage, what makes the green economy approach,especiallyasarticulatedbyUNEP,differentfromotherapproachesisitsstrongemphasisontheroleofredirectinginvestmenttoaddressissuesandconcerns.Therationaleforthisapproachisthat misallocations of capital frequently lead to unsustainable development, where majorfinancial resources are spent on, for example, the use of fossil fuels or unsustainable fishing,while too little is spent on improving public transport, renewable energy, ecosystemconservationandwastetreatment(GGKP,2013).
Greeneconomyindicatorsaregenerallybasedonspecificresourceissuesoreconomicsectors,providingaframeworkwhichadaptseasilytospecificsectoralinitiativesandfocus,suchastheforestsector.
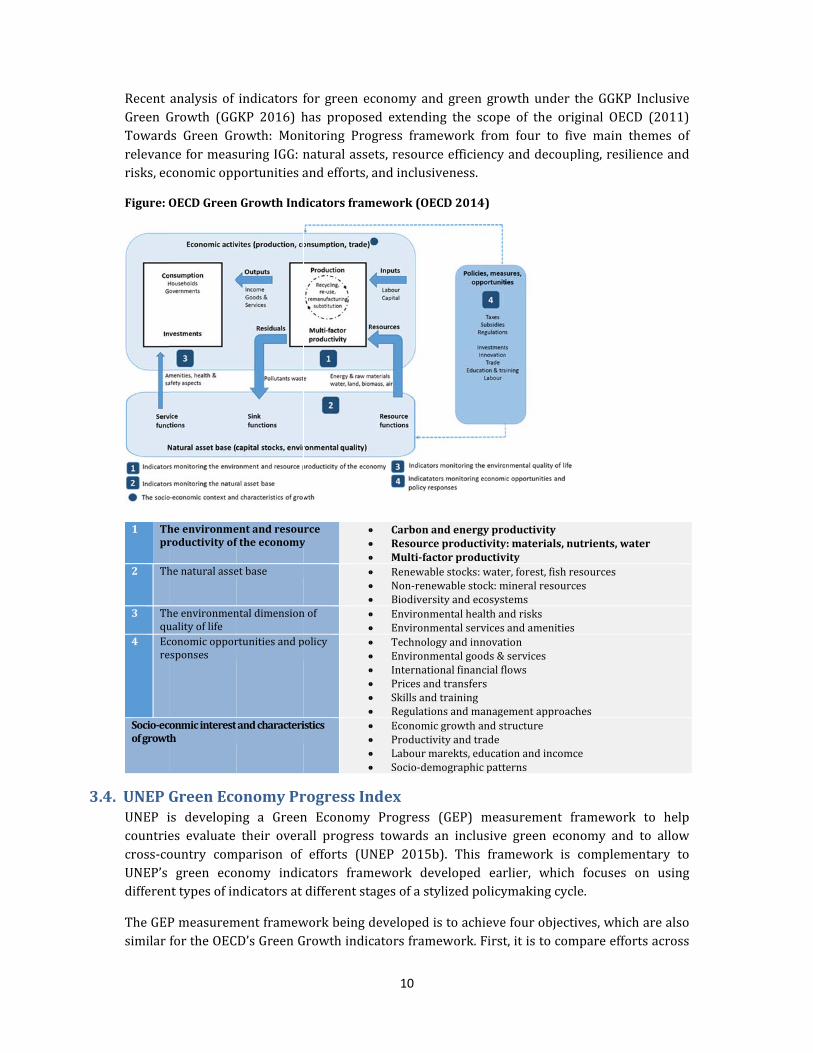
3.3.OECDGreenGrowthIndicatorsTheOECD’sworkongreengrowthmeasurementispartofabroaderagendaonmeasuringwell‐beingandsustainability.TheOECD’sselectedindicatorsorganizeintothefollowingfourthemes(seeFigurewhichprovidesalistoftopicscoveredbyindicatorsineachofthesethemes):
environmentalandresourceproductivity naturalassetbase environmentalqualityoflife policies,measures,opportunities
The OECD Green Growth Indicators framework also includes a dashboard of six headlineindicators to communicate the central elements of green growth in a balanced way (OECD2014):
carbonproductivity materialproductivity environmentallyadjustedmultifactorproductivity naturalresourceindex changesinlanduseandcover populationexposuretoairpollution.
3.
RecentGreen GTowardrelevanrisks,ec
Figure:O
1 Thpr
2 Th
3 Thqu
4 Ecre
Socio‐ecofgrowt
4.UNEPGUNEP icountriecross‐coUNEP’sdifferen
TheGEPsimilar
analysis ofGrowth (GGds Green Grceformeasconomicopp
OECDGreen
heenvironmeroductivityof
henaturalasse
heenvironmenualityoflifeconomicopporesponses
conmicinterestth
GreenEcois developines evaluateountry comgreen eco
nttypesofin
PmeasuremfortheOEC
indicators fGKP 2016) hrowth: MonsuringIGG:nportunitiesa
nGrowthInd
entandresouftheeconomy
etbase
ntaldimension
rtunitiesandp
andcharacteri
onomyPrng a Greentheir overa
mparison ofonomy indicndicatorsat
mentframewD’sGreenG
for green echas proposenitoring Pronaturalasseandefforts,
dicatorsfram
rcey
nof
policy
istics
rogressInn Economyall progressefforts (UNcators framdifferentsta
workbeingdGrowthindic
10
conomy anded extendingress frameets,resourceandinclusiv
mework(OEC
Carbonan Resource Multi‐fact Renewabl Non‐renew Biodiversi Environm Environm Technolog Environm Internatio Pricesand Skillsand Regulation Economic Productiv Labourma Socio‐dem
ndexProgress
s towards aNEP 2015bmework devagesofasty
developediscatorsframe
d green grong the scopeework fromeefficiencyveness.
CD2014)
ndenergyproeproductivitytorproductivlestocks:watewablestock:mityandecosyst
mentalhealthanmentalservicesgyandinnovatmentalgoods&onalfinancialfldtransferstrainingnsandmanagegrowthandst
vityandtradearekts,educatimographicpatt
(GEP) meaan inclusiveb). This framveloped earylizedpolicy
stoachieveework.First
owthundere of the orim four to fianddecoup
oductivityy:materials,nvityer,forest,fishrmineralresourctemsndrisksandamenitiestionserviceslows
ementapproactructure
ionandincomterns
surement fe green ecomework isrlier, whichymakingcyc
efourobjectt,itistocom
theGGKP Iiginal OECDve main thpling,resilie
nutrients,wate
resourcesces
s
ches
ce
frameworknomy and tcomplemen
h focuses ocle.
tives,whichmpareeffort
InclusiveD (2011)hemes ofenceand
er
to helpto allowntary toon using
arealsotsacross

11
countriesinkeyareasofthetransitiontoaninclusivegreeneconomy.Second,itistosupportthe assessment of progress in achieving some of the Sustainable Development Goals (SDGs)within the Post‐2015 Development Agenda. Third, it will help countries monitor progressagainst nationally set targets in priority areas. Finally, the framework is to bring moretransparency to policymaking and inspire broader policy support for an inclusive greeneconomy.
Currently theGEPmeasurement framework is composedof aGreenEconomyProgress index(GEPindex)andacompaniondashboardofgreeneconomysustainabilityindicators.Ascanbeseen in Table 2, the components of the index are not sector‐specific, with the exception ofindicatorsonenergyusethatareincorporated.
Table2:ComponentsoftheGEPindex(adaptedfromUNEP2015b)
Indicator Description Multidimensionality Countrycoverage
Economy Environment Social
GreenTrade Exportofenvironmentalgoods(percentoftotalexport)
X X X 128
Greeninnovation
Patentpublicationinenvironmentaltechnologybyfilingoffice(%oftotalpatents
X X X 61
Renewableenergysources
Shareofrenewableenergysupply
X X 129
Energyuse Energyuse(kgofoilequivalent)per$1,000GDP
X X 132
Inequality:Palmaratio
Ratiooftherichest10%ofthepopulation'sshareofincomedividedbythepoorest40%'sshare)
X X 121
Accesstowater
Accesstoimprovedwatersources(%oftotalpopulation)
X X X 197
Accesstoelectricity
Accesstoelectricity(%oftotalpopulation)
X X X 211
Accesstosanitation
Accesstosanitationfacilities(%oftotalpopulation)
X X X 198
Airpollution Particulatematter(PM2.5)pollutionconcentration
X X X 186
Materialfootprintpercapita
RawMaterialConsumptionofusedbioticandabioticmaterials(tons/person)
X X X 175
Marineandterrestrialprotectedareas
Terrestrialprotectedareas(%oftotallandarea)plusmarineprotectedarea(%ofterritorialwaters
x x X 145and195(respectively)
12
Progressisconsideredasbeingbothmultidimensionalandlong‐term.Inaddition,progress–orchange–intheindicatorsisincorporatedintotheproposedindex,notsimplythelevelorvalue.Forexample, the indexincorporates thechange intheshareofrenewableenergysupplyoverthe measured time period (ten years was chosen for sample calculations). Furthermore, theindexcantake intoaccountprogressmadetowardsdefinedtargetssetbypolicymakers.Theindicators are weighted according to the relationship between defined thresholds and initialvalues, thus representing some relative measure of how far a country must improve. Thethresholds themselves are defined either based on scientific recommendations where theseexist, or in a relative sense as the level defining the “top” quarter (25%) of best‐performingcountries.
Thedashboard,whichcurrentlyconsistsofanadditionalsevenindicators,isintendedtotrackthe sustainabilityof a country’sprogress in situation relative toplanetaryboundaries and itsstock of wealth. Importantly from a forestry perspective, this includes a land use indicator,measuring the percentage of land devoted to cropland agriculture, with a threshold value of15%.
UNEP’s GEP index is currently under development with consultative draft methodology andpapersproducedin2015and2016.Theindexaimstocaptureprogresstowardsachievinganinclusivegreeneconomybytrackingchangesinflowsthatcharacterizeinter‐linkagesbetweenthesocial,economicandenvironmentaldimensionsofsustainabledevelopment.
3.5.NationalinitiativesApplicationsintheCzechRepublic,Denmark,Germany,theNetherlands,SlovakiaandSloveniashowed that most indicators proposed in the OECD framework can be met using nationallyavailable statistics without additional data collection efforts or significant data gaps (OECD2014). For some of the more sophisticated indicators, however, such as environmentallyadjustedmultifactorproductivity,naturalresourcestocks indexandsoilresources,somedatagapsremain.Workondevelopingthemethodologyisongoingtofill thesegaps(OECD,2016).Moreover,notall indicatorswereconsideredrelevant foreachofthecountries(OECD,2016),andasinthelatesteditionoftheDutchGreenGrowthIndicatorsreport,theOECDframeworkisadaptedtobemoresuitabletothelocalcontext(StatisticsNetherlands2012,2015).
Statistics Netherlands monitors the country’s success in pursuing a green growth strategy,employingandtailoring theOECD’sGreenGrowthMeasurementFramework for thispurpose.Reportshavebeenpublishedin2011,2012and2015.Thefirstreportdescribed20indicators.This listwas expanded in 2012 and then again in 2015 to cover 36 indicators under the sixthemes of the OECD framework. For each of the indicators, the 2015 report included anassessment of the trend over time, distinguishing between those indicators for which animprovement was seen from those which demonstrate deterioration, or those for which nochange was detected (Statistics Netherlands 2015). For indicators of environmental andresource efficiency, Statistics Netherlands assessed whether the trend exhibits a pattern ofabsoluteorpartialdecoupling.
13
The Czech Republic has undertaken two reviews of green growth in the country using theOECD’sGreenGrowthMeasurementFramework.Thefirstwasin2011andthesecondin2013.Thelatestversionmeasured27indicatorsunderfivethemes(CzechStatisticalOffice,2013).8
4. NaturalCapitalAssessmentMethods
4.1. SystemofEnvironmentalEconomicAccountingThe System of Environmental‐Economic Accounting (SEEA) is an international initiative,coordinatedundertheauspicesoftheUnitedNationsStatisticalDivision.TheSEEAprovidesastandardizedframeworkforintegratingdataonnaturalandenvironmentalresourcesintoasetoftablesandaccountsthataresatellitetotheSystemofNationalAccounts(SNA).AtUNCEDin1992, themember states of the UN agreed on a “programme to develop national systems ofintegratedenvironmentalandeconomicaccountinginallcountries”topursuethedevelopmentofthisstandardizedframework,buildingonexistinginitiativesinvariouscountries.
TheSEEA‐CentralFramework(CF)isa“multipurposeconceptualframeworkthatdescribestheinteractionsbetweentheeconomyandtheenvironment,andthestocksandchangesinstocksofenvironmental assets” (United Nations 2012a). The SEEA‐CF proposes accounts to coverphysical resource flows, natural assets and their depletion (physical and monetary), andexpenditure on environmental protection and resource management. The resource flow andasset accounts clearly comprise a form of natural capital accounting (NCA), according to abroader interpretation of this term. Thus, the SEEA is not itself a measurement framework.Rather it is an accounting system, related to national accounts, which could provide thestatistical system for organizing and presenting data necessary for the calculation of variousindicatorssuggestedintheprecedingsections.
The SEEA also includes specific attention for the agriculture, forestry and fisheries sector,referred to as SEEA‐Agriculture, or SEEA‐AFF (UnitedNations, 2016), just as there is specificguidance for other sectors or resources, such as energy and water. SEEA‐Agriculture thusprovides more detailed guidance on the application of the principles and framework of theSEEA‐CF to the agriculture, forestry and fisheries sectors. The UN Committee of Experts onEnvironmental‐EconomicAccountingadoptedtheSEEA‐Agricultureguidelinesin2016.Theaimis to have the SEEA‐Agriculture become a statistical standard, adopted by the UN StatisticalCommission,asasubsystemoftheSEEA‐CF.
InadditiontotheCentralFramework,therearealsotwoothercomponentsoftheSEEA.OneistheExperimentalEcosystemAccounts(SEEA‐EEA),whichcomprise“acoherentandintegratedapproachtotheassessmentof theenvironmentthroughthemeasurementofecosystems,andmeasurementoftheflowsofservicesfromecosystemsintoeconomicandotherhumanactivity”(United Nations 2012b). The scale on which the accounting may be conducted varies: theecosystemsmeasuredmayrangefromspecificlandcovertypeareas,suchasforests,tolargerintegratedareas,suchasriverbasins,andmayincludeareasconsideredtoberelativelynaturalandthosethatareheavilyaffectedbyhumanactivity,suchasagriculturalareas.”Theecosystemaccounts are still for implementation at the national level. The difference with the Central 8 The Czech report groups environmental and resource productivity/intensity under one theme, whereas the Statistics Netherlands report considered these as two themes, resulting in six themes in total in the latter approach.

14
Framework and standard national accounting is that the basic accounting units are definedaccordingtoecosystemtypesandboundaries.VariouspilotstudiesareunderwayasameanstopromotethefurtherdevelopmentoftheSEEA‐EEA.9
ThethirdcomponentoftheSEEAistheExtensionsandApplications.ThiscompaniondocumenttotheSEEACentralFrameworkhighlightsthepotentialofdatafromtheaccountsoftheSEEACentralFrameworktobeappliedtoarangeofpolicyandresearchquestionsandtobeextendedto integratewithdata inotherdomains.The focus inSEEAApplicationsandExtensions isonmeasurementandanalysisatabroad,nationallevelontopicssuchassustainableresourceuse,environmental efficiency, environmental protection activity and the production ofenvironmental goods and services, environmental assets and natural resources, and thehouseholdsector’sbehaviourwithrespecttotheenvironment.
4.2. WealthAccountingandtheValuationofEcosystemServices(WAVES)WealthAccountingand theValuationofEcosystemServices (WAVES) isapartnership, ledbytheWorldBank,whichbroadlypromotesmainstreamingofnaturalresources indevelopmentplanning and national economic accounts.10 This is done through natural capital accounting(NCA)wherethereareinternationallyagreedstandards,andalsobydevelopingapproachestoecosystem service accounts. The partnership, launched in 2010, includes a coalition of UNagencies,governments,internationalinstitutes,nongovernmentalorganizationsandacademics.
Natural capital accounts promoted under WAVES consist of resource accounts for naturalresources like forests,water,andminerals, following theSEEACentralFramework,aswellasexperimental accounts for ecosystems like watersheds and mangroves. Eight developingcountrieshavesinceembarkedonprogrammesforNCAundertheWAVESpartnership,whichprovidestechnicalguidanceandexpertise.
4.3. TheEconomicsofEcosystemsandBiodiversity(TEEB)TheEconomicsofEcosystemsandBiodiversity(TEEB)isaglobalinitiativefocusedon“makingnature’svaluesvisible”.11Itsprincipalobjectiveistomainstreamthevaluesofbiodiversityandecosystemservicesintodecision‐makingatalllevels.Itaimstoachievethisgoalbyfollowingastructured approach to valuation that helps decision‐makers recognize the wide range ofbenefitsprovidedbyecosystemsandbiodiversity,demonstratetheirvaluesineconomictermsand,whereappropriate,suggesthowtocapturethosevaluesindecision‐making.
TEEB has sponsored a number of studies at international and national level on the value ofbiodiversityandecosystemservices.Intermsofindicators,itpromotestheincorporationoftheeconomicvalueofecosystemservicesintorelevantaccountingandreportingframeworks.TEEBhas not itself developed or endorsed specific indicator frameworks. Given the importance offorest ecosystems in the scope of TEEB’swork, it is nonetheless helpful to provide this briefmentionhere.
9 http://unstats.un.org/unsd/envaccounting/londongroup/meeting21.asp 10 https://www.wavespartnership.org/
11 http://www.teebweb.org/

15
5. Overviewofassessmentsystems,includingcriteriaandindicatorsdevelopedbytheforestsectorwhichcouldbeusedtomeasureprogressoftheforestsectortowardsagreeneconomyPrevioussectionsofthispaperpresentedthemethodsbeingdevelopedtoassesstheprogressof forest sector towards a green economy, notably a wide range of dashboards, compositeindices, footprints and adjusted economic measures, for use at the global/international ornational levels,andaddressingagreeneconomyasawhole.Theobjectiveofthissectionistoexplorethelinkagesandinteractionsbetweentheforestsector(inabroadsense)andthegreeneconomyaswhole,andonthatbasistomakeapreliminarysetofproposals fordiscussiononhowtheprogressoftheforestsectortowardsagreeneconomycouldbemeasured.
This section takes as its starting point the background paper presented to the workshop on“Measuring and communicating thecontribution of the forest sector to a greeneconomy” inRovaniemiin2013(Prins,2013).
SincetheRovaniemiworkshopmanyapproachestomonitoringthetransitiontowardsagreeneconomy have been developed and are being tested, as shown in the previous parts of thispaper.Thepaceofresearch,experimentationanddiscussionisaccelerating.Intheforestsector,therehasbeenan increase inawarenessof the issuesandchallenges,andseveralsustainableforestmanagement(SFM)processeshavediscussedtheissue(reportsonthiswillbemadeattheworkshop).
Thissectionaddressessomebackgroundissuesandthensuggestsproposalsforanapproachtomeasuretheprogressoftheforestsectortowardsagreeneconomy.
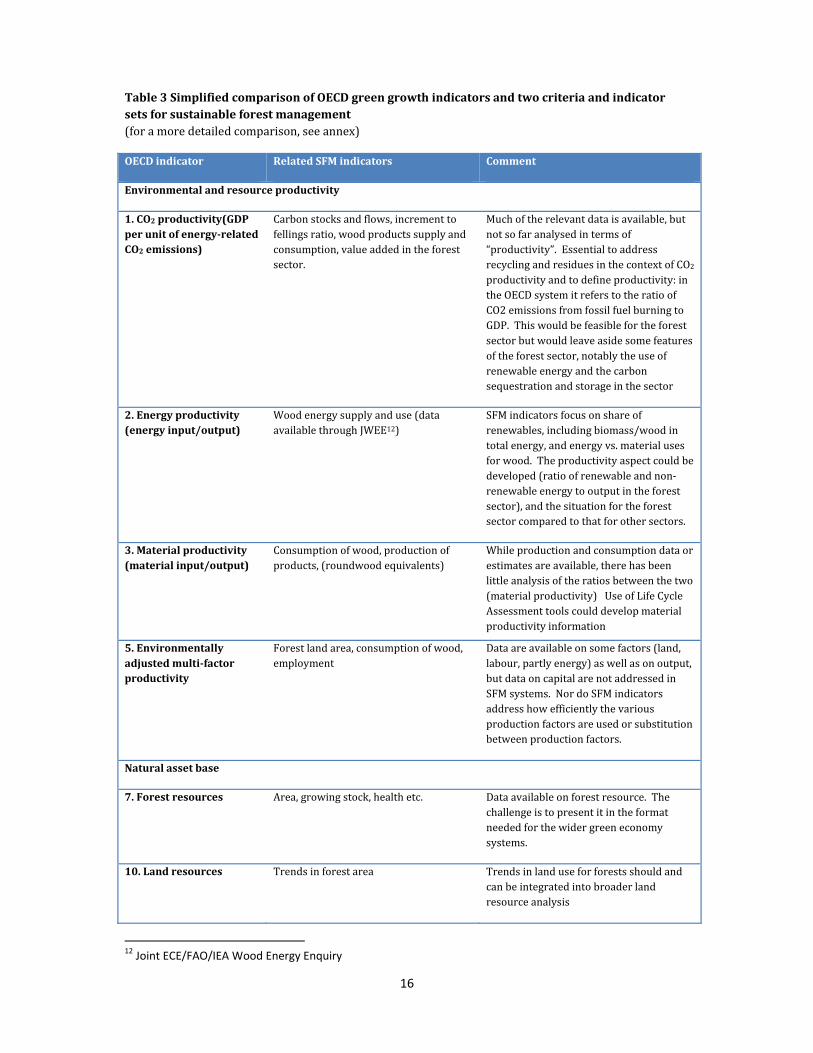
5.1. Canpresentforestsectormonitoringsystemsassessthesector’sprogresstowardsagreeneconomy?Mostforestmonitoringsystemsusedatpresenthavetheiroriginintheneedtomanagetimberproduction,combinedwiththeneedtomonitorbiodiversityandforestdamageinthecontextofsustainableforestmanagement.Inmostcountriesnow,systemsofcriteriaandindicatorsofsustainableforestmanagementprovidetheframeworkformonitoringactivitiesbygovernmentsorforestmanagers.Wouldtheseprovideadequateinformationformanagingtheforestsectorinagreeneconomy,asdescribedinpreviouspartsofthispaper?Table1comparessystematicallytwosetsofcriteriaandindicatorsofsustainableforestmanagement(ForestEurope–FE‐andMontréalProcess‐MP)withoneofthegeneralgreeneconomyindicatorsets,theOECDgreengrowthindicators–theonewhichisclosestinitsapproachtothatoftheSFMcriteriaandindicatorsystems.
16
Table3SimplifiedcomparisonofOECDgreengrowthindicatorsandtwocriteriaandindicatorsetsforsustainableforestmanagement(foramoredetailedcomparison,seeannex)
OECDindicator RelatedSFMindicators Comment
Environmentalandresourceproductivity
1.CO2productivity(GDPperunitofenergy‐relatedCO2emissions)
Carbonstocksandflows,incrementtofellingsratio,woodproductssupplyandconsumption,valueaddedintheforestsector.
Muchoftherelevantdataisavailable,butnotsofaranalysedintermsof“productivity”.EssentialtoaddressrecyclingandresiduesinthecontextofCO2productivityandtodefineproductivity:intheOECDsystemitreferstotheratioofCO2emissionsfromfossilfuelburningtoGDP.Thiswouldbefeasiblefortheforestsectorbutwouldleaveasidesomefeaturesoftheforestsector,notablytheuseofrenewableenergyandthecarbonsequestrationandstorageinthesector
2.Energyproductivity(energyinput/output)
Woodenergysupplyanduse(dataavailablethroughJWEE12)
SFMindicatorsfocusonshareofrenewables,includingbiomass/woodintotalenergy,andenergyvs.materialusesforwood.Theproductivityaspectcouldbedeveloped(ratioofrenewableandnon‐renewableenergytooutputintheforestsector),andthesituationfortheforestsectorcomparedtothatforothersectors.
3.Materialproductivity(materialinput/output)
Consumptionofwood,productionofproducts,(roundwoodequivalents)
Whileproductionandconsumptiondataorestimatesareavailable,therehasbeenlittleanalysisoftheratiosbetweenthetwo(materialproductivity)UseofLifeCycleAssessmenttoolscoulddevelopmaterialproductivityinformation
5.Environmentallyadjustedmulti‐factorproductivity
Forestlandarea,consumptionofwood,employment
Dataareavailableonsomefactors(land,labour,partlyenergy)aswellasonoutput,butdataoncapitalarenotaddressedinSFMsystems.NordoSFMindicatorsaddresshowefficientlythevariousproductionfactorsareusedorsubstitutionbetweenproductionfactors.
Naturalassetbase
7.Forestresources Area,growingstock,healthetc. Dataavailableonforestresource.Thechallengeistopresentitintheformatneededforthewidergreeneconomysystems.
10.Landresources Trendsinforestarea Trendsinlanduseforforestsshouldandcanbeintegratedintobroaderlandresourceanalysis
12 Joint ECE/FAO/IEA Wood Energy Enquiry

17
OECDindicatorRelatedSFMindicators
Comment
11.Soilresources Soilcondition,soildegradation SomedataareavailableinSFMsystemsofsoilconditionanddegradation.Theyneedtobeintegratedintoabroaderapproach,especiallyasforestsoilsareoftentheleastdamagedsoils.
Economicopportunitiesandpolicyresponses
16.R&DofimportancetoGreenGrowth
DataarecollectedbyUNFFandC&Iprocessesontotalspendingonresearch,trainingandeducationintheforestsector
Forthepurposesofgreeneconomyanalysis,itwouldbenecessarytoseparateR&D“ofimportancetoGreenGrowth”fromotherR&D.Wearenotawareofanyefforttodothiswithinthesector’sanalyticalframework
18.Environmentrelatedinnovation
Theimportanceofinnovationisaccepted(especiallyintheforestindustries),butwearenotawareofmonitoringofinnovationintheforestsector.TheOECDgathersinformationondevelopmentofenvironment‐relatedtechnologies,butabreakdownisnotavailablefortheforestsector.
19.Productionofenvironmentalgoodsandservices
Post‐consumerrecoveryofpaperandwood,productionofrenewablewoodenergy
“Environmentalgoodsandservices”aredefinedbyOECDandEurostatasthosegoodsandserviceswhichhaveanenvironmentalprotectionorresourcemanagementpurposeastheirprimeobjective(recoveryofpost‐consumerpaperandsupplyofrenewableenergysatisfytheseconditions).Managementofforestswhichare“notavailableforwoodsupply”or“notcultivated”isconsideredanenvironmentalservice.However,traditionalSFMindicatorsdonotdistinguishtheseactivitiesfromothertypesofforestmanagement
20.InternationalfinancialflowsofimportancetoGreenGrowth
C&IsystemsaddressfinancialflowsforSFM,butnotinternationalflows,anddonotseparatethosewhichconcern“greengrowth”.
InternationalfinancialflowsareaddressedbythefourthGlobalObjectiveonForestswhichaimsto“reversethedeclineinofficialdevelopmentassistanceforsustainableforestmanagement.”13
21.Environmentallyrelatedtaxation
C&IsystemsforSFMconsiderpoliciesandinstitutionstopromotesustainableforestmanagement,whichwouldincludespecifictaxationmeasures
Itisnotcleariftaxsystemsforsustainableforestmanagementarealsoconsideredinagreeneconomycontextas“environmentallyrelatedtaxation”
22.Energypricing C&Isystemsaddresstheuseofwoodforenergy
SFManalysistendstofocusonvolumesofwoodbiomassusedforenergy,butnotonpricingissues,whichshouldbeseeninamuchwider(all‐energy)context.
13 Data were presented and analyzed in (UNECE/FAO, 2015)

18
Severalpreliminaryconclusionsmaybedrawnfromtable3:
There are many areas of complementarity between sustainable forest managementindicatorsandgreengrowthindicators,confirmingtheimpressionthattheforestsectorcanmakeamajorinputtoagreeneconomy.
Italsoappearsthattherearesufficientdatasourcesinplacetomakepossibleasatisfactorytrackingoftheforestsector’sprogresstowardsagreeneconomy.
However,thefocusofthetwoapproaches(SFMandgreeneconomy)isquitedifferent,and it is not satisfactory simply to transfer SFM indicators to address green economyissues.
Areaswhichareimportantforgreeneconomymonitoring,butnotdirectlyaddressedinpresentsystemstomonitorsustainableforestmanagementinclude:
o Factor productivity/efficiency of resource use. Forest‐centred systemsconcentrate on volumes and flows, not on efficiency of use, whether of land,capital,labourorwood.
o Accounting approaches and valuation of the elements of the forest sector.Traditional national accounts (SNA) are exclusively in monetary units.Economic‐environmental accounts (SEEA) combine physical measures (ha offorest,m3ofwood inthecaseof the forestsector)withmonetaryunits,whichcancreatevaluationissues.
o R&D,patentsandinnovationhavereceivedlittleattentionindiscussionofSFM.Littleinformationisavailableonpatentsandinnovationintheforestsector,althoughthepotentialimportanceoftheseisclear.
5.2. TheroleofgreennationalaccountingintheworkonmeasuringprogressoftheforestsectortowardsagreeneconomyConventional macro‐economic analysis and policy is highly dependent on the availability ofreliable, recent and comparable information on national accounts, presented according tomethods which have been codified and standardised over many years, notably through theSystemofNationalAccounts(SNA).Theshortcomingsofconventionalnationalaccounts(i.e.theSNA) such as: failure to include natural capital, distortion through omission of externalities,failure to includehumanwellbeingetc. have led to amajor international effort to designandimplement systems for economic and environmental accounting, also known as “greenaccounting”.InparticulartheSystemofEnvironmental‐EconomicAccounting(SEEA)preparedundertheaegisoftheUNStatisticalCommission14providesthenecessaryframeworkaswellasdetailedguidanceforsectors,includingagricultureandforestry.Atthenationallevel,itwillnotbe possible to achieve truly evidence‐based policy making for the green economywithout afunctionalgreennationalaccountssystem,basedonsoundtheoryandgeneratingreliableandcomprehensivedata.
14 The System of Environmental‐Economic Accounting (SEEA) contains the internationally agreed standard concepts, definitions, classifications, accounting rules and tables for producing internationally comparable statistics on the environment and its relationship with the economy. The SEEA framework follows a similar accounting structure as the System of National Accounts (SNA) and uses concepts, definitions and classifications consistent with the SNA in order to facilitate the integration of environmental and economic statistics. See section 4 for discussion of the SEEA

19
The forest sector is amajor challenge for thosewho are developing green national accountssystems,foranumberofreasons,includingthefollowing:
Theimportanceofthe“naturalcapital”containedinforests,andthedifficultymeasuringandvaluingit,especiallyonanannualtimescale;;
The multi‐functional nature of forestry, leading to many “non‐market benefits” andother externalities, which are difficult to quantify in physical terms, and even moredifficulttoexpressinmonetaryterms;
The long term nature of forestry, leading to complex issues of discount rates andassumptions as regards the future (risks over the rotation, possible changes inmanagementobjectives,futuremarketconditionsandpricesetc.).
Experts, including the designers of criteria and indicator systems for sustainable forestmanagement,haveresistedthe ideaofsystematicallyexpressingall forestsectorindicators inmonetary terms, because of the above‐mentioned conceptual problems, and because such amethodologyseemstoimplythatallvalues,includingenvironmental,socialandculturalvalues,shouldbesubordinatedtoeconomicvalues.
However, the concept of greennational accountshas beendeveloped in order to incorporateenvironmental, social and cultural values into evidence‐based policy making, and analysephysicalmeasuresalongsidemonetarymeasures. Combiningenvironmentalandsocialvalueswith traditional economic units should – if correctly implemented – be an effective way ofpromoting rationaldiscussionandevidencebaseddecisionmaking,withoutunduly favouringeconomicvaluesoverothervaluesystems.
Greennationalaccountssystemsarebeingdevelopedandwillbe implemented,whatever thedifficulties encountered. The conclusion to be drawn is that the forest sector, and especiallyresearchers, could devote further efforts to generating forest sector related information in aformwhichcanbeusedby theemerginggreennationalaccountssystems,bothphysicaldataand,whereappropriate,monetarydata,bearinginmindthatvaluationofnon‐marketbenefitsofforestshas,uptillnow,remainedatthetheoretical,ratherthanthepolicylevelinmostcases.Theemergenceofthegreeneconomywillprobablygiveextraimpetusandimportancetotheseefforts.

20
Anexampleofnaturalcapitalaccountsforforests
ArecentstudyofnaturalcapitalaccountsoftheForestEnterpriseEngland(ForestEnterpriseEngland,2016),
althoughstillexploratoryandsubjecttorevision,demonstratedthatitisalreadypossibletouseanaturalcapital
accountapproachtoproducepolicyrelevantinformation.Table5summarisesthemainoutputofthisstudy.
Table5ExtractsfromnaturalcapitalaccountofForestEnterpriseEngland(reportyear(2015/2016),in£million)
Privatevalue Externalvalue Totalvalue
Timber 207 ‐ 207
Carbon ‐ 7595 7595
Recreationandpublicaccess (283) 4880 4597
GovernmentPESfunding 575 (575) ‐
Totalgrossassetvalue 503 11922 12425
Maintenancecosts (484) (31) (515)
Totalnetnaturalcapitalassets 19 11891 11910
Note:Forconceptsanddefinitionsseestudy(ForestEnterpriseEngland,2016).Anumberofheadingshavebeen
omitted,aswellasdataforthebaselineyearandthechangebetweenthebaselineandreportyear.
Whatevertheshortcomingsofthemethodologyanddata(acknowledgedbytheauthors),itisclearfromthisstudy
thatinEngland,thevalueofwhatis,atpresent,thecoreofmostforestmanagementandbudgeting–timbersalesand
managementcosts–ismuchsmallerthantheexternalvalueprovidedintheformofcarbonandrecreationservicesbyForestEnterpriseEngland.Whenthistypeofaccountingisfullydevelopedandacceptedasatoolformanagement
andpolicyformulation,inEnglandandelsewhere,itishighlylikelythatprioritieswillchange,aswellasfinancial
flows.Inthisregard,itisinterestingtonotethattheUKNationalEcosystemAssessment(2011)undertookscenario
analysisofpossible futuretrendsconcerninglanduse,populationandincome.Theanalysisconcludedthatinmanycases,increasesinmonetary,marketedvaluesofecosystemservices,suchasagriculturalcropsortimber,couldonly
beachievedwithdeclinesinvariousnon‐marketedecosystemservices,suchascarbonsequestration.Thedevelopmentofimprovedandextendedaccountingsystemswouldsupportevenmorerefinedandrobust assessmentsofthistype.

21
5.3. Whatisneededtoputinplaceaneffectivesystemtomeasuretheprogressoftheforestsectortowardsagreeneconomy?Asystemwhichisabletomeasureprogressoftheforestsectortowardsagreeneconomy,inanobjective, comparable and understandable way, will need significant investment, of time,politicalwillandresources,aswellas flexibilityandopenminds fromall.Thepossiblestagescouldbe:
Consensusforming,atthepan‐Europeanorgloballevel,onwhatshouldbemeasured,aswellasconcepts,definitions,feasibilityetc.(Thispaperisintendedasacontributiontothisinitialdiscussion).
Identification or creation of a framework for the development of the measurementsystem.
Analysis of the sector’s ability to generate the missing data and identification of thepotentialexternalsystems/partnersthathadtobeengaged.
Widespread consultation and briefing with national correspondents and otherinformation providers, as well as distribution of labour between partners, along thelinesalreadydevelopedforSFMbytheteamofspecialistsonmonitoringSFM.
Datacollection,analysisandreporting.
However in some areas, deeper research and discussion will be needed before there is arealisticprospectofobtainingreliableandcomparabledata.Theseareasarebrieflydescribedbelow.
Integrationofmonetarymeasures into forest sectormonitoring systems. Integration ofecologicalprocessesintoaccountingsystemsisattheheartofthegreeneconomy.Obstaclestodothisincludethelackofsomeofthekeybiophysicaldata(inaformat,andwithafrequencycompatiblewithnationalaccounts),aswellasthedifficultiesofexpressingthesephysicalflowsinmonetaryterms.Thereforeforestsectorsystemsmustmakeamajorefforttobringtogetherparametersofthesectornotonlyintermsofm3orha,butalsoinmonetarytermsasrequiredby the SEEA framework. This is essential not only for analysis of progress towards a greeneconomy, but also for communication with other sectors. This implies basic informationcollection on matters like prices, costs, salaries, revenues, and profitability, as well as newmethodstoputmonetaryvaluesonaspectswhichhavebeenmeasureduptillnowinphysicalunits.Thesedata shouldbeusedandmonitoredregularlyandbecomea core,normalpart ofsector analysis, as they are for e.g. agriculture.They should bedeveloped in accordancewithexistingguidelinesnotablySEEAand the SEEAAgriculture (includesalso forestry) atpresentunderconsultation.Manyofthesedatamaybebeingcollectedalreadyoutsidetheforestsector,notablyinthecontextofnationalaccountssystems,soeffortstoacquirethisinformationshouldbe carriedout in cooperationwith appropriate expert bodies, andharmonisedwith standardpracticefornationalaccounts.
Definitionandmeasurementofnaturalcapital in forests. There is aneed to estimate thevalue,notonlyofgrowingstockat today’swoodprice,butalsoofnetpresentvalueof futurecrops (discount rate, demand projections), aswell as of forest land, adjusted by valuation ofecosystemservices/externalities.Thiswillnecessitatemajorconsultationandresearchonbothconceptsanddata.

22
WoodflowsEfficiencyofresourceuseandmulti‐factorproductivityarealsoattheheartofthegreeneconomyconcept.Toestimatethis,itisnecessarytohaveamuchmoreprecisepictureofflows of material and energy, something which is well understood at the level of individualplants, butmuch lesswellunderstoodat thenational level.Thebasis for this isavailable, forinstanceintheWoodResourceBalance,usedinthesecondeditionoftheUNECE/FAOEuropeanForestSectorOutlookStudy(EFSOSII)(ECE/FAO,2011),buttherearestillmanygaps.Thisisnotjustaresearchtopicbutneedsannualcollectionandpublicationofdata.Itisnecessarytoworkwithindustry,whoistheonlyonesabletocollectthisdata.Volumesofrecoveredwoodproducts should be addressed in the same effort, following successful experience in a fewcountries(e.g.GermanyandtheNetherlands,bothofwhicharenowinapositiontomonitorthevolumesofwoodproductsrecoveredforrecyclingafterconsumption).
5.4. AnapproachtomeasuringprogressoftheforestsectortowardsagreeneconomyOnthebasisofthecomparisonabove,andthediscussioninthepaperforRovaniemi,apossibleapproachhasbeendevelopedwhichmightbeusedassubjectfordiscussionforanappropriatedebate,reviewandmodification,asaframeworktomeasuretheprogressoftheforestsectortowardsagreeneconomy.Theseverypreliminaryproposals,summarisedbelow,couldbeusedasoneofthedirectioninwhichthediscussioncoulddevelopaftertheworkshopon21October2016.
Whatquestionsshouldameasurementsystemtrytoanswer?Themeasurementsystem,wheninplace,shouldaimtoanswerthefollowingquestions:
Howmuch,andinwhatway,istheforestsectorcontributingtoagreeneconomy? How todefine the “greenness” of the forest sector?How specific is the forest sector’s
contribution?Towhichextent the“greenness”of thesectorcanbemeasuredwiththeuse of general tools (described in the first sections of this paper)? Which additionaltools,specificfortheforestsectorshouldbedeveloped?
How “green” is the forest sector? Is the forest sector becomingmore “green”?Whichpartsofthesector(bycountryandactivity)aremore“green”andwhichless“green”?
In which countries is the forest sector better integrated in (making the mostcontributionto)agreeneconomy?
How“green”istheforestsectorcomparedtoothersectors?
StructureTheRovaniemiActionPlanfortheForestSectorinaGreenEconomy(ECE/FAO,2014)haseight“principles” in the preamble and five “pillars”. Combining them15 leads to the following fiveheadingswhichareproposedtostructurethemeasurementoftheprogressoftheforestsectortowardsagreeneconomy:
Sustainableandefficientuseofnaturalresources; Lowcarbon forest sector(e.g. contribution tomitigationof,andadaptation to,climate
change); Sustainabilityoftheworkforce;
15 The process of analyzing the Action Plan and other aspects is described in detail in the 2013 paper (Prins,
2013), and not repeated here

23
Integrationofexternalitiesandpaymentforecosystemservices; Goodgovernanceandevidencebaseddecisionmaking.
SixmainareasofmeasurementIt is proposed that themeasurement systembe structured around sixmain areas,which aresummarisedbelow,withsomeexplanatoryjustification.
1. Conservationofforestnaturalcapital.Theconservationovertimeoftheforestcapitalhas always been at the heart of the concept of sustainable forestmanagement, and ismonitored by existing systems of criteria and indicators of sustainable forestmanagement. This aspect will not lose importance in a green economy, and mustcontinue to bemeasured.However, in an emerging green economy, this centuries oldforestry concept will need to be expressed in terms which are understood by andcompatiblewithemerginggreenaccountingsystems(seenextsection).Theexpressionofthevalueoftheforestnaturalcapitalshouldincludenotonlywoodstocksandflowsbut also the value of the non‐market functions, and any increase or reduction in theforest’scapacitytosupplythem.Thisiswellknowntobeaverychallengingexercise.
2. Multifactorproductivityandefficientuseofresources.Itisknownthatthereislittlewaste in the forest industries, as residues are used for other products or for energy;recyclingofpaperand,increasingly,woodproducts,iswidespread.Howevertraditionalanalysisofthesectorhasfocusedonwhether“enough”materialisavailable,andlessonhow efficiently it is used. In a green economy, it will also be necessary to increaseefficiencyintheuseofallresources,notablywood,butalsoenergy,labourandcarbon,andmonitorthesetrends.
3. Contribution to climate changemitigation. A green economy gives high priority toclimatechangemitigation,anareawhereforestsandforestproductsplayanimportantand complex role, notably through carbon sequestration and storage, as well assubstitution, for non‐renewablematerials and energy sources. A “cascade” approach(using wood first as raw material, and only afterwards as energy source) is oftenadvocated. However, at the national level, the forest sector contribution to climatechange mitigation varies widely according to circumstances: extent of forests,increment/harvest balance, size and efficiency of wood processing industries,importanceofrenewableenergy,consumptionandrecyclingpatternsetc.Furthermorethiscontributioncanchangeovertime,sometimesrapidly,forinstancebecauseofforestdamage, market conditions or increased use of wood energy. The profile of eachnational contribution in this area should be described and any significant changesmonitored.
4. Integrationofexternalitiesandpayment for forestecosystemservices. Integrationofexternalities,andtheircorrection throughadaptedmarketmechanisms, isessentialpartsofagreeneconomy.Therearemanyexternalitiesintheforestsector,notablyasregards the ecosystem services provided by forests, usually without any monetarycompensation.However,systemsarebeingdevelopedandputinplaceforpaymentforforestecosystemservices.Quantificationoftheseservicesandmonitoringofeffortstocorrect them are essential to measure the forest sector’s contribution to a greeneconomy.

24
5. Sustainabilityoftheforestsectorworkforce.Thedevelopmentof“decentgreenjobs”and reduction of social exclusion are part of all green economy strategies. Theprotectionoftheworkforceagainstoccupationalinjuriesanddiseasearepartofthis,asisappropriateeducationandtraining,enablingtheworkforcetocontributetoagreeneconomyandaddressthenewchallengeswhichwillemerge.Highaccident/injuryratesand inadequate education and trainingwould significantly hinder progress towards agreeneconomy.Finallythecreationormaintenanceof“decentgreenjobs”(asdefinedbyILOandmentionedintheActionPlan)isanessentialpartofagreeneconomy,andthusoftheforestsectorinagreeneconomy.
6. Good governance and evidence based decision making. Good governance is animportantpartofagreeneconomy.Althoughgovernanceintheforestsectorisalreadymonitored in criteria and indicators of sustainable forest management, the profoundchangesnecessaryinmethodsandattitudestomovetowardsagreeneconomymakeitnecessary to monitor how the sector is responding to the emerging governancechallenges.Inaveryrealsense,agreeneconomyisbasedonchangesingovernanceanddecision making, using modified information input (e.g. corrected for externalities).Thereforethequalityofgovernanceshouldalsobemeasuredaspartofthetransitiontoagreeneconomy.
SomeindicatorswhichmightbeusedtomeasureprogressoftheforestsectortowardsagreeneconomyThelistbelowisaninitialsetofideas,structuredaccordingtothesixareasoutlinedabove.Itisnotaformalproposal,butanillustrationofthetypeofindicatorswhichmightbeuseful.
Table4Someindicatorswhichmightbeusedtomeasureprogressoftheforestsector,atthenationallevel,towardsagreeneconomy(asproposedtoroundtableatMetsä2013,Rovaniemi))
Indicator Directionof“progress”16
1 Conservationofforestnaturalcapital
1.1 Changeinforestnaturalcapital:physicalparametersandmonetaryvalueoflandandtrees,adjustedforexternalitiesandecosystemservices
Stabilityorincrease
2 Multi‐factorproductivityandefficientuseofresources
2.1 Materialproductivityintheforestsector Increase
2.2 Energyproductivityintheforestsector17 Increase
2.3 Recoveryratesforpaperandwoodproducts Increase
3 Contributiontoclimatechangemitigation
16 Change in the direction indicated would constitute progress towards a green economy and change in the other direction would be movement away from a green economy. In many cases, there will be some maximum achievable level which should be defined, so “increase” would not be infinitely possible. 17 A distinction should be made between inputs of fossil energy and of renewable energy.

25
Indicator Directionof“progress”18
3.1 Carbonstocksandflowsinforestecosystemsandharvestedwoodproducts
Increaseinstocksanddecreaseinnetemissions
3.2 Shareofwoodenergyintotalprimaryenergysupply Increase19
3.3 Ameasureofsubstitutionorcascadeduseintheforestsector Progresswouldbearelativelyhighshareofuseasrawmaterialcomparedtouseforenergy,providedwastagewaskeptlow
4 Integrationofexternalitiesandpaymentforforestecosystemservices
4.1 Valueofecosystemservicesprovidedbyforests Increase
4.2 Systemsinplaceforpaymentofecosystemservices:numberofsystemsandtotalvalueoftransactions
Increase
4.3 Valueofforestrelatedcarbonmarkets Increase
5 Sustainabilityoftheforestsectorworkforce
5.1 Occupationalsafetyandhealthoftheforestryworkforce Increase
5.2 Investmentineducationandtraining Increase
5.3 Numberof“decentgreenjobs”intheforestsector(orshareofdecentgreenjobsintotalemploymentbytheforestsector)
Increase
6 Goodgovernanceandevidencebaseddecisionmaking
6.1 Nationalforestprogrammeintegratedintobroadernationalpoliciesandprogrammesforagreeneconomy
ExistenceofanNFPwhichcomplieswithagreedguidelines20
6.2 Monitoringsystemscapableofsupplyinggreeneconomyindicatorsanddatarequiredfornationalgreenaccountingsystems
Existenceofsystems
18 Change in the direction indicated would constitute progress towards a green economy and change in the other direction would be movement away from a green economy. In many cases, there will be some maximum achievable level which should be defined, so “increase” would not be infinitely possible. 19 This requires further discussion and putting in context. However, it is clear that the use of wood for energy is important and should be monitored, and compared to stated objectives. 20 For instance, those defined by Vienna Resolution V1 and the MCPFE Approach to National Forest
Programmes in Europe.

26
References
—.2011.TheEuropeanForestSectorOutlookStudyII2010‐2030.Geneva:UN,2011.
CzechStatisticalOffice(2013).GreenGrowthintheCzechRepublic:SelectedIndicators2013.Prague,CzechRepublic.
ECE/FAO.2014.RovaniemiActionPlanfortheForestSectorinaGreenEconomy.Geneva:UN,2014.ECE/TIM/SP/35,ISBN978‐92‐1‐117078‐8.
ForestEnterpriseEngland.2016.NaturalCapitalAccounts2015/2016.Bristol:ForestryCommissionEngland,2016.
GreenGrowthKnowledgePlatform(2013).Movingtowardsacommonapproachongreengrowthindicators.(GGKPScopingPaperNo.1).Geneva,Switzerland:GGKP.
GreenGrowthKnowledgePlatform(2016).MeasuringInclusiveGreenGrowthattheCountryLevel:TakingStockofMeasurementApproachesandIndicators.(GGKPResearchCommitteeonMeasurement&IndicatorsWorkingPaper02).Geneva,Switzerland:GGKP.
OECD.(2011).TowardsGreenGrowth:MonitoringProgress‐OECDIndicators.Paris,France:OECD.
OECD.(2014).GreenGrowthIndicators2014.OECDGreenGrowthStudies.Paris,France:OECD.
OECD.(2016).OECDPolicyHighlights:Measuringthetransformationoftheeconomy.GreenGrowthIndicators.PolicyPerspectives.Paris,France:OECD.
Prins,Kit.2013.Measuringprogressoftheforestsectortowardsthegreeneconomy:someproposals.2013.http://www.unece.org/index.php?id=31343#/.
StatisticsNetherlands.(2012).GreenGrowthintheNetherlands2012,TheHague,TheNetherlands:StatisticsNetherlands.
StatisticsNetherlands.(2015).GreenGrowthintheNetherlands2015,TheHague,TheNetherlands:StatisticsNetherlands.
UKNationalEcosystemAssessment(2011)TheUKNationalEcosystemAssessmentTechnicalReport.UNEP‐WCMC,Cambridge.
UnitedNations(2012a).SystemofEnvironmental‐EconomicAccounting2012:CentralFramework.UnitedNations,EuropeanCommission,FoodandAgricultureOrganizationoftheUnitedNations,InternationalMonetaryFund,OrganisationforEconomicCo‐operationandDevelopment,WorldBank.
UnitedNations(2012b).SystemofEnvironmental‐EconomicAccounting2012:ExperimentalEcosystemAccounting.UnitedNations,EuropeanCommission,FoodandAgricultureOrganizationoftheUnitedNations,OrganisationforEconomicCo‐operationandDevelopment,WorldBankGroup.
UnitedNations(2016).SystemofEnvironmental‐EconomicAccountingforAgriculture,ForestryandFisheries:SEEAAgriculture.UnitedNations,FoodandAgricultureOrganizationoftheUnitedNations.
UNEP(2011).Towardsagreeneconomy:pathwaystosustainabledevelopmentandpovertyeradication.Nairobi,Kenya:UNEP.
UNEP.(2012a).MeasuringProgresstowardsanInclusiveGreenEconomy.Geneva,Switzerland:UNEP.
UNEP(2014).UsingindicatorsforGreenEconomyPolicymaking.Nairobi,Kenya:UNEP.
UNEP(2015a).UncoveringPathwaysTowardsanInclusiveGreenEconomy:ASummaryforLeaders.Nairobi,Kenya:UNEP.
UNEP(2015b).TheGreenEconomyProgressMeasurementFramework.Geneva,Switzerland:UNEP.

27
Annex
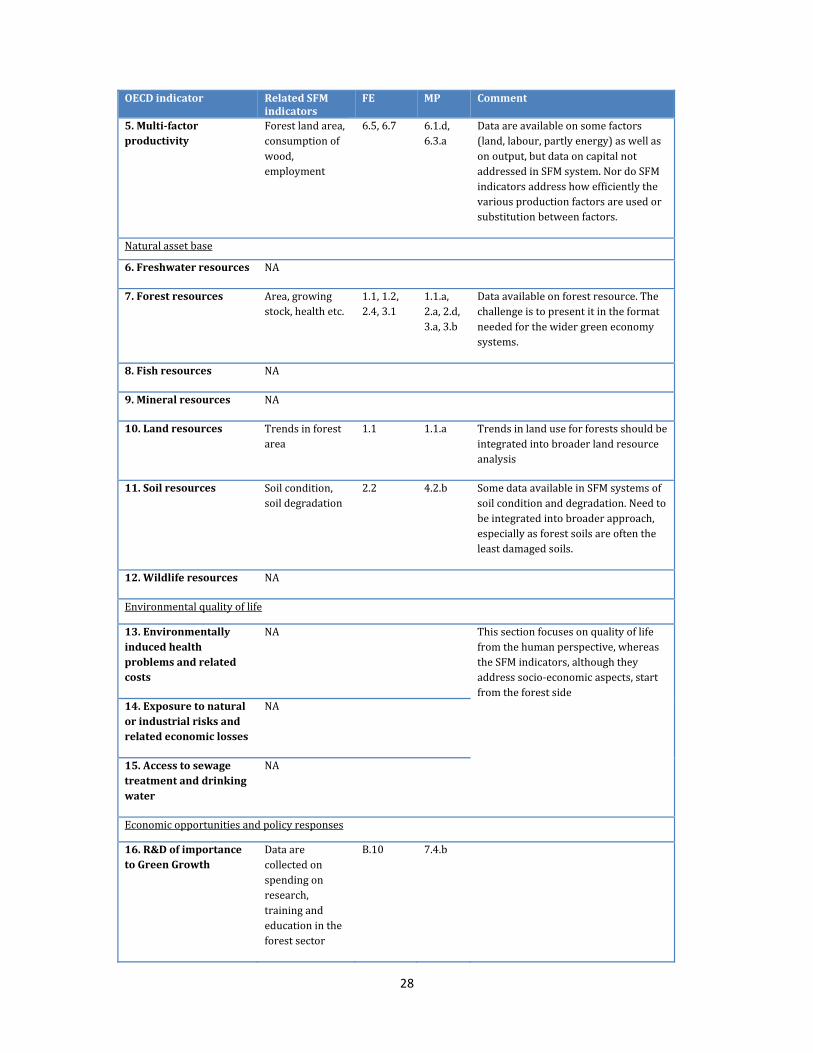
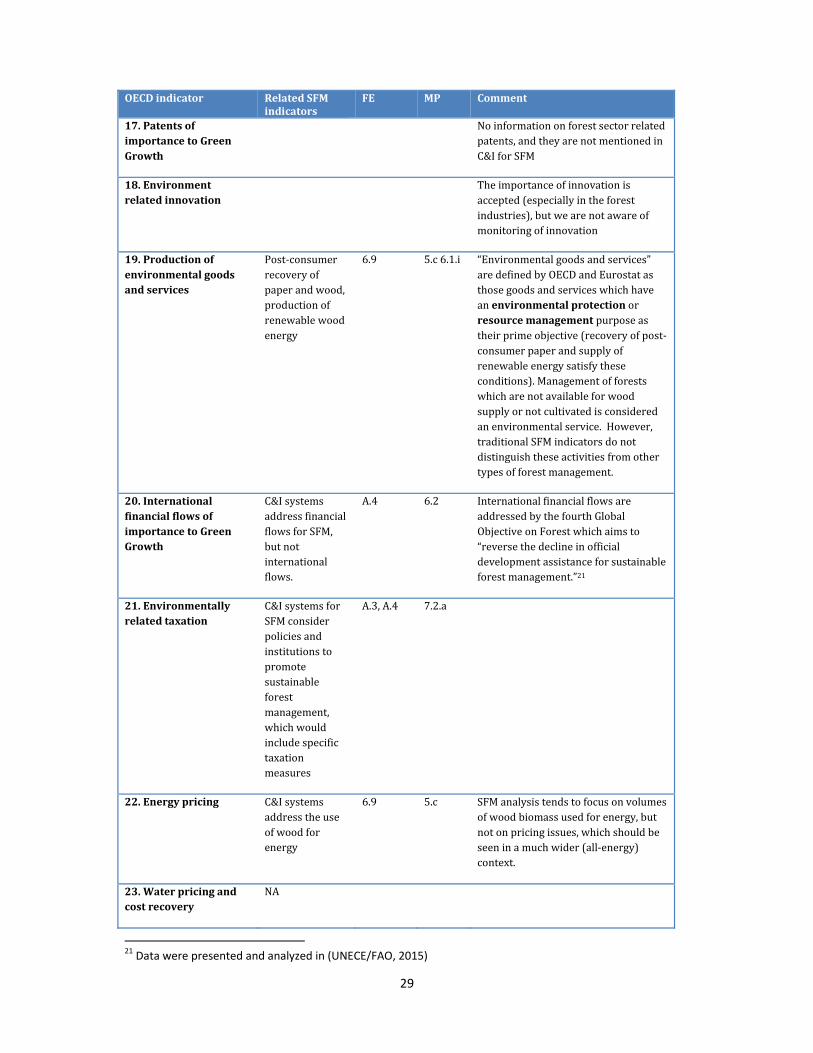
OECDgreengrowthindicatorsandSFMindicators(comprehensiveapproach,asopposedtotheselectionintableX)
OECDindicator RelatedSFMindicators
FE MP Comment
Socio‐economiccontextandcharacteristicsofgrowth Broadsocio‐economiccontextindicators,notapplicabletoanindividualsectorEconomicgrowthand
structureNA
Productivityandtrade NA
Inflationandcommodityprices
NA
Labourmarkets NA
Socio‐demographicpatterns
NA
Incomeandeducation NA
Environmentalandresourceproductivity
1.CO2productivity Carbonstocksandflows,incrementtofellingsratio,woodproductssupplyandconsumption
1.4,3.1 2.b,2.d,5.a,5.b,5.c,6.1.a,6.1.i
CO2productivityinforestecosystemsandinforestproductsindustryandconsumptionrepresentfundamentallydifferentissues(carbonsink,lifecycleassessment).Muchofthedataisavailable,butnotsofaranalysedintermsof“productivity”.Essentialtoaddressrecyclingandresidues
2.Energyproductivity Woodenergysupplyanduse
6.9 5.c SFMindicatorsfocusonshareofrenewablesinenergy,andenergyvs.materialusesforwood.Productivityaspectcouldbedeveloped(energyinput–withbreakdownrenewable/non‐renewable–comparedtoproductoutput),andsituationforwoodcomparedwithothermaterials.
3.Materialproductivity Consumptionofwood,productionofproducts,(roundwoodequivalents)
6.7 6.1.d UseofLifeCycleAssessmenttoolscoulddevelopmaterialproductivityinformation
4.Waterproductivity NA Someforestindustries(pulp,paper,fibreboard)aremajorwaterconsumers,butthisisnotaddressedinSFManalysis
28
OECDindicator RelatedSFMindicators
FE MP Comment
5.Multi‐factorproductivity
Forestlandarea,consumptionofwood,employment
6.5,6.7 6.1.d,6.3.a
Dataareavailableonsomefactors(land,labour,partlyenergy)aswellasonoutput,butdataoncapitalnotaddressedinSFMsystem.NordoSFMindicatorsaddresshowefficientlythevariousproductionfactorsareusedorsubstitutionbetweenfactors.
Naturalassetbase
6.Freshwaterresources NA
7.Forestresources Area,growingstock,healthetc.
1.1,1.2,2.4,3.1
1.1.a,2.a,2.d,3.a,3.b
Dataavailableonforestresource.Thechallengeistopresentitintheformatneededforthewidergreeneconomysystems.
8.Fishresources NA
9.Mineralresources NA
10.Landresources Trendsinforestarea
1.1 1.1.a Trendsinlanduseforforestsshouldbeintegratedintobroaderlandresourceanalysis
11.Soilresources Soilcondition,soildegradation
2.2 4.2.b SomedataavailableinSFMsystemsofsoilconditionanddegradation.Needtobeintegratedintobroaderapproach,especiallyasforestsoilsareoftentheleastdamagedsoils.
12.Wildliferesources NA
Environmentalqualityoflife
13.Environmentallyinducedhealthproblemsandrelatedcosts
NA Thissectionfocusesonqualityoflifefromthehumanperspective,whereastheSFMindicators,althoughtheyaddresssocio‐economicaspects,startfromtheforestside
14.Exposuretonaturalorindustrialrisksandrelatedeconomiclosses
NA
15.Accesstosewagetreatmentanddrinkingwater
NA
Economicopportunitiesandpolicyresponses
16.R&DofimportancetoGreenGrowth
Dataarecollectedonspendingonresearch,trainingandeducationintheforestsector
B.10 7.4.b
29
OECDindicator RelatedSFMindicators
FE MP Comment
17.PatentsofimportancetoGreenGrowth
Noinformationonforestsectorrelatedpatents,andtheyarenotmentionedinC&IforSFM
18.Environmentrelatedinnovation
Theimportanceofinnovationisaccepted(especiallyintheforestindustries),butwearenotawareofmonitoringofinnovation
19.Productionofenvironmentalgoodsandservices
Post‐consumerrecoveryofpaperandwood,productionofrenewablewoodenergy
6.9 5.c6.1.i “Environmentalgoodsandservices”aredefinedbyOECDandEurostatasthosegoodsandserviceswhichhaveanenvironmentalprotectionorresourcemanagementpurposeastheirprimeobjective(recoveryofpost‐consumerpaperandsupplyofrenewableenergysatisfytheseconditions).Managementofforestswhicharenotavailableforwoodsupplyornotcultivatedisconsideredanenvironmentalservice.However,traditionalSFMindicatorsdonotdistinguishtheseactivitiesfromothertypesofforestmanagement.
20.InternationalfinancialflowsofimportancetoGreenGrowth
C&IsystemsaddressfinancialflowsforSFM,butnotinternationalflows.
A.4 6.2 InternationalfinancialflowsareaddressedbythefourthGlobalObjectiveonForestwhichaimsto“reversethedeclineinofficialdevelopmentassistanceforsustainableforestmanagement.”21
21.Environmentallyrelatedtaxation
C&IsystemsforSFMconsiderpoliciesandinstitutionstopromotesustainableforestmanagement,whichwouldincludespecifictaxationmeasures
A.3,A.4 7.2.a
22.Energypricing C&Isystemsaddresstheuseofwoodforenergy
6.9 5.c SFManalysistendstofocusonvolumesofwoodbiomassusedforenergy,butnotonpricingissues,whichshouldbeseeninamuchwider(all‐energy)context.
23.Waterpricingandcostrecovery
NA
21 Data were presented and analyzed in (UNECE/FAO, 2015)
30
For more information, please contact:
Forestry and Timber Section
United Nations Economic Commission for Europe
Food Agriculture Organization of the United Nations
Palais des Nations
CH ‐ 1211 Geneva 10, Switzerland
Telephone: +41(0)22 917 1375
E‐mail: [email protected]
Website: http://www.unece.org/forests


![Green Economy ה לש סקודרפהו - CSRI · Green Economy & Green Growth [ ] •'The Future we Want': Rio+20 2012 •We consider green economy in the context of sustainable development](https://static.fdocuments.us/doc/165x107/5e8d61ea057b7926cb4edcc4/green-economy-oe-green-economy-green-growth-athe.jpg)


