Measuring the Social and Emotional Wellbeing od Aboriginal and Torres Strait Islander People
115
Measuring the social and emotional wellbeing of Aboriginal and Torres Strait Islander peoples
-
Upload
mikejackson -
Category
Documents
-
view
9 -
download
0
description
Australian Institute of Health and Welfare Canberra: Measuring the Social and Emotional Wellbeing of Aboriginal and Torres Strait Islander People
Transcript of Measuring the Social and Emotional Wellbeing od Aboriginal and Torres Strait Islander People

Measuring the social and emotional wellbeing of
Aboriginal and Torres Strait Islander peoples

The Australian Institute of Health and Welfare is Australia’s national health and welfare statistics and information agency. The Institute’s mission is better information and statistics for better health and wellbeing.
Please note that as with all statistical reports there is the potential for minor revisions of data in this report over its life. Please refer to the online version at <www.aihw.gov.au>.

Australian Institute of Health and Welfare Canberra
Cat. no. IHW 24
Measuring the social and emotional wellbeing of
Aboriginal and Torres Strait Islander peoples
January 2009

© Australian Institute of Health and Welfare 2009 This work is copyright. Apart from any use as permitted under the Copyright Act 1968, no part may be reproduced without prior written permission from the Australian Institute of Health and Welfare. Requests and enquiries concerning reproduction and rights should be directed to the Head, Media and Communications Unit, Australian Institute of Health and Welfare, GPO Box 570, Canberra ACT 2601. A complete list of the Institute’s publications is available from the Institute’s website <www.aihw.gov.au>. ISBN 978 1 74024 872 3
Suggested citation
Australian Institute of Health and Welfare 2009. Measuring the social and emotional wellbeing of Aboriginal and Torres Strait Islander peoples. Cat. no. IHW 24. Canberra: AIHW.
Australian Institute of Health and Welfare
Board Chair Hon. Peter Collins, AM, QC
Director Penny Allbon Any enquiries about or comments on this publication should be directed to: Aboriginal and Torres Strait Islander Program Evaluation and Capacity Building Unit Australian Institute of Health and Welfare GPO Box 570 Canberra ACT 2601 Phone: (02) 6244 1259 Front cover artwork Waterholes by Lyndy Delian
‘This screen print was inspired by sorrows of the Stolen Generations. Water is common to us all and the ripples on the surface of water reach far away. Stealing children over generations has had far reaching effects on the Aboriginal Nations. Using a contemporary design of circle, which is a common traditional symbol for water, the circles represent community and the half circles represent those who were taken from their families and don't make it back to their communities. Stealing just one child means their children and their children’s children unto the last generation will bear the effects. Water is also used to represent tears and tears are common to us all.’ Lyndy Delian
Published by the Australian Institute of Health and Welfare Printed by Bluestar Digital, ACT

v
Contents
Acknowledgments..................................................................................................................................vii Acronyms ................................................................................................................................................viii Symbols used ........................................................................................................................................... ix Summary .....................................................................................................................................................x
Defining and measuring social and emotional wellbeing.............................................................x The social and emotional wellbeing of Indigenous Australians ..................................................x Improving measures of social and emotional wellbeing..............................................................xi
1 Introduction.........................................................................................................................................1 1.1 What is social and emotional wellbeing? .................................................................................2 1.2 Development of the interim social and emotional wellbeing module .................................3
2 Data on the social and emotional wellbeing of Indigenous Australians ..............................10 2.1 Psychological distress................................................................................................................10 2.2 Impact of psychological distress ..............................................................................................13 2.3 Positive wellbeing ......................................................................................................................17 2.4 Anger ...........................................................................................................................................20 2.5 Life stressors ...............................................................................................................................22 2.6 Discrimination ............................................................................................................................25 2.7 Cultural identification ...............................................................................................................27 2.8 Removal from natural family ...................................................................................................28
3 Internal validation of the interim social and emotional wellbeing module ........................30 3.1 Validating the domains against each other ............................................................................31 3.2 Validating the domains against other variables ....................................................................44
4 Findings from other data sources..................................................................................................53 4.1 National Hospital Morbidity Database...................................................................................53 4.2 National Community Mental Health Care Database............................................................57 4.3 Supported Accommodation Assistance Program National Data Collection.....................61 4.4 Commonwealth State/Territory Disability Agreement National Minimum Data Set ....64 4.5 Bettering the Evaluation and Care of Health Survey............................................................68 4.6 Western Australian Aboriginal Child Health Survey...........................................................69
5 Stakeholder workshop on the interim module ..........................................................................74 5.1 Assessment of the eight domains of the interim module.....................................................74 5.2 Additional areas to explore ......................................................................................................75 5.3 Other outcomes of the workshop ............................................................................................76
6 Conclusions and recommendations..............................................................................................77

vi
6.1 Overall assessment of the eight domains ...............................................................................77 6.2 Recommendations......................................................................................................................84
Appendix A: Social and emotional wellbeing module—additional information ......................87 Kessler Psychological Distress Scale...............................................................................................87
Appendix B: Administrative data and other surveys—additional information..........................89 National Hospital Morbidity Database..........................................................................................89 National Community Mental Health Care Database...................................................................89 Supported Accommodation Assistance Program National Data Collection............................92 Commonwealth State/Territory Disability Agreement National Minimum Data Set ...........93 Bettering the Evaluation and Care of Health Survey...................................................................95
Appendix C: Technical notes ................................................................................................................96 Data analysis and presentation .......................................................................................................96
List of tables .............................................................................................................................................97 List of figures .........................................................................................................................................100 References...............................................................................................................................................101
Additional appendixes Appendix D: Chapter 2 detailed tables and confidence intervals……………………Web-based
Appendix E: Chapter 3 detailed tables and confidence intervals…………….………Web-based
Appendix F: Chapter 4 detailed tables and confidence intervals………….…………Web-based
These appendixes can be found at http://www.aihw.gov.au/publications/index.cfm

vii
Acknowledgments
This report was written by staff in the two Aboriginal and Torres Strait Islander Health and Welfare Units (Program Evaluation and Capacity Building, and Determinants and Outcomes) at the Australian Institute of Health and Welfare. The main contributors were Mieke Van Doeland, Helen Johnstone, Adriana Vanden Heuvel, Fadwa Al-Yaman, Sam Hemsley, Michelle Wallis, Michelle Gourley, Suzanne Dixon, Karen Byng and Nelufa Begum.
Thanks are extended to the Hospitals Unit, the Supported Accommodation and Crisis Services Unit, the Mental Health Services Unit and the Functioning and Disability Unit within the Institute who provided and/or commented on the administrative data. The Australian Bureau of Statistics (National Centre for Aboriginal and Torres Strait Islander Statistics) provided valuable comments on the draft report.
The outcomes of the 2006 social and emotional wellbeing workshop form part of this report. We would like to thank the workshop participants who included representatives from the National Advisory Group on Aboriginal and Torres Strait Islander Health Information and Data, the Office of Aboriginal and Torres Strait Islander Health, the Australian Bureau of Statistics and the National Aboriginal Community Controlled Health Organisation.
This work received financial support from the Australian Health Ministers’ Advisory Council (AHMAC) through the National Advisory Group on Aboriginal and Torres Strait Islander Health Information and Data.

viii
Acronyms
ABS Australian Bureau of Statistics
AHM Australian Health Ministers
AIHW Australian Institute of Health and Welfare
AI-SUPERPFP American Indian Services Utilization, Psychiatric Epidemiology, Risk and Protective Factors Project
BEACH Bettering the Evaluation and Care of Health
CDEP Community Development Employment Projects
CSTDA Commonwealth State/Territory Disability Agreement
ERP estimated resident population
GP general practitioner
ICD-10-AM International Statistical Classification of Diseases and Related Health Problems, 10th revision, Australian modification
ICD-10-PC International Classification of Diseases, 10th revision, Primary Care
K-5 Kessler-5 (modified version of Kessler Psychological Distress Scale-10)
K-6 Kessler High Distress Measure
K-10 Kessler Psychological Distress Scale-10
NACCHO National Aboriginal Community Controlled Health Organisation
NATSIHS National Aboriginal and Torres Strait Islander Health Survey
NATSISS National Aboriginal and Torres Strait Islander Social Survey
NCMHCD National Community Mental Health Care Database
NDC National Data Collection
NHS National Health Survey
NMDS National Minimum Data Set
SAAP Supported Accommodation Assistance Program
SDQ Strengths and Difficulties Questionnaire
SF-36 Short Form (36) Health Survey
SMHWB National Survey of Mental Health and Wellbeing
WAACHS Western Australian Aboriginal Child Health Survey
ix
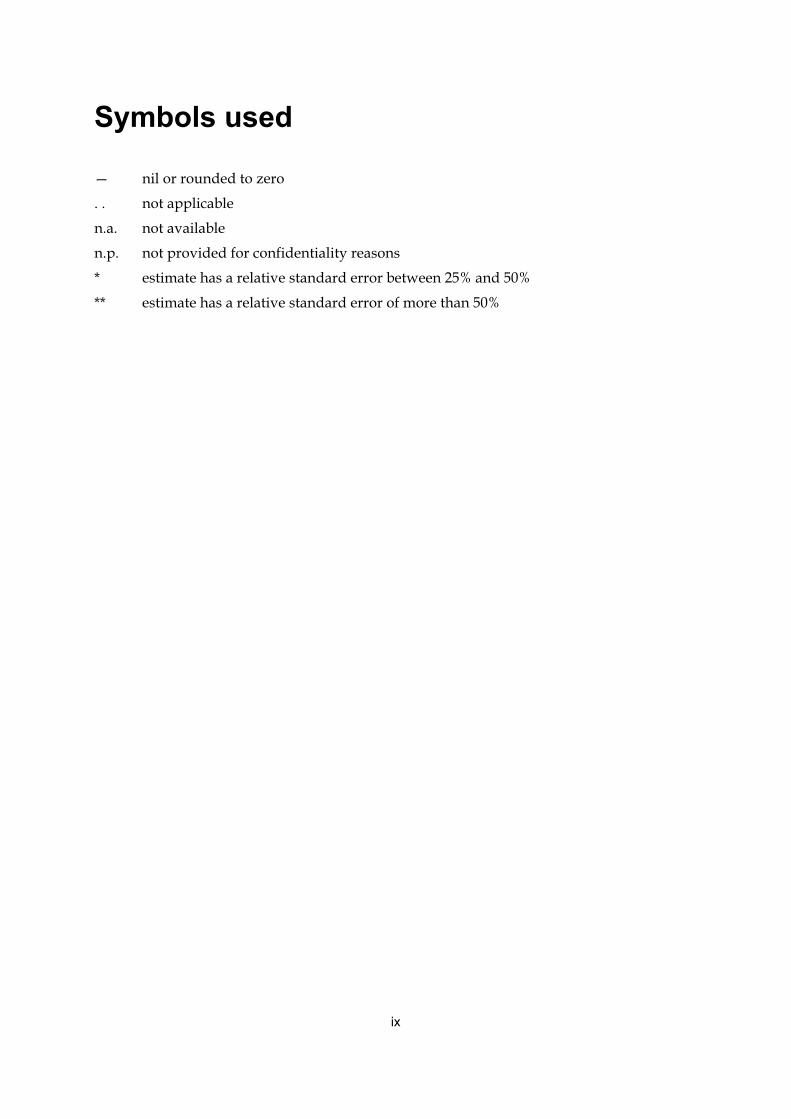
Symbols used
— nil or rounded to zero
. . not applicable
n.a. not available
n.p. not provided for confidentiality reasons
* estimate has a relative standard error between 25% and 50%
** estimate has a relative standard error of more than 50%

x
Summary
Defining and measuring social and emotional wellbeing The concept of social and emotional wellbeing that underpins the analyses in this Report attempts to capture an Aboriginal and Torres Strait Islander holistic and whole-of-life view of health. It includes mental health, but also considers the impact of other factors on emotional well being, such as life stressors, removal from family, discrimination and cultural identification.
Until recently, the majority of national data on the social and emotional wellbeing of Aboriginal and Torres Strait Islanders centred on the use of mental health services.
The interim social and emotional wellbeing module was developed to collect national data on this topic in the 2004–05 National Aboriginal and Torres Strait Islander Health Survey (NATSIHS).
The interim module has eight domains—psychological distress, impact of psychological distress, positive wellbeing, anger, life stressors, discrimination, cultural identification and removal from natural family.
This report provides current national data on the social and emotional wellbeing of Aboriginal and Torres Strait Islander peoples, reviews the effectiveness of the interim social and emotional wellbeing module, and makes recommendations for improving measures of social and emotional wellbeing.
The social and emotional wellbeing of Indigenous Australians Key findings from the 2004–05 NATSIHS were: • Over one-quarter (27%) of Indigenous adults reported high or very high levels of
psychological distress. • Indigenous Australians were twice as likely to report high or very high levels of
psychological distress as non-Indigenous Australians. • Almost one in 10 Indigenous Australians had visited a doctor or health professional in
the 4 weeks prior to interview due to feelings of psychological distress. • In relation to life stressors, four in 10 Indigenous adults indicated that they or their
family or friends had experienced the death of a family member or close friend in the previous year, 28% reported serious illness or disability and 20% reported alcohol-related problems.
On the other hand:
• Over half of Indigenous adults reported feeling calm and peaceful (51%) and/or full of life (55%) all or most of the time.

xi
• Nearly three-quarters (71%) reported being happy in the last 4 weeks.
Other data sources also indicated that Aboriginal and Torres Strait Islanders have poorer social and emotional wellbeing than non-Indigenous Australians: • The rate of community mental health service contacts for Indigenous people was more
than twice that for non-Indigenous people. • Aboriginal and Torres Strait Islander people were twice as likely to be hospitalised for
intentional self-harm as non-Indigenous people.
Improving measures of social and emotional wellbeing This report found that the interim module performed well and all eight domains should be retained, with some modifications required to five of the domains. The report recommends that the feasibility of defining and measuring a number of additional concepts (self-efficacy, resilience and identity, isolation and loneliness, and social wellbeing) should be further explored.
The AIHW has been funded to undertake some of this work in a second report on Indigenous social and emotional wellbeing that considers the concepts of self efficacy, resilience and identity, and social wellbeing. NACCHO is responsible for considering the concepts of isolation and loneliness in a separate report.


1
1 Introduction
Social and emotional wellbeing, as defined in this report, is a broad and holistic concept that reflects the Aboriginal and Torres Strait Islander holistic understanding of life and health. It includes mental health, but also considers other factors such as cultural, spiritual and social wellbeing. It encompasses not just the wellbeing of the individual, but also the wellbeing of their family and community.
The social and emotional wellbeing of Aboriginal and Torres Strait Islander people is an area of particular concern and has been identified as a priority area of the National Strategic Framework for Aboriginal and Torres Strait Islander Health (NATSIHC 2004). While there is a scarcity of national data that specifically measure the social and emotional wellbeing of Indigenous Australians, data that are available paint a consistent picture—one of much higher rates of use of mental health services by Indigenous Australians compared with other Australians (ABS & AIHW 2005; AIHW 2008b).
The need for better national data on the social and emotional wellbeing of Indigenous Australians has been noted in numerous reports over many years (for example NHMRC 2002; SHRG 2004; Swan & Raphael 1995). Information is needed to support the development and assessment of policies and programs aimed at addressing this area of disadvantage among Indigenous Australians. While the importance of social and emotional wellbeing has been recognised, as a concept it is difficult to define and to measure and, until recently, there was a lack of agreed-upon national measures of social and emotional wellbeing.
For these reasons, the measurement of the social and emotional wellbeing of Aboriginal and Torres Strait Islander peoples is part of the work program of the National Advisory Group on Aboriginal and Torres Strait Islander Health Information and Data (AIHW 2006b). As part of this work program, three organisations—namely the Australian Institute of Health and Welfare (AIHW), the National Aboriginal Community Controlled Health Organisation (NACCHO) and the Australian Bureau of Statistics (ABS)—have worked collaboratively since 2003 to develop measures of social and emotional wellbeing.
In 2003 the AIHW organised a workshop of interested stakeholders, where the interim social and emotional wellbeing module was developed for inclusion in the 2004–05 National Aboriginal and Torres Strait Islander Health Survey (NATSIHS). The interim module consists of eight domains covering the areas of psychological distress, impact of psychological distress, positive wellbeing, anger, life stressors, discrimination, cultural identification and removal from natural family. This was an important step towards the goal of developing an agreed-upon and validated social and emotional wellbeing survey module that would provide accurate measures of social and emotional wellbeing among Indigenous Australians, and also allow for comparisons with non-Indigenous Australians. It was agreed at the 2003 workshop that the interim module would be reported on once it had been tested.
This report assesses how well the interim social and emotional wellbeing module worked in the 2004–05 NATSIHS, and reports on the outcomes of stakeholders workshop held in 2006 that reviewed the interim module. The report makes a number of recommendations for improving the module and other measures relevant to social and emotional wellbeing. The report also includes data on social and emotional wellbeing of Indigenous Australians from other data sources. The structure of this report is:

2
• Chapter 1 outlines the concept of social and emotional wellbeing and the development of the interim module
• Chapter 2 includes data on the social and emotional wellbeing of Indigenous Australians from the 2004–05 NATSIHS
• Chapter 3 reports on the internal validation of the interim module • Chapter 4 provides data from other sources on the social and emotional wellbeing of
Indigenous Australians which can also be used to externally validate the module • Chapter 5 summarises the outcomes from the 2006 stakeholders’ workshop on the
interim module • Chapter 6 pulls together the analyses in the preceding chapters to provide an overall
assessment of the interim module, and outlines the recommendations for improving the module and related measures for use in future surveys
• Appendix A provides more detailed information on the measures in the interim module; Appendix B provides additional information on the administrative data reported in Chapter 4; Appendix C provides technical notes; and appendixes D, E and F (web-based only) provide detailed tables to support the analyses in chapters 2, 3 and 4.
1.1 What is social and emotional wellbeing? The concept of social and emotional wellbeing used in this report is based on the Australian Aboriginal view of health. This view recognises that achieving optimal conditions for health and wellbeing requires a holistic and whole-of-life view of health that encompasses the social, emotional and cultural wellbeing of the whole community (SHRG 2004).
In the 1989 National Aboriginal Health Strategy (NAHSWP 1989) a concept of health is presented that recognises the correlations that exist between Indigenous health and cultural, traditional, political and socioeconomic factors of Indigenous history and society (NAHSWP 1989). This holistic view of health has been reiterated in numerous other documents, and was developed further in Ways forward, a report by Swan and Raphael (1995) who wrote:
Aboriginal concept of health is holistic, encompassing mental health and physical, cultural and spiritual health. Land is central to well-being. This holistic concept does not merely refer to the ‘whole body’ but in fact is steeped in the harmonised interrelations which constitute cultural well-being. These inter-relating factors can be categorised as largely spiritual, environmental, ideological, political, social, economic, mental and physical. Crucially, it must be understood that when the harmony of these interrelations is disrupted, Aboriginal ill-health will persist.
Social and emotional wellbeing is a concept that attempts to encompass this holistic view of health. It also seeks to recognise Aboriginal and Torres Strait Islander peoples’ particular experiences of grief and trauma through colonisation, separation from families, and loss of land and culture.
It is important to understand the relationship between the concepts of social and emotional wellbeing and mental health. Mental health is also a complex domain that is defined in a number of different ways (AHM 2003). A definition of mental health agreed on by Australian Health Ministers (AHM 2003) was:
A state of emotional and social well-being in which the individual can cope with the normal stress of life and reach his or her potential.

3
Mental health is therefore a component of social and emotional wellbeing. The concept of mental health comes more from an illness or clinical perspective and its focus is more on the individual and their level of functioning in their environment. The social and emotional wellbeing concept is broader than this and recognises the importance of connection to land, culture, spirituality, ancestry, family and community, and how these affect the individual (SHRG 2004).
Mental health problems impact on social and emotional wellbeing. Mental health problems and mental illness refer to ‘the range of cognitive, emotional and behavioural disorders that interfere with the lives and productivity of people’ (AHM 2003:5). A mental illness is a clinically diagnosable disorder that significantly interferes with an individual’s cognitive, emotional or social abilities. Social and emotional wellbeing problems cover a broad range of problems that can result from unresolved grief and loss, trauma and abuse, domestic violence, removal from family, substance misuse, family breakdown, cultural dislocation, racism and discrimination, and social disadvantage (SHRG 2004).
While it is difficult to precisely define the concepts of mental health and social and emotional wellbeing, it is more difficult to develop measures for these concepts at the population level. As noted in the National Mental Health Plan 2003–2008, the measurement of mental health is complex and there is no widely accepted measurement approach to date (AHM 2003). The measurement of social and emotional wellbeing presents even more challenges, although there has been some progress made towards developing appropriate measures for use in the Australian context.
1.2 Development of the interim social and emotional wellbeing module Stakeholders in Indigenous statistics have been advocating for the inclusion of measures of social and emotional wellbeing (including measures of mental health) as a priority area for collection and reporting. There were, however, significant concerns about the appropriateness of using existing survey instruments to measure this concept in the Aboriginal and Torres Strait Islander population.
Questions that are regularly used to measure mental health in general population health surveys in Australia were designed to measure this concept in the context of Western culture. It has been argued by Indigenous Australians and others (for example Swan & Raphael 1995) that many of these questions are culturally and socially inappropriate for Indigenous Australians.
In light of concerns about the validity of the standard mental health questions, the ABS did not include any general mental health measures in the Indigenous component of the 2001 National Health Survey (NHS). This meant no data were collected from that survey on the mental health of Indigenous Australians. Recognising the importance of obtaining data on the social and emotional wellbeing of Indigenous Australians, high priority was placed on the development of an appropriate instrument for inclusion in the 2004–05 NATSIHS (which was to be run in conjunction with the 2004–05 NHS).
However, no measures had been sufficiently developed for use in the survey, and there was a lack of agreement among key stakeholders on the questions that should be used. The AIHW therefore convened a one-day workshop in 2003 to discuss and agree upon an interim social and emotional wellbeing module for inclusion in the 2004–05 NATSIHS. Stakeholders

4
involved in this process included representatives from the NACCHO, the Standing Committee on Aboriginal and Torres Strait Islander Health, the Office for Aboriginal and Torres Strait Islander Health, Aboriginal and Torres Strait Islander Services, Australian Government and state and territory health agencies, and the ABS. In addition, experts who had experience in related surveys in New South Wales, Western Australia and the Northern Territory participated in the workshop.
Given the time limits that existed, it was recognised at the workshop that devising a new and comprehensive set of culturally appropriate measures of social and emotional wellbeing for Indigenous Australians was not possible. Therefore, it was agreed that an interim social and emotional wellbeing module would be developed but that it would only include pre-existing measures (with minor modifications if required). The workshop participants also agreed that for the module to be accepted by Indigenous stakeholders it should contain as few questions as possible and that these needed to be brief.
The workshop produced a range of measures for the module and the development and testing of these measures resulted in the following eight being included in the module (these are all described in more detail in the next section): • psychological distress domain (K-5) - a modified version of the Kessler Psychological
Distress Scale-10 (K-10) • impact of psychological distress domain to detect the impact of psychological or
emotional distress on the respondent’s life • positive wellbeing domain to identify positive emotional states such as happiness and
vitality, in order to provide balance with the first two items • anger domain to capture various manifestations of anger that could be analysed against
other dimensions of the module • life stressors to identify other factors potentially affecting social and emotional
wellbeing • discrimination that was recognised as having an adverse effect on social and emotional
wellbeing • cultural identification to recognise the importance Indigenous people place on a sense
of belonging • removal from natural family to capture significant events that are likely to have
impacted on an individual’s social and emotional wellbeing.
The development and testing stages of the interim module led to the elimination of some proposed items: • There were no existing and appropriate measures of ‘isolation’ and ‘coping’ available for
use and not enough time to develop new measures, and therefore these concepts were dropped from the survey specifications.
• Pilot testing identified difficulties with the ‘family resilience’ items and the item was dropped from the specifications after the pilot test.
Detailed description of the interim module The final eight domains in the interim module were not intended to serve as a comprehensive and cohesive measure of Indigenous social and emotional wellbeing and were not intended to be used to derive an overall social and emotional wellbeing score. The

5
interim module represented the first step in developing appropriate measures of social and emotional wellbeing for Aboriginal and Torres Strait Islander peoples. The workshop proposed that the module be used in the 2004–05 NATSIHS, comprehensively reviewed and further developed for subsequent ABS surveys.
The aims of the interim module were to: • provide a broad assessment of the social and emotional wellbeing of Indigenous
Australians • test the applicability of existing measures to Indigenous contexts • provide insights into best practice for developing instruments and measuring social and
emotional wellbeing.
Following is a detailed description of the eight domains in the interim module and how these were developed.
Psychological distress (Kessler-5) The K-5 measure of psychological distress consists of a subset of five questions taken from the Kessler Psychological Distress Scale-10 (K-10) developed in 1992 by professors Ron Kessler and Dan Mroczek (ABS 2003). The K-10 is a non-specific psychological distress scale that consists of 10 questions designed to measure levels of negative emotional states experienced in the 4 weeks prior to interview (see Appendix A for a list of the K-10 questions).
The NSW Health Survey of 1997 and 1998 utilised the K-10 to measure the psychological distress of more than 35,000 people aged 16 years and over, 600 of whom self-identified as Aboriginal and/or Torres Strait Islander. Comparisons of population and sample showed that similar response rates were achieved for both Indigenous and non-Indigenous people and with agreement from the Ethics Committee of the Aboriginal Health and Medical Research Council of NSW, these comparative results were published (NSW Health Department 2000).
In addition to the 10 item question set, the Kessler Psychological Distress Scale also has a 6-question format that is referred to as the Kessler High Distress Measure or, alternatively, the K-6. The K-6 has been used in a number of international studies including the United States National Health Interview Survey (NCHS 2007). In addition, the American Indian Services Utilization, Psychiatric Epidemiology, Risk and Protective Factors Project (AI-SUPERPFP), which sought to measure the prevalence of mental health problems in American Indians, utilised the K-6 and found that this tool provided a concise and accurate measure of psychological distress within this population (NCAIANMHR 2007).
Stakeholders involved in the 2003 social and emotional wellbeing workshop recognised the usefulness of the K-6 in providing a measure of psychological distress, but concerns existed about the cultural appropriateness of the wording of one of the K-6 items. That is, it was felt that the question about the amount of time a person felt ‘worthless’ might be considered offensive to some Aboriginal and Torres Strait Islanders (Stewart 2003).
Given that previous research has found that both the K-10 and K-6 are fairly robust measures (for example Furukawa et al. 2003; Kessler et al. 2002) and given that an analysis of 1997–98 NSW Health Survey data suggested that the value of the measure would not be drastically affected by the loss of one item (Stewart 2003), it was agreed that five of the six items from the K-6 would be included in the 2004–05 NATSIHS to provide a measure of psychological distress. Professor Kessler and state and territory health authorities gave their support for

6
the inclusion of these five questions as a means to measure psychological distress among Indigenous Australians.
In addition, slight wording changes were made to two of the original Kessler items to enhance understanding in an Indigenous context: the item which refers to feeling ‘hopeless’ was changed to one that asked about feeling ‘without hope’, and the original item that asked about feeling ‘restless or fidgety’ was modified to one that asked about feeling ‘restless or jumpy’.
Impact of psychological distress In order to identify and quantify the impact of psychological distress on the respondent’s life, Kessler and colleagues also developed a series of follow-up questions to the K-10/K-6 items. These questions (or somewhat modified versions of them) have been included in the United States National Health Interview Survey and in a number of Australian state and territory health surveys (for example in New South Wales, South Australia and the Northern Territory) (DoHA 2003). They were included in the interim social and emotional wellbeing module and are referred to as the impact questions.
Respondents were asked the following five questions: ‘In the last four weeks, about how often: Did you feel nervous? without hope? restless or jumpy? that everything was an effort? and so sad that nothing could cheer you up?’. For each question, there were five response options: all of the time, most of the time, some of the time, a little of the time, and none of the time (ABS 2006c). In addition, those respondents who had a psychological distress score in the range 6-25 were asked about how this distress affected their ability to work or carry out their normal activities; how many times they had seen a doctor or other health professional due to their distress; and how often physical health problems were the main cause of their distress. Note that the latter question was included as a means to further examine the causal direction of association between physical and mental health. Stewart (2003) noted that while it was often suggested that psychological distress is most often a secondary effect of physical health, analyses of NSW Health Survey data suggest that this is not necessarily the case.
Positive wellbeing In order to provide a balance to the ‘illness’ perspective as captured by the psychological distress questions, a positive wellbeing domain was included in the interim social and emotional wellbeing module. This domain consisted of selected questions from the Short Form 36 Health Survey (SF-36). The SF-36 provides a generic measure of health status (see Ware 2007; Ware et al. 1993) that has been used widely both in Australia and overseas. It consists of 36 questions from which eight scales can be derived: physical functioning, role limitations due to physical health problems, bodily pain, general health, vitality, social functioning, role limitations due to emotional problems, and mental health.
Four positively-worded items from the mental health and the vitality scales were used in the interim module to capture the concept of positive wellbeing. The questions were: ‘In the last four weeks, about how often: Did you feel calm and peaceful? Have you been a happy person? Did you feel full of life? Did you have a lot of energy?’ (ABS 2006c).
Note that in the standard SF-36 there are six response options. For the purposes of the interim module, one of those categories (namely, a good bit of the time) was removed in order to line up the response options used for this domain to those used for the psychological distress domain (Stewart 2003).

7
Anger Anger is viewed by health experts as a useful indicator of distress, and the measurement of anger was considered to be particularly pertinent for the examination of social and emotional wellbeing among Indigenous Australians. At the time of the development of the interim social and emotional wellbeing module for the 2004–05 NATSIHS, no existing anger questions from Australian surveys were considered to be satisfactory. Thus, five questions were adopted from the questionnaire used in the AI-SUPERPFP study, a multi-stage, cross-sectional study of American Indian communities in the United States (NCAIANMHR 2007). The five anger items that were included in the survey asked respondents to indicate how often, in the previous four weeks, they had been bothered or upset by any the following: feeling easily annoyed or irritated; having violent thoughts like wanting to beat, injure or harm someone; wanting to break or smash things; getting into a lot of arguments; and shouting or throwing things.
The objective of the five anger questions was to report various manifestations of anger rather than provide a discrete measure of anger per se among Australia’s Indigenous population (ABS: Miller 2004). The manifestations of anger covered by the five questions vary in intensity (for example ‘feeling easily annoyed or irritated’ as opposed to ‘wanting to break or smash things’). They also vary in terms of whether they relate to feelings and thoughts (for example ‘having violent thoughts like wanting to beat, injure or harm someone’) or to actions (for example ‘shouting or throwing things’) (ABS 2006b).
Life stressors The experience of stressful events (for example illness, serious accident, death in family, divorce) can have a significant effect on an individual’s social and emotional wellbeing. These stressors may affect an individual through direct experience or indirectly through a family member’s problems (ABS 2007). Stakeholders involved in the development of the social and emotional wellbeing module recognised that questions about life stressors were an important source of information in providing context for other questions in this module.
Two different stressor questions were included in the 2004–05 NATSIHS: one was asked of Indigenous people living in non-remote areas of Australia, and another was asked of Indigenous people residing in remote areas of Australia. The wording and order of the specified stressors were somewhat different in the two questions, and in the non-remote version two extra stressors (namely ‘mental illness’ and ‘pressure to fulfil cultural responsibilities’) were included.
In both versions, the questions asked about stressors that may have been a problem for the respondent, their family and/or friends in the previous 12 months, although the non-remote version referred to ‘close friends’ while the remote version simply referred to ‘friends’ (ABS 2006b). These stressor questions had been previously used in the ABS’s 2002 National Aboriginal and Torres Strait Islander Social Survey (NATSISS) (ABS 2004). In order to allow analyses to be undertaken for the whole Indigenous sample simultaneously (rather than separately for remote and non-remote areas), one variable that consisted of the 15 items common to both of the two stressor questions was used.
Discrimination Discrimination represents perceived rejection and persecution by the dominant culture (Whitbeck et al. 2002). Key stakeholders agreed that discrimination is an important

8
component of social and emotional wellbeing measures, and thus a series of questions identifying feelings of discrimination among Indigenous people was included in the 2004–05 NATSIHS (ABS 2006b). These items were developed with the assistance of an advisory group comprising experts in Indigenous information, research and health issues.
A set of four items were included in the 2004–05 NATSIHS that asked whether respondents felt that in the previous 12 months they were treated the same as non-Indigenous people when seeking health care and whether they had been treated badly in any situation because of their Indigenous origin. Those who replied ‘yes’ to the latter of the two questions were then asked how they felt when discriminated against (with options such as feel angry, feel sad and feel sick), and what they usually did when treated badly (for example try to avoid person or situation, keep it to yourself) (ABS 2006c).
Cultural identity In recognition of both the importance that many Indigenous people place on a sense of belonging at the community level and connection to country, and the detrimental effects that a break in this sense of belonging could have on social and emotional wellbeing, a series of cultural identity questions were included in the 2004–05 NATSIHS. These questions had previously been utilised in the ABS’s 2002 NATSISS (ABS 2004).
The cultural identification domain of the interim module consisted of four items that identify the level of attachment Indigenous people have to their tribal or language group and traditional country. These items, which were asked only of those living in non-remote areas in the 2004-05 NATSIHS, asked respondents if they identify with a tribal group, a language group or clan and if they recognise an area as their homelands or traditional country. Those who replied ‘yes’ to the latter of the questions were then asked if they currently live there and, if not, whether they are allowed to visit there.
Removal from natural family Family is the core unit for Indigenous people and sharing customs through generations is essential in keeping their sense of identity alive (Whap 2001). Throughout history there have been a number of events and policy decisions that have threatened family ties among Aboriginal and Torres Strait Islander peoples, such as the removal of some Indigenous children from their natural families and the introduction of custodial care. These events affect and shape the social and emotional wellbeing of Indigenous Australians. Similar to the cultural identity questions, the removal from family questions were sourced from the ABS’s 2002 NATSISS (NATSISS: ABS 2004a).
Respondents were asked if they themselves had been taken away from their natural family by a mission, the government or welfare, and if any of their relatives had been taken away from their natural family. Those who replied ‘yes’ to the latter of the questions were asked to indicate which of their relatives had been removed (ABS 2006c).
Collecting data using the interim module Once finalised, the interim social and emotional wellbeing module was incorporated into the 2004–05 NATSIHS questionnaire. Special procedures were introduced for the survey in light of concerns about respondent burden and the possible impact on respondents of being asked questions about their social and emotional wellbeing.

9
Firstly, interviewers attempted to ensure that all interviews were conducted in a private setting. Respondents were also provided with a ‘refusal’ option for the four questions on positive wellbeing, the five questions on psychological distress, the one question on discrimination in health care and the three questions on removal from natural family.
Indigenous facilitators were engaged in remote areas to assist with interviewing. The questions were asked in English if the respondent was functionally literate in English. Otherwise, they were translated into the respondent’s own language by the Indigenous facilitator and their answers were conveyed back to the interviewer in English.
In remote areas local clinics were made aware of the survey and respondents were referred to the clinic if they wished to discuss any issues arising from the survey. In non-remote areas the Aboriginal Medical Services were informed of the survey and their contact details were provided to respondents at the interview.

10
2 Data on the social and emotional wellbeing of Indigenous Australians
This chapter presents data on the social and emotional wellbeing of Aboriginal and Torres Strait Islander peoples as measured by the interim social and emotional wellbeing module in the 2004–05 NATSIHS. Data from the eight domains of the module are presented, including differences by age, sex, and remoteness. Some figures for individual states and territories are also included.
The total number of Aboriginal and Torres Strait Islander adults surveyed in the 2004–05 NATSIHS was 5,757 (children were also surveyed in the 2004–05 NATSIHS but only adults were asked questions in the social and emotional wellbeing module). After the data was weighted to account for the method of sample selection and to allow for the interpretation of results based on the population as a whole, the NATSIHS sample represented a population of 258,300 Indigenous Australian adults.
Although the 2004–05 NATSIHS was run in association with the 2004–05 NHS, only the psychological distress domain of the interim social and emotional wellbeing module was included in the NHS (ABS 2006b). Psychological distress was therefore the only measure where the Indigenous and non-Indigenous populations could be compared.
2.1 Psychological distress In the NATSIHS psychological distress module, respondents were asked the following five questions: ‘In the last four weeks, about how often: Did you feel nervous? without hope? restless or jumpy? that everything was an effort? and so sad that nothing could cheer you up?’ For each question, there were five response options: all of the time, most of the time, some of the time, a little of the time, and none of the time (ABS 2006c).
For each of the questions, ‘none of the time’ was most frequently reported (between 38% and 62% of responses), while 6% or fewer Indigenous adults responded ‘all of the time’ (Table 2.1).
Table 2.1: Frequency of feelings of psychological distress by psychological distress indicators, Indigenous persons aged 18 years and over, 2004–05 (per cent)
Nervous Without hope Restless or
jumpy Everything was
an effort
So sad that nothing could cheer you up
All of the time 2.8 2.3 4.4 6.0 2.2
Most of the time 6.2 5.0 8.1 10.7 5.0
Some of the time 19.9 13.0 20.3 20.7 13.4
A little of the time 25.5 15.6 24.3 23.1 16.0
None of the time 44.4 62.4 41.5 38.2 62.2
Total(a) 100.0 100.0 100.0 100.0 100.0
(a) Includes missing responses.
Source: AIHW analysis of the 2004–05 NATSIHS.

11
As per the standard approach to scoring K-6 and K-10 items, the five psychological distress items were scored from 1 for ‘none of the time’ to 5 for ‘all of the time’. These scores were then summed, yielding a scale with a minimum score of 5 (where response was ‘none of the time’ to all five questions) and a maximum score of 25 (where response was ‘all of the time’ to all five questions). The data are presented as two dichotomous groups - ‘low/moderate’ (scores of 5 to 11.9) and ‘high/very high’ (scores of 12.0 to 25) in this chapter.
Table 2.2: Level of psychological distress by selected characteristics, Indigenous persons aged 18 years and over, 2004–05 (per cent)
Low/moderate High/very high Total(a)
Sex
Male 77.1 21.4 100.0
Female 66.2 32.2 100.0
Age
18–24 years 72.8 26.0 100.0
25–34 years 71.4 27.1 100.0
35–44 years 69.6 29.2 100.0
45–54 years 69.3 29.4 100.0
55 years and over 73.8 23.0 100.0
Remoteness
Major Cities 74.2 25.2 100.0
Inner Regional 70.8 29.1 100.0
Outer Regional 68.7 29.6 100.0
Remote or Very Remote 70.4 26.0 100.0
Total(a) 71.3 27.2 100.0
Total no. of Indigenous people(a) 184,100 70,200 258,300
(a) Includes missing responses.
Note: The category ‘low/moderate’ includes those who responded ‘none of the time’ to all five questions on psychological distress.
Source: AIHW analysis of the 2004–05 NATSIHS.
In the 2004–05 NATSIHS, an estimated 184,100 Indigenous adults (71%) reported low/moderate psychological distress levels, some 46,900 (18%) with a score of five. Table 2.2 shows that a further estimated 70,200 Indigenous adults (27%) reported feelings associated with high/very high levels of psychological distress, while no psychological distress score could be calculated (due to missing data) for the remaining 2%. Indigenous females were significantly more likely than Indigenous males to report high/very high levels of psychological distress (32% and 21%, respectively). In contrast, there were no significant differences in psychological distress levels by age or by remoteness category.
Because the 2004–05 NHS included the K-10 psychological distress questions, a K-5 score has been created from both surveys and thus a comparison between Indigenous and non-Indigenous Australians is possible in relation to this domain. There were, however, some differences between the two surveys in content and methodology (for example use of prompt cards varied, and wording of K-5 questions were slightly different) that should be taken into account when making comparisons.

12
After taking into account differences in the relative size and age structure of the two populations, Indigenous Australians were twice as likely as non-Indigenous Australians to report high/very high levels of psychological distress (27% compared with 13%). A similar difference in rates was observed when the results were compared separately for men (ratio of 2.1) and for women (ratio of 2.0) (Appendix Table D4). Differences by Indigenous status were also compared separately for each age group and the results are shown in Table 2.3. With the exception of the age group 18–24 years, the rate of high/very high psychological distress among Indigenous adults was at least twice the corresponding non-Indigenous rate.
Table 2.3: Number and proportion of people who reported high or very high levels of psychological distress, by Indigenous status and age, persons aged 18 years and over, 2004–05
Indigenous Non-Indigenous
Number Per cent(a) Number Per cent(a) Rate ratio(b)
18–24 years 14,700 26.0 299,600 16.1 1.6
25–34 years 18,900 27.1 338,200 12.2 2.2
35–44 years 17,200 29.2 389,500 13.4 2.2
45–54 years 11,700 29.4 368,000 13.6 2.2
55 years and over 7,600 23.0 528,200 11.7 2.0
Total 70,200 27.2 1,923,500 13.0 2.1
Total no. of people(c) 258,300 . . 14,753,300 . . . .
. . Not applicable
(a) The rates for total persons were directly age standardised, while the rates for each age group are crude rates, as detailed in Appendix C.
(b) Ratio Indigenous: non-Indigenous.
(c) Includes missing responses.
Source: AIHW analysis of the 2004–05 NATSIHS and 2004 NHS.
The proportion of Indigenous adults with high/very high psychological distress levels ranged from 21% in the Northern Territory to 35% in Western Australia. Relatively high rates of high/very high psychological distress were also reported among Indigenous adults in Tasmania (34%) and the Australian Capital Territory (30%).
Significant differences by Indigenous status were also observed for each of the three remoteness categories for which there were data in both surveys (Table 2.4). The largest difference observed was in Outer Regional areas, where 2.2 Indigenous adults reported high/very high psychological distress levels for every one non-Indigenous adult who reported the same level of psychological distress.

13
Table 2.4: Number and proportion of people who reported high or very high levels of psychological distress, by Indigenous status and remoteness(a), persons aged 18 years and over, 2004–05
Indigenous Non-Indigenous
Number Per cent(b) Number Per cent(b) Rate ratio(c)
Major Cities 19,900 25.6 1,300,300 12.8 2.0
Inner Regional 15,000 27.9 403,600 13.9 2.0
Outer Regional 16,400 28.9 199,000 12.9 2.2
Total(d) 70,200 26.6 1,923,500 13.1 2.0
(a) Since the remote sample of the NHS did not have the same scope and coverage as that of the NATSIHS, comparisons of psychological distress can only be made between those living in non-remote areas of Australia.
(b) Directly age standardised using the Australian 2001 estimated resident population, as detailed in Appendix C.
(c) Ratio Indigenous: non-Indigenous.
(d) Includes those living in remote or very remote areas.
Source: AIHW analysis of the 2004–05 NATSIHS and 2004 NHS.
2.2 Impact of psychological distress A number of questions were included in the survey to assess the impact of psychological distress. The first question was asked of everyone and related to the frequency of feelings of psychological distress (or lack thereof) in the previous 4-week period, compared with what was usual for them.
Three questions were asked of the 81% of respondents (representing 207,400 Indigenous adults) who reported some level psychological distress (that is, their K-5 score was 6 or above). These respondents answered ‘all of the time’, ‘most of the time’, ‘some of the time’ and/or ‘a little of the time’ to one or more of the five questions used to measure psychological distress. The three questions asked of these respondents were: • if there were any days when they were totally unable to work or carry out their normal
activities because of these feelings and, if so, how many days • if they had seen a doctor or health professional because of their feelings and, if so, how
often • how often physical health problems were the main cause of these feelings.
Frequency of distress The majority of Indigenous respondents indicated that their distress levels over the 4 weeks before the interview had been the same as usual (72%), while 16% indicated they had occurred more often than usual, and 11% said they had occurred less often than usual. Indigenous females (18%) were more likely than Indigenous males (13%) to say these feelings had occurred more often than usual. While there were no significant differences by age group in relation to those who said their feelings had occurred more often than usual, there were some significant differences by remoteness area (Table 2.5). In particular, Indigenous people living in major cities were more likely to report experiencing feelings of distress ‘more often than usual’ than those living in Remote or Very Remote areas of Australia (19% compared with 11%).

14
Table 2.5: Frequency of feelings of psychological distress by remoteness, Indigenous persons aged 18 years and over, 2004–05 (per cent)
Major Cities Inner
Regional Outer
Regional Remote or
Very Remote Australia
How often feelings occurred
More often than usual 19.2 15.8 16.1 10.7 15.5
About the same as usual 68.9 73.7 68.9 76.2 71.9
Less often than usual 10.6 10.1 13.1 9.1 10.6
Total(a) 100.0 100.0 100.0 100.0 100.0
Total no. of Indigenous people(a) 78,700 51,400 55,400 72,800 258,300
(a) Includes missing responses.
Source: AIHW analysis of the 2004–05 NATSIHS.
Impact on usual activities Of the estimated 207,400 Indigenous adults who had a psychological distress score in the range 6–25, 21% reported that in the past 4 weeks there had been one or more days in which they had been unable to work or carry out normal activities due to their feelings of distress (Table 2.6). The average number of days lost due to these feelings was 7.
A higher proportion of females than males indicated that they had one or more days on which they were unable to work or carry out normal activities due to their feelings of distress (24% compared with 18%, respectively). Those adults aged 18 to 24 years were least likely to have indicated having lost 1 or more days of their usual activities due to psychological distress (16%) while those aged 55 years and over (27%) were most likely to have done so.
There were significant differences in the average number of days lost across remoteness areas, with those who lived in Remote or Very Remote areas reporting an average of 6 days on which they were unable to work or carry out normal activities, compared with 7 days for those in Major Cities and 8 days for those in Inner Regional areas.

15
Table 2.6: Number of days unable to work or carry out normal activities due to feelings of psychological distress, by selected characteristics, Indigenous persons aged 18 years and over, 2004–05
Number of days in the last 4 weeks
0 days 1 day or more Total(a)(b)
Per cent Per centAverage number of
days(c) Per cent
Sex
Male 82.0 17.5 6.8 100.0
Female 75.6 24.2 6.4 100.0
Age
18–24 years 84.2 15.7 5.8 100.0
25–34 years 77.5 22.1 6.2 100.0
35–44 years 77.1 22.2 6.6 100.0
45–54 years 77.4 22.4 8.1 100.0
55 years and over 72.8 26.8 6.3 100.0
Remoteness
Major Cities 79.6 20.0 6.6 100.0
Inner Regional 81.8 17.8 7.6 100.0
Outer Regional 79.5 20.4 7.0 100.0
Remote or Very Remote 73.2 26.3 5.5 100.0
Total 78.4 21.2 6.5 100.0
Total number of Indigenous people(a) 162,600 44,000 . .
207,400
. . Not applicable
(a) Analysis excludes those who had a K-5 score of 5 (18%) and those with a missing K-5 score (1.6%).
(b) Includes missing responses on variable ‘number of days unable to work/carry out normal activity’.
(c) Averages are based on respondents who reported having at least 1 day off.
Source: AIHW analysis of the 2004–05 NATSIHS.
Impact on visits to health professional While the majority (88%) of those who reported a psychological distress score in the range 6–25 did not see a doctor or other health professional about their feelings of distress in the 4-week period, an estimated 24,600 Indigenous adults (12%) did (Table 2.7). This means that almost one in 10 Indigenous Australians visited a doctor or other health professional in relation to their feelings of distress in the 4-week period. Those that did seek help saw a health professional, on average, 2 times during the 4 weeks prior to interview. Indigenous women were more likely than Indigenous men to have visited a health professional about their distress (14% compared with 9%, respectively). Furthermore, those aged 45–54 years were significantly more likely to have seen a health professional about their distress than those aged 18–24 years (15% and 8%, respectively). Among those who reported one or more visits, the average number of visits did not differ significantly by age, sex or remoteness area.

16
Table 2.7: Whether saw a health professional because of feelings of psychological distress, by selected characteristics, Indigenous persons aged 18 years and over, 2004–05
Whether saw a health professional in the last 4 weeks
No Yes Total(a)(b)
Per cent Per centAverage no. of
visits(c) Per cent
Sex
Male 90.9 8.5 2.2 100.0
Female 85.3 14.4 1.9 100.0
Age
18–24 years 92.4 7.6 2.0 100.0
25–34 years 87.4 12.2 2.1 100.0
35–44 years 85.8 13.2 2.1 100.0
45–54 years 85.4 14.5 1.7 100.0
55 years and over 86.2 13.4 2.0 100.0
Remoteness
Major Cities 88.1 11.3 2.1 100.0
Inner Regional 86.4 13.2 2.3 100.0
Outer Regional 89.8 10.2 1.9 100.0
Remote or Very Remote 86.6 12.9 1.7 100.0
Total 87.7 11.8 2.0 100.0
Total no. of Indigenous people(a) 181,900 24,600 . . 207,400
. . Not applicable
(a) Analysis excludes those who had a K-5 score of 5 (18%) and those with a missing K-5 score (1.6%).
(b) Includes missing responses on variable ‘whether saw a health professional because of feelings of psychological distress’.
(c) Averages are based on respondents who reported at least 1 visit.
Source: AIHW analysis of the 2004–05 NATSIHS.
Relationship between physical and mental health Of those who had a K-5 score in the range 6–25, 15% said that physical health problems were the main cause of their feelings all or most of the time (Appendix tables D7–D9).
While there was no significant difference by sex, there was a clear association with age—in older age groups, physical health problems were more likely to be reported as the main cause of feelings of distress all or most of the time (Figure 2.1). Indigenous Australians who lived in Major Cities (18%) were more likely than those who lived in Remote or Very Remote areas (11%) to indicate that physical health problems were the main cause of their feelings of distress all or most of the time (Appendix Table D9).

17
Notes
1. Includes missing responses.
2. Analysis excludes those who had a K-5 score of 5 (18%) and those with a missing K-5 score (1.6%).
Source: AIHW analysis of 2004–05 NATSIHS.
Figure 2.1: How often physical health problems were the main cause of feelings of psychological distress, by age, Indigenous persons aged 18 years and over, 2004–05
2.3 Positive wellbeing The positive wellbeing domain comprised the following four questions: ‘In the last four weeks, about how often: Did you feel calm and peaceful? Have you been a happy person? Did you feel full of life? Did you have a lot of energy? (ABS 2006c). The response options were the same five that were used for the K-5 questions.
More than half of the representative adult Indigenous population reported being happy (71%), calm and peaceful (56%) and/or full of life (55%) all or most of the time in the 4 weeks before the interview, while nearly half (47%) said they had a lot of energy all or most of the time (Appendix tables D10–D12).
Only a small proportion of Indigenous adults (between 2% and 7%) reported ‘none of the time’ to the questions on positive wellbeing (Table 2.8).
712 14
2428
9 10 13 13 14
8276
7063
55
0
20
40
60
80
100
18–24 25–34 35–44 45– 54 55+
Age (years)
Per cent All/most of time Some of the time A little/none
18
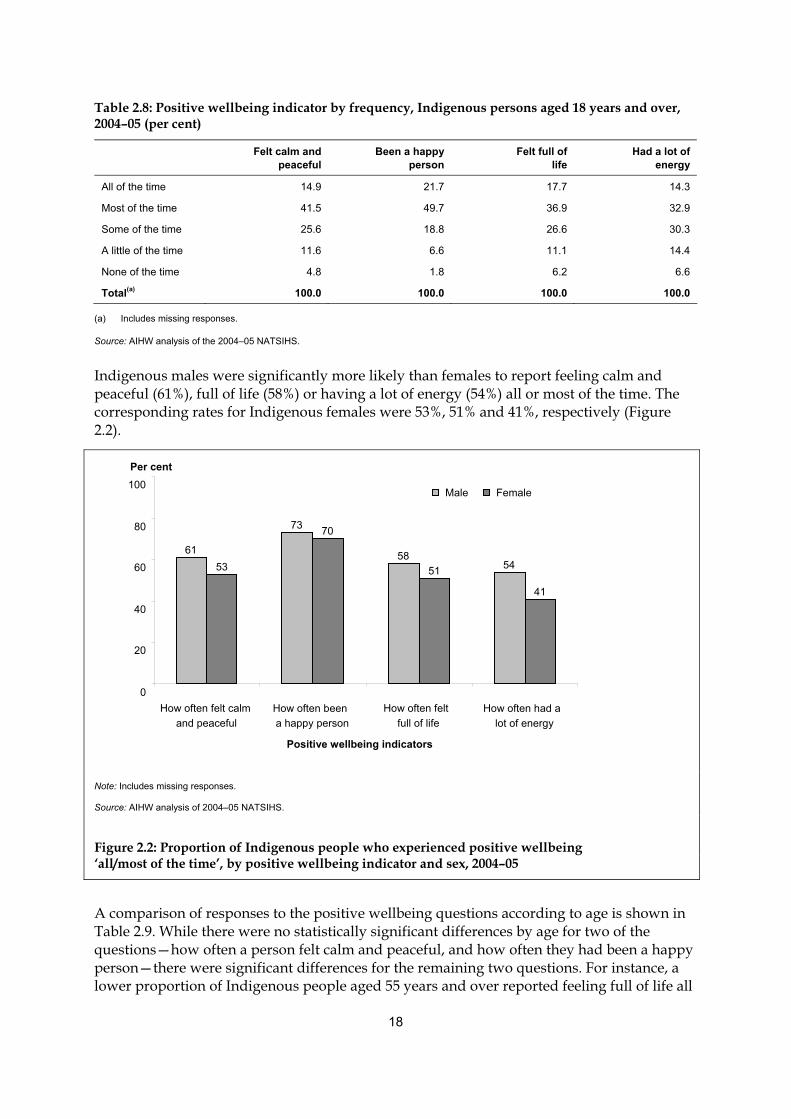
Table 2.8: Positive wellbeing indicator by frequency, Indigenous persons aged 18 years and over, 2004–05 (per cent)
Felt calm and
peaceful Been a happy
person Felt full of
life Had a lot of
energy
All of the time 14.9 21.7 17.7 14.3
Most of the time 41.5 49.7 36.9 32.9
Some of the time 25.6 18.8 26.6 30.3
A little of the time 11.6 6.6 11.1 14.4
None of the time 4.8 1.8 6.2 6.6
Total(a) 100.0 100.0 100.0 100.0
(a) Includes missing responses.
Source: AIHW analysis of the 2004–05 NATSIHS.
Indigenous males were significantly more likely than females to report feeling calm and peaceful (61%), full of life (58%) or having a lot of energy (54%) all or most of the time. The corresponding rates for Indigenous females were 53%, 51% and 41%, respectively (Figure 2.2).
Note: Includes missing responses.
Source: AIHW analysis of 2004–05 NATSIHS.
Figure 2.2: Proportion of Indigenous people who experienced positive wellbeing ‘all/most of the time’, by positive wellbeing indicator and sex, 2004–05
A comparison of responses to the positive wellbeing questions according to age is shown in Table 2.9. While there were no statistically significant differences by age for two of the questions—how often a person felt calm and peaceful, and how often they had been a happy person—there were significant differences for the remaining two questions. For instance, a lower proportion of Indigenous people aged 55 years and over reported feeling full of life all
61
73
585453
70
51
41
0
20
40
60
80
100
How often felt calmand peaceful
How often been a happy person
How often felt full of life
How often had a lot of energy
Positive wellbeing indicators
Per cent
Male Female

19
or most of the time than did people aged 25–34 years (47% compared with 58%, respectively). Similarly, a lower proportion of those aged 55 years reported that they had a lot of energy all or most of the time than did Indigenous people in the 25–34 years age group (38% compared with 53%, respectively).
Table 2.9: Frequency of positive wellbeing indicators by age, Indigenous persons aged 18 years and over, 2004–05 (per cent)
18–24 years 25–34 years 35–44 years 45–54 years 55 years and over Total
Felt calm and peaceful
All/most of the time 57.6 52.5 57.6 56.1 60.8 56.4
Some of the time 26.7 30.5 22.5 22.8 22.1 25.6
A little/none of the time 14.2 15.9 18.4 19.9 14.1 16.5
Total(a) 100.0 100.0 100.0 100.0 100.0 100.0
Been a happy person
All/most of the time 71.3 72.1 70.9 70.2 72.4 71.4
Some of the time 20.6 19.5 18.5 19.1 14.7 18.8
A little/none of the time 7.0 7.3 9.1 9.8 10.2 8.4
Total(a) 100.0 100.0 100.0 100.0 100.0 100.0
Felt full of life
All/most of the time 55.3 57.7 55.9 52.4 47.0 54.6
Some of the time 29.0 26.0 24.9 26.8 26.5 26.6
A little/none of the time 14.5 15.3 17.6 19.6 23.4 17.3
Total(a) 100.0 100.0 100.0 100.0 100.0 100.0
Had a lot of energy
All/most of the time 49.9 52.8 45.5 43.5 38.0 47.2
Some of the time 31.7 27.4 31.6 29.9 32.1 30.3
A little/none of the time 17.3 18.6 21.3 25.7 26.7 21.1
Total(a) 100.0 100.0 100.0 100.0 100.0 100.0
Total number of Indigenous people(a) 56,700 69,800 59,100 39,600 33,200 258,300
(a) Includes missing responses.
Source: AIHW analysis of 2004–05 NATSIHS.
Those who lived in Remote or Very Remote areas of Australia were more likely than those who lived in any of the remaining areas to say they had a lot of energy and that they felt full of life all or most of the time. For example, 56% of those who lived in Remote or Very Remote areas of Australia said they had a lot of energy all or most of the time, while 43% of those who lived in Major Cities gave this response (Table 2.10).

20
Table 2.10: Frequency of positive wellbeing indicators, by remoteness, Indigenous persons aged 18 years and over, 2004–05 (per cent)
Major Cities Inner Regional Outer Regional
Remote or Very Remote Australia
Felt calm and peaceful
All/most of the time 52.3 57.3 56.4 60.3 56.4
Some of the time 26.4 25.9 25.0 24.9 25.6
Little/none of the time 20.2 16.5 16.6 12.4 16.5
Total(a) 100.0 100.0 100.0 100.0 100.0
Been a happy person
All/most of the time 70.9 68.2 71.0 74.5 71.4
Some of the time 18.7 22.9 17.3 17.3 18.8
Little/none of the time 9.5 8.5 9.9 6.1 8.4
Total(a) 100.0 100.0 100.0 100.0 100.0
Felt full of life
All/most of the time 52.1 50.3 52.4 62.0 54.6
Some of the time 26.4 30.4 27.5 23.4 26.6
Little/none of the time 20.5 19.0 18.3 12.0 17.3
Total(a) 100.0 100.0 100.0 100.0 100.0
Had a lot of energy
All/most of the time 42.5 44.7 45.0 55.5 47.2
Some of the time 32.6 29.5 31.0 27.9 30.3
Little/none of the time 23.9 25.4 22.1 14.1 21.1
Total(a) 100.0 100.0 100.0 100.0 100.0
Total number of Indigenous people(a) 78,700 51,400 55,400 72,800 258,300
(a) Includes missing responses.
Source: AIHW analysis of 2004–05 NATSIHS.
Across the states and territories, the highest proportions of respondents reporting ‘all or most of the time’ to the questions on positive wellbeing were, consistently, in Queensland and Western Australia, both of which have relatively large Indigenous populations. For example, 74% of respondents in Queensland said they had been a happy person all or most of the time, and 72% of those in Western Australia also gave this response. On the other hand, the lowest proportions reporting ‘all or most of the time’ to the questions on positive wellbeing were, consistently, in Tasmania, the Australian Capital Territory and Victoria. These three jurisdictions also have the smallest Indigenous populations.
2.4 Anger The anger questions included in the 2004–05 NATSIHS were designed to examine manifestations of anger, rather than providing a discrete measure of levels of anger. The five anger items that were included in the survey asked respondents to indicate how often, in the previous 4 weeks, they had been bothered or upset by any the following: feeling easily

21
annoyed or irritated; having violent thoughts like wanting to beat, injure or harm someone; wanting to break or smash things; getting into a lot of arguments; and shouting or throwing things. The response options for these questions were: a lot; some; and not at all (ABS 2006c).
Feeling easily annoyed or irritated is considered to be a less intense measure of anger than the other measures. Thus, a relatively larger percentage of respondents (16%) answered ‘a lot’ to this item (Table 2.11). In comparison, 6% said they got into arguments a lot of the time, 4% said that they had violent thoughts and/or shouted or threw things a lot of the time, and 3% said they wanted to break or smash things a lot of the time.
With the exception of the question on how often respondents felt easily annoyed or irritated, Indigenous people aged 55 years and over were significantly less likely than those in most of the other age groups to respond ‘a lot’ to the anger items. As well, for each of the five anger items, a higher proportion of people in this age group indicated that they had not experienced the various anger manifestations at all in the previous 4 weeks.
Table 2.11: Frequency of anger manifestation by age, Indigenous persons aged 18 years and over, 2004–05 (per cent)
18–24 years
25–34 years
35–44 years
45–54 years
55 years and over Total
Felt easily annoyed or irritated
A lot 14.8 16.8 17.8 15.7 12.1 15.8
Some 53.3 55.8 57.0 56.3 47.2 54.5
Not at all 30.9 26.2 23.5 27.0 37.6 28.2
Total(a) 100.0 100.0 100.0 100.0 100.0 100.0
Had violent thoughts
A lot 5.1 5.2 4.3 *3.4 *2.0 4.3
Some 21.8 19.7 18.5 20.1 9.8 18.7
Not at all 72.0 73.7 75.7 75.4 85.4 75.6
Total(a) 100.0 100.0 100.0 100.0 100.0 100.0
Wanted to break or smash things
A lot 4.7 4.4 3.4 *1.9 *1.2 3.4
Some 20.4 18.9 14.7 14.7 7.9 16.2
Not at all 73.8 75.4 80.4 82.5 88.0 78.9
Total(a) 100.0 100.0 100.0 100.0 100.0 100.0
Had a lot of arguments
A lot 7.2 6.4 6.0 4.6 *1.6 5.6
Some 34.7 30.7 31.2 27.9 15.2 29.3
Not at all 56.8 61.8 61.2 66.6 80.3 63.7
Total(a) 100.0 100.0 100.0 100.0 100.0 100.0
(continued)

22
Table 2.11 (continued): Frequency of anger manifestation by age, Indigenous persons aged 18 years and over, 2004–05 (per cent)
18–24 years
25–34 years
35–44 years
45–54 years
55 years and over Total
Shouting or throwing things
A lot 4.4 5.1 4.6 4.1 *1.4 4.2
Some 24.4 25.4 25.3 19.4 9.5 22.2
Not at all 69.8 68.3 68.6 75.6 86.3 72.1
Total(a) 100.0 100.0 100.0 100.0 100.0 100.0
Total no. of Indigenous people(a) 56,700 69,800 59,100 39,600 33,200 258,300
* Estimate has a relative standard error between 25% and 50% and should be used with caution.
(a) Includes missing responses.
Source: AIHW analysis of the 2004–05 NATSIHS.
A larger proportion of Indigenous women than Indigenous men reported that they felt easily annoyed or irritated a lot of the time (18% compared to 13%, respectively) and/or that they got into arguments a lot in the previous 4 weeks (7% compared to 4%, respectively) (Appendix Table D13). There were no statistically significantly differences between Indigenous men and women for the other two anger measures.
When responses were compared by remoteness area, no consistent pattern was observed across the five questions (Appendix Table D15), but some significant differences were observed for specific questions. For instance, in relation to how often they felt easily annoyed or irritated, a higher proportion of those living in Remote or Very Remote areas reported ‘not at all’ in the previous 4 weeks than those living in Major Cities (35% compared with 26%). On the other hand, a lower proportion of respondents living in Remote or Very Remote areas reported that they had not had violent thoughts when compared with those living in Major Cities (70% compared to 79%). Similarly, respondents in Remote or Very Remote areas were also less likely than those in Major Cities to report that they did not shout or throw things at all in the previous 4 weeks (67% and 76%, respectively).
2.5 Life stressors
Type of stressors Respondents were asked to indicate which (if any) of 15 stressors they, their family and/or friends had experienced during the 12 months prior to interview (ABS 2006c). Four in 10 (42%) respondents indicated that they, their family and/or friends had experienced the death of a family member or close friend in the previous year, while 28% indicated serious illness or disability, 20% reported alcohol-related problems and 19% indicated that a family member was sent to, or currently in, jail (Table 2.12). Overall, 22% of respondents did not report any of the specified stressors.
The types of stressors reported by respondents differed significantly according to remoteness area. For example, those Indigenous adults who lived in Remote or Very Remote areas were significantly more likely than other Indigenous adults to say that they, their family and/or

23
friends had been a witness to violence; experienced overcrowding at home; had a member of family sent to jail/currently in jail; and/or had a gambling problem (Appendix Table D18).
Table 2.12: Type of life stressor experienced, by remoteness, Indigenous persons aged 18 years and over, 2004–05 (per cent)
Major Cities
Inner Regional
Outer Regional
Remote or Very Remote Australia
Type of stressor
Serious illness or disability 30.0 28.4 25.8 28.7 28.4
Serious accident 9.9 7.5 6.8 12.1 9.4
Death of a family member or close friend 41.8 39.2 40.5 45.6 42.1
Divorce or separation 12.4 14.2 11.2 7.3 11.1
Not able to get a job 20.2 15.8 16.4 14.6 16.9
Involuntary loss of job 12.4 7.6 5.0 3.7 7.4
Alcohol-related problems 20.9 15.3 18.1 24.1 20.1
Drug-related problems 19.2 14.5 15.9 15.2 16.4
Witness to violence 11.2 10.8 9.5 23.5 14.2
Abuse or violent crime 11.3 10.1 10.1 13.2 11.4
Trouble with the police 15.6 12.9 17.1 19.0 16.3
Gambling problem 12.6 8.8 11.4 19.4 13.5
Member of family sent to jail/currently in jail 17.2 13.6 17.7 24.7 18.7
Overcrowding at home 11.3 8.9 16.1 29.2 16.9
Discrimination/racism 11.7 11.0 10.4 13.1 11.6
Total who experienced at least one of these stressors 77.2 76.7 75.1 78.0 76.9
None of the above 22.5 22.6 23.8 20.9 22.4
Total(a)(b) 100.0 100.0 100.0 100.0 100.0
Total no. of Indigenous people(b) 78,700 51,400 55,400 72,800 258,300
(a) Multiple response item—total exceeds 100.0%.
(b) Includes missing responses.
Source: AIHW analysis of the 2004–05 NATSIHS.
In addition to the list of stressors shown in Table 2.12, respondents who lived in non-remote areas of Australia were asked whether two additional issues had been a problem for them, their family and/or friends in the past year: mental illness, and pressure to fulfil cultural responsibilities. Of those living in non-remote areas, 15% reported mental illness and 6% reported pressure to fulfil cultural responsibilities.
The types of stressors reported did not differ significantly by sex (Appendix Table D16), but there were a number of significant differences according to age (Appendix Table D17). For example, those aged 35–44 years were more likely than those aged 18–24 years to report that they, their family and/or friends had experienced the death of a family member or close friend (45% and 37%, respectively). As well, those aged 18–24 years (15%) were less likely than those aged 25–34 years (23%) and 35–44 years (22%) to report that they, their family and/or friends had experienced an alcohol-related problem.
24
Across the states and territories, Western Australia had the highest proportion of respondents who reported that they, their family and/or friends had experienced the death of a family member or close friend in the previous year (51%). The highest proportion of respondents who reported alcohol-related problems was in the Australian Capital Territory (27%), while 28% of respondents in the Northern Territory reported that a family member was sent to, or currently in, jail.
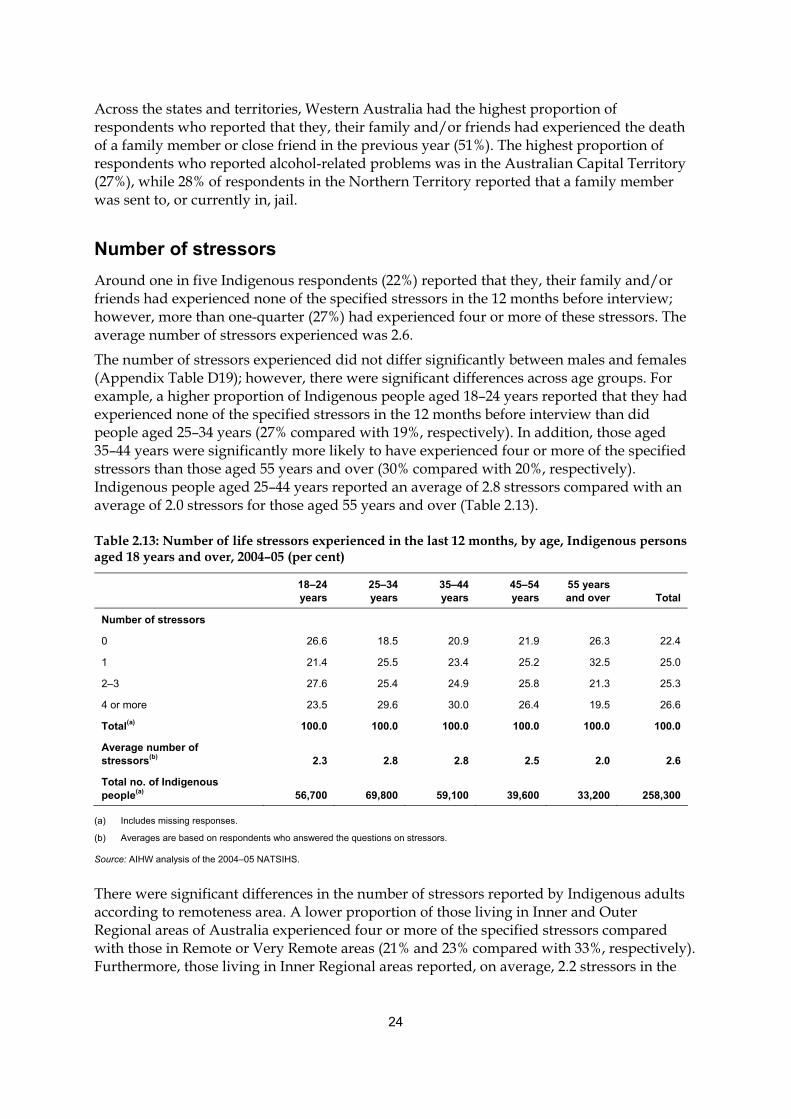
Number of stressors Around one in five Indigenous respondents (22%) reported that they, their family and/or friends had experienced none of the specified stressors in the 12 months before interview; however, more than one-quarter (27%) had experienced four or more of these stressors. The average number of stressors experienced was 2.6.
The number of stressors experienced did not differ significantly between males and females (Appendix Table D19); however, there were significant differences across age groups. For example, a higher proportion of Indigenous people aged 18–24 years reported that they had experienced none of the specified stressors in the 12 months before interview than did people aged 25–34 years (27% compared with 19%, respectively). In addition, those aged 35–44 years were significantly more likely to have experienced four or more of the specified stressors than those aged 55 years and over (30% compared with 20%, respectively). Indigenous people aged 25–44 years reported an average of 2.8 stressors compared with an average of 2.0 stressors for those aged 55 years and over (Table 2.13).
Table 2.13: Number of life stressors experienced in the last 12 months, by age, Indigenous persons aged 18 years and over, 2004–05 (per cent)
18–24 years
25–34 years
35–44 years
45–54 years
55 years and over Total
Number of stressors
0 26.6 18.5 20.9 21.9 26.3 22.4
1 21.4 25.5 23.4 25.2 32.5 25.0
2–3 27.6 25.4 24.9 25.8 21.3 25.3
4 or more 23.5 29.6 30.0 26.4 19.5 26.6
Total(a) 100.0 100.0 100.0 100.0 100.0 100.0
Average number of stressors(b) 2.3 2.8 2.8 2.5 2.0 2.6
Total no. of Indigenous people(a) 56,700 69,800 59,100 39,600 33,200 258,300
(a) Includes missing responses.
(b) Averages are based on respondents who answered the questions on stressors.
Source: AIHW analysis of the 2004–05 NATSIHS.
There were significant differences in the number of stressors reported by Indigenous adults according to remoteness area. A lower proportion of those living in Inner and Outer Regional areas of Australia experienced four or more of the specified stressors compared with those in Remote or Very Remote areas (21% and 23% compared with 33%, respectively). Furthermore, those living in Inner Regional areas reported, on average, 2.2 stressors in the

25
previous 12 months, whereas those living in Remote or Very Remote areas reported an average of 3.0 (Table 2.14).
Table 2.14: Number of life stressors experienced in the last 12 months, by remoteness, Indigenous persons aged 18 years and over, 2004–05 (per cent)
Major cities Inner
Regional Outer
Regional Remote or
Very Remote Australia
Number of stressors
0 22.5 22.6 23.8 20.9 22.4
1 24.9 31.3 26.1 19.8 25.0
2–3 25.4 24.5 25.8 25.4 25.3
4 or more 26.9 20.9 23.2 32.8 26.6
Total(a) 100.0 100.0 100.0 100.0 100.0
Average number of stressors(b) 2.6 2.2 2.3 3.0 2.6
Total no. of Indigenous people(a) 78,700 51,400 55,400 72,800 258,300
(a) Includes missing responses.
(b) Averages are based on respondents who answered the questions on stressors.
Source: AIHW analysis of the 2004–05 NATSIHS.
2.6 Discrimination A set of four questions were included in the 2004–05 NATSIHS to ascertain whether respondents felt that in the previous 12 months they were treated the same as non-Indigenous people when seeking health care and whether they had been treated badly in any situation because of their Indigenous origin. Those who replied ‘yes’ to the latter of the two questions were then asked how they felt when discriminated against (with options such as ‘feel angry’, ‘feel sad’ and ‘feel sick’), and also what they usually did when treated badly (for example ‘try to avoid person or situation’, ‘keep it to yourself’) (ABS 2006c).
Treatment when seeking health care When asked if they felt they had been treated the same, worse than or better than non-Indigenous people when they sought health care in the previous year, an estimated 19,400 Indigenous adults (8%) either indicated that they did not know the answer or refused to answer. Due to this relatively high rate of non-response, these records have been excluded when calculating other proportions in this section.
The majority (83%) of Indigenous adults indicated that they had been treated the same as non-Indigenous people when they had sought health care in the previous 12 months, while 5% said they had been treated better than non-Indigenous people, and 4% said worse (Table 2.15). In addition, 6% of respondents indicated that they had not sought health care in the relevant time period and 2% had only encountered Indigenous people when they sought health care (for output purposes, these categories have been combined and are labelled ‘other’ in the table below).
The proportion of respondents who felt they received better or worse treatment than non-Indigenous respondents did not differ according to sex (Appendix Table D22), although

26
there were significant differences between age groups. In particular, those aged 55 years and over (90%) were more likely than those aged 35–44 years (82%) and 45–54 years (81%) to say they felt they were treated the same as non-Indigenous people (Appendix Table D23). In addition, Indigenous respondents in Remote or Very Remote areas were significantly more likely than those in Major Cities or regional areas to report that they received better treatment than non-Indigenous people (Table 2.15).
Table 2.15: Perceived treatment when seeking health care compared with non-Indigenous people, by remoteness, Indigenous persons aged 18 years and over, 2004–05 (per cent)
Major Cities Inner
Regional Outer
Regional Remote or
Very Remote Australia
Worse 3.5 *2.9 3.7 5.5 4.0
Same 85.7 83.2 86.8 77.1 83.0
Better 2.9 4.2 2.1 11.4 5.4
Other(a) 7.8 9.6 7.4 6.0 7.6
Total(b) 100.0 100.0 100.0 100.0 100.0
Total no. of Indigenous people(b) 71,600 47,600 52,700 67,000 238,900
* Estimate has a relative standard error between 25% and 50% and should be used with caution.
(a) Includes those who did not seek health care in the last 12 months and those who only encountered Indigenous health professionals.
(b) Excludes those who did not know the answer or refused to answer (8%).
Source: AIHW analysis of the 2004–05 NATSIHS.
Treatment in general The majority (84%) of Aboriginal and Torres Strait Islander adults said that they had not been treated badly in the previous 12 months because of their Indigenous origin; while an estimated 40,400 (16%) said they had been (Table 2.16). Less than 1% of respondents did not provide a response to this question. Responses to this question did not differ according to sex, age or remoteness area (Appendix tables D22–D24).
Table 2.16: Whether treated badly because of Indigenous origin, by remoteness, Indigenous persons aged 18 years and over, 2004–05 (per cent)
Major Cities Inner
Regional Outer
Regional Remote or
Very Remote Australia
Yes 15.4 13.5 17.4 16.0 15.6
No 84.1 85.9 81.9 83.1 83.7
Total(a) 100.0 100.0 100.0 100.0 100.0
Total no. of Indigenous people(a) 78,700 51,400 55,400 72,800 258,300
(a) Includes missing responses (less than 1%).
Source: AIHW analysis of the 2004–05 NATSIHS.
The estimated 40,400 Indigenous adults who felt they had been treated badly because of their Indigenous status were asked two additional questions about how they felt and the actions they took when this occurred. Respondents could indicate one or more feelings and actions when answering these questions. Of those Aboriginal and Torres Strait Islander peoples who

27
felt they had been treated badly in the previous year because of their Indigenous status, 67% said they mainly felt angry when this occurred, 31% said they felt sorry for the person who treated them this way, 28% said they felt sad and 17% said they felt ashamed or worried about it.
The most common actions taken by Indigenous people who felt they had been discriminated against were to talk to family or friends about it (38%), avoid the person or situation (33%), try to do something about the people who did it (30%) and/or just forget about it (28%).
2.7 Cultural identification The cultural identification domain of the 2004–05 NATSIHS consists of four questions that identify the level of attachment Indigenous people have with their tribal or language group and traditional country. These items, which were asked only of those living in non-remote areas, asked respondents if they identify with a tribal group, a language group or clan and if they recognise an area as their homelands or traditional country. Those who replied ‘yes’ to the latter of the questions were then asked if they currently live there and, if not, whether they are allowed to visit there. The response option for each of these questions was either yes or no (ABS 2006c).
Nearly half of Indigenous adults in non-remote areas (46%) said they identified with a tribal group, language group or clan. Responses to this question did not differ significantly by age, sex or by whether they lived in a Major City, Inner Regional or Outer Regional area (Appendix tables D25–D27).
Table 2.17: Whether recognises an area as homelands or traditional country, by remoteness(a), Indigenous persons aged 18 years and over in non-remote areas, 2004–05 (per cent)
Major Cities
Inner Regional
Outer Regional Total
Recognises area as homelands or traditional country 61.4 56.4 61.7 60.1
Recognises area and currently lives there 7.0 22.3 19.8 15.0
Recognises area, does not currently live there but allowed to visit 52.7 32.6 40.8 43.6
Recognises area, does not currently live there and not allowed to visit *0.8 **0.2 *0.5 *0.6
Doesn’t recognise area as homelands or traditional country 38.2 43.1 32.9 38.0
Total(b) 100.0 100.0 100.0 100.0
Total no. of Indigenous people(a) (b) 78,700 51,400 55,400 185,500
* Estimate has a relative standard error between 25% and 50% and should be used with caution.
** Estimate has a relative standard error of more than 50% and should be used with caution.
(a) Question asked of non-remote respondents only.
(b) Includes missing responses.
Source: AIHW analysis of the 2004–05 NATSIHS.
Six out of 10 Indigenous adults in non-remote areas (60%) said that they recognised a specific area as their homelands or traditional country (Table 2.17). Of those individuals who did recognise their homelands, the majority (73%) did not live on their homelands but were allowed to visit. Responses did not differ significantly by sex (Appendix Table D25), but there was a significant difference between some of the remoteness areas—a higher

28
proportion of those who lived in Inner Regional areas than those who lived in Outer Regional areas said they did not recognise an area as their homelands or traditional country (43% compared with 33%) (Table 2.17).
Whether or not Indigenous Australians recognised their homelands differed significantly between some of the age groups (Figure 2.3). In particular, a higher proportion of Indigenous people aged 18–24 years (47%) than those aged 35–44 years (36%) and those aged 45–54 years (31%) said that they did not recognise an area as their homelands or traditional country.
52
61 6267
63
47
37 3631
35
0
20
40
60
80
18–24 25–34 35–44 45– 54 55+
Age (years)
Per cent
Recogniseshomelands
Does not recognisehomelands
Notes 1. Includes missing responses.
2. Question asked of non-remote respondents only.
Source: AIHW analysis of 2004–05 NATSIHS.
Figure 2.3: Whether recognises an area as homelands or traditional country, by age, Indigenous persons aged 18 years and over in non-remote areas, 2004–05
2.8 Removal from natural family Three questions were included in the 2004–05 NATSIHS that dealt with the removal of Aboriginal and Torres Strait Islander people from their natural families. Respondents were asked if they themselves had been taken away from their natural family by a mission, the government or welfare, and if any of their relatives had been taken away from their natural family. Those who replied ‘yes’ to the latter of the questions were asked to indicate which of their relatives had been removed (ABS 2006c).
Overall, an estimated 18,000 Indigenous adults (7%) indicated that they had been removed from their natural family. While the proportion of Indigenous Australians removed from their families did not differ significantly by sex, there were significant differences by age, with a higher proportion of respondents aged 45–54 years and 55 years and over (both 11%) reporting having been removed from their natural family than those aged 18–24 years (4%) and 25–34 years (5%) (Appendix tables D28 and D30). A significantly higher proportion of

29
Indigenous respondents who lived in Major Cities (10%) than those in Inner and Outer Regional areas (both 6%) or in Remote or Very Remote areas (5%) reported having been removed from their natural family (Appendix Table D32).
When asked whether any of their relatives were taken from their natural family by a mission, the government or welfare, an estimated 35,900 Indigenous adults (14%) either indicated they did not know or did not want to answer. Those respondents were excluded from the analyses of these data. Of the estimated 92,300 Indigenous adults (43%) who had one or more relatives removed from their natural family, the relative(s) removed were most commonly a grandparent (44%), parent (28%) and/or aunt or uncle (27%). Those who lived in Remote or Very Remote areas (29%) were significantly less likely than those in Major Cities or regional areas to indicate that a relative had been removed (Table 2.18). There were no significant differences by sex or age in the responses to this question (Appendix tables D29 and D31).
Table 2.18: Whether relatives had been removed from their natural family, by remoteness, Indigenous persons aged 18 years and over, 2004–05 (per cent)
Major Cities Inner
Regional Outer
Regional Remote or
Very Remote Australia
Relative removed 52.4 42.6 48.1 29.4 42.6
Relative not removed 47.6 57.4 51.9 70.6 57.4
Total(a) 100.0 100.0 100.0 100.0 100.0
Total no. of Indigenous people(a) 63,600 42,200 44,800 65,800 216,400
(a) Excludes those who did not know the answer or refused to answer (13.8%).
Source: AIHW analysis of the 2004–05 NATSIHS.
South Australia and Western Australia had the highest proportions of respondents who reported that they had been removed from their natural family (13% and 12%, respectively).

30
3 Internal validation of the interim social and emotional wellbeing module
The interim social and emotional wellbeing module was developed over a short time period and was first used in the 2004–05 NATSIHS, as outlined in Chapter 1. The validity of the interim module, that is, whether it measures the concept it was designed to measure, therefore needed to be verified. This chapter reports on the outcomes of the internal validation process that was undertaken by the AIHW, that is, whether the results of various domains of the interim module were consistent with each other and consistent with other measures used in the 2004–05 NATSIHS.
This type of validation of social and emotional wellbeing measures has been done in a number of other studies (for example Andrews & Slade 2001; Saunders & Daly 2001). The internal validation process involved comparing the results from the eight domains in the module with each other, and with five other relevant variables in the survey in order to determine if the expected relationships were observed. The expected results were based on logic (for example those with higher levels of psychological distress would be expected to have a lower level of positive wellbeing), and findings from other research. The five other variables that were used in the internal validation process were self-assessed health status, long-term health conditions, excessive alcohol consumption, financial stress and labour force status.
The outcomes of the internal validation are presented in two sections, with Section 3.1 reporting in detail on the analyses carried out to validate the psychological distress domain against the other domains, and proceeding to a summary of the outcomes of the validation across all domains. Similarly, Section 3.2 first reports on the validation analyses of the psychological distress domain against the five other NATSIHS variables, and then presents a summary of the outcomes of the validation of four of the domains against those five variables. Detailed analysis results can be found in Appendix E in table format (Tables E1 to E215), which is available on the AIHW website.
Some of the domains included questions that provided additional descriptive information on a person’s mental health and social and emotional wellbeing, but did not assess the level of their wellbeing. For instance, the ‘impact of psychological distress’ domain includes a question on how often physical health problems were the main cause of the respondent’s psychological distress. While responses to this question provide descriptive information on the perceived cause of the distress, they do not provide information on the person’s level of social and emotional wellbeing. These questions were not considered in the validation analyses presented in this chapter.
The level of missing data, due to respondents not being willing to provide an answer or not knowing the answer for individual items, is also noted in this chapter as a way of evaluating the validity of the domains in the social and emotional wellbeing module. While the reason for the missing data could suggest a variety of issues (including conceptual issues, lack of clarity of question wording and perceived sensitivity to the topic), the validity of the domain could be called into question if high levels of missing data were observed.

31
3.1 Validating the domains against each other Section 3.1 describes the first part of the internal validation process—a comparison of the results from the eight social and emotional wellbeing domains with each other. While the validation was mostly based on data related to the entire survey population, that is, the remote and non-remote population, the analyses of the cultural identity domain against other domains, and vice versa, were based on limited geographic coverage—non-remote only. This is because in the 2004-05 NATSIHS the cultural identity questions were only asked of respondents living in non-remote areas and, to ensure comparability, the validation of this domain against other domains was based on the non-remote population.
Validating the psychological distress domain (K-5) against other domains: detailed description This section describes, in detail, the validation of the psychological distress domain against other domains. Five questions from the Kessler–10 Psychological Distress Scale were included in the social and emotional wellbeing module. Responses to these questions were converted into a K-5 score ranging from 5 to 25, with higher values indicating higher levels of psychological distress.
While different approaches have been used in Australia to group K-10 scores, the approach used most often for national surveys (including the ABS NHS) and a number of state and territory surveys is to present the data according to four categories (low, moderate, high and very high), with a very high score of psychological distress possibly indicating a need for professional help (ABS 2003). Stewart (2003) also created a 4-category variable when he constructed a K-5 measure (using the appropriate questions from the K-10 scale) using data from the 1997–98 NSW Health Survey.
While a dichotomous grouping of ‘low/moderate’ (scores of 5 to 11.9) and ‘high/very high’ (scores of 12.0 to 25) were used to present the data in Chapter 2, for the purposes of validation a 4-category K-5 variable was created. This included the following categories: low (total score of 5.0–7.9), moderate (8.0–11.9), high (12.0–14.9) and very high (15.0–25.0). Using these cut-offs, the data from the 2004–05 NATSIHS indicate that 39% of Indigenous adults had low levels of psychological distress, 33% had moderate levels, 13% high levels, and 14% very high levels. It should be noted that respondents who reported ‘none of the time’ to all the K-5 questions will have attained a score of five and are therefore included in the ‘low psychological distress’ category.
Questions on the impact of psychological distress were asked of anyone who had a K-5 score of 6 or above. For respondents with low levels of psychological distress (for example K-5 score = 6), however, this can be very confusing. It may be useful to consider changing the cut-off for asking impact questions to those with at least moderate levels of distress (a K-5 score of 8 or above). The reason for the impact questions would then be clearer to respondents. This approach is supported by the experience with the NSW Health Survey—it does not ask the impact questions of anyone who scores 15 or less on the K-10, since people scoring so low were puzzled at being asked the questions at all, and in some cases did not respond to impact questions (Stewart 2003).
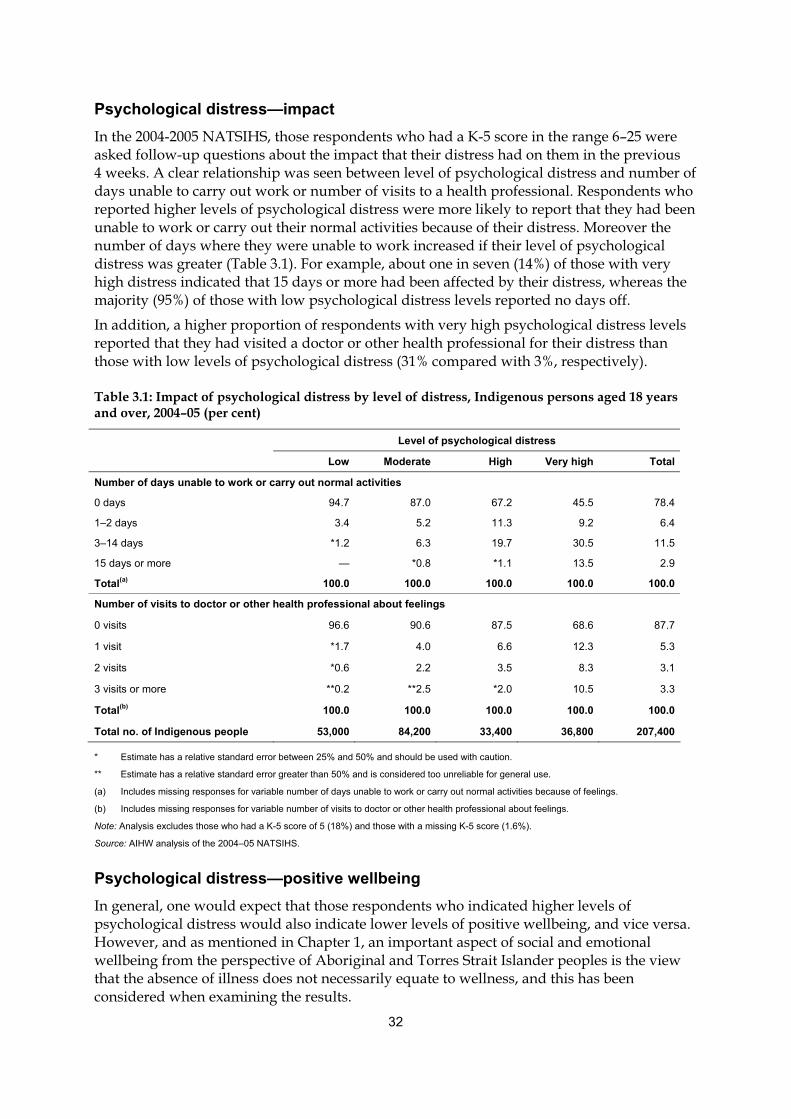
32
Psychological distress—impact In the 2004-2005 NATSIHS, those respondents who had a K-5 score in the range 6–25 were asked follow-up questions about the impact that their distress had on them in the previous 4 weeks. A clear relationship was seen between level of psychological distress and number of days unable to carry out work or number of visits to a health professional. Respondents who reported higher levels of psychological distress were more likely to report that they had been unable to work or carry out their normal activities because of their distress. Moreover the number of days where they were unable to work increased if their level of psychological distress was greater (Table 3.1). For example, about one in seven (14%) of those with very high distress indicated that 15 days or more had been affected by their distress, whereas the majority (95%) of those with low psychological distress levels reported no days off.
In addition, a higher proportion of respondents with very high psychological distress levels reported that they had visited a doctor or other health professional for their distress than those with low levels of psychological distress (31% compared with 3%, respectively).
Table 3.1: Impact of psychological distress by level of distress, Indigenous persons aged 18 years and over, 2004–05 (per cent)
Level of psychological distress
Low Moderate High Very high Total
Number of days unable to work or carry out normal activities
0 days 94.7 87.0 67.2 45.5 78.4
1–2 days 3.4 5.2 11.3 9.2 6.4
3–14 days *1.2 6.3 19.7 30.5 11.5
15 days or more — *0.8 *1.1 13.5 2.9
Total(a) 100.0 100.0 100.0 100.0 100.0
Number of visits to doctor or other health professional about feelings
0 visits 96.6 90.6 87.5 68.6 87.7
1 visit *1.7 4.0 6.6 12.3 5.3
2 visits *0.6 2.2 3.5 8.3 3.1
3 visits or more **0.2 **2.5 *2.0 10.5 3.3
Total(b) 100.0 100.0 100.0 100.0 100.0
Total no. of Indigenous people 53,000 84,200 33,400 36,800 207,400
* Estimate has a relative standard error between 25% and 50% and should be used with caution.
** Estimate has a relative standard error greater than 50% and is considered too unreliable for general use.
(a) Includes missing responses for variable number of days unable to work or carry out normal activities because of feelings.
(b) Includes missing responses for variable number of visits to doctor or other health professional about feelings.
Note: Analysis excludes those who had a K-5 score of 5 (18%) and those with a missing K-5 score (1.6%).
Source: AIHW analysis of the 2004–05 NATSIHS.
Psychological distress—positive wellbeing In general, one would expect that those respondents who indicated higher levels of psychological distress would also indicate lower levels of positive wellbeing, and vice versa. However, and as mentioned in Chapter 1, an important aspect of social and emotional wellbeing from the perspective of Aboriginal and Torres Strait Islander peoples is the view that the absence of illness does not necessarily equate to wellness, and this has been considered when examining the results.

33
In Figure 3.1, the percentage of respondents who reported ‘all’ or ‘most of the time’ to each of the four positive wellbeing questions is shown by level of psychological distress. The data show the expected relationship, that the percentage of Indigenous people who reported feeling each of the positive wellbeing measures ‘all’ or ‘most of the time’ declined as the level of psychological distress increased. Thus, for example, 81% of Indigenous people who had a low level of psychological distress indicated that they felt calm and peaceful ‘all’ or ‘most of the time’ in the previous four weeks, compared with 16% of those who had a very high level of psychological distress.
81
56
35
16
89
77
56
30
75
54
36
21 19
35
45
64
0
20
40
60
80
100
Low Moderate High Very high
Psychological distress
Per centFelt calm and peaceful
Been a happy person
Felt full of life
Had a lot of energy
Note: Includes missing responses for variable positive wellbeing.
Source: AIHW analysis of the 2004–05 NATSIHS.
Figure 3.1: Proportion of Indigenous persons who experienced positive wellbeing indicator ‘all/most of the time’ by level of psychological distress, 2004–05
However, while the expected inverse relationship was observed for each of the positive wellbeing questions, the degree to which positive wellbeing and lack of psychological distress was associated varied for the four items and was not always clear cut. For example, the data indicate that nearly one in three (30%) of those with very high psychological distress levels said they were happy all or most of the time, and more than half (56%) of those with high psychological distress levels said they were happy all or most of the time. Similarly, about one in three of those reporting a high level of psychological distress said they felt calm and peaceful (35%), full of life (36%) and/or had a lot of energy (35%) all or most of the time.
In general, the findings of an inverse association between the psychological distress and positive wellbeing items assist in validating these items. At the same time though, it is clear that for some of the questions, the relationship is not as strong as for others. This could be viewed as lending support to the view that wellbeing is not necessarily equated with lack of psychological distress and thus both wellbeing and distress questions should be included in surveys to gain a more robust picture of the mental health and social and emotional wellbeing of Indigenous Australians.

34
Psychological distress—anger Table 3.2 shows the relationship between psychological distress and each of the five anger questions for those respondents who indicated they had experienced the anger manifestations ‘a lot’. Those persons with very high psychological distress levels were most likely to have indicated being angry ‘a lot’ of the time. For example, almost half (49%) of the people who indicated very high levels of psychological distress also indicated that they felt easily annoyed or irritated ‘a lot’ of the time, compared with 4% of the people who had low levels of psychological distress. Even for those aspects of anger that were not very prevalent in the population, the expected direction of association was observed. For instance, the highest proportion of those most likely to want to break or smash things ‘a lot’ was among those with very high levels of psychological distress (15%).
Table 3.2: Proportion of Indigenous persons who experienced anger manifestation ‘a lot’ by level of psychological distress, 2004–05 (per cent)
Anger manifestation experienced ‘a lot’ Low Moderate High Very high Total(a)
Felt easily annoyed or irritated 4.2 11.1 27.2 48.6 15.8
Had violent thoughts *1.1 2.7 5.4 15.9 4.3
Wanted to break or smash things **0.3 *1.9 4.6 14.5 3.4
Got into a lot of arguments *1.5 2.9 7.9 21.4 5.6
Shouting or throwing things *0.5 2.5 7.1 15.8 4.2
Total no. of Indigenous people(a) 99,900 84,200 33,400 36,800 258,300
* Estimate has a relative standard error between 25% and 50% and should be used with caution.
** Estimate has a relative standard error greater than 50% and is considered too unreliable for general use.
(a) Includes missing responses for variable psychological distress.
Source: AIHW analysis of the 2004–05 NATSIHS.
Psychological distress—number of life stressors In the 2004–05 NATSIHS, respondents were asked whether or not they themselves, their family or friends had experienced each of 15 specific stressors in the previous 12 months. It was expected that those Indigenous Australians who reported higher levels of psychological distress would also report a greater number of stressors. This expectation is supported in research by Saunders and Daly (2001). Using data from the 2000 Western Australia Health and Wellbeing Survey, they found that in the general population, levels of psychological distress (measured using the K-10) were significantly higher for those who had experienced one or more stressful events during the previous 12 months compared with those who had not experienced a stressful event. However, in the Western Australian research, the stressors examined related to those stressors that the respondents had personally experienced; as noted above, this is not the case in the question asked in the 2004–05 NATSIHS.
Table 3.3 shows, for each level of psychological distress, the average number of stressors reported. There is a clear pattern whereby those with high and very high psychological distress levels reported a significantly higher average number of stressors than those with low or moderate psychological distress levels (3.2 and 3.6 compared with 1.9 and 2.6, respectively).

35
Table 3.3: Average number of life stressors experienced in the last 12 months by level of psychological distress, Indigenous persons aged 18 years and over, 2004–05
Psychological distress
Low Moderate High Very high Total(a)
Average stressors (number) 1.9 2.6 3.2 3.6 2.5
Total number of Indigenous people 99,900 84,200 33,400 36,800 258,300
(a) Includes missing responses on psychological distress variable.
Source: AIHW analysis of the 2004–05 NATSIHS.
In addition to examining the average number of stressors, the proportion of respondents in non-remote areas who reported the specific stressor of ‘mental illness’ for each level of psychological distress was also examined. Again a clear pattern was observed, with the likelihood of reporting mental illness as a stressor increasing as the level of psychological distress increased. For example, 7% of respondents with low levels of psychological distress reported mental illness as a stressor, compared with 33% of those with very high psychological distress (Table 3.4).
Table 3.4: Whether reported mental illness as stressor by level of psychological distress, Indigenous persons aged 18 years and over in non-remote areas, 2004–05 (per cent)
Psychological distress
Low Moderate High Very high Total(a)
Reported mental illness as stressor 6.5 14.0 17.9 32.8 14.5
Did not report mental illness as stressor 93.5 86.0 82.1 67.2 85.5
Total(b) 100.0 100.0 100.0 100.0 100.0
Total no. of Indigenous people(b) 68,400 64,500 23,200 28,000 185,500
(a) Includes missing responses for variable psychological distress.
(b) Includes missing responses for variable whether reported mental illness as a stressor.
Note: Non-remote population only.
Source: AIHW analysis of the 2004–05 NATSIHS.
Psychological distress—discrimination Perceptions of discrimination were measured with two variables in the survey. The first assessed whether Indigenous people felt that the treatment they received when accessing health care during the previous 12 months was different from that of non-Indigenous Australians. The second related to whether respondents felt they were treated badly in general, over the same period, because they were an Aboriginal or Torres Strait Islander person. One would expect that higher levels of psychological distress would be associated with feelings of greater discrimination. Saunders and Daly (2001) reported that those who experienced discrimination in the previous 12 months had a higher mean level of distress.
The correlations between high levels of psychological distress and perceived discrimination when accessing health care, are weakly supportive of the expected association. That is, as shown in Table 3.5, a higher proportion of those with high or very high levels of psychological distress reported that they felt they were treated worse than non-Indigenous

36
people when accessing health care than those with low levels of psychological distress (8% and 9% compared with 2%, respectively).
Table 3.5: Perceived treatment when seeking health care (compared with non-Indigenous people) by level of psychological distress, Indigenous persons aged 18 years and over, 2004–05 (per cent)
Level of psychological distress
Low Moderate High Very high Total(a)
Treatment when seeking health care compared with non-Indigenous people
Worse 1.7 3.3 7.7 8.5 4.0
Same 84.1 83.7 81.0 81.2 83.0
Better 4.8 5.8 6.1 5.0 5.4
Only encountered Indigenous health professionals 1.4 2.4 *3.0 *1.6 2.0
Did not seek health care 8.0 4.7 *2.3 3.7 5.6
Total(b) 100.0 100.0 100.0 100.0 100.0
Total no. of Indigenous people(b) 94,100 77,500 30,700 33,800 238,900
* Estimate has a relative standard error between 25% and 50% and should be used with caution.
(a) Includes missing responses for variable psychological distress.
(b) Excludes missing responses for variable treatment when seeking health care compared with non-Indigenous people (8%).
Source: AIHW analysis of the 2004–05 NATSIHS.
In relation to the question on perceived discrimination in general, there was a stronger association between such discrimination and psychological distress. That is, 10% of those who reported low levels of psychological distress indicated they felt they had been treated badly in the past year due to their Indigenous status, compared with 16% of those with moderate levels of psychological distress, 20% of those with high levels of psychological distress, and 25% of those with very high levels of psychological distress (Appendix Table E6).
Psychological distress—cultural identity In the 2004–05 NATSIHS, two variables dealt with the issue of cultural identity, with one relating to whether the individual identified with a tribal group, a language or clan, and the other relating to whether the respondent recognised an area as their homelands or traditional country. Because these questions were only asked of respondents living in non-remote areas, the validation of this domain against other domains was limited to the non-remote population only. Given that cultural identification questions in the survey were limited, no specific relationship between psychological distress and these variables was expected.
An analysis of the data confirmed that there were no identifiable patterns (or statistically significant differences) between level of psychological distress and whether or not a person identified with a tribal group, language group or clan. Similarly, recognition of one’s homelands did not vary according to level of psychological distress (Appendix Table E7).
Psychological distress—removal from natural family Respondents to the 2004–05 NATSIHS were asked whether they had been taken away from their natural families by a mission, the government or welfare; the same question was also asked in relation to whether a relative had been taken away. For validation purposes, a

37
three-category variable was created: those who reported that they themselves had been taken away (7%) (includes those who reported that a relative has also been taken away); those who reported that they had a relative removed (but had not been removed themselves) (36%); and those who had neither been removed themselves nor had any relatives removed (56%).
The analysis showed an association between removal from natural family and psychological distress, whereby a higher proportion of those respondents who reported very high levels of psychological distress indicated that they had been removed from their natural family than those who reported low levels of psychological distress (14% compared with 7%, respectively) (Table 3.6). No such association existed, however, for those with a relative only removed.
Table 3.6: Removal from natural family by level of psychological distress, Indigenous persons aged 18 years and over, 2004–05 (per cent)
Low Moderate High Very high Total(a)
Respondent removed 6.8 7.3 9.4 13.7 8.2
Relative only removed 31.5 39.4 38.6 39.6 35.9
Neither self nor relative removed 61.7 53.3 52.0 46.7 55.9
Total(b) 100.0 100.0 100.0 100.0 100.0
Total number of Indigenous people(b) 85,400 70,800 28,200 30,700 218,400
(a) Includes missing responses for variable psychological distress.
(b) Excludes missing responses for variable removal from natural family (13.8%).
Source: AIHW analysis of the 2004–05 NATSIHS.
Validating the domains against each other: summary This section summarises the outcomes of the comparisons of the eight social and emotional wellbeing domains with each other. Detailed results of all the analyses can be found in table format in Appendix E (Tables E15 to E215), which is available on the AIHW website.
‘Expected’ association shown In general, the social and emotional wellbeing domains demonstrated many of the expected relationships with other domains in the interim module (Table 3.7).
Psychological distress
As was expected, there were clear associations between the reported level of psychological distress and the following domains: impact of psychological distress; positive wellbeing; anger; number of life stressors; mental illness stressor; discrimination; and removal from natural family (self only). The outcomes of the validation of the psychological distress domain against the other domains are described in detail in Section 3.1.
Impact of psychological distress
The validation of the domain ‘impact of psychological distress’ also showed most of the expected relationships with other domains, including: psychological distress; anger; number of life stressors; positive wellbeing; and (general) discrimination. For example, 75% of those

38
reporting that there were no days in which they could not carry out their normal activities due to their psychological distress indicated that they had ‘been a happy person’ all or most of the time, compared with 38% of those who reported 3 to 14 such days (Appendix Table E19).
There was also validity within the domain—a comparison of the two questions within the impact domain showed the relationship one would expect. For example, a higher proportion of those who reported 15 or more days in which they could not work or carry out their normal activities due to their psychological distress, had two visits to a health professional due to their psychological distress in the past year, than those who reported zero days in which they could not carry out their normal activities (11% compared to 2%, respectively) (Appendix Table E15).
Positive wellbeing
The positive wellbeing domain showed mostly expected associations with the other domains—psychological distress; impact of psychological distress; anger; number of life stressors; (general) discrimination; and removal from natural family. For instance, those who reported experiencing the various feelings of positive wellbeing ‘all of the time’, reported a significantly lower average number of stressors than those who reported positive wellbeing feelings ‘none of the time’. The average number of stressors reported by those who felt calm and peaceful ‘all of the time’ was 2.0, compared with 3.6 stressors for those who felt calm and peaceful ‘none of the time’ (Appendix Tables E59–E62). Unlike many of the other domains, positive wellbeing also had an expected association with ‘removal from natural family’, in that those who reported higher levels of positive wellbeing were more likely to indicate that neither they nor their relatives had been removed from their natural family. For example, a higher proportion of those who indicated they felt full of life ‘all of the time’ reported that neither they nor a relative had been removed than those who reported feeling full of life ‘none of the time’ (67% compared with 45%, respectively) (Appendix Table E73).
Anger
Validation of the anger domain demonstrated the expected relationships with the following domains: psychological distress; impact of psychological distress; positive wellbeing; number of life stressors; and discrimination (general and when seeking health care). In one example, when analysing the anger domain against the positive wellbeing domain, it was found that 18% of those who reported they wanted to break or smash things ‘a lot’ reported they felt calm and peaceful all or most of the time, compared with 63% of those who said they wanted to break or smash things ‘not at all’ (Appendix tables E114–E118).
Life stressors
The life stressors domain was validated by examining the number of stressors reported, which showed expected associations with: psychological distress; impact of psychological distress; positive wellbeing; and anger. For example, of those who reported none of the specified stressors, 15% reported high or very high psychological distress; this compared with 22% of those who reported one stressor, 31% of those who indicated two or three stressors, and 40% of those who indicated four stressors or more (Appendix Table E169). Similarly, the number of stressors showed the expected relationship with all of the anger items, in that those who reported four stressors or more were significantly more likely than those who reported none of the specified stressors to express higher levels of anger (Appendix Table E173).

39
Further validation of the life stressor domain was undertaken by comparing two specific stressors against relevant domains. Questions on these two stressors were asked only of Indigenous respondents living in non-remote areas of Australia. A validation of the mental illness stressor (experienced by the respondent, their family or friends in the last 12 months) against psychological distress showed the expected association—those respondents who reported mental illness as a stressor were twice as likely to report high or very high levels of psychological distress than those who did not report this stressor (50% and 24%, respectively) (Appendix Table E174). Similarly, an analysis of the discrimination stressor and the discrimination domain also suggested validity of the discrimination stressor—those who reported discrimination as a stressor were much more likely to report that they felt discriminated against because of their Indigenous origin than those who did not report this stressor (66% compared to 9%, respectively) (Appendix Table E175).
Discrimination
The discrimination domain showed a number of relationships that might be expected with the following domains: psychological distress; number of life stressors; and the discrimination stressor. While ‘discrimination in health care’ was not associated with positive wellbeing, ‘general’ discrimination was—a lower proportion of those who felt discriminated against because of their Indigenous origin reported that they felt calm and peaceful, happy and/or full of life all or most of the time than those who did not feel discriminated against (47%, 61% and 46% compared with 59%, 74% and 56%, respectively) (Appendix Table E183). There was also validity within the domain—a higher proportion of respondents who felt they were treated worse than non-Indigenous people when seeking health care reported that they felt discriminated against in general than those who felt they received the same treatment (67% compared with 13%, respectively) (Appendix Table E186).
Cultural identification
Respondents living in non-remote areas of Australia were asked several ‘cultural identification’ questions (whether they identified with a tribal group, language group or clan, and whether or not they recognised their homelands or traditional country). There was validity within the domain—Indigenous people who said that they identified with a tribal group, language group or clan were significantly more likely to also recognise their homelands and live there, or not live there but have access to visit, compared with those who did not identify with a tribal group (24% and 68% compared with 8% and 24%, respectively) (Appendix tables E204 and E205).
As the cultural identification questions were asked in non-remote areas only, the validation of this domain against other domains was based on data for the non-remote population only. The cultural identification domain showed an ‘expected’ relationship with two other domains: discrimination; and removal from natural family (relative only). A larger proportion of those who identified with a tribal group, language group or clan reported that they felt discriminated against in any setting because of their Indigenous origin than those who did not identify with a tribal group, language group or clan (25% compared with 7%, respectively) (Appendix Table E202). Also, those who identified with a tribal group, language group or clan were more likely to report that a relative had been removed from their natural family than those who didn’t identify (55% compared with 28%, respectively) (Appendix Table E206).

40
Removal from natural family
Analysis of the ‘removal from natural family’ domain against other domains showed the relationship that could be expected with only one of the other domains, psychological distress. Those respondents who reported that they themselves had been removed from their natural family (with or without a relative) were also more likely to report high or very high levels of psychological distress compared with those who reported that neither they nor their relative(s) had been removed (38% and 24%, respectively) (Appendix Table E209). This was not the case for those respondents who reported that a relative only had been removed from their natural family.
Missing data For some domains, data are missing due to respondents not providing an answer or because they did not know the answer for individual items. The level of missing data could be considered a further indicator of the validity of the domains in the social and emotional wellbeing module.
Two domains had a particularly high level of missing data. For the discrimination domain, a large proportion of respondents said they did not know in response to the discrimination when seeking health care item (7.3%) and a small proportion (0.2%) refused to answer. These were combined to form a ‘missing’ category and were excluded from analyses, as the total proportion of missing responses exceeded 5%.
A similar issue existed for the ‘removal from natural family’ domain— a large proportion of respondents did not know whether or not any of their relatives had been removed from their natural family (13.4%). In addition, 2.3% of respondents refused to answer if they themselves had been removed from their natural family. Therefore, given that the two items on removal from family were combined to form one item, all refusal and don’t know responses were excluded from analysis because they exceeded 5% of total responses.

41
Tabl
e 3.
7: O
utco
mes
of t
he c
ross
-val
idat
ion
of th
e ei
ght s
ocia
l and
em
otio
nal w
ellb
eing
dom
ains
Dom
ain
asse
ssed
R
esul
ts s
how
‘exp
ecte
d’ a
ssoc
iatio
n w
ith:
No
asso
ciat
ion
or in
conc
lusi
ve
resu
lts w
ith:
‘Une
xpec
ted’
resu
lts w
ith:
Psy
chol
ogic
al d
istre
ss
impa
ct o
f psy
chol
ogic
al d
istre
ss; p
ositi
ve w
ellb
eing
(a) ;
ange
r; nu
mbe
r of l
ife s
tress
ors;
men
tal i
llnes
s st
ress
or;
disc
rimin
atio
n; re
mov
al fr
om n
atur
al fa
mily
(sel
f)
cultu
ral i
dent
ifica
tion;
rem
oval
fro
m n
atur
al fa
mily
(rel
ativ
e on
ly)
—
Impa
ct o
f psy
chol
ogic
al d
istre
ss
psyc
holo
gica
l dis
tress
; ang
er; n
umbe
r of l
ife s
tress
ors;
po
sitiv
e w
ellb
eing
; dis
crim
inat
ion
(gen
eral
)
with
in d
omai
n
cultu
ral i
dent
ifica
tion;
di
scrim
inat
ion
(whe
n se
ekin
g he
alth
car
e); r
emov
al fr
om n
atur
al
fam
ily
—
Pos
itive
wel
lbei
ng
psyc
holo
gica
l dis
tress
; im
pact
of p
sych
olog
ical
dis
tress
; an
ger;
num
ber o
f life
stre
ssor
s; d
iscr
imin
atio
n (g
ener
al);
rem
oval
from
nat
ural
fam
ily
cultu
ral i
dent
ifica
tion;
di
scrim
inat
ion
(whe
n se
ekin
g he
alth
car
e)
—
Ang
er
psyc
holo
gica
l dis
tress
; im
pact
of p
sych
olog
ical
dis
tress
; po
sitiv
e w
ellb
eing
; num
ber o
f life
stre
ssor
s; d
iscr
imin
atio
n (g
ener
al a
nd w
hen
seek
ing
heal
th c
are)
cultu
ral i
dent
ifica
tion;
rem
oval
fro
m n
atur
al fa
mily
—
Life
stre
ssor
s: N
umbe
r of s
tress
ors
M
enta
l illn
ess
stre
ssor
D
iscr
imin
atio
n st
ress
or
psyc
holo
gica
l dis
tress
; im
pact
of p
sych
olog
ical
dis
tress
; po
sitiv
e w
ellb
eing
; ang
er
psyc
holo
gica
l dis
tress
disc
rimin
atio
n
rem
oval
from
nat
ural
fam
ily
—
Dis
crim
inat
ion
psyc
holo
gica
l dis
tress
; pos
itive
wel
lbei
ng (a
ssoc
iate
d w
ith
‘gen
eral
’ dis
crim
inat
ion
only
); nu
mbe
r of l
ife s
tress
ors;
di
scrim
inat
ion
stre
ssor
with
in d
omai
n
impa
ct o
f psy
chol
ogic
al d
istre
ss;
posi
tive
wel
lbei
ng (n
o as
soci
atio
n w
ith ‘d
iscr
imin
atio
n in
hea
lth c
are’
)
—
Cul
tura
l ide
ntifi
catio
n di
scrim
inat
ion;
rem
oval
from
nat
ural
fam
ily (r
elat
ive
only
)
with
in d
omai
n
psyc
holo
gica
l dis
tress
; im
pact
of
psyc
holo
gica
l dis
tress
; pos
itive
w
ellb
eing
; ang
er; r
emov
al fr
om
natu
ral f
amily
(sel
f)
Num
ber o
f stre
ssor
s: a
hig
her n
umbe
r of s
tress
ors
wer
e re
porte
d by
thos
e w
ho re
cogn
ised
thei
r ho
mel
ands
than
by
thos
e w
ho d
id n
ot. T
his
was
als
o th
e ca
se fo
r tho
se w
ho id
entif
ied
with
a tr
ibal
gro
up,
lang
uage
gro
up o
r cla
n.
(con
tinue
d)

42
Tabl
e 3.
7 (c
ontin
ued)
: Out
com
es o
f the
cro
ss-v
alid
atio
n of
the
eigh
t soc
ial a
nd e
mot
iona
l wel
lbei
ng d
omai
ns
Dom
ain
asse
ssed
R
esul
ts s
how
‘exp
ecte
d’ a
ssoc
iatio
n w
ith:
No
asso
ciat
ion
or in
conc
lusi
ve
resu
lts w
ith:
‘Une
xpec
ted’
resu
lts w
ith:
Rem
oval
from
nat
ural
fam
ily
psyc
holo
gica
l dis
tress
(ass
ocia
ted
only
with
rem
oval
of
self,
with
or w
ithou
t rel
ativ
e)
psyc
holo
gica
l dis
tress
(not
as
soci
ated
with
rem
oval
of r
elat
ive
only
); im
pact
of p
sych
olog
ical
di
stre
ss; p
ositi
ve w
ellb
eing
; ang
er;
num
ber o
f life
stre
ssor
s
—
Not
e: A
s th
e cu
ltura
l ide
ntifi
catio
n qu
estio
ns w
ere
aske
d in
non
-rem
ote
area
s on
ly, t
he v
alid
atio
n of
this
dom
ain
agai
nst o
ther
dom
ains
was
bas
ed o
n da
ta fo
r the
non
-rem
ote
popu
latio
n on
ly.
(a)
Res
ults
not
alw
ays
cons
iste
nt; s
ee te
xt in
Sec
tion
3.1.
43
No association or inconclusive results Between some of the domains that were analysed, no association was shown. Also, in some cases, a statistically significant relationship was found between some of the questions across two domains, but where most questions across those domains showed no association, the results were determined ‘inconclusive’ and have been reported together with those domains that showed no association (Table 3.7).
It should be stated here that there are clearly differences in the strength of the expectations one might have of whether an association between domains is likely. That is, while there might be a strong expectation of an association between some of the domains—such as between psychological distress and positive wellbeing—it may not be as clear whether one would expect an association between others—such as psychological distress and recognising one’s homelands or traditional country, or between the past removal from natural family and recent manifestations of anger.
Some domains—the cultural identification domain and the removal from natural family domain in particular—did not show any association with most of the other domains. For example, no association was shown between the cultural identification domain and psychological distress, impact of psychological distress, positive wellbeing, anger, or removal of self from natural family. Similarly, there was no association between removal from natural family and impact of psychological distress or anger; no association between removal of a relative from natural family and the psychological distress domain; and no association between removal of self from natural family and the cultural identification domain.
‘Unexpected’ results Only one relationship—between the number of stressors and the cultural identification domain—showed the opposite association to the one that might be expected. Those respondents who identified with a tribal group, language group or clan reported, on average, a higher number of stressors than those who did not (3.1 stressors compared with 1.8) (Appendix Table E200). Similarly, those who reported that they recognised their homelands and currently lived there, and those who did not live there but were allowed to visit also reported, on average, a higher number of stressors than those who did not recognise their homelands (2.9 and 2.8 stressors compared with 1.7, respectively) (Appendix Table E201). As the cultural identification questions were asked in non-remote areas only, the scope of this validation was limited to the non-remote population only.
It should be noted that, in the question about life stressors, respondents were asked about stressors that not only they, but also their family and/or friends, had experienced in the previous 12 months. Consequently, the larger one’s family or circle of friends, the more stressors one is likely to report. Thus, while recognition of one’s homelands or identification with a tribal group, language group or clan is likely to be a positive factor in terms of cultural identity, it may also equate with a larger number of ties to others and the probability of more stressors experienced by one’s family and friends.
There was also no significant association between removal from natural family and positive wellbeing, but there was an association in the expected direction when the reverse analysis was carried out. That is, a lower proportion of respondents who had been removed from
44
their natural family reported positive wellbeing compared with those who had not been removed.
3.2 Validating the domains against other variables As well as comparing the results from the eight domains in the survey with each other (Section 3.1), the internal validation process also involved a comparison with five other relevant variables in the survey in order to determine if the expected relationships were observed.
The five NATSIHS variables selected for this part of the validation process were:
1. Self-assessed health status—respondents were asked to indicate how good their health was in general. This question refers to the respondent’s overall health and thus could encompass physical and/or mental health to varying degrees. In total, 40% indicated that their health was excellent or very good, 36% indicated that it was good, and 24% indicated that it was fair or poor.
2. Number of long-term health conditions, including long-term mental health conditions—respondents were asked whether they had any of a number of specific health conditions (for example asthma, cancer, arthritis, diabetes) or any other health conditions that had lasted, or were expected to last, for 6 months or more. Overall, 19% of Indigenous people reported having no long-term health conditions, 18% reported one condition, 30% reported two or three conditions, and 33% reported having four or more long-term health conditions
3. Alcohol consumption—respondents were asked a series of questions about alcohol consumption, and a 7-day average alcohol risk level variable was created, with categories based on guidelines produced by the National Health and Medical Research Council (NHMRC 2001). This variable is based on the week before the survey.
4. Financial stress—two household indicators were used to determine financial stress. The first indicated whether the respondent (or others in their household) could obtain $2,000 within a week for something they considered important. Overall, 46% of Indigenous adults were living in households that could raise the money, while 54% were in households that could not. The second variable indicated whether there had been any days in the previous 2 weeks and then in the previous 12 months in which the respondent (or others in the household) had no money for basic living expenses (for example food, rent). The majority (60%) of Indigenous adults were living in households that had not experienced any days where they could not pay for basic living expenses, just over one in four (26%) were in households in which there had been such days in the past two weeks (referred to as ‘present financial stress’ in the tables), and 13% in households in which there had been such days in the previous 12 months but not the past 2 weeks (referred to as ‘past financial stress’).
5. Labour force status—respondents were asked a number of questions about their labour force status and a variable with four categories was derived from those responses: employed in other than a Community Development Employment Project (CDEP) (41%), employed in CDEP (12%), unemployed (8%) and not in the labour force (40%).

45
Validating the psychological distress domain (K-5) against five other variables: detailed description This section describes, in detail, the validation of the psychological distress domain against five other NATSIHS variables. As described in Chapter 2 and Section 3.1, five questions from the K-10 were included in the social and emotional wellbeing module. Responses to these questions were converted into a K-5 score ranging from 5 to 25, with higher values indicating higher levels of psychological distress.
Psychological distress—self-assessed health status One measure of general health status that was included in the 2004–05 NATSIHS related to an individual’s own assessment of their health status. That is, respondents were asked to indicate how good their health was in general. This question refers to overall health and thus could encompass physical and/or mental health to varying degrees. In total, 40% of Indigenous adults indicated that their health was excellent or very good, 36% indicated that it was good, and 24% indicated that it was fair or poor. As shown in Figure 3.2, the data indicate the expected relationship between psychological distress and self-assessed health status, with those who had low levels of psychological distress more likely to say that their health was excellent or very good, and those with very high psychological distress more likely to say their health was fair or poor. In particular, those with very high levels of psychological distress were over 3 times as likely as those with low levels of psychological distress to rate their health as fair or poor (51% and 14%, respectively).
Note: Includes missing responses for variables psychological distress and self-assessed health status.
Source: AIHW analysis of the 2004–05 NATSIHS.
Figure 3.2: Self-assessed health status by level of psychological distress, Indigenous persons aged 18 years and over, 2004–05
Psychological distress—long-term health conditions In the 2004–05 NATSIHS, respondents were asked whether they had any of a number of specific health conditions (for example asthma, cancer, arthritis, diabetes) or any other health
14 22
27
51
38 35
42
28
47 43
31
21
0
10
20
30
40
50
60
Low Moderate High Very high
Psychological distress
Per cent
Fair/poor
Good
Excellent/very good

46
conditions that had lasted, or were expected to last, for 6 months or more. From this information, a variable was created that indicated the number of long-term health conditions a respondent had. Overall, 19% of Indigenous adults reported having no long-term health conditions, 18% reported one condition, 30% reported two or three conditions, and 33% reported having four or more long-term health conditions (Appendix Table E10).
In addition, the type of long-term health condition was examined, with a specific focus on mental health-related conditions. Overall, 3.5% of Indigenous adults reported alcohol and drug problems in the last 6 months, 9.9% reported mood and affective disorders and 11.5% reported other mental and behavioural problems. It is important to note that a different question format was used for Indigenous respondents living in non-remote areas compared with those in remote areas. That is, those living in non-remote areas were asked if they had any ‘other’ long-term health conditions and were shown a prompt card with a list of examples, including a number of specific mental health-related conditions such as depression and anxiety. Remote respondents, on the other hand, were simply asked to state any ‘other’ long-term conditions they had or were currently experiencing without being prompted with a list of possible conditions. Therefore, it is expected that the figures above are likely to be underestimates of the true extent of mental health-related conditions within the Indigenous population of Australia, particularly among those living in remote areas (ABS 2006c).
Number of long-term health conditions
As shown in Figure 3.3, a clear relationship between the number of long-term conditions and psychological distress was observed. Indigenous adults with very high levels of psychological distress were much more likely than those with low levels of psychological distress to have reported four or more long-term health conditions (62% and 21%, respectively). They were also less likely than those with low psychological distress to have indicated that they had no long-term conditions (8% versus 26%).

47
Note: Includes missing responses for variables psychological distress and number of long-term health conditions.
Source: AIHW analysis of the 2004–05 NATSIHS.
Figure 3.3: Number of long-term health conditions by level of psychological distress, Indigenous persons aged 18 years and over, 2004–05
Long-term mental health-related conditions
Whether or not Indigenous people suffered from a mental health-related problem that lasted or was expected to last 6 months or more also demonstrated a strong association with level of psychological distress. That is, those with very high levels of psychological distress were much more likely to report a long-term mental health-related condition than those with low levels of psychological distress (49% compared with 6%, respectively) (Figure 3.4).
26
18
12
8
2219
13
8
3032 33
2221
31
42
62
0
10
20
30
40
50
60
70
Low Moderate High Very high
Psychological distress
Per cent
0 conditions
1 condition
2-3 conditions
4 or more conditions

48
Source: AIHW analysis of the 2004–05 NATSIHS.
Figure 3.4: Whether reported a long-term mental health-related condition by level of psychological distress, Indigenous persons aged 18 years and over, 2004–05
Psychological distress—alcohol consumption A series of questions were asked in the 2004–05 NATSIHS about alcohol consumption. The ABS used responses to these questions to create a 7-day average alcohol risk level variable with categories based on guidelines produced by the National Health and Medical Research Council (NHMRC 2001). This variable was used in the current report as a measure of alcohol consumption, although it should be noted that this measure of risky alcohol consumption was based on consumption in the week prior to interview and does not consider whether this level was usual for the respondent.
Excessive alcohol consumption is associated with a variety of adverse health and social consequences and as such could be related to higher levels of psychological distress. However, results from the 2000 WA Health and Wellbeing survey indicated that there was no clear association between psychological distress (measured using the K-10) and alcohol consumption (Saunders & Daly 2001). In addition, analysis of data from the 2002 NSW Health survey also showed no clear relationship between psychological distress (using the K-10) and alcohol consumption (Stewart 2006). Likewise, the analysis of the 2004–05 NATSIHS found no statistically significant differences between the proportions of respondents who drank at high risk level according to psychological distress level (Appendix Table E12).
Psychological distress—Household financial stress Two household indicators were used to determine financial stress in the 2004-05 NATSIHS. The first indicated whether the respondent (or others in their household) said they could obtain $2,000 within a week for something they considered important. The data showed that 46% of Aboriginal and Torres Strait Islander adults were in households that could raise the money, while 54% were in households that could not. Six per cent of Indigenous adults were
614
29
49
95
86
71
51
0
20
40
60
80
100
Low Moderate High Very high
Psychological distress
Per cent
Long-term mental health condition
No long-term mental health condition

49
living in households in which the household spokesperson did not know if they could raise the money and have therefore been excluded from the analyses of this variable.
The second financial stress variable dealt with whether there had been any days in the previous 2 weeks and then in the previous 12 months in which the respondent (or others in the household) had no money for basic living expenses (for example food or rent). The majority (60%) of respondents were living in households in which there had not been any days where they could not pay for basic living expenses, just over one in four (26%) were living in households in which there had been such days in the past two weeks (referred to as ‘present financial stress’ in the tables), and 13% were in households that had experienced financial stress in the previous 12 months, but not the past two weeks (referred to as ‘past financial stress’).
For both measures, there was a clear relationship between psychological distress and financial stress. For example, a lower proportion of those who reported very high levels of psychological distress were in households that could obtain $2,000 within a week for an emergency, compared with those with low psychological distress (29% compared to 54%, respectively). Those with very high levels of psychological distress were also more likely to be living in households in which there had not been sufficient money for basic living expenses within the past two-week period than respondents reporting a low level of psychological distress (47% and 18%, respectively) (Appendix Table E13).
Psychological distress—labour force status In the 2004–05 NATSIHS, respondents were asked a number of questions about their labour force status and a variable with four categories was derived from these responses: employed in other than a CDEP (41%), employed in a CDEP (12%), unemployed (8%) and not in the labour force (40%).
There were no significant differences in the proportion of Indigenous adults who were unemployed or the proportion employed in CDEP according to level of psychological distress reported (Appendix Table E14). However, there were differences in relation to participation in the labour force—more than half (55%) of respondents who reported a very high level of psychological distress were not in the labour force, compared with 35% of those reporting a low level of psychological distress. On the other hand, just under a quarter (24%) of respondents who reported a very high level of psychological distress were employed—in other than a CDEP—compared with 46% of those reporting a low level of psychological distress.
Validating the domains against five other variables: summary This section summarises the outcomes of the comparisons of four social and emotional wellbeing domains with five other variables in the NATSIHS. Detailed results of all the analyses can be found in table format in Appendix E (Tables E1 to E215), which is available on the AIHW website.
‘Expected’ association shown In general, the social and emotional wellbeing domains that were examined demonstrated many of the expected relationships with the five NATSIHS variables (Table 3.8).

50
Psychological distress
As expected, there were clear associations between the reported level of psychological distress and self-assessed health status, number of long-term health conditions (including long-term mental health conditions), household financial stress and labour force status (being ‘employed’, and ‘not in the labour force’—there was no association with ‘unemployed’). The outcomes of the validation of the psychological distress domain against the five variables are described in detail in Section 3.2.
Impact of psychological distress
The validation of the domain ‘impact of psychological distress’ also showed the expected relationships with the variables listed above under the heading ‘psychological distress’.
Positive wellbeing
The positive wellbeing domain showed expected associations with the same four out of five variables—self-assessed health status; number of long-term health conditions, including long-term mental health conditions; household financial stress; and labour force status (being employed, and not in the labour force). For example, a higher proportion of those who felt happy ‘none of the time’ reported four health conditions or more than those who felt happy ‘all of the time’ (54% compared with 21%, respectively) (Tables C79–82). In terms of respondents’ mental health, a higher proportion of those who felt happy ‘none of the time’ reported a mental health condition than those who felt happy ‘all of the time’ (49% compared with 7%, respectively) (Tables C83–86). In relation to the second of the financial stress variables (present financial stress), the results were generally in the expected direction and many of the differences were statistically significant (Appendix Tables E91–E94). For example, 49% of those who said they were a happy person ‘none of the time’ compared with 21% of those who said they were a happy person ‘all of the time’ were in households that had experienced present financial stress (lack of money to pay for basic expenses in past 2 weeks) (Appendix Table E92). Also, as expected, those respondents who reported that they were employed were more likely to report higher levels of positive wellbeing. For instance, of those who reported that they ‘felt full of life’ most of the time, 49% said that they were employed, compared with 27% of those who ‘felt full of life’ none of the time (Appendix Table E97).
Anger
Validation of the anger domain demonstrated the expected relationships with the following variables—self-assessed health status, number of long-term health conditions (including long-term mental health conditions), household financial stress (present) and labour force status (being employed). For instance, those respondents who indicated a higher level of anger were less likely than those who had lower levels of anger to assess their health as excellent or very good (Appendix Tables E139–E143). In relation to mental health, a higher proportion of respondents who said they had violent thoughts ‘a lot’ reported a long-term mental health condition than those who reported that they did not have violent thoughts (48% compared with 14%, respectively) (Appendix Table E150). A consistent association was also observed between the anger manifestations and present financial stress. For example, a higher proportion of those who indicated that they wanted to break or smash things ‘a lot’ were in households that had experienced present financial stress than those who reported

51
not wanting to break or smash things ‘at all’ (55% compared with 23%) (Appendix Table E161).
No association or inconclusive results
In some cases, no association was found between the domains and the five variables analysed. Also, sometimes a statistically significant relationship was found between one or two questions in a domain and a variable, but where the other questions in that domain did not show an association, the results were determined ‘inconclusive’ and have been reported as showing no association (Table 3.8).
One variable in particular, alcohol consumption, did not show any association with the domains that were analysed—no association was shown between risky alcohol consumption and psychological distress, impact of psychological distress, positive wellbeing or anger (Appendix Tables E12, E37–38, E87–90 and E154–158). As discussed in more detail previously in this Section, results from two other surveys also showed no clear relationship between psychological distress (using the K-10) and alcohol consumption. There were some statistically significant associations between levels of anger and high-risk drinking; however, the relationship was not consistent across the five anger variables.
While there were some statistically significant associations between household financial stress (being able to raise $2,000 in an emergency) and some of the anger items, the results were not consistent across all five anger items (Appendix Tables E159–E163).
The analysis of the domains and the labour force variable showed mixed results. While there was a consistent association between the domains and being employed, there was no association between the reported anger manifestations and the response ‘not in the labour force’. Also, no statistically significant relationship existed between being unemployed and psychological distress, impact of psychological distress, positive wellbeing or anger (Appendix Tables E14, E41–42, E95–98 and E164–168). However, the results mostly showed the expected direction in terms of the percentage increase across the categories—for example the proportion who reported being unemployed increased with the amount of anger reported, or with the level of psychological distress reported.
Unexpected results
There were no unexpected results from the analysis of the four social and emotional wellbeing domains and the five other variables.

52
Tabl
e 3.
8: O
utco
mes
of t
he v
alid
atio
n of
four
soc
ial a
nd e
mot
iona
l wel
lbei
ng d
omai
ns w
ith s
elec
ted
NA
TSIH
S va
riab
les
Dom
ain
asse
ssed
R
esul
ts s
how
‘exp
ecte
d’ a
ssoc
iatio
n w
ith:
No
asso
ciat
ion
or in
conc
lusi
ve re
sults
w
ith:
‘Une
xpec
ted’
resu
lts w
ith:
Psy
chol
ogic
al d
istre
ss
self-
asse
ssed
hea
lth s
tatu
s; n
umbe
r of l
ong-
term
hea
lth c
ondi
tions
, inc
ludi
ng lo
ng-te
rm
men
tal h
ealth
con
ditio
ns; f
inan
cial
stre
ss;
labo
ur fo
rce
(‘not
in th
e la
bour
forc
e’,
‘em
ploy
ed’)
alco
hol c
onsu
mpt
ion;
labo
ur fo
rce
(‘une
mpl
oyed
’) —
Impa
ct o
f psy
chol
ogic
al d
istre
ss
self-
asse
ssed
hea
lth s
tatu
s; n
umbe
r of l
ong-
term
hea
lth c
ondi
tions
, inc
ludi
ng lo
ng-te
rm
men
tal h
ealth
con
ditio
ns; f
inan
cial
stre
ss;
labo
ur fo
rce
(‘not
in th
e la
bour
forc
e’,
‘em
ploy
ed’)
alco
hol c
onsu
mpt
ion;
labo
ur fo
rce
(‘une
mpl
oyed
’) —
Pos
itive
wel
lbei
ng
self-
asse
ssed
hea
lth s
tatu
s; n
umbe
r of l
ong-
term
hea
lth c
ondi
tions
, inc
ludi
ng lo
ng-te
rm
men
tal h
ealth
con
ditio
ns; f
inan
cial
stre
ss;
labo
ur fo
rce
(‘not
in th
e la
bour
forc
e’,
‘em
ploy
ed’)
alco
hol c
onsu
mpt
ion;
labo
ur fo
rce
(‘une
mpl
oyed
’) —
Ang
er
self-
asse
ssed
hea
lth s
tatu
s; n
umbe
r of l
ong-
term
hea
lth c
ondi
tions
, inc
ludi
ng lo
ng-te
rm
men
tal h
ealth
con
ditio
ns; f
inan
cial
stre
ss
(pre
sent
); la
bour
forc
e (‘e
mpl
oyed
’)
alco
hol c
onsu
mpt
ion;
fina
ncia
l stre
ss
(em
erge
ncy)
; lab
our f
orce
(‘un
empl
oyed
’/’no
t in
the
labo
ur fo
rce’
)
—
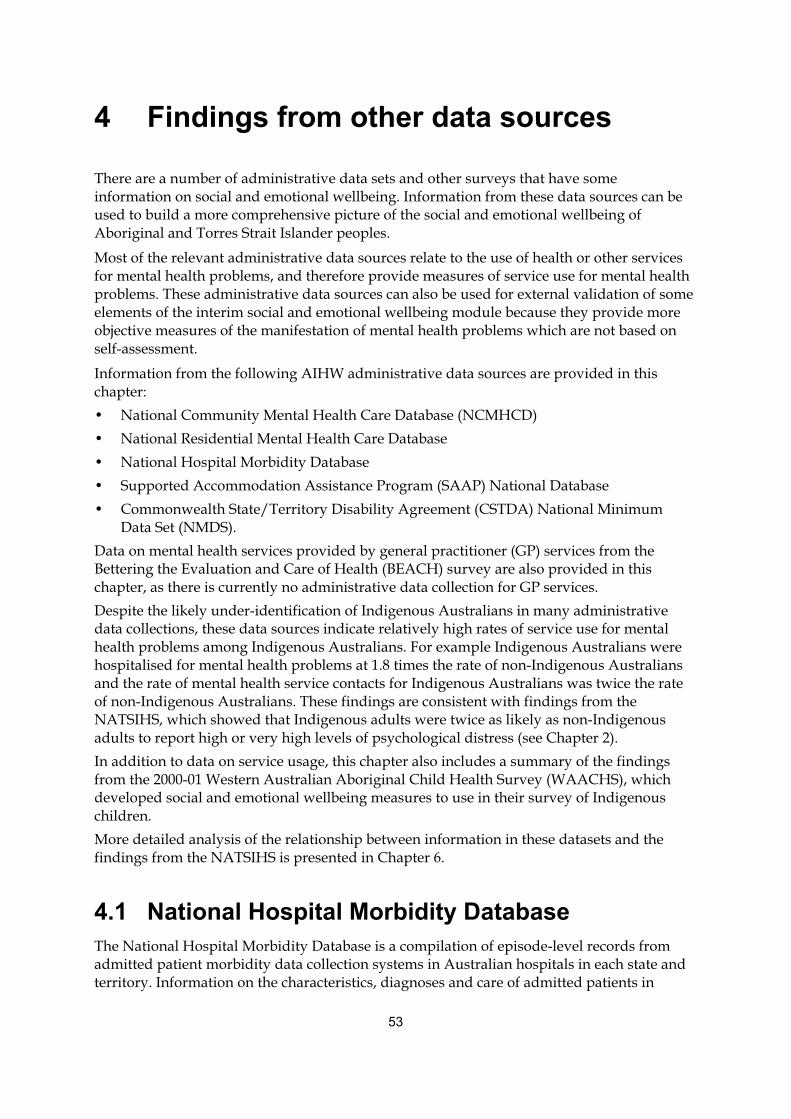
53
4 Findings from other data sources
There are a number of administrative data sets and other surveys that have some information on social and emotional wellbeing. Information from these data sources can be used to build a more comprehensive picture of the social and emotional wellbeing of Aboriginal and Torres Strait Islander peoples.
Most of the relevant administrative data sources relate to the use of health or other services for mental health problems, and therefore provide measures of service use for mental health problems. These administrative data sources can also be used for external validation of some elements of the interim social and emotional wellbeing module because they provide more objective measures of the manifestation of mental health problems which are not based on self-assessment.
Information from the following AIHW administrative data sources are provided in this chapter: • National Community Mental Health Care Database (NCMHCD) • National Residential Mental Health Care Database • National Hospital Morbidity Database • Supported Accommodation Assistance Program (SAAP) National Database • Commonwealth State/Territory Disability Agreement (CSTDA) National Minimum
Data Set (NMDS). Data on mental health services provided by general practitioner (GP) services from the Bettering the Evaluation and Care of Health (BEACH) survey are also provided in this chapter, as there is currently no administrative data collection for GP services. Despite the likely under-identification of Indigenous Australians in many administrative data collections, these data sources indicate relatively high rates of service use for mental health problems among Indigenous Australians. For example Indigenous Australians were hospitalised for mental health problems at 1.8 times the rate of non-Indigenous Australians and the rate of mental health service contacts for Indigenous Australians was twice the rate of non-Indigenous Australians. These findings are consistent with findings from the NATSIHS, which showed that Indigenous adults were twice as likely as non-Indigenous adults to report high or very high levels of psychological distress (see Chapter 2). In addition to data on service usage, this chapter also includes a summary of the findings from the 2000-01 Western Australian Aboriginal Child Health Survey (WAACHS), which developed social and emotional wellbeing measures to use in their survey of Indigenous children. More detailed analysis of the relationship between information in these datasets and the findings from the NATSIHS is presented in Chapter 6.
4.1 National Hospital Morbidity Database The National Hospital Morbidity Database is a compilation of episode-level records from admitted patient morbidity data collection systems in Australian hospitals in each state and territory. Information on the characteristics, diagnoses and care of admitted patients in

54
public and private hospitals is provided annually to the AIHW by state and territory health departments. Although hospital separation data are a valuable source of information about hospital care, they have limitations as indicators of ill-health. Sick people who are not admitted to hospital are not counted, and those who are admitted more than once are counted on each occasion. Admitted patient care data are also affected by changes in admission practices, and the availability of and access to hospitals.
Data are presented for the six jurisdictions which have been assessed as having adequate identification of Indigenous hospitalisations in 2005–06 to 2006–07: New South Wales, Victoria, Queensland, Western Australia, South Australia and the Northern Territory. These six states and territories represent about 95% of the total Indigenous population of Australia. The reported hospitalisation rates for Indigenous persons are affected by the quality of Indigenous identification, which varies across states and territories, and also across remoteness areas. Further details are provided in Appendix B.
Hospitalisations for mental health-related conditions Mental health-related conditions, which include mental and behavioural disorders (such as schizophrenia and psychoactive substance use) and other mental health conditions (such as Alzheimer’s disease and post natal depression) were responsible for 4.2% of all hospitalisations of Aboriginal and Torres Strait Islander Australians in New South Wales, Victoria, Queensland, Western Australia, South Australia and the Northern Territory for the period 2005–06 to 2006–07. Indigenous Australians had a separation rate for mental health conditions that was 1.8 times the rate of non-Indigenous Australians (Appendix Table F6).
Hospitalisations by age and sex • For the 2 year period July 2005 to June 2007, there were 20,670 hospitalisations of
Aboriginal and Torres Strait Islander peoples for mental health–related conditions in New South Wales, Victoria, Queensland, Western Australia, South Australia and the Northern Territory. Of these, 11,327 hospitalisations (55%) were of Indigenous males and 9,343 hospitalisations (45%) were of Indigenous females (Appendix Table F6).
• Indigenous males had higher rates of hospitalisations for mental health-related conditions than other males across all age groups except for those aged 0–4 years and Indigenous females aged 15–54 years had higher rates than other females (Figure 4.1).
• The greatest difference in female rates of hospitalisations for mental health-related conditions occurred in those aged 25–34 years, where Indigenous females were hospitalised at over twice the rate of other females (41 per 1,000 and 19 per 1,000 hospitalisations).
• The greatest difference in male rates of hospitalisations for mental health-related conditions occurred in those aged 35–44 years, where Indigenous males were hospitalised at over 3 times the rate of other males (55 per 1,000 and 16 per 1,000 hospitalisations).
• For Indigenous males hospitalisation rates were highest among those aged 35–44 years, whereas for Indigenous females, rates were highest for those aged 25–34 years (Figure 4.1).
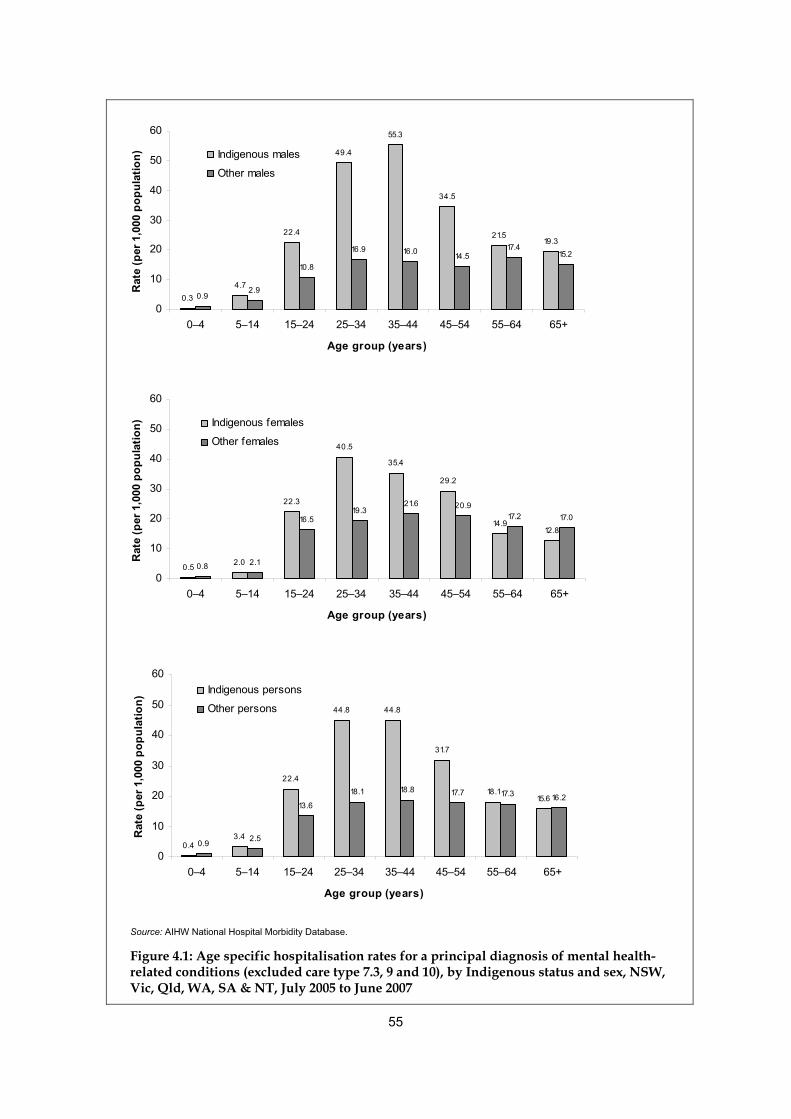
55
0.34.7
22.4
49.4
55.3
34.5
21.519.3
0.92.9
10.8
16.9 16.0 14.517.4
15.2
0
10
20
30
40
50
60
0–4 5–14 15–24 25–34 35–44 45–54 55–64 65+
Age group (years)
Rat
e (p
er 1
,000
pop
ulat
ion) Indigenous males
Other males
0.5 2.0
22.3
40.5
35.4
29.2
14.912.8
0.8 2.1
16.519.3
21.6 20.917.2 17.0
0
10
20
30
40
50
60
0–4 5–14 15–24 25–34 35–44 45–54 55–64 65+
Age group (years)
Rat
e (p
er 1
,000
pop
ulat
ion) Indigenous females
Other females
0.43.4
22.4
44.8 44.8
31.7
18.115.6
0.9 2.5
13.6
18.1 18.8 17.7 17.3 16.2
0
10
20
30
40
50
60
0–4 5–14 15–24 25–34 35–44 45–54 55–64 65+
Age group (years)
Rat
e (p
er 1
,000
pop
ulat
ion)
Indigenous persons
Other persons
Source: AIHW National Hospital Morbidity Database.
Figure 4.1: Age specific hospitalisation rates for a principal diagnosis of mental health-related conditions (excluded care type 7.3, 9 and 10), by Indigenous status and sex, NSW, Vic, Qld, WA, SA & NT, July 2005 to June 2007
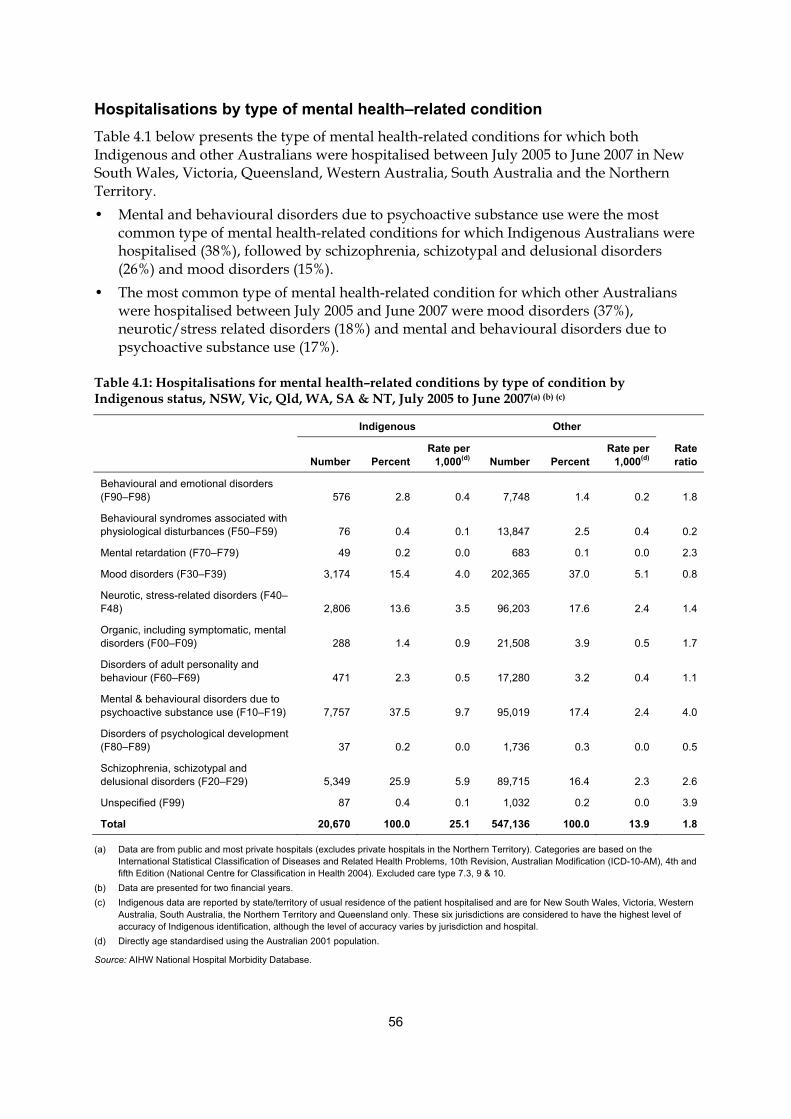
56
Hospitalisations by type of mental health–related condition Table 4.1 below presents the type of mental health-related conditions for which both Indigenous and other Australians were hospitalised between July 2005 to June 2007 in New South Wales, Victoria, Queensland, Western Australia, South Australia and the Northern Territory. • Mental and behavioural disorders due to psychoactive substance use were the most
common type of mental health-related conditions for which Indigenous Australians were hospitalised (38%), followed by schizophrenia, schizotypal and delusional disorders (26%) and mood disorders (15%).
• The most common type of mental health-related condition for which other Australians were hospitalised between July 2005 and June 2007 were mood disorders (37%), neurotic/stress related disorders (18%) and mental and behavioural disorders due to psychoactive substance use (17%).
Table 4.1: Hospitalisations for mental health–related conditions by type of condition by Indigenous status, NSW, Vic, Qld, WA, SA & NT, July 2005 to June 2007(a) (b) (c)
Indigenous Other
Number Percent Rate per
1,000(d) Number Percent Rate per
1,000(d) Rate ratio
Behavioural and emotional disorders (F90–F98) 576 2.8 0.4 7,748 1.4 0.2 1.8
Behavioural syndromes associated with physiological disturbances (F50–F59) 76 0.4 0.1 13,847 2.5 0.4 0.2
Mental retardation (F70–F79) 49 0.2 0.0 683 0.1 0.0 2.3
Mood disorders (F30–F39) 3,174 15.4 4.0 202,365 37.0 5.1 0.8
Neurotic, stress-related disorders (F40–F48) 2,806 13.6 3.5 96,203 17.6 2.4 1.4
Organic, including symptomatic, mental disorders (F00–F09) 288 1.4 0.9 21,508 3.9 0.5 1.7
Disorders of adult personality and behaviour (F60–F69) 471 2.3 0.5 17,280 3.2 0.4 1.1
Mental & behavioural disorders due to psychoactive substance use (F10–F19) 7,757 37.5 9.7 95,019 17.4 2.4 4.0
Disorders of psychological development (F80–F89) 37 0.2 0.0 1,736 0.3 0.0 0.5
Schizophrenia, schizotypal and delusional disorders (F20–F29) 5,349 25.9 5.9 89,715 16.4 2.3 2.6
Unspecified (F99) 87 0.4 0.1 1,032 0.2 0.0 3.9
Total 20,670 100.0 25.1 547,136 100.0 13.9 1.8
(a) Data are from public and most private hospitals (excludes private hospitals in the Northern Territory). Categories are based on the International Statistical Classification of Diseases and Related Health Problems, 10th Revision, Australian Modification (ICD-10-AM), 4th and fifth Edition (National Centre for Classification in Health 2004). Excluded care type 7.3, 9 & 10.
(b) Data are presented for two financial years. (c) Indigenous data are reported by state/territory of usual residence of the patient hospitalised and are for New South Wales, Victoria, Western
Australia, South Australia, the Northern Territory and Queensland only. These six jurisdictions are considered to have the highest level of accuracy of Indigenous identification, although the level of accuracy varies by jurisdiction and hospital.
(d) Directly age standardised using the Australian 2001 population.
Source: AIHW National Hospital Morbidity Database.

57
Hospitalisations for self-harm For the period July 2005 to June 2007, there were 3,179 hospitalisations of Indigenous Australians in New South Wales, Victoria, Queensland, Western Australia, South Australia and the Northern Territory caused by intentional self-harm. • Overall, Indigenous Australians were hospitalised for self-harm at more than twice the
rate of other Australians, with Indigenous males hospitalised at 2.9 times the rate of other Australians (Table 4.2).
• Hospitalisation rates for self-harm were the highest among Indigenous Australians aged 35–44 years (7 per 1,000) , while for other Australians they were highest among those aged 15–24 years (3 per 1,000) (Appendix Table F10).
Table 4.2: Hospitalisations for intentional self-harm (X60–X84), by Indigenous status and sex, NSW, Vic, Qld, WA, SA & NT, July 2005 to June 2007(a)(b)(c)
Indigenous Other
Number Rate per 1,000(d) Number Rate per 1,000(d) Rate
Ratio
Males 1,415 3.2 21,366 1.1 2.9
Females 1,764 3.7 34,000 1.8 2.1
Persons 3,179 3.5 55,371 1.4 2.4
(a) Data are from public and most private hospitals (excludes private hospitals in the Northern Territory). Categories are based on the International Statistical Classification of Diseases and Related Health Problems, 10th Revision, Australian Modification (ICD-10-AM), 4th and 5th Edition (National Centre for Classification in Health 2004). Excluded care type 7.3, 9 & 10.
(b) Data are presented for two financial years. (c) Indigenous data are reported by state/territory of usual residence of the patient hospitalised and are for New South Wales, Victoria, Western
Australia, South Australia, the Northern Territory and Queensland only. These six jurisdictions are considered to have the highest level of accuracy of Indigenous identification, although the level of accuracy varies by jurisdiction and hospital.
(d) Directly age standardised using the Australian 2001 population.
Source: AIHW National Hospital Morbidity Database.
Key findings • Between July 2005 and June 2007 Indigenous Australians were hospitalised for mental
health-related conditions at 1.8 times the rate of non-Indigenous Australians.
• Indigenous Australians were hospitalised for intentional self-harm at more than twice the rate of non-Indigenous Australians.
• It should be noted, however, that rates are affected by access to hospitals, admission practices and the quality of Indigenous identification.
4.2 National Community Mental Health Care Database Information on the use of community mental health services by Aboriginal and Torres Strait Islander peoples is available from the NCMHCD. Community mental health care services are those that are provided by specialised public mental health services dedicated to the assessment, treatment, rehabilitation and care of non-admitted patients (further detail provided in Appendix B).

58
In 2005–06 there were 247,263 contacts with community mental health services by Indigenous Australians. This represented a rate of service contacts that was almost twice the rate of non-Indigenous Australians (532 per 1,000 and 271 per 1,000 respectively) (Table 4.3).
Table 4.3: Community mental health service contacts by Indigenous status(a) and age group, 2005–06
Indigenous Australians Non-Indigenous
Age group Number Per cent Rate (per
1,000)(b) Number Per cent Rate (per 1,000) (b)
Rate ratio
Less than 15 years 20,250 8.2 110.7 320,128 5.9 83.3 1.3
15–24 years 61,029 24.7 621.8 752,524 13.9 276.3 2.3
25–34 years 80,299 32.5 1,096.2 1,033,734 19.1 365.5 3.0
35–44 years 54,693 22.1 884.9 919,940 17.0 309.5 2.9
45–54 years 20,674 8.4 500.7 665,275 12.3 240.3 2.1
55–64 7,672 3.1 353.7 368,897 6.8 170.7 2.1
65 years and over 2,646 1.1 194.6 533,278 9.8 203.6 1.0
Total contacts(c) 247,263 100 531.7 5,418,145 100 270.3 2.0
(a) These data should be interpreted with caution due to likely under-identification of Indigenous Australians. For more information, see Appendix 1 of Mental health services in Australia 2005–06.
(b) Rates were directly age-standardised to the Australian population at 30 June 2001.
(c) Includes service contacts for which age is unknown.
Source: National Community Mental Health Care Database, AIHW.
• The rate of community mental health contacts was highest among those aged 25–34 years for both Indigenous (1,096 per 1,000) and non-Indigenous Australians (366 per 1,000).
• The rate of community mental health contacts for Aboriginal and Torres Strait Islanders aged 25–34 years was 3 times the rate of non-Indigenous Australians of the same age (Table 4.3).

59
649
266
420
233
0
200
400
600
800
Indigenous Non-Indigenous
Rate per 1,000
Males
Females
Notes:
1. These data should be interpreted with caution due to likely under- identification of Indigenous Australians. For more information, see Appendix 1 of Mental health services in Australia 2005–06.
2. Rates were directly age-standardised to the Australian population at 30 June 2001.
Source: National Community Mental Health Care Database, AIHW.
Figure 4.2: Community mental health service contacts by Indigenous status and sex, 2005–06
• Indigenous male clients (649 per 1,000) had a much higher rate of service contacts with
community mental health services than Indigenous females (420 per 1,000). Although the same was found in the non-Indigenous population, the difference was not as large (Figure 4.2).
Residential mental health care Residential mental health care is one of the services provided through community mental health care services. In 2005–06, Indigenous Australians had 64 episodes of residential mental health care. Age-standardised rates show that Indigenous Australians were 1.5 times more likely to require episodes of residential mental health care than non-Indigenous Australians (Table 4.4).

60
Table 4.4: Episodes of residential mental health care by Indigenous status(a) and age group, 2005–06
Indigenous Australians Other Australians
Age group Number Per cent Rate (per 10,000)(b) Number Per cent
Rate (per 10,000)(b)
Rate ratio
Less than 15 years 0 0.0 0.0 21 0.9 0.0 0.0
15–24 years 13 20.3 0.2 257 11.0 1.0 0.2
25–34 years 25 39.1 4.7 668 28.5 2.2 2.1
35–44 years 12 18.8 2.0 506 21.6 1.6 1.3
45–54 years 9 14.1 3.0 333 14.2 1.2 2.5
55–64 years 3 4.7 0.5 196 8.4 0.9 0.6
65 years and over 2 3.1 0.0 245 10.4 0.4 0.0
Total episodes(c) 64 100.0 1.7 2,345 100.0 1.1 1.5
(a) These data should be interpreted with caution due to likely under-identification of Indigenous Australians. For more information, see Appendix 1 of Mental health services in Australia 2005–06.
(b) Rates were directly age-standardised to the Australian population at 30 June 2001.
(c) Includes episodes for which age is unknown.
Source: National Residential Mental Health Care Database, AIHW.
• Both Indigenous and other Australians aged 25–34 years had more episodes of residential mental health care than all other age groups.
• The rate of episodes of residential mental health care for Indigenous Australians aged 45–54 years was 2.5 times the rate for non-Indigenous Australians of the same age (Table 4.4).

61
24
43
1614
2
7
27 27
13
27
0
10
20
30
40
50
15–24 25–34 35–44 45– 54 55+
Age group (years)
Per cent
Male
Female
Notes:
1. These data should be interpreted with caution due to likely under-identification of Indigenous Australians. For more information, see Appendix 1 of Mental health services in Australia 2005–06.
2. Rates were directly age-standardised to the Australian population at 30 June 2001.
Source: National Community Mental Health Care Database, AIHW.
Figure 4.3: Percentage distribution of residential mental health care episodes by sex, Indigenous persons aged 15 years and over, 2005–06
• Episodes of residential mental health care were much more frequent for Indigenous
males aged 25–34 years than Indigenous females of the same age. • Across all other age categories, Indigenous females were more likely to report episodes
of residential mental health care than Indigenous males (Figure 4.3).
Key findings • In 2005–06 the rate of mental health service contacts was twice as high for Indigenous as
non-Indigenous Australians. Furthermore, Indigenous Australians were 1.5 times as likely as non-Indigenous Australians to require residential mental health care.
• Indigenous males had a higher rate of service contacts for community mental health services than females.
4.3 Supported Accommodation Assistance Program National Data Collection
The AIHW is responsible for the Supported Accommodation Assistance Program (SAAP) National Data Collection (NDC). The aim of SAAP is to provide transitional accommodation and support services to help people who are homeless and/or in crisis to achieve the maximum possible degree of self reliance and independence. SAAP offers a range of support services which are tailored to suit the client’s needs, such as housing, financial support, personal support, and specialist services (AIHW 2007a).

62
The reason for seeking assistance and the type of service provided defines the support period received by the client. For example, mental health-related closed support periods are those that had finished on or before 30 June of the reporting year for which one of the following were reported: the referral source is a psychiatric unit or the reason for seeking assistance is either mental health issues or psychiatric illness; either psychological or psychiatric services were identified by the agency as either needed, provided or referred; the accommodation type either before or after the support period was a psychiatric institution (AIHW 2007a).
This section includes data on clients with mental health-related closed support periods. Data is presented as weighted data, meaning that attempts have been made to adjust for the undercount of support periods due to non-participation of some agencies and the non-consent of some SAAP clients to the provision of their data. This allows for a more accurate estimation of the number of mental health-related closed support periods provided by SAAP and allows comparisons of this data to be made against other data published from the SAAP Client Collection (AIHW 2007a). (For further information refer to Appendix B.)
SAAP mental health-related closed support periods In 2005–06, there were 21,900 mental health-related closed support periods provided by SAAP agencies in Australia. For those support periods for which the Indigenous status of the client was known, 11% were provided to people of Aboriginal or Torres Strait Islander origin. Over half of all mental health-related closed support periods in 2005–06 were provided to Indigenous and non-Indigenous clients aged 25–44 years of age (54% and 55%, respectively).
Aged standardised rates indicate that in 2005–06 there was one non-Indigenous mental health-related closed support period for every 5 Indigenous mental-health related closed support periods. For clients aged 65 years and over, the rates for Indigenous clients were more than 7 times the rate of non-Indigenous clients (Table 4.5).
Indigenous clients with mental health-related closed support periods were more likely to be female than male (637 per 100,000 and 351 per 100,000, respectively). The rate of Indigenous females who had a mental health-related closed support period was 6.9 times higher than the rate for non-Indigenous females (Table 4.5).

63
Table 4.5: SAAP clients with mental health-related closed support periods: demographic characteristics, 2005–06
Indigenous Non-Indigenous
Client Demographics Per cent
Rate (per 100,000 population)(a) Per cent
Rate (per 100,000 population)(a) Rate ratio
Age Less than 15 years 4.0 54.1 1.5 7.3 7.5
15–19 15.9 714.9 12.7 177.2 4.0
20–24 16.4 899.5 12.4 165.6 5.4
25–44 54.3 988.1 54.8 178.8 5.5
45–64 9.0 345.7 17.4 65.6 5.3
65 years and over 0.4 65.0 1.2 8.5 7.7
Sex
Male 33.0 350.7 51.7 98.8 3.5
Female 66.8 636.7 48.3 92.5 6.9
Total(c) 100.0 498.0 100.0 95.4 5.2
Total no. of people(b)(c) 2,500 . . 19,400 . . . .
Notes:
1. All proportions and rates are calculated using non-rounded figures.
2. All proportions and rates do not include those mental health-related closed support periods for which age, sex or Indigenous status was missing and/or not reported.
(a) Rates by sex were directly age-standardised using the 2001 Australian Standard population.
(b) Includes missing and/or not reported responses. Excludes 1,142 support periods for whom Indigenous status was unknown.
(c) Total number rounded to the nearest 50.
Source: Supported Accommodation Assistance Program Client Collection.
Type of SAAP service provided Of the mental health-related closed support periods provided to Indigenous SAAP clients in 2005–06, 68% involved supported accommodation services while 32% involved a range of other support services. On the other hand, 55% of non-Indigenous SAAP clients received supported accommodation and 45% received other services. The age standardised rate of Indigenous clients who received accommodation during a mental health related support period was more than 6 times higher than the rate for non-Indigenous SAAP clients (340 per 100,000 and 53 per 100,000, respectively) (Table 4.6). (Definitions of service types are included in Appendix B.)

64
Table 4.6: SAAP mental health-related closed support periods, by service type, 2005–06
Indigenous Non-Indigenous
Per cent Rate (per
100,000)(a) Per cent Rate (per
100,000)(a) Rate ratio
Supported accommodation 68.4 339.8 55.0 52.8 6.4
Other support 31.6 158.4 45.0 43.0 3.7
Total(b) 100.0 498.2 100.0 95.8 5.2
Total no. of people(b)(c) 2,500 . . 19,400 . . . .
(a) Rates were directly age-standardised using the 2001 Australian Standard Population.
(b) Includes missing and/or not reported responses. Excludes 1,142 support periods for whom Indigenous status was unknown.
(c) Total number rounded to the nearest 50.
Notes:
1. All proportions and rates are calculated using non-rounded figures.
2. All proportions and rates do not include those mental health-related closed support periods for whom age or Indigenous status was missing and/or not reported.
Source: Supported Accommodation Assistance Program Client Collection.
Key findings • The age standardised Indigenous rate of SAAP closed support periods that were
mental-health related was 5 times the rate of non-Indigenous Australians. • The rate of Indigenous females with a mental health related closed support period was
nearly 7 times higher than the rate for non-Indigenous females.
4.4 Commonwealth State/Territory Disability Agreement National Minimum Data Set Specialist support services are provided to eligible persons with a disability through the Commonwealth State/Territory Disability Agreement. The data presented in this section cover service users with a psychiatric disability. The information has been extracted from the CSTDA National Minimum Data Set, which is a collation of data on specialist disability support services that receive CSTDA funding (see Appendix B for more details).
The types of CSTDA-funded services provided to people with disabilities can be grouped into five main categories reported in the CSTDA NMDS: accommodation support, community support, community access, respite, and employment services (advocacy, information and print disability and other support services are not required to collect data and are therefore not reported in national data).
The accommodation support category can be further broken down into accommodation support that is broadly regarded as a residential service and other accommodation support that is non-residential in nature. • Four accommodation support types provide support to people living in CSTDA-funded
accommodation—including large residential institutions, small residential institutions, hostels and group homes, i.e. ‘residential’ accommodation support.
65
• Other types of accommodation support, broadly classified as ‘non-residential’, provide support to people living in their own home or with an alternative family placement (definitions provided in Appendix B).
This section compares CSTDA service users with psychiatric disability who received residential accommodation support (with or without other CSTDA services) to service users with psychiatric disability who did not use residential accommodation support. This latter group includes people who used non-residential accommodation support (with or without other CSTDA services) and people who did not use any accommodation support services but used other types of CSTDA services.
In 2005–06 there were 7,182 Aboriginal and Torres Strait Islander people who used CSTDA-funded services, representing 3% of all service users. The Indigenous status of 23,156 service users (11%) was unknown.
Between July 2005 to June 2006, there were 1,216 Indigenous service users with a psychiatric disability, including those who reported psychiatric disability as a primary disability and others with psychiatric conditions as ‘other significant’ disability. This group represented 17% of all Indigenous service users in 2005-06. A similar proportion of other Australians who used CSTDA services had psychiatric disability as a primary or other significant disability (Appendix Table F4).
Rates of service use • There were 1,185 Indigenous non-residential service users and 98 Indigenous residential
service users with a psychiatric disability in 2005–06 (Table 4.7). • The age standardised rate for Indigenous persons with a psychiatric disability who used
residential accommodation support services was 1.9 times the rate for non-Indigenous persons. The rate for Indigenous persons with a psychiatric disability who used non-residential support services was 1.6 times the rate of non-Indigenous persons.
Table 4.7: CSTDA funded service users with a psychiatric disability by Indigenous status and sex, 2005–06
Indigenous Other
Number Rate (per 1,000)(a) Number Rate (per 1,000)(a) Rate ratio
Non-residential service users
Males 662 3.2 20,673 2.1 1.6
Females 523 2.6 15,382 1.5 1.7
Persons 1,185 2.9 36,124 1.8 1.6
Residential service users
Males 57 0.3 1,629 0.2 1.9
Females 41 0.2 1,231 0.1 1.9
Persons 98 0.3 2,861 0.1 1.9
(a) Directly age-standardised using the 2001 Australian standard population.
Note: Includes service users who had a psychiatric disability as their main disability or as an ‘other significant’ disability. Service users may have used both residential (service types 1.01–1.04) and non-residential (all other service types) services so may be counted in both groups.
Source: AIHW analysis of data from the 2005–06 Commonwealth State/Territory Disability Agreement NMDS.

66
Sex and age • Males with a psychiatric disability used residential and non-residential services at
higher rates than females, for both Indigenous and other groups (Table 4.7).
• The majority of both Indigenous and non-Indigenous users of non-residential services with a psychiatric disability were aged between 25 and 44 years (Table 4.8).
• Residential service users with a psychiatric disability were older than non-residential service users, with the majority of Indigenous and non-Indigenous users aged between 35 and 54 years.
Table 4.8: CSTDA funded service users with a psychiatric disability by Indigenous status by age, 2005–06
Indigenous Other
Age group Number Per cent Rate
(per 1,000)(a) Number Per cent Rate
(per 1,000)(a)
Non residential care
Less than 15 years 42 3.5 0.2 663 1.8 0.2
15–24 years 230 19.4 2.3 4,609 12.8 1.7
25–34 years 309 26.1 4.2 8,636 23.9 3.1
35–44 years 312 26.3 5.0 9,330 25.8 3.1
45–54 years 196 16.5 4.7 7,709 21.3 2.8
55–64 years 75 6.3 3.4 3,569 9.9 1.6
65 years and over 21 1.8 1.5 1,586 4.4 0.6
Total persons(b) 1,185 100.0 2.9 36,124 100.0 1.8
Residential care
Less than 15 years 2 2.0 0.0 7 0.2 0.0
15–24 years 11 11.2 0.1 147 5.1 0.1
25–34 years 22 22.4 0.3 468 16.4 0.2
35–44 years 31 31.6 0.5 797 27.9 0.3
45–54 years 20 20.4 0.5 786 27.5 0.3
55–64 years 9 9.2 0.4 487 17.0 0.2
65 years and over 3 3.1 0.2 169 5.9 0.1
Total persons(b) 98 100.0 0.3 2,861 100.0 0.1
(a) Rates for total persons are directly age-standardised using the 2001 Australian standard population.
(b) Includes service users who had a psychiatric disability as their main disability or as an ‘other significant’ disability. Service users may have used both residential (service types 1.01–1.04) and non-residential (all other service types) services so may be counted in both groups.
Source: AIHW analysis of data from the 2005–06 Commonwealth State/Territory Disability Agreement NMDS.
Types of services Non-residential CSTDA-funded services provided to service users include: in-home accommodation support; community support; community access; respite services;

67
employment support services: and advocacy, information and print disability and other support (definitions provided in Appendix B). • There were 1,185 Indigenous service users and 36,124 other Australian service users with
a psychiatric disability who accessed non-residential CSTDA-funded services during 2005–06.
• During 2005–06, 33% of Indigenous non-residential service users with a psychiatric disability accessed accommodation support. There were also 33% who accessed employment support services. A large proportion of these non-residential service users also used community access services and community support services.
• Just under half (47%) of other Australian non-residential service users with a psychiatric disability also accessed employment support services, and just over one third (34%) used community access services (Table 4.9).
Table 4.9: CSTDA-funded non-residential service users with a psychiatric disability, by non-residential service type, 2005-06(a)
Indigenous Other Australians(b)
Non-Residential service type Number Per cent Number Per cent
Accommodation support 391 33.0 7,407 20.5
Community support 315 26.6 5,391 14.9
Community access 351 29.6 12,375 34.3
Respite 168 14.2 3,701 10.2
Employment 385 32.5 16,869 46.7
Total 1,185 100.0 36,124 100.0
(a) Financial year reporting.
(b) Includes non-Indigenous and not stated Indigenous status.
(c) Non-residential service users include those accessing all service except service types 1.01–1.04.
Note: Components may add to more than the total as service users may have accessed more than one service type during the financial year.
Source: AIHW analysis of 2005–06 Commonwealth State/Territory Disability Agreement NMDS.
• During 2005–06, there were 98 Indigenous and 2,861 other Australian CSTDA-funded residential service users with a psychiatric disability.
• Of the Indigenous service users who accessed residential services during 2005–06, the majority (77%) accessed group homes, while 19% accessed large institutions, 3% accessed small institutions and 2% accessed hostels.
• Other Australian service users were also most likely to access group homes (69%), followed by large institutions (27%), hostels (3%) and small institutions (2%) (Table 4.10).

68
Table 4.10: CSTDA-funded residential service users with a psychiatric disability, by residential service type, 2005-06(a)
Indigenous Other(b)
Residential service type Number Per cent Number Per cent
Large institution 19 19.4 765 26.7
Small institution 3 3.1 66 2.3
Hostels 2 2.0 90 3.1
Group homes 75 76.5 1,986 69.4
Total 98 100.0 2,861 100.0
(a) Financial year reporting.
(b) Includes non-Indigenous and not stated.
Note: Components may add to more than the total as service users may have accessed more than one service type during the financial year.
Source: AIHW analysis of 2005–06 Commonwealth State/Territory Disability Agreement NMDS.
Key findings • The age standardised rate for Indigenous persons with a psychiatric disability who
accessed residential accommodation support services was 1.9 times the rate for non-Indigenous persons.
• The rate for Indigenous persons with a psychiatric disability who accessed non-residential support services was 1.6 times the rate of non-Indigenous persons.
• Males with a psychiatric disability used residential and non-residential services at higher rates than females, for both Indigenous and other Australians.
4.5 Bettering the Evaluation and Care of Health Survey GPs provide a range of services to people with mental health problems. Information about general practice encounters is available from the BEACH survey of general practice activity. This survey collects information on general practice activity from a random sample of approximately 1,000 GPs across Australia each year (see Appendix B for more information about the survey).
Data for the five year period 2002–03 to 2006–07 are presented below. Mental health-related problems (psychological problems) were the sixth most common type of problems managed at GP encounters with Aboriginal and Torres Strait Islander patients during this period. • In the period 2002–03 to 2006–07 there were 7,542 GP encounters with Aboriginal and
Torres Strait Islander patients recorded in the survey, at which 11,219 problems were managed. Of these, 9.7% (1,088) were mental health related problems (AIHW 2008).
• Depression was the most common mental health–related problem managed at GP encounters with Indigenous patients, followed by drug misuse (licit or illicit), anxiety and sleep disturbance (Table 4.11).
• Mental health-related problems were managed at a rate of 14.4 per 100 GP encounters with Indigenous patients (Appendix Table F1).

69
• After adjusting for differences in age distribution, mental health–related problems were managed at GP encounters with Indigenous patients at a similar rate to encounters among other patients (Table 4.11).
• Alcohol misuse, drug abuse and tobacco misuse were managed at GP encounters with Indigenous patients at around three times the rate of encounters with other patients.
• Schizophrenia was also more commonly managed at GP encounters with Indigenous patients than with other patients (at around twice the rate).
Further information is provided in Appendix Table F1.
Table 4.11: Most frequently reported mental health-related problems managed by general practitioners, by Indigenous status, 2002–03 to 2006–07 (a)(b)(c)
Number
Percent of total problems
Age standardised rate per 100 encounters
Problem managed Indigenous Other(d) Indigenous Other(d) Indigenous(e) Other(d)(e) Ratio(f)
Depression (P03, P76) 272 19,216 2.4 2.7 3.3 3.9 0.8
Drug abuse (P19) 148 2,354 1.3 0.3 1.5 0.5 3.0
Anxiety (P01, P74) 115 8,600 1.0 1.2 1.4 1.8 0.8
Sleep disturbance (P06) 97 7,847 0.9 1.1 1.3 1.6 0.8
Alcohol misuse (P15, P16) 83 1,685 0.7 0.2 0.9 0.3 2.7
Schizophrenia (P72) 75 2,203 0.7 0.3 0.8 0.5 1.9
Tobacco misuse (P17) 65 1,618 0.6 0.2 0.8 0.3 2.5
Acute stress reaction (P02) 58 2,932 0.5 0.4 0.8 0.6 1.3
Affective psychosis (P73) 20 892 0.2 0.1 0.2 0.2 1.1
Dementia (P70) 14 2,439 0.1 0.3 0.7 0.5 1.5
Other(g) 141 6,694 1.3 0.9 1.6 1.4 1.2
Total mental health 1,088 56,480 9.7 7.8 13.5 11.6 1.2
(a) These survey results are likely to undercount the number of Indigenous Australians visiting doctors. (b) Combined financial year data for 5 years. (c) Data for Indigenous and Other Australians have not been weighted. (d) Includes non–Indigenous patients and patients for whom Indigenous status was ‘not stated’. (e) Directly age standardised rate per 100 encounters. Figures do not add to 100 as more than one problem can be managed at each
encounter.
(f) Rate ratio- Indigenous: Other. (g) ICPC–2 codes: P04–P05, P07–P13, P18, P20, P22–P25, P27–P29, P71, P75,P77–P82, P85–P86, P98–P99.
Source: AIHW analysis of BEACH data.
4.6 Western Australian Aboriginal Child Health Survey The WAACHS was a large-scale investigation into the physical health, social and emotional wellbeing of 5,289 Western Australian Aboriginal and Torres Strait Islander children aged 0–17 years. It was undertaken in 2000 and 2001 by the Telethon Institute for Child Health Research through its Kulunga Research Network, a collaborative maternal and child health research, information and training network.

70
The second volume of findings from the WAACHS explored some of the key issues surrounding the social and emotional wellbeing of Aboriginal and Torres Strait Islander children. In particular, information was collected about difficulties with emotions and feelings, self-harm or attempted suicide, cultural engagement, experience of loss or trauma, substance or alcohol use, family violence and child abuse (Zubrick et al. 2005). Key findings from this second volume are presented below.
Emotional and behavioural health The Strengths and Difficulties Questionnaire (SDQ) is a widely used measure of emotional and behavioural difficulties, such as conduct problems, hyperactivity, peer problems and anti-social behaviour. The SDQ was used in the WAACHS to measure the prevalence of these problems within the young Indigenous population of Australia, Before the questionnaire was administered, however, a series of modifications were necessary to ensure that the measure was culturally appropriate. In particular, changes to the wording of items and to the response scale were made using language that was familiar to the Aboriginal and Torres Strait Islander population (Zubrick et al. 2005).
In order to provide a benchmark for comparing the SDQ results from the WAACHS, SDQ data were also collected from a sample of 1,200 non-Indigenous children aged 4–17 years in 2004, using computer-assisted telephone interviewing. Details on the SDQ items, response scale, and scoring procedure are provided in the report The Western Australian Aboriginal Child Health Survey: the social and emotional wellbeing of Aboriginal children and young people (Zubrick et al. 2005).
The survey found that over a quarter (26%) of Aboriginal children aged 4–11 years were at high risk of clinically significant emotional and behavioural problems (26%), and a further 21% of those aged 12–17 years were classified at the same risk level. Non-Indigenous children in these age groups were significantly less likely to be classified at high risk of developing emotional and behavioural difficulties (Figure 4.4) (Zubrick et al. 2005).
Indigenous males aged 4–17 years were significantly more likely than Indigenous females of the same age to demonstrate behaviours associated with a high-risk level of emotional and behavioural difficulties (Zubrick et al. 2005).
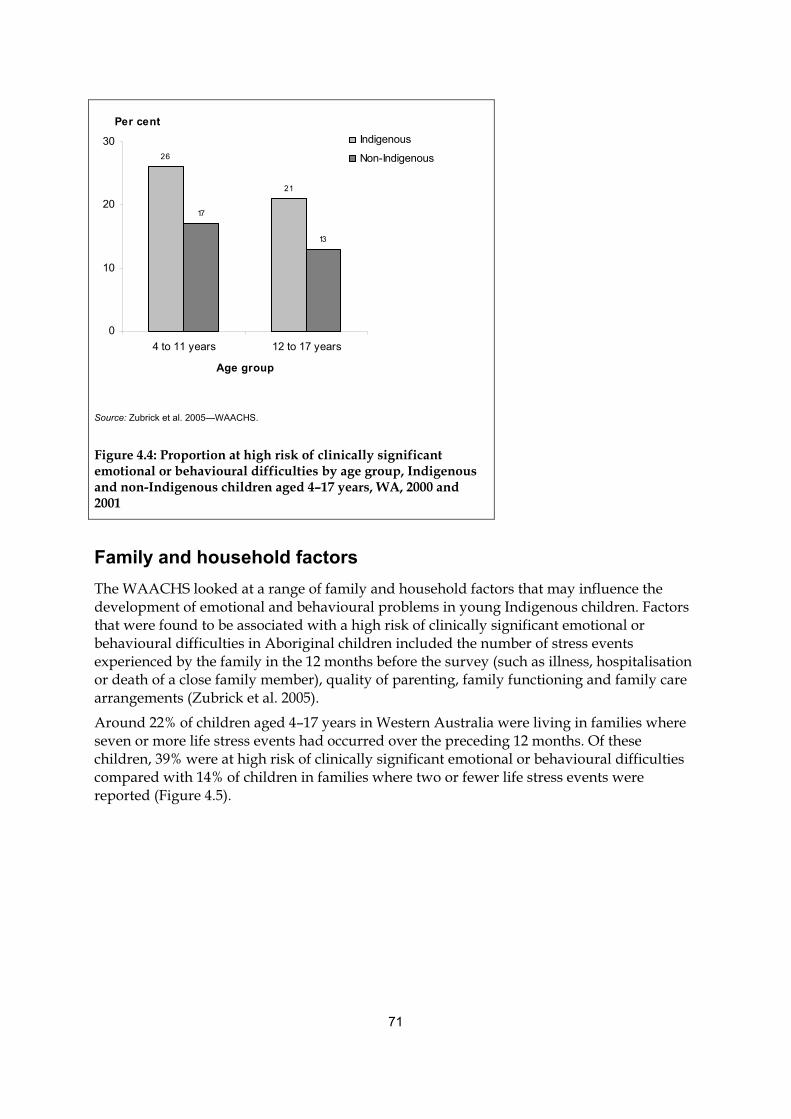
71
26
21
17
13
0
10
20
30
4 to 11 years 12 to 17 years
Age group
Per centIndigenous
Non-Indigenous
Source: Zubrick et al. 2005—WAACHS.
Figure 4.4: Proportion at high risk of clinically significant emotional or behavioural difficulties by age group, Indigenous and non-Indigenous children aged 4–17 years, WA, 2000 and 2001
Family and household factors The WAACHS looked at a range of family and household factors that may influence the development of emotional and behavioural problems in young Indigenous children. Factors that were found to be associated with a high risk of clinically significant emotional or behavioural difficulties in Aboriginal children included the number of stress events experienced by the family in the 12 months before the survey (such as illness, hospitalisation or death of a close family member), quality of parenting, family functioning and family care arrangements (Zubrick et al. 2005).
Around 22% of children aged 4–17 years in Western Australia were living in families where seven or more life stress events had occurred over the preceding 12 months. Of these children, 39% were at high risk of clinically significant emotional or behavioural difficulties compared with 14% of children in families where two or fewer life stress events were reported (Figure 4.5).

72
77
65
48
912 1314
23
39
0
20
40
60
80
100
0 to 2 3 to 6 7 to 14
Number of life stress events
Per cent
Low
Moderate
High
Source: Zubrick et al. 2005—WAACHS.
Figure 4.5: Risk of clinically significant emotional or behavioural difficulties by number of life stress events in the previous 12 months, WA, 2000- 2001 (per cent)
Social and emotional wellbeing Unlike the items assessing emotional and behavioural difficulties in young Aboriginal and Torres Strait Islanders that were asked of the child’s closest carer, information on the social and emotional wellbeing of Indigenous young people aged 12–17 years was self-reported data. Information on self-esteem and suicidal behaviour were among the topics covered, and links between these outcomes and certain health risk behaviours were made (Zubrick et al. 2005).
Self-esteem In the WAACHS, self-esteem was understood as internalised self image, feelings of self worth and efficacy, and was known as a cause and consequence of many emotional or behavioural difficulties. Self-esteem was measured using a scale specifically designed for the WAACHS from which an overall level of self-esteem was derived (details on the content and scoring procedure of this scale are provided in the report The Western Australian Aboriginal Child Health Survey: the social and emotional wellbeing of Aboriginal children and young people). Overall, Indigenous female youth (aged 12-17 years) were more likely to have low levels of self-esteem than their male counterparts (32% and 21% respectively). Low self-esteem meant they had a self-esteem score in the lowest quartile. Twenty-seven per cent of all Indigenous young people had a high level of self-esteem (that is, a self-esteem score in the highest quartile), with the percentage for females at 24% and the percentage for males at 30% (Zubrick et al. 2005).
73
Suicidal behaviour In support of the link between social and emotional wellbeing and suicide, over one-third (37%) of young Indigenous people in Western Australia who were at high risk of clinically significant emotional or behavioural difficulties had thought about ending their own life. Furthermore, the proportion of Indigenous youth who had suicidal thoughts was highest among those who had a low level of self-esteem (25%) compared with those youth with high self-esteem (9%).
Health risk behaviours Indigenous youth aged 12–17 years were also asked about their experience with a series of health risk behaviours that can play an important role in the social and emotional development of young people. These include things such as cigarette smoking, alcohol and drug use, sexual knowledge and experience, bullying and racism (Zubrick et al. 2005). • More than one-third (35%) of Indigenous youth had smoked cigarettes regularly (daily
for at least a month). • Overall, 27% of Aboriginal and Torres Strait Islander youth said they drank alcohol, and
nearly half (46%) of these respondents had drunk to excess in the last six months (as measured by any occurrence of alcohol-induced vomiting).
• Over one-quarter of the Western Australian Indigenous population aged 12–17 years said they had had sex (28%) and 18% had not used any method of contraception the last time they had sex.
• More than 1 in 5 Indigenous youth (22%) reported experiencing racism in the six months before interview (Zubrick et al. 2005).
Key findings • Overall, Indigenous Western Australian youth aged 4–17 years were 1.6 times as likely
as non-Indigenous youth in this age group to be at high risk of clinically significant emotional or behavioural problems.
• Factors strongly associated with the social and emotional development of young people included self-esteem, family functioning and life stress events, cigarette and alcohol use, bullying and racism.

74
5 Stakeholder workshop on the interim module
In November 2006 the AIHW convened a workshop on the interim social and emotional wellbeing module. The workshop was held to examine the 2004–05 NATSIH data on social and emotional wellbeing and to seek stakeholder views on how well the interim module had worked and how it could be improved. The workshop also discussed new measures that could be included in the next version of the social and emotional wellbeing module to be used in the 2010–11 NATSIHS.
The workshop was attended by representatives from the National Advisory Group on Aboriginal and Torres Strait Islander Health Information and Data, the Office of Aboriginal and Torres Strait Islander Health, the ABS and the NACCHO; as well as state and territory government officials, academics and researchers.
The 2006 workshop confirmed the value, importance and general feasibility of measuring aspects of social and emotional wellbeing for Aboriginal and Torres Strait Islander peoples, and made a number of recommendations to improve the interim module. The workshop also identified the importance of ensuring that measurement instruments not only capture information that is of particular relevance to Aboriginal and Torres Strait Islander peoples, but also retain comparability with the non-Indigenous population where appropriate so that progress and change can be monitored.
5.1 Assessment of the eight domains of the interim module The workshop examined the eight domains of the module in detail and made a number of recommendations on how they could be improved. The workshop supported the retention of all eight domains, but made recommendations on how six of the domains (psychological distress, impact of psychological distress, anger, life stressors, discrimination and cultural identification) could be improved. The outcomes of the workshop are summarised in Table 5.1.

75
Table 5.1: Summary of the outcomes of the 2006 workshop in relation to the interim social and emotional wellbeing module
Social and wellbeing module domain Outcomes and issues
Domain supported
Issues yes/no
Psychological distress (K-5)
The workshop supported the K-5 measure. It was suggested that consideration be given to expanding the domain to include all the K-10 items.
Y Y
Impact of psychological distress
The workshop discussed retaining this domain, but ‘refining’ the questions to capture the issues around social and emotional wellbeing more widely.
Y Y
Positive wellbeing The workshop supported the positive wellbeing questions. It was noted however that the concepts covered may differ between age groups and between cultures.
Y N
Anger This domain should be retained, but needs more work and refinement because of the following issues:
• The manifestation of anger can be a positive response, and this should be recognised when interpreting the data. Anger has a potentially positive relationship with resilience. To capture this, the workshop suggested collecting contextual information, and including a self-efficacy measure.
• It may also be desirable to include a question on anger among the community, to ensure that feelings in the community are captured, and to supplement the questions on individuals.
Y Y
Life stressors This domain should be retained, but needs more work and refinement, taking into consideration the following issues:
• There is a need to separately capture individual stressors and those affecting other people and the whole community.
• As with anger, there is a need to look at stress in context—need to capture how people manage and cope with stress, and what makes people strong/weak in different communities. Destruction of country around sacred sites (e.g. through mining), loss of rights and language, loss of culture and associated assimilation are all major stressors that need to be captured.
Y Y
Discrimination The workshop agreed that this is a very important measure to retain, but queried whether the questions adequately captured the experience of discrimination. The data show a much lower level of discrimination than expected (16% ‘general’ discrimination, and 4% discrimination in health care).
It was agreed that the current definitions were too narrow and that the concept of discrimination should be expanded to capture oppression and racism.
Y Y
Cultural identification
The workshop agreed that it was important to retain this domain, but that there is a need to better capture cultural attachment. Some suggested concepts to capture were connection to country, family, spirituality, and identity, and the ways these may sustain or impact on wellbeing.
Y Y
Removal from natural family
The workshop agreed that this domain was very important and should be retained.
Y N
5.2 Additional areas to explore As well as amendments to the existing domains in the social and emotional wellbeing module, the workshop also suggested new items that could be explored for inclusion in the next version of a social and emotional wellbeing module to be used in the 2010–11 NATSIHS. The workshop recommended that the following areas should be examined in more detail for suitability of inclusion in the next social and emotional wellbeing module:

76
• sense of mastery and control of one’s life as an important determinant of physical and mental wellbeing
• resilience and other protective factors such as continuum of identity, coping skills, connection to land, country and heritage
• the concept of spirituality • isolation and loneliness • other ‘social’ wellbeing measures, such as family and community cohesion • a SDQ for children, similar to the one used in the WAACHS • mental health diagnoses, such as anxiety or depression, as categories under health
conditions.
5.3 Other outcomes of the workshop The workshop discussed a number of related issues and noted the following: • the need for clarity on what is being measured and why • the need to distinguish between mental health and social and emotional wellbeing • the concept of wellbeing needs further definitional work • the need for the collection of relevant local level data • the importance of returning data on Aboriginal and Torres Strait Islander peoples to
communities in a meaningful way.

77
6 Conclusions and recommendations
The need to create measures of social and emotional wellbeing for Indigenous Australians to be used in the 2004–05 NATSIHS resulted in the development of the interim module of social and emotional wellbeing. This was an important first step in developing such measures; however, it is also recognised that further work on the module is required if it is to effectively capture the concept of social and emotional wellbeing among Indigenous Australians, as well as allowing comparisons with non-Indigenous Australians.
This report represents the next step in developing the social and emotional wellbeing module. The report assesses the utility of the interim module through four main processes—analysing the data on social and emotional wellbeing from the 2004–05 NATSIHS, internally validating the eight domains, providing data on social and emotional wellbeing from other data sources, and obtaining stakeholder views on how well the interim module worked and how it could improved. The report therefore attempts to answer the following questions: • What were the key findings on Indigenous social and emotional wellbeing from using
the interim module in the 2004–05 NATSIHS? (Chapter 2) • Were the eight domains internally valid when tested against each other and against
other relevant NATSIHS variables? (Chapter 3) • What were the key findings on Indigenous social and emotional wellbeing from other
data sources, and did they externally validate the interim module?( Chapter 4) • What were the recommendations from the stakeholder workshop in relation to the
interim module? (Chapter 5)
This final chapter brings together the findings from each chapter to provide an overall assessment of each of the eight domains in the interim module. The final section of the chapter provides the recommendations for improving the social and emotional wellbeing module for Aboriginal and Torres Strait Islander peoples.
6.1 Overall assessment of the eight domains
Psychological distress (K-5)
Key findings from the interim social and emotional wellbeing module Analysis of the psychological distress domain showed that, in 2004–05, around one-quarter (27%) of Aboriginal and Torres Strait Islander adults reported feelings associated with high or very high levels of psychological distress. After taking into account differences in the relative size and age structure of the two populations, Indigenous Australians were twice as likely as non-Indigenous Australians to report high or very high levels of psychological distress (27% compared with 13%, respectively).
Result of the internal validation The psychological distress domain was assessed as internally valid.

78
For example, respondents who reported higher levels of psychological distress were more likely to report that they had been unable to work or carry out their normal activities because of their distress. In addition, as the level of psychological distress increased, the percentage of Indigenous people who reported feeling each of the positive wellbeing measures ‘all’ or ‘most of the time’ decreased.
Results of the external validation Most of the other data sources analysed in this report (Chapter 4) confirm the finding that Indigenous Australians are more likely than other Australians to experience psychological distress. For example, the rate of community mental health service contacts for Indigenous people was twice that of non-Indigenous people, and there were 1.5 times more residential mental health care episodes for Indigenous Australians than for non-Indigenous Australians. The finding is also confirmed by the SAAP data—the rate of mental health-related closed support periods for Aboriginal and Torres Strait Islander peoples was 5 times that for non-Indigenous people. Aboriginal and Torres Strait Islander peoples were also twice as likely to be hospitalised for intentional self-harm as non-Indigenous people.
Results from the 2000-01WAACHS showed that over one-quarter (26%) of Aboriginal children aged 4–11 years were at high risk of clinically significant emotional and behavioural problems, and a further 21% of those aged 12–17 years were classified at the same risk level. On the other hand, non-Indigenous children in these age groups were significantly less likely to be classified at high risk of developing emotional and behavioural difficulties (17% and 13%, respectively). Indigenous female youth were more likely to have low levels of self-esteem than their male counterparts, meaning they had a self-esteem score in the lowest quartile (32% and 21% respectively).
Recommendations from the workshop The workshop supported the K-5 measure, but also made the suggestion that this domain could be expanded to include all the K-10 items.
Conclusion • The K-5 was assessed as being a good measure of psychological distress, and should be
included in future versions of the social and emotional wellbeing module. • Consideration should be given to including the full K-10 in future versions of the
module to allow direct comparisons with non-Indigenous people from the NHS.
Impact of psychological distress
Key findings from the interim social and emotional wellbeing module Analysis of the impact of psychological distress domain showed that among Indigenous adults with a psychological distress score of 6 or more, 21% reported that in the previous 4 weeks there had been at least 1 day in which they had been unable to carry out normal activities due to their feeling of distress, and 12% reported seeing a doctor or other health professional due to psychological distress over the same period.

79
Result of the internal validation The impact of psychological distress domain was assessed as internally valid.
The validation found, however, that consideration should be given to changing the requisite level of psychological distress as measured by the K-5 which determines whether the respondent is asked the impact questions. These questions are currently asked of all those with any level of psychological distress, including those with low and very low levels. In future surveys, it is proposed that impact questions only be asked of those with at least moderate levels of distress (a K-5 score of 8 or above).
Result of the external validation According to the BEACH data, for every 100 GP encounters with patients who identified as Aboriginal or Torres Strait Islander, 14 encounters involved mental health-related problems. After adjusting for differences in the age structure of the two populations, mental health–related problems were managed at GP encounters with Indigenous patients at a similar rate to encounters among other patients (14 and 12 per 100 encounters, respectively).
In 2005–06, there were 247,263 contacts with community mental health services by Indigenous Australians, which represented a rate of service contacts of 532 per 1,000 Indigenous population, compared with 270 per 1,000 population for non-Indigenous Australians. In the same period, there were 64 episodes of residential mental health care for Indigenous Australians, representing a rate of 1.7 per 10,000 population, compared with a rate of 1.1 per 10,000 population for non-Indigenous Australians.
As these other data sources all use different counting units, it is unfortunately not possible to use these results to confirm the results from the NATSIHS question about seeing a doctor or other health professional due to psychological distress.
Recommendations from the workshop The workshop discussed retaining this domain, but refining the questions to capture broader information about social and emotional wellbeing.
Conclusion • The impact of psychological distress domain is a useful measure and should be included
in future versions of the social and emotional wellbeing module. • The cut-off K-5 score for asking questions on the impact of psychological distress should
be increased (from the current K-5 score of 6 or above), so that the impact questions are not asked of people with low levels of psychological distress.
• The impact questions should be refined to collect broader information about social and emotional wellbeing.
Positive wellbeing
Key findings from the interim social and emotional wellbeing module More than half of the adult Indigenous population reported being happy (71%), calm and peaceful (56%) and/or full of life (55%) all or most of the time in the 4 weeks prior to being interviewed, while nearly half (47%) said they had a lot of energy all or most of the time.

80
Result of the internal validation The positive wellbeing domain was assessed as internally valid.
The domain appears to be valuable in that it provides a positive counterbalance to the questions in the psychological distress domain, and gives respondents an opportunity to report positive emotions. The positive wellbeing items also allow cross-classificatory analysis with the psychological distress domain to assess its validity (an inverse relationship is expected), as well as other domains included in the social and emotional wellbeing module.
Result of the external validation There is not a lot of information on positive wellbeing that could be used to validate this domain. Somewhat relevant are the findings of the WAACHS which showed that 27% of young Indigenous people aged 12–17 years had high self-esteem, meaning they had a self-esteem score in the highest quartile. The proportion of young males with high self-esteem was 30%, and the figure for young females was 24%.
Recommendations from the workshop The workshop supported the positive wellbeing questions.
Conclusion The positive wellbeing domain is a useful measure and should be retained in future versions of the social and emotional wellbeing module.
Anger
Key findings from the interim social and emotional wellbeing module About one in six (16%) of adult Indigenous Australians indicated that, in the previous 4 weeks, they felt easily annoyed or irritated a lot of the time, 6% said they got into arguments a lot, 4% said that they had violent thoughts and/or shouted or threw things a lot, and 3% said they wanted to break or smash things a lot of the time.
Result of the internal validation The anger domain was assessed as valid.
The internal validation revealed that the three-choice response format performed well, in that significant differences were observed between the response options and in the comparison with other variables such as psychological distress and positive wellbeing.
It is important to note that the anger domain measures various manifestations of anger, but it is not intended to provide an overall ‘level of anger’ measure—considering this, the anger domain performed reasonably well and returned many of the expected relationships with other domains.
Recommendations from the workshop The workshop recommended that the anger domain be retained, but with more work and refinement because of the following issues:
81
• The manifestation of anger can be a positive response, and this should be recognised when interpreting the data. Anger has a potentially positive relationship with resilience.
• There is a need to collect contextual information to help in the interpretation of the findings.
Conclusion • The anger domain should be retained, but that more contextual information should be
collected and reported.
Life stressors
Key findings from the interim social and emotional wellbeing module Death of a family member or close friend was the stressor most commonly reported by respondents (42%), followed by serious illness or disability (28%), alcohol-related problems (20%) and a family member being sent to, or currently in, jail (19%).
While almost one-quarter of Indigenous respondents, their family and/or friends had experienced none of the specified stressors in the 12 months before interview (22%), more than one-quarter (27%) had experienced four or more of the specified stressors. The average number of stressors experienced was 2.6.
Result of the internal validation The life stressors domain was assessed as internally valid.
There are some issues that need to be considered. Firstly, although the life stressors domain performed well in terms of its associations with other variables (returning the expected relationships), the information would be more informative if those stressors experienced by the respondent could be reported separately from those experienced by their family/friends to allow for better sensitivity in the questions.
Secondly, there may be differences between cultures in what are regarded as stressors, and further work may be required to create a list of stressors that is appropriate and relevant for both Indigenous and non-Indigenous populations.
Recommendations from the workshop The workshop recommended that this domain be retained, but felt that it needed more work and refinement, taking into consideration the following issues: • It would be useful to separately capture individual stressors and those affecting other
people and the whole community. • As with anger, there is a need to look at stress in context, that is to capture how people
manage and cope with stress and what makes people strong or weak in different communities (resilience). For example, a respondent or community may experience a large number of stressors, but may have effective ways of dealing with them. As a result, the level of psychological distress experienced as a result of some stressors may be low.
• Stressors may differ between communities. For example, in one community overcrowded housing may be a major source of stress while in another community substance abuse may pose more of a problem. Destruction of country around sacred sites
82
(for example through mining), loss of rights and language, loss of culture and associated assimilation are all major stressors that need to be captured.
Conclusion • The life stressors domain should be retained and included in future versions of the social
and emotional wellbeing module. • There is a need to collect data and report separately the stressors experienced by the
respondent separately from the stressors experienced by family or friends.
Discrimination
Key findings from the interim social and emotional wellbeing module About one in six respondents (16%) respondents indicated that they had been treated badly in the previous 12 months because of their Indigenous origin.
When asked if they felt they were treated differently from non-Indigenous people when they sought health care in the previous year, the majority (83%) of Indigenous Australians indicated they had been treated the same, while 5% said they were treated better and 4% said they were treated worse.
Result of the internal validation Only one of the two parts of the discrimination domain was assessed as internally valid: • discrimination ‘in general’ was assessed as valid • discrimination ‘in health care’ performed less well.
The question that asked about the respondent’s experience with discrimination in general (as opposed to the question on discrimination in the health care setting) performed well—it produced a low rate of unknown/not stated responses (1%) and a number of statistically significant associations with other domains. However, in relation to the discrimination in health care setting, there were a large proportion of respondents who did not answer the question on discrimination when seeking health care (7%). It is hard to know whether this was due to the wording of the question or other factors. Also, the validation results showed only a couple of associations between this part of the discrimination domain and other domains.
Recommendations from the workshop The workshop agreed that this is a very important measure to retain, but definitions should be expanded, taking into consideration the following issue: • The data show a much lower level of discrimination than expected (16% ‘general’
discrimination, and 4% discrimination in health care), and the workshop agreed that it is likely that the current definitions are too narrow. It was suggested that this concept should be expanded to capture oppression and racism.

83
Conclusion The discrimination domain should be retained, but it requires further refinement and/or expansion in order to capture different forms of discrimination. The discrimination in health care question did not perform as well and could possibly be removed. • The discrimination domain should be retained and included in future versions of the
social and emotional wellbeing module. • Further refinement and expansion of the discrimination domain should be undertaken to
ensure that it captures a broader definition of discrimination, including oppression and racism.
• The discrimination in health care question did not perform well. This part of the domain could be removed or the wording of the question be reviewed.
Cultural identification
Key findings from the interim social and emotional wellbeing module Nearly half of the Indigenous people who lived in non-remote areas (46%) said they identified with a tribal group, language group or clan. Six out of 10 Indigenous adults in non-remote areas (60%) said that they recognised a specific area as their homelands or traditional country. Of those individuals who did recognise their homelands, the majority did not live on their homelands but were allowed to visit (73%).
Result of the internal validation The cultural identification domain was assessed as having little validity in terms of associations with the other domains.
However, this domain should not be excluded from the NATSIHS just because it is not associated with most other domains, as it provides important descriptive information.
Recommendations from the workshop While this domain should be retained, capturing the concept of cultural identification is difficult. For example, it has been widely acknowledged that spirituality is a key concept to consider; however, it proves to be a very difficult concept to measure. Attempts were made to capture spiritual concepts through the cultural identity domain, but these items did not perform well in terms of their associations with other variables.
The workshop agreed that it is important to retain this domain, but that there is a need to better capture cultural attachment. Some suggested concepts to capture were connection to country, family, spirituality, and identity, and the ways these may sustain or affect wellbeing.
Conclusion • The cultural identification domain should be retained and included in future versions of
the social and emotional wellbeing module • More work is required on how to translate the key concepts into questions without
losing their meaning. The domain should therefore be refined and expanded to better

84
capture cultural identification, including the following concepts-connection to country, family, identity, spirituality, and the ways these may sustain or impact on wellbeing.
• Consider extending coverage to include respondents in remote areas.
Removal from natural family
Key findings from the interim social and emotional wellbeing module Overall, 7% of respondents indicated that they had been removed from their natural family, with respondents aged 45–54 years and 55 years and over (both 11%) most likely to indicate this.
Result of the internal validation The removal from natural family domain was assessed as having little validity in terms of associations with the other domains in the module.
While there were not many associations with other social and emotional wellbeing domains, this domain is important to retain. Removal from natural family has been recognised as an important issue to consider in assessing the social and emotional wellbeing of Indigenous Australians, especially given the large emphasis that Aboriginal and Torres Strait Islander peoples place on the family unit.
There was a large proportion of missing responses to the question on whether or not the respondent’s relative or relatives had been removed from their natural family (14% did not know or did not answer). While it is possible that this was partially due to the wording of the question, a proportion of respondents may not know whether they had a relative who was removed.
Recommendations from the workshop The workshop agreed that this domain is very important to retain.
Conclusion The removal from natural family domain should be retained and included in future versions of the social and emotional wellbeing module.
6.2 Recommendations The review of the performance of the eight domains in the interim social and emotional wellbeing module outlined above found that all eight domains should be retained. There were, however, a number of recommendations arising from this review as to how some of the domains could be improved.
In addition, however, the stakeholder workshop found that there were a number of important areas of social and emotional wellbeing not currently captured in the module that should be explored further. For example, the interim module did not capture more positive aspects of social and emotional wellbeing, such as resilience and self-mastery. It also did not have many measures of broader social wellbeing. There were also other issues arising from
85
the workshop that were not directly related to the module, but which should be considered for future ABS surveys.
Table 6.1 provides a summary of this report’s recommendations and categorised into the three areas outlined above: those relating to the eight domains in the interim module, additional areas to be further explored for inclusion in the 2010–11 National Aboriginal and Torres Strait Islander Health Survey, and other issues related to social and emotional wellbeing that arose during the consultations.
These recommendations will be addressed through a number of different processes. The National Advisory Group on Aboriginal and Torres Strait Islander Health Information and Data has funded the AIHW to write a report that will consider many of the issues arising from this review of the interim social and emotional wellbeing module, in particular addressing the outcomes of the 2006 stakeholder workshop. The ABS is responsible for considering a number of the recommendations and NACCHO is responsible for further exploring the concepts of isolation and loneliness.
The ABS has already made some changes to the questions in the life stressors domain and the discrimination domain as these questions are used in the 2008 National Aboriginal and Torres Strait Islander Social Survey (NATSISS). These changes will also be incorporated into the next version of the social and emotional wellbeing module for the 2010-11 NATSIHS. Any other changes to the module will need to be developed and pilot tested in time for inclusion in this survey.
Future versions of the social and emotional wellbeing module need to include measures that allow for comparison with the non-Indigenous population, as well as more culturally appropriate measures that are relevant to the particular experiences of the Aboriginal and Torres Strait Islander population.

86
Table 6.1: Summary of recommendations
Area Recommendations Action
Domains in the interim module
Psychological distress (K-5)
Consider including the full K-10 measures for psychological distress to allow for more detailed comparisons with non-Indigenous people.
To be considered in second AIHW report
Impact of psychological distress
1. Increase the K-5 cut-off score for asking questions on psychological distress from 6.
2. Refine the impact question to capture a wider range of issues.
ABS to consider
Positive wellbeing No amendments suggested. Nil required
Anger No amendments to the domain but more contextual information could be collected.
ABS has included some additional questions in 2008 NATSISS. ABS to consider what other information is useful/feasible to collect.
Life stressors 1. Collect data on life stressors for the respondent separately from stressors experienced by family or friends.
2. Review the list of stressors to ensure it is a comprehensive and relevant list of significant stressors.
ABS have addressed both these issues in the 2008 NATSISS
Discrimination 1. Further refine the discrimination question to ensure it captures the broader definition of discrimination, including oppression and racism.
2. Review or remove the discrimination in health care question.
ABS have modified the discrimination question for the 2008 NATSISS
Cultural identification
1. Refine and expand the domain to better capture cultural attachment (possibly including connection to country, family, identity, spirituality) and how this affects wellbeing.
2. Extend coverage to include people in remote areas
ABS to consider
Removal from natural family
No amendments suggested. Nil required
Additional areas to be explored
Self-efficacy, mastery and control
This is important for physical and mental wellbeing. It was suggested that this area also be captured in relation to the positive aspects of anger and to assist in the interpretation of the life stressors domain.
To be explored in second AIHW report
Resilience and protective factors
This could include factors such as continuum of identity, family resilience, coping strategies and connection to land.
To be explored in second AIHW report
Isolation and loneliness
To be developed by NACCHO
Social wellbeing measures
To capture broader social wellbeing, such as family and community cohesion and issues such as trust and social capital
To be explored in second AIHW report
Related issues for future ABS surveys
Strengths and difficulties questionnaire for children
This was used in the WA Aboriginal Child Health Survey. Examine the appropriateness of using this in future ABS surveys, recognising that the questionnaire required modification for use in the WAACHS.
To be explored in second AIHW report
Mental health diagnoses
Explore the feasibility of including mental health diagnoses, such as anxiety and depression, as health conditions. The 1997 ABS mental health survey used these measures and their appropriateness for use with the Indigenous population needs to be tested.
ABS to consider

87
Appendix A: Social and emotional wellbeing module—additional information
Kessler Psychological Distress Scale
K-10 The Kessler Psychological Distress Scale–10 (K-10) is a measure of the level of a person’s psychological distress and is non-specific in nature (that is, it does not attempt to identify specific mental illnesses). It was developed in the early 1990s for use in the United States National Health Interview Survey (Kessler & Mroczek 1994). The first national Australian survey in which the K-10 was used was the 1997 National Survey of Mental Health and Wellbeing of Adults (SMHWB) (ABS 1999). Following its use in this survey, validation work of the scale undertaken by Andrews and Slade (2001) indicated a strong association between K-10 scores and the diagnosis of anxiety and depression, as well as a significant, but weaker, association with other mental disorder categories. In addition, their results suggested that the K-10 was a better predictor of mental illness and psychological distress than other short general modules that had been trialled in the 1997 SMHWB. Subsequent to its inclusion in the 1997 SMHWB, the K-10 has been used widely, including by the ABS in its NHS (ABS 2006a), by the AIHW in the National Drug Strategy Household Survey (AIHW 2005) and by a number of states and territories in their health surveys (Dal Grande et al 2002; NSW Department of Health 2004; Victorian Government Department of Human Services 2006).
The K-10 consists of 10 questions that seek to measure the level of current anxiety and depressive symptoms a person experienced during the 4 weeks prior to interview.
Question set 1. In the past four weeks, about how often did you feel tired out for no good reason? 2. In the past four weeks, about how often did you feel nervous? 3. In the past four weeks, about how often did you feel so nervous that nothing could calm
you down? * 4. In the past four weeks, about how often did you feel hopeless? 5. In the past four weeks, about how often did you feel restless or fidgety? 6. In the past four weeks, about how often did you feel so restless that you could not sit
still? * 7. In the past four weeks, about how often did you feel depressed? 8. In the past four weeks, about how often did you feel that everything was an effort? 9. In the past four weeks, about how often did you feel so sad that nothing could cheer you
up? 10. In the past four weeks, about how often did you feel worthless?
* Items 3 and 6 are not asked if the response to the preceding question was ‘none of the time’.

88
For each item, there are five response options which are based on the frequency with which the respondent experienced the particular problem; these response options and corresponding scores are as follows: • none of the time (score = 1) • a little of the time (score = 2) • some of the time (score = 3) • most of the time (score = 4) • all of the time (score = 5).
After summing the scores across the 10 items, the range of possible scores on the K-10 is 10 to 50, with a low score indicating no or low psychological distress and a high score indicating high distress. While different approaches have been used in Australia to group K-10 scores (ABS 2003), the approach used most often for national surveys (such as the National Health surveys and the National Drug Strategy Household Survey) sees the grouping of scores into four categories: low (score of 10 to 15), moderate (score of 16 to 21), high (score of 22 to 29) and very high (score of 30 to 50). It is generally accepted that those scoring very high are likely to have a severe mental illness and should seek professional help.

89
Appendix B: Administrative data and other surveys—additional information
National Hospital Morbidity Database Hospitalisation data are presented for the 2-year period July 2005 to June 2007. An aggregate of two years of data have been used as the number of hospitalisations for some conditions are likely to be small for a single year.
Hospitalisations for which the Indigenous status of the patient was not reported have been included with hospitalisations data for non–Indigenous people under the ‘other’ category. This is to enable consistency of data across jurisdictions as public hospitals in some states and territories do not have a category for the reporting of ‘not stated’ or inadequately recorded/reported Indigenous status.
The principal diagnosis is the problem that was chiefly responsible for the patient’s episode of care in hospital. The term ‘hospitalisation’ is used to refer to a separation that is the episode of admitted patient care, which can be a total hospital stay (from admission to discharge, transfer or death) or a change in a type of care (for example, from acute to rehabilitation). It is therefore possible for the same patient to be counted more than once in hospitalisations data.
Specialised mental health care is identified through the fact that a patient had one or more psychiatric care days recorded—that is, care was received in a specialised psychiatric unit or ward. In acute care hospitals, a ‘specialised’ episode of care or separation may comprise some psychiatric care days and some days in general care or psychiatric care days only. An episode of care in a public psychiatric hospital is deemed to comprise psychiatric care days only and to be ‘specialised’, unless some care was given in a unit other than a psychiatric unit, such as a drug and alcohol unit.
National Community Mental Health Care Database The NCMHCD includes data on service contacts provided by government-operated community mental health services. The data collated in the NCMHCD are specified by the NMDS for Community Mental Health Care. The NCMHCD contains data on client demographics, including information such as age, sex and data on each individual service contact, such as principal diagnosis and mental health legal status. Detailed specifications for the NMDS for Community Mental Health Care can be found in METeOR, the AIHW’s online metadata registry, at <www.aihw.gov.au>.
The scope for this collection is all ambulatory mental health service contacts provided by the government-operated community mental health services that are included in the NMDS for Community Mental Health Establishments.
A mental health service contact for the purposes of this collection was defined as the provision of a clinically significant service by a specialised mental health service provider for a patient or client, other than those admitted to psychiatric hospitals or designated

90
psychiatric units in acute care hospitals, and those resident in 24-hour staffed specialised residential mental health services where the nature of the service would normally warrant a data entry in the clinical record of the patient/client in question. Any one patient can have one or more service contacts over the relevant period. Service contacts are not restricted to face-to-face communication but can include telephone, video link or other forms of direct communication. Service contacts can also either be with the patient, a third party, such as, a carer or family member, and/or other professionals, mental health workers or other service providers.
It should be noted that there is some variation across jurisdictions as to what is classified as a service contact. For example, New South Wales, Queensland, South Australia and Tasmania may include written correspondence as service contacts, while others do not.
Quality of Indigenous identification Data from the NCMHCD on Indigenous status should be interpreted with caution. Across the jurisdictions, the data quality and completeness of Indigenous identification varies or is unknown.
All states and territories provided information on the quality of the Indigenous status data for the NCMHCD 2004–05 as follows: • New South Wales stated that the quality of Indigenous identification in data has not
been evaluated. • Victoria considered the quality of Indigenous identification in data to be unacceptable
due to lack of consistency in data entry across its services. • Queensland reported that the quality of Indigenous identification data were acceptable
at a broad level that is, in distinguishing between Indigenous Australians and other Australians. However, they believe that there are quality issues regarding the coding of more specific details (that is, ‘Aboriginal’, ‘Torres Strait Islander’, ‘Both Aboriginal and Torres Strait Islander’). Queensland reported that several strategies have been implemented to improve the quality of Indigenous data and noted that a replacement for the existing collection system with inbuilt validation checks would further improve the quality of the data.
• Western Australia reported that the quality of Indigenous status data for 2004–05 was acceptable. However, the data could be improved with the appropriate resources, training and reporting standards.
• South Australia indicated that there has been limited analysis of the quality of Indigenous status data. Therefore, the quality of the data are uncertain at this stage.
• Tasmania reported the quality of its data to be acceptable. • the Australian Capital Territory considered the quality of its Indigenous status data to be
acceptable, noting that there is some room for improvement regarding the reporting of the ‘Not stated’ category.
• the Northern Territory indicated its Indigenous status data to be of acceptable quality.

91
Principal diagnosis data quality It should also be noted that there is some variability across the states and territories in the data collection and coding practices in relation to principal diagnosis in the NCMHCD; this may also affect data quality. In particular, there are: • differences among states and territories in the classification used. Six of the state and
territory health authorities used the complete International Statistical Classification of Diseases and Related Health Problems, 10th revision, Australian Modification (ICD-10-AM) classification to code principal diagnosis. However, New South Wales used a combination of ICD-10-AM and the International Classification of Diseases, 10th revision, Primary Care (ICD-10-PC), and the Northern Territory used only the ‘Mental and behavioural disorders’ chapter of the ICD-10-AM classification
• differences according to the size of the facility (for example, large versus small) in the ability to accurately code principal diagnosis
• differences according to the availability of appropriate clinicians to assign principal diagnoses (diagnoses are generally made by psychiatrists, whereas service contacts are mainly provided by non-psychiatrists)
• differences according to whether the principal diagnosis is applied to an individual service contact or to a period of care. New South Wales and the Australian Capital Territory mainly report the current diagnosis for each service contact rather than a principal diagnosis for a longer period of care. The remaining jurisdictions mainly report principal diagnosis as applying to a longer period of care.
Estimating the number of patients The estimated number of patients in the NCMHCD has been calculated by counting the number of unique person identifier–establishment identifier combinations. Within each establishment or facility, a patient is allocated a unique identifier. However, this means that patients who utilised services in more than one establishment will be counted more than once; therefore, the number of patients may be overestimated.
Definitions Community mental health care: specialised mental health care provided by community mental health services and hospital-based ambulatory care services, such as outpatient clinics and day clinics, which are government operated.
Service contacts: the provision of a clinically significant service by a specialised mental health service provider(s) for patient/clients, other than those admitted to psychiatric hospitals or designated psychiatric units in acute care hospitals, and those resident in 24-hour-staffed specialised residential mental health services, where the nature of the service would normally warrant a dated entry in the clinical record of the patient/client in question. Any one patient can have one or more service contacts over the relevant period. Service contacts are not restricted to face-to-face communication but can also either be with video link or other forms of direct communication. Service contacts can also either be with the patient, or with a third party such as a carer or family member, and/or other professional or mental health worker or other service provider.

92
Residential mental health care: residential care provided by residential mental health services. A residential mental health service is a specialised mental health service that: • employs mental health-trained staff on-site • provides rehabilitation, treatment or extended care to residents for whom the care is
intended to be on an overnight basis and in a domestic-like environment • encourages the resident to take responsibility for their daily living activities.
These services include those that employ mental health trained staff on-site 24 hours per day and other services with less intensive staffing. However, all these services employ on-site mental health-trained staff for some part of each day.
Episodes of residential care: a period of care between the start of residential care (either through the formal start of the residential stay or the start of a new reference period) and the end of residential care (either through the formal end of residential care, commencement of leave intended to be greater than 7 days or the end of the reference period). An individual can have one or more episodes of care during the reference period.
Residential stay: the period of care beginning with a formal start of residential care and ending with a formal end of the residential care and accommodation. It may involve more than one reference period (that is, more than one episode of residential care).
Supported Accommodation Assistance Program National Data Collection The SAAP National Data Collection (NDC) is a nationally consistent information system that combines information from SAAP agencies in each state and territory and Australian government funding departments. The AIHW manages the collection.
The scope of the SAAP NDC includes all agencies that receive funding through the national SAAP agreement and/or state and territory funds.
The data presented in this report were extracted from the Client Collection component of the SAAP NDC, which includes information about all clients receiving SAAP support lasting for at least 1 hour. Data are recorded by service providers during or immediately following contact with clients and are then forwarded to the AIHW after the clients’ support periods have ended or, for ongoing clients, at the end of the reporting period (31 December and 30 June of each year).
There are high levels of non-response to particular questions in the data collection forms received by the AIHW. This means that caution should be exercised when interpreting the data because the results may not fully reflect the entire population of interest.
Furthermore, the protocols established for the NDC require that SAAP clients provide information in a climate of informed consent. If a client’s consent is not obtained, only a limited number of questions can be completed on data collection forms.
It is standard policy for the publication of national SAAP data to present numbers as rounded figures to the nearest 50.

93
Definitions Support period: the period in which the client receives supported accommodation and/or other support services from a SAAP agency. A support period can either be closed or open.
Closed support period: a support period that had finished on or before 30 June of the reporting year.
Supported accommodation: Accommodation paid for or provided directly by a SAAP agency. The accommodation may be provided at the agency or may be purchased using SAAP funds—at a motel, for example.
For further information on the SAAP collection, refer to the SAAP National Data Collection annual report 2005–06 Australia (AIHW 2007a).
Commonwealth State/Territory Disability Agreement National Minimum Data Set Data pertaining to the CSTDA are collected through the CSTDA NMDS. This NMDS, which is managed by the AIHW, facilitates the annual collation of nationally comparable data about CSTDA-funded services. Services within the scope of the collection are those for which funding has been provided during the specified period by a government organisation operating under the CSTDA. A funded agency may receive funding from multiple sources. Where a funded agency is unable to differentiate service users according to funding source (that is, CSTDA or other), they are asked to provide details of all service users.
With the exceptions noted below, agencies funded under the CSTDA are asked to provide information about: • each of the service types they are funded to provide (that is, service type outlets they
operate) • all service users who receive support over a specified period • the CSTDA NMDS service type(s) that the service users receive.
However, certain service type outlets—such as those providing advocacy or information and referral services—are not requested to provide any service user details while other service type outlets (such as recreation and holiday programs) are only asked to provide minimal service user details.
The CSTDA NMDS collection includes those disability support service providers that receive funding under the CSTDA, including psychiatric-specific disability service providers, as well as other disability service providers that may be accessed by persons with a psychiatric disability. It should be noted that the CSTDA does not apply to the provision of services with a specialist clinical focus. In addition, the collection does not include psychiatric-specific disability support services that are not funded through the CSTDA.
There is some variation between jurisdictions in the services included under the CSTDA as follows: • In New South Wales, psychiatric-specific disability services are provided by the New
South Wales Department of Health and are not included in the CSTDA NMDS collection. • In Victoria, psychiatric-specific disability services are included in the CSTDA NMDS
collection.

94
• In Queensland, psychiatric-specific disability services that receive CSTDA funding through Disability Services Queensland are included in the CSTDA NMDS collection.
• In Western Australia, only some psychiatric disability services are included in the CSTDA NDMS collection. The health department is the main provider of services for people with a psychiatric disability and these services are not included.
• Tasmania, the Australian Capital Territory and the Northern Territory do not include any services classified as ‘psychiatric disability services’. However, these jurisdictions provide ‘mental health services’. There appears to be no sharp distinction between what is classified as a ‘psychiatric disability service’, with some mental health services providing support to people with psychiatric disability.
Definitions Persons with disabilities: people with disabilities that are attributable to an intellectual, psychiatric, sensory, physical or neurological impairment or acquired brain injury (or some combination of these) and for whom disability: • is likely to be permanent; • results in substantially reduced capacity in at least one of the following: self-
care/management, mobility or communication • are likely to require significant ongoing and/or long-term episodic support • are evident before 65 years of age (FaCS 2002).
Residential services: services that provide accommodation to people with a disability. They include accommodation in large and small residentials or institutions, hostels and group homes.
Non-residential services: services that support people with a disability to live in a non-institutional setting through the provision of community support, community access, accommodation support in the community, respite and/or employment services.
Large residentials/institutions: provides 24-hour residential support in a setting of more than 20 beds.
Small residentials/institutions: provides 24 hour residential support in a setting of 7 to 20 beds.
Hostels: provides residential support in a setting of usually less than 20 beds and may or may not provide 24-hour residential support.
Group homes: provides combined accommodation and community-based residential support to people in a residential setting and are generally staffed 24 hours a day. Usually no more than 6 service users are located in any one home.
In-home accommodation support: involves support with the basic needs of living. It includes personal care by an attendant, in-home living support, alternative placement (such as shared-care arrangements and host family placements) and crisis accommodation support.
Community support: includes services such as specialised therapeutic services, early childhood intervention, and behaviour and/or specialist intervention, counselling and case management.

95
Community access services: designed to provide opportunities for people with a disability to gain and use their abilities to enjoy their full potential for social independence. They include learning and life skills development, and recreation and holiday programs.
Respite services: provides a short-term and time-limited break for caregivers of people with a disability and include services such as those provided in the individual’s home, in centres, in respite homes and with host families.
Employment support services: provides assistance in obtaining and/or retaining paid employment in both general employment as well as specialised and supported environments.
Advocacy, information and print disability and other support: includes services such as advocacy, information, referral, mutual support, self-help groups, research, evaluation, training and development. Note that no service user counts are collected for these services.
For further information on CSTDA support services, refer to the most recent report Disability support services 2004–05: national data on services provided under the Commonwealth State/Territory Disability Agreement (AIHW 2006a).
Bettering the Evaluation and Care of Health Survey The BEACH survey of general practice activity is a collaborative study between the AIHW and The University of Sydney. For each year’s data collection, a random sample of about 1,000 GPs each report details of 100 consecutive general practice encounters of all types on structured encounter forms. Each form collects information about birth, sex and reasons for encounter, the problems managed and the management of each problem (for example, treatment provided, prescriptions and referrals). Data on patient risk factors, health status and GPs’ characteristics are also collected.
The number of Indigenous patients identified in the BEACH survey is likely to be underestimated. This is because some GPs might not ask about Indigenous status, or the patient may choose not to identify (AIHW 2002). The estimates presented here are also derived from a relatively small sample of GP encounters involving Indigenous Australians.
Due to a late inclusion of a ‘not stated’ category of Indigenous status in 2001–02 (before which not stated responses were included with non-Indigenous responses), GP encounters for which Indigenous status was not reported have been included with encounters for non-Indigenous people under the ‘other’ category.
96
Appendix C: Technical notes
Data analysis and presentation Throughout this publication, data may not sum to the totals shown due to missing and/or not stated values, as well as rounding. Totals reported include missing and/or not stated values, unless indicated otherwise.
Note that in calculating averages for the impact variables, we used 18 for those in the 15 plus days group (for days missed) and 5 for those in the 4 plus visits group (when referring to visits to a health professional).
Finally, missing data was excluded from analysis where it exceeded 5% of the total proportion.
Population rates and age standardisation Crude (observed rates) were calculated using the ABS estimated resident population (ERP) at the midpoint of the data range (for example, rates for 2004–06 were calculated using ERP at 31 December 2005).
The direct method of age standardisation was used for the calculation of age-standardised rates using 5-year age groups. The Australian estimated resident population at 30 June 2001 was used as the population from which expected rates were calculated.
Confidence intervals Significance testing was performed using upper and lower 95% confidence intervals with the following formula taken from the ABS’s National Aboriginal and Torres Strait Islander Health Survey: Expanded confidentialised unit record file, technical manual 2004–05:
LCL_proportion = proportion – 1.96 * se_proportion UCL_proportion = proportion + 1.96 * se_proportion
where se_proportion = rse_proportion * proportion/100
and rse_proportion = sqrt ((rse_numerator ** 2) – (rse_denominator ** 2)).
However, in some instances, the rse_numerator was smaller than the rse_denominator, therefore lower and upper confidence limits could not be calculated.
Note For Appendixes D, E and F, see the web-based document at <http://www.aihw.gov.au/publications/index.cfm>.

97
List of tables
Table 2.1: Frequency of feelings of psychological distress by psychological distress indicators, Indigenous persons aged 18 years and over, 2004–05 (per cent) 10
Table 2.2: Level of psychological distress by selected characteristics, Indigenous persons aged 18 years and over, 2004–05 (per cent) 11
Table 2.3: Number and proportion of people who reported high or very high levels of psychological distress, by Indigenous status and age, persons aged 18 years and over, 2004–05 12
Table 2.4: Number and proportion of people who reported high or very high levels of psychological distress, by Indigenous status and remoteness(a), persons aged 18 years and over, 2004–05 13
Table 2.5: Frequency of feelings of psychological distress by remoteness, Indigenous persons aged 18 years and over, 2004–05 (per cent) 14
Table 2.6: Number of days unable to work or carry out normal activities due to feelings of psychological distress, by selected characteristics, Indigenous persons aged 18 years and over, 2004–05 15
Table 2.7: Whether saw a health professional because of feelings of psychological distress, by selected characteristics, Indigenous persons aged 18 years and over, 2004–05 16
Table 2.8: Positive wellbeing indicator by frequency, Indigenous persons aged 18 years and over, 2004–05 (per cent) 18
Table 2.9: Frequency of positive wellbeing indicators by age, Indigenous persons aged 18 years and over, 2004–05 (per cent) 19
Table 2.10: Frequency of positive wellbeing indicators, by remoteness, Indigenous persons aged 18 years and over, 2004–05 (per cent) 20
Table 2.11: Frequency of anger manifestation by age, Indigenous persons aged 18 years and over, 2004–05 (per cent) 21
Table 2.12: Type of life stressor experienced, by remoteness, Indigenous persons aged 18 years and over, 2004–05 (per cent) 23
Table 2.13: Number of life stressors experienced in the last 12 months, by age, Indigenous persons aged 18 years and over, 2004–05 (per cent) 24
Table 2.14: Number of life stressors experienced in the last 12 months, by remoteness, Indigenous persons aged 18 years and over, 2004–05 (per cent) 25
Table 2.15: Perceived treatment when seeking health care compared with non-Indigenous people, by remoteness, Indigenous persons aged 18 years and over, 2004–05 (per cent) 26
Table 2.16: Whether treated badly because of Indigenous origin, by remoteness, Indigenous persons aged 18 years and over, 2004–05 (per cent) 26
Table 2.17: Whether recognises an area as homelands or traditional country, by remoteness, Indigenous persons aged 18 years and over in non-remote areas, 2004–05 (per cent) 27

98
Table 2.18: Whether relatives had been removed from their natural family, by remoteness, Indigenous persons aged 18 years and over, 2004–05 (per cent) 29
Table 3.1: Impact of psychological distress by level of distress, Indigenous persons aged 18 years and over, 2004–05 (per cent) 32
Table 3.2: Proportion of Indigenous persons who experienced anger manifestation ‘a lot’ by level of psychological distress, 2004–05 (per cent) 34
Table 3.3: Average number of life stressors experienced in the last 12 months by level of psychological distress, Indigenous persons aged 18 years and over, 2004–05 35
Table 3.4: Whether reported mental illness as stressor by level of psychological distress, Indigenous persons aged 18 years and over in non-remote areas, 2004–05 (per cent) 35
Table 3.5: Perceived treatment when seeking health care (compared with non-Indigenous people) by level of psychological distress, Indigenous persons aged 18 years and over, 2004–05 (per cent) 36
Table 3.6: Removal from natural family by level of psychological distress, Indigenous persons aged 18 years and over, 2004–05 (per cent) 37
Table 3.7: Outcomes of the cross-validation of the eight social and emotional wellbeing domains 41
Table 3.8: Outcomes of the validation of four social and emotional wellbeing domains with selected NATSIHS variables 52
Table 4.1: Hospitalisations for mental health–related conditions by type of condition by Indigenous status, NSW, Vic, Qld, WA, SA & NT, July 2005 to June 2007 56
Table 4.2: Hospitalisations for intentional self-harm (X60–X84), by Indigenous status and sex, NSW, Vic, Qld, WA, SA & NT, July 2005 to June 2007 57
Table 4.3: Community mental health service contacts by Indigenous status and age group, 2005–06 58
Table 4.4: Episodes of residential mental health care by Indigenous status and age group, 2005–06 60
Table 4.5: SAAP clients with mental health-related closed support periods: demographic characteristics, 2005–06 63
Table 4.6: SAAP mental health-related closed support periods, by service type, 2005–06 64
Table 4.7: CSTDA funded service users with a psychiatric disability by Indigenous status and sex, 2005–06 65
Table 4.8: CSTDA funded service users with a psychiatric disability by Indigenous status by age, 2005–06 66
Table 4.9: CSTDA-funded non-residential service users with a psychiatric disability, by non-residential service type, 2005-06 67
Table 4.10: CSTDA-funded residential service users with a psychiatric disability, by residential service type, 2005-06 68

99
Table 5.1: Summary of the outcomes of the 2006 workshop in relation to the interim social and emotional wellbeing module 75
Table 6.1: Summary of recommendations 86

100
List of figures
Figure 2.1: How often physical health problems were the main cause of feelings of psychological distress, by age, Indigenous persons aged 18 years and over, 2004–05 17
Figure 2.2: Proportion of Indigenous people who experienced positive wellbeing ‘all/most of the time’, by positive wellbeing indicator by sex, 2004–05 18
Figure 2.3: Whether recognises an area as homelands or traditional country, by age, Indigenous persons aged 18 years and over in non-remote areas, 2004–05 28
Figure 3.1: Proportion of Indigenous persons who experienced positive wellbeing indicator ‘all/most of the time’ by level of psychological distress, 2004–05 33
Figure 3.2: Self-assessed health status by level of psychological distress, Indigenous persons aged 18 years and over, 2004–05 45
Figure 3.3: Number of long-term health conditions by level of psychological distress, Indigenous persons aged 18 years and over, 2004–05 47
Figure 3.4: Whether reported a long-term mental health-related condition by level of psychological distress, Indigenous persons aged 18 years and over, 2004–05 48
Figure 4.1: Age specific hospitalisation rates for a principal diagnosis of mental health-related conditions, by Indigenous status and sex, NSW, Vic, Qld, WA, SA & NT, July 2005 to June 2007 55
Figure 4.2: Community mental health service contacts by Indigenous status(a) and sex, 2005–06 59
Figure 4.3: Percentage distribution of residential mental health care episodes by sex, Indigenous persons aged 15 years and over, 2005–06 61
Figure 4.4: Proportion at high risk of clinically significant emotional or behavioural difficulties by age group, Indigenous and non-Indigenous children aged 4–17 years, WA, 2000 and 2001 71
Figure 4.5: Risk of clinically significant emotional or behavioural difficulties by number of life stress events, WA, 2000- 2001 (per cent) 72

101
References
ABS (Australian Bureau of Statistics) 1999. National Survey of Mental Health and Wellbeing of Adults: users’ guide, 1997. ABS cat. no. 4327. Canberra: ABS.
ABS 2002. National Health Survey: summary of results, 2001. ABS cat. no. 4364 . Canberra: ABS.
ABS 2003. Information paper: use of the Kessler Psychological Distress Scale in ABS health surveys, 2001. ABS cat. no. 4817.0. Canberra: ABS.
ABS 2004. National Aboriginal and Torres Strait Islander Social Survey 2002. ABS cat. no. 4824.0. Canberra: ABS.
ABS: Miller M 2004. Peer review of Social and Emotional Wellbeing Module for 2004–05 Indigenous Health Survey. Unpublished report prepared for the 2006 Social and Emotional Wellbeing Workshop, Canberra.
ABS 2006a. National Aboriginal and Torres Strait Islander Health Survey: expanded confidentialised unit record file, technical manual 2004–05. ABS cat. no. 4715.0. Canberra: ABS.
ABS 2006b. National Health Survey 2004–05. ABS cat. no. 4364.0. Canberra: ABS.
ABS 2006c. National Health Survey and National Aboriginal and Torres Strait Islander Health Survey 2004/05: data reference package, 2004–05. ABS cat. no. 4363.0. Canberra: ABS.
ABS 2007. General Social Survey 2006. ABS cat. no. 4159.0. Canberra: ABS.
ABS & AIHW (Australian Institute of Health and Welfare) 2005. The health and welfare of Australia’s Aboriginal and Torres Strait Islander peoples. ABS cat. no. 4704.0. AIHW cat. no. IHW 14. Canberra: ABS & AIHW.
AHM (Australian Health Ministers) 2003. National Mental Health Plan 2003–2008. Canberra: Australian Government.
AIHW (Australian Institute of Health and Welfare) 2002. Australia’s children: their health and wellbeing 2002. Cat. no. PHE 36. Canberra: AIHW.
AIHW 2005. 2004 National Drug Strategy Household Survey: detailed findings. Drug statistics series no. 16. Cat. no. PHE 66. Canberra: AIHW.
AIHW 2006a. Disability support services 2004–05: national data on services provided under the Commonwealth State/Territory Disability Agreement. Cat. no. DIS 46. Canberra: AIHW.
AIHW 2006b. National Advisory Group on Aboriginal and Torres Strait Islander Health Information and Data: strategic plan 2006–2008. Cat. no. IHW 19. Canberra: AIHW.
AIHW 2007a. Homeless people in SAAP: SAAP National Data Collection annual report 2005–06 Australia. SAAP NDCA report series 11. Cat. no. HOU 156. Canberra: AIHW.
AIHW 2008. Aboriginal and Torres Strait Islander Health Performance Framework, 2008 report: Detailed analyses. AIHW Cat. no IHW 22. Canberra: AIHW.
AIHW 2008b. Mental health services in Australia 2005–06. Cat. no. HSE 56. Canberra: AIHW.
Andrews G & Slade T 2001. Interpreting scores on the Kessler Psychological Distress Scale (K10). Australian and New Zealand Journal of Public Health 25(6): 494–7.

102
Dal Grande E, Taylor A & Wilson D 2002. South Australian Health and Wellbeing Survey 2000. South Australia: South Australian Department of Human Services.
DoHA (Department of Health and Ageing) 2003. Mental Health National Outcomes and Casemix Collection: overview of clinician-rated and consumer self-report measures. Version 1.50. Canberra: Commonwealth of Australia.
FaCS (Commonwealth Department of Family and Community Services) 2002. Commonwealth State/Territory Disability Agreement (CSTDA) 2002–2007. Canberra: FaCS. Viewed July 2007, <http://www.facs.gov.au/internet/facsinternet.nsf/disabilities/policy-cstda.htm>.
Furukawa TA, Kessler RC, Slade T & Andrews G 2003. The performances of the K6 and K10 screening scales for psychological distress in the Australian National Survey of Mental Health and Well-being. Psychological Medicine 33(2):357–62.
Kessler R, Andrews G, Colpe LJ, Hiripi E, Mroczek DK, Normand SLT et al. 2002. Short screening scales to monitor population prevalence and trends in non-specific psychological distress. Psychological Medicine 32:959–76.
Kessler R & Mroczek D 1994. Final version of our non-specific psychological distress scale. Ann Arbor, Michigan: Survey Research Centre of the Institute for Social Research, University of Michigan.
NAHSWP (National Aboriginal Health Strategy Working Party) 1989. A National Aboriginal Health Strategy: report of the National Health Strategy Working Party. Canberra: Department of Aboriginal Affairs.
NATSIHC (National Aboriginal and Torres Strait Islander Health Council) 2004. National Strategic Framework for Aboriginal and Torres Strait Islander Health 2003–2013: framework for action by governments. Canberra: NATSIHC.
NCAIANMHR (National Center for American Indian and Alaska Native Mental Health Research) nd. Project summary: American Indian Services Utilization, Psychiatric Epidemiology, Risk and Protective Factors Project (AI-SUPERPFP). Viewed 3 August 2007, <http://aianp.uchsc.edu/ncaianmhr/research/superpfp.htm>.
NCCH (National Centre for Classification in Health) 2004. The International Statistical Classification of Diseases and Related Health Problems, 10th revision, Australian modification (ICD-10-AM). 4th ed. Sydney: University of Sydney.
NCHS (National Centre of Health Statistics) 2007. National Health Interview Survey. Hyattsville, MD: NCHS. Viewed 8 August 2007, <http://0-www.cdc.gov.mill1.sjlibrary.org/nchs/nhis.htm>.
NHMRC (National Health and Medical Research Council) 2001. Australian Alcohol Guidelines: health risks and benefits. Canberra: Commonwealth of Australia.
NHMRC 2002. Research agenda working group road map: a strategic framework for Aboriginal and Torres Strait Islander health research. Canberra: Commonwealth of Australia.
NSW Department of Health 2004. New South Wales Adult Health Survey 2003. NSW Public Health Bulletin Supplement 15(s-4):1–116.
NSW Health Department 2000. Report on the 1997 and 1998 NSW Health Surveys. Sydney: NSW Health Department. Viewed 2 July 2007, <http://www.health.nsw.gov.au/public-health/nswhs/hsindex.htm>.

103
Saunders D & Daly A 2001. 2000 Collaborative health and wellbeing survey: psychological distress in the Western Australian population. Perth: Health Department of Western Australia.
SHRG (Social Health Reference Group) 2004. A national strategic framework for Aboriginal and Torres Strait Islander peoples’ mental health and social and emotional wellbeing 2004–2009. Canberra: Department of Health and Ageing.
Stewart G 2003. Possible measure/s of psychological distress, its impact, and social support. AIHW workshop for the Australian Indigenous Health Survey of 2004. NSW: Department of Health.
Stewart G 2006. An overview of the social and emotional wellbeing data in NATSIHS 2004–05. 2006 Social and Emotional Wellbeing Workshop, Canberra.
Swan P & Raphael B 1995. Ways forward: Aboriginal and Torres Strait Islander mental health policy: national consultancy report. Canberra: Australian Government Publishing Service.
Victorian Government Department of Human Services 2006. Victorian Population Health Survey 2005. Melbourne: Rural and Regional Health and Aged Care Services.
Ware JE 2007. SF-36® Health Survey update. Lincoln, RI: Quality Metric Health Outcomes Solutions. Viewed 10 August 2007, <http://www.sf-36.org/tools/SF36.shtml#LIT>.
Ware JE, Snow KK, Kosisnki M & Gandek B 1993. SF-36 Health Survey Manual and Interpretation Guide. Boston, MA: The Health Institute.
Whap G 2001. A Torres Strait Islander perspective on the concept of Indigenous knowledge. The Australian Journal of Indigenous Education 29(2):22–9.
Whitbeck LB, McMorris BJ, Hoyt DR, Stubben JD & LaFromboise T 2002. Perceived discrimination, traditional practices, and depressive symptoms among American Indians in the upper Midwest. Journal of Health and Social Behaviour 43(4):400–18.
Zubrick SR, Silburn SR, Lawrence DM, Mitrou FG, Dalby RB, Blair EM et al. 2005. The Western Australian Aboriginal Child Health Survey: the social and emotional wellbeing of Aboriginal children and young people. Perth: Curtin University of Technology and Telethon Institute for Child Health Research.