Measuring the ROI of ERP in SMBhosteddocs.ittoolbox.com/aberdeen_roi-of-erp-in-smb...economy, ERP...
24
Measuring the ROI of ERP in SMB Keeping ERP Projects Alive When You Need Them the Most March 2009 Cindy Jutras
Transcript of Measuring the ROI of ERP in SMBhosteddocs.ittoolbox.com/aberdeen_roi-of-erp-in-smb...economy, ERP...

Measuring the ROI of ERP in SMB Keeping ERP Projects Alive When You Need Them the Most
March 2009
Cindy Jutras

Measuring the ROI of ERP in SMB Page 2
© 2009 Aberdeen Group. Telephone: 617 854 5200
Executive Summary
Company Size Definition
This benchmark report highlights the performance and capabilities of companies with annual revenues under $250 million, referred to as Small to Medium Businesses (SMBs). This definition is used in parallel with Aberdeen's standard company size definitions based on annual revenues:
√ Small: under $50 million
√ Midsize: $50 million to $1 billion
√ Large: over $1 billion
Research Benchmark
Aberdeen’s Research Benchmarks provide an in-depth and comprehensive look into process, procedure, methodologies, and technologies with best practice identification and actionable recommendations
"We had a very aggressive [ERP implementation] timeline. After a short initial planning and discovery phase, we implemented ERP in four months. We brought it in on time and under budget. We drastically cut the time it takes to process month end from multiple days to a few hours. We were able to reduce the time to prepare quotes from 20 hours to a few minutes. It has produced huge time and labor savings."
~ Matt Pearson, Director of IT, Adtech Global Solutions
Enterprise Resource Planning (ERP) is more than a necessary infrastructure that forms the transactional system of record upon which a business is based. ERP is the potential source of cost savings and operational improvements. It is also a serious undertaking. This report serves as a roadmap to Small to Midsize Businesses (SMBs) for realizing the maximum Return on Investment (ROI) from ERP implementations.
Best-in-Class Performance Based on input from over 920 SMBs, Aberdeen used five key performance criteria to distinguish Best-in-Class companies. While the implementation of ERP produced a reduction in costs and improvements in scheduling across all companies, Best-in-Class companies achieved significantly better results:
• 20% reduction in levels of inventory, with 97% inventory accuracy
• 19% reduction in operational costs
• 22% reduction in administrative costs
• 94% on-time and complete delivery
Competitive Maturity Assessment Survey results show that the firms enjoying Best-in-Class performance shared several common characteristics.
• 100% use estimated ROI to cost justify ERP projects
• Best-in-Class have 33% more aggressive plans but are 150% more likely to meet expectations of ROI within the estimated timeframe
• Best-in-Class are 219% more likely than Laggards to use advanced analytics and Business Intelligence (BI), along with reporting capabilities of ERP to monitor business benefits
Required Actions In addition to the specific recommendations in Chapter Three of this report, to achieve Best-in-Class performance, companies must:
• Set aggressive goals for ERP projects - expect more and reap the benefits
• Quantify the expected business benefits of ERP projects and the projected timelines for achieving them
• Establish a baseline for measuring improvements, then measure, measure, measure
www.aberdeen.com Fax: 617 723 7897

Measuring the ROI of ERP in SMB Page 3
© 2009 Aberdeen Group. Telephone: 617 854 5200 www.aberdeen.com Fax: 617 723 7897
Table of Contents Executive Summary....................................................................................................... 2
Best-in-Class Performance..................................................................................... 2 Competitive Maturity Assessment....................................................................... 2 Required Actions...................................................................................................... 2
Chapter One: Benchmarking the Best-in-Class ..................................................... 4 Business Context ..................................................................................................... 4 The Maturity Class Framework............................................................................ 5 The Best-in-Class PACE Model ............................................................................ 6 Best-in-Class Strategies........................................................................................... 6
Chapter Two: Benchmarking Requirements for Success .................................... 9 Competitive Assessment......................................................................................10 Capabilities and Enablers ......................................................................................12
Chapter Three: Required Actions .........................................................................19 Laggard Steps to Success......................................................................................19 Industry Average Steps to Success ....................................................................19 Best-in-Class Steps to Success ............................................................................20
Appendix A: Research Methodology.....................................................................22 Appendix B: Related Aberdeen Research............................................................24
Figures Figure 1: Business Drivers Impacting ERP Strategies............................................ 4 Figure 2: How Often ROI is Considered ................................................................ 6 Figure 3: Strategic Actions of Best-in-Class ............................................................ 7 Figure 4: Top Strategies for Enabling Achievement of Goals ............................. 8 Figure 5: Do You Estimate ROI to Cost Justify ERP Projects? ........................12 Figure 6: Events Which Trigger Cost Justification ..............................................13 Figure 7: Do You Measure the ROI of Completed ERP Projects?..................13 Figure 8: Events Which Trigger ROI Measurement............................................14 Figure 9: Reasons for Not Considering ROI ........................................................15 Figure 10: Tools Used to Monitor Business Benefits .........................................16 Figure 11: Successfully Achieved ROI in Projected Timeline ...........................17 Figure 12: Savings Factors Considered in ROI.....................................................17
Tables Table 1: Top Performers Earn Best-in-Class Status.............................................. 5 Table 2: The Best-in-Class PACE Framework ....................................................... 6 Table 3: The Competitive Framework...................................................................11 Table 4: The PACE Framework Key ......................................................................23 Table 5: The Competitive Framework Key ..........................................................23 Table 6: The Relationship Between PACE and the Competitive Framework ...23

Measuring the ROI of ERP in SMB Page 4
© 2009 Aberdeen Group. Telephone: 617 854 5200
Chapter One: Benchmarking the Best-in-Class
Business Context Fast Facts
√ Companies are 44% more likely to estimate ROI to cost justify ERP projects than they were two years ago but only 13% more likely to actually measure the actual return from their investment
√ 100% of the Best-in-Class measure reductions in operational and administrative cost and inventory levels as a result of ERP
√ As a result, the Best-in-Class produce twice the reduction in inventory levels as Industry Average companies and more than 10-times that of Laggards
√ Best-in-Class companies reduce administrative costs by 22% and administrative costs by 19% while Laggards see no cost reduction at all
The December 2007 ERP in SMB: Exploring Growth Strategies report found small to midsize businesses (those with annual revenues less than $250 million) splitting their focus between growth and customer service. Today, while improving customer response time remains an important factor, the struggling economy is causing many to look to their ERP implementations to help them cut costs (Figure 1). As SMBs brace themselves in this down economy, ERP projects (upgrades, extensions, new implementations) run the risk of being delayed just when they are needed the most.
A well-managed ERP implementation can significantly reduce cost while improving other aspects of the business. Yet the focus for the past decade or more from both ERP solution providers as well their customers has been on reducing the Total Cost of Ownership (TCO) of ERP. Focusing exclusively on TCO is no longer enough. The focal point must now expand to include the Return on Investment (ROI) of ERP projects in order to justify continued investment and maximize business benefits.
Figure 1: Business Drivers Impacting ERP Strategies
44%
41%
34%
33%
0% 25% 50%
Must reduce costs
Must improve customer response time
We need to be easier to do businesswith (improve overall customer
Need to manage growth expectations
% All SMB respondents
Source: Aberdeen Group, March 2009
Growth expectations, customer service, and cost control have consistently been the top three business drivers impacting ERP over the past three years. However, pressures to reduce costs have escalated over the past year, resulting in this business driver taking over the top spot. This does not mean that all growth has stopped. Indeed, Aberdeen's survey of over 890 SMBs for The 2009 Aberdeen Report found that 54% of respondents were planning to grow revenues, at an average aggregate rate of 11% (13% anticipate revenues to be flat from 2008 to 2009 while 34% predict revenues will decline by an average of 11%.) However Figure 1 does reflect the focused role ERP plays as the necessary infrastructure that forms the operational and transactional system of record for companies of all types
www.aberdeen.com Fax: 617 723 7897

Measuring the ROI of ERP in SMB Page 5
© 2009 Aberdeen Group. Telephone: 617 854 5200 www.aberdeen.com Fax: 617 723 7897
and sizes, thereby making it a necessary tool to control costs while also improving customer response times.
The Maturity Class Framework Aberdeen used five key performance criteria to distinguish the Best-in-Class from Industry Average and Laggard organizations. These Key Performance Indicators (KPIs) were chosen not only because every company should be measuring them, but also because a well executed ERP implementation can have a very significant impact on these metrics. Inventory will play a more significant role for manufacturers than for other industries, but inventory, in any form, is an asset that must be measured.
Table 1: Top Performers Earn Best-in-Class Status
Definition of Maturity Class Mean Class Performance
Best-in-Class: Top 20% of aggregate performance scorers
22% reduction in inventory levels 19% reduction in operational costs 22% reduction in administrative costs 94% complete and on-time delivery 93% inventory accuracy
Industry Average: Middle 50% of aggregate
performance scorers
11% reduction in inventory levels 6% reduction in operational costs 8% reduction in administrative costs
“As we re-developed our processes in moving from our previous software to an ERP solution, we were able to automate a lot of the processes behind the scenes with the new system. Our general manager and CEO look at how we have been able to eliminate unnecessary labor, which is proof enough for them. We have definitely realized substantial labor savings because of ERP.”
~Logistics Manager, Small Plastics Manufacturer
91% complete and on-time delivery 91% inventory accuracy
2% reduction in inventory levels Laggard:
Bottom 30% of aggregate
performance scorers
0% reduction in operational costs 1% increase in administrative costs 77% complete and on-time delivery 84% inventory accuracy
Source: Aberdeen Group, March 2009
The selection and implementation of an ERP solution is a very significant undertaking. The length of time from initial installation to the first go-live milestone for the average SMB is almost 10 months, and implementation efforts continue long after the first milestones are reached. The average SMB spends somewhere between $290,370 on software and services (for companies under $50 million in annual revenues) to $1,381,431 (for companies with revenues between $100 and $250 million). Given this level of investment, one would think ROI would be top of mind for most companies. Yet 12% of SMBs never estimate ROI in order to cost justify an ERP project and 24% never measure the ROI after the completion of ERP projects (Figure 2). While these percentages represent a non-trivial portion of the companies surveyed, they have also shrunk significantly in the last two years, since Aberdeen last collected similar responses. In January 2007, we

Measuring the ROI of ERP in SMB Page 6
© 2009 Aberdeen Group. Telephone: 617 854 5200 www.aberdeen.com Fax: 617 723 7897
found 32% of companies never estimated ROI to cost justify ERP projects and 33% never measured the actual return on those investments.
Figure 2: How Often ROI is Considered
24%25%
48% 51%40%
12%
0%
30%
60%
Estimate ROI Measure ROI
Always Sometimes Never
Source: Aberdeen Group, March 2009
Whether this increased attention to ROI has resulted from the uncertainty of our troubled economic times, or other circumstances, the shift in focus is reassuring. Now is not the time to put ERP projects with cost-cutting potential on hold.
The Best-in-Class PACE Model To achieve these significant returns from an ERP solution, a combination of strategic actions, organizational capabilities, and enabling technologies are required. These are summarized as shown in Table 2.
Table 2: The Best-in-Class PACE Framework
Pressures Actions Capabilities Enablers Must reduce costs Standardize and
accelerate business processes Provide visibility to business processes across functions and departments
ROI is estimated up-front in order to cost justify projects and calculated at the completion of each project Dedicated resources are assigned throughout ERP implementation
“We looked at the loaded cost of implementing ERP - the maintenance, time, and our capitalized labor - and came up with what it would cost. Then we looked at what we gain from it by estimating labor savings from the business process changes, and applied those to an income statement to come up with an ROI over how long it would take to get to a positive impact.”
~ IT Manager, Mid-size Clothing Manufacturer and
Distributor
Integrated ERP Business Intelligence (BI) platform and tools Corporate / Enterprise Performance Management (EPM) From summary data, decision-makers can
drill down to transactions that form the fiscal and operational audit trail
Workflow automation / Business Process Management (BPM) Real-time visibility into status of all
processes from quote to cash Event management Business benefits of ERP are measured
Source: Aberdeen Group, March 2009
Best-in-Class Strategies Seldom do we see significant variation in the ERP strategies between those that are Best-in-Class and those that are not. Companies of all types and sizes understand that the primary function of ERP is to standardize and
Measuring the ROI of ERP in SMB Page 7
© 2009 Aberdeen Group. Telephone: 617 854 5200
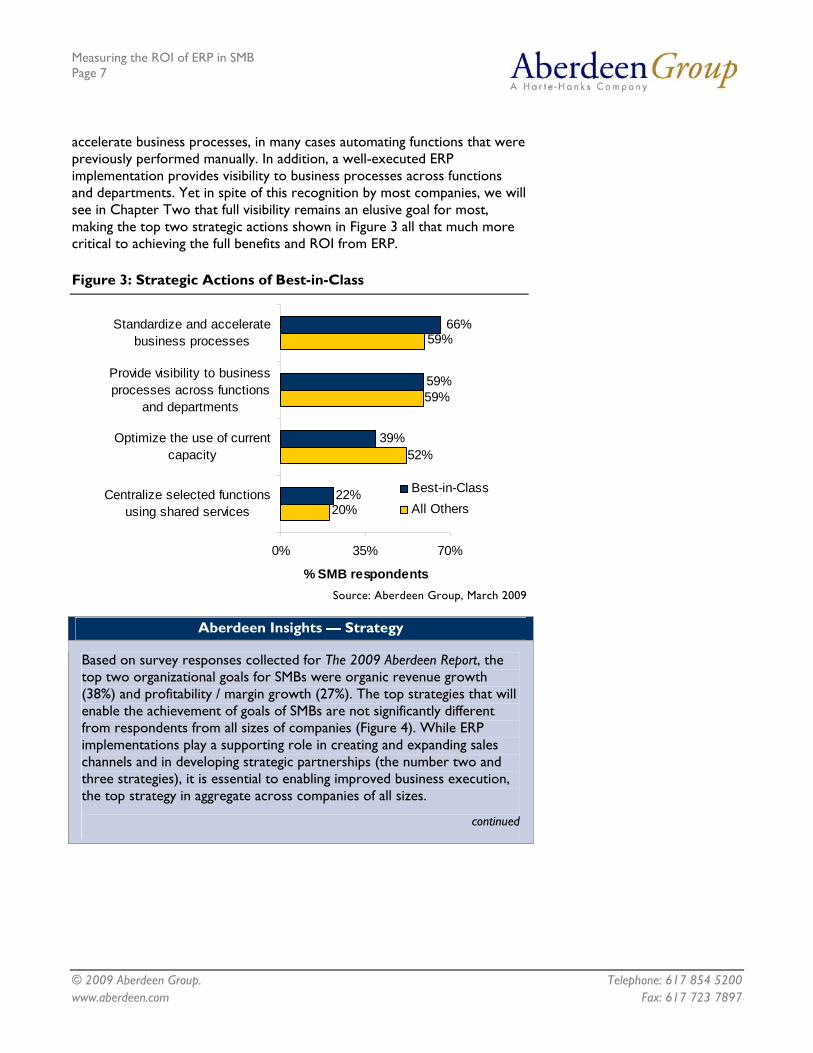
accelerate business processes, in many cases automating functions that were previously performed manually. In addition, a well-executed ERP implementation provides visibility to business processes across functions and departments. Yet in spite of this recognition by most companies, we will see in Chapter Two that full visibility remains an elusive goal for most, making the top two strategic actions shown in Figure 3 all that much more critical to achieving the full benefits and ROI from ERP.
Figure 3: Strategic Actions of Best-in-Class
22%
39%
59%
66%
20%
52%
59%
59%
0% 35% 70%
Standardize and acceleratebusiness processes
Provide visibility to businessprocesses across functions
and departments
Optimize the use of currentcapacity
Centralize selected functionsusing shared services
% SMB respondents
Best-in-ClassAll Others
Source: Aberdeen Group, March 2009
Aberdeen Insights — Strategy
Based on survey responses collected for The 2009 Aberdeen Report, the top two organizational goals for SMBs were organic revenue growth (38%) and profitability / margin growth (27%). The top strategies that will enable the achievement of goals of SMBs are not significantly different from respondents from all sizes of companies (Figure 4). While ERP implementations play a supporting role in creating and expanding sales channels and in developing strategic partnerships (the number two and three strategies), it is essential to enabling improved business execution, the top strategy in aggregate across companies of all sizes.
continued
www.aberdeen.com Fax: 617 723 7897

Measuring the ROI of ERP in SMB Page 8
© 2009 Aberdeen Group. Telephone: 617 854 5200
Aberdeen Insights — Strategy
Figure 4: Top Strategies for Enabling Achievement of Goals
34%
25%
39%
42%
49%
30%
36%
28%
24%
39%
44%
58%
22%
34%
28%
53%
0% 20% 40% 60% 80%
Re-engineer processes
Staff development / expansion
Reduce cost of materials /production
Improve brand visibility
Develop new products andservices
Develop strategic partnerships
Create / expand sales channels
Improve business execution
% Respondents
SMBAll respondents
Source: Aberdeen Group, March 2009
The top two strategies behind ERP implementations of standardizing and accelerating business processes and providing visibility across the enterprise are both critical to improved business execution. Without the supporting infrastructure that ERP provides as a system of record for the business, execution is severely handicapped, which makes ERP a critical success factor in achieving overall business goals.
In the next chapter, we will see what the top performers are doing to achieve these gains.
www.aberdeen.com Fax: 617 723 7897

Measuring the ROI of ERP in SMB Page 9
© 2009 Aberdeen Group. Telephone: 617 854 5200
Chapter Two: Benchmarking Requirements for Success
Sous-Vide Cooking Process
Sous-Vide means “under vacuum." It is the technology, science, method, and art of slow cooking food and sauces at low temperatures under vacuum seal (usually immersed in water). Recognized by some of the world’s most renowned chefs as a revolutionary method that is changing the face of professional cooking, it results in food with 10% to 15% more moisture content than other cooking methods provide, resulting in 50% better holding time and a moist entrée with precise taste, texture and color.
Fast Facts
√ 100% of the Best-in-Class use ROI estimates to cost justify ERP projects
√ 94% of the Best-in-Class measure the ROI of certain types of ERP projects; 68% measure the ROI of ERP replacements and 63% measure the ROI of all capital purchases
√ 42% of the Best-in-Class continue to monitor ROI after it has been achieved
√ The Best-in-Class have 33% more aggressive plans but are 150% more likely to meet expectations of ROI within the estimated timeframe
The implementation of an ERP solution is a very significant investment in terms of time and money. While many feel compelled to make this investment simply because they view ERP as a necessary infrastructure to support the business, best practices for maximizing the benefits from such a solution involve the measurement of reduction in costs, improvement in schedule performance and customer satisfaction, and the ability to redeploy employees to add more value to the organization.
Case Study — Cuisine Solutions
Cuisine Solutions produces and markets premium, fully cooked, frozen entrees for banquet, airline, passenger rail service, retail, military and restaurant industries. Having pioneered the sous-vide cooking method in the United States, the company, headquartered in Alexandria, Virginia, employs 350 people (full time and part time). Cuisine Solutions has developed a niche in the food market due to its portioning and cooking style, producing approximately 200,000 lbs of product weekly in the US.
"When I first joined the company I found out all of our US operation was on a DOS-based system," said Ron Zilkowski, CFO. "They took me over to see the system and at first glance I said 'DOS?' Yes, this was a DOS-based version of an MRP system that had been acquired by [a major ERP solution provider] and it would costs us a couple hundred thousand dollars to upgrade to the most recent version. And oh, by the way, we were out of seat licenses so we would need to buy more seats and we would need another couple hundred thousand in new equipment.”
He continued, "As the new CFO, I knew I could not cost justify the upgrades in cost for equipment, software, etc. if all we did was upgrade and continue doing what we already did. We needed to introduce technology into the plant, not on the outside, after the fact.” Zilkowski explained that the company was growing fast and needed to upgrade their systems because they were badly out of date, reporting for production needed an overhaul, and they needed to be Sarbanes-Oxley Compliant with protected and secure systems. “We needed an integrated solution, but … we had limited resources. We needed a fast implementation that could handle constantly evolving processes, a system that would be easy to maintain but be secure," he said.
continued
www.aberdeen.com Fax: 617 723 7897

Measuring the ROI of ERP in SMB Page 10
© 2009 Aberdeen Group. Telephone: 617 854 5200 www.aberdeen.com Fax: 617 723 7897
Case Study — Cuisine Solutions
Cuisine Solutions had a four-person IT team, and no desire to hire additional help. They looked at traditional deployments and discovered the solution, with hardware, software and services, would cost over $1 million in addition to ongoing maintenance fees.
“So we opted for a different approach, one that could be viewed as an operating cost instead of a capital purchase. We needed a software solution that would be easy to install but could be hosted or run on-demand - Software as a Service [SaaS],” said Zilkowski .
Since implementation, there have been many success stories. The initial benefits include:
• Knowing more about the company’s costs (this has not yet been translated to production and manufacturing labor improvements)
• Realizing improvements in raw material costs and recipe utilization – they have better traceability
• Workers now feel they are involved with reporting due to the full-feature accounting system that takes seconds to consolidate
• Customers love the improved confirmations and clearer invoicing
When asked about the secrets to Cuisine Solutions' success, Zilkowski said, "Establish constant small benchmarks and assessments; constantly remind people of the benefits and small successes should be promoted in the organization along the way."
Competitive Assessment Aberdeen Group analyzed the aggregated metrics of surveyed companies to determine whether their performance ranked as Best-in-Class, Industry Average, or Laggard. In addition to having common performance levels, each class also shared characteristics in five key categories: (1) process (the ability of the organization to measure ROI); (2) organization (corporate focus and collaboration among stakeholders); (3) knowledge management (contextualizing data and exposing it to key stakeholders); (4) technology (the selection of appropriate tools and effective deployment of those tools); and (5) performance management (the ability to deliver against expectations of ROI). These characteristics (identified in Table 3) serve as a guideline for best practices, and correlate directly with Best-in-Class performance across the key metrics.

Measuring the ROI of ERP in SMB Page 11
© 2009 Aberdeen Group. Telephone: 617 854 5200 www.aberdeen.com Fax: 617 723 7897
Table 3: The Competitive Framework
Best-in-Class Average Laggards ROI is estimated to cost justify ERP projects
100% 91% 75%
ROI is calculated after the completion of an ERP project
94% 83% 55%
ROI of an ERP project is calculated periodically even after it has been achieved
Process
42% 24% 7%
Dedicated resources are/were assigned throughout ERP implementation project Organization
66% 58% 56%
From summary data, decision-makers can drill down to transactions that form the fiscal and operational audit trail
65% 45% 34%
Real time visibility into status of all processes from quote to cash
Knowledge
45% 33% 24%
Tools used to monitor the business benefits derived from ERP implementations:
Technology
58% use dashboards displaying data from installed applications in real-time 79% use advanced analytics and BI 74% use reporting capabilities of the installed applications
52% use dashboards displaying data from installed applications in real-time 50% use advanced analytics and BI 70% use reporting capabilities of the installed applications
25% use dashboards displaying data from installed applications in real-time 25% use advanced analytics and BI 50% use reporting capabilities of the installed applications
Successfully achieved ROI in the projected timeline at the Divisional level
58% 30% 13%
Successfully achieved ROI in the projected timeline at the Corporate level
Performance
53% 30% 6%
Source: Aberdeen Group, March 2009

Measuring the ROI of ERP in SMB Page 12
© 2009 Aberdeen Group. Telephone: 617 854 5200
Capabilities and Enablers “In terms of measuring ROI, we know the costs of the IT department. By shutting down some of the non-integrated packages, we look at 'total in' and 'total out.' But the part that will be hard to measure is improved functionality and integration, which are two of the top criteria we are looking at from our new ERP system. A lot of our databases are not integrated right now, which has been a challenge for us.”
~Brian Bulman, Manufacturing Manager, Hardigg Industries
Based on the findings of the Competitive Framework and interviews with end users, Aberdeen’s analysis of the Best-in-Class demonstrates ERP is a mission critical component in the pursuit of corporate goals. Because of the significant investment companies make in ERP implementations, the total cost of ownership is important and includes factors such as hardware, software, services, maintenance, as well as internal costs of dedicated or part-time resources. By looking beyond TCO to ROI, the other side of the equation is opened - monetizing the gains.
Process Best-in-Class companies are 33% more likely to utilize ROI estimates to cost justify ERP projects than Laggards and 71% more likely to measure the results when the projects are completed. While 100% of the Best-in-Class use ROI estimates to cost justify projects, not every project comes under the same level of scrutiny (Figure 5).
Figure 5: Do You Estimate ROI to Cost Justify ERP Projects?
9%25%
53% 59%
28%
47% 33%
47%
0%
0%
50%
100%
Best-in-Class Industry Average Laggard
Always Sometimes Never
Source: Aberdeen Group, March 2009
“We used consultants to help us with establishing the benefits realization, and a strategic view on the program, and also QA. They were extremely important because they provided the guidance and methodology for determining the ROI of our ERP platform.”
~ Business Transformation Program Director, National
food distributor
The event which is most likely to trigger the estimation of ROI in order to cost justify the expense is the replacement of an existing ERP solution (Figure 6). Drivers behind replacements are varied, including the need for more functionality (48%) and outdated or clumsy interfaces (41%) which inhibit ease of use. The desire to consolidate or rationalize multiple ERP solutions is more prevalent in larger companies, but is still a key factor in 34% of those planning to replace their current solution. SMBs overall are 25% more likely to require this level of cost justification for replacements than for the initial purchase, which is almost always deemed as a capital purchase, unless the implementation is delivered entirely on demand in the mode of Software as a Service (SaaS) which can allow a company to treat the purchase as an operating expense. For Best-in-Class companies in particular, the replacement of ERP modules or extensions requires a similar level of justification.
www.aberdeen.com Fax: 617 723 7897

Measuring the ROI of ERP in SMB Page 13
© 2009 Aberdeen Group. Telephone: 617 854 5200
Figure 6: Events Which Trigger Cost Justification
Modules versus Extensions
Aberdeen is careful to distinguish between a “module” of ERP and an “extension.” All the modules of ERP use a single data base model. Integration is built in and there is little or no redundancy of data elements, except where there is a specific need. A module is built with the same development tools, on the same architecture as core ERP. While a module can be implemented incrementally, its release cycle is in lock step with the remainder of the core ERP modules.
The simplest definition of an extension to ERP is an enterprise application that extends the functionality, but is separate.
42%
74%
74%
79%
84%
89%
21%
50%
59%
58%
50%
74%
0% 50% 100%
A Minor upgrade
Any new purchase (modules,users, etc.)
A major upgrade
Any capital purchase
Replacement of ERP modules/ extensions
Replacement of ERP
Best-in-ClassAll Others
Source: Aberdeen Group, March 2009
It makes good business sense that replacement activity requires the most scrutiny since an existing application is presumably already bringing value to the enterprise, while a new purchase will most likely be filling a need that has not been previously satisfied.
Figure 7: Do You Measure the ROI of Completed ERP Projects?
17%
45%
38% 29%14%
56%55%
41%
6%
0%
50%
100%
Best-in-Class Industry Average Laggard
Always Sometimes Never
Source: Aberdeen Group, March 2009
While ROI appears to be a useful tool to cost justify projects, companies are less likely to follow up by measuring the ROI at the completion of a project (Figure 7). In looking at which of these same events prompt the measurement of ROI at the completion of the project, we see percentages decrease in aggregate by an average of 18% for Best-in-Class and 22% for all others (Industry Average and Laggards combined) as compared to those estimating ROI (Figure 8).
The relative priorities of ROI measurement remain the same with one exception. While all companies are most likely to calculate the ROI of
www.aberdeen.com Fax: 617 723 7897

Measuring the ROI of ERP in SMB Page 14
© 2009 Aberdeen Group. Telephone: 617 854 5200
replacing ERP, once a module or extension is replaced, the priority of measuring the benefit of that partial replacement of the overall solution drops in relation to other activities, even below the percentage of those measuring the results of implementing new modules or replacements. Almost half of the Best-in-Class (47%) and over three quarters of all others (77%) appear to take the resultant benefit for granted once the decision is made. This is particularly dangerous when an embedded module is replaced with an extension, since the initial cost of integration may not reflect the total cost over time to maintain that level of integration. The cost of the replacement can continue to increase over time, requiring additional benefits in order to produce an ROI.
Figure 8: Events Which Trigger ROI Measurement
32%
53%
58%
58%
63%
68%49%
40%
35%
24%
23%
6%
0% 50% 100%
A Minor upgrade
Replacement of ERP modules/ extensions
Any new purchase (modules,users, etc.)
A major upgrade
Any capital purchase
Replacement of ERP
Best-in-ClassAll Others
Source: Aberdeen Group, March 2009
For those who do not measure ROI some or all the time, the reasons for neglecting this important process are varied (Figure 9). The reason most often cited is the one that is the most suspect. Pleading the case that ROI is too hard to measure is an excuse. The most successful ERP implementations have clear objectives, often based in planned cost reductions, schedule and accuracy improvements that can result in improved customer satisfaction or the ability to re-deploy headcount to add more value to the business as processes are automated. Where these are not identified, quantified and measured, fewer gains are realized.
www.aberdeen.com Fax: 617 723 7897

Measuring the ROI of ERP in SMB Page 15
© 2009 Aberdeen Group. Telephone: 617 854 5200
Figure 9: Reasons for Not Considering ROI
48%
29%
33%
24%
0% 25% 50%
ROI is too hard to measure
We simply manage against ourIT budget
ERP is viewed as a necessarycost of doing business
Don't have the necessary tools
% All SMB Respondents Source: Aberdeen Group, March 2009
Not only are Best-in-Class more likely to measure ROI at the completion of a project, 42% continue monitoring of ROI after it has been achieved as compared to 24% of Industry Average and only 7% of Laggards. This supports Aberdeen's contention that an ERP implementation is never "done" and there are always more ways to continue to drive additional value from the application.
Organization Management commitment has long been touted as a cornerstone of a successful ERP implementation. Nothing speaks more clearly to the commitment of upper management than the dedication of the staff required to not only begin the project, but to see it through to completion. Those best qualified to lead the initial implementation are the people the company can least afford to remove from their normal day-to-day responsibilities. Yet if allowed to see the project through to the achievement of the expected ROI, the dedication of resource is far easier to justify.
Knowledge Management Providing visibility across departments and functions was a top strategy of both the Best-in-Class and all others (both at 59%). Yet less than half of our top performers (45%) have achieved full visibility throughout the quote to cash cycle. At the same time, 65% have the ability for decision-makers to drill down from summary data, all the way to the detailed transactions that form the fiscal and operational audit trail. Given this drill-down capability, what prevents the Best-in-Class from having full visibility? The most logical explanation is that either the ERP implementation stops short of standardizing and accelerating all the business processes from quote to cash or not all stakeholders have access to these capabilities. In either or both cases, the ERP solution is not complete and implementation has fallen short of its full potential.
If the technical capability exists, but has not produced the desired or needed level of visibility, business benefits are being left on the table. Industry Average and Laggards suffer from the same missed opportunities.
www.aberdeen.com Fax: 617 723 7897

Measuring the ROI of ERP in SMB Page 16
© 2009 Aberdeen Group. Telephone: 617 854 5200
Technology Twenty four percent (24%) of SMBs point to the lack of tools necessary to accurately measure the ROI of ERP projects. Yet many of those tools exist within the application for which the ROI should be measured. In fact reporting capabilities of the applications themselves are the second most prevalent means Best-in-Class use to monitor the business benefits of implementation (Figure 10), second only to analytics and BI. Many ERP solutions have embedded BI capabilities today, including dashboards which may be configured to a specific role in the company. These capabilities have emerged within the last few years and therefore those companies stuck on older releases, based on less robust technology will not be able to take advantage of these capabilities. Yet regardless of whether these dashboards, analytics or BI tools are embedded, layered on top of, or implemented side by side with the applications, the real value lies in being able to display data from installed applications in real time, without having to synchronize or batch data.
Figure 10: Tools Used to Monitor Business Benefits
42%
67%
56%
41%
62%
40%
47%
53%
58%
58%
74%
79%
0% 25% 50% 75% 100%
Ad hoc report writer and querycapabilities
Spreadsheets
Custom reporting
Dashboards displaying datafrom installed applications in
real-time
Reporting capabilities of theinstalled application
Advanced analytics andBusiness Intelligence (BI)
Best-in-Class
All Others
Source: Aberdeen Group, March 2009
Performance Management Best-in-Class companies have more aggressive plans for achieving ROI, and, not surprisingly, have an increased likelihood of achieving those goals (Figure 11). Aberdeen investigated both planned and actual timelines for achieving ROI at both the division and corporate levels. Sixty-nine percent (69%) of the Best-in-Class projected ROI to be achieved within two years at the division level and 74% actually achieved ROI within a two year window. Since only 58% of the Best-in-Class actually achieved their projected timeline, we see that a subset exceeded expectations, in some cases shortening the timeline of achieved ROI from three years down to two, or from two years down to one. Compare this to those not Best-in-Class and we find only 33% achieving ROI in the division within two years.
www.aberdeen.com Fax: 617 723 7897

Measuring the ROI of ERP in SMB Page 17
© 2009 Aberdeen Group. Telephone: 617 854 5200
Figure 11: Successfully Achieved ROI in Projected Timeline
58%53%
30% 30%
13%6%
0%
25%
50%
75%
Division Corporate
Best-in-Class Industry Average Laggard
Source: Aberdeen Group, March 2009
We found similar results at the corporate level, but extended by about four to six months. Overall we found the Best-in-Class to be 33% more aggressive in their plans and more than 150% more likely to meet expectations of ROI in the estimated period of time. This indicates that setting realistic, but demanding goals produces the best results.
Aberdeen Insights — Where Does ROI Come From?
The source of ROI can vary from company to company. Figure 12 displays those factors considered as gains in the ROI of ERP.
Figure 12: Savings Factors Considered in ROI
47%
38%
53%
50%
66%
67%
68%
68%
74%
79%
84%
84%
84%
95%
50%
59%
56%
57%
63%
54%
70%
65%
63%
89%
0% 50% 100%
Reduction or redeployment ofheadcount
Increase in value-add delivered tocustomers
Reduction in Waste
Reduction in inventory costs
Reduction of generaladministrative costs
Better utilization of resources
Increased profits
Reduction in operational costs
Best-in-ClassIndustry Average
Laggard
Source: Aberdeen Group, March 2009
continued
www.aberdeen.com Fax: 617 723 7897
Measuring the ROI of ERP in SMB Page 18
© 2009 Aberdeen Group. Telephone: 617 854 5200 www.aberdeen.com Fax: 617 723 7897
Aberdeen Insights — Where Does ROI Come From?
For some, manufacturers in particular, the reduction in inventory alone can pay for the ERP solution. Think in round numbers. If you have $1,000,000 of inventory, even our Industry Average companies were able to reduce inventory by 11% through better inventory accuracy, better visibility to demand and improved agility in responding to that demand. This translates to a savings of $110,000. The Best-in-Class double that.
Perhaps you are not a manufacturer with those levels of direct material inventory. Instead consider overall administrative costs associated with processes that are still manual or are not streamlined and optimal. Automate simple processes such as three-way matching between purchase orders, receipts and vendor invoices. This can remove clerical effort and speed the process to avoid missed prompt-payment discounts or over-payments. This impacts both operational costs as well as administrative costs, providing even more opportunity for savings.
Add to this lower operational cost from improved scheduling, better utilization of resources and better responsiveness to customers, all primary business drivers behind ERP strategies. Through automation of manual processes, consider redeployment of full time employees to tasks which provide more value to the organization.
Altogether the potential for return on the ERP investment is powerful.

Measuring the ROI of ERP in SMB Page 19
© 2009 Aberdeen Group. Telephone: 617 854 5200
Chapter Three: Required Actions
Whether a company is trying to move its performance in obtaining ROI from ERP from Laggard to Industry Average, or Industry Average to Best-in-Class, the following actions will help spur the necessary performance improvements:
Fast Facts
√ The Best-in-Class are 33% more likely to utilize ROI estimates to cost justify ERP projects and 71% more likely to measure the results when projects are completed
√ 45% of Laggards "don't know" operational cost savings as a result of ERP in spite of the fact that 58% are manager level and above
√ The Best-in-Class set 33% more aggressive goals for the projected timeline for ROI, yet are over seven-times more likely to meet those objectives than Laggards
√ The Best-in-Class are five-times more likely than Laggards to continue to monitor and measure ROI after it has been achieved
Laggard Steps to Success • Determine the objective for each ERP project, including
new implementations, replacements of entire systems, modules or extensions, upgrades and customizations. Where minor upgrades are necessary for bug fixes, support of new hardware, middleware or databases, and/or regulatory requirements, don't dwell on the obvious. But each discretionary project should have stated goals of cost savings, margin improvements or other operational enhancements, along with a projected timeline for achieving them. Make the organization "stretch" to reach those goals. The Best-in-Class set 33% more aggressive goals, yet are over seven-times more likely to achieve them in the projected timeframe.
• Determine the baseline performance before you begin a project. Put a stake in the ground from which to measure. If you have yet to implement ERP, this may require manual efforts, but balance sheet and profit and loss statements can provide an easy starting point.
• Monitor business benefits. While the reduction of cost was the top business driver of ERP strategies for 41% of Laggard companies, 19% do not measure reductions in inventory and 21% do not measure reductions in operational and administrative costs as a result of ERP. What gets measured gets managed. The reporting capabilities of your ERP should provide a good starting point for gaining visibility to cost reductions. Not only do 19% to 21% not measure these cost reductions, but an additional 37% to 45% simply "don't know." Granted, this may not be an organizational failure, but considering 58% of Laggard respondents were manager level and above, this points to the fact that many decision-makers do not have direct access to the results which can easily be detected through standard ERP reporting.
Industry Average Steps to Success • Dedicate the necessary resources to ERP projects and
allow the team to see the project through to completion, where completion means achieving the expected ROI. Industry Average companies do not differentiate themselves from Laggards in dedicating staff to implementations (58% of Industry
www.aberdeen.com Fax: 617 723 7897

Measuring the ROI of ERP in SMB Page 20
© 2009 Aberdeen Group. Telephone: 617 854 5200 www.aberdeen.com Fax: 617 723 7897
Average and 56% of Laggards do so). As a result, they run the risk of stopping short of reaching the full benefits that can be attained in terms of cost reductions, improvements in schedules, and further business benefits. Measuring the success of the project by these criteria will ensure a more complete implementation and better ROI. Oftentimes the best people to dedicate to the project are the people you can least afford to reassign from their "real jobs."
• Improve visibility to data in ERP. Only a third (33%) of Industry Average performers have real time visibility to all processes from quote to cash, although 45% have the technical capability that allows decision-makers to drill down from summary data to the transactional level. Providing improved visibility may mean providing easy and direct access to more decision makers in the organization. Or it may mean providing better tools to make the data more easily consumed. Forcing managers to wade through mountains of detail to get an answer is a sure fire way to make them look elsewhere for answers.
• Continue to monitor and measure ROI after initial projections of savings have been achieved. Reaching the inflection point where the implementation of ERP has paid for itself is no reason to stop expecting additional benefits. The Best-in-Class are 75% more likely to continue to look for added gains, either through additional savings from existing efforts (more cost reductions, better scheduling, improved customer satisfaction, etc.) or with the next ERP project that may upgrade or extend an implementation.
Best-in-Class Steps to Success • Implement dashboards that display data from ERP and
other integrated applications in real time. While 79% of the Best-in-Class are using analytics and BI to monitor the business, only 58% are using configurable dashboards. Only a trivial few indicated they did not know the cost savings and operational improvements as a result of ERP, but 55% of Best-in-Class claim not to have full visibility from quote to cash. By contextualizing data and making it easier to consume, decision makers can not only keep a finger on the pulse of the business, but can determine when cost savings make it feasible, or even necessary, to attack the next cost-saving project.
• Consider other sources of ROI. While 95% of the Best-in-Class expect ROI from operational cost savings and 84% factor in reduction in administrative costs, better utilization of resources and increased profits, fewer top performers (68%) consider increases in value-add delivered to customers or the opportunity to reduce or re-deploy headcount. In a world of automation and self-service, those companies which can successfully differentiate themselves

Measuring the ROI of ERP in SMB Page 21
© 2009 Aberdeen Group. Telephone: 617 854 5200 www.aberdeen.com Fax: 617 723 7897
with added value provided to the customer will thrive which those with a focus on internal metrics will struggle to excel.
Aberdeen Insights — Summary
A well-managed ERP implementation can be a continuing source of cost savings and operational improvements which help companies survive and thrive in these troubled economic times. The strategic goals of standardizing and accelerating business processes and providing improved visibility are essential to improving business execution, which in turn supports the organizational goals of revenue and profit growth. While the total cost of ERP ownership is important to monitor and optimize, focusing on TCO is no longer sufficient. Focus must now expand to include ROI of ERP projects in order to justify continued investment and maximum benefits. With the downturn in the economy, a knee jerk reaction may be to stop any discretionary spending on ERP projects just when their cost-saving, operation improving potential is needed the most. Given the current economic uncertainty, it is now more critical than ever to keep these ERP projects alive.

Measuring the ROI of ERP in SMB Page 22
© 2009 Aberdeen Group. Telephone: 617 854 5200
Appendix A: Research Methodology
Between January and February 2009, Aberdeen examined the use, the experiences, and the intentions of more than 920 small to mid-size enterprises using ERP in a diverse set of industries.
Study Focus
Responding professionals completed an online survey that included questions designed to determine the following:
√ The degree to which ERP is deployed in their operations and the business benefits are monitored
√ The structure and effectiveness of existing ERP implementations
√ Current and planned use of ERP
√ The business benefits that have been derived from ERP initiatives
The study aimed to identify emerging best practices for measuring the ROI of ERP in SMBs, and to provide a framework by which readers could assess their own management capabilities.
Aberdeen supplemented this online survey effort with interviews with select survey respondents, gathering additional information on ERP strategies, experiences, and results.
Responding enterprises included the following:
• Job title / function: The research sample included respondents with the following job titles: C-Level (27%); EVP/SVP/VP/GM (4%); Director (11%); Manager (26%); Consultant (7%); IT (12%); and other (14%).
• Industry: The research sample included respondents from the following industries: general manufacturing (34%); automotive (10%); industrial equipment manufacturing (11%); aerospace and defense (10%); metals and metal products (10%); high technology (11%); consumer goods (10%); and other (11%); and more (respondents were allowed to select multiple industries).
• Geography: The majority of respondents (76%) were from the Americas. Remaining respondents included those from the Asia-Pacific region (11%) and Europe, the Middle East and Africa (12%).
• Company size: Fifty seven percent (57%) of respondents were from small enterprises (annual revenues below US $50 million); 24% were from midsize enterprises with annual revenues between $50 million and $100 million; and 19% of respondents were from mid-size businesses with revenues between $100 million and $250 million).
• Headcount: Sixteen percent (16%) of respondents were from larger mid-size enterprises (headcount greater than 500 employees); 51% were from midsize enterprises (headcount between 100 and 500 employees); and 32% of respondents were from small businesses (headcount between 1 and 99 employees).
Solution providers recognized as sponsors were solicited after the fact and had no substantive influence on the direction of this report. Their sponsorship has made it possible for Aberdeen Group to make these findings available to readers at no charge.
www.aberdeen.com Fax: 617 723 7897

Measuring the ROI of ERP in SMB Page 23
© 2009 Aberdeen Group. Telephone: 617 854 5200
Table 4: The PACE Framework Key
Overview Aberdeen applies a methodology to benchmark research that evaluates the business pressures, actions, capabilities, and enablers (PACE) that indicate corporate behavior in specific business processes. These terms are defined as follows: Pressures — external forces that impact an organization’s market position, competitiveness, or business operations (e.g., economic, political and regulatory, technology, changing customer preferences, competitive) Actions — the strategic approaches that an organization takes in response to industry pressures (e.g., align the corporate business model to leverage industry opportunities, such as product / service strategy, target markets, financial strategy, go-to-market, and sales strategy) Capabilities — the business process competencies required to execute corporate strategy (e.g., skilled people, brand, market positioning, viable products / services, ecosystem partners, financing) Enablers — the key functionality of technology solutions required to support the organization’s enabling business practices (e.g., development platform, applications, network connectivity, user interface, training and support, partner interfaces, data cleansing, and management)
Source: Aberdeen Group, March 2009
Table 5: The Competitive Framework Key
Overview The Aberdeen Competitive Framework defines enterprises as falling into one of the following three levels of practices and performance: Best-in-Class (20%) — Practices that are the best currently being employed and are significantly superior to the Industry Average, and result in the top industry performance.
In the following categories: Process — What is the scope of process standardization? What is the efficiency and effectiveness of this process? Organization — How is your company currently organized to manage and optimize this particular process?
Industry Average (50%) — Practices that represent the average or norm, and result in average industry performance.
Knowledge — What visibility do you have into key data and intelligence required to manage this process? Technology — What level of automation have you used to support this process? How is this automation integrated and aligned?
Laggards (30%) — Practices that are significantly behind the average of the industry, and result in below average performance. Performance — What do you measure? How
frequently? What’s your actual performance?
Source: Aberdeen Group, March 2009
Table 6: The Relationship Between PACE and the Competitive Framework
PACE and the Competitive Framework – How They Interact Aberdeen research indicates that companies that identify the most influential pressures and take the most transformational and effective actions are most likely to achieve superior performance. The level of competitive performance that a company achieves is strongly determined by the PACE choices that they make and how well they execute those decisions.
Source: Aberdeen Group, March 2009
www.aberdeen.com Fax: 617 723 7897

Measuring the ROI of ERP in SMB Page 24
© 2009 Aberdeen Group. Telephone: 617 854 5200 www.aberdeen.com Fax: 617 723 7897
Appendix B: Related Aberdeen Research
Related Aberdeen research that forms a companion or reference to this report include:
• The 2008 ERP in Manufacturing Benchmark Report; June 2008
• 2007 ERP in Manufacturing Benchmark; July 2007
• The Order-to-Cash Cycle: Integrating Business Processes to Improve Operational Performance; March 2008
• ERP Plus in Process Industries; November 2008
• ERP in SMB: Exploring Growth Strategies; December 2007
• ERP in Industrial Machinery and Components Manufacturing; November 2007
• ERP in Complex Manufacturing: Improving Collaboration and Visibility, December 2008
• 2008 ERP in the Mid-Market:; August 2008
• The Total Cost of ERP Ownership in Small Companies; August 2008
• The Total Cost of ERP Ownership in Mid-Size Companies; July 2008
• The Total Cost of ERP Ownership in Large Companies; July 2008
Information on these and any other Aberdeen publications can be found at www.Aberdeen.com.
Author: Cindy Jutras, Vice President and Research Fellow, Enterprise Applications, [email protected]
Since 1988, Aberdeen's research has been helping corporations worldwide become Best-in-Class. Having benchmarked the performance of more than 644,000 companies, Aberdeen is uniquely positioned to provide organizations with the facts that matter — the facts that enable companies to get ahead and drive results. That's why our research is relied on by more than 2.2 million readers in over 40 countries, 90% of the Fortune 1,000, and 93% of the Technology 500.
As a Harte-Hanks Company, Aberdeen plays a key role of putting content in context for the global direct and targeted marketing company. Aberdeen's analytical and independent view of the "customer optimization" process of Harte-Hanks (Information – Opportunity – Insight – Engagement – Interaction) extends the client value and accentuates the strategic role Harte-Hanks brings to the market. For additional information, visit Aberdeen http://www.aberdeen.com or call (617) 723-7890, or to learn more about Harte-Hanks, call (800) 456-9748 or go to http://www.harte-hanks.com
This document is the result of primary research performed by Aberdeen Group. Aberdeen Group's methodologies provide for objective fact-based research and represent the best analysis available at the time of publication. Unless otherwise noted, the entire contents of this publication are copyrighted by Aberdeen Group, Inc. and may not be reproduced, distributed, archived, or transmitted in any form or by any means without prior written consent by Aberdeen Group, Inc. 043008a