Problems with ANES Questions Measuring Political Knowledge ...

June 2000
Published by the Engineering Council10 Maltravers StreetLondon WC2R 3ERTel: 020 7240 7891Fax: 020 7240 7517email: [email protected] site: www.engc.org.uk

i
This report is published under the auspices of:
• The Learning and Teaching Support Network (Maths, Stats & OR)
• The Institute of Mathematics and its Applications
• The London Mathematical Society
• The Engineering Council
Acknowledgements
The findings and recommendations in this report emerged
from a seminar at the Møller Centre Cambridge,
10-11 May 1999.
Thanks are extended to the Gatsby Charitable Foundation
who sponsored the seminar; to those who attended and
presented papers or contributed to discussions; and to Trevor
Hawkes and Mike Savage for their efforts in producing
the report.

Preface
Evidence is presented of a serious decline in students mastery of basic mathematical skills and level of preparation
for mathematics-based degree courses. This decline is well established and affects students at all levels. As a result,
acute problems now confront those teaching mathematics and mathematics-based modules across the full range of
universities.
This report is aimed, therefore, at those in Higher Education who teach mathematics-based modules and those
involved with admissions. There is a need for each department to become attuned to the full extent of the problem
as it affects their students. The diagnostic testing of new undergraduates is recommended as an effective means of
achieving this goal.
The report is also aimed at those charged with responsibility for setting the A-level Mathematics curriculum.
Following the many changes introduced in the early 1990’s we would suggest that now is the time to take stock.
ii

Measuring the Mathematics Problem
Summary
Findings
1. At least 60 Departments of Mathematics, Physics and Engineering give diagnostic tests in mathematics to their
new undergraduates.
2. There is strong evidence from diagnostic tests of a steady decline over the past decade of fluency in basic
mathematical skills and of the level of mathematical preparation of students accepted onto degree courses.
Possible reasons for this include:
• changes in GCSE and A Level syllabuses and structures;
• greatly reduced numbers taking A Level Mathematics and Further Mathematics;
• changes in the teaching force and in society;
• lack of practice and poor study skills.
3. There is an increasing inhomogeneity in the mathematical attainments and knowledge of students entering
science and engineering degree programmes. Factors here include:
• insufficient candidates with satisfactory A-level Mathematics grades for the number of degree places
available;
• the freedom of A-level students to choose Statistics as an alternative to Mechanics, a choice that provides
much less reinforcement of the pure mathematics.
4. The decline in skills and the increased variability within intakes are causing acute problems for those teaching
mathematics-based modules across the full range of universities.
5. Diagnostic tests play an important part in
• identifying students at risk of failing because of their mathematical deficiencies,
• targeting remedial help,
• designing programmes and modules that take account of general levels of mathematical attainments, and
• removing unrealistic staff expectations.
6. Diagnostic testing should be seen as part of a two-stage process. Prompt and effective follow-up is essential to
deal both with individual weaknesses and those of the whole cohort.
7. There is a need for greater institutional awareness of the cited problems and for adequate resources to deal with
them.
8. The decline in basic skills is not the fault of the teachers in schools. Compared to their predecessors, they have
to deliver a different curriculum, under very different and difficult circumstances, to quite different cohorts of
students. From primary through to tertiary education, teachers share the common goal of inspiring young
people to take mathematics seriously and to learn it well. They need to work together and to support each other
in providing students with a coherent curriculum and a positive mathematical experience throughout their
education.
iii

9. There is also a need for the mathematics community, and its stakeholders in the broadest sense, to speak with
one voice, to be heard in decision-making processes, and to represent its views effectively to the public through
the media. A great step forward would be the creation of a small but representative Standing Committee for
Mathematics which could act as a two-way conduit between the mathematics community and the bodies taking
decisions affecting mathematics and mathematics education; in particular, the Committee would be given very
early notice of possible government initiatives concerning mathematics and would be in a position to offer
authoritative and representative advice to government and senior civil servants.
Recommendations
1. Students embarking on mathematics-based degree courses should have a diagnostic test on entry.
2. Prompt and effective support should be available to students whose mathematical background is found wanting
by the tests.
3. The possibility of setting up a National Centre for Diagnostic Testing should be closely looked at. It would offer a
flexible test-creation service with a broadly-based and easily-accessible database of questions to a wide range of
educational institutions involved in the teaching and learning of mathematics.
4. In order to develop and monitor a mathematical education that is (i) appropriate to the needs of the 21st century
and (ii) fully integrated from primary through to tertiary levels, the Government should establish a Standing
Committee for Mathematics to include representatives from all sectors and stakeholders.
iv

Measuring the Mathematics Problem
Contents
Acknowledgements i
Preface ii
Summary iii
1 Background and Outline of Report 1
2 Mathematics at the Interface (1960-2000) 2
A Level Mathematics 2
Changes in A Level Mathematics 3
A Level Mathematics Teaching 4
3 Diagnostic Testing in Theory and Practice 5
3.1 Changes in the Competency of A Level Students 6
3.2 Diagnostic Testing in the Department of Mathematics (University of Warwick) 11
4 Provision of Additional Support 15
5 Findings and Recommendations 17
6 Appendices 18
1. Mathematics at the Interface 18
2. A Level Mathematics: the post 16 perspective 19
3. Reviews of Diagnostic Testing 20
4. Further Evidence of the Decline 27
5. List of Participants 28
v
1. Background and Outline of Report
This past decade has seen a serious decline in students’ basic mathematical skills and level of preparation on entry into
Higher Education. At least 60 Departments of Mathematics, Physics and Engineering now give diagnostic tests in basic
mathematics to their new undergraduates. This decline presents a major problem in mathematics based degree courses
right across the Higher Education sector — one which is widely acknowledged.
The problem has become steadily worse since the mid 1990’s when several reports drew attention to the emerging
“mathematics problem” at the sixth form/ HE interface and the inevitable consequences for students entering
undergraduate courses in science and engineering; Institute of Physics (1994), Engineering Council (1995), Institute of
Mathematics and its Applications (1995), London Mathematical Society (1995). In “Tackling the Mathematics
Problem” it was pointed out that (i) Mathematics, Science and Engineering Departments appear unanimous in their
perception of a qualitative change in the mathematical preparedness of incoming students — even among the very
best and (ii) students enrolling on courses making heavy mathematical demands are hampered by a serious lack of
essential technical facility — in particular, a lack of fluency and reliability in numerical and algebraic manipulation
and simplification.
It was to accumulate evidence for the extent of this decline and its effect on first year undergraduate teaching and
learning that a Gatsby Seminar was held on the 10th and 11th May 1999 at the Møller Centre in Cambridge. The
35 participants were mainly practitioners in Higher Education but also included representatives from the
Qualifications and Curriculum Authority, Mathematics in Education and Industry and the Gatsby Technical
Education project.
The Seminar ranged over the following related themes:
• The evolution of Mathematics A-level and other post-16 qualifications; the current situation in schools and
colleges.
• Diagnostic testing in theory and practice.
• Using diagnostic tests to identify individual students’ learning needs, to alert their teachers, and to inform
module and curriculum design.
• How best to provide additional mathematics learning support; especially remedial help, Communications and
Information Technology (CIT) solutions.
• The broader national perspective on teaching and learning and the role of the mathematics community.
As a result the report falls naturally into three main sections and a summary;
Mathematics at the Interface (1960-2000) which maps out the many changes to A level Mathematics and their effect
on HE over the past four decades.
Diagnostic Testing in Theory and Practice examines the testing procedures in use at the Universities of Coventry and
Warwick. They provide evidence of a steady decline in mathematical capabilities over a decade and illustrate that
the decline is affecting even those departments who admit students with very high grades (29 or more points at A
level).
Provision of additional support identifies a range of follow-up strategies by which University Departments are trying
to cope with the problem of mathematical deficiencies. There are no simple solutions in this area. Various avenues
are being explored and best practice has yet perhaps to emerge.
Summary consists of a number of key findings and four recommendations: They may be seen as a way forward in
tackling the Mathematics Problem.
1

2. Mathematics at the Interface (1960-2000)Mike Savage, Ann Kitchen, Ros Sutherland, Roger Porkess
Consisting of four presentations, the opening session aimed to set the scene for the seminar by reviewing (i) the
changing pattern of the A level Mathematics Curriculum over four decades and (ii) the effect of this and other
changes for students entering mathematics-based degree programmes in Higher Education. An outline of the key
developments is given in Appendix 1.
A Level Mathematics: The Golden Age
Attention was drawn to the 1960’s when A level was an entrance examination controlled by the universities and
geared to serve their needs. A level Mathematics consisted mainly of Pure and Mechanics with the latter providing
ample scope for the use and practice of algebra, trigonometry and calculus. With the benefit of hindsight this is
now seen as a “golden age” for A level Mathematics in which able sixth formers, aiming for university, were
inspired and stretched by a very talented teaching force. Students acquired the all important study skills together
with sound mathematical knowledge and understanding which prepared them well for Higher Education.
A Level Mathematics: Changes to the Curriculum
The first major change to the curriculum appeared in the mid 1970’s with the emergence of statistics. Students
entering the sixth form now had a choice of mathematics courses; (i) Pure and Mechanics, (ii) Pure and Statistics,
(iii) Pure and Applied (where the latter included a combination of topics in Applied Mathematics). This departure
from homogeneity in the applications of mathematics generated problems for those teaching mechanics in first
year undergraduate courses — with the result that diagnostic tests and/or additional support for mechanics were
introduced in many universities. For the following decade, science and engineering departments learned to cope
with students having varied backgrounds in Applied Mathematics. Indeed they were able to do so because Pure
Mathematics at A level remained solid and students continued to be generally well prepared with regard to study
skills, problem solving skills and basic mathematical capabilities.
The pace of change quickened in the mid 1980’s. First, Universities lost control of the curriculum with SEC, SEAC,
SCAA and now QCA validating courses. The Government gave the green light for curriculum development and a
series of new, modular-type A level Mathematics courses were designed and trialled. A level was now viewed as a
finishing post at 19 as well as an entrance examination for universities. The GCE examination was replaced by
GCSE which, for Mathematics, brought a decline in students concept of proof and in their technical fluency and
understanding of algebra. At a stroke A level Mathematics was undermined in a key area from which it has not yet
recovered!
New A level Mathematics courses came on stream in the early 1990’s with several new features including (i) a
diminished pure maths common core (40% — reduced to 30%) (ii) a proliferation of modular syllabuses and (iii)
a diversification of content.
2
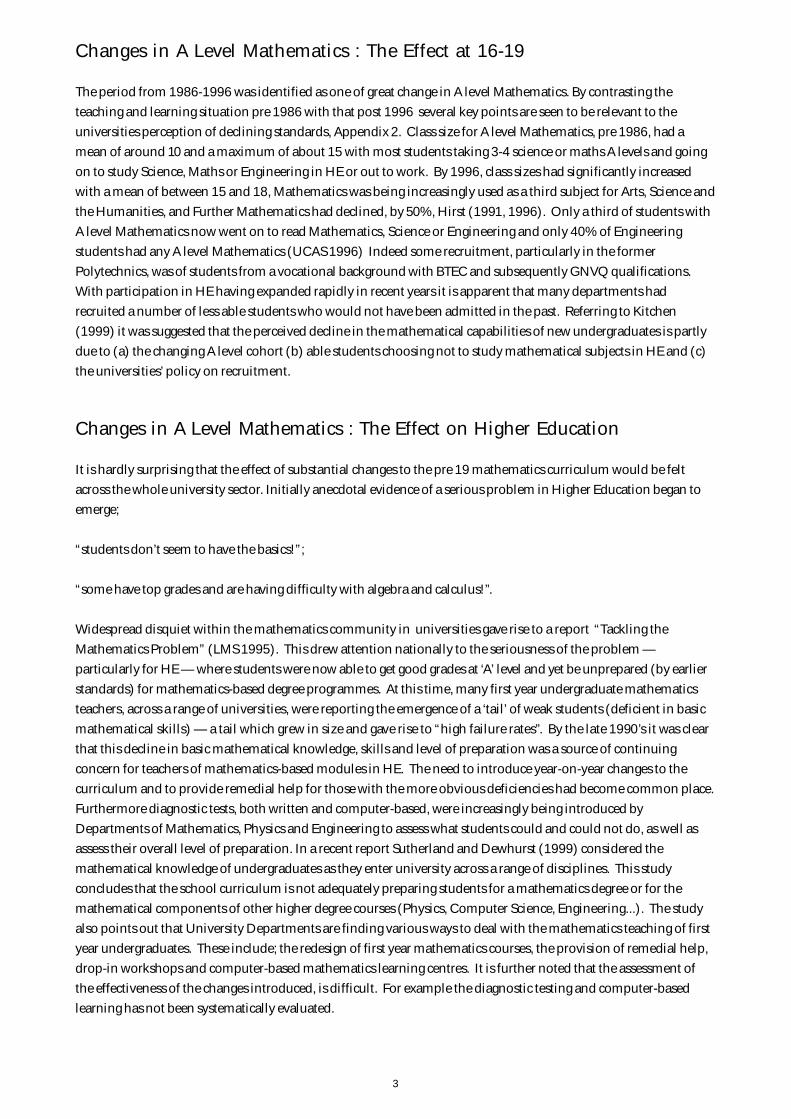
Changes in A Level Mathematics : The Effect at 16-19
The period from 1986-1996 was identified as one of great change in A level Mathematics. By contrasting the
teaching and learning situation pre 1986 with that post 1996 several key points are seen to be relevant to the
universities perception of declining standards, Appendix 2. Class size for A level Mathematics, pre 1986, had a
mean of around 10 and a maximum of about 15 with most students taking 3-4 science or maths A levels and going
on to study Science, Maths or Engineering in HE or out to work. By 1996, class sizes had significantly increased
with a mean of between 15 and 18, Mathematics was being increasingly used as a third subject for Arts, Science and
the Humanities, and Further Mathematics had declined, by 50%, Hirst (1991, 1996). Only a third of students with
A level Mathematics now went on to read Mathematics, Science or Engineering and only 40% of Engineering
students had any A level Mathematics (UCAS 1996) Indeed some recruitment, particularly in the former
Polytechnics, was of students from a vocational background with BTEC and subsequently GNVQ qualifications.
With participation in HE having expanded rapidly in recent years it is apparent that many departments had
recruited a number of less able students who would not have been admitted in the past. Referring to Kitchen
(1999) it was suggested that the perceived decline in the mathematical capabilities of new undergraduates is partly
due to (a) the changing A level cohort (b) able students choosing not to study mathematical subjects in HE and (c)
the universities’ policy on recruitment.
Changes in A Level Mathematics : The Effect on Higher Education
It is hardly surprising that the effect of substantial changes to the pre 19 mathematics curriculum would be felt
across the whole university sector. Initially anecdotal evidence of a serious problem in Higher Education began to
emerge;
“students don’t seem to have the basics!”;
“some have top grades and are having difficulty with algebra and calculus!”.
Widespread disquiet within the mathematics community in universities gave rise to a report “Tackling the
Mathematics Problem” (LMS 1995). This drew attention nationally to the seriousness of the problem —
particularly for HE — where students were now able to get good grades at ‘A’ level and yet be unprepared (by earlier
standards) for mathematics-based degree programmes. At this time, many first year undergraduate mathematics
teachers, across a range of universities, were reporting the emergence of a ‘tail’ of weak students (deficient in basic
mathematical skills) — a tail which grew in size and gave rise to “high failure rates”. By the late 1990’s it was clear
that this decline in basic mathematical knowledge, skills and level of preparation was a source of continuing
concern for teachers of mathematics-based modules in HE. The need to introduce year-on-year changes to the
curriculum and to provide remedial help for those with the more obvious deficiencies had become common place.
Furthermore diagnostic tests, both written and computer-based, were increasingly being introduced by
Departments of Mathematics, Physics and Engineering to assess what students could and could not do, as well as
assess their overall level of preparation. In a recent report Sutherland and Dewhurst (1999) considered the
mathematical knowledge of undergraduates as they enter university across a range of disciplines. This study
concludes that the school curriculum is not adequately preparing students for a mathematics degree or for the
mathematical components of other higher degree courses (Physics, Computer Science, Engineering...). The study
also points out that University Departments are finding various ways to deal with the mathematics teaching of first
year undergraduates. These include; the redesign of first year mathematics courses, the provision of remedial help,
drop-in workshops and computer-based mathematics learning centres. It is further noted that the assessment of
the effectiveness of the changes introduced, is difficult. For example the diagnostic testing and computer-based
learning has not been systematically evaluated.
3

A Level Mathematics Teaching
A feature of the teaching profession over the past 30 years is the loss of status of teachers, and especially maths
teachers. As a consequence, the composition of the teaching force has changed as (i) potential and able recruits
have been put off the profession, not least, by talking to existing teachers who have become demoralised, and (ii)
many older teachers have felt that retirement is preferable to having their work unappreciated or indeed castigated.
The need to recognise the extremely difficult nature of the job expected of today’s A level Mathematics teachers was
strongly emphasised. Compared to their predecessors, they teach a much changed and now varied curriculum to
students with a quite different motivation and background under very different circumstances (large class sizes and
inhomogeneous cohorts of students). Indeed such teachers need to be supported and encouraged if we are to stand
any chance of attracting able recruits into the profession. It was further pointed out that most of the competent
maths teachers in our schools and colleges are now in their 40’s and 50’s. As they retire they are not being replaced
by young teachers of anywhere near the same calibre. Even good schools are finding it almost impossible to recruit
acceptable new mathematics teachers. Many posts are filled mainly by people who are not mathematicians and do
not have a sound background in the subject. Consequently trying to maintain, let alone improve, the quality of
students leaving school for Higher Education is rather like running up a down-going escalator — and one which, if
anything, is accelerating. Whatever problems universities now face are likely to get worse rather than better over
the next decade.
REFERENCESEngineering Council (1995): The Changing mathematical background of undergraduate engineers (R. Sutherland and S. Pozzi),
Engineering Council, London.
Hirst, K. E. (1991) Changes in School Mathematics. Consequences for the University Curriculum, University of Southampton.
Hirst, K. E. (1990) Changes in A-level Mathematics from 1996, University of Southampton.
Institute of Mathematics and its Applications (1995): Mathematics Matters in Engineering, IMA, Southend.
Institute of Physics (1994): The case for change in post-16 physics: planning for the 21st Century, written by the Institute of Physics 16-
19 Working Party.
Kitchen, A. (1999): The Changing Profile of Entrants to Mathematics at A-level and to Mathematical Subjects in Higher Education. Brit,
Ed Res J, Vol 25, 1, 57-74.
LMS (1995) Tackling the Mathematics Problem. Joint report of the LMS, Institute for Mathematics and its Applications and the Royal
Statistical Society, LMS.
Sutherland, R & Dewhurst, H. (1999) Mathematics Education. Framework for Progression from 16-19 to HE, report produced by the
Graduate School of Education, University of Bristol.
4

3. Diagnostic Testing in Theory and PracticeJohn Appleby, Duncan Lawson, Tony Croft, Trevor Hawkes,Douglas Quinney, Brian Sleeman
Diagnostic tests are a direct response to the perceived decline in the mathematical knowledge and skills of new
students in relation to the mathematical requirements of their programmes of study. The majority of tests,
operating in Diagnostic Mode, are designed to assess students’ prior mathematical knowledge and skills and so
allow their teachers
• to identify individual strengths and weaknesses
• to identify overall deficiencies in the cohort
• to identify unrealistic staff expectations
• to inform module and curriculum design and delivery.
A second mode of operation is the so-called Drill and Kill Mode, designed for students on courses requiring high A-
level mathematics grades. Students are able to identify particular weaknesses and areas where they are short of
practice and are then required to take diagnostic tests repeatedly until they reach a prescribed standard.
Six presentations served to reveal a wide range of evidence of a decline in the mathematical preparedness amongst
new undergraduates in Departments of Engineering, Mathematics and Physics from both the new and older
universities (Appendix 3). The overall message was clear; the problem had become steadily worse, was now
widespread and the A Level mathematics grade is not a reliable indicator of competence in basic skills.
Of these presentations, two are given in full — in the following sub-sections — in order to contrast the Diagnostic
Mode of testing (at Coventry University) with the Drill and Kill Mode of testing (at the University of Warwick). The
first reveals strong evidence of a steady decline in mathematical capabilities over a decade whereas the second
illustrates how the decline is affecting those departments who admit the most able students (with 29 or more
points at A-level).
5
3.1 Changes in the Competency of A Level StudentsDuncan Lawson, BP Mathematics Centre, Coventry University
Introduction
The expansion of higher education in the 1980s created less homogeneity in cohorts of students entering university.
Not only were students with lower A level qualifications than in previous years entering higher education there was
also an expansion in the types of entry qualifications as vocational education (BTECs and latterly Advanced
GNVQs), Access and Foundation courses became accepted routes into university.
It was against this background of inhomogeneity that Coventry University introduced its standard diagnostic test
[1] in 1991. The purpose of this test was primarily to determine what incoming students could and could not do.
The same test has been used every year since 1991. It consists of 50 multiple choice questions each offering 1
correct option, 3 (wherever possible, plausible) incorrect options and a Don’t Know option. The test covers seven
topics: basic arithmetic, basic algebra, lines and curves, triangles, further algebra, trigonometry and basic calculus.
Two sample questions are given below:
Basic Algebra If x(x+1) = 6 then
A: x = 6 or x+1 = 6 B: x = 6 or x+1 = 1 C: x+2=0 or x-3=0
D: x-2=0 or x+3=0 E: Don’t Know
Lines & Curves The curves y = x2+2 and y = 3x
A: have no point of intersection B: intersect at the point (1,3) only
C: intersect at the point (2,6) only D: intersect at (1,3) and (2,6)
E: Don’t Know
Students take the test, essentially without warning, during induction week. The aim of the test is to discover in
which areas of mathematics students have immediate competence and in which they do not. Students are assured
that no marks are given for the test and that the information gathered from it will be used for their benefit. They
are told that guessing may obscure weaknesses that they need to correct and are encouraged to select the ‘Don’t
Know’ option rather than guess.
Each student receives an individual diagnosis outlining his/her strengths and weaknesses in the seven topics
covered by the test. (Students are not given marks, instead they are given a qualitative description of their
performance on each topic which is either ‘Excellent’, ‘Satisfactory’ or ‘Some revision may be needed’.) Printed on
each diagnosis is the advice that, where topics have been shown to need some revision, students should visit the BP
Mathematics Centre for discussion with Centre staff about appropriate action to fill in gaps in background
knowledge. The Centre has a range of materials available for students to use, either in the Centre or to take away
and offers one-to-one support for students. The Centre operates as a drop-in facility, currently open for 25 hours per
week. It is up to the students as to whether or not they take advantage of the help available in the Centre. There is
no compulsion on them to visit. Currently the Centre receives around 1000 student visits per term.
In addition to the personal diagnoses, cohort summaries are also compiled. These cohort summaries are sent to
course tutors to enable them to advise students in module selection and to module leaders to inform teaching
approach (and starting point).
When the test was introduced in 1991 only a relatively small number of students took it. These were on courses
(often engineering HNDs where a high proportion of the intake was from a BTEC background) where experience
6
had shown that the entry cohort was most likely to struggle with mathematics. As time has gone by the number of
courses using the diagnostic test has increased and now it is taken by all students entering courses containing a
significant study of mathematics (including courses in the mathematical sciences). Currently the test is taken by
approximately 600 students per year.
Results
In addition to the immediate information which the diagnostic test provides (and for which it was designed), by
recording the results every year, a large database of student performances has been built up which enables a study of
changes in performance over time to be made. Such analyses have been published for the data up to 1997 [2-4].
Here we extend this analysis to include the results of students entering higher education in 1998.
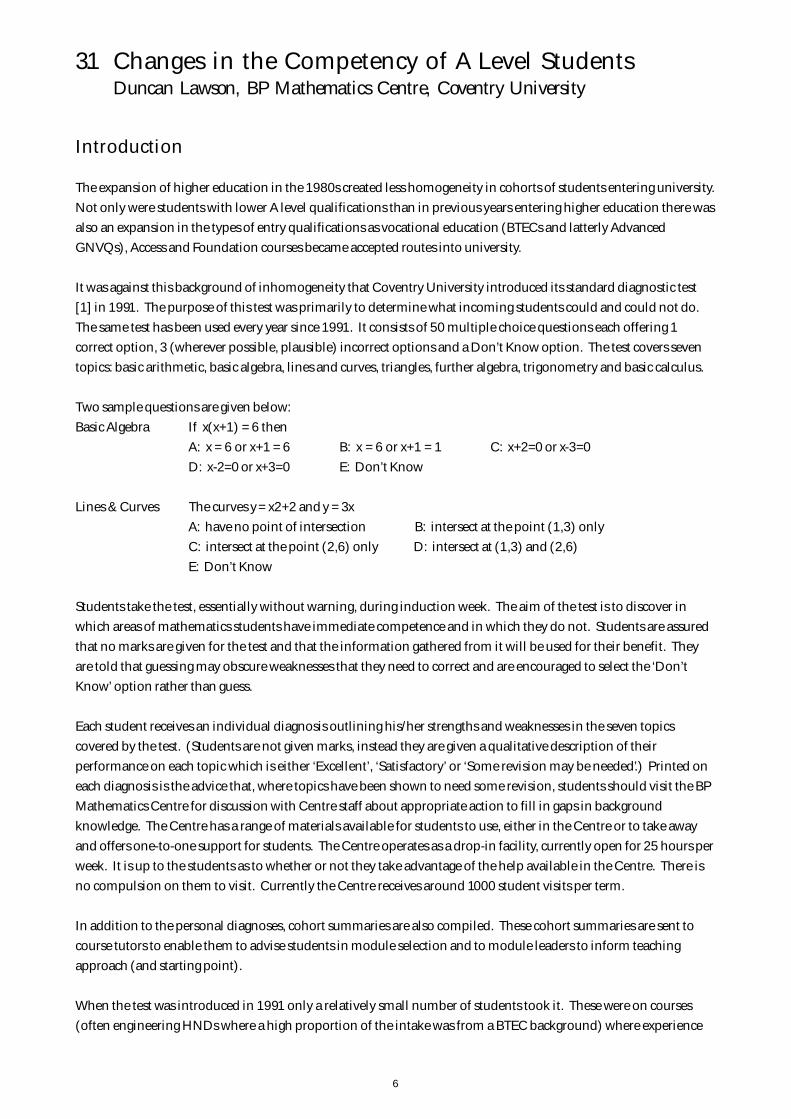
Figure 1 below shows the performance of the 1998 entry cohort for those students with A-level grades A — N and
those students with Advanced GNVQ (AGNVQ). On each topic (except triangles, which it could be argued is really
a GCSE topic) the performance decreases with A-level grade and the results of Advanced GNVQ students are
significantly below those of students with A-level grade N.
For grades B to N the worst performance is in Further Algebra. The questions in this section cover function
notation, the factor theorem, negative and fractional powers, expanding a cubic, the definition of logarithms,
inequalities and partial fractions. Even amongst grade B students only just over half of these questions were
answered correctly. This has serious implications for the exposition not only of university mathematics but also of
many engineering topics.
Figure 1: Performance of the 1998 entry cohort
The results of the Advanced GNVQ students are particularly disappointing. The syllabus topics of the optional and
advanced mathematics units in Engineering Advanced GNVQ are very similar to the syllabus topics in A-level.
However, the results from the 1998 sitting of the diagnostic test indicate that these topics are not covered in
anything like the same thoroughness. This has serious implications for many engineering courses. The latest
edition of SARTOR [5] specifically identifies Advanced GNVQ as an acceptable alternative to A-level as an entry
qualification for accredited degree courses. However the mathematical experience of Advanced GNVQ students is
vastly different to that of A-level students.
7

Figure 2: A comparison of successive cohorts of Grade D students
Figure 2 shows the performance over time of students entering with A level grade D. Grade D has been chosen for
this analysis because there is more data for this grade than for any other. As mentioned above, when the diagnostic
test was first introduced it was primarily given to those student groups thought to be most at risk and these groups
had very few students with high A-level grades. In later years there is a reasonable amount of data for all grades.
The results for grade D students are typical of what happens at other grades. This gives clear evidence that there is a
decline over time in the competency of students with the same A-level grade in the topics covered by the diagnostic
test. The difference between the 1991 and 1993 cohorts was small, however there was a sharp drop in competency
in the 1995 cohort and a further noticeable drop with the 1997 cohort. The performance of the 1998 grade D
cohort is not shown in Figure 2 however it is similar to that of the 1997 cohort with a marginal improvement in
basic algebra and triangles offset by slight decline in further algebra, trigonometry and basic calculus. It is
interesting to compare the performance of different grade cohorts in different years. Figure 3 shows the results for
the 1991 grade N students, the 1993 grade E students, the 1995 grade D students and the 1997 grade C students.
Figure 3: A comparison of different grade cohorts from different years
8

Comparing these four cohorts we see that the N91 cohort performs best in four of the seven topics and the C97
cohort performs best in the other three. However, there is no significant difference between the overall
performance of these four groups. This suggests that, in the skills which the diagnostic test assesses, there is a ‘grade
dilution’ of approximately one grade every two years.
The overall score in the test of students with different A level grades provides some startling information. Table 1
gives the overall scores (out of 50) for the 91, 97 and 98 entry cohorts (grade A has been omitted because the sample
size in all years is too small to provide any useful information). Comparing the results of the 1991 and 1998
cohorts we see that for grades C to U the score drops by, respectively, 7.8, 6.7, 7.4, 8.7 and 7.3 (out of 50) or roughly
speaking one mark per year.
Table 1 also shows what we have seen in Figure 3, namely that the performance of the 1991 grade N cohort (score
34.4) is very similar to that of the 1997 grade C cohort (score 34.0). Whilst it cannot be deduced from this that 97
Grade C students would have failed in 1991 (as was sensationally claimed in the Sunday Times [6]) it is strong
evidence that there are major problems in terms of the mathematical skills traditionally required by university
courses. With the 1998 grade C cohort the situation is even worse. These students scored on average 2.3 marks (4.6%)
less than the 1991 grade N cohort. It appears that the decline continues.
1998 1997 1991
A level Score Sample Score Sample Score Sample
Grade (max 50) Size (max 50) Size (max 50) Size
B 36.8 27 36.4 17 40.5 2
C 32.1 52 34.0 48 39.9 12
D 30.6 58 30.3 56 37.3 33
E 28.2 46 30.3 48 35.6 63
N 25.7 22 27.8 17 34.4 28
U 22.8 9 23.8 19 30.1 28
Table 1: Diagnostic Test Scores (by A level grade)
REFERENCES1. A Whitehead, Diagnostic Test, Coventry University, 1991.
2. D N Hunt & D A Lawson, ‘Trends in Mathematical Competency of A-level Students on Entry to University’, Teaching Mathematics
and Its Applications, Vol 15, No 4, pp 167- 173, 1996.
3. D N Hunt & D A Lawson, ‘Common Core — Common Sense’, in Mathematical Education of Engineers II, pp 21-26, Eds: L.Mustoe
& S.Hibberd, IMA Publications, 1997.
4. D A Lawson, ‘What can we expect from A-level Mathematics Students?’, Teaching Mathematics and Its Applications, Vol 16, No 4, pp
151-156, 1997.
5. The Engineering Council, Standards and Routes to Registration, 3rd edition, The Engineering Council, London, 1997.
6. J O’Reilly, ‘A level standards hit new low’, Sunday Times p 28, April 26 1998.
9

Further Evidence of a Decline
Just prior to the publication of this report information came to light on the diagnostic testing of undergraduate
physicists at the University of York, where Professor J Mathew has used the same mathematics test to collect data
over a twenty year period 1979-1999. Originating from a Physics Interface Project, this test was designed to assess
basic mathematical knowledge and skills. Two sample questions are presented in Appendix 4 along with a graph
showing the performance over time of different cohorts with similar A level grades. This performance remains
more or less constant until 1990 when there is a sharp fall followed by a steady decline over the past decade — thus
confirming the trend identified by Dr Lawson.
10
3.2 Diagnostic Testing in the Department of MathematicsTrevor Hawkes, Department of Mathematics, University of Warwick
Academic Background
The Department admits 220 single-honours mathematics students with an average score of 29.5 on their best three A-
Levels. All have taken a STEP or Special Paper in Mathematics and most have passed this at Grade 2 or higher.
Furthermore, the majority have taken double Maths at A-Level. In addition, the Department teaches the first-year
Mathematics core courses to 150 joint-honours degree students based in the Departments of Physics and Statistics.
These students must have an A grade in A-Level Mathematics and enter with an average of 27 A-Level points; however,
they are not required to take a STEP or Special Paper.
The Department offers rigorous three-year BSc and four-year MMath programmes including a thorough grounding
in traditional Analysis in the first year. The Mathematics core has four main sequences: Algebra, Analysis, Geometry
& Topology, and Applied. The programme offers a high degree of flexibility and, after their first year of study,
students may present themselves for examination in a wide range of options from both within and without the
Science Faculty. There is little space in the curriculum for remedial courses.
Rationale for Warwick’s ‘Drill-and-Kill’ Approach
During the 80s, members of the Department in the front line of undergraduate teaching became convinced of a
steady decline in the basic mathematical skills of their new intakes. The students arrived less able to manipulate
algebraic and trigonometric equations and inequalities with speed and accuracy, and less proficient at the tasks of
basic calculus, such as differentiating and integrating elementary functions. During this period of decline, the
average A-Level scores of our intakes went up.
The Department responded in two ways.
• The syllabuses of first-year courses were rewritten to reduce the steepness of the initial learning curve and
provide a gentler transition from the more concrete and prescriptive style of A-Level mathematics to the more
conceptual and open-ended approach at university.
• Optional classes were offered to first-year students to help them plug any gaps they identified in their A-Level
skills.
These classes ran for several years in different formats but were always a failure. After a couple of weeks, attendance
would drop to a mere handful. The classes quickly became negatively seen as ‘remedial’, and the fact that no course
credit was attached to them gave the impression that the Department did not regard them as important.
In the mid 90s, a raft of more radical solutions were introduced: weekly marked homework for exam credit in all
core modules, additional small-group teaching (three hours a week in squads of four), a small-classroom approach
to teaching Analysis, group work, IT-based enhancement of learning. And the optional classes designed to bring
students up to speed in their A-Level skills were replaced by diagnostic tests in five skill areas on arrival, followed by
weekly resit tests until a score of at least 80% is achieved. A small amount of exam credit is attached to each of these
tests (amounting to 0.4% of the overall first-year mark, which in turn contributes only 10% to the final degree
score) but this provides an effective inducement to full participation and widespread success. The five A-Level skill
areas together are called Maths Techniques and form a small part of the first-year bridging module Foundations.
11

The Diagnostic tests
• give students immediate feedback of how they measure up, on arrival at university, to the standards expected of
them in basic A-Level skills,
• give tutors (who mark the Diagnostic tests) an instant snapshot of the level of basic skills of the new students
they will be teaching,
• and allow the Department to monitor the changing background abilities of its incoming students over the years.
The weekly resit tests for students who fail to reach the threshold of 80% in one or more of the skill areas in the
diagnostic tests, and the regular reporting of students’ progress to their tutors, send a clear message that the skills are
important to further progress in the degree course. The very modest amount of exam credit that is awarded for
success reinforces this message and provides the incentive for students to develop the accuracy and skill required to
achieve the 80% target.
The Logistics
In late August, as soon as the Department receives the names and addresses of the admissions candidates who
have achieved its offer, a letter is sent to them explaining that there will be a diagnostic test in five skill areas at
the start of term. This mail shot includes a booklet of practice questions, together with advice on how to deal
with them and references to the material in standard A-Level texts. Students are advised to spend the month
before they come to Warwick getting up to speed on these skills and filling in any gaps they may have in their
A-Level knowledge (for example, complex numbers).
On the first Wednesday of the new academic year, all first-year single-honours and joint-degree Mathematics
students sit a 2-hour diagnostic test covering four skills areas: Differentiation, Integration, Trigonometry,
Inequalities. The tests are held in normal lecture theatres, have the format of question-and-answer booklets.
These are marked by the students’ personal tutors and returned to them the following week at the first weekly
tutorial, when any shortcomings are identified and discussed.
Students who fail to reach the 80% threshold in one or more of the four skill areas, can take resit tests (held at
time-tabled slots during the subsequent six weeks) as often as they like until they achieve this percentage.
To minimise marking costs, the resit tests are staged in the following format:
• Before the test begins, each candidate collects a blank answer sheet to which is attached a second carbonised
copy and takes a seat in the lecture theatre.
• At the start of the test, the questions are displayed on a screen using an OHP.
• At the end of the 30-minute test, students hand in the carbon copies of their answer sheets.
• The answers are then displayed on the screen and students mark their own papers. They can raise questions
about the validity of their answers at this stage.
• Students who claim to have scored 80% or more hand in their marked top copies. These are then checked
against the carbon copies and a sample are remarked.
Under this arrangement, only a fraction of the successful tests are marked; no time is expended marking the tests of
the unsuccessful candidates.
A fifth skill area, elementary algebraic manipulation, is tested by computer using a modified version of John
Appleby’s assessment program Diagnosys, which was originally designed to provide diagnostic testing of
Engineering students at the University of Newcastle. With Appleby’s permission, Warwick added libraries of
questions to enable Diagnosys to generate unlimited random tests, a timing mechanism, and an email system for
sending progress reports to students’ tutors. To obtain the exam credit for this fifth skill area, students must pass the
12

40-minute Diagnosys test at the 90% level but are allowed to retake the test as often as they wish. A secondary
purpose of Diagnosys was to encourage students to get logged on to the University network at an early stage of their
course, but with the steady growth of IT in the degree programme, this is now a superfluous motive.
Success in one of the five skill areas is rewarded with a contribution of 4% to the final overall score in the
first-year bridging course Foundations. Thus up to 20% of the final Foundations mark comes from the 5
Maths Techniques skill areas but contributes only a maximum of 0.2% to the final degree mark.
Students who do not achieve the 80% threshold in one of the written tests by the end of Week 7 or the 90% target
in the computer-based Diagnosys test by the end of Week 10, are given a score of zero (instead of 4). This
unforgiving marking system stresses the importance of both accuracy and speed to succeed.
Learning Support
The August mailing of practice test questions includes advice and references to background material in A-Level textbooks.
Tutors are expected to offer help to those of their tutees who appear to have difficulties with the Maths Techniques material.
From Week 3 onwards, regular help classes in the various skill areas are provided for students who are having
trouble passing the resits. These classes are taught by a local retired school teacher.
Much of the first-year teaching and learning takes place in squads of four; these are established at the start of the
academic year and stay fairly stable throughout the first two years of the degree programme. These squads are
encouraged to help each other (when two or three in a squad have already passed a given skill area, they are urged to
coach the one or two that haven’t).
Detailed back-up notes are available for the computer test Diagnosys.
Conclusions
The approach described above provides an effective and low-cost method of raising the level of basic mathematical
skills in beginning undergraduates. Over 350 students from three departments are put through the system within a
10-week term for under £1000. The great majority of these achieve the desired 80/90% thresholds in all skill areas
within this time. After such a system has run for two years or more, the tests and related materials can be recycled
without risk of compromising security.
The high entry standards into the Warwick degree course ensure that the great majority of the students are able to
raise their performance in Maths Techniques with the minimum of support and individual attention. It may not
work as well on students with a weaker or more variable mathematical backgrounds.
In due course it is hoped to convert the Maths Techniques resit tests into a computer-based format. This would
enable the tests to be used in both formative (practice) and summative (examination) modes. After the initial
investment, this would reduce costs still further, and would bring the other advantages of Web-based assessment:
• easy monitoring of individual progress;
• analysis of individual and collective weak areas;
• on-line help;
• quick reporting and feedback to students and staff alike.
Problems with (i) displaying mathematics on the Web and (ii) examination security still need to be solved.
13

4. Provision of Additional SupportA Summary of Reports from Working Groups
Once the results of a diagnostic test are known the question arises as to what we do with the results of the test and ,
in particular, “how do we provide effective support for those students with deficiencies in basic knowledge and
skills?”.
It was clear from the collective experiences of the seminar participants that there is no simple solution- no panacea-
to what has rapidly become one of the most challenging problems at the school/university interface. We are at the
stage where a number of individuals in various institutions are currently exploring a wide range of follow-up
strategies. These include supplementary lectures, additional modules, computer assisted learning, Mathematics
Support Centres, additional diagnostic tests and streaming. Each has its merits and brief details are given below.
Supplementary Lectures
One of the first attempted remedies was to introduce a series of supplementary, remedial lectures running in
parallel with the first year course. There are two problems here; (i) the need for students to give sufficient time and
attention in order to master the remedial material and (ii) the danger of overloading weak students with
additional studies when they are probably struggling with other modules.
Additional Assessed Modules
Some departments require their weaker students to rectify their deficiencies by taking additional mathematics
modules alongside their main course. Once again the danger is to overload students with too much additional
work. As one participant remarked “can a student lacking basic skills cope with the demands of the current
mathematics and engineering modules whilst attempting to repair the earlier damage?”.
Lower Level, Transition Modules
There is a clear need to circumvent the problem of overload whilst recognising that weak students do need a
relevant transition module to make up for shortfalls in their background. A strategy used in some institutions is to
replace mainstream mathematics modules by transition or bridging modules which permit students to get to grips
with lower level material at a slower pace and in a less diverse group. The mainstream mathematics modules are
then taken later in the programme.
For weak students the downside of this approach is that their mathematical experience remains out -of- step with
the mainstream giving rise to other problems
• discovering that they have not covered the mathematics required for their engineering modules.
• discovering that their options are severely restricted.
14
Computer Assisted Learning (CAL)
The increasing availability of student centred computer-based support material now presents an ideal opportunity
to follow up a diagnostic test and address the problem of mathematical deficiencies using CAL.
Given a diagnostic profile of students mathematical knowledge and skills (set against pre-determined objectives in
Mathematics) it is now possible to provide automatic links to CAL material such as that developed under TLTP, for
example
• Mathwise; 50 computer based modules developed by the UK Courseware Consortium
• Calm; computer assisted learning in Mathematics, Heriot Watt University
• Metric; TLTP project based at Imperial College, London
• Transmath; TLTP project based at Leeds University
• Calmat; computer assisted learning in Mathematics based at Glasgow Calendonian University.
This approach is being pioneered at Keele University with Dr D. Quinney where the aim is to provide support
material where a central feature is a symbiotic relationship between computer based material and tutorial support.
Mathematics Learning Support Centres
Several universities have established a Mathematics Support Centre to enable students experiencing difficulties
with mathematics to obtain supplementary resources and tuition. The aim is to devise follow-ups to the diagnostic
test which are tailored to individual needs and, since the centre is open-access, students can attend at any time.
Such centres can be very effective in dealing with students having specific isolated difficulties. However, for the less
well-prepared students a drop-in surgery is hardly sufficient. If they are to gain a coherent body of mathematical
knowledge there is no substitute for an extended and systematic programme of study.
Additional Tests
Diagnostic tests reveal weaknesses in basic mathematical knowledge even amongst the most well qualified students.
At the University of Warwick a successful method has been devised for dealing with deficiencies with very able
students having over 29 A-level points and most with Further Mathematics — see Section 3.2, Diagnostic Testing in
the Department of Mathematics: Dr T Hawkes.
Mixed Ability Teaching vs Streaming
A diagnostic test will identify both the strengths and weaknesses of individual students and also the range of
abilities of students in the cohort. The question then to be addressed is how best to teach them in the first semester
mathematics module? Often course requirements and financial considerations are such that students have to be
taught as a single group and so we are engaged in mixed-ability teaching!
There is an increasing awareness, however, amongst first year teachers of mathematics that mixed ability teaching,
of a first year cohort with diverse knowledge and abilities, is quite inappropriate . Indeed it can be disastrous by
further compounding rather than solving the initial problem. The weaker students are “at risk” and remain so
without a carefully planned programme of help to assist them on the road to recovery.
15

At the University of Leeds an experiment is currently underway with the teaching of mathematics to first year
physicists who are admitted with A level mathematics grades A to C but also includes a number with grade D( and
a good grade in physics). Diagnostic testing identifies students who are “at risk”-in the sense that they are the ones
who are most likely to fail the module when taken by the whole cohort. In an attempt to help this weaker group
the cohort has been streamed with those “at risk” taught separately. They will cover the same material (including A
level revision material) at a slower pace over a longer time and sit the same examination as the “standard group”. By
the end of the academic year we shall know the extent to which the experiment has proved successful!
Finally we conclude with a perceptive remark from one seminar participant on the effect of follow-up strategies
which puts into sharp focus the extent of the challenge that now faces us;
“ the problem of declining mathematical ability is a long standing one and its roots go
deep. It is not at all clear that such cosmetic exercises at the point of entry to tertiary
education will be sufficient.”
Findings and Recommendations
These are given in the Summary on page (iii).
16

Appendix 1
Mathematics at the Interface(1960-2000)
1960s Advanced level GCE (A-level) was an entrance examination for the Universities— run by them and geared to serve their needs.A-level Mathematics was mainly Pure and Mechanics.
1970s Emergence of Statistics.Universities experience problems teaching Applied mathematics at Year 1.Diagnostic testing of mechanics.
1980s Universities lose autonomy in curriculum to the Government.SEC, SEAC, SCAA and now QCA validate awards.Curriculum development pre A-level of GCE and CSE into GCSE.Numbers taking Mathematics at A-level start to drop dramatically.
1990s Deficiencies with algebra become apparent.New Mathematics courses emerge (1992)These try to make mathematics a) more popular, and
b) more accessibleThere is a wide variety in the mathematics content and mastery of the manydifferent A level syllabuses available. Many students taking A-level mathematicsdo not go on to use their mathematics in H.E.Chaos/confusion in H.E.Reports and analyses are carried out by various bodies. Development ofdiagnostic testing of basic skills within universities.
17

Appendix 2
A level mathematics: the post 16 perspective.
When Pre 1986 1986+ 1996+ 2002+
Defined by • Examination boards • Government • Need to increase • New core
• Led by Universities control. accessibility 50% Pure,
• No statutory core • Mathematics core • New core 25%
• 40% Pure Maths • 30% Pure, 10% Stats applications
(less algebra) 10% modelling
All Linear All Modular
Taught to • Steadily increasing • Failing numbers • Numbers start to ?numbers • Increase in improve.
• Class size rose to a class size • Class sizes continue
mean of around 10 • Maximum in FE to increase.
and max of about 15 rises to 25+ • Mean now between
• Most university • Growth in other 15 and 18,
entrants had A levels maths qualifications • Continuing diversity
Mainly 11-18 schools Mainly post 16 institutions
To whom • Most taking 3 or 4 • Growth in use of • Only 1/3 rd of students ?science or maths Mathematics as with A level Maths go
A levels a third subject for on to read science,
• Most going on to Arts, science and engineering or maths
science/maths/ Humanities • only 40% of
engineering • Decrease in engineering students
or out to work Further Maths have any A level maths
(UCAS 1996)
• Decrease in emphasis
on Pure Maths
Mainly science A levels Mixed A levels
Other factors • Very little outside • Increase in • The mean no. of ?work numbers of hours of paid
• Most students full students doing employment per
time outside work week is around 12.
• Maths sex ratio • Advent of AS (study of 3 large post
around 2:1 Further Maths 16 institutions, 1997)
may have less • Push for more AS
Pure content League tables
• Sex ratio No change in sex ratio
is 62%,38%
in 1995
Ann Kitchen, Centre for Mathematics Education, University of Manchester,
18

Appendix 3
Reviews of Diagnostic Testing
3.1 Gatsby Seminar on Diagnostic testing in mathematics
experience from the Universtiy of NewcastleJC Appleby, Department of Engineering Mathematics
Introduction
Diagnostic testing has been used at foundation level and then at first year level in mathematics at Newcastle for eight
years. For several years a basic mechanics test has also been in use. Diagnostic testing on entry may be used to: select
students for special treatment or streaming, to identify specific areas needing attention for each individual and to
survey group knowledge to inform course design and delivery. It is also interesting to discover whether such tests have
any predictive power with regard to future success.
Our overall aims in using diagnosis and remediation were to assist every individual with information about
their own needs, to provide sufficient support for the weakest to enable them to catch up and progress to a
degree, and to inform curriculum design and admissions policy by relating knowledge to background
qualifications and to subsequent progress.
Results for the Mathematics test
The Mathematics test results are not in themselves very startling, revealing almost complete knowledge of the most
basic skills, and a predictable patchiness on more advanced ones, even those theoretically covered by some higher
GCSE syllabuses (Table 1). The possibility of entering algebraic answers to questions, and the correspondingly very
limited use of multiple-choice questions, helps to produce results that match one’s expectations. However, all
teaching staff need to be aware of the significant proportion of students not knowing, for example, how to factorise
difference of squares or how to divide algebraic fractions. Moreover, a lack of knowledge at this level is likely to
mean not that they haven’t met the topic, but that they have failed to absorb it reliably, and that therefore they may
not pick it up quickly when revised.
Table 1. Knowledge of selected basic skills by Stage 1 Engineering students 1997 entry — proportion knowing, or
inferred as knowing, each topic:
Manipulation of positive powers ............................................................................................................ 91%Manipulation of negative powers ........................................................................................................... 85%Manipulation of fractional powers......................................................................................................... 44%Expansion of two brackets, collecting terms .......................................................................................... 92%Factorising difference of two squares ..................................................................................................... 55%Dividing algebraic fractions ................................................................................................................... 68%Definition of radians .............................................................................................................................. 68%Gradient of line through two points ...................................................................................................... 77%
Equation of circle, given radius and centre ............................................................................................ 16%
19

Figure 1. Relationship of diagnostic maths mark and first maths exam mark, Stage 0
Figure 1 shows the correlation of diagnostic mark with a later exam mark. This is of interest in itself, but also
provides some validation, which is needed to use a diagnostic test with confidence, particularly one with inferences
about knowledge based on the skills network. For the 1996/7 Foundation Year, the correlation is high (for this kind
of data) at 0.72, comparing well with the correlation between first and second exams in mathematics. However,
note that the predictability for an individual is measured by adjusted R-squared — the proportion of the variance in
the exam mark accounted for by the diagnostic mark. At a value of 0.50, this is high (as predictions go) but indicates
the difficulty in assigning remedial tuition — perhaps half of the students so assigned will be in the wrong group!
At Stage 1, the correlation (0.61) and prediction (adjusted R-squared = 0.37) is less good, reflecting perhaps the less
suitable coverage of the Test; the first semester maths course is largely a revision of A-level in any case.
An additional statistic is provided by the relationship of departmental means of diagnostic and first exam marks. Five
departments are split into three lecture groups, and many tutorial groups, and we were interested in the effect of the
different lecturers, together with departmental course loadings, pastoral factors etc. The correlation of the average
exam mark for the departments with the average diagnostic mark was a remarkable 0.994 in 1996/7. That is, the
departmental performance in the first maths exam in January could have been predicted almost perfectly from the
diagnostic marks available in early October!
Remedial provision
As mentioned above, at Foundation Year and at Stage 1 in some degrees, a full remedial module is provided for those
deemed to be at risk, based on their diagnostic mark and qualifications. The two years’ results available for Stage 1
students show a pleasing improvement relative to the main group in their first exam, but no subsequent improvement
Table 2. Remedial group results — Stage 1 entrants to Mech & Mats degrees
Stage 1 results Stage 2 results
Year Number 1st exam 2nd exam All subjects 1st exam 2nd exam All subjects
1994/5
Remedial 13 52 43 54 49 43 53
Whole 95 52 51 53 55 47 52
1995/6
Remedial 10 54 42 47 50 n/a n/a
Whole 78 56 50 52 63 n/a n/a
(Table 2). The Stage 2 results exclude those students who failed or dropped out in Stage 1 (three and four
respectively), but the mean results are still below the rest of the group (some of whom had also gone).
20

The DIAGNOSYS Test
DIAGNOSYS is a skills-based computer testing system for basic mathematics. It is supplied with questions on 92
skills in numeracy, algebra, trigonometry, statistics etc. Normally a student will be tested on 50-70 skills by selecting
certain topic areas. The knowledge-based approach used allows diagnosis of this range of knowledge by asking
questions selectively, responding to background qualification and to previous answers. For example, consider two
algebra skills:
Expand x(x+l) => Expand (x+1)(x+2)
Knowledge of the second implies knowledge of the first, whilst ignorance of the first implies ignorance of the second.
Typically, fewer than half the skills need be tested, and a test of c60 skills can be completed in one hour. The skills are
categorised as being at four’levels’ of difficulty, and are arranged in a hierarchical network.
The output files are processed to produce individual ‘profiles’, ranked listings, ‘group profiles’ of knowledge
(including analysis of sub-groups, such as different qualifications, sex, etc.), and tabulated answers to reveal
common misunderstandings.
Using a hierarchy of skills thus has a twofold benefit: it reduces the number of questions asked, and allows the
system to target questions more appropriate to the user. The network, inferences and question design have been
validated in several ways, as described in Appleby, Samuels and Treasure Jones 1997.
DIAGNOSYS is designed to permit minor, major or complete changes to the questions and knowledge-base. Tests
on other subjects have been constructed by others using this system.
Publications
1997 DIAGNOSYS — a knowledge-based diagnostic test of basic mathematical skills. Computers in Education, 28,
113-131 (with PC Samuels and T Treasure Jones)
1997 Diagnostic testing of mathematics and mechanics on entry Mathematical Education of Engineers,
Loughborough, IMA, 1997. (with A Anderson)
1995 Managing the transition to University education: computer-based diagnostic testing of background
knowledge. International Congress of Engineering Deans and Industry Leaders, Monash, 1995. (with A
Anderson and others)
1995 Diagnosis and treatment of students from varied backgrounds. IMA Conference: The Mathematical Education
ofEngineers, Loughborough, 1994. (with A Anderson, P Fletcher)
21

3.2 Mathematical preparedness for entrance toundergraduate engineering degree programmes,
and diagnostic testingDr A Croft, Department of Mathematical Sciences, LoughboroughUniversity
In 1996 a Mathematics Learning Support Centre was established at Loughborough University. Its primary raison
d’etre was to support significant numbers of engineering undergraduates who were having serious difficulties
coping with the mathematical demands of their programmes. Since then it has developed an exceptionally wide
range of resources using a mix of traditional and modem technologies and now offers its services to any
undergraduate student in the university who might benefit from additional help with learning mathematics.
The Centre has been the focus of a number of initiatives including diagnostic testing of new students. This has been
carried out for three years now (1996, 7 and 8) and was implemented as follows:
(i) for practical reasons the test was paper-based multiple choice (OMR marked). About 600/700 students are
involved, and to test such a large number by computer within a couple of days of arriving at university is
impossible.
(ii)it has only been possible to run a one hour test covering number, basic algebra, and basic calculus very
superficially. This is because the test either had to be fitted into a busy induction period time-table or,
exceptionally, a first maths lecture. Further, the questions on the test were thought by staff to be rather simple,
and so getting a question correct does not imply competence. Certainly getting questions wrong raises concerns.
Those of us concerned with the test recognise its inadequacies and ideally would require students to do a much
more comprehensive and longer test.
(iii)Students and tutors are given feedback within a couple of days. This consists of a raw mark only. However,
students are invited to the Centre to discuss detailed marks, and strengths and weaknesses, although few do this.
The data gathered has been useful to indicate areas of great weakness. The topics of ‘Partial fractions’ and
‘Integration by substitution’ particularly, stand out. This has enabled supporting materials to be made available,
and some students do make use of them.
The major challenge is not the diagnostic testing itself, but what to do about the results! There are significant
numbers of students who are weak across the whole spectrum of basic topics. Referring them to extra remedial
material while their main maths course progresses is often the only option available but is rarely seen to work. It
takes a particularly highly motivated and mature student to do this. For the majority it is more appropriate to
recommend a prolonged period on an alternative course at the right level, but this doesn’t seem to happen.
Engineering departments want such students to be able to proceed with mainstream engineering courses alongside
their well-prepared peers. Major problems are the mismatch between expectations and abilities and a failure to
recognise what different levels of mathematical qualification really mean. This results in a tremendous amount of
unhappiness and misery for the affected students, and puts teaching staff in a no-win situation.
22

3.3 Diagnostic Testing at KeeleDr D Quinney, Department of Mathematics, Keele University
Introduction
There have been considerable changes in traditional student numbers and their qualifications, in addition we have to take
into account the increasing number of students who arrive with access and foreign qualifications and the number of mature
students. They arrive with a variety of different mathematical knowledge.In order to establish the capabilities of each student
it is necessary to identify which skills they are competent in and those for which additional attention is required. Plenary
teaching can be complemented by providing supplementary assistance through tutorials, supplementary classes or CAL
courseware but this is more effective if each student has received precise and detailed information on their possible
deficiencies. The large numbers of students involved means that this is can be time consuming and labour intensive and
demonstrates the need for an automated, but relatively simple, diagnostic test or tests.
Diagnostic Test Used at Keele
HoDoMS (Heads of Departments of Mathematical Sciences) has funded a WWW site giving information, contacts
and case studies of existing diagnostic tests. Details can be found at:
http:/ /www.keele.ac.uk/depts/ma/diagnostic/
The Mathematics Department at Keele University selected a computer based diagnostic test written at Nottingham
University by Hibberd & Brydges. (Brydges S & Hibberd S, 1994, Hibberd 5, 1996.) Customised versions of the test
have been implemented by a number of UK universities. The test comprises twenty multiple choice questions
selected from a pool of 48 questions to be answered in 40 minutes; selected pseudo-randomly to ensure an adequate
range of topic coverage. A typical question is shown below.
Figure 1: Testing integration.
A total (percentage) score, weighted to minimise ‘guesses’ (+3, for a correct answer and -1 for an incorrect answer),
is determined at the end of the test. In addition to a student selecting a correct option they can also abstain; the
effect of which is to avoid the penalty of selecting an incorrect answer if unsure. At the end of the test each student
is presented with a diagnostic report, see figure 2. Based on this profile it is possible to assign individual support
material; in Keele’s case we use Mathwise. Global information on each cohort and question can be readily
extracted, including the most common incorrect answers and changes in cohort performance.
23

Figure 2. Student Diagnostic Report
Although our primary aim is to help students to achieve their potential the gathering of national information
regarding the mathematical abilities of students in HE will also be possible. Such information will help long term
planning in HE and also provide positive feedback to SCAA and secondary education in general.
Results at Keele University
In addition to providing individual profiles for students it is possible to investigate the skills of the whole cohort.
Table 1 shows the average scores of students entering Keele to read mathematics. The scores are normalised so that
an “average” student would score 5 in each topic.
Table 1. Keele Results 1996-97
Topic 1996 1997
Basic Algebra 6.62 9.01
Inequalities 7.07 2.25
Expansions 5.67 2.83
Co-ord Geometry 7.06 4.51
Differentiation 3.19 6.34
Max and Min 7.48 5.56
Curve Sketching 6.27 5.25
Integration 3.83 7.24
Log and Exp fns 6.41 8.85
Trig Functions 6.29 0.79
The wide discrepancy indicates that simply selecting all students and providing common courses is not a possible
option. Indeed, the variation suggest that a different set of support material would need to be developed each year. To
this end, after the student is presented with the profile its results are linked to provide a tailored course which is
provided by CAL.
24
3.4 Diagnostic Testing at LeedsProfessor B Sleeman, Department of Applied Mathematical Studies,University of Leeds
Diagnostic testing was initially introduced in 1980 with first year mathematics undergraduates. They were given a
one hour written test in mechanics to access their basic knowledge and conceptual understanding. For a decade
this proved a very useful means of identifying those students who needed extra help/special treatment in order to
cope with a demanding first year course in applied mathematics.
In Mathematics
More recently (1998) diagnostic testing in mathematics was introduced following a series of high failure rates,
1ong tails” and a general awareness of a rapid decline in the mathematical knowledge and skills of entrants to
mathematics — based degree schemes. There is clearly a gulf between what many students understand/can do and
what is expected of them!
A one hour written test was therefore designed — covering algebra, trigonometry, differentiation and integration and
given to 450 mathematicians, physicists, engineers and joint honours students. The aims are to
• identify students’ mathematical strengths/weaknesses
• identify “students at risk” (and needing streaming)
• assess the significance of the ‘A’ level Maths grade.
Two rather unexpected results are the following,
(i) students with a good ‘A’ level Mathematics grade (A or B) cannot be assumed to be competent in basic
mathematical skills.
(ii)most students have deficiencies in calculus and display a woeful lack of practice.
With regard to the latter, support is given to physicists by way of a 5 credit Calculus Consolidation module to bring
them up to speed.
25

Appendix 4
Further Evidence of the Decline
Mathematics Diagnostic Tests (1979-1999)Professor J Mathew, Department of Physics, University of York
Since 1979 the Physics Department at York has given two multiple choice diagnostic tests, one on Electricity
and one on Mathematics, to students entering the course. The tests were developed in York as part of the Physics
Interface Project, a joint scheme coordinated at the University of Wales in Cardiff, and based on a Royal Society
review of “What Physical Scientists should know when coming to University”.
The questions aim to define the level of skill and knowledge retained during the summer after the A-level test.
The Mathematics questions reflect both basic pure mathematics and mathematical manipulations relevant to
physics, but do not include any Mechanics that might have been covered in Applied Mathematics. There are 50
multiple choice questions with 4-answer choices on each question. Two sample questions are given below:
Q1. logb (2ab) — log
b (a) is,
logb 2ab
(A) 1 + logb 2 B) log
b a (C) log
b 2a2b (D) log
b (2ab–b)
Q2. The graph of the curve represented by the equation xy = c, (where c < 0) is
Results of the test
The graph below charts the performance of different cohorts from 1979-1999.
26
Appendix 5
List of Participants
Dr Jack Abramsliky Qualifications and Curriculum AuthorityDr John Appleby University of Newcastle upon TyneProfessor Roger Baker The Gatsby Charitable FoundationProfessor Keith Ball University College LondonDr Janice Barton University of LiverpoolProfessor Cliff Beevers Heriot-Watt UniversityDr Pam Bishop The University of BirminghamDr Neil Challis Sheffield Hallam UniversityDr Amanda Chetwynd Lancaster UniversityDr Bill Cox University of AstonDr Tony Croft Loughborough UniversityDr Sue Dunn Queen Mary Westfield CollegeDr Martin Greenhow Brunel UniversityDr David Griffel University of BristolDr Trevor Hawkes University of WarwickDr Stephen Hibberd University of NottinghamDr Keith Hirst University of SouthamptonProfessor Kenneth Houston University of UlsterMrs Ann Kitchen University of ManchesterDr Duncan Lawson Coventry UniversityDr Sanjoy Mahajan University of CambridgeDr Leslie Mustoe Loughborough UniversityMs Lisa Page Gatsby Technical Education ProjectDr Judith Perry University of CambridgeMr Roger Porkess University of PlymouthDr Douglas Quinney Keele UniversityProfessor Chris Robson Seminar Chairman, University of LeedsMr Tom Roper University of LeedsProfessor Peter Saunders King’s College London ProfessorProfessor Mike Savage University of LeedsDr Christine Shiu Open UniversityProfessor Brian Sleeman University of LeedsProfessor Peter Stanley University of ManchesterProfessor Ros Sutherland University of BristolDr John Williams Gatsby Technical Education Project
27

June 2000
Published by the Engineering Council10 Maltravers StreetLondon WC2R 3ERTel: 020 7240 7891Fax: 020 7240 7517email: [email protected] site: www.engc.org.uk