MEASURING THE IMPACT OF INTANGIBLE ASSET … · MEASURING THE IMPACT OF INTANGIBLE ASSET INVESTMENT...
20
ACRN Journal of Finance and Risk Perspectives Vol. 1, Issue 2, p. 69-88, Dec. 2012 ISSN 2305-7394 69 MEASURING THE IMPACT OF INTANGIBLE ASSET INVESTMENT TOWARD COMPANY FINANCIAL HEALTH AND COMPANY AGENCY PROBLEM Dimas Mukhlas 1 1 University Agder, Christiansand Norway Empirical Research from Indonesian Companies during World Economic Financial Crisis 2006-2011 Abstract. The thesis examines the impact of intangible investment toward company’s market value. The scenario is working under 2 conditions. First is detecting the role of intangible asset in moderating company financial health toward company market value. The financial health here is working from 3 perspectives. These indicators of company’s health are company performance, solvency ratio, and debt proportion. The second scenario is detecting the role of intangible asset in moderating policy in corporate governance toward market value. Intangible asset analysis was chosen here because of its special characteristic. The first is the character which gives benefits to company. Secondly is the character that put the company in risky point. Intangible asset as the asset of production has equipped the employee with better skills and knowledge on productions. On the other hand, an intangible asset that does not have physical evidence triggered the liquidity problem of the company. Indonesia was chosen as the place of observation because of their growth in intangible asset investment. Based on OECD, after 2002, either Foreign Direct Investment or Intellectual Asset in Indonesia has increased. The thesis attempts to analyze how the impact of this assets toward company performance during the crisis. The research involves 158 Indonesian stock listed companies where the data has been collected from 2006 until crisis 2011. Looking at market value of company, intangible value of company, the dividend policy, and corporate financial structures, empirical evidence reveals a significant positive relationship between the amount of intangible asset and the market value of company. Introduction During last decades the development and alteration of business environment grow tremendously fast. The rapid technology improvement, deregulation and globalization have forced companies to go through the process of reinventing (Garanina & Pavlova, 2011). The investment that helps the companies to improve their competitive abilities will be presented in two ways. The first way is a tangible asset which has physical evidence, whereas the later one is an intangible asset without physical evidence. The appropriate intangible asset helps the company to achieve the success ‘roots of company value creation’ (Garanina & Pavlova,
Transcript of MEASURING THE IMPACT OF INTANGIBLE ASSET … · MEASURING THE IMPACT OF INTANGIBLE ASSET INVESTMENT...

ACRN Journal of Finance and Risk Perspectives
Vol. 1, Issue 2, p. 69-88, Dec. 2012
ISSN 2305-7394
69
MEASURING THE IMPACT OF INTANGIBLE ASSET
INVESTMENT TOWARD COMPANY FINANCIAL HEALTH
AND COMPANY AGENCY PROBLEM
Dimas Mukhlas1
1University Agder, Christiansand Norway
Empirical Research from Indonesian Companies during World Economic Financial Crisis
2006-2011
Abstract. The thesis examines the impact of intangible investment toward
company’s market value. The scenario is working under 2 conditions. First is
detecting the role of intangible asset in moderating company financial health
toward company market value. The financial health here is working from 3
perspectives. These indicators of company’s health are company performance,
solvency ratio, and debt proportion. The second scenario is detecting the role of
intangible asset in moderating policy in corporate governance toward market
value. Intangible asset analysis was chosen here because of its special
characteristic. The first is the character which gives benefits to company.
Secondly is the character that put the company in risky point. Intangible asset as
the asset of production has equipped the employee with better skills and
knowledge on productions. On the other hand, an intangible asset that does not
have physical evidence triggered the liquidity problem of the company. Indonesia
was chosen as the place of observation because of their growth in intangible asset
investment. Based on OECD, after 2002, either Foreign Direct Investment or
Intellectual Asset in Indonesia has increased. The thesis attempts to analyze how
the impact of this assets toward company performance during the crisis. The
research involves 158 Indonesian stock listed companies where the data has been
collected from 2006 until crisis 2011. Looking at market value of company,
intangible value of company, the dividend policy, and corporate financial
structures, empirical evidence reveals a significant positive relationship between
the amount of intangible asset and the market value of company.
Introduction
During last decades the development and alteration of business environment grow
tremendously fast. The rapid technology improvement, deregulation and globalization have
forced companies to go through the process of reinventing (Garanina & Pavlova, 2011). The
investment that helps the companies to improve their competitive abilities will be presented in
two ways. The first way is a tangible asset which has physical evidence, whereas the later one
is an intangible asset without physical evidence. The appropriate intangible asset helps the
company to achieve the success ‘roots of company value creation’ (Garanina & Pavlova,
MEASURING THE IMPACT OF INTANGIBLE ASSET INVESTMENT TOWARD COMPANY
FINANCIAL HEALTH AND COMPANY AGENCY PROBLEM
70
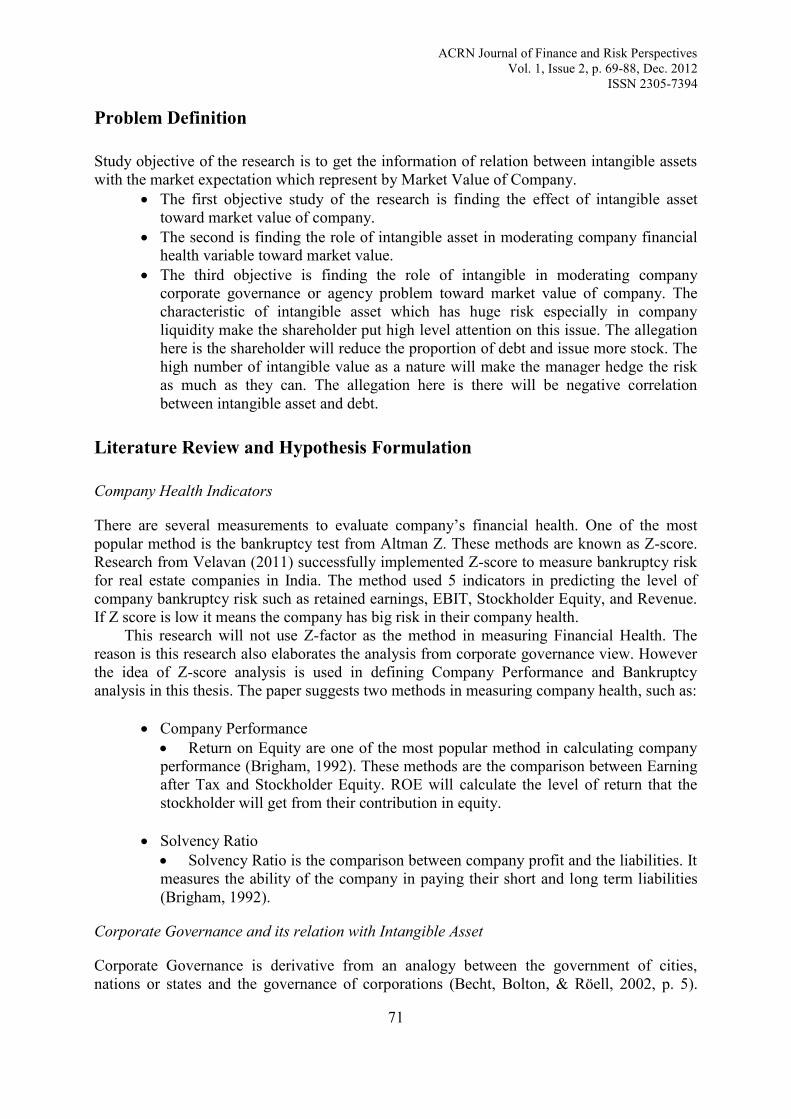
2011). Moreover, researcher believe that intangibles asset are ‘major drivers of company
growth and value in most economy sector’(Lev, 2001).
Before the financial crisis of 2008, Neil Gross in Business Week August 2001 stated that
‘Valuing intangibles is a tough job, but it has to be done’i. He also claimed that there are huge
transformations in defining important asset. ‘The shifting from brick and mortar to patent and
knowledge are the new realities that grow in latest Modern business competition’. According
to that statement, the good knowledge and understanding about intangible asset can be one of
endurance component to face the crisis. Furthermore, Gross (2008) stated that many
accountants do not put in the account about this knowledge. It is caused by the nature of
intangible value which is not stated in balance sheet.
Petkov (2011) stressed that intangible asset brought many advantages to the company;
however, it also triggers the agency cost, which leads to the bankruptcy of the company. The
bankruptcy is the result of the large sunk cost (which are beneficial, only when they will be
returned in the future), (Martins & Alves, 2010). Align with explanation above; many
economists put allegation that the wrong way of manager in valuing and treating intangible
asset also led to world economic crisis in 2008 (Petkov, 2011). It is also worth mentioning
bubble phenomenon, namely the condition where the price of asset increases, but later on
falling down and end up with the lower intrinsic price (White, 2011). Economists believe that
bubble phenomenon can happen because of some asset that does not have ability to be
identifiable (Petkov, 2011). The effect was that the price of the asset does not reflect the real
number of intrinsic value. The increasing gap between market and book value of companies
spurred reflections on the importance of intangible asset and the way they are measured
(Garanina & Pavlova, 2011).
Indonesia is one of the countries which are able to maintain their economic growth
during the crisis. Based on the data in Indonesian Statistical Department, in 2008, Indonesia
recorded 6,01% on year average economic growth where almost all countries in rest of the
world recorded minus National Economic growth. During the first, the second, the third, and
the fourth quarter Indonesia record their growth as 6.21%; 6.25%, 6.30%, and 5.27%. Hence
Indonesia did not struggle the bubble burst, many researcher attempt to find the knowledge
behind it.
This phenomenon is not common in the global economic transaction framework
nowadays where the financial transaction can happen beyond the country border, thus the
bubble phenomenon should affect Indonesia easily. Both characteristic of intangible asset,
either in creating company competitive advantage or triggering the potential risk of the bubble
makes this particular asset become interesting research object therefore in this research we
will see how big the intangible asset role in assisting the Indonesian’s company’s endurance
before and during crisis in 2008 was.
Based on the paper from Organization for economic Cooperation and Development
(OECD) titled Foreign Direct Investment and Intellectual Capital Formation in South East
Asiaii, after 2002 foreign direct investment in Indonesia has increased, especially in
intellectual capital. The intangible asset has the same characteristic as bubble has; it is very
hard to measure the intrinsic value. The crisis that took a place in 2008 was a cause of the
United States bubble phenomenon. The question is, why Indonesia was not affected by the
whole world crisis in 2008, even if the intangible asset shared some similarity with the bubble
characteristic.
ACRN Journal of Finance and Risk Perspectives
Vol. 1, Issue 2, p. 69-88, Dec. 2012
ISSN 2305-7394
71
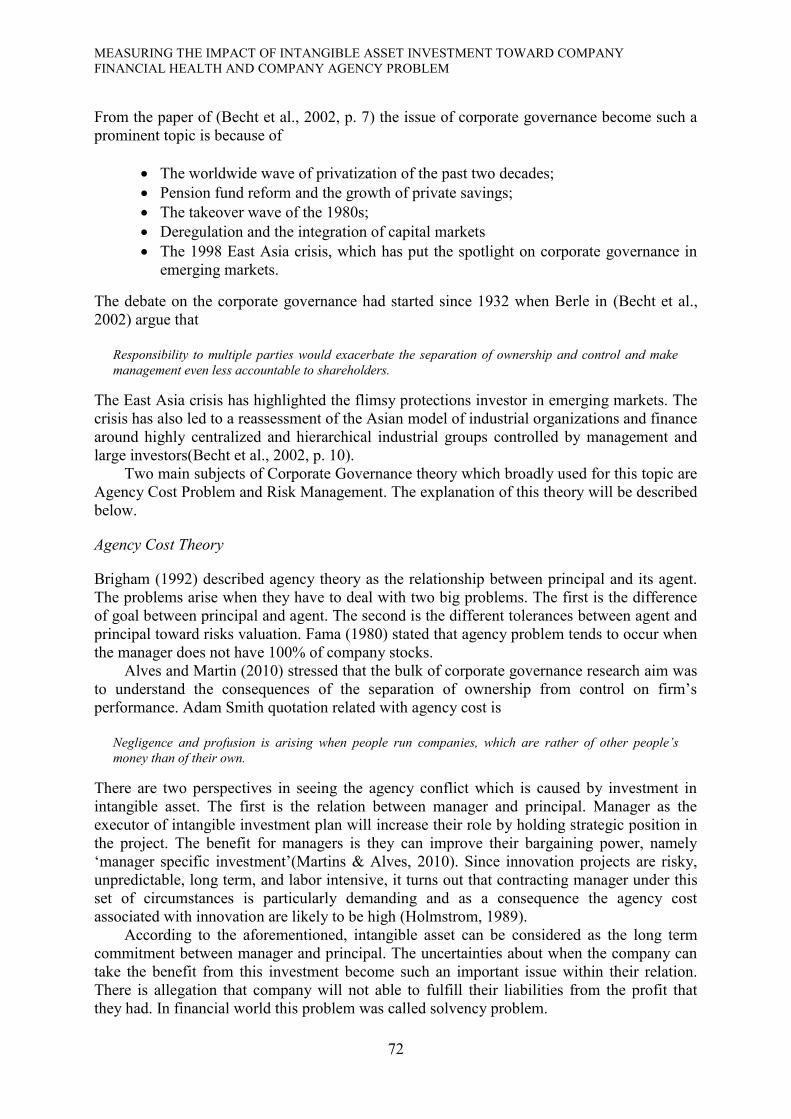
Problem Definition
Study objective of the research is to get the information of relation between intangible assets
with the market expectation which represent by Market Value of Company.
The first objective study of the research is finding the effect of intangible asset
toward market value of company.
The second is finding the role of intangible asset in moderating company financial
health variable toward market value.
The third objective is finding the role of intangible in moderating company
corporate governance or agency problem toward market value of company. The
characteristic of intangible asset which has huge risk especially in company
liquidity make the shareholder put high level attention on this issue. The allegation
here is the shareholder will reduce the proportion of debt and issue more stock. The
high number of intangible value as a nature will make the manager hedge the risk
as much as they can. The allegation here is there will be negative correlation
between intangible asset and debt.
Literature Review and Hypothesis Formulation
Company Health Indicators
There are several measurements to evaluate company’s financial health. One of the most
popular method is the bankruptcy test from Altman Z. These methods are known as Z-score.
Research from Velavan (2011) successfully implemented Z-score to measure bankruptcy risk
for real estate companies in India. The method used 5 indicators in predicting the level of
company bankruptcy risk such as retained earnings, EBIT, Stockholder Equity, and Revenue.
If Z score is low it means the company has big risk in their company health.
This research will not use Z-factor as the method in measuring Financial Health. The
reason is this research also elaborates the analysis from corporate governance view. However
the idea of Z-score analysis is used in defining Company Performance and Bankruptcy
analysis in this thesis. The paper suggests two methods in measuring company health, such as:
Company Performance
Return on Equity are one of the most popular method in calculating company
performance (Brigham, 1992). These methods are the comparison between Earning
after Tax and Stockholder Equity. ROE will calculate the level of return that the
stockholder will get from their contribution in equity.
Solvency Ratio
Solvency Ratio is the comparison between company profit and the liabilities. It
measures the ability of the company in paying their short and long term liabilities
(Brigham, 1992).
Corporate Governance and its relation with Intangible Asset
Corporate Governance is derivative from an analogy between the government of cities,
nations or states and the governance of corporations (Becht, Bolton, & Röell, 2002, p. 5).
MEASURING THE IMPACT OF INTANGIBLE ASSET INVESTMENT TOWARD COMPANY
FINANCIAL HEALTH AND COMPANY AGENCY PROBLEM
72
From the paper of (Becht et al., 2002, p. 7) the issue of corporate governance become such a
prominent topic is because of
The worldwide wave of privatization of the past two decades;
Pension fund reform and the growth of private savings;
The takeover wave of the 1980s;
Deregulation and the integration of capital markets
The 1998 East Asia crisis, which has put the spotlight on corporate governance in
emerging markets.
The debate on the corporate governance had started since 1932 when Berle in (Becht et al.,
2002) argue that
Responsibility to multiple parties would exacerbate the separation of ownership and control and make
management even less accountable to shareholders.
The East Asia crisis has highlighted the flimsy protections investor in emerging markets. The
crisis has also led to a reassessment of the Asian model of industrial organizations and finance
around highly centralized and hierarchical industrial groups controlled by management and
large investors(Becht et al., 2002, p. 10).
Two main subjects of Corporate Governance theory which broadly used for this topic are
Agency Cost Problem and Risk Management. The explanation of this theory will be described
below.
Agency Cost Theory
Brigham (1992) described agency theory as the relationship between principal and its agent.
The problems arise when they have to deal with two big problems. The first is the difference
of goal between principal and agent. The second is the different tolerances between agent and
principal toward risks valuation. Fama (1980) stated that agency problem tends to occur when
the manager does not have 100% of company stocks.
Alves and Martin (2010) stressed that the bulk of corporate governance research aim was
to understand the consequences of the separation of ownership from control on firm’s
performance. Adam Smith quotation related with agency cost is
Negligence and profusion is arising when people run companies, which are rather of other people’s
money than of their own.
There are two perspectives in seeing the agency conflict which is caused by investment in
intangible asset. The first is the relation between manager and principal. Manager as the
executor of intangible investment plan will increase their role by holding strategic position in
the project. The benefit for managers is they can improve their bargaining power, namely
‘manager specific investment’(Martins & Alves, 2010). Since innovation projects are risky,
unpredictable, long term, and labor intensive, it turns out that contracting manager under this
set of circumstances is particularly demanding and as a consequence the agency cost
associated with innovation are likely to be high (Holmstrom, 1989).
According to the aforementioned, intangible asset can be considered as the long term
commitment between manager and principal. The uncertainties about when the company can
take the benefit from this investment become such an important issue within their relation.
There is allegation that company will not able to fulfill their liabilities from the profit that
they had. In financial world this problem was called solvency problem.

ACRN Journal of Finance and Risk Perspectives
Vol. 1, Issue 2, p. 69-88, Dec. 2012
ISSN 2305-7394
73
Goyal (2002) said
Because the assets of high growth firms are largely intangible, debt holders have more difficulty
observing how stockholders se assets in high growth firms”
Moreover, Martin and Alves (2010) stressed that consequently as the scope for discretionary
behavior is higher in more intangible asset intensive sectors than in traditional industries, the
asset substitution (risk shifting) and under investment problem increase, exacerbating adverse
selection problems. From this perspective debt holder are the party who has highest risk
within information asymmetry and high bankruptcy costs, the consequence is debt holders
will limit their credit to intangible asset intensive firms(Martins & Alves, 2010).
Petkov (2011) stressed that there were possibilities of intangible asset that company does
not intend to use in order to deny other parties to access them. According from
aforementioned, intangible asset does not always booster the company operation performance.
If the definition criteria for control, identify ability and future benefits are not met, the
expenditure is recognized as an expense or as part of purchased goodwill if it involves a
business combination (IAS-38, 2007).
Martin and Alves (2010) stressed in their previous research about the relation of agency
cost and dividend Policy. Agency Cost between Manager and Shareholder will increase when
manager does not share the dividend (Martins & Alves, 2010). Based on this idea the paper
proposed dividend as the one of indicator the agency cost problem.
Risk Management
Risk Management is the process of identification, analysis and either acceptance or mitigation
of uncertainty in investment decision makingiii. In investment Risk, risk management is
separated into two types which are systematic risk and unsystematic risk. Systematic risk is
the risk that any company cannot avoid it and unsystematic risk is the risk that any company
can manage to avoid it. Systematic risk is related with the condition that closes with
macroeconomic such as the inflation, interest rate, the political instability, the trade balance of
the country and some macroeconomics variables. Related with systematic risk the company
can manage it by set the hedge to protect their asset.
In unsystematic risk, some variables can be managed by company such as agency
conflict, the operational cost risk, and any other microeconomic risk. At this level company
has mostly enough power to manage the risk such as reduce the agency cost, create the better
remuneration system, create the healthy dividend policy, arrange the financing structure
between equity and debt.
Related with this paper, the risk management become prominent because the
characteristic of modern company asset which is not physically seen. The nature of intangible
asset which highly risk needs special treatment in terms of risk management(Alves & Martins,
2010). Moreover, research from Petkov suggests some steps to deal with intangible asset risk.
One of the steps is reducing proportion of debt as the source in financing intangible asset. By
reducing the debt proportion, the risk of intangible investment will be borne by stockholder
with their equity. This is better because there are no obligations of manager to pay the return
of equity periodically. This character is different with debt which required debt interest to be
paid annually.

MEASURING THE IMPACT OF INTANGIBLE ASSET INVESTMENT TOWARD COMPANY
FINANCIAL HEALTH AND COMPANY AGENCY PROBLEM
74
Hypothesis Formulation
The Role of Intangible Asset Toward Market Value of Equity
Intangible asset are believed as the important factor in determine the company success
(Garanina & Pavlova, 2011; Lev, 2001; Stewart, 1995; Titova, 2011). Moreover Research
from Petkov (2011) stated that intangible asset has important role toward company success or
failure during the crisis. On this research, the author attempts to see the relation of intangible
asset and the market value of the company during the crisis period in 2006 until 2011. The
Market Value index here is represented by Tobin’s Q value index. Tobin’s Q are proved in
some previous researches as the valid indicator in showing investment effectiveness in
business market (Tillinger, 1991; Wolfe & Sauaia, 2005). Based on aforementioned, the
author propose first paper hypothesis
H1a: Intangible asset intensive has positive relation to market value of company.
The Role of Intangible Asset toward Company Financial Health’s
Garanina and Pavlova (2010) found that intangible value has positive relation with Company
Performance. Even though Petkov (2011) belief that intangible asset need several years before
the company can take its benefit, but the appreciation of company makes the principal belief
that company performance should improves. Based on this idea, the paper proposes second
Hypothesis.
H2a: Intangible asset can help to explain the relation between Company Performance and Company
Market Value.
The natures of intangible asset risk make principal more concern in its investment. The
principal tend to change the company financing structure. Debt holder also will mind to put
debt on high risk investment. This investment is affecting the corporate governance in
organization. There is allegation that company will not able to fulfill their liabilities when
they do investment in intangible asset.
The explanation above led to the hypothesis that there is difference in equity and debt
portion between company that have high intangible asset investment and the one who do not
put high investment in it.
H3a: Intangible asset can help to explain the relation between Company Financial Health and its effect
to market value of company.
The Role of Intangible Asset toward Agency Problem
The crisis in Indonesia which happened in 1998 is good example of liquidity problem. The
condition was caused by the high amount of debt which needs to be paid off. It becomes
worse when dollar scarcities as the debt currency are disappearing from market. These
conditions bring the awareness about debt risk.
According with it Alves and Martin (2010) argue that the existence of intangible asset
will increase the stakeholder monitoring toward debt volume. Principal will tend to finance all
intangible asset based on equity instead of debt because of debt. The premium of debt which

ACRN Journal of Finance and Risk Perspectives
Vol. 1, Issue 2, p. 69-88, Dec. 2012
ISSN 2305-7394
75
is high is too risky for financing innovation. This phenomenon led this paper into the idea that
the existence of intangible asset will have negative correlation with debt or leverage.
The nature of intangible asset which risky has made the company becomes more careful
in managing their asset. Based on research from (Alves & Martins, 2010), intangible assets
increase both agency cost of shareholders (hidden information and hidden action) and agency
cost of debt holders (asset substitution and underinvestment issues become more important).
As a consequence of both high non interest tax shields and high financial distress costs, the
level of debt is expected to be low in intangible assets intensive firms(Alves & Martins,
2010). In contrast, as intangibles assets are associated with high levels of information
asymmetry, pecking order theory, and signaling arguments suggest high levels of debt.
Profit retention is the lowest cost funding source of intangible assets firms(Petkov, 2011).
Moreover, the company who put intangible investment mostly uses this asset for long term
investment. If it comes to Company Life Cycle graph the company is in the position of
growth. Therefore intensive firms in intangible asset intend to pay low dividends. On the
other hand based on signaling theory, the company who has big asymmetric information will
tend to give higher dividend. Since the intangible asset was preferred to be financed by equity
the company will tend to make the equity become more attractive by the policy of more
generous in dividend sharing.
H4a: Intangible Asset is able to describe more about relation between debt proportions toward Market
Value of Company.
H5a: Based on signaling theory, Intangible asset can help to explain the relation between the dividend
policy and market value.
Methodology and Hypothetical Test
The analysis of intangible asset role needs the existence of variables. Multiple regression
analysis need two or more variable and type for measurement of both dependent and
explanatory will be interval (Zikmund, Babin, Carr, & Griffin, 2010). The dependent will be
explained by the independent. Here are the list of variables and theory behind it.
The formula will work when the value of each variable has the same or comparable type
(Hair, 2006). Since the purpose of the research is getting the relative value from each
company so typical data from this research was using ratio. Another advantage is the ratio
volume can reduce the level of deviation which results from the huge variance and company
size.
Table 1. List of Variables
Variable Definition Type
Company Investment Effectiveness
Tobins Q Ratio The ratio between market value of equities plus liabilities
compared with book value of asset
DEPENDENT
Fundamental Value
Intangible Value (Log
Form)
Intangible Value based INDEPENDENCE
& MODERATOR

MEASURING THE IMPACT OF INTANGIBLE ASSET INVESTMENT TOWARD COMPANY
FINANCIAL HEALTH AND COMPANY AGENCY PROBLEM
76
Variable Definition Type
Solvency Ratio The ratio of the company ability in fulfill their short term
liabilities
INDEPENDENCE
Firm Corporate Governance& Characteristic
Firm Performance Return On Equity INDEPENDENCE
Debt Ratio The proportion of Debt in the company INDEPENDENCE
Dividend Pay Out (Log
Form)
Dummy Variable related with policy of Company in
Giving Dividend or not
INDEPENDENCE
Firm Size (Log Form) The Size of the Firm, will be transformed into log forms CONTR
Dependent Variable
Tobins Q ratio is proposed as the dependent variable. This variable was used in some
previous research such as research from Tillinger (1991) and Wolve (2005). Tobin’s Q were
consistently showed its ability in measuring the company investment effectiveness (Tillinger,
1991). Moreover Tobins Q also able to show the result of short games business performance
(Wolfe & Sauaia, 2005).
Moreover, research related with Intangible Asset from Garanina (2010) claimed that
Intangible value was one of important factor in determining the Market Value of the
company. This theory becomes the background of the decision in using this variable.
Independent Variable
Solvency Ratio
Solvency ratio is the measurement of company’s ability to pay their long term obligation. The
calculation is based on company’s after tax income, excluding non-cash depreciation
expenses, as compared to the firms total debt obligations (Brigham, 1992).
The calculation is
Moreover Brigham (1992) stated that acceptable solvency ratio will be different from one
and other industry. However the number which considered normal if the solvency ratio is
greater than 20%. The lower solvency ratio means the greater risk to be default in obligations
payment.
The relation between Solvency Ratio and intangible asset here was described on the
introduction before. Martin and Alves (2010) stated that greater intangible investment, then
greater possibility of company bankruptcy. That author conveyed that unphysical asset will
risky when this sector cannot pay back the investment from its return. Moreover, liquidity
problem always following this asset since the companies cannot sell their intangibles.

ACRN Journal of Finance and Risk Perspectives
Vol. 1, Issue 2, p. 69-88, Dec. 2012
ISSN 2305-7394
77
Firm Performance
Firm Performance here was putted based on the research from Martin and Alves (2010) wich
use ROE as the indicator of company performance. The performance of the company will
raise the market value of the company(Brigham, 1992). However in some particular condition
the performance of the company will not help to raise the market value when the economic
condition is in the crisis. In 2008, there was one company namely BUMI RESOURCE which
performed well in mining industry but its asset value was dramatically sliding in 3 monthsiv.
This condition proves that during the crisis, each company variable has unpredictable
characteristic. The influence of intangible asset toward firm performance will be analyzed in
this research.
Dividend Payout
Dividend Payout are used oftenly as the indicator of Agency Theory in the company (Petkov,
2011; Titova, 2011). Dividend also used as the indicator of signaling theory phenomenon in
the company. Signaling theory stated that the company will share dividend when the company
need more stock for their operation. Signaling theory is also close with company internal
governance issue (Brigham, 1992). In Agency Conflict issue, signaling theory can be
interpreted as the manager willingness to raise the market value of company for their own
favor. One indicator of agency conflict allegation is when the company does not perform well
and still share the dividend. Most common step after this is the company will issue more
stock.
On the other hand, opposite from signaling theory, company will not share so many
dividends. The reason is because the company still in the growth phase which means the
company needs more capital to invest in intangible value (Alves & Martins, 2010). Two
theory of it will be analyzed in each hypothesis. At this research, we will also use one variable
which not in metric type. We will use one dummy variable which means only 0 or 1 as the
variable to help the reliability of model. The control variable here is related with dividend
policy. If the companies share their dividend then the value will be 1 otherwise it wills 0.
The variance on dividend amount to share is commonly big among companies. On this
research the author convert the dividend value from each company into logarithms form.
Debt Ratio
Lev (2001) explained that intangible has high liquidity risk. Liquidity risk here means about
the ease of company asset to be sold. This risk affects the shareholder to be more careful in
financing the intangible investment. Martin and Alves (2010) in their paper told that there are
tendency to finance the intangible investment from the equity. The reason is to reduce the risk
from the debt holder in terms of intangible investment is failed in producing return. Therefore
debt ratio is putted as the independence variable as one of the variables which are expected
has negative correlation with intangible asset.
Intangible Asset
Research from Garanina (2011) and Alves (2010) put intangible as their independent variable.
However they did not put intangible Asset as moderator Variable. The contribution of this

MEASURING THE IMPACT OF INTANGIBLE ASSET INVESTMENT TOWARD COMPANY
FINANCIAL HEALTH AND COMPANY AGENCY PROBLEM
78
research toward business study in intangible asset is by putting its variable as the moderator
on the model.
There are two reasons why this research put intangible asset as moderator variable. First
the big range in company size make the calculation of intangible industry has large standard
deviation. The varieties in One Industry in Indonesia are quite big. Second reason is this
research want to see deeper influence of intangible asset toward other variable and also the
model. The third reason is because the assumption of CIV model in calculating the intangible
value has so many criticizes in accuracy, so this research will emphasize on the existence of
intangible value toward the other variable. The intangible here still will be counted and
represented in descriptive statistic. However in the regression model, intangible value will be
converted into dummy variable where stated if the company has positive intangible value then
it will be in value 1 but if the company does not have or have 0 intangible values then it will
be written in 0 values.
Moderator variable here was expected to give moderator effect. Moderator effect based
on Hair (2006) is the variable where has function in moderating the explanatory variable to
explain more the dependence. When Intangible value here become Moderator variable is
expected to be able explain more the model of the dependence and increase the adj. R square
model.
The intangible variable has quite big variance. The volume mostly aligned with the size
of the company. Therefore in reducing the variance problem, the research converts the
variable with logarithms form.
Control Variable (Firm Size)
Indonesia has big variety in the company size range. Even in one industry sector the gap can
be so large. Here control variable namely Firm Size will be attached to help the model in
explaining the dependence variable. The wide variety in Indonesian company size will be
disadvantage for this research; therefore the author will convert the form of the firm size into
the logarithm value.
First Model
Second Model
Deal with collinearity model from Moderation
Gujarati (2003) stated that Moderation variable is increasing the collinearity problem in the
model. Collinearity occurs when the interaction between explanatory variables within the
model is higher than the relation of explanatory variable and the dependent variable.
Therefore Gujarati suggest the result of moderation to be centralized. The formula of data
centralization is

ACRN Journal of Finance and Risk Perspectives
Vol. 1, Issue 2, p. 69-88, Dec. 2012
ISSN 2305-7394
79
Centralize Moderating Variable = Moderating variable – Median of the Group.
The example is there are 3 data on the observation such as 9, 18, and 27. Here if the data
has same value with median then it will be valued 0. The value which is less than median will
have negative value, in this term 18 become 0, 9 become -9 (9-18) and 27 become 9 (27-18).
This method was proofed effectively in reducing collinearity problem.
Data Analysis
Descriptive Statistic
Descriptive Statistic here has a purpose to describe the general information of the sample. The
descriptive statistic will show the mean, median, standard deviation, and variance. The
descriptive statistic here will show the development of the phenomenon in the observation
data from year to year especially in the development of intangible asset data.
Table Preliminary results from data collection
Intangible Asset and Goodwill Report Count Percentage
2011 98 32.70%
2010 95 32.36%
2009 90 31.50%
2008 85 29.62%
2007 77 26.83%
2006 65 22.65%
Average 62.5714286 29.28%
The limited availability of data made the researcher to take fixed number of company which
consistently publishes their financial report. Therefore the research took 30 companies in 6
years period of time.
The proportion of each company with complete financial data is displayed below. From
each industry, the research took randomly and put it in the group of observation.
Number Classification Amount Percentage
1 Agriculture 24 8.54%
2 Mining 23 8.19%
MEASURING THE IMPACT OF INTANGIBLE ASSET INVESTMENT TOWARD COMPANY
FINANCIAL HEALTH AND COMPANY AGENCY PROBLEM
80
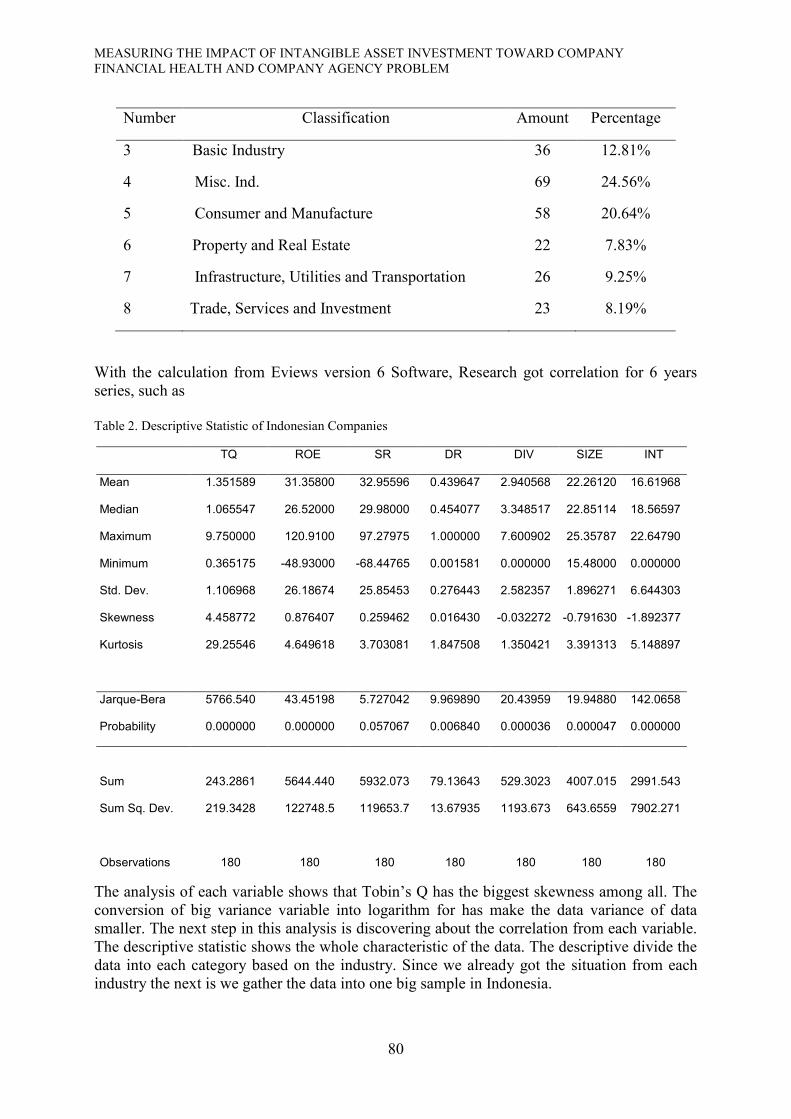
Number Classification Amount Percentage
3 Basic Industry 36 12.81%
4 Misc. Ind. 69 24.56%
5 Consumer and Manufacture 58 20.64%
6 Property and Real Estate 22 7.83%
7 Infrastructure, Utilities and Transportation 26 9.25%
8 Trade, Services and Investment 23 8.19%
With the calculation from Eviews version 6 Software, Research got correlation for 6 years
series, such as
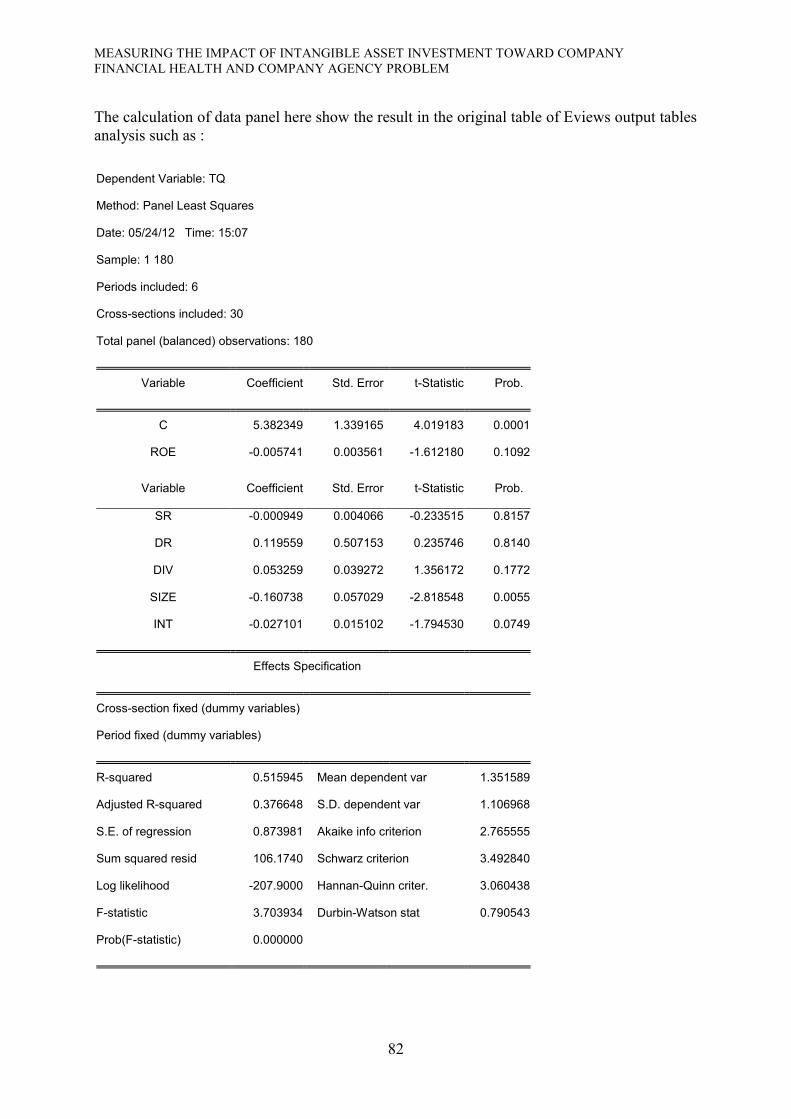
Table 2. Descriptive Statistic of Indonesian Companies
TQ ROE SR DR DIV SIZE INT
Mean 1.351589 31.35800 32.95596 0.439647 2.940568 22.26120 16.61968
Median 1.065547 26.52000 29.98000 0.454077 3.348517 22.85114 18.56597
Maximum 9.750000 120.9100 97.27975 1.000000 7.600902 25.35787 22.64790
Minimum 0.365175 -48.93000 -68.44765 0.001581 0.000000 15.48000 0.000000
Std. Dev. 1.106968 26.18674 25.85453 0.276443 2.582357 1.896271 6.644303
Skewness 4.458772 0.876407 0.259462 0.016430 -0.032272 -0.791630 -1.892377
Kurtosis 29.25546 4.649618 3.703081 1.847508 1.350421 3.391313 5.148897
Jarque-Bera 5766.540 43.45198 5.727042 9.969890 20.43959 19.94880 142.0658
Probability 0.000000 0.000000 0.057067 0.006840 0.000036 0.000047 0.000000
Sum 243.2861 5644.440 5932.073 79.13643 529.3023 4007.015 2991.543
Sum Sq. Dev. 219.3428 122748.5 119653.7 13.67935 1193.673 643.6559 7902.271
Observations 180 180 180 180 180 180 180
The analysis of each variable shows that Tobin’s Q has the biggest skewness among all. The
conversion of big variance variable into logarithm for has make the data variance of data
smaller. The next step in this analysis is discovering about the correlation from each variable.
The descriptive statistic shows the whole characteristic of the data. The descriptive divide the
data into each category based on the industry. Since we already got the situation from each
industry the next is we gather the data into one big sample in Indonesia.

ACRN Journal of Finance and Risk Perspectives
Vol. 1, Issue 2, p. 69-88, Dec. 2012
ISSN 2305-7394
81
The tables below show the bivariate correlation between each variable. The data will be
divided into each year to see the relation from each variable before and at crisis.
TQ ROE SR DR DIV SIZE INT
TQ 1.000000
ROE -0.021186 1.000000
SR 0.067973 0.266714 1.000000
DR 0.225156 0.049850 0.003822 1.000000
DIV -0.117271 0.233799 0.015234 -0.431009 1.000000
SIZE -0.294725 -0.116052 -0.225169 -0.270626 0.340011 1.000000
INT 0.104321 0.103060 0.188969 0.236977 -0.077063 -0.099792 1.000000
The significant correlation here will be started from the intangible asset
Intangible Asset has positive and significance correlation with Tobins Q Index.
Intangible Value has significance correlation with Company Performance.
Intangible Asset has positive significance with Solvency Ratio
Intangible Asset has positive significance with Debt Ratio
Intangible Asset has negative and not significance with dividend and size of
company.
Regression Analysis
Panel Data Analysis
Regression analysis here has a purpose to find out the relationship between dependent
variable and explanatory variable. The author intends to find the relation of the each variable
from the regression analysis. The analysis will analyze t-test of each independent analysis, the
F-test from the model, and the adjusted R squared. The data are the 30 selected companies
which has complete financial report. The time span for the research is 6 years from 2006 until
2011. In terms of finding the causality the calculation will use Panel Data analysis.
Each variable has been adjusted to have valid model in regression analysis. The Dividend
Payout, Intangible Value, and the size of Firm already converted in Ln. The software that the
author used here is Eviews 6th
version.
The regression model for Panel Data analysis here are :
+
MEASURING THE IMPACT OF INTANGIBLE ASSET INVESTMENT TOWARD COMPANY
FINANCIAL HEALTH AND COMPANY AGENCY PROBLEM
82
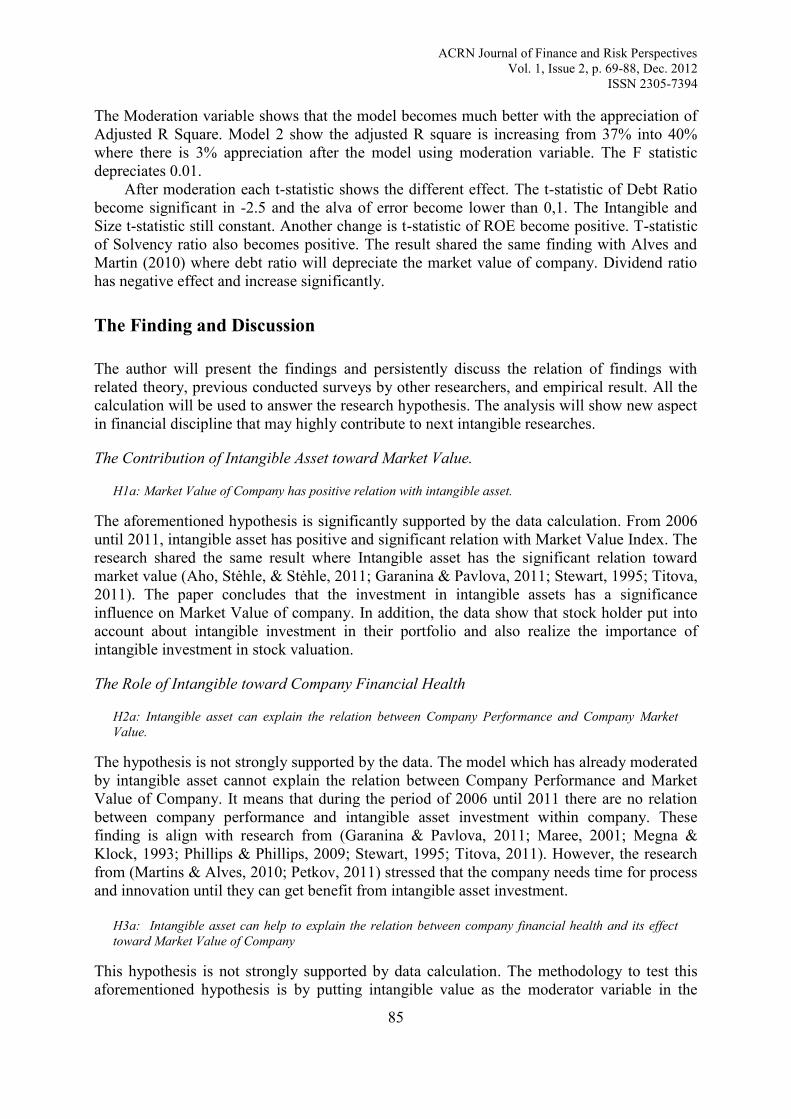
The calculation of data panel here show the result in the original table of Eviews output tables
analysis such as :
Dependent Variable: TQ
Method: Panel Least Squares
Date: 05/24/12 Time: 15:07
Sample: 1 180
Periods included: 6
Cross-sections included: 30
Total panel (balanced) observations: 180
Variable Coefficient Std. Error t-Statistic Prob.
C 5.382349 1.339165 4.019183 0.0001
ROE -0.005741 0.003561 -1.612180 0.1092
Variable Coefficient Std. Error t-Statistic Prob.
SR -0.000949 0.004066 -0.233515 0.8157
DR 0.119559 0.507153 0.235746 0.8140
DIV 0.053259 0.039272 1.356172 0.1772
SIZE -0.160738 0.057029 -2.818548 0.0055
INT -0.027101 0.015102 -1.794530 0.0749
Effects Specification
Cross-section fixed (dummy variables)
Period fixed (dummy variables)
R-squared 0.515945 Mean dependent var 1.351589
Adjusted R-squared 0.376648 S.D. dependent var 1.106968
S.E. of regression 0.873981 Akaike info criterion 2.765555
Sum squared resid 106.1740 Schwarz criterion 3.492840
Log likelihood -207.9000 Hannan-Quinn criter. 3.060438
F-statistic 3.703934 Durbin-Watson stat 0.790543
Prob(F-statistic) 0.000000

ACRN Journal of Finance and Risk Perspectives
Vol. 1, Issue 2, p. 69-88, Dec. 2012
ISSN 2305-7394
83
The panel data regression result
The table above shows the result of data pools from 2006 until 2011. The adj. R square
number are 0, 37 which means the model can describe 37% from the whole phenomenon. The
F statistics are 3.7 with the standard error below 0.01. The F-statistic shows that the model
significantly influences the dependence Variable. The variance analysis shows that the mean
of dependence variable are higher than the standard deviation.
The analysis of independent data, the author found that t-statistic of Intangible value has
Significance -1,7 and with significance under 0,1 toward market value index. It means the
depreciation of each intangible asset has opposite relation with the appreciation the market
value. This result has opposite value with research from Garanina and Pavlova (2011), where
they found intangible has positive correlation with the market value index.
The Control variable, Company Size has significant t-statistic 2.81 with standard error
Alva less than 0,1. This analysis proved the theory of Tobin’s Q theory that the appreciation
of company size whiles the market value of company stagnant will result the negative relation
within it.
Other variable exclude intangible asset and size does not show their relation with the
market value. Even ROE and Solvency ratio has negative relation but the error value is not
significance. Therefore the paper will attempt to show the hide value by putting intangible
value as the moderator within the model.
Panel Data with moderation value
The next uses moderation value. This model will evaluate the impact of intangible value
toward each financial indicator. The Moderation method here is by multiplying each
independent variable with intangible value. To reduce the Multicollinearity the paper uses the
centering method for each result of moderation variable.
And to manage with collinearity after moderation, the moderator variable was centered with
formula
The time span is from 2006 until 2011. The author calculating the model by Eviews 6th
version.

MEASURING THE IMPACT OF INTANGIBLE ASSET INVESTMENT TOWARD COMPANY
FINANCIAL HEALTH AND COMPANY AGENCY PROBLEM
84
The data show this result
Dependent Variable: TQ
Method: Panel Least Squares
Date: 05/24/12 Time: 15:08
Sample: 1 180
Periods included: 6
Cross-sections included: 30
Total panel (balanced) observations: 180
Variable Coefficient Std. Error t-Statistic Prob.
C 6.012628 2.090090 2.876732 0.0047
ROE -0.006858 0.009206 -0.744941 0.4576
SR 0.001080 0.004122 0.261867 0.7938
Variable Coefficient Std. Error t-Statistic Prob.
INT -0.070904 0.039448 -1.797397 0.0745
MODCTRROE 0.000115 0.000526 0.218765 0.8272
MODCTRSR 2.70E-06 7.55E-06 0.357975 0.7209
MODCTRDR -0.226291 0.087086 -2.598465 0.0104
MODCTRDIV -0.009001 0.006617 -1.360199 0.1761
MODCTRSIZE 0.005918 0.002216 2.670758 0.0085
Effects Specification
Cross-section fixed (dummy variables)
Period fixed (dummy variables)
R-squared 0.552746 Mean dependent var 1.351589
Adjusted R-squared 0.402549 S.D. dependent var 1.106968
S.E. of regression 0.855631 Akaike info criterion 2.742039
Sum squared resid 98.10196 Schwarz criterion 3.558017
Log likelihood -200.7835 Hannan-Quinn criter. 3.072883
F-statistic 3.680134 Durbin-Watson stat 0.845812
Prob(F-statistic) 0.000000
ACRN Journal of Finance and Risk Perspectives
Vol. 1, Issue 2, p. 69-88, Dec. 2012
ISSN 2305-7394
85
The Moderation variable shows that the model becomes much better with the appreciation of
Adjusted R Square. Model 2 show the adjusted R square is increasing from 37% into 40%
where there is 3% appreciation after the model using moderation variable. The F statistic
depreciates 0.01.
After moderation each t-statistic shows the different effect. The t-statistic of Debt Ratio
become significant in -2.5 and the alva of error become lower than 0,1. The Intangible and
Size t-statistic still constant. Another change is t-statistic of ROE become positive. T-statistic
of Solvency ratio also becomes positive. The result shared the same finding with Alves and
Martin (2010) where debt ratio will depreciate the market value of company. Dividend ratio
has negative effect and increase significantly.
The Finding and Discussion
The author will present the findings and persistently discuss the relation of findings with
related theory, previous conducted surveys by other researchers, and empirical result. All the
calculation will be used to answer the research hypothesis. The analysis will show new aspect
in financial discipline that may highly contribute to next intangible researches.
The Contribution of Intangible Asset toward Market Value.
H1a: Market Value of Company has positive relation with intangible asset.
The aforementioned hypothesis is significantly supported by the data calculation. From 2006
until 2011, intangible asset has positive and significant relation with Market Value Index. The
research shared the same result where Intangible asset has the significant relation toward
market value (Aho, Stėhle, & Stėhle, 2011; Garanina & Pavlova, 2011; Stewart, 1995; Titova,
2011). The paper concludes that the investment in intangible assets has a significance
influence on Market Value of company. In addition, the data show that stock holder put into
account about intangible investment in their portfolio and also realize the importance of
intangible investment in stock valuation.
The Role of Intangible toward Company Financial Health
H2a: Intangible asset can explain the relation between Company Performance and Company Market
Value.
The hypothesis is not strongly supported by the data. The model which has already moderated
by intangible asset cannot explain the relation between Company Performance and Market
Value of Company. It means that during the period of 2006 until 2011 there are no relation
between company performance and intangible asset investment within company. These
finding is align with research from (Garanina & Pavlova, 2011; Maree, 2001; Megna &
Klock, 1993; Phillips & Phillips, 2009; Stewart, 1995; Titova, 2011). However, the research
from (Martins & Alves, 2010; Petkov, 2011) stressed that the company needs time for process
and innovation until they can get benefit from intangible asset investment.
H3a: Intangible asset can help to explain the relation between company financial health and its effect
toward Market Value of Company
This hypothesis is not strongly supported by data calculation. The methodology to test this
aforementioned hypothesis is by putting intangible value as the moderator variable in the
MEASURING THE IMPACT OF INTANGIBLE ASSET INVESTMENT TOWARD COMPANY
FINANCIAL HEALTH AND COMPANY AGENCY PROBLEM
86
model. The value of Solvency Ratio which has been multiplied by Intangible value could not
show any significance appreciation toward t-statistic. It means that the level of intangible
value will not affect the ability of company in fulfilling their liability.
The research from Petkov (2011) which stated that investment in intangible asset will
depreciate the company ability in paying their liabilities was not supported by the calculation.
In addition to that, solvency ratio is the parameter of company ability in paying their short and
long term obligation. The high volume of solvency ratio means that the company is able to
pay their liabilities However; data panel calculation does not show any relation between
solvency ratio and market value of company.
The Role of Intangible Toward Agency Conflict
H4a: Intangible Asset is able to describe more about relation between debt proportion toward Market
Value of Company.
The aforementioned hypothesis is strongly supported by the data calculation. Based on
calculation, there are negative relations between intangible asset and debt. The manager tends
to finance intangible asset with stock instead of debt. The debts with high interest-rate make
investment in intangible too risky. Data panel show there are negative relations between
intangible and debt. Within Market value, debt also has strong negative relation with the
improvement of market value of company. The reason is the high level of debt will increase
the risk of the company because of their interest premium.
H5a: Based on signaling theory, intangible asset can explain more the relationship between the dividend
policy and company market value.
The last hypothesis is strongly supported by data calculation. After get moderated by
intangible value the dividend does show t-statistic improvement. In the regression, there is
shown that there is positive relationship between dividend and market valued of the company.
It means that for the company with intangible value intensive tends to increase their stock. Its
aligned with research result from Alves, high investment company will prefer to finance their
activity from their equity (Alves & Martins, 2010). It means they give positive signaling news
to the shareholder in order to increase their stock.
Conclusion
The research in finding out how Indonesia can survive during crisis 2008 is always interesting
discussion among economist. The data and analysis that the author has collected from 2006
until 2011 show some way in seeing this phenomenon from different point of view, namely
intangible asset.
The conclusion is described below.
1. The research find that Intangible as Moderator value can improve the ability of the
model in explaining the phenomenon. The value of adj. r square has increased after
moderation variable is used. Intangible asset also has significant relation between
company market value. It means stockholder estimates that intangible value
investment is an important issue in company operation decision.
2. The Hypothesis related to the Role of Intangible Asset in Company Financial Health is
not strongly supported by data calculation. Which means the market price of the
ACRN Journal of Finance and Risk Perspectives
Vol. 1, Issue 2, p. 69-88, Dec. 2012
ISSN 2305-7394
87
company is not influenced by intangible asset investment if the company has good
performance.
3. The second hypothesis which is related to the role of Intangible in Financial Health is
not strongly supported by data calculation. Even though the solvency ratio variable
was moderated by intangible asset, but there were no significant change within the
model. This finding lead the researcher to belief that solvency ratio as the bankruptcy
indicator does not show any relation with market value of equity. The paper has
discovered that investment in Intangible asset will not affect the perception of market
toward company who has bankruptcy risk.
4. The first hypothesis related to the role of intangible asset in affecting market price of
company who has internal conflict was strongly supported by data. It is started by the
calculation of first model which does not use moderator variable. It results that the
model did not show the relation between debt and market value added. However,
when moderation value moderates comes up, the relationship become significant
between debt ratio and market value of the company. It means the increase of
intangible asset has influence the investor valuation toward company who has internal
conflict.
5. The Second hypothesis related to the role of intangible asset within corporate
governance policy was strongly supported by data. The relation between dividend and
market value of company is increased when the moderator variable is putted in. The
appearance of moderator variable is followed by the improvement of t-statistic. It
proves that signaling theory is occurred when intangible asset is moderating the
model.
Reference
Aho, S., Stėhle, S., & Stėhle, P. (2011). A critical assessment of Stewart's CIV method. [Article]. Measuring
Business Excellence, 15(4), 27-35. doi: 10.1108/13683041111184080
Alves, S., & Martins, J. (2010). The Impact of Intangible Assets on Financial and Governance Policies: UK
Evidence. [Article]. International Research Journal of Finance & Economics(36), 147-169.
Becht, M., Bolton, P., & Röell, A. A. (2002). Corporate Governance and Control. SSRN eLibrary. doi:
10.2139/ssrn.343461
Brigham, E. F. (1992). Fundamentals of financial management. Fort Worth: Dryden Press.
Garanina, T., & Pavlova, Y. (2011). Intangible Assets and Value Creation of a Company: Russian and UK
Evidence. [Article]. Proceedings of the European Conference on Intellectual Capital, 165-175.
Hair, J. F. (2006). Multivariate data analysis. Upper Saddle River, N.J.: Prentice Hall.
Holmstrom. (1989). Agency costs and innovation, . Journal of Economic Behavior and Organization, 12(4),
305-327.
IAS-38. (2007). International Accounting Standards No.38. IASB, London, 3(IASB).
Lev, B. (2001). Intangibles: management, measurement, and reporting. Washington, D.C.: Brookings Institution
Press.
Maree, K. W. (2001). Valuation of intellectual capital in South African companies: a comparative study of three
valuation methods. Master of Commerce Dissertation, Department of Accounting.
Martins, J., & Alves, S. (2010). THE IMPACT OF INTANGIBLE ASSETS ON FINANCIAL AND
GOVERNANCE POLICIES: A LITERATURE REVIEW. [Article]. Portuguese Journal of
Management Studies, 15(1), 87-107.
Megna, P., & Klock, M. (1993). The impact of intangible capital on Tobin's q in the semiconductor industry.
[Article]. American Economic Review, 83(2), 265.
Petkov, R. R. (2011). The Current Financial Crisis and Its Potential Impact on Internally Generated Intangible
Assets. [Article]. International Journal of Business & Management, 6(3), 37-44.

MEASURING THE IMPACT OF INTANGIBLE ASSET INVESTMENT TOWARD COMPANY
FINANCIAL HEALTH AND COMPANY AGENCY PROBLEM
88
Phillips, J., & Phillips, P. (2009). Measuring return on investment in HR. [Article]. Strategic HR Review, 8(6),
12-19. doi: 10.1106/14754390910990946
Stewart, T. A. (1995). TRYING TO GRASP THE INTANGIBLE. [Article]. Fortune, 132(7), 157-161.
Tillinger, J. W. (1991). An Analysis of the Effectiveness of the Research and Experimentation Tax Credit in a q
Model of Valuation. [Article]. Journal of the American Taxation Association, 13(2), 1.
Titova, N. (2011). Summary on Intellectual Capital Value Added (VAIC) and Calculated Intangible Value (CIV)
all Over the World: Lessons to be Learnt. [Article]. Proceedings of the European Conference on
Intellectual Capital, 543-554.
White, L. J. (2011). PREVENTING BUBBLES: WHAT ROLE FOR FINANCIAL REGULATION? [Article].
CATO Journal, 31(3), 603-619.
Wolfe, J., & Sauaia, A. C. A. (2005). The Tobin q as a business game performance indicator. [Article].
Simulation & Gaming, 36(2), 238-249. doi: 10.1177/1046878105275237
Zikmund, W. G., Babin, B. J., Carr, J. C., & Griffin, M. (2010). Business Research Methods. Canada: South-
Western, Cengage Learning.
Endnote
i Gross, Neil, Commentary: Valuing ‘intangibles’ is tough job, but it has to be done.
http://www.businessweek.com/magazine/content/01_32/b3744008.htm
ii http://www.oecd.org/dataoecd/8/40/1949901.pdf
iii http://www.investopedia.com/terms/r/riskmanagement.asp#axzz1r3DBnpm0
iv http://us.finance.detik.com/read/2008/09/15/095817/1006187/6/saham-bumi-bisa-jatuh-lagi