Measuring the Effectiveness of Neurological Rehabilitation ...
238
Measuring the Effectiveness of Neurological Rehabilitation Thesis submitted to the University of London for the Degree of Doctor of Medicine, February 2004 Rory James O’Connor Neurological Outcome Measures Unit Institute of Neurology University College London
Transcript of Measuring the Effectiveness of Neurological Rehabilitation ...

Measuring the Effectiveness of Neurological Rehabilitation
Thesis submitted to the University of London for the Degree of Doctor of
Medicine, February 2004
Rory James O’Connor
Neurological Outcome Measures Unit
Institute of Neurology
University College London

UMI Number: U593267
All rights reserved
INFORMATION TO ALL USERS The quality of this reproduction is dependent upon the quality of the copy submitted.
In the unlikely event that the author did not send a complete manuscript and there are missing pages, these will be noted. Also, if material had to be removed,
a note will indicate the deletion.
Dissertation Publishing
UMI U593267Published by ProQuest LLC 2013. Copyright in the Dissertation held by the Author.
Microform Edition © ProQuest LLC.All rights reserved. This work is protected against
unauthorized copying under Title 17, United States Code.
ProQuest LLC 789 East Eisenhower Parkway
P.O. Box 1346 Ann Arbor, Ml 48106-1346

Abstract
Neurological rehabilitation aims to reduce the restrictions on an individual’s
participation in society. Psychometrically rigorous and clinically relevant
outcome measures, used appropriately, enhance the evidence base of
rehabilitation. This Thesis assesses routinely used outcome measures at
three time points: inpatient, outpatient, and longer-term follow-up. First, a
retrospective analysis of the inpatient database of the Neurorehabilitation
Unit was carried out to assess the Barthel index (Bl) and Functional
Independence Measure (FIM). Second, a prospective study examined the
impact of rehabilitation on physical function and emotional wellbeing. Five
measures were completed on admission, discharge and three months post
discharge: the Bl (clinician and patient scored versions), FIM, General Health
Questionnaire and Hospital Anxiety and Depression Scale. Finally, the effect
of multiple sclerosis (MS) on work retention was assessed in a cross-
sectional study using a newly developed outcome measure, the Impact on
Work Questionnaire.
In the first study, the responsiveness of the Bl and FIM total scores ranged
from moderate to large. But item level analyses indicated differential item
performance, with effect sizes varying from very low to large, associated with
large floor and ceiling effects. The second study demonstrated the significant
improvements in physical and psychological functioning in patients
undergoing rehabilitation. Physical gains persisted after discharge, however,
emotional wellbeing deteriorated. The last study revealed that a combination
2

of MS-related problems, environmental restrictions and poor vocational
support impact on work retention in people with MS.
Following patients through the rehabilitation process, in the form of three
distinct studies, has afforded a unique view of the effect of rehabilitation in
neurological conditions. Furthermore, the examination of routinely used
measures has provided guidance on the application of these in future
research. Choosing the most appropriate measures and analytical
techniques provides richer data, facilitates accurate evaluation of
rehabilitation interventions, and ultimately improves patient care.
3

Statement of Originality
The discussion on rehabilitation and outcome measurement that comprises
Chapter 1 is the result of my own research of the literature. Measuring the
responsiveness of the Barthel index and FIM is Dr Hobart’s original concept.
I analysed the database of outcome measures, performed the calculations
and wrote the first draft of findings and discussion. Professor Thompson and
Drs Cano, Hobart and Playford reviewed Chapter 2. Dr Playford, Professor
Thompson and I designed the study described in Chapter 3 .1 designed the
questionnaires, prepared the database, and analysed the data with guidance
from Dr Cano. The nurses and therapists of the NRU collected Barthel, FIM
and GHQ data on admission and discharge. I collected all other data for this
study. Professor Thompson and Dr Playford reviewed Chapter 3. Dr Playford
conceived the study described in Chapter 4. Professor Thompson, Dr
Playford and I designed the study. I designed the questionnaires, collected
the data, and analysed the results with guidance from Dr Cano. Dr Lluls
Rami6 i Torrents assisted in the data collection for the second part of the
study. Professor Thompson and Drs Cano and Playford reviewed Chapter 4.
I wrote the first draft of Chapter 5, which was reviewed by Professor
Thompson and Dr Playford. Ideas or quotations from the work of other
people are fully acknowledged in accordance with standard referencing
practice.
4

Table of Contents
Title page
Abstract
Statement of originality
Table of contents
List of tables
List of figures
Appendices
Chapter 1 Introduction
1.1 Introduction to Neurological Rehabilitation
1.1.1 History of Rehabilitation
1.1.2 The Rehabilitation Process
1.1.3 The Neurorehabilitation Unit (NRU)
1.2 Outcome Measurement
1.2.1 History
1.2.2 Psychometric Principles
1.2.3 Role in Rehabilitation
1.3 Types of Outcome Measure
1.3.1 Generic
1.3.2 Dimension Specific
1.3.3 Disease Specific

1.4 Administration of Outcome Measures
1.4.1 Postal Questionnaires
1.4.2 Telephone Interviewing
1.4.3 Face-to-Face Interviewing
1.5 Study Objectives
Chapter 2 Responsiveness of the Barthel and FIM
2.1 Introduction
2.2 Methods
2.2.1 Sample
2.2.2 Barthel Index
2.2.3 FIM
2.2.4 Analyses
2.3 Results
2.3.1 Sample
2.3.2 Barthel Index
2.3.3 FIM
2.4 Discussion
2.4.1 Summary of Results
2.4.2 Study Strengths and Limitations
2.4.3 Implications for Clinical Practice
2.4.4 Conclusion

Chapter 3 Measuring the Impact of Inpatient Rehabilitation 96
3.1 Introduction 97
3.2 Methods 100
3.2.1 Sample 101
3.2.2 Outcome Measures 102
3.2.3 Analyses 106
3.3 Results 109
3.3.1 Demographics 109
3.3.2 Physical Function 113
3.3.3 Emotional Wellbeing 116
3.3.4 Psychometric Analysis 120
3.4 Discussion 124
3.4.1 Summary of Results 124
3.4.2 Study Strengths and Limitations 129
3.4.3 Implications for Clinical Practice 132
3.4.4 Conclusion 136
7

Chapter 4 The Impact of MS on Work Retention 137
4.1 Introduction 138
4.2 Qualitative Study 148
4.2.1 Methods 148
4.2.2 Results 148
4.3 Quantitative Study 151
4.3.1 Methods 152
4.3.2 Results 155
4.4 Discussion 164
4.4.1 Summary of Results 164
4.4.2 Study Strengths and Limitations 167
4.4.3 Implications for Clinical Practice 168
4.4.4 Conclusion 171
Chapter 5 Conclusion 172
5.1 Summary of Findings 173
5.2 Implications for Rehabilitation Research 175
5.3 Future Directions 180
5.4 Conclusion 187
References 189
8

List of Tables
Chapter 2
2.1 Items of the Barthel index and FIM 68
2.2 Sample demographics 75
2.3 Barthel index and FIM scores 76
2.4 Total group Barthel responsiveness and floor/ceiling effects 77
2.5a Barthel responsiveness and floor/ceiling effects for MS 78
2.5b Barthel responsiveness and floor/ceiling effects for stroke 78
2.5c Barthel responsiveness and floor/ceiling effects for SCI 79
2.6 Total group FIM responsiveness and floor/ceiling effects 82
2.7a FIM responsiveness and floor/ceiling effects for MS 83
2.7b FIM responsiveness and floor/ceiling effects for stroke 84
2.7c FIM responsiveness and floor/ceiling effects for SCI 85
Chapter 3
3.1 Patients’ demographics on admission 112
3.2 Physical function measures: admission and discharge 114
3.3 Psychometric properties of the self-report Barthel index 115
3.4 Emotional wellbeing measures: admission and discharge 116
3.5 Emotional wellbeing measures: follow-up 117
3.6 HADS categories: admission, discharge and follow-up 118
3.7 Emotional wellbeing measures: acute onset versus chronic 119

3.8 Psychometric properties of the GHQ-28 and HADS 121
3.9 Correlations between GHQ-28 and HADS subscales 122
3.10 Discharge transition question 122
Chapter 4
4.1 Employment in people with MS 140
4.2 Demographics of patients in quantitative study 156
4.3 Impact of MS on work retention 157
4.4 Endorsement frequency: impact on work questionnaire 160
4.5 Acceptability: impact on work questionnaire 161
4.6 Factor loading: impact on work questionnaire scales 162
4.7 Reliability: impact on work questionnaire 163
4.8 Intercorrelations between questionnaire scales 164
10

List of Figures
Chapter 1
1.1 International classification of impairments (ICIDH) 21
1.2 International classification of functioning (ICF) 24
Chapter 2
2.1 Barthel index item responsiveness 80
2.2 FIM item responsiveness 86
Chapter 3
3.1 Recruitment to study 110
3.2 ROC curve for GHQ-28 123
Chapter 4
4.1 Duration of MS and work retention 158
11

Appendices
1 Self-report Barthel index 227
2 General Health Questionnaire 230
3 Hospital Anxiety and Depression Scale 232
4 Impact on Work Questionnaire 237
12

Chapter 1 1ntroduction

Chapter 1 Introduction
1.1 Introduction to Neurological Rehabilitation
Neurological rehabilitation is an educational and problem solving approach
for individuals with disabling neurological illnesses that enables them to
achieve their optimum physical, psychological and social function. (Marks et
al. 2000) It involves both active change by the individual who has become
disabled to acquire the skills necessary to participate in society, and the use
of resources to reduce societal barriers. (Rehabilitation Advisory Group NHS
Executive 1997)
Neurological rehabilitation requires significant input from the patient as well
as considerable healthcare resources; therefore, rehabilitation services must
ensure that they are effective. To demonstrate effectiveness, it is necessary
to measure the changes in patients’ health status as they journey from the
onset of neurological illness, through rehabilitation, and onto reintegration
into the community and resumption of their social roles. Measuring
effectiveness improves the evidence base of neurological rehabilitation; but
to detect clinically important change in patients, it is necessary to use
responsive outcome measures. Furthermore, for neurological rehabilitation to
be worthwhile, the changes made must endure after discharge as measured
after reintegration into the community. And, after returning home, patients
who wish to resume work must be able to do so; therefore the impact of
neurological illness on work retention must be examined.
14

The effect of rehabilitation can be measured at several levels - impairment,
activity and participation. To understand how these concepts have
developed, this Chapter will explore the origins of neurological rehabilitation
and how rehabilitation is currently practised in the Neurorehabilitation Unit
(NRU) of the National Hospital for Neurology and Neurosurgery (NHNN),
where the studies in this Thesis were undertaken. To demonstrate the
established scientific background of outcome measurement and its relevance
to healthcare, the history of outcome measurement will be reviewed with
particular emphasis on how outcome measurement has become a key
element in neurological rehabilitation. Finally in this Chapter, the studies that
comprise this Thesis will be outlined.
1.1.1 History of Rehabilitation
Rehabilitation as a concept in medicine only came into existence in the late
19th Century. Before this time, most patients who had been seriously injured,
or who had sustained life-threatening illnesses, died. There are, however,
some surprisingly modern examples of rehabilitation practice from antiquity.
One illustration of this is a comprehensive therapeutic programme for the
functional deficits due to stroke, developed by Caelius Aurelianus working in
Rome around 400 AD. (Lippert-Gruner 2002) He proposed the use of
individualised rehabilitation programmes focusing on the impairments caused
by stroke including facial paralysis, dysphagia and mobility restrictions. He
also describes for the first time a graded exercise programme. This
15

programme progresses from walking with the assistance of two, through
walking with aids, to walking unaided across uneven surfaces. Unfortunately,
the comprehensive multidisciplinary team approach used by Caelius
Aurelianus did not survive the fall of the Roman Empire and the subsequent
Dark Ages in Europe.
With the improvements in healthcare in the latter half of the 19th century -
organised nursing care, antisepsis and anaesthetics - many more patients
were surviving hitherto fatal illnesses. (Howat 2001) In particular, those
injured during armed conflict were surviving injuries sustained during combat.
With increasingly sophisticated weapons, it became necessary to employ
larger armies. Two of the largest conflicts of the 19th century were the
Crimean war (1853 -1856) and the American civil war (1861 - 1865). They
resulted in casualties on a scale never encountered before. For instance, it
has been estimated that 15,000 men lost a limb during the American Civil
War. (O'Connor 1997) Paradoxically, the first modern style artificial limb was
exhibited at the Crystal Palace Exhibition in 1851. One of the notable
developments during the American Civil War was the Turner’s Lane Hospital.
(Freemon 1993) Here Silas Mitchell developed a centre for the treatment of
soldiers with neurological injuries. The three neurologists on the staff of the
hospital studied and developed treatments for neuropathic pain and phantom
limb pain, common symptoms in neurological rehabilitation practice still seen
today. But the developments in treating these neurological injuries did not
extend to the treatment of spinal cord injuries. In the mid-19th century,
16

patients with cervical level injuries died within one week of injury and patients
with lumbar level injuries succumbed within a month. (Silver 1993)
By the end of the 19th century progress had been made in the rehabilitation
of patients with hemiplegia and aphasia following stroke. The mainstays of
treatment at this point were intensive retraining and exercise. In 1856, Todd
described the use of regular active or passive exercising of paralysed limbs
to prevent contracture development. (Licht 1973) Towards the end of the
century, Frenkel, at the Hopital Pttig-Salpdtr&re, developed the first hospital
gymnasium to promote the principles of retraining after stroke. (Licht 1970)
Charcot’s successor at the Salpgtr&re, Raymond, coined the phrase
“reeducation des movements” for the service.
Apart from the examples mentioned above, very few rehabilitation facilities
were in existence at the start of the First World War. The years 1914 to 1918
left a legacy of an estimated 10 million disabled people amongst the nations
involved in the conflict; 400,000 in Britain alone. (Koven 1994) This resulted
in a huge need for services to cope with the needs of soldiers recently
paralysed or with limb amputations. Robert Jones, an Army orthopaedic
surgeon, lamented the lack of comprehensive physical therapy to ensure the
success of his orthopaedic operations. His research into disability at the time
focused on the person holistically and encouraged regular therapy to foster a
sense of normality amongst ex-servicemen. (Buxton 1965)
17

Vocational rehabilitation was extolled in the years after World War One by Sir
William Osier who stated “there is no question of greater national importance
than how to make these men again effective citizens, capable of earning
their own living”. (Cited in Koven 1994) The need for diversions to occupy
former soldiers led to the development of occupational therapy, a new
discipline that utilised purposeful activity to facilitate rehabilitation. Its
strategies had developed from the moral treatment movement of the late
1800’s. Patients who were considered to be “mentally or muscularly flabby”
were prescribed a period of training to restore their occupational ability.
(Hanson and Walker 1992) The use of occupational treatments moved from
being purely diversional, through being therapeutic, to being seen as an
essential part of treatment to allow a person to reintegrate into their
communities. The literature of the history of occupational therapy describes
the progression from ex-servicemen making ashtrays from used bullets to a
more comprehensive service within community hospitals where patients with
disabilities were brought through a series of programmes from the “pre
industrial shop” to proper work and in some cases into a new career.
(Gutman 1995; Gutman 1997) Interestingly, the founders of the discipline
drew on Caelius Aurelianus’ earlier model of graded activity to remedy the
deconditioning that occurred after disabling injury, building on the example of
the rehabilitation of patients recovering from pulmonary tuberculosis in
Germany. (Creighton 1993)
After the outbreak of World War Two, several strategies were put in place to
co-ordinate the care of soldiers injured during combat. The first spinal cord
18

injury centre in the Britain was established at Stoke-Mandeville in 1941. This
unit’s management of spinal cord injury reduced the mortality rate of spinal
cord injury which at the end of the 1930’s was still 80% within the first year.
(Silver 1993) The same year, a brain injury unit was established in
association with the Royal Infirmary in Edinburgh to care for soldiers with
traumatic brain injuries. (Pentland et al. 1989) One of the founders of this
unit, Oliver Zangwill, went on to develop a vocational rehabilitation service for
patients with brain injury. Similarly, in the United States, the Air Force was
the first of the Forces to develop a rehabilitation programme for its injured
pilots in 1942. (Moss 1974) This was an integral part of the Air Force’s
hospital services and was primarily responsible for returning pilots to active
service. This situation was mirrored in Canada, where Botterell opened the
first spinal cord injury unit in North America in 1945 to rehabilitate Canadian
soldiers injured in the War and return them to a productive life. (Tator 1999)
Many physicians who returned from World War Two saw the need for
services in the community similar to those that they had been providing to
disabled soldiers. (Chamberlain 1992) A number of rehabilitation units were
set up, particularly in the United Kingdom, in disused military hospitals, to
provide a range of services for people with neurological injuries, amputations
and rheumatological illnesses. Some of the principles of rehabilitation that
had developed for patients with neurological injuries were applied in other
medical fields for previously well patients who had became disabled through
acute illness. For example, in cardiology, patients following acute myocardial
infarction were prescribed eight weeks of bed rest. So called strenuous
19

activities, such as climbing the stairs, were prohibited, often indefinitely.
Needless to say, patients rarely returned to a normal lifestyle and never to
employment. In 1951, the first post myocardial infarction rehabilitation
programme was instituted and proven to be safe. (Pashkow 1993) Cardiac
rehabilitation rapidly became an accepted treatment when it was shown that,
not only was it not detrimental to patients’ health, but it actually reduced
complications, such as pulmonary embolism.
By the 1970s most developed countries had a network of rehabilitation units
that provided care for patients with a range of neurological and non-
neurological illnesses. (Tunbridge 1972) These, in general, provided a
multidisciplinary approach to the patient and were developing programmes of
research into rehabilitation methods and outcome measurement. In order to
standardise nomenclature between countries and to capture information
about non-fatal health outcomes, the World Health Organisation developed
the International Classification of Impairments, Disabilities and Handicaps
(ICIDH). (World Health Organisation 1980) This classification was an attempt
to gather data beyond the mortality statistics that had been collect by the
International Statistical Classification of Disease and Related Health
Problems (ICD). It was largely the result of work by Badley, Bury and Wood
in Manchester, who were studying the epidemiology of disabling conditions,
and who required a conceptual model to classify the impact of disabling
illness on an individual. (Wood 1989) They suggested a linear model that
links a pathological process to its clinical manifestations (impairments) that
impact on an individual’s ability to perform tasks (disability), which then
20

impede his or her functioning in society (handicap). The overall model is
illustrated by a diagram showing one-way arrows linking impairment,
disability and handicap (Figure 1).
Figure 1 International classification of impairments, disabilities and
handicaps (World Health Organisation 1980)
Disease —► Impairment —► Disability —► Handicap
The ICIDH was proposed in 1975 along the lines of the long established ICD
and eventually published for field trials in 1980. (De Kleijn-de Vrankrijker
2003) It was initially taken up enthusiastically by rehabilitation professionals
in developed countries. (Granger 1985) However, the underlying concept of
a linear model from pathology through to handicap has been challenged.
(Thuriaux 1995) How pathology contributes to impairment and subsequently
causes disability and handicap is not a straightforward relationship and is
dependent on how individuals interact with their environment. Although this
was acknowledged in the commentary for the ICIDH, the role of personal and
environmental factors in handicap were not recorded by the classification.
(Ustun et al. 2003) This meant that the ICIDH could not record or measure
the effect that social circumstances and the physical environment had on an
individual. For instance, if an individual does not return home after a stroke, it
(intrinsic) (exteriorised) (objectified) (socialised)
21

is not possible to record if that was due to the individual’s poor recovery or
due to their home environment.
There are relatively strong relationships between pathology and impairment
e.g. in stroke, the clinical classification can be based on territory of cerebral
infarction. (Bamford et al. 1991) There may also be a relationship between
pathology and disability. This is less well defined, however, and while there
may be a relationship, for example, in multiple sclerosis between lesions
demonstrated on magnetic resonance imaging and disability, (O'Riordan et
al. 1998a) other lesions can be demonstrated that are asymptomatic.
(O'Riordan etal. 1998b)
There is a more tenuous relationship between pathology and handicap, as
the latter is affected by the individual’s interaction with his or her
environment. Two examples illustrate this point. In rural Mexico, a disabled
child is seen as evidence of the parents’ ability to care for an especially
vulnerable infant and so confers status on the parents. (Groce 1999)
Secondly, in an area of east Massachusetts, there is an unusually high
prevalence of autosomal recessive deafness resulting in a high proportion of
babies being born deaf. Everyone in the community, both hearing and deaf
understands sign language, consequently the social consequences
(handicap) of deafness in that community are minimal. (Schalick 2000)
22

To overcome these drawbacks, a revised version of the classification was
proposed: the International Classification of Functioning, Disability and
Health (ICF). (World Health Organisation 2001) This was a further attempt to
describe the experience of disability and its manifestations on an individual
(Figure 2). It was developed in parallel, in numerous languages, and field-
tested in 15 countries in an inclusive process, involving disability groups,
professional bodies and non-governmental organisations. One key element
was the move away from what was seen as the medical model bias of the
ICIDH. According to this model, disability requires medical treatment by
clinicians. (Engel 1977) The other end of the spectrum is the social model.
This requires society to adapt to the requirements of even the most severely
disabled individual. (Bickenbach et al. 1999) The ICF synthesises the useful
elements of the two models, rather than opting for one of the extremes. In
this regard it may be seen as a biopsychosocial model. (Ustun et al. 2003)
23
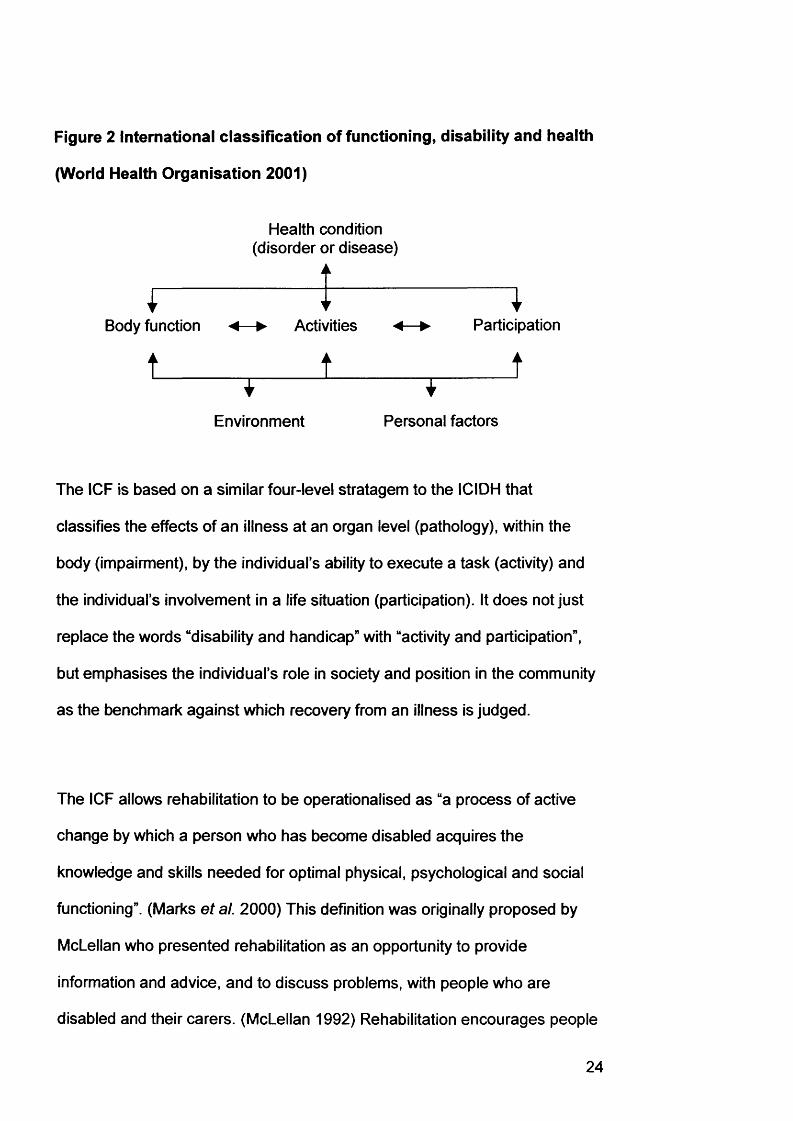
Figure 2 international classification of functioning, disability and health
(World Health Organisation 2001)
Body function
1
Health condition (disorder or disease)
Activities
1Participation
tEnvironment Personal factors
The ICF is based on a similar four-level stratagem to the ICIDH that
classifies the effects of an illness at an organ level (pathology), within the
body (impairment), by the individual’s ability to execute a task (activity) and
the individual’s involvement in a life situation (participation). It does not just
replace the words “disability and handicap” with “activity and participation”,
but emphasises the individual’s role in society and position in the community
as the benchmark against which recovery from an illness is judged.
The ICF allows rehabilitation to be operationalised as “a process of active
change by which a person who has become disabled acquires the
knowledge and skills needed for optimal physical, psychological and social
functioning”. (Marks et al. 2000) This definition was originally proposed by
McLellan who presented rehabilitation as an opportunity to provide
information and advice, and to discuss problems, with people who are
disabled and their carers. (McLellan 1992) Rehabilitation encourages people
24

to use their knowledge and skills to bring themselves from a less able state
to one in which they have improved the interaction with their personal
environment, community and society in general, to a level with which they
are more satisfied. This takes the meaning of rehabilitation further and
removes it from its origins where “rehabilitation” was performed on patients
who had become acutely disabled, generally through trauma, to a much
more widely applicable philosophy where individuals guide their own
progress from their current situation towards their desired end point.
Neurological rehabilitation aims to assist individuals in reducing the
limitations placed on their activities and participation in society by
neurological illness.
The widening of the scope of neurological rehabilitation has allowed it to
develop from dealing solely with static neurological conditions, such as
complete spinal cord injury. Structured multidisciplinary rehabilitation
programmes are now in place for neurological illnesses which tend towards
recovery, such as stroke and traumatic brain injury, (Bohannon 1993) as well
as illnesses whose natural history is to deteriorate, such as progressive
multiple sclerosis and Parkinson’s Disease. (Freeman et al. 1997; Thompson
and Playford 2001)
The organisation of neurological rehabilitation is also changing and more
importance is being placed on working with individuals in the community and
in their preferred environments, such as work or leisure. (Wade 2003)
25

The evolution of neurological rehabilitation has taken place in the context of
the changes in society and healthcare along with an increase in the self-
determination of individuals that has occurred over time. This has resulted in
an evidence-based, individually tailored approach to the patient with a
neurological illness. It is within this framework that the current procedure for
neurological rehabilitation will be examined.
1.1.2 The Rehabilitation Process
Patients present to the health service with a sudden illness, or following
deterioration in their formerly stable health status, for which they seek an
explanation and treatment. Initially, they go through a diagnostic process that
aims to establish the underlying illness. This is essential to plan treatment in
the light of the overall prognosis of the condition. Often medical or surgical
treatments are used to arrest further decline or ameliorate symptoms. If
these are unsuccessful or are only partially successful, then other means
must be used to restore the patient’s functioning and autonomy in the
community. (Cardol et al. 2002) At this point, the multidisciplinary
neurological rehabilitation team assesses the patient to outline the
impairments and limitations to their activities and participation. (British
Society of Rehabilitation Medicine 2002)
26

Assessment in rehabilitation is somewhat different to making the traditional
medical diagnosis which concentrates on using patterns of impairments to
establish the underlying pathology that is backed up with laboratory or
radiological evidence. The goal of rehabilitation assessment is to acquire
sufficient information to understand the cause of the presenting problem,
develop a prognosis if appropriate, and plan specific interventions. (Wade
2002a) In rehabilitation, the presenting problems will be limitations in activity
or participation that have to be viewed in the context of the patient’s social
and environmental circumstances.
In many ways rehabilitation assessment has a wider scope than making a
medical diagnosis and relies on the multidisciplinary team’s breadth of skills
to establish all of the areas that require addressing. (Johnson and Thompson
1996) Individual team members may miss issues that are incorporated when
the team works together, providing a more comprehensive overview of the
patient’s potential to benefit from rehabilitation. (Cunningham et al. 2000)
The information collected is not just a means to an end. There is evidence
that there may be a therapeutic benefit in the assessment procedure itself
that highlights problems to the patient of which he or she may not have been
aware and may then wish to address before formally entering a rehabilitation
programme. (David et al. 1982) The assessment process is the first step on
a journey that leads to a full understanding of the patient’s problems and the
formulation of a treatment plan. (Wade 1998)
27

The next step on that journey is the translation of the activity and
participation issues into a set of realistic goals to be achieved during the
rehabilitation programme. In this context, goals may be based around
impairments, activities or participation. The long-term goal is the overall aim
of the rehabilitation programme. This is supplemented by short-term goals
that have a shorter time course and build on each other to guide the patient
towards his or her long-term goal.
Many rehabilitation units use a goal-orientated approach to rehabilitation on
the basis that setting a target focuses the staff and patient on achieving a
common objective. (Schut and Stam 1994) Setting appropriate short- and
long-term goals for a patient relies on a full and accurate assessment
procedure that outlines the patient’s limitations in activities and participation.
(McGrath and Davis 1992) It has been suggested that goals based around
participation issues, for example, shopping, are preferable to those based on
activities such as walking, balance or memory. (Wade 1999a) It is probably
more meaningful for the patient to focus on participation restrictions as they
have a greater immediacy and appropriateness to daily life for the patient in
society. There is also evidence that setting goals at the participation level
improves patient motivation as they are of greater relevance. (Schut and
Stam 1994) Patient involvement in goal setting may improve rehabilitation
outcome further. Participation of the patient in goal setting is fully compatible
with the philosophy of rehabilitation and contributes to the patient’s
autonomy. (Chan 2002)
28

Goal achievement can be recorded in a number of ways. Goal attainment
scaling assesses goal achievement by measuring the outcome of the goal
against a preordained schema. (Rockwood etal. 1997) Goals are scored
according to whether they are achieved, over achieved or under achieved.
This allows goal achievement to be quantified and examined statistically as
any other outcome measure. This technique does not, however, record why
goals were not achieved. Recording goal achievement using an integrated
care pathway (ICP) can allow analysis of goal components and the reasons
why goals may not have been achieved. (Lowe 1998)
ICPs were initially introduced to promote quality and effectiveness in
healthcare. (Lowe 1998) They were traditionally used in settings where care
and treatment follows a well-defined pathway, for example, joint replacement
surgery. (Aragon et al. 2002) It is increasingly recognised, however, that
ICPs are able to facilitate the provision of multidisciplinary medical care to
patients with complex needs. (Kitchiner et al. 1996) Use of ICPs has been
shown to improve assessment and inter-team communication in acute
stroke. (Sulch et al. 2002) They have been used to provide a framework for
the rehabilitation process by describing the procedures that will be carried
out during the patient’s stay, to record departures from that framework
(variances) and to describe those variances. (Rossiter and Thompson 1995)
They provide an opportunity for auditing the rehabilitation process as well as
the outcome in terms of goal achievement. (Rossiter et al. 1998)
29

Originally designed for use in hospitals, ICPs have been taken up by all
healthcare sectors and have been used to set guidelines, monitor costs and
improve communication between members of the multidisciplinary team.
(Riley 1998) Standards now exist to develop ICPs that cross from acute
hospital care, through rehabilitation and into community care, “integrated
community pathways”. (Young et al. 2003)
An ICP is the integration of medical information, goal achievement and
outcome measures within a document that is based on established
guidelines and evidence-based practice. (Jackson et al. 2002) But for an ICP
to be effective, the multidisciplinary team requires continuous education and
training. (Newton 2003) ICPs are most effective, and have the highest rates
of completion, when the multidisciplinary team has ownership over the
development, introduction and evolution of the ICP. (Hassan etal. 2002)
Reassessment of the patient during the course of their programme allows the
setting of new goals, the modification of treatments and the formulation of
discharge plans, all of which is facilitated by the ICP. Reassessment is, of
course, a key element in all medical procedures, but has become a sine qua
non in rehabilitation. (Sinclair and Dickinson 1998) It is part of the
standardised structured approach towards ameliorating a patient’s problems
that is used by the multidisciplinary team to identify issues both at the
assessment phase and during the journey through rehabilitation. (Wade
2002b) This ability to respond to changes in the patient’s status means that
30

both the team and the patient can remain focused on achieving the long-term
goal.
Having an appropriate long-term goal to be achieved by discharge, which
includes exploring options for return to work, allows the multidisciplinary
team and patient to see beyond the discharge and towards the resumption of
employment, education and social roles in the future. Some patients are able
to return to these roles immediately after discharge from rehabilitation.
However, others require the services of the outpatient therapy team or
community rehabilitation team. (Hopman and Vemer2003; Sim et al. 1997)
Vocational services, such as Jobcentre Plus or Rehab UK, working in
combination with the rehabilitation team, can facilitate return to work if this is
an element of the patient’s social role. (British Society of Rehabilitation
Medicine 2000)
This section has described current practice of rehabilitation within the
framework of the ICF. Rehabilitation allows the patient return to the
community retaining the gains made during the inpatient phase of their
programme and exploring options to return to full social interaction including
education and employment as appropriate. The next section outlines how
this process is applied in the neurological rehabilitation department where
the studies described in this Thesis were conducted.
31

1.1.3 The Neurorehabilitation Unit (NRU)
The NRU provides inpatient rehabilitation for adults with neurological
illnesses. It is a constituent part of the hospital and the majority of patients
admitted are referred by consultants from within the hospital. Patients are
either admitted directly from neurological or neurosurgical wards (40%)1 or
from home after being seen in outpatient clinics (49%). Eleven percent of
patients are admitted from other hospitals.
The multidisciplinary team sees inpatient referrals on the ward, while the
remainder is seen in the multidisciplinary clinic. During this assessment, the
patient’s impairments, activity limitations and participation restrictions are
noted and agreed upon by the members of the team. If it is felt that a transfer
to the NRU is appropriate, rather than outpatient or community treatment, the
main aims of the admission are discussed with the patient and, if acceptable,
the patient is admitted.
Once in the NRU, a goal-orientated programme of rehabilitation is planned
with a long-term goal and several short-term goals. Each patient has a
keyworker who is a member of the multidisciplinary team. The keyworker is
responsible for explaining the goals to the patient and ensuring that the
patient understands and agrees with them. Goal setting is a relatively new
technique in rehabilitation and perhaps because of this, the patient has not
1 Figures for 2002
32

been fully incorporated into the goal setting process. A trial is under way in
the NRU comparing the traditional way of goal setting with a collaborative
method that asks the patient to identify and prioritise the participation issues
that they feel are compromised by their illness. This information is then used
as a basis for goal setting. Preliminary work suggests that this method is
acceptable to patients and has identified areas of concern for the patient that
might have been missed by the traditional approach.
The collaborative goal setting trial has been facilitated by the ICP that is used
in the NRU, which incorporates the status of each goal set, as well as the
outcome measures recorded for each patient. (Freeman et al. 1996)
Originally, ICPs were developed for each of the three main diagnostic groups
in the NRU, namely multiple sclerosis, stroke and spinal cord impairment.
(Playford et al. 2002) These were recently combined to give a generic
document that can be used with all patients. (Edwards et al. 2003) The
outcome measurement information collected by the ICP is entered onto a
database in the NRU and interrogation of this database has enabled two of
the component studies of this Thesis.
1.2 Outcome Measurement
As outcome measurement is a key element in neurological rehabilitation, this
section looks at its history from initial observational work to a discipline that
can measure outcomes scientifically. The history of the science of
33
measurement, psychometrics, will also be outlined. Finally in this section, the
application of outcome measurement in neurological rehabilitation will be
examined.
1.2.1 History
In keeping with the developments in neurological rehabilitation in the 20th
Century, there has been recognition of the importance of recording the
outcome of treatment. But, outcomes of medical therapy have always been a
topic of interest to communities with medical practitioners. In ancient Egypt,
the code of Hammurabi prescribed financial rewards for successfully treating
patients. Inadequate outcomes were punished by physical and financial
penalties depending on the severity of the mishap. (Schwartz and Lurie
1990) Hippocrates encouraged those in his school to methodically report
their outcomes, both successes and failures. Over the following centuries,
however, medical progress became based on anecdotal observation. Not
until the Renaissance, with the emphasis on experimentation and systematic
observation, did scientific thought enter into medical decision making. James
Lind performed the first investigative trial for a medical treatment in 1747 for
the treatment of scurvy. (Bloom 1990) Even with evidence behind this
medical treatment, it was nearly fifty years before the authorities took it up as
a useful intervention.
In the 1800s mortality statistics were the primary outcome reported by
hospitals, with no regard for the results of the operations and interventions
34

that were performed within their institutions. Florence Nightingale, in her
important 1863 treatise Notes on Hospitals, wrote, “if the function of a
hospital were to kill the sick, statistical comparison of this nature would be
admissible”, (lezzoni 1996) After returning from the Crimean War, she
highlighted the importance of proper analysis of hospital activity in identifying
the causes of inpatient mortality. Her work laid the foundations for nurse
education and hospital design, both innovations leading to substantial
decreases in inpatient mortality. (Cook 2002; Cook and Webb 2002)
At the start of the 20th Century, Ernest Codman was proposing the “end-
result” system and he subsequently founded a hospital that bore this name.
(Neuhauser 1990) He started the first systematic recall of patients to review
how well treatment had resolved their complaint and what complications they
had sustained. He was aided by Frank Gilbreth, who proposed “scientific
management” in hospitals. Unfortunately, the hospital he founded failed after
the First World War and Codman turned his energies to other issues, most
notably setting up the first tumour register for sarcomas.
Evaluating outcomes became unfashionable in the years after Codman’s
death. It re-emerged in the 1970s as medical interventions became more
technical and commonplace and it was no longer such an ordeal to have
surgery. Indeed it became the case that some surgery was done routinely,
for example, tonsillectomies. The ethics and monetary consequences of
routine surgery came into question and forced clinicians to base their
35

treatments on the results of research and not anecdote. (Wennberg et al.
1980)
At present there is significant emphasis on auditing the outcome of all
aspects of medical care. Not just the end-result, but also the process by
which it has been achieved. Audit is defined as “the systematic critical
analysis of the quality of medical care, including diagnosis, treatment,
outcome and quality of life for the patient”. (Department of Health 1989) All
departments within hospitals and in the community are expected to regularly
audit their practice, identify areas for improvement and implement change.
(Wainwright et al. 1999) Several investigators have struck a note of caution.
(Brook 1997; Davies 2001) They argue that while we are gathering data
about the process of medical care, little is done to alter the deficiencies
found. The essential part of using outcomes to improve care is to complete
the “audit cycle” by examining the deficiencies noted, implementing changes
and then re-examining the changes to see if they have resulted in the
anticipated result. (National Institute for Clinical Evidence 2002; Turner-
Stokes 2003; Gnanalingham et al. 2001)
However, there has been a trend away from evaluating the outcome of
medical interventions by using data like mortality rates and lengths of stay.
Similarly, biomedical measures such as clinical or laboratory indices do not
provide a complete representation of the effect of treatment on an individual.
These measures, while important in their own right, are being supplemented
36

by measures of constructs that focus on issues of importance to the patient
such as functional status, health related quality of life and emotional well
being. (Fitzpatrick et al. 1998) A construct is a variable that is abstract rather
than concrete, and is defined in terms of observed behaviour. Unlike
concrete measures like blood pressure, it is more complex to measure
constructs such as walking ability, depression or satisfaction with role. This
requires the use of patient based outcome measures, where the patient
gives his or her opinion on the construct in question. (Bergner and Rothman
1987)
With healthcare becoming more focused on outcome in the last 30 years,
there has been increasing interest in seeking the patient’s opinion of his or
her own health. Patient based outcome measures have been developed that
allow patients to report their own health status. These outcome measures
encompass a range of physical, psychological and social constructs that may
be affected by illness. Measuring these constructs is a relatively new concept
in healthcare, but has a long history in the social sciences.
Psychometrics as a science developed out of experimental psychology at the
turn of the last century. There was a desire to measure constructs in the
human experience such as intelligence, educational attainment or mood for
which there were no objective measurement scales. It quickly became a
fundamental part of educational psychology and the measurement of
attitudes. (Thurstone 1928a) In the 1920s and 1930s a set of requirements
37

for measures was developed, which formed the basis of modern outcome
measurement. (Thurstone 1928b) This emphasised the need for measures of
constructs, such as intelligence, that were linear, similar to the measurement
of length or weight.
Thurstone’s method required the administration of a measurement scale to a
large number of individuals for calibration. This was a time-consuming
process and resulted in a scale that was only valid for the population for
which the scale had been calibrated. (Streiner and Norman 1995)
Subsequently, Likert, working with Gardner Murphy, developed measures of
attitudes based on an individual giving their response to a set of adjectives
on a rating scale from “strongly approve” to “strongly disapprove”. (Likert
1932) This was subsequently taken up by healthcare researchers and widely
used without the underlying proof that what was being measured was
actually linear. In effect, this means that the distance between any two points
on the scale may not be the same, for example, is the distance from
“approve” to “strongly approve” the same as the distance from “disapprove”
to “strongly disapprove”? Likert did not deal with this point in his original
paper, and the debate over the importance of linearity has continued since.
(Streiner and Norman 1995)
The science of psychometrics, or “classical” test theory, became an intrinsic
part of educational and psychological evaluation in the 1950s. Classical test
theory was extensively investigated and applied in these areas. (Massof
38

2002) By this time, a number of leading psychometricians such as Louis
Guttman, Frederic Lord and Georg Rasch had developed the next level of
scale assessment. (Hambleton et al. 1991) This evolved into two areas of
statistical method: item response theory and Rasch analysis. (Hobart 2002;
Rasch 1966) These methods recognise that an individual’s response to an
item in a measure represents some amount of the trait and then attempts to
place those points into a linear relationship with other points.
Psychometrics came late to healthcare but has become widespread since
the late 1970s with the development of numerous rating scales and patient
based outcome measures, and the evaluation of older measurement
instruments. (Hobart et al. 2001b) It is now recognised that in order to record
a patient’s or clinician’s observations, one must use the principles of
psychometrics to ensure that the construct is measured accurately.
1.2.2 Psychometric Principles
Outcome measures rely on being psychometrically sound to provide the best
estimation of the construct being measured. The psychometric criteria for
examining outcome measures have been developed and refined over the
last fifty years and there is now a substantial body of work to refer to.
Outcome measures are traditionally examined with regard to acceptability,
reliability, validity and responsiveness. This section outlines these properties
and how each contributes to the development of scientifically rigorous
39

outcome measures. Each of these properties builds on, and in some
instances impacts upon, the previous properties. Where there is conflict
between two or more properties, this is discussed under the relevant
heading.
Acceptability: The first measure of acceptability of an instrument that must
be made is whether it is acceptable to the individuals to which it is to be
administered - this has been termed “respondent burden”. Acceptable
measures reduce potential distress in individuals who may be unwell and
improve response rates in surveys. (Fitzpatrick etal. 1998) The Medical
Outcomes Trust, an international, independent body responsible for
promoting standards in outcome measurement, regards acceptability as one
of the most important criteria in the selection of a measurement instrument.
(Lohr et al. 1996)
Acceptability can encompass a number of aspects: the time burden,
perceived relevance and perceived intrusiveness to patients. Acceptability
can be measured by the length of time taken to complete the questionnaire;
by a transitional question, asking the patient how he or she felt about
answering the questionnaire; (Andresen et al. 1998) or by a structured
interview carried out by the researcher after administering the measure.
(Cheung et al. 2000)
40

Respondents may also find instruments that have high content validity (see
later) more acceptable and this can be enhanced by using questions
developed from structured interviews of patients with the illness or condition
so that acceptability is addressed at each stage of the design. (Hobart et al.
2001a) This method reduces the possibility of designing questions that
patients might find irrelevant, inappropriate, intrusive or offensive.
The second way of defining acceptability reflects the spread of the data
recorded by the outcome measure in relation to the real spread of the data.
(Ware, Jr. 1987) Ideally, the range of responses should match the range of
the measure, with the mean of the responses at approximately the mid-point
of the scale. (Testa and Simonson 1996) It can also be measured by the
floor and ceiling effects (the proportion of patients who score each item at the
lowest and highest points of the scale, respectively) and endorsement
frequency tables (how many patients answer each of the items). Guidelines
for floor and ceiling effects vary, but most authors would recommend that
both should be less than 15% to 20% of items in the top and bottom
endorsement categories. (Hobart et al. 2001a; McHorney et al. 1994)
Floor effects limit the ability of an outcome measure to detect change, as
patients who score at the floor on their initial evaluation, may not change
their score at follow-up, despite an improvement in their underlying clinical
condition. For these patients, the extent of their change will be under-
measured. (Ganiats et al. 1992) Conversely, patients who are already
41

scoring at the ceiling of a measure at baseline cannot change their score
irrespective of any further improvement. (Stucki et al. 1995b) For instance,
an item in an outcome measure may rate patients as either dependent or
independent in performing a task, such as walking. A patient with tetraplegia
may change from being immobile to walking with standby assistance.
However, on both occasions, this patient will be scored as dependent. The
patient’s clinical improvement is not matched by an improvement in the
outcome measure score. Therefore, changes outside the scale’s scope of
measurement will not be detected. In effect, this means that the impact of an
intervention could potentially be underestimated. Whilst scales are designed
to minimise total score floor and ceiling effects, the impact of item floor and
ceiling effects on a scale’s psychometric performance has not been
examined. (Hobart et al. 2002; McHorney et al. 1994)
Reliability: Reliability is an estimate of the reproducibility and internal
consistency of an outcome measure. (Fitzpatrick et al. 1998) A measure
produces a total score that comprises the true score plus measurement
error. (Bergner and Rothman 1987) The reliability coefficient represents the
proportion of the total score that can be attributed to the true score. There
are a number of reliability indices, including test-retest reliability, interrater
reliability, intrarater reliability and internal consistency.
To be useful in a longitudinal study, a patient based outcome measure needs
adequate test-retest reliability. This is the degree to which the measure is
42

stable over time when no change is expected in the underlying condition. An
interval of between two and 14 days is recommended between
administrations of the measure. If the interval is longer, then the condition being
measured may change. If the interval is shorter than two days, reliability may be
overestimated due to a learning effect, that is, the respondent remembers
the answers that he or she gave before, which introduces a bias. (Streiner
and Norman 1995)
Test-retest scores can be evaluated in a number of ways. The most
commonly used method is the intraclass correlation coefficient (ICC) which is
calculated from the analysis of variance table (ANOVA). This is a statistical
technique that determines the variance between the two administrations of
the outcome measure. Whilst the ICC is commonly used in reliability studies,
there is no set guideline for the level at which it should be set. Studies in the
literature have used ICCs that range between 0.60 and 0.80 (Andresen et al.
1996; Hobart etal. 2001a)
The second main way that test-retest results can be reported is by means of
the Pearson correlation, which is a statistical technique based on regression
analysis. It produces a statistic that measures how well a straight line can be
fitted to the two sets of data. However, it may not detect if there is a
systematic difference between the two sets of data. This tends to exaggerate
the correlation between the two sets of data leading to spuriously high
results. (Fitzpatrick et al. 1998; Streiner and Norman 1995)
43

For clinician rated outcome measures, other aspects of reliability are tested,
namely interrater reliability and intrarater reliability. Interrater reliability
examines the error between different clinicians measuring the same patient
at the same time. Intrarater reliability is analogous to test-retest reliability,
and examines the error between two sets of measures performed by the
same clinician rating a patient who is stable over time. The ICC is also
preferentially used to express these indices at similar levels to the test-retest
reliability index (0.60 to 0.80). (Unal et al. 2001) If individual clinical decisions
are to be based on the outcome of the instrument then much higher interrater
reliability should be sought; ideally the ICC should be greater than 0.95.
(Lohr et al. 1996) For example, if patients are to be discharged from a
rehabilitation programme when they reach a certain level on a measure of
ability, for example the Barthel index, then the clinician who is rating the
patients must be able to demonstrate that he or she can score the Barthel
index to a high level of intrarater reliability.
The final aspect of reliability, internal consistency, evaluates how closely the
items that comprise a measure examine aspects of the same construct and
not other constructs. Obtaining several estimates of the same construct by
using a measure with a number of items ensures that the construct is
accurately measured. (Bergner and Rothman 1987) This is, of course, only
true when all items measure the same construct. Internal consistency
44

coefficients estimate the extent to which the items measure the same
construct.
Internal consistency can be examined in a number of ways, most commonly
by estimating Cronbach’s alpha for the items of the instrument. (Cronbach
1951) Cronbach’s method divides a measure into two halves and examines
the correlation between the responses to the items of both halves.
Correlations are then examined for all possible divisions of the measure and
an average of the correlations is found. The average correlation is reported
as the alpha value. The values of this statistic should exceed alpha = 0.70 for
measures that will be making comparisons between groups, for example,
when comparing results from two groups in a study comparing different
rehabilitation interventions. (Fitzpatrick etal. 1998) Higher internal
consistency could suggest item redundancy (all the items asking the same
question but phrased in different ways). However, for decision making in
individual cases, for instance, deciding to start antidepressant treatment for a
patient based on his or her responses to a measure of depression, the
internal consistency should ideally be greater than alpha = 0.95. Higher
internal consistency reduces the confidence interval around a score. Alpha
values can be increased with a greater number of items in the measure,
which decreases the confidence interval. (Riazi et al. 2002)
Internal consistency may also be estimated by the item-total correlation.
(Streiner and Norman 1995) The item-total correlation examines the
45

correlation between each item and the measure with the item removed.
Correlations between the item and the remaining items of the measure
should exceed r = 0.20.
Validity: Reliability is essential, but not sufficient, to establish the validity of
an outcome measure. Validity is an assessment of whether an instrument
actually measures what it purports to measure. (Bergner and Rothman 1987)
Validity, however, is not established for all potential uses of an instrument.
Rather, it can only be said to be valid for the purposes for which it had
originally been validated. For instance, the Rivermead mobility index is a
valid measure of mobility for patients with neurological illnesses, but it is not
valid for use in patients with musculoskeletal illnesses. (Ryall et al. 2003) As
with reliability, there are a number of methods used to establish the validity of
a measure. Traditionally, validity is tested under the headings of content,
construct and criterion validity. (McDowell and Jenkinson 1996) Whilst
appearing to be different properties of the measure, they all address the
degree of confidence that can be placed in the results obtained from using a
measure.
Content validity asks whether an instrument is appropriate to its use in a
particular setting and can be determined by users of the scale or by a group
expert in the subject matter of the scale. One such evaluation is the paper
from the Department of Neurology, Leiden University, which reports on the
content validity of four Parkinson’s disease scales. (Marinus et al. 2002) The
46

four scales vary in their coverage of aspects of Parkinson’s disease. For
instance, three of the four scales do not ask about transfers or dressing -
aspects of ADLs that are commonly affected in Parkinson’s disease.
Similarly, only two of the scales have items relating to sexual relationships.
However, the Parkinson’s impact scale (PIMS) has this item as an optional
question as it remains unanswered in 32% of questionnaires. This example
illustrates the interaction between acceptability and content validity.
Construct validity is a more quantitative measure of the validity of an
outcome measure. An outcome measure is meant to evaluate a construct
that is not directly observable such as ability or participation. This construct,
however, can be expected to be related to other variables or outcome
measures. Correlations can then be examined with the outcome measure
under investigation against those relating to the construct in an hypothesised
direction, magnitude and pattern. (McDowell an d Jenkinson 1996) Construct
validity postulates that the outcome measure w ill correlate more strongly with
variables that are intuitively related to it (convergent validity) or correlate
weakly with variables that are unrelated (discriminant validity). This is
determined by calculating Pearson correlations between the outcome
measures. There are a number of levels of correlation taken to demonstrate
convergence or discrimination. Most authors use levels of correlation of r >
0.70 for convergence and r < 0.30 for discrimination. (Hobart et al. 2001a;
Tunis et al. 1999)
47

Clinician rated scales can also be examined for construct validity. This
technique was used to review the properties of the Barthel index, the
Functional Independence Measure (FIM) and Functional Independence
Measure + Functional Assessment Measure (FIM+FAM). These measures
purport to measure physical and cognitive disability and very high Pearson’s
correlation (r= 0.96 to r= 0.99) and agreement (ICC = 0.95 to 0.99) were
found between them. (Hobart etal. 2001b)
Criterion validity is used when a measure is being compared to a well-
established, “gold-standard” measure - a criterion. This is form of validity is
usually employed when developing a new measure where there is a criterion
with which to compare it. However, in the development of outcome
measures, there is rarely a criterion for constructs such as ability or
participation, so criterion validity is not often reported. It assumes a role
when a short version of a longer, more established measure is being
developed. In this case, the longer measure is used as the criterion and
Pearson correlations are again used to examine the relationship between the
two measures. An example of this was the development of a 25-item version
of the World Health Organisation Quality of Life assessment (WHOQOL)
from a 100-item quality of life questionnaire. (World Health Organisation
1998a)
It is important that instruments continue to be validated by use in different
studies in different settings. Only by repeatedly using the instrument and
48

confirming its validity in a number of settings with different samples can an
instrument be said to be valid. It can be considered that a scale has not been
“validated” in the original publication, but the evidence for its validity
increases with each study in which it performs as expected. (Guyatt et al.
1993)
Responsiveness: Responsiveness is the ability of an instrument to detect
accurately change when change has occurred. (Beaton et al. 2001) It has
been termed responsiveness, sensitivity and sensitivity to change and
authors have given each name a slightly different definition. It has also been
argued that it forms part of the accumulation of evidence for the validity of a
scale rather than a separate element establishing the psychometrics of an
instrument. (Guyatt et al. 1989) However, as with all psychometric properties
of a measure, responsiveness interacts with, and impacts upon, other
properties. For instance, a measure with high test-retest reliability, that is,
very stable across time, may not be very responsive.
There are numerous methods of reporting responsiveness. (Fitzpatrick et al.
1998) These can be used to judge whether the instrument is effective at
detecting change, what the magnitude of that effectiveness is, under what
circumstances and in which sample. (Patrick and Chiang 2000) Liang defines
sensitivity to change as the ability to measure change regardless of its
relevance or meaningfulness to the patient or clinician, whereas he terms
responsiveness as the ability to measure a clinically meaningful change.
49
(Liang 2000) He recommends that all patient based outcome measures
should have responsiveness established as a form of longitudinal construct
validity. As with reliability and validity, responsiveness is a property of the
instrument when used in a particular sample and needs to be re-established
for each new use of the instrument.
The easiest method to examine responsiveness is to look at the change in
score between baseline and follow-up (mean change score). This may then
be examined by paired f-tests, assuming underlying normality. However, in
very large samples a statistically significant difference can be generated
without there being any clinically meaningful change in the patients. A
method of overcoming this is to calculate the effect size (mean change score
divided by the standard deviation of baseline score). This gives a magnitude
and direction to the change expressed in units of standard deviation of the
baseline score. (Kazis et al. 1989) In essence, the effect size statistic
describes change as a function of the random variation in baseline scores in
the sample. Thus, effect size is expressed in standardised units that
facilitates comparison of different measures.
Cohen’s criteria are used categorise effect size results as small if less than
0.20, moderate if approximately 0.50 and large if greater than 0.80. (Cohen
1988) These values were proposed empirically by Cohen to provide a
quantitative expression of the magnitude and meaning of change brought
about by an intervention. (Cohen 1992) Since publishing these criteria, they

have come into general use, firstly due to the inherent simplicity of
calculating effect sizes, and secondly due to validation of the criteria by
several studies. These studies have compared change, as measured by the
effect size calculated from patient based outcome measures, with a transition
question that rates change as perceived by the patient. The first study
demonstrated concordance between patient satisfaction with lumbar spinal
stenosis surgery, as measured by a transition question, and the
responsiveness of a disease specific outcome measure. (Stucki et al. 1995a)
The same group subsequently reported similar findings in a study of carpal
tunnel syndrome surgery. (Bessette et al. 1998) In the Bessette et al study,
patients’ opinion of their improvement (rated using a transition question)
correlated closely with effect sizes calculated from a disease specific
outcome measure. In a third study, of coronary revascularisation treatment,
good concordance was found between a transition question and the
magnitude of change as determined from a patient based outcome measure
asking about the impact of heart failure. (Middel et al. 2001) These studies
provide evidence that Cohen’s criteria, whilst initially developed empirically,
are closely related to change as directly reported by patients. It must be
noted that responsiveness is different to statistical significance. Whilst the
results of a study may be statistically significant, they may not be clinically
significant as determined by responsiveness statistics.
In summary, an outcome measure must meet minimum psychometric
standards to ensure rigorous measurement. Measures must be acceptable to
51

the patients to which they are administered, and must capture the full
spectrum of patients’ responses. A measure must demonstrate internal
consistency and reproducibility to predefined criteria, and it must measure
what it purports to measure when compared to other instruments. Finally,
when clinically significant change occurs, this should be detected by the
measure.
1.2.3 Role in Rehabilitation
It is relatively straightforward to measure an impairment-based construct; for
instance, the time taken by a patient to walk ten metres. Measuring how
walking impacts on participation in the community may not involve any direct
measure of walking at all, as limited ability to walk may impact on work or
social roles, and a measure of these constructs would be more efficient at
detecting any change brought about by rehabilitation.
Quantifying activity and participation has only come recently to neurological
rehabilitation in comparison to the overall development of the speciality. This
may be because clinicians feel that it is too complex to measure these
constructs, or that interactions between patients and their environment
confounds what should be measured in the individual patient. (Hobart 2002)
The earliest measures in neurological rehabilitation focused largely on
quantifying the impairments that a neurological illness produces, for example
Kurtzke’s Disability Status Scale in multiple sclerosis. (Kurtzke 1955) One
52

exception to this was the Barthel index, developed initially in 1955, to
describe activity limitations in patients transferring from neurological
rehabilitation units to nursing homes. (Mahoney and Barthel 1965) While
these two measures were both developed during the mid-1950s and are still
in common use, the Barthel index has superior measurement properties to
the Disability Status Scale. (Hobart et al. 2000)
Since the adoption by healthcare researchers of psychometric principles
there has been a substantial improvement in the quality of measurement in
neurological rehabilitation. (McDowell and Jenkinson 1996) It is now possible
to develop instruments that can accurately measure constructs such as
functional status and emotional well being. (Guyatt etal. 1993) There are
now well-established techniques to produce instruments that are based on
issues of importance to patients as well as fulfilling a set of criteria that
ensure sound measurement properties. (Lohr et al. 1996) An example of this
is the development of a measure of the impact of multiple sclerosis that takes
into account the patient’s perspective and uses psychometric methods to
produce an instrument with superior measurement properties than the
Disability Status Scale. (Hobart et al. 2001a) Further developments of these
techniques and the use of more sophisticated methods of scale design and
testing will enhance the ability of clinicians to measure the effect of
neurological rehabilitation.
53

Combining psychometric methods with the ICF have allowed new ways of
thinking about outcome measurement in neurological rehabilitation. (Tennant
2000) The combination of these frameworks has facilitated the development
of new instruments for measurement in neurological rehabilitation and the
classification of existing instruments according to what they purport to
measure.
As a rehabilitation programme is individually tailored to a patient’s needs, it
presents difficulties if one wishes to document the changes effected over the
course of the programme. It also makes comparing patients with the same
illness difficult, as there is no criterion against which to compare change.
Collecting data using outcome measures enables standardised information
to be gathered on patients during the rehabilitation process. This information
can be used to track changes in individual patients’ progress or within a
group of patients with the same diagnosis. As well as these benefits, using
standardised outcome measures allows comparison between patients at
different times in the same unit, which facilitates clinical audit.
1.3 Types of Outcome Measures
Once an outcome measure is selected for use in a study or clinical setting
that is appropriate, reliable, valid and responsive, one needs to consider the
constructs and population that one intends to study. This section considers
54

the main types of outcome measure that have been used in neurological
rehabilitation studies and discusses their relative merits.
1.3.1 Generic
Generic health related quality of life measures are widely used and aim to
capture information from a number of health related constructs such as
physical, psychological and social functioning, mobility, daily activities, and
pain. They can be used in both a general sample of patients and in patients
with a particular illness. Examples of generic measures are the Medical
Outcomes Trust Short Form 36-item questionnaire (SF-36) and the World
Health Organisation Quality of Life Questionnaire (WHOQOL). (Ware, Jr. and
Sherbourne 1992; World Health Organisation 1998b)
Generic measures are useful in the clinical setting when breadth of
measurement is essential. They may not show good responsiveness in
studies where a treatment is being investigated for the specific amelioration
of a particular ailment, but they may indicate if there are other areas that
need addressing due to side effects or other untoward problems with the
treatment.
55

1.3.2 Dimension Specific
These instruments attempt to measure an aspect of overall health status
such as psychological wellbeing. The Hospital Anxiety and Depression Scale
(HADS) is one such measure which taps these two dimensions of
psychological status. (Zigmond and Snaith 1983) Dimension specific scales
are used largely in psychological testing to capture data from a single
construct. They allow in-depth reporting of the construct that they purport to
measure e.g. anxiety or depression. This may affect their responsiveness, as
they cannot capture other aspects of a condition that a treatment might be
aiming to change.
1.3.3 Disease Specific
Disease specific measures aim to represent the spectrum of health related
concerns associated with a particular disease or condition e.g. the Multiple
Sclerosis Impact Scale 29-item (MSIS-29). (Hobart etal. 2001a) Being
specific to the disease, it will appear more appropriate to patients. This will
translate into a higher response rate when administered, as patients will see
it as more relevant to their problems.
However, it is always possible that if disease specific measures are used
exclusively, then one might miss an effect on constructs not measured by a
disease specific instrument and only by the wider scope of a generic
measure. This area has been explored by the European Consortium on
56

Cancer Outcomes. (Sprangers et al. 1993) It has developed a measure that
consists of a generic scale which covers the issues that might be common to
all cancers and cancer treatments (e.g. fatigue, pain, nausea and vomiting)
with disease-specific measures that are used with particular types of cancer.
This approach of combining different types of outcome measures can be
applied to any combination of existing measures to examine the patient’s
perception of their health in one or more constructs.
1.4 Administration of Outcome Measures
After selecting a scientifically sound outcome measure that captures the
construct or constructs of interest, it is necessary to administer it to patients.
This will depend on the nature of the construct of interest, the educational
level of the patients, the resources available and the design of the study.
Outcome measures can be administered by self-report questionnaire, face-
to-face or telephone interview, treatment diaries, computer-assisted
questionnaires and more recently by electronic mail and Internet based
methods. This section will explore some of these methods of administration,
how they can be used to greatest effect and their advantages and
disadvantages.
1.4.1 Postal Questionnaires
Mailed, self-report questionnaires are the mainstay of surveys. It is the
cheapest method, can be administered from one central office, and does not
57

rely on trained interviewers. For example the cost of administering the SF-36
by post is $27.07 per administration as compared to $47.86 by telephone.
(Zaslavsky et al. 2002)
There are a number of issues relating to the use of this method. First is the
non-response rate. This is possibly the most important point as it has long
been established that non-responders are systematically different from those
who do return questionnaires. (Brambilla and McKinlay 1987) For instance,
in North America, older people, people with disabilities, Hispanic or black
people and those with less education return questionnaires less frequently.
(Zaslavsky et al. 2002) This will bias the results, particularly by omitting those
people who may have different experiences of healthcare.
Good questionnaire design is the most important element in securing high
response rates. (Dillman etal. 1993) Dillman has long been the proponent of
proper questionnaire design to obtain the best response - “The Total Design
Method”. (Dillman 1978) Using the same style across pre- and post-mailing
reminders and a “motivational” insert produces the best response rate. Other
factors that increase response rates include personalising the posted items
by using a covering note or an advance notification. (Eaden etal. 1999)
With postal questionnaires there is also the risk of item non-response even in
those questionnaires returned. This reduces the usefulness of the
58

information. To improve the completion rate one must carefully design the
questionnaire to ensure ease of completion. One study looking at the SF-12
in older people found that, by redesigning the stem and leaf configuration,
the item response rate was significantly higher, with the added benefit of a
reduction in the error rate in optical scanning due to patients selecting two
responses for the same item. (Iglesias etal. 2001)
1.4.2 Telephone Interviewing
While telephone interviewing is more expensive than postal questionnaires, it
still costs less than face-to-face interviewing and can be performed from a
central office. However, it does require a trained interviewer, which increases
expense. This improves the item response rate and allows the interviewer to
explain items that the respondent may find difficult. (Nybo Andersen and
Olsen 2002) Item response has also been shown to be higher to telephone
interview, possibly by including people who are illiterate or who have visual
impairment. (Harris et al. 1997)
The main disadvantage of telephone interviewing is not being able to contact
people to have an adequate sample of the population under review. The
most obvious set of respondents who will be left out are those who do not
use the telephone because they are deaf. (Barnett and Franks 1999)
However a potentially larger source of bias is the exclusion of people without
telephones for social reasons. It has been demonstrated that people in this
59

group are more likely to be smokers, take less exercise, participate less in
health screening, have greater disability and are less likely to have health
insurance. (Corey and Freeman 1990; Ford 1998; Marcus and Telesky 1983)
Of course, like postal questionnaires, it is possible that there are difficulties
reaching some people. Only conducting interviews during office hours, for
example, will exclude those working outside the home during the day.
Techniques to improve response rate include arranging a time for the
interview to be conducted and leaving a message on an answering machine
if the respondent does not answer. (Harlow et al. 1993; Smith et al. 1995)
1.4.3 Face-to-Face Interviewing
Face-to-face interviewing is the most labour intensive and expensive method
of obtaining patients’ opinions. However, it has the advantage of being the
most personal and of providing the greatest assistance to the person being
interviewed should they have difficulties understanding the questions. The
interviewer can also travel to the person being interviewed which further
reduces the inconvenience to the patient, as well as allowing the interviewer
to be certain of the identity of the patient. (Frerichs and Shaheen 2001)
The nature of the face-to-face interview may affect what respondents report
to interviewers. More impersonal methods like a questionnaire or telephone
60
interview produce higher rates of reporting behaviourally sensitive issues
such as alcohol consumption, drug use and use of seat restraints for
children. (Corkrey and Parkinson 2002; Pless and Miller 1979) Similarly,
patients with stroke report less disability when questioned by telephone than
face-to-face, which needs to be borne in mind when designing studies.
(Korner-Bitensky et al. 1994)
Hybrid techniques have been developed that combine two or more of the
methods outlined above. They have increased levels of cost and complexity,
but can improve response rates markedly. One combination, used
commonly, is the “drop-off”. This is where initial demographic data is
obtained from respondents and a questionnaire is then left with them to be
either collected or posted back to a central location. (Salant and Dillman
1994)
1.5 Study Objectives
Neurological rehabilitation has developed into an evidence-based discipline
that provides a patient-centred, tailored, treatment based on the framework
of the IGF. For neurological rehabilitation to be effective, it should improve
the patient’s functioning in terms of their activities and participation. Change
in function is recorded by the use of outcome measures. Appropriate
outcome measures and methods of administration can be used to facilitate
measuring the effect of the neurological rehabilitation process. A combination
of generic and dimension specific outcome measures will provide the widest
61

coverage of the patient’s experience of their health and wellbeing following
neurological illness.
The first objective of this study was to comprehensively evaluate the
responsiveness of the outcome measures used in the NRU by examining
their ability to detect change at an item level in patients with neurological
illnesses undergoing rehabilitation. This first component of the study
compared the performance of the clinician rated, generic outcome measures,
the Barthel index and the FIM. It then examined their relative properties in
three different neurological illnesses; multiple sclerosis, stroke and spinal
cord impairment.
The second objective of this study was to prospectively examine the changes
effected by neurological rehabilitation on patients’ physical function and
psychological wellbeing using clinician rated and patient based outcome
measures. This study used the Barthel index and FIM as well as the self-
report Barthel index, the General Health Questionnaire (GHQ) and the
HADS. These measures were administered to patients in the NRU on
admission and discharge. This was followed by a postal questionnaire sent
to patients three months after discharge. This component of the study
included an examination of the psychometric properties of the measures.
The third objective of this study was to identify the health related, personal
and environmental factors that impact on work retention in people with MS.
62

For the last hundred years, return to work has been a key element in
neurological rehabilitation. However, the needs of people with chronic
neurological illnesses who are trying to remain in employment can be
neglected. This study used the self-report Barthel index, the GHQ and a
newly developed questionnaire about the impact of MS on ability to work, to
evaluate the physical, psychological and vocational status of a cross-section
of people with MS.
63

Chapter 2 Responsiveness of the Barthel and FIM

2. Responsiveness of the Barthel index and Functional Independence
Measure (FIM)
2.1 Introduction
As discussed in the opening Chapter of this Thesis, the measurement of
treatment outcomes is an integral part of neurological rehabilitation, (Hobart
et al. 2001b) and promotes the clinical effectiveness of rehabilitation
programmes. (Intercollegiate Working Party for Stroke 1999) Outcome
measurement is an integral part of the patient’s journey through the
rehabilitation process in the NRU. Outcome measures are recorded on
admission and discharge for all patients, and for the last 10 years have been
entered into a database. This database has facilitated a retrospective
evaluation of the psychometric properties of two widely used, clinician rated,
generic outcome measures, the Barthel index and FIM. The evaluation of
these measures is described in this Chapter.
For the information from outcome measures to be meaningful, the measures
must be clinically relevant. That is, they must include items pertinent to
neurological rehabilitation interventions, such as mobility, activities of daily
living, and communication. But outcome measures must also be
psychometrically sound. (McDowell and Jenkinson 1996; Aaronson et al.
2002) All outcome measures are required to be acceptable, reliable and
valid, and to be able to be used in an evaluative study, it is essential that
they demonstrate responsiveness. (Guyatt et al. 1987; Stucki et al. 1995a)
As discussed in Chapter 1, these psychometric properties combine to
65

produce a rigorous measure. Thus, the prerequisites for a responsive
measure are that it is also acceptable, reliable and valid.
For outcome measures with multiple items, responsiveness is usually
reported for the total score. The responsiveness statistic is, therefore, a
synthesis of the responsiveness of the individual items. Whilst it is a
convenient index, total score responsiveness can conceal potential item level
problems that could limit the responsiveness of a measure. One of the main
limitations to responsiveness results from item floor or ceiling effects.
(Fitzpatrick et al. 1998)
The aim of this study was to determine whether item score changes are
accurately represented by total score changes, and the impact that item floor
and ceiling effects have on overall scale responsiveness, in the Barthel index
and the FIM.
2.2 Methods
This section outlines the methods used in this study. The first part presents
the sample from which the data were collected. This is followed by an
appraisal of the outcome measures (Barthel index and FIM) used in the
study. The discussion of each measure is supplemented by a summary of
their relevant measurement properties. Lastly, the analyses that were
performed on the data are described.
66

2.2.1 Sample
Data were collected from patients admitted to the NRU, from May 1993 to
March 2003. All patients with complete admission and discharge data and a
length of stay greater than 10 days were included. A length of stay greater
than 10 days was chosen as this is the minimum planned admission for a
patient, and less than this a change would not be expected in a patient’s
functional ability.
The Barthel index and FIM were scored by consensus of the multidisciplinary
team based on the patients’ abilities during the admission and discharge
weeks. The outcome measures were scored according to the instructions of
the developers. (Wade and Collin 1988; Uniform Data System 1993)
2.2.2 Barthel index
The Barthel index is a clinician rated generic outcome measure that
measures the ability of patients with neurological or musculoskeletal
illnesses to care for themselves. (Mahoney and Barthel 1965) The Barthel
index measures ten personal activities of daily living (ADLs). Two items are
dichotomous, six items have three-point scales and two items have four-point
scales (Table 2.1). The items are summated and the total score ranges from
0 to 20. Higher values indicate better functioning. (Wade and Collin 1988)
67

The psychometric properties of the Barthel index are summarised in the
following section.
Acceptability: It is frequently mentioned in textbooks of neurological
rehabilitation that the Barthel index is limited by poor acceptability, in terms
of its floor and ceiling effects. (Wade 1992) But when used in inpatient
neurological rehabilitation, this limitation reduces in importance. In this
setting, mean admission scores are close to the mid-point of the range of the
Barthel index, and floor and ceiling effects are minimal, (van der Putten et al.
1999) However, when used in a community setting, its acceptability is
hampered by significant floor and ceiling effects. (Kelly and Jessop 1996) In
Kelly’s study of 30 patients attending an occupational rehabilitation
programme, seven of the 10 items had ceiling effects greater than 75%.
68

Table 2.1 Items of the Barthel index and FIM
Barthel index FIMItem Order of Response Order of Response
items* options items options
Motor Items Self-care
Feeding 5 3 1 7Grooming 3 2 2 7Bathing 10 2 3 7Dressing upper body 8 3 4 7Dressing lower body 5 7Toileting 4 3 6 7
Sphincter controlBladder management 2 3 7 7Bowel management 1 3 8 7
TransfersBed/chair transfer 6 4 9 7Toilet transfer 10 7Bath transfer 11 7
Mobility
Walking/wheelchair use 7 4 12 7Stairs 9 3 13 7
Cognitive Items Communication
Comprehension 14 7Expression 15 7
Social cognitionSocial interaction 16 7Problemsolving 17 7Memory 18 7
*Order as they appear in the Barthel index
69

Reliability: The reliability of the Barthel index has been examined in several
studies. It demonstrates good internal consistency (Hobart et al. 2001b) and
test-retest reliability when used to rate patients with restricted ability due to
neurological conditions in a rehabilitation setting. (Green etal. 2001) High
inter-rater reliability has been demonstrated between members of the
rehabilitation multidisciplinary team when rating patients’ ability following
stroke and traumatic brain injury. (Collin et al. 1988; D'Olhaberriague et al.
1996; Roy etal. 1988)
Validity: The Barthel index demonstrates convergent validity with other
measures of physical function when assessing stroke patients. (Schuling et
al. 1993; Anderson et al. 1996; Post et al. 2002) Post’s study also reports
discriminant validity of the Barthel index against measures of psychological
function.
Responsiveness: Responsiveness of the Barthel index has only been
reported in MS and stroke. For patients with MS in neurological rehabilitation
the Barthel index has low to moderate responsiveness (effect size 0.37),
(van der Putten et al. 1999) but good responsiveness (effect size 0.95 to 1.2)
for patients with stroke. (Hsueh et al. 2002; van Bennekom et al. 1996)
In summary, the Barthel index is an acceptable, reliable and valid measure
for patients who have neurological disability impacting on their personal
70

activities of daily living. It is moderately responsive in a rehabilitation setting.
Item-level acceptability and responsiveness have not been reported.
2.2.3 FIM
The FIM, like the Barthel index, is a clinician rated generic outcome measure
designed to collect information about patients in rehabilitation. It was
developed because of the perceived limited responsiveness of the Barthel
index. (Granger etal. 1986) The FIM comprises 18 items grouped into two
domains - motor (13 items) and cognitive (five items) (Table 2.1). Each item
is scored on a seven-point scale; one represents complete dependence and
seven represents full independence. A subtotal is generated for each domain
and together the two domains give the total score. The motor scale is scored
from 13 to 91 and the cognitive scale from five to 35. For each item and
scale, higher values indicate better functioning. The literature regarding the
psychometric properties of the FIM is examined in this section.
Acceptability: Floor and ceiling effects for the FIM motor and cognitive
scales are less than 20% in patients with MS and stroke in neurological
rehabilitation. (Brock et al. 2002; van der Putten et al. 1999) But in a study of
patients with traumatic spinal cord injury admitted for rehabilitation, the motor
scale had a floor effect of 61%, with a ceiling effect for the cognitive scale of
93%. (Hall etal. 1999)
71

Reliability: Internal consistency (Dodds etal. 1993) and intrarater and
interrater reliability (Ottenbacher et al. 1996) were examined in two meta
analyses of studies of patients with restricted ability due to neurological
conditions in rehabilitation settings. Internal consistency was high, with
Cronbach’s alpha of 0.93. Intrarater and interrater reliability, as measured by
intraclass correlation coefficients were both found to be 0.95, when scored
by members of the multidisciplinary team.
Validity: The FIM is reported to have the greatest content validity o f six
measures purporting to measure disability. (Kelly and Jessop 1996)
Convergent construct validity of the FIM is supported by strong correlations
with other measures of physical function. (Sharrack etal. 1999) Discriminant
validity has been demonstrated against measures of psychological function.
(Freeman et al. 2000)
Responsiveness: The FIM motor scale has good responsiveness (effect
size 0.91) in patients with stroke in rehabilitation, (van der Putten etal. 1999)
However, a lower effect size (0.34) was seen in patients with MS. The FIM
cognitive scale is moderately responsive in patients with stroke (0.61), but
has negligible responsiveness in patients with MS. (Hobart etal. 2001b)
Low responsiveness of the cognitive scale can reduce the total score
responsiveness. This is particularly true when improvements in the motor
score influence the total score in patients with unchanged cognitive scores,
72

for example, in patients with spinal cord injury. (Grimby et al. 1996) It has
also been demonstrated that total scale responsiveness can mask low item
level responsiveness. (Sharrack et al. 1999) This limitation can be overcome
by reporting the responsiveness indices for the motor and cognitive scales
separately.
The FIM, like the Barthel index, is a reliable and valid measure of a patient’s
ability. It is appropriate for use in patients with stroke, MS and spinal cord
injuries who are receiving rehabilitation. The motor scale appears to be very
responsive but ceiling effects appear to hamper the cognitive scale.
Responsiveness and acceptability have been demonstrated at scale level in
patients in neurological rehabilitation. However, item responsiveness and
item floor and ceiling effects have not been examined in this population, so
the impact of these factors on the overall responsiveness of the measures
has not been fully explored.
2.2.4 Analyses
Effect sizes were calculated for the total and item scores, for the group as a
whole and for the diagnostic subgroups of MS, stroke and spinal cord
impairment (SCI). (Kazis et al. 1989) These three groups make up the
majority of patients treated in the NRU. Cohen’s criteria were used to
categorise the effect size results as small if less than 0.20, moderate if
approximately 0.50 and large if greater than 0.80. (Cohen 1992)
73

Distributions of the total and scale scores, and each item’s response option
frequencies were investigated using item endorsement frequencies. These
are the percentages of patients endorsing each response option. It was
expected that for each scale and item, the floor effect and ceiling effect
effects should each be less than 20%. (McHorney et al. 1994)
2.3 Results
2.3.1 Sample
Out of 1495 patients admitted during the time period studied, 1390 patients
(93%) had admissions of 10 days or longer and had complete admission and
discharge data available (Table 2.2). Seventy-five percent of the total group
comprised patients with MS (38%), stroke (20%) and SCI (17%). The mean
age of patients was 48 years with a wide range of ages represented. Overall
there were more females than males, which was largely due to the female
preponderance in the MS group. The mean length of stay for the total group
was 35 days. Patients with MS had shorter admissions than patients in the
other groups. This is mainly because patients with MS are admitted from
home for a defined rehabilitation programme, whereas patients with acute
onset disability are admitted from other wards within the NHNN or other
hospitals and require more extensive input before being discharged home.
74

Table 2.2 Sample demographics
Total group MS Stroke SCI
Total number of patients
Patients’ data available1495 622 291 250
1390 569 282 236
Mean age (years) Standard deviation Range
48
15
4412
5315
52
16
1 6 -88 16 -75 1 6 -87 16-85
Sex (male/female) percent (male/female)
644/746 186/383 167/115 133/10346/54 33/67 59/41 56/44
Mean length of stay (days)
Standard deviation Range
3524
2310
51
30
4327
10-184 10-102 10-149 10-184
2.3.2 Barthel Index
Total group: Admission and discharge Barthel index scores for the total
group and the three disease groups, MS, stroke and SCI, are presented in
Table 2.3. Effect sizes and floor and ceiling effects on admission and
discharge are outlined for the Barthel index for the group as a whole (Table
2.4).
75

Table 2.3 Barthel index and FIM scores
Total group MS Stroke SCI
Admission Barthel index
Mean (SD) 11.8(5.3) 12.2(5.4) 11.7(5.0) 11.2(5.3)Range 0 - 2 0 0 - 2 0 0 - 2 0 0 - 2 0
Discharge Barthel index Mean (SD) 15.9(4.8) 14.8(5.4) 17.2(4.0) 16.3(4.2)Range 0 - 2 0 0 - 2 0 2 - 2 0 3 - 2 0
Admission FIM Motor
Mean (SD) 58.2(6.2) 59.7(19.4) 57.6(18.4) 56.6(19.6)Range 13-91 13 -90 13-91 13 -88
Admission FIM Cognitive Mean (SD) 29.7 (6.2) 30.3 (5.2) 25.9 (7.5) 32.9 (4.2)Range 5 - 3 5 10 -35 5 - 3 5 13 -35
Discharge FIM Motor
Mean (SD) 72.7(17.5) 68.3(19.0) 77.2(14.7) 74.4(15.3)Range 13-91 13-91 13-91 21-91
Discharge FIM Cognitive Mean (SD) 31.0(5.2) 31.0(4.8) 29.1 (5.8) 33.3(3.4)Range 5 - 3 5 5 - 3 5 6 - 3 5 14 -35
Effect size for the Barthel index for the total group was 0.77. Total score floor
and ceiling effects on admission were within the criterion value (1.2% and
5.4%). On discharge, the floor effect was small (0.1%) but the ceiling effect
exceeded the recommended value (27.8%).
76

Table 2.4 Total group Barthel responsiveness and floor/ceiling effects
Effect size Floor/ceiling effectAdmission Discharge
Bowels 0.20 9.4/80.6 5.1/88.8Bladder 0.33 20.4/60.6 10.3/76.8Grooming 0.44 31.0/69.0 10.6/89.4Toileting 0.51 22.0/46.5 10.4/74.9Feeding 0.55 8.8/48.7 4.2/79.3Transfer 0.59 8.5/39.5 3.4/72.9Mobility 0.68 21.9/28.1 4.1/59.7Dressing 0.64 22.6/34.6 7.6/67.6Stairs 0.78 63.0/14.5 32.4/41.3Bathing 0.80 78.0/22.0 45.1/54.8Total 0.77 1.2/5.4 0.1/27.8
Item effect sizes ranged from 0.20 (bowels) to 0.80 (bathing). Admission item
floor effects ranged from 8.5% (transfer) to 78.0% (bathing) with ceiling
effects from 14.5% (stairs) to 80.6% (bowels). Discharge item floor effects
were 3.4% (transfer) to 45.1% (bathing) and ceiling effects from 41.3%
(stairs) to 89.4% (grooming).
Diagnostic groups: Effect sizes for the total scores (Tables 2.5a-c) were
0.47 (MS), 1.09 (stroke) and 0.98 (SCI). Item effect sizes for MS ranged from
0.13 (bowels) to 0.49 (bathing), for stroke from 0.18 (bowels) to 1.13 (stairs),
and for SCI from 0.38 (feeding) to 1.16 (bathing).
77

Table 2.5a Barthel responsiveness and floor/ceiling effects for MS
Effect size Floor/ceiling effectAdmission Discharge
Bowels 0.13 9.4/80.5 6.9/85.9Bladder 0.30 23.3/49.7 16.4/67.4Grooming 0.28 24.7/75.3 12.4/87.6Toileting 0.26 21.6/54.9 14.9/69.5Feeding 0.43 8.6/54.2 5.5/79.4
Transfer 0.38 10.2/43.0 6.5/64.9Mobility 0.41 14.9/31.4 5.0/49.8Dressing 0.38 19.3/41.8 10.2/61.4Stairs 0.39 62.9/16.9 46.3/30.4Bathing 0.49 73.5/26.5 51.8/48.2Total 0.47 1.0/5.7 0.2/19.3
Table 2.5b Barthel responsiveness and floor/ceiling effects for stroke
Effect size Floor/ceiling effectAdmission Discharge
Bowels 0.18 5.3/90.4 1.8/95.4Bladder 0.30 9.2/78.7 2.8/91.5Grooming 0.70 44.7/55.3 9.6/90.4Toileting 0.74 17.4/40.1 5.7/82.3Feeding 1.11 6.7/19.9 2.8/71.6Transfer 0.84 3.5/35.8 0.7/79.8Mobility 0.88 33.0/29.1 3.9/71.3Dressing 0.95 22.7/24.5 5.3/72.3Stairs 1.13 56.4/15.6 14.2/57.8Bathing 1.08 82.3/17.7 40.8/59.2Total 1.09 0.7/5.3 0.0/40.1
78

Table 2.5c Barthel responsiveness and floor/ceiling effects for SCI
Effect size Floor/ceiling effectAdmission Discharge
Bowels 0.40 17.7/64.6 7.6/85.7Bladder 0.52 35.0/48.1 10.1/70.5Grooming 0.42 23.6/76.4 5.9/94.1Toileting 0.72 27.4/38.4 8.4/77.2Feeding 0.38 5.9/71.3 1.7/89.5Transfer 0.70 12.2/39.2 1.7/79.7Mobility 0.89 18.6/23.2 1.3/61.6Dressing 0.84 27.0/29.5 5.1/70.9Stairs 1.08 73.4/9.7 31.2/38.4Bathing 1.16 81.4/18.6 36.7/62.9
Total 0.98 2.515.5 0.0/24.1
Effect sizes for the total group and the diagnostic subgroups are compared in
Figure 2.1. Again, overall, there was a similar pattern between items with
effect sizes for items in the MS group being smaller than for the other two
subgroups. One exception to the pattern was the feeding item, which was
substantially higher (1.11) in the stroke group than for MS (0.43) and SCI
(0.38).
79

Figure 2.1 Barthel index item responsiveness
1.40
1.20
1.00
0.80
0.60
0.40
0.20
0.00<u-O
O)c D) O) gCD CJ)
Ll_
Total Group
MS
Stroke
SCI
80

2.3.3 FIM
Total group: Admission and discharge scores for the motor and cognitive
scales of the FIM are presented in Table 2.3. Effect sizes and floor and
ceiling effects are outlined in Table 2.6 for the total group.
The effect sizes for the motor, cognitive and total scales were 0.74, 0.22 and
0.70 respectively. Floor and ceiling effects on admission and discharge for
the motor and cognitive subscales and total scale were all less than 1.7%,
except for the ceiling effect of the cognitive scale (28.5%, admission; 33.5%,
discharge).
Item effect sizes ranged from 0.15 (problem solving) to 0.82 (walk/wheelchair
use). For the items of both scales, there was a wide range in ceiling and floor
effects at both time points. On admission the floor effect ranged from 1.0%
(social interaction) to 60.1% (stairs) with ceiling effects from 1.1% (stairs) to
66.1% (social interaction). Discharge floor and ceiling effects ranged from
0.7% (memory) to 31.3% (stairs), and from 5.4% (stairs) to 76.4% (social
interaction) respectively.
Diagnostic groups: Effect sizes for the three groups (Tables 2.7a-c) for the
total scale were 0.42 (MS), 0.99 (stroke) and 0.86 (SCI). Item effect sizes for
MS ranged from 0.09 (comprehension and problem solving) to 0.58
(walk/wheelchair use), for stroke from 0.26 (bowels) to 1.05 (stairs), and for
SCI from 0.04 (problem solving) to 1.03 (dressing lower body).
81

Table 2.6 Total group FIM responsiveness and floor/ceiling effects
Effect size Floor/ceiling effectsAdmission Discharge
Feeding 0.42 6.3/36.5 2.1/54.8Grooming 0.43 4.8/41.2 2.4/64.2Bathing 0.60 9.2/14.6 3.7/38.1Dressing upper body 0.49 6.8/30.3 2.9/53.5Dressing lower body 0.67 21.5/8.0 10.8/28.7Toileting 0.52 16.8/21.4 8.8/46.7Bladder 0.31 12.7/35.3 6.2/45.2Bowels 0.24 7.0/37.0 4.4/51.2Bed transfer 0.67 11.9/13.7 4.7/44.7Toilet transfer 0.63 12.3/9.5 5.6/33.3Bath transfer 0.72 21.8/2.6 8.0/10.4Walk/wheelchair use 0.82 30.9/3.8 5.2/16.6Stairs 0.76 60.1/1.1 31.3/5.4Total motor 0.74 0.9/0.4 0.3/1.7Comprehension 0.17 0.6/67.4 0.2/73.6Expression 0.21 2.9/61.5 0.6/70.4Social interaction 0.20 1.0/66.1 0.5/76.4Problem solving 0.15 4.0/37.3 1.9/40.3Memory 0.17 2.0/59.0 0.7/65.9Total cognitive 0.22 0.2/28.5 0.1/33.5Total 0.70 0.010.0 0.0/0.6
82

Table 2.7a FIM responsiveness and floor/ceiling effect for MS
Effect size Floor/ceiling effectAdmission Discharge
Feeding 0.32 6.3/39.7 2.8/53.8Grooming 0.25 4.0/46.4 3.5/62.2Bathing 0.31 8.4/17.0 6.0/31.2Dressing upper body 0.26 6.2/33.2 4.7/48.3Dressing lower body 0.34 22.3/8.4 15.9/19.8Toileting 0.24 15.8/21.6 13.0/35.0Bladder 0.27 15.1/19.9 9.6/23.3Bowels 0.14 7.7/34.1 6.3/41.1Bed transfer 0.42 15.1/11.1 9.3/29.6Toilet transfer 0.38 15.8/6.3 10.0/19.6Bath transfer 0.45 22.3/1.4 12.3/5.1Walk/wheelchair use 0.58 22.3/1.8 5.6/6.1Stairs 0.40 59.4/0.2 44.4/1.9Total motor 0.44 0.5/0.0 0.4/0.2Comprehension 0.09 0.0/71.9 0.2/75.5Expression 0.12 0.0/69.4 0.2/75.3Social interaction 0.15 0.4/69.6 0.4/78.5Problem solving 0.09 3.2/31.6 1.8/33.1Memory 0.10 1.6/52.5 1.1/56.9Total cognitive 0.14 0.0/22.7 0.2/27.0Total 0.42 0.0/0.0 0.0/0.2
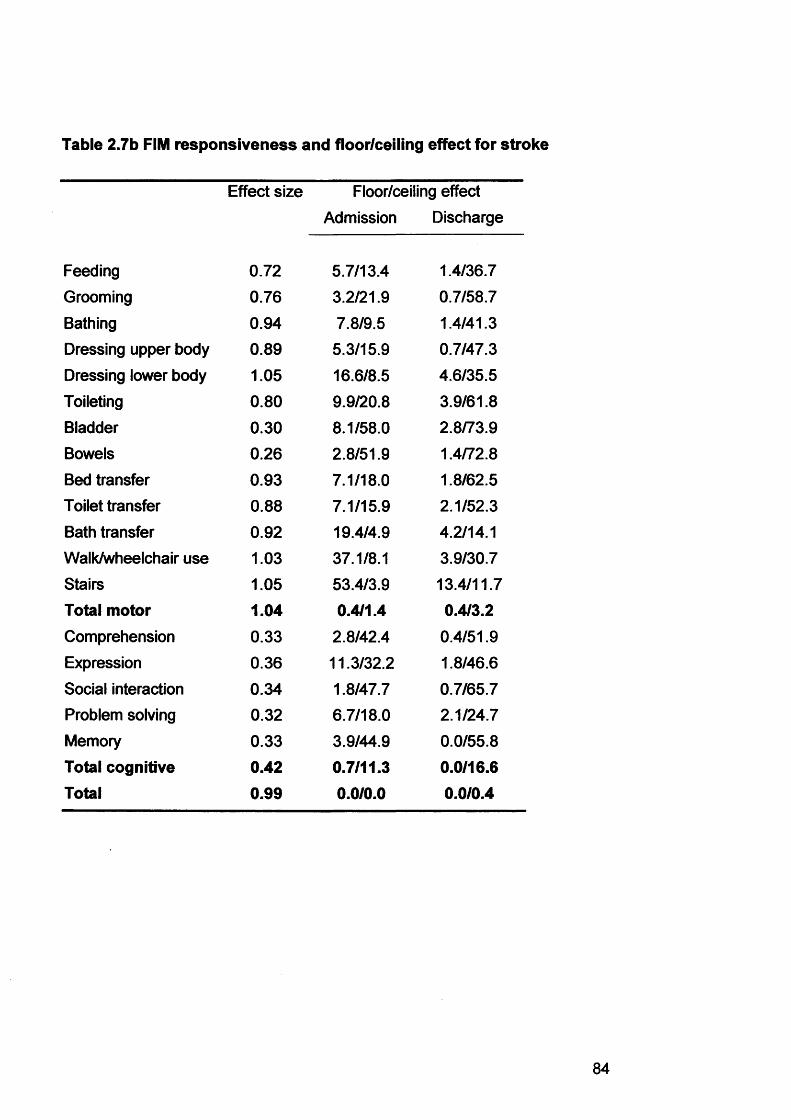
Table 2.7b FIM responsiveness and floor/ceiling effect for stroke
Effect size Floor/ceiling effectAdmission Discharge
Feeding 0.72 5.7/13.4 1.4/36.7
Grooming 0.76 3.2/21.9 0.7/58.7Bathing 0.94 7.8/9.5 1.4/41.3Dressing upper body 0.89 5.3/15.9 0.7/47.3Dressing lower body 1.05 16.6/8.5 4.6/35.5Toileting 0.80 9.9/20.8 3.9/61.8Bladder 0.30 8.1/58.0 2.8/73.9Bowels 0.26 2.8/51.9 1.4/72.8Bed transfer 0.93 7.1/18.0 1.8/62.5Toilet transfer 0.88 7.1/15.9 2.1/52.3Bath transfer 0.92 19.4/4.9 4.2/14.1Walk/wheelchair use 1.03 37.1/8.1 3.9/30.7Stairs 1.05 53.4/3.9 13.4/11.7Total motor 1.04 0.4/1.4 0.4/3.2Comprehension 0.33 2.8/42.4 0.4/51.9Expression 0.36 11.3/32.2 1.8/46.6Social interaction 0.34 1.8/47.7 0.7/65.7Problem solving 0.32 6.7/18.0 2.1/24.7Memory 0.33 3.9/44.9 0.0/55.8Total cognitive 0.42 0.7/11.3 0.0/16.6Total 0.99 0.0/0.0 0.0/0.4

Table 2.7c FIM responsiveness and floor/ceiling effect for SCI
Effect size Floor/ceiling effectAdmission Discharge
Feeding 0.34 4.2/61.0 0.0/73.7Grooming 0.41 5.5/58.1 1.7/74.2Bathing 0.77 10.2/13.1 2.1/43.2Dressing upper body 0.49 11.0/42.4 2.5/64.4Dressing lower body 0.92 23.3/5.1 8.1/31.8Toileting 0.67 22.5/20.3 6.8/46.2Bladder 0.46 16.5/22.0 4.2/34.7Bowels 0.44 13.6/17.4 5.5/37.3Bed transfer 0.80 13.1/14.0 1.3/51.3Toilet transfer 0.75 13.6/7.6 3.0/34.3Bath transfer 0.86 24.2/1.7 6.4/8.9Walk/wheelchair use 0.94 40.3/3.0 5.9/13.6Stairs 1.11 71.6/0.8 29.2/3.8Total motor 0.90 1.7/0.0 0.0/0.4Comprehension 0.13 0.0/84.7 0.0/90.3Expression 0.11 0.4/87.7 0.0/89.8Social interaction 0.07 0.4/83.5 0.0/87.7Problem solving 0.04 1.7/66.4 0.8/66.9Memory 0.14 0.9/85.1 0.0/90.7Total cognitive 0.11 0.0/60.9 0.0/62.3Total 0.86 0.0/0.0 0.0/0.4

Effect sizes for the FIM for the total group and the diagnostic subgroups are
compared in Figure 2.2. As with the Barthel index there was a similar pattern
between items, with effect sizes for items in the MS group being smaller than
for the other two subgroups. Again the noticeable exception in the motor
scale was the feeding item which was higher (0.72) in the stroke group than
for MS (0.32) and SCI (0.34). The effect sizes of the cognitive items for the
MS and SCI groups were all small (less than 0.15) whereas the stroke group
had values in the range 0.32 to 0.36.
Figure 2.2 FIM item responsiveness
1.20
1.00
0.80
0.60
0.40
0.20
0.00o> f ? >> <D-o £V) £ cn O
EI o5o>>
£355oo
c.5co ,o-C
Total Group
MS
Stroke
SCI
86

2.4 Discussion
2.4.1 Summary of Results
The results of this study indicate that, in neurological rehabilitation, the
responsiveness of the Barthel index, as measured by the effect size statistic,
is moderate to large. Total score floor and ceiling effects are small.
Responsiveness varies between groups, with the stroke group having the
largest value, demonstrating that responsiveness is a sample dependent
property. These results indicate that the Barthel index should have the ability
to detect clinically important change in patients in rehabilitation, according to
Cohen’s criteria.
The total score effect sizes for the Barthel index and the FIM motor and FIM
total scores are comparable in magnitude. As seen with the Barthel index,
responsiveness is greater in the stroke and SCI groups as compared to the
MS group. The responsiveness of the FIM cognitive scale is low in the total
group and in the MS and SCI groups. Only in the stroke group does the
cognitive scale tend towards moderate responsiveness. Floor and ceiling
effects of the FIM are minimal, apart from the ceiling effect of the cognitive
scale. These results indicate that the FIM motor scale, like the Barthel index,
should have good potential to measure change, but that the FIM cognitive
scale would have poor potential in this regard.

The results of this study are comparable to findings reported by previous
authors, including work from this department, (van der Putten et al. 1999;
Hsueh et al. 2002) Effect sizes for the Barthel index and FIM in this study
were of the same magnitude as those reported by other authors. (Hobart et
al. 2001b) Patients in these three studies by other authors had similar
demographics and lengths of stay to the patients reported in this study.
Analysis of the items suggests that the scales may not be as responsive as
implied by the total score. The effect sizes of the items in both scales varied
widely, indicating that some items detected more change than others. Effect
sizes of the FIM cognitive scale were uniformly low, apart from the stroke
group where they were low to moderate. FIM item responsiveness has
previously been reported for patients with MS attending an MS outpatient
clinic. (Sharrack etal. 1999) In Sharrack’s study, however, responsiveness
was calculated only for 25 out of the 50 patients in the study who were
judged to have changed since their previous visit. Item responsiveness in
Sharrack’s study was similar to that found in this study.
This variation in item responsiveness can be explained, in part, by examining
the items’ response option frequencies. Items with ceiling effects on
admission imply that the patient cannot improve any further in that construct
irrespective of any clinical improvement. Discharge item ceiling effects, which
for all items in both scales were even higher than on admission, signify that
patients may have improved more than the items measured. For example, in
88

the item analysis of the Barthel index, the bowel item was the least
responsive (0.20) and had the highest admission and discharge ceiling
effects, 80.6% and 88.8% respectively. In contrast, the bathing item had
good responsiveness (0.80) and relatively smaller ceiling effects, 22.0% and
54.8% respectively, although these are still above recommended criteria.
This is the first study to evaluate item responsiveness and acceptability in
patients undergoing inpatient neurological rehabilitation. The study
demonstrates that total score analysis can be a limited indicator of the
potential of an outcome measure to detect clinical change. The examination
of item level responsiveness has revealed items within the measure that
have poor responsiveness, which do not contribute to the measures’ overall
responsiveness.
2.4.2 Study Strengths and Limitations
This study included all patients admitted to a neurological rehabilitation unit
over a 10-year period who had completed at least 10 days of inpatient
rehabilitation and for whom admission and discharge results were available.
A high percentage (93%) of patients satisfied these criteria. The study
sample comprised a range of patients with acute and chronic neurological
illnesses. There was a wide age range, and male and female patients were
represented in proportions appropriate to disease group. These results
support the generalisability of the findings of this study.

The generalisability of these results is, however, limited by the extent to
which the patients and the rehabilitation interventions delivered in the NRU
are comparable to other rehabilitation centres. The patients in this study
have similar levels of physical ability to those in other studies. (Nyein et al.
1999; Post et al. 2002; Tow and Kong 1998) Other studies have included
patients with less physical ability (Hsueh et al. 2002; Paolucci et al. 2000;
Scivoletto et al. 2003) and greater physical ability. (Craig et al. 2003;
McPherson and Pentland 1997; Salbach et al. 2001) None of these studies
reports effect sizes for the Barthel index or FIM, so it is not possible to
directly compare results. Only one, a study of patients with SCI admitted for
rehabilitation, reports the Barthel index mean change score and standard
deviation. (Scivoletto et al. 2003) The effect size for the Barthel index in
Scivoletto’s study was 1.17, which is of a similar magnitude to the effect size
for patients with SCI in this study (0.98).
Whilst the physical ability of patients in this study is comparable to patients in
some of the other studies, there is less comparability with respect to
cognition. Some studies of rehabilitation in MS and stroke describe patients
with similar levels of cognitive ability. (Marolf et al. 1996; Ravaud et al. 1999)
But most studies of patients with stroke and MS comprise patients with lower
FIM cognitive scores. (Brosseau and Wolfson 1994; Fiedler et al. 2000;
Stineman et al. 1996) In general, patients with severe cognitive impairments
are not admitted to the NRU; therefore the patients in this study are not
representative of the full spectrum of patients with neurological illness.

The Barthel index and FIM are both clinician rated outcome measures. This
study did not take into account the patients’ opinion of the impact of
rehabilitation - either their opinion of the changes in physical function or the
changes in emotional wellbeing. Therefore, it is not possible to determine
from these analyses how much change occurred outside the measurement
ability of these scales. This could have been achieved by the use of an
appropriate transition question.
Finally, this study did not examine other psychometric properties of the
Barthel index and FIM in this sample. It was not possible to examine the test-
retest or interrater reliability of the scores in the NRU database. Therefore,
the possibility that poor reliability of the scores could have reduced the
responsiveness of the measures cannot be discounted. This possibility is,
however, small as the reliability of these measures has been demonstrated
in studies, both in the NRU (Hobart et al. 1996a) and in other centres.
(Loewen and Anderson 1988; Roy et al. 1988)
2.4.3 Implications for Clinical Practice
The results of this study have two main implications for the clinical practice of
neurological rehabilitation. Firstly, outcome measure responsiveness and
treatment effectiveness are closely related. Secondly, the range of
measurement of an outcome measure must match the range of the construct
to be measured in a sample.
91

The relationship between responsiveness and the impact of treatment can be
illustrated by two examples. First, an item might measure a construct that
would not be expected to change, as the patient has no deficit in that area,
for instance, the low responsiveness of the cognitive items seen in patients
with SCI. These patients generally have impairments isolated to the spinal
cord and would not be expected to have cognitive deficits. Consequently
changes would not be expected across these items.
Second, an item might reflect a construct that is unchangeable (rehabilitation
is unable to modify it) or the instrument does not measure that change. For
instance, a patient may have an indwelling urinary catheter on admission to
the NRU that he or she is able to manage independently. During the course
of the admission, the patient successfully starts using intermittent self-
catheterisation, which is a preferable technique for bladder management.
However, the bladder item in the FIM will remain unchanged as the patient
continues to require a catheter to manage his or her bladder. No change is
recorded by that item, so its responsiveness is poor.
These examples demonstrate the importance of matching outcome
measures to samples. Using generic measures to detect clinical change
inevitably means that there will be items that are not applicable to all
patients. This is illustrated by the low responsiveness of the Barthel index
and FIM in patients with MS. This does not necessarily mean that
rehabilitation for MS is inappropriate, or that it is less effective than

rehabilitation for other conditions, merely that the Barthel index and FIM do
not adequately detect the clinical change made by patients with MS in
rehabilitation. Of course, responsiveness of the Barthel index and FIM refers
only to the changes as measured by the multidisciplinary team recording
changes from admission to discharge. These measures do not take into
account the opinion of the patients in rehabilitation. Therefore, it may be
more appropriate to choose an outcome measure that has been shown to be
responsive for patients with MS in rehabilitation, such as the MSIS-29, which
also takes the patients’ opinions into account. (Riazi et al. 2003) This issue is
of importance, for instance, when conducting a trial comparing rehabilitation
interventions. As responsiveness is the ability to detect clinically significant
change, rather than statistically significant change, using responsive
measures in trials improves the evidence base for rehabilitation
interventions.
The item floor and ceiling effects noted in this study indicate the extent to
which the Barthel index and FIM do not measure the full range of physical
and cognitive ability of patients in the NRU. For the Barthel index, items have
two, three or four response options. This is less than recommended by
standard texts on outcome measure development. (Streiner and Norman
1995) It is suggested that items should have seven response options to
optimise discrimination between levels of ability. (Miller 1956) Items should
also have a range of measurement that matches the range of the construct
that is to be measured.

Floor and ceiling effects cannot be eliminated, but they can be minimised by
appropriate item response options. Calculating floor and ceiling effects for
the items of the Barthel index is an artificial procedure, as by implication,
even if equal numbers of patients endorse each of the response options,
there will be more than 20% of patients endorsing each response option. It
does, however, illustrate the need for items to have response option scales
that match the range of the constructs they purport to measure, from
severely limited to no limitation, with clinically appropriate points in between.
The FIM is comprised of items that have the “magical number” of seven
response options. Why, then, do the items of the FIM have such variable
responsiveness? The answer lies in the difficulty of the response options for
the items. Some items, such as stair climbing, which have large effect sizes,
also have low admission mean scores. Patients can make substantial gains
in these items by moving up the lower response options. To gain the higher
response options (six and seven) requires more improvement than is
necessary to gain lower response options. The FIM, like the Barthel index, is
an ordinal scale with a fixed scoring system that is criterion-based. Point
differences between individual response options are not the same and
changes at the lower end of the scale occur much more easily than at the
upper end. (Linacre et al. 1994) Again, this emphasises the need to write
appropriate response options for items.

In summary, it is important to choose an outcome measure that matches the
construct to be measured in the sample, both in terms of item relevance and
item responsiveness.
2.4.4 Conclusion
The Barthel index and FIM are moderately responsive for patients
undergoing neurological rehabilitation. The responsiveness of these
measures is limited by poor item performance, which leads to an
underestimation of the impact of rehabilitation. This study focused on
clinician rated changes in physical and cognitive function; there was no
measure of emotional wellbeing and no patient based outcome measure.
A more comprehensive view of the impact of rehabilitation can be achieved
by using a wider range of outcome measures. Chapter 3 describes a study
that examines the effectiveness of neurological rehabilitation in improving
physical functioning and emotional wellbeing using patient based outcome
measures.
95

Chapter 3 Measuring the Impact of Inpatient Rehabilitation

Chapter 3 Measuring the Impact of Inpatient Rehabilitation
3.1 Introduction
The last Chapter outlined the responsiveness of the Barthel index and FIM in
a large sample of patients in inpatient neurological rehabilitation. While these
measures underestimate the overall impact of rehabilitation on patients with
neurological illness, they provide some evidence that neurological
rehabilitation improves patients’ physical ability. But this is only one aspect of
patients’ health related quality of life. Rehabilitation aims to improve a
patient’s health status across a number of domains including physical ability,
social functioning and emotional wellbeing. (Tulsky and Rosenthal 2002)
The effectiveness of rehabilitation in reducing physical impairments due to
neurological illness has been established for patients with stroke. (Paolucci
et al. 2000; Sim et al. 1997; Ronning and Guldvog 1998) These three studies
demonstrated that patients made improvements in physical function with an
inpatient multidisciplinary programme. Other studies have established the
effectiveness of neurological rehabilitation in patients with spinal cord
impairment, (Tow and Kong 1998; van der Putten et al. 2001) MS, (Freeman
et al. 1997; Patti et al. 2003) traumatic brain injury, (Jorger et al. 2001;
McPherson and Pentland 1997) and Guillain-Barre syndrome. (Nicholas et
al. 2000; Meythaler et al. 1997)

Neurological rehabilitation has also been demonstrated to improve
psychological wellbeing and health related quality of life after stroke,
(Hopman and Verner 2003) spinal cord impairment, (Tate etal. 2002) MS,
(Wiles etal. 2001) and traumatic brain injury. (Johnston and Miklos 2002)
For neurological rehabilitation to be worthwhile, it is necessary for the gains
made during rehabilitation to be maintained after discharge. The
improvements in physical function and in psychological wellbeing made
during inpatient neurological rehabilitation persist for a variable time after
discharge. For instance, in stroke, the benefits on physical function persist
for up to one year. (Suenkeler et al. 2002) Even in neurological illnesses
known to deteriorate over time, such as progressive MS, improvements in
physical function and emotional wellbeing can be maintained for between six
and 10 months after discharge. (Freeman etal. 1999)
These studies have used a range of outcome measures, not all of which
have been fully validated for use in neurological rehabilitation. Some
outcome measures, such as the Barthel index, FIM and SF-36 have been
shown to have satisfactory psychometric properties in a rehabilitation setting.
However, the psychometric properties of other outcome measures, such as
the 28-item General Health Questionnaire (GHQ-28), have not been
evaluated in audits or studies of rehabilitation interventions. This is of
particular importance with regard to responsiveness, which is a key property

of all outcome measures, particularly in the context of clinical trials. (Stucki et
al. 1995a)
Outcome measures, particularly those measuring constructs such as
emotional wellbeing, often employ a cutting score. (Allen and Yen 1979) A
common example of this is the use of the GHQ-28 to indicate “caseness” in
patients with emotional distress. That is, patients are considered to have a
disruption of their emotional status, such that it warrants formal investigation
by a psychiatrist, if they score above the cutting score. Cutting scores for
outcome measures can be determined when patients can be categorised
using a criterion, or gold standard test. The specificity and sensitivity for all
possible scores on the outcome measure are calculated, and the score on
the outcome measure that gives the optimum specificity and sensitivity when
compared to the criterion is deemed to be the cutting score. This technique
has been applied to the GHQ-28, for use as a screening instrument for
emotional distress. Cutting scores were determined for different patient
populations using structured psychiatric interviews, (Bridges and Goldberg
1986) and the Hospital Anxiety and Depression Scale (HADS). (Feinstein et
al. 1999) Using outcome measures as screening tests can be valuable in
neurological rehabilitation where patients have to come to terms with newly
acquired disabilities, and the consequent emotional distress may impede
their recovery. (Mayo et al. 2002) It has been recommended that each unit
that uses outcome measures in this way, determines the cutting score that
best matches their individual population. (Bowling 2001)

The commonest symptoms of emotional distress in patients with neurological
illness are anxiety and depression. (Feinstein etal. 1999) These symptoms
contribute significantly to the morbidity of the original illness. Identifying these
symptoms in patients can facilitate early treatment and an improved
outcome. (Hassan et al. 2002)
This Chapter aims to explore the factors mentioned above, in a prospective,
observational study. The study aims to examine the changes effected by
neurological rehabilitation on patients’ physical function and emotional
wellbeing using clinician rated and patient based outcome measures on
discharge from rehabilitation and three months after discharge. The study will
use the clinician rated Barthel index and FIM, and the patient rated self-
report Barthel index, GHQ-28 and HADS. The study will also include an
examination of the psychometric properties of these measures and a review
of the most appropriate cutting score for the GHQ-28 in the NRU population.
3.2 Methods
This section describes the sample of patients recruited to the study, details
the outcome measures used, and outlines the psychometric procedures used
in this Chapter. The Joint Research Ethics Committee of the National
Hospital for Neurology and Neurosurgery and the Institute of Neurology
approved this study.

3.2.1 Sample
Recruitment of patients took place from 1st November 2002 to 31st May 2003.
All patients that were admitted between these dates were invited to
participate. Patients were asked to provide their written informed consent
after reading the study information leaflet.
Demographic and diagnostic data were collected by patient interview and
from the medical records within 48 hours of admission. Consenting patients
were asked to complete a questionnaire booklet containing self-report
outcome measures. Antidepressant use was recorded for each patient during
his or her admission. Within the 72 hours prior to discharge, patients were
again asked to complete a questionnaire booklet. Discharge destination was
recorded and contact details for follow-up information were confirmed with
each patient.
Three months from the discharge date, a questionnaire booklet was sent to
each patient with a request to complete and return it These questionnaires
were developed using the total design method as described by Dillman.
(Dillman 1978) An initial letter reminding each patient of the study was sent
first. This was followed seven days later by a letter explaining the study, the
questionnaire booklet and a stamped addressed envelope. A reminder letter
was sent if the booklet was not returned after 10 days. If not returned by
three weeks, a further questionnaire booklet and stamped addressed
envelope was sent to the patient’s address.
3.2.2 Outcome Measures
Five outcome measures were used in this study. The Barthel index and FIM
as outlined in the previous Chapter were scored by the treating
multidisciplinary team on admission and discharge. Patients were asked to
complete the self-report Barthel index, the GHQ-28 and the Hospital Anxiety
and Depression Scale (HADS) on admission, discharge and follow-up. In
addition to the outcome measures on discharge, a transition question with
respect to change in mood was asked. For this question, patients were
asked to rate how their mood had changed since admission. The response to
this question was graded with a Likert scale with the following response
options: much worse, worse, the same, better, much better. (Likert 1932)
The outcome measures were chosen to reflect the potential changes in
physical function and emotional wellbeing, particularly anxiety and
depression, which would be expected in patients in neurological
rehabilitation. The Barthel index, FIM and GHQ-28 were already in routine
use in the NRU. The self-report Barthel index was used to measure physical
function after discharge. The HADS was chosen as it has been shown to be
sensitive and specific in detecting post-stroke depression and emotional
disturbance in people with MS. (Feinstein et al. 1999; Johnson et al. 1995)
This would allow the HADS to be used to determine the optimal cutting score
of the GHQ-28.
102

The self-report Barthel index, the GHQ-28 and the HADS are described in
the following paragraphs with a summary of their psychometric properties.
Self-report Barthel index: This was developed from Collin’s 1988 version of
the Barthel index. (Collin etal. 1988) It was designed as a self-report
outcome measure for use in postal surveys. (Gompertz et al. 1994) The 10
items of the clinician scored Barthel index were converted into multiple
choice questions and scored according to the published guidelines
(Appendix 1). As with the clinician scored Barthel index, the items are
summated to give a total score from 0 to 20, with higher scores indicating
greater independence in activities of daily living.
The self-report Barthel index has good acceptability and test-retest reliability
in patients with stroke living in the community. (Gompertz et al. 1994) High
interrater reliability has been demonstrated between scores obtained by
patient self-report and clinician scoring. (Hobart et al. 1996b)
GHQ-28: This is a 28-item self-report questionnaire of emotional wellbeing
first published in 1979. (Goldberg and Hillier 1979) It has four sub-categories
measuring somatic symptoms, insomnia and anxiety, social dysfunction, and
severe depression, each of which can be analysed separately (Appendix 2).
Initially developed in general practice, it has been used in studies of patients
with MS, (Feinstein etal. 1999) stroke (Johnson etal. 1995) and in general
neurological inpatients. (Lykouras etal. 1996) In the original publication, the
103

authors recommended scoring each item dichotomously and summating the
items to give a total score from 0 to 28. (Goldberg and Hillier 1979) Lower
scores indicate better emotional wellbeing. A cutting score of five or more
indicates emotional disturbance in general practice patients. When this
cutting score is applied in patients with a range of neurological illnesses,
including MS, stroke and Parkinson’s disease, prevalence rates of emotional
disturbance exceed 50% of the sample. (Bridges and Goldberg 1986; Rabins
and Brooks 1981) Consequently, other authors have recommended using
cutting scores of six (Lykouras et al. 1996) or 12 which improve the
sensitivity and specificity of the GHQ-28 in detecting emotional disturbance.
(Bridges and Goldberg 1986)
The GHQ-28 was developed from the 60-item General Health Questionnaire.
Internal consistency of the GHQ-28 is reported to be high. (Failde et al.
2000) Test-retest reliability has not been reported in the literature. Using the
60-item version as a reference, the shorter version demonstrated good
criterion validity. (Goldberg and Hillier 1979) It has also been demonstrated
to have construct validity when tested against clinical psychiatric
examination. (Rabins and Brooks 1981) One potential problem with the
GHQ-28 is that the first seven items are related to physical symptoms of
emotional disturbance, for example, poor energy levels, headache and hot or
cold spells. It has been reported that this may result in a high false-positive
rate when the GHQ-28 is used in patients with neurological illness, as these
symptoms are commonly seen in neurological conditions, so will be
endorsed by patients when the symptoms are due to a physical, not a

psychological cause. (Bowling 2001) For this reason, some authors find the
HADS preferable, as it does not contain items relating to physical symptoms.
HADS: Published in 1982, the HADS has 14-items, seven of which measure
anxiety and seven that measure depression. (Zigmond and Snaith 1983) It
was developed to provide a short outcome measure that could identify these
two constructs in patients with physical illness (Appendix 3). The authors felt
that the General Health Questionnaire was too long and did not give specific
information about the nature of the emotional disorder. They felt that the
scale should be limited to anxiety and depression, as these are the most
common emotional disorders seen in patients in hospitals. Furthermore,
items relating to physical manifestations of emotional disorders were
specifically avoided to reduce the chance of false-positive results.
Each of the items in the HADS is scored from 0 to 3. The anxiety and
depression scales are summated separately giving scores ranging from 0 to
21 for each construct. Lower scores indicate less anxiety and depression
respectively. Scores of seven or less are normal, those between eight and 10
are borderline, and scores of 11 or more are abnormal. The HADS has been
used widely in hospital and general practice settings. It has been used for
screening for anxiety and depression in patients with stroke (Johnson et al.
1995) and MS. (Feinstein etal. 1999)

The HADS has been demonstrated to be internally consistent (Mykletun et
al. 2001) and have test-retest reliability. (Gold etal. 2003) Construct validity
has been established against other measures of anxiety and depression.
(Bjelland et al. 2002)
3.2.3 Analyses
This section describes the procedures carried out to compare the patients’
scores on admission, discharge and follow-up to determine the effect and
durability of the rehabilitation process. It also describes the techniques used
to establish the psychometric properties of the outcome measures to ensure
that they are appropriate for use in this population and how the cutting score
for the GHQ-28 was determined. Analyses were performed with SPSS
Version 11. (SPSS Incorporated 2002)
Descriptive statistics: The mean and standard deviation or frequency were
calculated for demographic variables, outcome measure scores and
transition questions. Paired t-tests were used to compare scores from
admission to discharge and discharge to follow-up. Independent f-tests were
performed to examine whether the following characteristics affected patients’
rehabilitation outcome: age greater than the median, sex, presence of
anxiety or depression, antidepressant use, and onset of neurological
disability (acute or chronic).

Acceptability: Acceptability of the self-report Barthel index, GHQ-28 and
HADS was determined by calculating percentage of missing items for each
measure. Failure to answer items can be due to the items being irrelevant,
inappropriate or intrusive. (Lohr et al. 1996) This study used a transition
question asking each patient how easy he or she found the questionnaires to
answer. (Andresen et al. 1998) The response options were: very difficult,
difficult, easy and very easy.
Acceptability of the measures was also evaluated by examining mean
scores, standard deviations and score ranges. Floor and ceiling effects were
calculated for the self-report Barthel index, GHQ-28 and the anxiety and
depression scales of the HADS.
Reliability: Reliability was estimated by using Cronbach’s alpha (Cronbach
1951) and item-total correlations. Cronbach’s alpha should be greater than
0.70. (Fitzpatrick et al. 1998) The item-total correlation examines the
correlation between each item and the measure with the item removed.
Items should correlate with the measure at r> 0.20. (Streiner and Norman
1995)
Validity: In this study it was postulated that the self-report Barthel index
would correlate strongly with the clinician scored Barthel index and FIM, and
the GHQ-28 would demonstrate convergent validity with the depression
scale of the HADS. Discriminant validity was expected between the GHQ-28

and HADS, and the self-report Barthel index. Construct validity would,
therefore, provide evidence for the use of these instruments in measuring the
two constructs of physical function and emotional wellbeing.
Acceptability, reliability and validity statistics for the outcome measures were
calculated on the patients’ scores on admission, as the greatest number of
patients completed the admission outcome measures.
Responsiveness: For the GHQ-28 and HADS, effect sizes were calculated
for the sample as a whole and for patients in each response category of the
transition question. (Middel et al. 2001) This technique allows external
validation of the effect size statistic by comparing it to the patient’s own
opinion of the change in their emotional wellbeing. In this way, clinical
change as perceived by the patient is placed in the context of the answers
given to the items of the GHQ-28 and HADS at the end of his or her NRU
admission.
ROC analysis: Receiver operating characteristic (ROC) analysis is a graphic
representation of the relationship between the sensitivity and the specificity
of an instrument. ROC analysis determines the best cutting score that
maximises the true-positive rate (sensitivity) whilst minimising the false-
positive rate (1-specificity). ROC analysis has been used to determine cutting
scores for the GHQ-28 in previous studies and is recommended by the
developers of the instrument. (Lykouras etal. 1996) An ideal instrument, with
perfect sensitivity and specificity, would be represented by the top left-hand
point of the graph. When the data are plotted on the graph for all possible
scores of the GHQ-28, the point on the curve closest to the top left-hand
point represents the cutting score with the best combination of sensitivity and
specificity. The HADS depression scale was used as the reference in the
ROC analysis.
These procedures were used to examine the response of patients to
neurological rehabilitation, to establish the properties of these outcome
measures in this population, and to determine the optimum cutting score for
the GHQ-28.
3.3 Results
The results of the analyses performed on the data gathered are presented in
this section. The demographics of the sample are presented initially, followed
by the results from the measures of physical function (Barthel index, FIM,
self-report Barthel index), then the measures of emotional well being (GHQ-
28, HADS) and finally, the psychometric analyses.
3.3.1 Demographics
Over the course of the recruitment period, 70 patients were admitted to the
NRU for inpatient rehabilitation. A flow diagram illustrating the recruitment of
patients to the study is presented in Figure 3.1. Three patients declined to

take part, but did not give reasons why. Four patients were unable to
complete the questionnaires: two patients were unable to speak English and
two patients were unable to communicate due to profound aphasia.
Figure 3.1 Recruitment to the study
70 patients admitted
\^ 3 declined to participate; 4 unable to complete questionnaire
63 consented to take part and completed admission questionnaire
\2 transferred off NRU; 1 did not complete discharge questionnaire
60 completed discharge questionnaire
N 2 patients RIP; 2 change of residence after discharge; 4 no reply
52 returned completed follow-up questionnaire
Over the course of the study, two patients became unwell and were
transferred off the NRU for medical treatment. These patients did not
complete their rehabilitation and were not followed-up. One patient did not
complete the discharge questionnaires.
Of the 60 patients who completed discharge questionnaires, 52 patients
returned a completed questionnaire booklet three months after discharge. Of
the eight who did not, two patients died in the intervening period, both from
pneumonia. Two patients had been homeless on admission, and letters to
the addresses that they were allocated on discharge were returned
110

unopened. Four patients did not reply to the mailings. The response rate is
calculated from the number of those who returned the questionnaire (52)
divided by the number (56) who could have completed the questionnaire
(that is, those known to be living at a valid address) and, for this study, it is
93%. There were no systematic differences in admission and discharge
scores between those who returned the questionnaire booklet and those who
did not.
The demographics of the 63 patients who consented to take part and who
completed the admission questionnaires are described in Table 3.1. There
were more males than females in the sample. The median age of patients
was 45 years. Apart from patients with spinal cord injuries, stroke and MS,
there was a range of other neurological illnesses represented in the sample.
The mean age, and age range, of the patients in this study are similar to
those seen in the NRU over the last 10 years, as described in the last
Chapter.

Table 3.1 Patients’ demographics on admission
Variable
Sex
Male n (%) 34 (55%)Female n (%) 29 (45%)
Age Mean (SD; range) 48 (16; 2 0 -8 8 )
Diagnosis n (%)Spinal cord lesion 17 (26%)Stroke 16 (25%)MS 12(19%)GBS 6(10%)Cerebral tumour 3 (5%)Acquired brain injury 2 (3%)Cerebral palsy 2 (3%)Movement disorder 2 (3%)Miscellaneous 3 (5%)
Admitted fromNHNN 28 (44%)Home 25 (40%)Other hospitals 9 (14%)Other rehabilitation units 1 (2%)

Patients’ lengths of stay in rehabilitation were also similar to lengths of stay
of patients with similar diagnoses in other years. The mean length of stay for
all patients was 38 days, with a standard deviation of 26 days, and ranged
from 16 to 168 days. Of the 60 patients who completed the discharge
questionnaires, 59 patients were discharged home from the NRU. Two
patients chose to be discharged to nursing homes, one patient with cerebral
palsy returned to the sheltered accommodation he had been living in prior to
his illness and the two patients who were homeless on admission were
discharged to the homeless persons unit. One patient was discharged to
continue his rehabilitation in another rehabilitation unit.
3.3.2 Physical Function
Over the course of the study there was a statistically significant improvement
(p < 0.001) in all measures of physical function. Table 3.2 outlines the
changes between admission and discharge on the Barthel index, FIM and
self-report Barthel index. This table includes the effect size for each of the
measures.
Effect sizes were moderate to large (0.68 to 0.82) for each of the outcome
measures of physical function indicating good improvement. The FIM
cognitive scale effect size was 0.25, which is in the same range as the
results for this measure in the previous Chapter.

At three months physical function remained at discharge levels for the self-
report Barthel index with a mean value of 15.8, standard deviation 4.2. This
represents a fall in this measure of 0.8, which is not significant.
Table 3.2 Physical function measures: admission and discharge
Outcome measure Admission score (SD)
Discharge score (SD)
Meanchange
Significance Effectsize
FIM total 89.6 (22.5) 108.1 (16.9) 17.9 p < 0.001 0.82
FIM motor 59.6 (21.1) 76.8 (14.3) 16.6 p < 0.001 0.81FIM cognitive 29.7 (5.6) 31.1 (4.9) 1.5 p < 0.001 0.25
Barthel index 12.7 (5.8) 17.3 (3.5) 4.5 p < 0.001 0.79
Self-report Barthel 13.2 (4.9) 16.5 (3.6) 3.3 p < 0.001 0.68
Self-report Barthel index: The self-report Barthel index demonstrated good
acceptability, internal consistency and construct validity against the clinician
scored Barthel index and FIM (Table 3.3). The item-total correlations were
greater than 0.30 for all items except the bladder item. Apart from this result,
the self-report Barthel index met or exceeded the psychometric criteria as
described in the methods section.
114

Table 3.3 Psychometric properties of the self-report Barthel index
Property
AcceptabilityMissing items % 0%-8%Floor/ceiling effects % 0% / 9.5%Scale range 0 - 2 0Score range 2 - 2 0Mean score (SD) 12.9 (5.1)
ReliabilityItem-total correlations 0.17-0.81Cronbach’s alpha 0.83
Validity (Pearson’s correlation)Barthel index 0.77
FIM motor 0.77
FIM total 0.75
115

3.3.3 Emotional Wellbeing
In a similar pattern to the physical changes, emotional wellbeing improved
from admission to discharge. The GHQ-28 and HADS depression scale
demonstrated a statistically significant decrease (p < 0.001). The HADS
anxiety scale did not show a significant decrease (p = 0.050). Admission and
discharge scores with effect sizes are presented in Table 3.4. There was a
large improvement (0.91) in emotional wellbeing as measured by the GHQ-
28. The change for the HADS depression scale was small to moderate (0.43)
and small for the HADS anxiety scale (0.22).
Table 3.4 Emotional wellbeing measures: admission and discharge
Outcome Admission Discharge Mean Significance Effectmeasure score (SD) score (SD) change size
GHQ-28 8.3 (6.2) 2.7 (3.5) 6.2 p < 0.001 0.91
HADSDepression 6.3 (4.8) 4.2 (3.5) 2.1 p < 0.001 0.43Anxiety 5.7 (4.3) 4.8 (4.4) 0.9 p = 0.050 0.22
By follow-up at three months, the mean GHQ-28, HADS depression and
anxiety scores were 6.6, 6.5 and 6.6 respectively (Table 3.5). These scores
did not differ significantly from the corresponding scores on admission.
However, all three had increased significantly on the corresponding
discharge scores (p < 0.002).

Table 3.5 Emotional wellbeing measures: follow-up
Outcome Follow-up Mean change Discharge to measure score (SD) discharge to follow-up
follow-up significance
GHQ-28 6.6 (6.9) -4.1 p < 0.001
HADSDepression 6.5 (4.4) -2.2 p < 0.001Anxiety 6.6 (5.1) -1.39 p =0.002
HADS scores: Admission and discharge HADS scores were categorised
into groups according to the classification as outlined in the methods section.
On admission, four patients had abnormal levels of anxiety alone, four had
abnormal levels of depression alone, and five patients had abnormal levels
of both (Table 3.6). Results are included for the 60 patients who completed
both admission and discharge HADS questionnaires and the 52 patients who
completed the follow-up questionnaire. As expected from the total score
changes in the HADS scales, there was a decrease in the number of patients
in the borderline and abnormal categories for the depression scale from
admission to discharge. But for the anxiety scale there was only a decrease
of two in the number of borderline cases and one in the number of abnormal
cases. The follow-up anxiety and depression categories indicate increases in
the numbers of patients with borderline or abnormal states in a similar
pattern to the total scores for those scales.

Table 3.6 HADS categories: admission, discharge and follow-up
HADS Category Normal Borderline Abnormal
AnxietyAdmission 45 6 9Discharge 48 4 8Follow-up* 31 11 10
DepressionAdmission 37 14 9Discharge 52 5 3Follow-up 31 13 8
Subgroup analysis: Change in patients’ scores was not affected by age,
sex, anxiety, depression or antidepressant use. The only variable of
significance was whether patients had acute onset of illness or had a chronic
disability prior to this admission for rehabilitation. This difference was only
significant for the GHQ-28 score at discharge, which demonstrated a greater
improvement in emotional wellbeing for patients with chronic disability, than
for patients with acute onset of illness (Table 3.7).
* Only 52 patients completed the follow-up HADS questionnaires

Table 3.7 Emotional wellbeing measures: acute onset versus chronic
Outcomemeasure
Admission to dischargeAdmission Discharge Significance
score scoreEffectsize
Discharge to follow-upFollow-up Significance
score
GHQ-28Acute 7.8 3.8 p < 0.001 0.82 6.3 p = 0.011Chronic 8.4 1.7* p < 0.001 0.91 6.1 p = 0.026
HADSDepression
Acute 6.5 4.1 p = 0.002 0.47 6.9 p < 0.001Chronic 6.2 4.5 p = 0.042 0.32 6.1 p = 0.025
AnxietyAcute 5.4 4.5 p = 0.160 0.26 7.1 p = 0.014
Chronic 6.6 5.0 p = 0.155 0.18 6.1 p = 0.073
* Difference between patients with acute and chronic illness significant at p = 0.45, all other
differences not significant
119
3.3.4 Psychometric Analysis
Acceptability: The GHQ-28 and HADS demonstrated good acceptability
(Table 3.8). There were very few missing items in the HADS scales, with a
slightly higher percentage in the GHQ-28. Those items with the greatest
number of missing items were primarily in the severe depression subscale,
which includes questions about suicide. Fifty-eight patients reported that they
found the questionnaires easy or very easy to answer. Three patients found
the questionnaires difficult; two patients did not endorse any category in this
question. Floor and ceiling effects were minimal, apart from the floor effect of
the GHQ-28, which was 28%.
Reliability: The internal consistency of the GHQ-28 and HADS scales were
within the criteria as outlined in the methods section. Only one item of the
GHQ-28 (having hot or cold spells) had an item-total correlation less than
0.20; all other items were greater than 0.20.
Validity: Construct validity was demonstrated by moderate correlations
between the anxiety and depression scales of the HADS and moderate
correlations between the GHQ-28 and the HADS scales (Table 3.8). There
were low correlations between the measures of emotional wellbeing and the
self-report Barthel index as expected. Correlations between emotional
wellbeing and age and sex of patients were less than r - 0.20.

Table 3.8 Psychometric properties of the GHQ-28 and HADS
Measure GHQ-28 HADSDepression Anxiety
AcceptabilityMissing items % 0%-10% 0%-2% 0%-1%Floor/ceiling effects % 28% / 2% 6%/2% 8% / 0%Scale range 0 - 2 8 0-21 0 - 2 1Score range 0 - 2 8 0- 21 0 - 1 8Mean score (SD) 6.2 (7.3) 6.4 (4.8) 5.9 (4.4)
ReliabilityItem-total correlation 0.18-0.82 0.38 - 0.67 0.53 - 0.80Cronbach’s alpha 0.95 0.82 0.86
Validity (Pearson’s correlation)GHQ-28 0.674 0.647
HADS Depression 0.662
Self-report Barthel -0.04 -0.12 -0.14
When the GHQ-28 insomnia and anxiety subscale was examined against the
HADS anxiety scale, there was a correlation of r = 0.717. This indicates that
these two scales measure the same construct. The other three subscales of
the GHQ-28, somatic symptoms, social dysfunction and severe depression
correlated at lower levels with the HADS anxiety and depression scales
(Table 3.9).
121

Table 3.9 Correlations between GHQ-28 and HADS subscales
HADSDepression Anxiety
GHQ-28 SubscaleSomatic symptoms 0.498 0.496Anxiety 0.640 0.717Social dysfunction 0.663 0.541Severe depression 0.503 0.604
Responsiveness: Table 3.10 presents the effect sizes for the patients
stratified by the response they gave to the transition question regarding
mood on discharge. No patients endorsed the worse or much worse
categories in the transition question. For the GHQ-28 and HADS depression
scale there was concordance between the transition question categories and
the effect size for the scales.
Table 3.10 Discharge transition question
Effect size
Transition Number of GHQ-28 HADS HADSquestion patients Depression Anxiety
Much better 22 1.25 0.75 0.20
Better 23 0.69 0.28 0.19
The same 15 0.66 0.12 0.27
Worse 0Much worse 0
122

Cutting score: Using the standard cutting score of five or more, 41 (65%)
patients were classified as having emotional disturbance on admission.
When the GHQ-28 results were plotted on the ROC curve, the optimum
cutting point for this sample was established as six (Figure 3.2). That is, a
score of six or more on the GHQ-28 indicates emotional disturbance. Using
this new cutting score reduces the number of patients with emotional
disturbance to 36 (57%). The sensitivity and specificity for this cutting score
were 75.0% and 79.3% respectively.
Figure 3.2 ROC curve for GHQ-28
Arrow indicates point of greatest sensitivity and 1-specificity
1.00
.75-
£>'(/) -50-c<DCO
.25-
0.001.00.75.50.250.00
1 - Specificity

3.4 Discussion
3.4.1 Summary of Results
This observational study has three main findings. Firstly, emotional distress
is very common amongst patients with neurological conditions. Neurological
rehabilitation improves emotional wellbeing, but the effect is not enduring.
Secondly, the outcome measures used in this study are psychometrically
sound, and in particular are responsive when used to detect change in
neurological rehabilitation. Thirdly, a higher cutting score for the GHQ-28 is
required for patients with neurological conditions than that recommended for
general populations.
This study describes high levels of anxiety and depression in patients on
admission to a neurological rehabilitation unit. The level of depression is
comparable to that seen in other studies of depression in neurological illness.
(Sadovnick et al. 1996; Turner-Stokes and Hassan 2002; Kennedy and
Rogers 2000) What this study adds, however, is that while physical function
and depression improve in patients undergoing rehabilitation, anxiety
remains elevated. Anxiety has been identified as an important contributor to
poor quality of life in patients with chronic neurological illnesses. (Feinstein et
al. 1999) In Feinstein’s study, anxiety, accompanied by depression, in
patients with MS, was associated with more frequent thoughts of self-harm
and greater social dysfunction. It is being increasingly recognised that
combined anxiety and depression is the most common affective disorder in
general psychiatric practice. (Shorter and Tyrer 2003) This study provides

evidence that this may also be the case amongst patients in rehabilitation, as
five patients had combined anxiety and depression, which was more than
had depression alone (four).
However, the impact of anxiety or depression on physical function is not
certain. Some studies have suggested that physical function after stroke is
impaired by depression, (Johnson et al. 1995) whereas others have not
found any relationship. (Cassidy et al. 2004) This study found no association
between anxiety, depression and physical function, though the numbers in
these analyses are small.
The patient based outcome measures used in this study, the self-report
Barthel index, the GHQ-28 and HADS, are responsive to changes brought
about by neurological rehabilitation in this sample. The responsiveness of the
GHQ-28 and HADS, as measured by the effect size statistic, was in keeping
with the direction and magnitude of change indicated by the patients’ opinion
of the change in their emotional wellbeing. The GHQ-28 is more responsive
(effect size 0.91) than the HADS depression scale (effect size 0.43) in
detecting change in emotional wellbeing. This may be due to the GHQ-28
sampling a wider construct of emotional wellbeing from social dysfunction to
severe depression and so detecting change in a range of areas that
rehabilitation aims to improve. The changes in these individual areas will
then contribute to overall responsiveness.

These results demonstrate that the self-report Barthel index, GHQ-28 and
HADS are acceptable, reliable and valid in patients undergoing inpatient
rehabilitation. They are also suitable for assessing the status of patients after
they have been discharged from rehabilitation. The three measures have
good acceptability in patients recently admitted for rehabilitation. Internal
consistency is high as measured by standard indices. There is construct
validity between the self-report Barthel index and the clinician scored Barthel
index and FIM indicating that the self-report Barthel index can be used to
measure physical function in this sample after discharge. Total and subscale
scores of the GHQ-28 and the HADS scales correlate in the moderate to
high range, indicating that they measure related but distinct constructs. Both
scales measure anxiety and depression, and the GHQ-28 also measures the
related constructs of somatic symptoms and social dysfunction.
Findings in this study are consistent with previous studies that have
evaluated the measurement properties of the self-report Barthel index, the
GHQ-28 and the HADS. The self-report Barthel index has been shown to be
acceptable and reliable in patients with stroke. (Gompertz et al. 1993;
Gompertz et al. 1994) Construct validity has been demonstrated previously
with the clinician scored Barthel index. (Hobart et al. 1996b) There are no
studies that have used the self-report Barthel index during inpatient
rehabilitation and then after discharge to assess physical function.

This is the first study to examine the acceptability and internal consistency of
the GHQ-28 in patients with neurological illness in rehabilitation. Internal
consistency in this setting was similar to that seen when the measure has
been used in other medical illnesses. (Failde et al. 2000) Construct validity of
the GHQ-28 has previously been shown with other measures of emotional
wellbeing such as the Schedule of Recent Experience (Rabins etal. 1986)
and structured interviews. (Bridges and Goldberg 1986; Lykouras et al. 1996)
The acceptability and reliability of the HADS has not been tested before in
patients in neurological rehabilitation. Findings in this study for internal
consistency and validity of the HADS are, however, comparable with a
previous study involving patients with neurological illness. (Gold et al. 2003)
The cutting score for the GHQ-28 of six or more found by this study to give
optimum sensitivity and specificity to detect emotional disturbance, is the
same as that found by other studies of patients with neurological illness.
Johnson’s study, of patients with post-stroke depression, reported that a
cutting score of six or more resulted in a sensitivity of 78% and specificity of
81% in detecting emotional disturbance. (Johnson etal. 1995) Lykouras’
study of general neurological inpatients, using the same cutting score,
reported a sensitivity of 87% and specificity of 77%. (Lykouras etal. 1996)
This study found lower sensitivity, but equal levels of specificity.

Applying the new cutting score of six or more to the sample in this study
reduced the number of patients classified as having emotional disturbance
by 8% to 57%, compared to the original cutting score of five or more. This is
similar to the level of emotional disturbance seen in other studies involving
patients with neurological illness. Rabins, in two studies of outpatients with
MS, reports that between 47% and 52% of patients have emotional
disturbance using the GHQ-28 with a cutting score of five or more. (Rabins
and Brooks 1981; Rabins et al. 1986) These studies included a wide range of
patients with MS, from newly diagnosed to those with physical and cognitive
impairments. Fifty-six of 107 (52%) patients in Lykouras’ study had emotional
disturbance. (Lykouras et al. 1996) Patients in that study also ranged from
newly diagnosed to chronically unwell, and had a wide range of diagnoses,
with demyelinating diseases (17%), myopathy (14%) and epilepsy (13%)
being the three most common diagnoses.
There are differences between the results of this study and a previous study
performed in the NRU. Freeman et al reported enduring improvements in
emotional wellbeing in patients with progressive MS following inpatient
rehabilitation. (Freeman et al. 1999) Median GHQ-28 scores decreased from
9.5 on admission to 1.5 on discharge and remained below five for up to one
year. However, there are a number of important differences between the two
studies. All patients in Freeman’s study had MS with a mean duration of
illness of 15.3 years. But in this study, only 12 (19%) patients had MS, and
38 (60%) patients were admitted with an acute onset of neurological illness.
Furthermore, patients in this study were followed-up with a postal

questionnaire at three months, but in Freeman’s study, patients were seen
every three months for a year. These variations between patient populations
and methodology are most likely to be responsible for the differences
between the two studies.
In summary, neurological rehabilitation produces improvements in physical
functioning that persist for at least three months, and improvements in
emotional wellbeing, which deteriorate after discharge. The self-report
Barthel index, GHQ-28 and HADS are psychometrically sound outcome
measures in neurological rehabilitation.
3.4.2 Study Strengths and Limitations
This study included all patients admitted to a neurological rehabilitation unit
over a seven-month period who consented and who were able to
communicate with an interviewer. The results of this study refer to a sample
of patients with a casemix of acute and chronic neuromedical and
neurosurgical illnesses. There was a wide age range, and male and female
patients were equally represented. Patients were admitted from home and
from hospitals in the Greater London area.
Scores on admission for the measures of physical function and emotional
wellbeing spanned the range of the measurement scales. The patients
reported in this study have similar levels of disability to those reported in
other studies. (Post et al. 2002; Sim et al. 1997; Tennant et al. 1996; Tow

and Kong 1998; van Bennekom et al. 1996; Ronning and Guldvog 1998)
Other studies have described patients with higher, (Hsueh et al. 2002;
Paolucci et al. 2000; Patel et al. 1998; Scivoletto et al. 2003) and with lower
levels of disability. (Craig et al. 2003; Salbach et al. 2001; Wallace et al.
2002) Levels of emotional disturbance were similar to those seen in patients
hospitalised with neurological illness. (Lykouras et al. 1996; Rabins and
Brooks 1981; Rabins et al. 1986) The characteristics of this sample, with
respect to demographics and scores on outcome measures, suggest that it is
representative of other groups of patients in neurological rehabilitation.
A further strength of this study is the consistency of input from the
rehabilitation team. Patients were treated by a multidisciplinary team
experienced in treating patients with neurological illnesses. Outcome
measurement is an integral part of the rehabilitation process in the NRU and
rehabilitation outcomes are audited three-monthly. The results of this study
are consistent with the outcomes in the NRU for the year prior to the start of
the study and the three months since the study finished. The study did not
affect the team’s scoring of the clinician scored outcome measures or the
rehabilitation interventions the patients received. These factors support the
generalisability of these results to other patients who may be admitted to the
NRU.
Ideally, this study would have incorporated a control group. However
logistical considerations meant that it was not possible to conduct a

randomised double blind trial without huge resource implications. Ethical
concerns would not allow delay in treating patients with acute conditions
where there is strong evidence that rehabilitation is effective and prevents
secondary complications, for example, in stroke and in spinal cord injury
rehabilitation. (Edwards et al. 2002; Inman 1999)
This study excluded patients who were unable to communicate sufficiently to
provide answers to the self-report questionnaires. Every effort was made to
ensure as many patients as possible were invited to participate, but patients
with profound aphasia or insufficient skill in English could not be included.
The exclusion of these patients means that patients with the most severe
participation restrictions were not included. This limits the generalisability of
the results to these patients. One method of including patients with severe
communication impairment is to ask a family member or carer to act as a
proxy. This technique has been used in assessing outcome in traumatic
brain injury and stroke rehabilitation and may warrant further investigation as
a method of obtaining outcome measurement data from these patient
groups. (Cusick et al. 2000; Sneeuw et al. 1997)
A potential limitation to the follow-up arm of the study is non-respondent bias
from those who did not return the questionnaires. While a well-established
method was chosen to facilitate as high a response rate as possible, non
response was an unavoidable consequence of postal questionnaire follow-
up. It is not possible to determine how the results of the study might have

differed if they had included those who did not reply, however, there were no
systematic differences between those who did and those did not respond to
the postal questionnaire.
3.4.3 Implications for Clinical Practice
The results of this study have several implications for clinical practice. First, it
is important to measure a range of constructs when evaluating patients’
progress, both during and after a rehabilitation programme, to
comprehensively evaluate their outcome. Second, emotional wellbeing
deteriorates after discharge, therefore it is important to develop strategies to
identify and assist those patients who have emotional disturbance. Third, it is
possible to measure accurately the impact of rehabilitation in patients while
they are in a rehabilitation unit and after discharge using self-report
questionnaires, and these could be used more extensively by rehabilitation
teams.
Rehabilitation is a complex process that can effect improvements in physical
function and emotional wellbeing in patients with neurological conditions. The
goal of a rehabilitation intervention may be to reduce a patient’s impairment,
improve an activity or enhance his or her participation. Health related quality
of life is the interaction of a patient’s impairments, activities and level of
participation, with his or her social and personal background. (Carr etal.
2001) But health related quality of life is difficult to determine
comprehensively. (Ware, Jr. 2003; Testa and Simonson 1996) The practical

consequence of this is that most studies of rehabilitation aim to assess only a
representative portion of the constructs that potentially could be measured.
Physical function and emotional wellbeing are the two most commonly
measured constructs in studies of rehabilitation interventions, particularly in
patients with neurological illnesses.
It is important that rehabilitation programmes routinely measure as wide a
range of constructs as possible for two reasons. Firstly, biometric data, such
as blood pressure, or laboratory or radiological results are generally of
limited interest to patients, but more importantly, often correlate poorly with
function and wellbeing. (Guyatt et al. 1993) Secondly, patients with the same
impairments rarely have the same limitations in activity or participation.
Although some patients may continue to work and participate in leisure
activities, others may become unemployed and restrict their lifestyles.
(Larocca et al. 1985) By using a range of patient based outcome measures it
will be possible to develop a clear appreciation of the patients’ current
functional status and their understanding of their own abilities.
Measuring physical function - walking, activities of daily living, upper limb
tasks - is a core element of neurological rehabilitation programmes. (Wade
1993) However, most measurement of physical function is clinician scored.
There is increasing interest in patient based outcome measures, not just of
constructs such as psychological or social functioning, but also of physical
function. (Hobart 2002) The self-report Barthel index is one such measure.

More recent work emphasises developing measures using psychometric
principles; an example of which is a scale to measure the patient’s
perspective of the impact of MS on his or her walking ability. (Hobart et al.
2003) The MS Walking scale is an outcome measure, developed using
psychometric methods, that contains 12 items, which are based on
statements made by patients with MS about their walking ability. Therefore, it
provides scientific data of the patients’ opinions by asking questions that
patients themselves have identified as important.
There is evidence that patients’ opinions are significantly different to those of
clinicians’ in a range of situations. (Wilson and Cleary 1995) Taking the
patients’ opinions into account can facilitate decision making when those
wishes are clearly known. Furthermore, if patients feel that clinicians are
interested in their opinions and are taking them into account when treating
them, then the patients are more likely to comply with treatment. (Jones
2003; Javors and Bramble 2003) This is an important issue when patients
with chronic neurological illnesses are discharged from rehabilitation with
home management programmes to prevent secondary complications such
as muscle contractures and pressure sores. Using patient based outcome
measures in these situations to allow clinicians to comprehend the patients’
understanding of their situation may improve compliance with treatment.
Several studies have demonstrated that compliance with treatment may also
be affected by emotional disturbance. (Sinyor et al. 1986; van de Weg et al.

1999) As discussed earlier in this Chapter, rehabilitation for neurological
illnesses can improve emotional wellbeing. However, deterioration in
emotional wellbeing occurs after discharge from rehabilitation. Why this
occurs has not been adequately explained, and emotional wellbeing can
deteriorate despite stable or improving physical function. (Suenkeler et al.
2002) Hopman has suggested that restricted social role after discharge may
influence wellbeing. (Hopman and Verner 2003) Patients returning to their
home environment following a neurological illness will be reminded of their
functional limitations and loss of independence. Patients will also be unable
to return to other activities such as driving or work, which may have formed a
part of their normal social role before the onset of neurological illness.
Detecting and treating emotional disturbance may play a role in improving
the outcome of rehabilitation programmes. But to treat emotional disorders,
they must first be detected. This can readily be achieved in a neurological
rehabilitation setting using patient based outcome measures as patients find
these acceptable and they produce results that are reliable and valid.
This study has shown that it is possible to measure physical function and
emotional wellbeing with a postal survey using patient based outcome
measures. Assessing patients after discharge using postal questionnaires
may be an effective way of identifying those patients who are having
difficulties in the community. In this way, further interventions can be
provided for patients, such as readmission to the rehabilitation unit,
outpatient support, or increased community input.
3.4.4 Conclusion
Neurological rehabilitation is effective in improving physical function and
emotional wellbeing in patients with acute or chronic disability. It is possible
to measure accurately the changes brought about by rehabilitation
interventions. However, when patients are discharged to the community,
emotional wellbeing deteriorates despite maintenance of physical function.
It is possible that incomplete return to a full social role contributes to patients’
deterioration in wellbeing after discharge from rehabilitation. The next
Chapter describes a study that examines the relationship between chronic
neurological illness and retention of employment, an important social role for
adults of working age.

Chapter 4 The Impact of MS on Work Retention

4. The Impact of MS on Work Retention
4.1 Introduction
The previous Chapter outlined the impact of inpatient neurological
rehabilitation on physical function and emotional wellbeing. Most patients
who are discharged from inpatient rehabilitation programmes after an acute
neurological illness are able to return to living in the community, and some
patients are able to resume employment. For these patients, being able to
return to work, or retrain in a new career, may be a factor in promoting
emotional wellbeing, as returning to a previous role signals a return to
normality for most people.
Equally, patients with chronic neurological illnesses living in the community,
who are in employment, may benefit from rehabilitation interventions to
improve their ability to remain in work. (Barnes 2003) For this group of
patients, improved ability to work may also contribute to an enhanced sense
of wellbeing.
Chronic neurological illnesses include conditions that are progressive in
nature, such as MS. The needs of patients with MS change over time;
patients may have disabling relapses with relapsing-remitting MS, or they
may accumulate disability in progressive MS. In order for people with MS to
remain in employment, work retention interventions have to be flexible to
respond to these changes.

Why is work retention so important? First, work is a significant social role.
(Williams 1987) Most adults of working age define their role in society in
terms of the work that they perform and disruption of this role by chronic
illness can alter adult identity. It has been reported that for people with MS,
“the assault on the identity for many people when they are unable to perform
as usual can be profound”. (Dyck and Jongbloed 2000)
Second, the combination of loss of paid employment and medical expenses
can put a considerable economic burden on individuals with chronic
conditions and on their families. In a study of families in the United States
where the wage earner had MS, it was reported that 25% of families had
inadequate means to cover their day-to-day needs, even when the cost of
medical care was excluded. (Catanzaro and Weinert 1992)
Third, unemployed individuals experience lower quality of life. (Lindholm et
al. 2002) As a result of the combination of altered social role, financial
uncertainty and the direct health related effects of the MS itself, quality of life
in unemployed people with MS is lower than in those who are working and
have the same level of disability. (Aronson 1997) For these three reasons,
work retention programmes should be available for people with MS who are
experiencing difficulties staying in work.

The level of employment amongst people with MS has been uniformly low in
studies over the last 20 years. Table 4.1 outlines six epidemiological studies
that have included data on employment. Despite differences in countries and
methodologies, four of the six studies reported remarkably similar levels of
employment (23% to 32%).
Table 4.1 Employment in people with MS
Location(Reference)
Number Meanage
Duration of MS
EDSS Employmentrate
Saxony, Germany (Poser 1981)
92 N/A 18.4 N/A 30%
New York, US (Larocca 1982)
312 43 13 4.6 23%
Tromso, Norway (Gronning 1990)
79 30 N/A N/A 49%
Vancouver, Canada (Jackson 1991)
210 45 N/A N/A 24%
Ontario, Canada (Aronson 1997)
697 48 12 N/A 32%
Northern Ireland* (McDonnell 1998)
111 53 13.6 6.0 14%
* This study only included patients with primary progressive multiple sclerosis
N/A: Not available
140

One of the first studies to examine employment issues in people in MS was
performed in Lower Saxony in Germany. (Poser etal. 1981) This was a
cross-sectional study of patients attending an MS clinic, with patients being
interviewed by medical sociologists and neurologists. Ninety-two of 148
patients were interviewed with respect to the impact that MS had on their
employment status. Poser’s study found that impaired mobility, bladder and
bowel dysfunction, and ataxia were the most common factors that limited
patients’ ability to work.
The following year, Larocca’s group in New York found that 23% of patients
selected from an MS clinic were still in employment after a mean duration of
MS of 13 years. (Larocca et al. 1982) Patients underwent a structured
interview and examination by a neurologist. Increasing disability was the
main factor related to unemployment. A one-point increment in Kurtzke
Disability Status Scale was associated with a 7% increase in the probability
of being unemployed.
In the Norwegian study, the patients were much younger with a mean age of
30 years, which explains the higher employment rate. (Gronning et al. 1990)
This was a retrospective study and data for the study were taken from the
medical notes of all patients with MS registered with the neurology service of
a district hospital in northern Norway. Older patients, and those with
progressive MS, were most at risk of becoming unemployed.

These three studies are limited by only including patients attending hospital
services. People with MS who were not registered with the hospital, either
because they were not in need of neurological services or because they
received their care at other facilities would not have been sampled in these
surveys. Later studies have used community-based surveys to increase the
cohort of patients sampled.
Two of these community-based studies involved postal questionnaires. The
first, Jackson’s 1991 study of unemployment amongst members of the
Vancouver Island MS Society in Canada, had a 51.6% response rate to a
single postal questionnaire. (Jackson etal. 1991) The authors note that,
although they followed Dillman’s advice on the design of the questionnaire
itself, (Dillman 1978) the study’s funding permitted only one questionnaire
mailing. Mobility, fatigue and access at the workplace were identified by
patients as having the greatest impact on their ability to work.
The second community-based study to use postal questionnaires selected
participants at random from the membership of the Ontario MS Society.
(Aronson 1997) There was an 83% response rate from 845 people with MS
initially contacted. Fatigue and mobility problems were again reported to be
the greatest barriers to work.
In the final study, from Northern Ireland, all of the patients had primary
progressive MS. (McDonnell and Hawkins 1998) Patients were recruited to

the study as part of a larger epidemiological study of MS in the region. One
neurologist interviewed and examined all patients and recorded employment
status. Mean Expanded Disability Status Scale (EDSS) score in patients in
this group was higher than that recorded for patients in the study by Larocca
et al, and patients were older than in the other studies, which may explain
the lower employment rate.
Other studies have reported increased unemployment in association with
higher disability. (Hammond et al. 1996) Longer duration of MS is also
related to unemployment, which is likely to be due to the accumulation of
disability over time. (Jacobs et al. 1999) These findings were confirmed in a
prospective study of risk factors for unemployment in a cohort of Canadian
patients of working age who were followed up over a two-year period.
(Busche et al. 2003) The authors found that employment fell from 51.1% at
baseline to 40.6% at follow-up. Patients at greatest risk of becoming
unemployed were older, had progressive MS, greater disability and longer
duration of MS. The authors recommended targeting interventions to those
patients at greatest risk of unemployment to improve their chances of
remaining in work.
These studies have documented the impact that impaired mobility and
balance, bladder and bowel dysfunction, and fatigue have on patients’ ability
to remain in work. MS can also have a profound effect on cognitive ability. A
study of cognition in patients with MS reported that cognitive impairment, in
particular problems with planning and executive dysfunction, was an
independent risk factor for unemployment. (Rao et al. 1991) This increased
risk is independent of the patients’ physical impairments. Rao et al. have
suggested that neuropsychological testing can facilitate work retention by
allowing appropriate adaptations in the workplace.
A more insidious barrier to employment in patients with MS is the attitudes of
their employers and co-workers. This has been reported by patients as
subtle prejudice, in spite of legislation, such as the Americans with
Disabilities Act, designed to prevent discrimination against people with
disabilities. (O'Day 1998) Patients in O’Day’s study reported that work
colleagues would comment unfavourably on their unsteadiness or slurred
speech, implying that they were drunk. Other patients reported that their
managers misinterpreted repeated toilet breaks, due to urinary frequency, as
laziness.
While identifying the factors relating to difficulties in work retention is
important, it is necessary to quantify them as well, in order to gauge the
extent of the problem and to plan interventions to alleviate barriers to work. A
number of authors have attempted to develop questionnaires to measure
these factors, which are outlined in the next section.
Generic work impact measures: These have been developed to examine
the relationship between health status and ability to work. The measures

were designed to be used in any sample of workers, irrespective of the
nature of their employment or their illness. The first generic work impact
questionnaire to be published, the Work Productivity and Activity Impairment
measure, aimed to quantify the effect of illness on patients’ ability to perform
their work roles. (Reilly et al. 1993) It was administered as a self-report
questionnaire and demonstrated good test-retest reliability and construct
validity.
The Work Limitations Questionnaire was developed using psychometric
methods to measure the impact of chronic health problems on work. (Lerner
et al. 2001) The patients that were included in the group from which the
items for the questionnaire were generated had a range of chronic medical
conditions including asthma, inflammatory bowel disease, depression and
epilepsy. The final 25-item measure had high internal consistency, test-retest
reliability and construct validity.
Other questionnaires, such as the Work Productivity Short Inventory,
(Goetzel et al. 2003) and the Health and Work Performance Questionnaire
(Kessler et al. 2003) have attempted to establish the economic impact of
chronic illness on the employer. These two instruments were specifically
designed to measure the cost to the employer of chronic illness related
reduced work ability. They have not been used to measure the impact of
chronic illness on an individual’s ability to work.
145

None of these measures had any items that pe rta in specifically to the impact
of neurological illness. This is not surprising as, overall, people with a
neurological condition form only a small part o f th e total population that is
unable to work because of health related problems. Information from the
Department of Social Security in the UK indicates that five percent of
incapacity benefit claimants have a neurological condition; of whom 14%
have MS. (British Society of Rehabilitation M edicine 2000) Musculoskeletal
(28%) and psychological (20%) conditions are th e most common medical
reasons for patients to claim incapacity benefit. Therefore, a generic
questionnaire dealing with health related ability to work would primarily have
to concentrate on these two areas in order to h a ve the greatest content
validity.
Disease-specific work impact measures: A number of disease-specific
work impact questionnaires have been published. These have been
developed to examine the relationship between a specific medical condition
and patients’ ability to perform their work. Examples include the Work
Instability Scale for patients with rheumatoid arthritis, (Gilworth et al. 2003)
and the Fear Avoidance Beliefs Questionnaire-Work for patients with chronic
pain. (Ciccone and Just 2001) As musculoskeletal problems and chronic pain
are amongst the most common medical reasons for patients to become
unemployed, it is not surprising that these issues have been addressed in
disease-specific measures.
146

There has only been one report of an MS and employment specific
questionnaire in the literature - the Work Assessment Scale (WAS). (Gulick
1991) This is a 52-item questionnaire that asks patients with MS to rate items
that may impede or enhance their ability to work. It demonstrates adequate
internal consistency but other forms of reliability and acceptability were not
tested. Convergent validity was established between the WAS and the
Activities of Daily Living Self-Care Scale (MS). The author does not present
any responsiveness data. The WAS has not been used in any subsequent
publications.
To measure the impact of MS on patients’ ability to retain work, the following
study was undertaken. The first phase was a qualitative study that aimed to
identify the areas that impact on work retention in patients with MS. The aim
of the second part was to quantify the physical, psychological and social
factors affecting work retention in a cross-sectional sample of patients with
MS, based on the information collected in the first phase.
The Joint Research Ethics Committee of the National Hospital for Neurology
and Neurosurgery and the Institute of Neurology approved the study. All
patients gave their informed written consent.

4.2 Qualitative Study
4.2.1 Methods
All patients with clinically definite MS, attending the National Hospital for
Neurology and Neurosurgery, aged 18 to 65 years, were eligible to
participate in the study. Patients were recruited from an MS outpatient clinic
and the inpatient rehabilitation unit of the hospital to ensure a wide age
range, duration of MS, and range of disabilities.
Patients were asked about their MS, their experiences of employment and
their social circumstances. This interview was supplemented by completion
of a questionnaire comprising open-ended questions regarding the effect that
MS had on ability to remain at work. Demographic information was obtained
during the patient interview and from the medical notes. The results of
patient interviews and questionnaires were entered into a database and
content analysed. Areas relating to work retention were identified.
4.2.2 Results
Sample: Sixty-two patients participated in the first phase of this study. Fifty-
three patients were attending outpatient clinics and nine were inpatients in
the NRU who had been admitted from home for a short period of inpatient
rehabilitation. The mean age of the patients was 46 years and ranged from
19 to 65. Forty patients (65%) were female. All patients had clinically definite
148
MS with a mean duration of 12 years (range one to 43 years). Twenty-four
patients (39%) were employed at the time of the interview.
The open-ended items of the questionnaire generated a list of problems that
the patients found impacted on work retention. These problems could be
divided into those relating to: the person and their disease; and societal and
employment environments. The two themes can be illustrated by examples
from the questionnaire.
The person and their disease: Patients often described a particular
problem that had a major impact on their ability to remain in work and that
concerned them a great deal. For example, a 49-year-old woman with MS for
19 years who had recently become unemployed from an office job stated:
“This illness has devastated my life and the way I deal with things. My main concern is my bladder problems.”
At times, a specific problem was cited as creating difficulty with work
retention, such as poor vision or ataxia, which impacted on the ability to use
particular equipment. For example, a 48-year-old female who had worked as
a civil servant commented on her ability to use the mouse of a computer:
“I would have liked to work 10 to 12 hours a week, but my hand-eye co-ordination was too poor.”
At other times, it was a symptom of MS that impacted on all activities, both in
work and at home. For example, this 45-year-old male patient with MS for 13
years had worked as a social worker until five years ago:
“Normal daily things take so long unfortunately. I get very fatigued very quickly.”
149

By contrast, other patients reported having flexible working environments
that allowed them to take time-off if they were unwell. For example, one
patient was able to work from home on days that he was particularly
fatigued. Fatigue could lead onto other problems with work retention, such as
depression or anxiety, as well as being an issue in itself. This is illustrated by
a 42-year-old female’s comment:
“I feel very tired in the afternoons. I feel a burden on people in work.”
Societal and employment environments: The difficulties identified most
were travelling to and from work, and access at work. This is highlighted by a
42-year-old male quantity surveyor with MS for 12 years who commented on
the effect that reduced ability to perform physical tasks had in his particular
work environment:
“My concern revolves around my ability to undertake certain tasks such as walking, climbing ladders and stairs. I therefore need to learn to delegate to others and am slowly coming to terms with this.”
Another example comes from a 48-year-old female patient with MS for 15
years who related that, after the last relapse that resulted in her having to
use a wheelchair to mobilise in the community, she was unable to return to
work because of access problems:
“I did try to resume work, but was told I couldn’t, as the wheelchair couldn’t be lifted up four steps to get in.”
Other patients found the travelling to and from work was too difficult, even if
they had access to private transport. For example, a 51-year-old solicitor
who had MS for eight years stated:
“I travel by minicab as I can’t use public transport so I only go to the office twice a week.”
Even using adaptive equipment may not be a completely satisfactory solution
to these problems. For example, a 54-year-old male architect reported that
he found it increasingly difficult to use voice-activated software, and in order
to retain his work, he now required a support worker, who was funded by the
Access to Work scheme.
The areas relating to the person and their disease, and societal and
employment environments were grouped into a one page, self-report
questionnaire (Appendix 4). These items were supplemented by additional
themes from work and MS related articles identified by a search of Medline
from 1966 to 2003 and Web of Science from 1981 to 2003. The items could
be represented with the common stem “how much does the following impact
on your work”, with a five-point response option scale. (Streiner and Norman
1995) This adjectival scale rated the impact of each item - from no impact
(one) to extreme impact (five). With this measure, scores can range from 17
to 85; higher scores indicate greater impact of MS on work retention.
4.3 Quantitative Study
This section describes the methods of the second part of the study. The main
aim of this part of the study was to quantitatively evaluate the impact of MS
on work retention. The impact on work questionnaire, as outlined in the
previous section, was used in this study to measure the impact of MS.
Measures of physical function (self-report Barthel index) and emotional
wellbeing (GHQ-28) were also recorded to relate work retention issues to
151

these factors. As a secondary aim, the psychometric properties of the impact
on work questionnaire were studied.
4.3.1 Methods
Sample: One hundred patients with clinically definite MS, aged 18 to 65
years, attending an MS outpatient clinic, were invited to participate.
Demographic data, including type and duration of MS, were recorded for
each patient.
Outcome measures: Each patient was asked to complete a questionnaire
booklet that contained the impact on work questionnaire and questions on
employment status, previous or current occupation and sources of advice
that the patient had accessed. The design of the booklet was based on
Dillman’s “Total Design Method”, as outlined in Chapter 1, to ensure the
greatest response rate. (Dillman 1978) The booklet also included the self-
report Barthel index and the GHQ-28 to record physical function and
emotional wellbeing, as described in the previous Chapter. Patients were
also encouraged to add any further information they wished to contribute in a
comment box in each booklet. In addition, the Expanded Disability Status
Scale (EDSS), a clinician rated MS disability measure, was recorded for
each patient to allow comparison of the patients in this study with other
studies. (Kurtzke 1983)

Statistical methods: Summary statistics were examined for the group as a
whole, and subgroup analyses were performed for employed and
unemployed patients. The demographic data - age and duration of MS -
were compared using independent f-tests, as were the Barthel index, GHQ-
28 and EDSS scores. The scores for the items of the impact on work
questionnaire were summated and also compared using parametric
statistics.
Psychometric methods: The items of the impact on work questionnaire
were tested for patient acceptability by calculating percentage missing data.
Acceptability was also evaluated by determining scale and item means,
standard deviations, and endorsement frequencies for each response option
of the rating scale.
To determine reliability, the items of the questionnaire were first entered into
a factor analysis of principal components to extract the factors that might
explain the constructs measured by the scale. Solutions with Eigenvalues
greater than one were chosen in order to select the number of factors to
rotate in varimax principal axis factoring. (Staquet et al. 1998) This technique
reduces the amount of variance in each factor by including only the smallest
possible number of items in each factor. Principal axis factoring rotation was
performed for each of the potential solutions suggested by principal
component analysis. Each rotated solution was then examined for items that

loaded with each other by more than 0.40 to develop subscales of the
questionnaire.
It was assumed that each subscale would measure a distinct but related
construct of the impact that MS has on work retention. To examine how well
each subscale measured a particular construct, the internal consistency of
the subscales were calculated using Cronbach’s alpha coefficient and item-
total correlations. Alpha values should be greater than 0.70 and item-total
correlations should be greater than 0.20 to support the internal consistency
of the subscale. (Streiner and Norman 1995)
Validity was studied to ensure that the questionnaire measured the construct
it purported to measure. Construct validity was measured using Pearson’s
correlation coefficients between the questionnaire’s subscales and other
variables. It was expected that the subscales of the questionnaire would
correlate moderately with each other (r = 0.30 to r = 0.70). It was also
expected that there would be moderate correlations between the subscales
and the measures of physical disability (EDSS, Barthel index) and emotional
wellbeing (GHQ-28). While these instruments measure specific constructs in
MS, they will not fully explain the impact of MS on work retention. Given that
the questionnaire was designed to be a measure of the impact of MS on
work retention, unemployed patients were expected to have higher scores
than employed patients.

4.3.2 Results
Sample: One hundred patients participated in the cross-sectional study: 36
were employed and 64 were unemployed. The patients’ demographics are
presented in Table 4.2. Results of demographic data and outcome measure
scores are compared between employed and unemployed groups using
independent sample Mests, and the level of statistical significance is
included.
Outcome measures: In this sample, the patients who were unemployed
were older, had a longer duration of MS, and lower Barthel index scores and
had higher EDSS scores (both indicating greater physical disability) than
patients in work. There were significantly more patients with secondary
progressive MS in the unemployed group. There was no difference in scores
for emotional wellbeing on the GHQ-28 between the two groups.

Table 4.2 Demographics of patients in quantitative study
Variable (SD; range) Employed Unemployed Significano
Number 36 64
Age 45 (8; 27 - 59) 49(10; 20-65) p < 0.05
Female (%) 25 (69%) 50 (78%) NS
Type of MS
Primary progressive MS 7 8
Relapsing-remitting MS 14 12
Secondary progressive MS 13 44 p < 0.05
Duration of MS 10(7; 0 -2 2 ) 15(8; 1 -43) p<0.01
EDSS 5.7 (1.8; 1.5-8.0) 6.8 (1.6; 1.0-9.0) p<0.01
Self-report Barthel index 17 (4; 1 -20) 12 (5; 1 -20) p < 0.01
GHQ-28 score 6 (7; 0 - 23) 5 (6; 0 - 25) NS
GHQ-28 depression case (%) 17 (47%) 24 (37%) NS
Impact on work questionnaire 43(14; 25 -69) 48(12;26-71) p = 0.07
Twenty-four employed patients reported that MS affected their ability to
remain in work. Of the 12 who felt that it did not currently affect their ability to
remain in work, four felt that it might impact in the future. Forty-three
unemployed patients stated that they had left work as a direct consequence
of MS. The other patients either took early retirement or left work to look after
children. Whether MS influenced these patients’ decisions was not recorded.
Thirty-three of the unemployed patients expressed a desire to return to work
if this was possible.
156

Only 20 patients reported receiving advice on work retention (Table 4.3).
Most patients in this group felt that they benefited from talking to hospital
occupational therapists about their employment issues. The four patients
who spoke to disability employment advisers in Jobcentres stated that they
found their advice of limited help. No patient reported receiving employment
advice from a community-based therapist, a rehabilitation physician or a
neurologist.
Twenty-three employed patients and 13 unemployed patients recorded that
they would like to receive advice on work retention (Table 4.3). This group of
patients included some of those who had received advice before and found it
of limited help.
Table 4.3 Impact of MS on work retention
Employment status Employed Unemployed
Total number of patients 36 64
MS affects ability to work (%)
MS will affect work in the future (%)
Left work due to effects of MS (%)
Would like to return to work (%)
24 (67%)
4(11%)
43 (67%)
33 (52%)
Sources of advice on work retention
Hospital occupational therapist
Jobcentre
Other patients with MS
Would like advice on work retention (%)
51
1
23 (64%)
7
3
3
13 (20%)
157

All patients in the cross-sectional study had been in employment or full-time
education at the time of diagnosis of MS. At the time of the survey,
unemployed patients had longer durations of illness than employed patients.
Figure 4.1 illustrates the effect of increasing duration of MS on patients’
ability to remain in work. Unemployment occurred within the first year after
diagnosis for some patients and increased steadily with increasing duration
of MS.
Figure 4.1 Duration of MS and work retention
TD<DOCl
E<D
(/)00c(1)CDCL
Ocot r oQ .o
CL
0.045402520
Duration of MS (years)
158

Impact on work questionnaire: Working and unemployed patients reported
similar levels of difficulty in work retention as measured by the questionnaire.
Using the work impact questionnaire, patients identified the areas that most
impacted on their ability to work (Table 4.4). Six items were identified by
more than 25% of patients as having a large impact on their ability to work.
Four of these areas related to the direct effects of MS: handwriting (26%),
fatigue (28%), balance (40%) and walking difficulties (45%). Two areas
related to the impact of societal and employment environments, access at
work (39%) and travel to and from work (48%).
159

Table 4.4 Endorsement frequency: impact on work questionnaire
Item Percentage of patients
Not at all A little Moderately Quite a bit Extremely
Fatigue 6.2 12.4 22.7 30.9 27.8Balance 15.2 17.2 11.1 16.2 40.4
Walking difficulties 10.3 9.3 11.3 23.7 45.4
Visual problems 40.8 23.5 9.2 14.3 12.2
Weakness 7.1 25.3 26.3 26.3 15.2
Handwriting 24.2 12.1 10.1 27.3 26.3
Pain 38.4 25.3 11.1 16.2 9.1
Coordination 21.2 25.3 24.2 18.2 11.1
Speech 65.7 15.2 7.1 7.1 5.1
Swallowing 74.7 16.2 6.1 2.0 1.0
Continence 23.2 32.3 14.1 16.2 14.1
Concentration 26.8 39.2 11.3 16.5 6.2
Memory 36.7 31.6 13.3 12.2 6.1
Mood 37.8 26.5 24.5 10.2 1.0
Travel to work 11.6 13.7 15.8 10.5 48.4
Access at work 12.5 20.8 9.4 18.8 38.5
Public attitudes 36.7 22.4 16.3 16.3 8.2
160

Psychometric analysis: There was a low proportion of missing data for all
items of the impact on work questionnaire suggesting that all of the items
were acceptable to patients (Table 4.5). Examination of scale and item
means, standard deviations and item endorsement frequencies showed that
responses were generally well distributed across all response categories.
Table 4.5 Acceptability: impact on work questionnaire
Environment scale Symptom scale
Items
Missing data 1% - 4%
Mean scores: range 1.38 - 3.85
SD: range 0.78-1.55
Floor effect: range 7.1% - 74.7%
Ceiling effect: range 1.0% - 48.4%
Subscales
Possible score range 5 - 4 0 5 - 45
Observed score range 8 - 3 7 14-44
Mean score (SD) 29.2(8.3) 17.0(6.9)
Floor/ceiling effect 0% / 0% 4% / 0%
Factor analysis indicated a two-factor solution: a symptom scale, comprising
items that referred to the person and their disease theme; and an
environment scale, that referred to items relating to mobility and access
(Table 4.6). Items loaded to one of the two factors by more than 0.40 for all
but two items - continence and pain. The values for these items were 0.359
and 0.397 respectively. As incontinence and pain are clinically important
symptoms in MS, it was felt that these two items should be retained in the
measure.
161

Table 4.6 Factor loading: impact on work questionnaire scales
Item
Environment scale
Walking difficulties
Balance
Access at work
Travel to work
Weakness
Public attitudes
Handwriting
Continence
Symptom scale
Concentration
Memory
Speech
Swallowing
Visual problems
Coordination
Mood
Pain
Fatigue
Environment scale Symptom scale
0.808
0.793
0.730
0.726
0.708
0.588
0.498
0.359
-0.095
0.104
0.131
0.090
0.316
0.047
0.337
0.285
0.152
0.169
0.137
0.148
0.040
0 406
-0.027
0 349
0.406
0.834
0.812
0.799
0.754
0.716
0.662
0.638
0.397
0.388
162

The two subscales of the impact on work questionnaire were then examined
for internal consistency by calculating Cronbach’s alpha coefficients and
item-total correlations (Table 4.7). The subscales met the criteria for both of
these tests indicating satisfactory internal consistency.
Table 4.7 Reliability: impact on work questionnaire
The intercorrelations between the total and subscale scores of the impact on
work questionnaire are presented in Table 4.8. All correlations are high
indicating that the questionnaire and its subscales are measuring related
constructs. The two subscales correlate moderately with each other
suggesting that they measure related but distinct constructs.
Correlations between the environment scale and the Barthel index and
EDSS index are moderate and correlations between the symptom scale and
the Barthel index and EDSS are low (Table 4.8). There is a low correlation
between the environment scale and the GHQ-28. Age is not correlated with
either subscale. These results provide evidence of convergent and
discriminant validity.
Environment scale Symptom scale
Reliability
Cronbach’s alpha
Item-total correlations: range
0.84
0.354 - 0.693
0.87
0.420 - 0.729
163

Table 4.8 Intercorrelations between questionnaire scales
Variable Environment scale Symptom scale
Total score 0.891 0.841
Environment scale 0.504
EDSS 0.403 0.104
Barthel index -0.395 -0.151
GHQ-28 0.135 0.256
Age 0.116 -0.144
When the scores for the environment and symptom scales were examined, a
statistically significant difference was noted between working and
unemployed patients on the environment scale: 45 and 62 respectively (p
<0.001). There was no statistical difference between the groups of patients
on the symptom scale: 30 and 27 respectively. This result provides evidence
of group differences construct validity of the environment scale.
4.4 Discussion
4.4.1 Summary of Results
For the patients with MS in this study, work represents an important social
role that they enjoy and wish to engage in for as long as possible. Three
factors were elucidated to explain the impact of MS on work retention. The
first is the pervasive effect that MS has on patients’ ability to retain work. The
second is the interaction between patients’ physical limitations and barriers in
the environment, either an inaccessible workplace or the lack of suitable

transport. The third is the impact of poor vocational support on patients’
ability to find solutions to work retention issues.
The first of these factors, the effects of the disease process, varied in its
impact on work retention. Some symptoms of MS, for example, balance or
walking difficulties had a large impact on work retention. Others, such as
mood or memory, had a much smaller impact. These results are similar to
those seen in two studies of community-based populations of patients with
MS in North America. (Gulick et al. 1989; Jackson et al. 1991) No other
authors have looked at specific impairments impacting on work retention.
This study found that increasing age, longer duration of MS and accrual of
disability are associated with increased difficulties in retaining work. These
results are similar to those found in studies from other centres in Europe and
North America. (Gronning et al. 1990, Larocca et al. 1985, Poser et al. 1981)
Patients in this study with secondary progressive MS, as in other studies,
were also more likely to be unemployed. (Jacobs et al. 1999)
The second factor was the interaction between limitations in patients’
physical ability and barriers in the environment, such as travelling to work
and accessing it once there. Patients in Gulick’s study reported that the
combination of limitations in walking, standing and balance, and physical
barriers in the environment, had the greatest impact on their ability to work.
(Gulick et al. 1989) Other studies have also explored the work environment
165
in job retention. Twenty percent of the patients in the study by Jackson
identified inaccessible toilets as having a large impact on their ability to
remain in work. (Jackson et al. 1991) In this study, the continence item
loaded with the environment scale on factor analysis, indicating that
incontinence may not be a work limiting problem as such, except when
accessible toilet facilities are not available.
Conversely, an accessible environment, with appropriate adaptations and a
flexible work pattern can assist patients in remaining in work. A case-
controlled study of protective factors in work retention identified that
sedentary jobs, where the patient was able to do his or her work in a sitting
position, were the jobs most likely to be retained by people with MS.
(Verdier-Taillefer et al. 1995) Gulick’s study also described conditions that
enhanced the ability to remain in work including adaptive aids, intermittent
rest periods and the ability to pace one’s work. (Gulick et al. 1989)
The third factor was the availability of good vocational support. Only 20% of
patients in this study had received any advice on work retention. Most of this
advice had been given by hospital occupational therapists. The lack of
assistance from statutory employment agencies has been reported in other
studies. Patients in the study by O’Day described a lack of understanding for
the needs of patients with MS from vocational rehabilitation officers. (O'Day
1998) Frequently, however, patients are not referred to any vocational
rehabilitation service, even if the assistance offered is less than optimum.

(Roessler and Rumrill, Jr. 2003) The support required by patients can often
be minimal, generally comprising the ability to take rests or installing
adaptive aids in the workplace. (Gulick et al. 1989)
This is the first study in the UK to explore the issues surrounding work
retention in patients with MS. A combination of MS-related problems,
environmental and travel restrictions, and lack of vocational support impact
on work retention.
4.4.2 Study Strengths and Limitations
This study included patients with a wide age range, representative of the
population of adults of working age. There were more females than males,
as expected in a cohort of patients with MS. All subtypes of MS were
represented and there was a wide range of duration of MS. Patients in this
study had similar demographic and disease characteristics to those in the
other studies on work and MS outlined above. This supports the
generalisability of these results.
This study is limited, however, by only recruiting patients who were attending
the NHNN. This study did not include patients who had no contact with
hospital services. This may bias the results by including patients with greater
disability. Furthermore, patients in this study all lived in the Greater London
area. This might have biased their opinion of the impact of travel on their
167

ability to remain in work. Lack of parking facilities and inaccessible public
transport are two problems encountered by all patients with MS in any large
urban area.
With respect to the data collection, this was a cross-sectional study, so it was
not possible to determine the impact of the various factors that impacted on
work retention over time. Factors leading to problems in work retention have
been studied by other authors, who have established that the most important
determinants of loss of work are increasing disability and older age. (Busche
et al. 2003)
Finally, due to the cross-sectional design of this study, it was not possible to
study the test-retest reliability or responsiveness of the impact on work
questionnaire. These properties remain to be tested.
4.4.3 Implications for Clinical Practice
These results have important implications for the management of patients
with MS. As seen in other studies, patients with MS have difficulty with work
retention. There are three areas that clinicians need to address to assist
patients with MS in remaining in work.
Firstly, work retention is significantly affected by impairments caused by MS,
particularly mobility and fatigue. Appropriate management by outpatient and
168

community multidisciplinary teams, but including if necessary a period of
inpatient rehabilitation, has a role to play in reducing the impact of MS-
related impairments. Both the physical (Busche et al. 2003) and the cognitive
impairments of MS (Rao et al. 1991) need to be addressed for a
comprehensive approach towards work retention.
In this study, loss of work occurred soon after diagnosis for some patients,
indicating the importance of implementing work retention strategies
immediately after diagnosis. As MS can be a fluctuating illness initially, it is
crucial that patients are able to take sick leave during relapses, with support
to return to work as soon as is feasible. This has been shown to be
protective in work retention studies. (Verdier-Taillefer et al. 1995) With
progressive forms of MS, work retention strategies need to be flexible to
adapt to the changing needs of the patient with MS.
The impairments caused by MS become limitations on participation in work
when they impact on a patient’s ability to travel to and from work, access the
workplace and have access to a suitable toilet. This leads onto the second
area that clinicians need to address. Mobility was identified as having a large
impact on work retention, so rehabilitation to improve walking, or prescribing
an appropriate mobility aid may improve work retention. Providing a suitable
work environment that is accessible and has appropriate equipment is the
remit of Jobcentre Plus in the UK. Unfortunately, patients in this study had
169

very little contact with Jobcentre Plus, or its predecessor, the Disability
Employment Agency.
Thirdly, as studies have shown that vocational services can be unresponsive
to the needs of patients with MS, clinicians need to work closely with these
services to improve their interactions with patients. (O'Day 1998) Improving
the link between clinicians and vocational services is a key element in
Government strategy to reduce the number of people on incapacity benefit in
the UK (Secretary of State for Work and Pensions 2002)
These three areas lend themselves to collaboration between clinicians,
working in a multidisciplinary team with occupational therapists and
physiotherapists, and disability employment advisers in Jobcentre Plus. A
model of vocational rehabilitation could be adopted from examples of good
practice in low back pain or traumatic brain injury. (Bendix et al. 1998;
Wehman et al. 2003) These services comprise a multidisciplinary team that
includes an occupational psychologist. They offer a range of services that
includes “job-coaching", or on-the-job support, to facilitate the incorporation
of work retention strategies and adaptive equipment into a patients’
workplace.
170

4 .4.4 Conclusion
This study represents the next step in the patients’ journey from acute
neurological illness to recovery - return to work. This study outlines how
patients with MS need both good medical management and vocational
rehabilitation to reduce the impact that MS has on work retention. This study
has also shown that the impact of MS on work retention can measured using
a short questionnaire.
171

Chapter 5 Conclusion

5.1 Summary of Findings
Neurological rehabilitation is a complex intervention requiring significant
healthcare resources and considerable involvement of patients, their families
and carers. It is incumbent upon rehabilitation teams to employ the most
effective interventions to enable patients with neurological conditions to live
as independently as possible. Measuring outcome is the first step in
determining the effectiveness of an intervention. The measures used for
evaluating outcomes must be clinically relevant and scientifically sound. In
particular, outcome measures used to evaluate interventions must be
responsive. Because of the importance of responsiveness, specific attention
was paid to it in this Thesis.
This Thesis has addressed three objectives, which are important points on
the journey of a patient from the onset of neurological illness, through
rehabilitation and into the community. The first experience of outcome
measurement for many patients with disability due to neurological illness is
on admission to a rehabilitation unit. Therefore, the first objective was to
comprehensively examine the responsiveness of two outcome measures
commonly used in neurological rehabilitation, the Barthel index and the FIM.
This study included a comparison of the responsiveness of these measures
in MS, stroke and spinal cord injury.
There is considerable evidence that a period of inpatient rehabilitation
improves physical function and emotional wellbeing, but relatively few

studies have examined the long-term outcome of patients after discharge.
The second objective of the Thesis was to evaluate the effect of neurological
rehabilitation on these parameters, and to determine if this effect endured
after discharge. This study incorporated an assessment of the psychometric
properties of the self-report Barthel index, General Health Questionnaire and
Hospital Anxiety and Depression Scale.
The next stage on the journey towards recovery for many patients is their
return to employment. This is influenced by a variety of physical,
psychological and environmental issues. The third objective of this Thesis
was to investigate the impact of neurological illness on the ability of patients
with MS to remain in work. This study also involved the development and
psychometric testing of an outcome measure to quantify the impact of a
patient’s illness and work environment on his or her ability to remain in work.
Examining the responsiveness of the Barthel index and FIM demonstrated
that the total scores are responsive. However, item responsiveness varies
and is limited by item floor and ceiling effects. Floor effects indicate that there
were patients who might have improved more than the item detected. Ceiling
effects represent patients who could not improve their score, irrespective of
any clinical improvement, as they had already attained the highest score
possible. Differential responsiveness was also seen between MS, stroke and
spinal cord injury. Therefore, total score responsiveness needs to be
interpreted with caution as the total score may be an underestimate of the
174

overall effectiveness of neurological rehabilitation. These findings emphasise
the importance of targeting the range of measurement of a scale to the
patients being measured.
The second investigation, a prospective, observational study, supported the
view that physical function and emotional wellbeing are improved in patients
with acute and chronic neurological conditions, by inpatient multidisciplinary
rehabilitation. Following discharge, the improvements in physical function are
maintained, but emotional wellbeing deteriorates. This study also
demonstrated that the self-report Barthel index, the GHQ-28 and HADS are
acceptable, reliable, valid and responsive measures in neurological
rehabilitation.
Lastly, three factors were found to impact on work retention; the effects of
MS, difficulties within the workplace environment, and poor vocational
support. These three factors are interrelated, and their effects could be
mitigated by closer collaboration between health and vocational services.
The Work Impact Questionnaire demonstrated good acceptability, reliability
and validity.
5.2 Implications for Rehabilitation Research
The individual studies that comprise this Thesis have used a combination of
clinician rated and patient based outcome measures. These outcome
175

measures have facilitated retrospective, prospective and cross-sectional
evaluations of the rehabilitation process. The findings of this Thesis can be
used as a basis to plan further research into neurological rehabilitation
interventions, and to refine the use of outcome measures in rehabilitation
studies. This section will consider the points raised by this Thesis with regard
to the use of patient based outcome measures in rehabilitation studies,
questionnaire administration, and the psychometric factors relevant to
outcome measurement.
There is an important conceptual issue in using patient based outcome
measures to evaluate rehabilitation outcome. As discussed in Chapter 1,
seeking patients’ opinion on their health status is increasingly emphasised in
healthcare. (Wilson and Cleary 1995; Higginson and Carr 2001) Using
patient based outcome measures, particularly those concerned with health
related quality of life, improves the ability of a trial to detect a clinically
significant difference, as patients will report changes that may not be
determined by clinician rated measures. For instance, the GHQ-28 and
HADS were shown to be clinically useful, as well as responsive, in detecting
significant changes in patients in rehabilitation. Trials of rehabilitation
interventions could include these measures to gain a more comprehensive
picture of the impact of rehabilitation on the psychological aspect of
neurological illness. Many authors recommend sampling a number of health
constructs in trials to fully understand the effect of the intervention. (Bergner
and Rothman 1987; Ware, Jr. 1987) This Thesis has shown that this can be
176

achieved for inpatient (Chapter 3) and community samples (Chapter 4) using
self-report questionnaires.
Furthermore, outcome measures of physical function and emotional
wellbeing can be used successfully in cross-sectional, and longitudinal or
evaluative studies, with satisfactory patient recruitment and retention.
Patients with restricted ability to travel due to neurological illness find it
difficult to attend hospitals to participate in trials; gathering information using
postal questionnaires could be a potential alternative to bringing patients to
hospital to score clinician rated scales. There is also a cost advantage in
postal outcome measures over the alternative of requiring clinicians to travel
to patients’ homes to complete outcome measures.
To put this into perspective, in Chapter 2, 93% of patients had a complete set
of clinician rated outcome measures at discharge. In Chapter 3, there was a
93% response rate to a set of patient based outcome measures completed
three months after discharge and returned by post to the hospital. Whilst
these are very different scenarios, a retrospective audit and a prospective
observational study, it does demonstrate the ability of postal patient based
outcome measures to gather useful data from a sample of patients with
restricted mobility. The utility of postal questionnaires should be considered
when planning a study that requires patients to be followed-up over an
extended period of time in the community.
177

Response rates to questionnaires are enhanced when patients find them
acceptable. Measuring patients’ opinions in healthcare evaluation is
important, but an inappropriate patient based outcome measure can be
worse than none at all, as measures with poor acceptability to patients can
cause emotional distress in vulnerable individuals. (Evans et al. 2002)
Statistical acceptability is also a key factor in outcome measurement, but is
rarely discussed in relation to a particular instrument. When selecting a
measure for use in a trial, careful consideration should be given to choosing
one that has been tested in a sample with similar characteristics to the
sample in the proposed study. This will ensure that floor and ceiling effects
are minimised, reducing the possibility of a false negative effect.
Content validity should also be considered when selecting an outcome
measure to use in a clinical trial. In Chapter 4, it was demonstrated that
standard measures of physical function and emotional wellbeing were not
sufficient to describe the impact of MS on work retention. Patients’ responses
to an open questionnaire described issues that related to a variety of issues,
including community mobility, accessible toilets, and fatigue, which were not
included in the standardised measures. Development of a bespoke
questionnaire allowed these constructs to be measured. This does not imply
that a new outcome measure should be developed whenever a study or trial
is being considered. Organisers of trials should carefully evaluate available

outcome measures, and select those that accurately reflect the construct to
be measured.
The responsiveness of the total scores of the clinician rated Barthel index
and FIM has been discussed in Chapter 2. Although it was already known
that these measures were responsive in MS and stroke rehabilitation
(Sharrack et al. 1999; van der Putten et al. 1999), the analyses in this Thesis
have refined the recommendations for their use. The limitations on the
measures’ responsiveness must be borne in mind if the Barthel index and
FIM are to be used in trials of neurological rehabilitation. Essentially, this
means that the measure used should match the level of disability in the
sample to be studied. This study has also shown that the Barthel index and
FIM are more responsive in stroke and spinal cord injury than in MS. This
means that if evaluating an intervention in patients with MS, consideration
should be given to using a more responsive measure, such as the MSIS-29.
(Hobart et al. 2001a)
Knowing the responsiveness of a measure can facilitate planning studies
using the criteria set out by Cohen. (Cohen 1992) This ensures that optimum
sample sizes are selected, without recruiting fewer patients than would give
a clinically significant result, or more patients than is necessary. (Briggs
2000)
179

Considering the points raised by the studies in this Thesis, it is advisable to
obtain as much information as possible about a measure, and how it should
be administered, before using it in a trial of a rehabilitation intervention. It
would be important to review previous studies utilising the measure,
psychometric studies, and head-to-head comparisons of the measure with
other instruments.
5.3 Future Directions
The previous section has outlined how using appropriate outcome measures
with satisfactory psychometric properties in properly designed trials can
improve the evidence base of rehabilitation practice. Rehabilitation has a
short history as a distinct medical speciality compared to other fields, but it is
evolving rapidly. Outcome measurement has been closely associated with
rehabilitation and considerable progress has been achieved in some areas,
for instance, the development and promotion of the FIM as a universal
outcome measure, but more work is required. This section explores what
additional investigations need to be done to improve rehabilitation practice
and further the scientific measurement of rehabilitation outcomes as a result
of the studies in this Thesis.
An important finding of this Thesis has been the changes in emotional
wellbeing that patients experience at different points in their rehabilitation
programme. Most authors examining health related quality of life in patients
with neurological conditions have focused on patients recently diagnosed

with a particular illness. A smaller proportion of studies has evaluated the
impact of rehabilitation on quality of life and even fewer has looked at
patients’ wellbeing after discharge. Further studies are required to consider
this critical area, to ensure that anxiety and depression do not impede
patients’ recovery.
Future work should examine the factors that lead to the deterioration in
psychological functioning that accompanies discharge into the community
from rehabilitation programmes. In particular, provision of community based
rehabilitation should be enhanced. There is evidence that community
services for people with chronic disability are inadequate, with a significant
proportion of patients with moderate (39%) and severe disability (12%) not
having access to any community nursing or therapy support. (Freeman and
Thompson 2000) Several studies have demonstrated the effectiveness of
community rehabilitation in improving physical functioning and emotional
wellbeing in MS, (Wiles et al. 2001) stroke, (Andersen et al. 2002) and
Parkinson’s disease. (Trend et al. 2002) However, the evidence base for
community rehabilitation should be enhanced by further studies of outpatient,
day-care and home-based rehabilitation programmes.
Irrespective of the availability of community rehabilitation, inpatient
rehabilitation units should adopt strategies to protect patients’ emotional
wellbeing after discharge. Emotional recovery is facilitated by ensuring that
patients have the necessary abilities to lead as independent life as possible
181

after discharge. (Kreutzer and Kolakowsky-Hayner 1999) Kreutzer’s study
describes the importance of providing patients with communication and
problem solving skills to maintain their emotional wellbeing, and this area
requires further evaluation to determine the optimum methods of enhancing
psychological functioning.
Participation in employment is another area highlighted in this Thesis that
should be explored by future investigations. Only patients with MS were
studied, but other patients with chronic neurological conditions will share
their experiences of trying to remain in work. The technique used in Chapter
4 could be adopted for other patient groups, including those who have had
an acute onset of disability and are trying to return to work.
The impact of chronic neurological illness on patients’ ability to work needs to
be examined in greater detail. Chapter 4 has outlined the three main factors
that impact on work retention - the symptoms of MS, accessible work and
transport, and vocational rehabilitation services. Each of these factors needs
to be addressed by the introduction of a range of services and a dedicated
work retention multidisciplinary team that includes personnel from the
Department of Work and Pensions. (Secretary of State for Work and
Pensions 2002) For each patient who is unable to remain in work due to the
impact of a chronic neurological condition, an individualised work retention
programme should be instituted. This may include adaptive equipment,

facilitation of skills in the workplace by occupational therapists, or time
management strategies by an occupational psychologist.
Work retention interventions should be assessed for effectiveness to improve
the evidence base for vocational rehabilitation programmes. The impact of
these interventions could be measured by patient based outcome measures,
or econometric instruments such as the Work Productivity Short Inventory,
(Goetzel et al. 2003) and the Health and Work Performance Questionnaire.
(Kessler et al. 2003) These last two instruments were specifically designed to
measure the cost to the employer of chronic health conditions and, in
combination with information regarding the patients’ perspective on work
ability, could be used to make a strong case for work retention strategies that
have demonstrated their effectiveness.
In neurological rehabilitation the Barthel index and the FIM are two of the
most commonly used clinician rated outcome measures. The study
described in Chapter 2 on the responsiveness of these measures was
performed on the outcomes recorded by one neurological rehabilitation unit
in London over a ten-year period. These analyses need to be performed on
data from rehabilitation units in other centres to confirm the results. It would
also be instructive to compare the differential item responsiveness of these
measures in other diagnostic subgroups, for instance, traumatic brain injury,
sub-arachnoid haemorrhage or Parkinson’s disease. Analysis of the
responsiveness of the Barthel index and FIM in these groups may reveal

other items that perform poorly and require attention when the measures are
being further refined. (Hobart et al. 2001b)
Good responsiveness of the Barthel index and FIM in stroke and SCI, and
the satisfactory properties of the self-report Barthel index, GHQ-28 and
HADS in rehabilitation (Chapter 3), means that these measures can be used
in randomised controlled trials (RCT) of rehabilitation interventions. Not all
rehabilitation units have the resources to perform trials of this calibre, but
many centres could perform observational studies to examine the effect of
rehabilitation practices in different settings. (Wade 1999b) Whilst RCTs are
the gold standard for all medical interventions, observational studies do have
a role to play. Observational studies have been used to identify areas
deserving of further study, to facilitate long-term follow-up of patients,
(possibly after unblinding after an RCT) and to study interventions already in
clinical practice, where their would be ethical problems in randomising
patients to a control group. (Black 1996)
The measures of emotional wellbeing, depression and anxiety used in
Chapters 3 and 4, the GHQ-28 and HADS, have had limited psychometric
evaluation in rehabilitation settings. As with the Barthel index and FIM, these
measures also need to be examined in other neurological rehabilitation
settings and with other patient groups. This large-scale collection of data
from patients in neurological rehabilitation could be facilitated by more
widespread use of outcome measurement data collection through the use of
integrated care pathways as discussed in Chapter 1. (Lowe 1998)
As the patient is the best placed person to evaluate an intervention, a patient
based outcome measure might be thought to be the best method of
recording that patient s evaluation of change. In most situations this would be
the case, but there are some patient groups in neurological rehabilitation
practice where the patient’s opinion of his or her health status is difficult to
ascertain successfully. For patients in vegetative or minimally responsive
states, for instance, or patients with profound communication or cognitive
impairments, obtaining the patient’s opinion presents substantial challenges.
The effect of cognitive impairment (memory, reasoning or attention), visual or
speech impairment, or the combination of these, on patients’ responses to
outcome measures has not been fully explored. Even patients with
neurological lesions that might not be considered to cause cognitive
impairment, such as brainstem haemorrhages or infarcts, can be
demonstrated to have reduced cognition. (Garrard et al. 2002) Trials that
include patients with these impairments need careful design, possibly with
consideration of the use of patient proxy reports. (Cusick et al. 2000) Patient
proxy reports have been shown to be accurate when collecting data on
physical function, (Duncan et al. 2002) but less so with pain or emotional
distress. (Andresen et al. 2001) It may be worthwhile to collect this data
routinely in certain clinical scenarios, for example, when monitoring patients

with progressive conditions such as MS, to examine the relationship between
patients’ opinions and those of their carers, particularly in the area of
emotional wellbeing. This information could then be used to inform decision
making on an individual patient’s treatment if he or she subsequently
developed cognitive impairment.
With the introduction of classical psychometric methods into healthcare
measurement over the last 20 years, there has been an increase in the
number of centres evaluating and developing outcome measures. (Hobart
and Thompson 2002) One of the limitations of classical psychometric
techniques is the interdependence between the properties of the measure
and the sample itself. (Hobart 2002) This was illustrated in Chapter 2, where
treatment efficacy was linked to item responsiveness. Newer methods of
analysis, such as item response theory and Rasch analysis, have facilitated
a more comprehensive evaluation of measures used routinely in
rehabilitation practice. (Grimby et al. 1996) These methods generate
“sample-free” item calibrations of the items in a measure, which allows a
measure to be evaluated without the characteristics of the sample impacting
on the properties of the measure.
Such sample-free items can then be collated into item banks, which are
repositories of calibrated items that allow measures to be developed to suit
the characteristics of the sample under review. Using banks of well-
calibrated items means that fewer items are required to measure a patient’s
ability in relation to other patients with similar conditions. This is the basis of
computer adaptive testing (CAT) where a patient’s response to a particular
item influences the choice of subsequent items. The use of CAT is already
widespread in education and psychological testing to obtain an individual’s
position in relation to their peers for a given test. This work is already being
used in health outcome measurement where a CAT version of the SF-36 is
available on the Internet to allow patients to monitor their own health. This is
likely to be the future of measurement in neurological rehabilitation in the 21st
Century. (Ware, Jr. 2003)
5.4 Conclusion
The evidence base for neurological rehabilitation must be strengthened by
well-designed clinical trials of therapeutic interventions. In order to achieve
this, two objectives must be met. First, outcome measures that can
accurately evaluate the intervention must be used in trials. Second, trials
need to focus on the underlying constructs that lead to disability -
impairments, activity limitations and participation restrictions - and try to
influence them, or at least reduce the impact they have on the individual.
Effective interventions can then be used by the multidisciplinary team with
individual patients in a rehabilitation programme, with the outcome of these
interventions routinely measured and audited.

If these objectives can be met in rehabilitation practice then healthcare
resources will be used more efficiently, service delivery will be improved and,
most importantly, the journey of a patient through the rehabilitation process
will be enhanced.

References
Aaronson.N., Alonso,J., Burnam.A., Lohr.K.N., Patrick,D.L., Perrin,E., and
Stein,R.E.K. 2002. Assessing health status and quality-of-life instruments:
Attributes and review criteria, Quality o f Life Research 11: 193-205.
Allen,M.J. and Yen.W.M. 1979. Introduction to measurement theory,
Waveland Press, Illinois.
Andersen,H E., Eriksen.K., Brown,A., Schultz-Larsen.K., and
Forchhammer.B.H. 2002. Follow-up services for stroke survivors after
hospital discharge-a randomized control study, Clin.Rehabil. 16: 593-603.
Anderson,C., Laubscher.S., and Burns,R. 1996. Validation of the Short Form
36 (SF-36) Health Survey Questionnaire Among Stroke Patients, Stroke 27:
1812.
Andresen.E.M., Bowley.N., Rothenberg.B.M., Panzer,R., and Katz,P. 1996.
Test-retest performance of a mailed version of the Medical Outcomes Study
36-Item Short-Form Health Survey among older adults, Med.Care 34: 1165-
1170.
Andresen.E.M., Rothenberg.B.M., and Kaplan,R.M. 1998. Performance of a
self-administered mailed version of the Quality of Well-Being (QWB-SA)
questionnaire among older adults, Med.Care 36. 1349-1360.
Andresen.E.M., Vahle.V.J., and Lollar.D. 2001. Proxy reliability: health-
related quality of life (HRQoL) measures for people with disability, Qual.Life
Res. 10: 609-619.
Aragon,D., Burton,V., Byers.J.F., and Cohen,M. 2002. The effect of a critical
pathway on patients' outcomes after carotid endarterectomy, Am.J.Crit Care
11: 250-258.
Aronson,K.J. 1997. Quality of life among persons with multiple sclerosis and
their caregivers, Neurology 48: 74-80.
Bamford.J., Sandercock.P., Dennis,M., Bum.J., and Warlow.C. 1991.
Classification and natural history of clinically identifiable subtypes of cerebral
infarction, Lancet 337: 1521-1526.
Barnes,M.P. 2003. Principles of neurological rehabilitation, Journal of
Neurology, Neurosurgery, and Psychiatry 74: 3-7.
Barnett,S. and Franks,P. 1999. Telephone ownership and deaf people,
implications for telephone surveys, Am.J.Public Health 89: 1754-1756.
Beaton,D.E., Bombardier.C., Katz.J.N., and Wright,J.G. 2001. A taxonomy
for responsiveness, J.Clin.Epidemiol. 54: 1204-1217.
Bendix,A.E., Bendix.T., Haestrup.C., and Busch,E. 1998. A prospective,
randomized 5-year follow-up study of functional restoration in chronic low
back pain patients, Eur. Spine J. 7: 111-119.
Bergner.M. and Rothman.M.L. 1987. Health status measures: an overview
and guide for selection, Annu.Rev.Public Health 8. 191-210

Bessette,L , Sangha.O., Kuntz.K.M., Keller,R.B., Lew.R.A., Fossel.A.H., and
Katz.J.N. 1998. Comparative responsiveness of generic versus disease-
specific and weighted versus unweighted health status measures in carpal
tunnel syndrome, Med.Care 36: 491-502.
Bickenbach.J.E., Chatterji.S., Badley.E.M., and Ustun.T.B. 1999. Models of
disablement, universalism and the international classification of impairments,
disabilities and handicaps, Soc.Sci.Med. 48: 1173-1187.
Bjelland.l., Dahl.A.A., Haug.T.T., and Neckelmann.D. 2002. The validity of
the Hospital Anxiety and Depression Scale. An updated literature review,
J.Psychosom.Res. 52: 69-77.
Black,N. 1996. Why we need observational studies to evaluate the
effectiveness of health care, BMJ 312. 1215-1218.
Bloom,B.S. 1990. Does it work? The outcomes of medical interventions,
Int. J.Technol.Assess.Health Care 6: 326-332.
Bohannon,R.W. 1993. Physical rehabilitation in neurologic diseases,
Curr.Opin.Neurol. 6: 765-772.
Bowling, A. 2001. Measuring disease: a review of disease-specific quality of
life measurement scales, Open University Press, Buckingham.
Brambilla.D.J. and McKinlay.S.M. 1987. A comparison of responses to
mailed questionnaires and telephone interviews in a mixed mode health
survey, Am. J.Epidemiol. 126: 962-971.

Bridges,K.W. and Goldberg,D P. 1986. The validation of the GHQ-28 and the
use of the MMSE in neurological in-patients, Br.J.Psychiatry 148: 548-553.
Briggs,A. 2000. Economic evaluation and clinical trials: size matters, BMJ
321: 1362-1363.
British Society of Rehabilitation Medicine. Vocational rehabilitation - the way
forward. 1-107. 2000. London, British Society of Rehabilitation Medicine.
Ref Type: Report
British Society of Rehabilitation Medicine 2002. Clinical governance in
rehabilitation medicine. The state of the art in 2002, Clin.Rehabil. 16 Suppl 1:
1-58.
Brock,K.A., Goldie,P.A., and Green wood, K.M. 2002. Evaluating the
effectiveness of stroke rehabilitation: choosing a discriminative measure,
Arch.Phys.Med.Rehabil. 83: 92-99.
Brook,R.H. 1997. Managed care is not the problem, quality is, JAMA 278:
1612-1614.
Brosseau.L. and Wolfson.C. 1994. The inter-rater reliability and construct
validity of the functional independence measure for multiple sclerosis
subjects, Clinical Rehabilitation 8: 107-115.
Busche.K.D., Fisk.J.D., Murray,T.J., and Metz.L.M. 2003. Short term
predictors of unemployment in multiple sclerosis patients, Can. J.Neurol.Sci.
30: 137-142.
Buxton,S.J. 1965. Roehampton 1915-1965, Br.Med.J. 5472: 1238-1239.
Cardol.M., de Jong,B.A., and Ward.C.D. 2002. On autonomy and
participation in rehabilitation, Disabil.Rehabil. 24: 970-974.
Carr,A.J., Gibson,B., and Robinson,P.G. 2001. Measuring quality of life: Is
quality of life determined by expectations or experience?, BMJ 322: 1240-
1243.
Cassidy,E., O'Connor,R., and O'Keane.V. 2004. Prevalence of post-stroke
depression in an Irish sample and its relationship with disability and outcome
following inpatient rehabilitation, Disabil.Rehabil. 26: 71-77.
Catanzaro.M. and Weinert.C. 1992. Economic status of families living with
multiple sclerosis, Int.J.Rehabil.Res. 15: 209-218.
Chamberlain,M. A. 1992. The metamorphosis of physical medicine?,
J R.Soc.Med. 85: 131-135.
Chan.R.C.K. 2002. Active participation and autonomy: an ultimate target for
rehabilitation, Disabil.Rehabil. 24: 983-984.
Cheung,W.Y., Garratt.A.M., Russell,I T., and Williams,J.G. 2000. The UK
IBDQ-a British version of the inflammatory bowel disease questionnaire,
development and validation, J.Clin.Epidemiol. 53: 297-306.
Ciccone.D.S. and Just.N. 2001. Pain expectancy and work disability in
patients with acute and chronic pain: a test of the fear avoidance hypothesis,
J Pain 2: 181-194.
Cohen, J. 1988. Statistical power analysis for the behavioral sciences,
Erlbaum, Hillsdale NJ.

Cohen,J. 1992. A Power Primer, Psychological Bulletin 112: 155-159.
Collin,C., Wade.D.T., Davies,S., and Horne,V. 1988. The Barthel ADL Index:
a reliability study, Int.Disabil.Stud. 10: 61-63.
Cook.G.C 2002. Henry Currey FRIBA (1820-1900): leading Victorian
hospital architect, and early exponent of the "pavilion principle",
Postgrad.Med. J. 78: 352-359.
Cook.G.C. and Webb,A.J. 2002. Reactions from the medical and nursing
professions to Nightingale's "reform(s)" of nurse training in the late 19th
century, Postgrad.Med.J. 78: 118-123.
Corey,C.R. and Freeman,H E. 1990. Use of telephone interviewing in health
care research, Health Serv.Res. 25: 129-144.
Corkrey.R. and Parkinson,L. 2002. A comparison of four computer-based
telephone interviewing methods: getting answers to sensitive questions,
Behav.Res.Methods Instrum.Comput. 34: 354-363.
Craig,J., Young,C.A., Ennis,M., Baker,G., and Boggild.M. 2003. A
randomised controlled trial comparing rehabilitation against standard therapy
in multiple sclerosis patients receiving intravenous steroid treatment,
J. Neurol. Neurosung. Psychiatry 74: 1225-1230.
Creighton,C. 1993. Graded activity: legacy of the sanatorium,
Am.J.Occup.Ther. 47: 745-748.
Cronbach.L.J. 1951. Coefficient alpha and the internal structure of tests,
Psychometrika 16: 297-334.

Cunningham,C., Horgan.F., and O'Neill,D. 2000. Clinical assessment of
rehabilitation potential of the older patient: a pilot study, Clinical
Rehabilitation 14: 205-207.
Cusick.C.P., Gerhart,K.A., and Mellick.D.C. 2000. Participant-proxy reliability
in traumatic brain injury outcome research, J.Head Trauma Rehabil. 15: 739-
749.
D'Olhaberriague.L, Litvan.l., Mitsias.P., and Mansbach.H.H. 1996. A
reappraisal of reliability and validity studies in stroke, Stroke 27: 2331-2336.
David,R., Enderby.P., and Bainton.D. 1982. Treatment of acquired aphasia:
speech therapists and volunteers compared, J.Neurol.Neurosurg.Psychiatry
45: 957-961.
Davies,H.T. 2001. Exploring the pathology of quality failings: measuring
quality is not the problem-changing it is, J.Eval.Clin.Pract. 7: 243-251.
De Kleijn-de Vrankrijker.M.W. 2003. The long way from the International
Classification of Impairments, Disabilities and Handicaps (ICIDH) to the
International Classification of Functioning, Disability and Health (ICF),
Disabil.Rehabil. 25: 561-564.
Department of Health. Working for patients. 1989. London, HMSO.
Ref Type: Report
Dillman.D.A. 1978. Mail and telephone surveys: the total design method,
Wiley, New York.
195

Dillman.D.A., Sinclair.M.D., and Clark,J R. 1993. Effects of Questionnaire
Length, Respondent-Friendly Design, and A Difficult Question on Response
Rates for Occupant- Addressed Census Mail Surveys, Public Opinion
Quarterly 57. 289-304.
Dodds,T.A., Martin,D.P., Stolov.W.C., and Deyo.R.A. 1993. A validation of
the functional independence measurement and its performance among
rehabilitation inpatients, Arch.Phys.Med.Rehabil. 74: 531-536.
Duncan,P.W., Lai.S.M., Tyler,D., Perera.S., Reker,D.M., and Studenski.S.
2002. Evaluation of proxy responses to the Stroke Impact Scale, Stroke 33:
2593-2599.
Dyck,I. and Jongbloed.L. 2000. Women with multiple sclerosis and
employment issues: a focus on social and institutional environments,
Can.J.Occup.Ther. 67: 337-346.
Eaden.J., Mayberry.M.K., and Mayberry,J.F. 1999. Questionnaires: the use
and abuse of social survey methods in medical research, Postgrad.Med.J.
75: 397-400.
Edwards,S.G., Thompson,A.J., Losseff.N., and Playford.E.D. 2002.
Shortening inpatient stay for stroke, Lancet 359: 2205.
Edwards,S.G., Thompson,A.J., and Playford.E.D. 2003. Integrated care
pathways in neurological rehabilitation - disease specific or process specific,
Clin.Med. 4:132-135
196

Engel,G.L. 1977. The need for a new medical model: a challenge for
biomedicine, Science 196: 129-136.
Evans,M., Robling.M., Maggs.R.F., Houston,H., Kinnersley.P., and
Wilkinson,C. 2002. It doesn't cost anything just to ask, does it? The ethics of
questionnaire-based research, J.Med.Ethics 28: 41-44.
Failde.l., Ramos,I., and Fernandez-Palacin.F. 2000. Comparison between
the GHQ-28 and SF-36 (MH 1-5) for the assessment of the mental health in
patients with ischaemic heart disease, Eur.J.Epidemiol. 16: 311-316.
Feinstein,A., O'Connor,P., Gray.T., and Feinstein.K. 1999. The effects of
anxiety on psychiatric morbidity in patients with multiple sclerosis, Mult.Scler.
5. 323-326.
Fiedler,R.C., Granger,C.V., and Post,L A. 2000. The Uniform Data System
for Medical Rehabilitation: report of first admissions for 1998,
Am.J.Phys.Med.Rehabil. 79: 87-92.
Fitzpatrick.R., Davey.C., Buxton,M.J., and Jones,D.R. 1998. Evaluating
patient-based outcome measures for use in clinical trials, Health
Technol.Assess. 2: 1-74.
Ford,E.S. 1998. Characteristics of survey participants with and without a
telephone: findings from the third National Health and Nutrition Examination
Survey, J.Clin.Epidemiol. 51: 55-60.
Freeman,J., Hobart,J.C., Langdon.D.W., and Thompson,A.J. 2000. Clinical
appropriateness: a key factor in outcome measure selection: the 36 item

short form health survey in multiple sclerosis, Journal of Neurology
Neurosurgery and Psychiatry 68: 150-156.
Freeman,J.A., Langdon.D.W., Hobart,J.C., and Thompson,A.J. 1997. The
impact of inpatient rehabilitation on progressive multiple sclerosis,
Ann. Neurol. 42. 236-244.
Freeman,J.A., Langdon.D.W., Hobart,J.C., and Thompson,A.J. 1999.
Inpatient rehabilitation in multiple sclerosis: do the benefits carry over into the
community?, Neurology 52. 50-56.
Freeman,J.A., Playford.E.D., Nicholas,R.S., and Thompson,A.J. 1996. A
neurological rehabilitation unit: audit of activity and outcome,
J R. Coll. Physicians Lond 30: 21-26.
Freeman,J.A. and Thompson,A.J. 2000. Community services in multiple
sclerosis: still a matter of chance, Journal of Neurology, Neurosurgery, and
Psychiatry 69: 728-732.
Freemon.F.R. 1993. The first neurological research center: Turner's Lane
Hospital during the American Civil War, J.Hist Neurosci. 2: 135-142.
Frerichs.R.R. and Shaheen.M.A. 2001. Small-community-based surveys,
Annu.Rev.Public Health 22: 231-247.
Ganiats.T.G., Palinkas.L.A., and Kaplan,R.M. 1992. Comparison of Quality of
Well-Being scale and Functional Status Index in patients with atrial
fibrillation, Med.Care 30: 958-964.
198

Garrard,P., Bradshaw,D., Jager.H.R., Thompson,A.J., Losseff.N., and
Playford.D. 2002. Cognitive dysfunction after isolated brain stem insult. An
underdiagnosed cause of long term morbidity, J.Neurol.Neurosurg.Psychiatry
73: 191-194.
Gilworth.G., Chamberlain,M.A., Harvey,A., Woodhouse.A., Smith,J.,
Smyth,M.G., and Tennant,A. 2003. Development of a work instability scale
for rheumatoid arthritis, Arthritis Rheum 49: 349-354.
Gnanalingham.J., Gnanalingham.M.G., and Gnanalingham.K.K. 2001. An
audit of audits: are we completing the cycle?, J.R.Soc.Med. 94: 288-289.
Goetzel.R.Z., Ozminkowski.R.J., and Long,S.R. 2003. Development and
reliability analysis of the Work Productivity Short Inventory (WPSI) instrument
measuring employee health and productivity, J.Occup.Environ.Med. 45: 743-
762.
Gold,S.M., Schulz,H., Monch.A., Schulz,K.H., and Heesen.C. 2003.
Cognitive impairment in multiple sclerosis does not affect reliability and
validity of self-report health measures, Mult.Scler. 9: 404-410.
Goldberg,D P. and Hillier.V.F. 1979. A scaled version of the General Health
Questionnaire, Psychol.Med. 9. 139-145.
Gompertz.P., Pound,P., and Ebrahim.S. 1993. The reliability of of stroke
outcome measurement, Clin.Rehabil. 7: 290-296.
Gompertz.P., Pound,P., and Ebrahim.S. 1994. A postal version of the Barthel
Index, Clinical Rehabilitation 8: 233-239.

Granger.C.V. 1985. Outcome of comprehensive medical rehabilitation: an
analysis based upon the impairment, disability, and handicap model,
lnt.Rehabil.Med. 7: 45-50.
Granger.C.V., Hamilton,B.B., Keith,R.A., Zielezny.M., and Sherwin.F.S.
1986. Advances in functional assessment for medical rehabilitation, Topics in
Geriatric Rehabilitation 1: 59-74.
Green,J., Forster,A., and Young,J. 2001. A test-retest reliability study of the
Barthel Index, the Rivermead Mobility Index, the Nottingham Extended
Activities of Daily Living Scale and the Frenchay Activities Index in stroke
patients, Disabil.Rehabil. 23: 670-676.
Grimby.G., Gudjonsson.G., Rodhe.M., Sunnerhagen.K.S., Sundh.V., and
Ostensson.M.L. 1996. The functional independence measure in Sweden:
experience for outcome measurement in rehabilitation medicine,
Scand.J.Rehabil.Med. 28: 51-62.
Groce,N.E. 1999. Disability in cross-cultural perspective: rethinking disability,
Lancet 354: 756-757.
Gronning.M., Hannisdal.E., and Mellgren.S.I. 1990. Multivariate analyses of
factors associated with unemployment in people with multiple sclerosis,
J.Neurol.Neurosurg.Psychiatry 53: 388-390.
Gulick.E.E. 1991. Reliability and validity of the work assessment scale for
persons with multiple sclerosis, Nurs.Res. 40. 107-112.

Gulick.E.E., Yam.M., and Touw.M.M. 1989. Work performance by persons
with multiple sclerosis: conditions that impede or enable the performance of
work, Int.J.Nurs.Stud. 26: 301-311.
Gutman,S.A. 1995. Influence of the U.S. military and occupational therapy
reconstruction aides in World War I on the development of occupational
therapy, Am.J.Occup.Ther. 49. 256-262.
Gutman,S.A. 1997. Occupational therapy's link to vocational reeducation,
1910-1925, Am.J.Occup.Ther. 51: 907-915.
Guyatt.G., Walter,S., and Norman,G. 1987. Measuring change overtime:
assessing the usefulness of evaluative instruments, J.Chronic.Dis. 40: 171-
178.
Guyatt.G.H., Deyo.R.A., Charlson.M., Levine.M.N., and Mitchell,A. 1989.
Responsiveness and validity in health status measurement: a clarification,
J. Clin.Epidemiol. 42: 403-408.
Guyatt.G.H., Feeny.D.H., and Patrick,D.L. 1993. Measuring health-related
quality of life, Ann. Intern. Med. 118: 622-629.
Hall.K.M., Cohen,M.E., Wright,J., Call.M., and Werner,P. 1999.
Characteristics of the Functional Independence Measure in traumatic spinal
cord injury, Arch.Phys.Med.Rehabil. 80: 1471-1476.
Hambleton.R.K., Swaminathan.H., and Rogers,H.J. 1991. Fundamentals of
item response theory, Sage, Newbury Park.

Hammond.S.R., McLeod,J.G., Macaskill.P., and English,D.R. 1996. Multiple
sclerosis in Australia: socioeconomic factors, J.Neurol.Neurosurg.Psychiatry
61: 311-313.
Hanson,C.S. and Walker,K.F. 1992. The history of work in physical
dysfunction, Am.J.Occup.Ther 46: 56-62.
Harlow.B.L., Crea.E.C., East.M.A., Oleson.B., Fraer,C.J., and Cramer,D.W.
1993. Telephone answering machines: the influence of leaving messages on
telephone interviewing response rates, Epidemiology A: 380-383.
Harris.L.E., Weinberger,M., and Tierney,W.M. 1997. Assessing inner-city
patients' hospital experiences. A controlled trial of telephone interviews
versus mailed surveys, Med. Care 35: 70-76.
Hassan.N., Turner-Stokes.L., Pierce,K., and Clegg,F. 2002. A completed
audit cycle and integrated care pathway for the management of depression
following brain injury in a rehabilitation setting, Clin.Rehabil. 16: 534-540.
Higginson.I.J. and Carr,A.J. 2001. Measuring quality of life: Using quality of
life measures in the clinical setting, BMJ 322: 1297-1300.
Hobart,J. 2002. Measuring disease impact in disabling neurological
conditions: are patients' perspectives and scientific rigor compatible?,
Current Opinion in Neurology 15: 721-724.
Hobart,J., Freeman,J., and Thompson,A. 2000. Kurtzke scales revisited: the
application of psychometric methods to clinical intuition, Brain 123 ( Pt 5):
1027-1040.
202

Hobart,J., Lamping,D., Fitzpatrick,R., Riazi.A., and Thompson,A. 2001a. The
Multiple Sclerosis Impact Scale (MSIS-29): a new patient-based outcome
measure, Brain 124: 962-973.
Hobart, J., Lamping, D., Freeman, J., and Thompson, A. Measuring disability
in multiple sclerosis, reliability of the functional independence measure.
Eur.J.Neurol. 3[Suppl. 2], 123. 1996a.
Ref Type: Abstract
Hobart, J., Lamping, D., and Thompson, A. J. Measuring disability in
neurological disease: validity of the self-report version of the Barthel index.
Eur.J.Neurol. 3[Suppl. 2], 122-123. 1996b.
Ref Type: Abstract
Hobart,J. and Thompson,A. 2002. Measurement of neurological outcomes,
pp. 105-117. In P.J.Goadsby, J.C.McArthur, W.l.McDonald, A.K.Ashbury,
and G.M.McKhann, editors, Diseases of the nervous system: clinical
neuroscience and therapeutic principles. Cambridge University Press,
Cambridge.
Hobart,J.C., Lamping,D.L., Freeman,J.A., Langdon.D.W., McLellan.D.L.,
Greenwood,R.J., and Thompson,A.J. 2001b. Evidence-based measurement.
Which disability scale for neurologic rehabilitation?, Neurology 57: 639-644.
Hobart,J.C., Riazi.A., Lamping,D.L., Fitzpatrick,R., and Thompson,A.J. 2003.
Measuring the impact of MS on walking ability: the 12-Item MS Walking
Scale (MSWS-12), Neurology 60. 31-36.

Hobart,J.C., Williams,L.S., Moran,K., and Thompson.A.J. 2002. Quality of life
measurement after stroke: uses and abuses of the SF-36, Stroke 33: 1348-
1356.
Hopman.W.M. and Verner.J. 2003. Quality of life during and after inpatient
stroke rehabilitation, Stroke 34: 801-805.
Howat.D.D. 2001. Amputations at the London Hospital, 1852-1857,
J.R.Soc.Med. 94: 657.
Hsueh.I.P., Lin.J.H., Jeng.J.S., and Hsieh.C.L. 2002. Comparison of the
psychometric characteristics of the functional independence measure, 5 item
Barthel index, and 10 item Barthel index in patients with stroke,
J. Neurol. Neurosurg. Psychiatry 73: 188-190.
lezzoni.L.I. 1996. 100 apples divided by 15 red herrings: a cautionary tale
from the mid-19th century on comparing hospital mortality rates,
Ann.Intern.Med. 124: 1079-1085.
Iglesias.C.P., Birks.Y.F., and Torgerson.D.J. 2001. Improving the
measurement of quality of life in older people: the York SF-12, QJM 94: 695-
698.
Inman,C. 1999. Effectiveness of spinal cord injury rehabilitation, Clin.Rehabil.
13 Suppl 1:25-31.
Intercollegiate Working Party for Stroke. National clinical guidelines for
stroke. Intercollegiate Working Party for Stroke. 1-150. 1999. London, Royal
College of Physicians of London.

Ref Type: Report
Jackson,D., Turner-Stokes.L., Khatoon.A., Stern,H., Knight,L., and
O'Connell,A. 2002. Development of an integrated care pathway for the
management of hemiplegic shoulder pain, Disabil.Rehabil. 24: 390-398.
Jackson,M.F., Quaal.C., and Reeves,M.A. 1991. Effects of multiple sclerosis
on occupational and career patterns, Axone. 13: 16-2.
Jacobs.L.D., Wende.K.E., Brownscheidle.C.M., Apatoff.B., Coyle,P.K.,
Goodman,A., Gottesman.M.H., Granger.C.V., Greenberg,S.J., Herbert,J.,
Krupp.L., Lava,N.S., Mihai.C., Miller.A.E., Perel.A., Smith.C.R., and
Snyder,D.H. 1999. A profile of multiple sclerosis: the New York State Multiple
Sclerosis Consortium, Mult.Scler. 5: 369-376.
Javors.J.R. and Bramble,J.E. 2003. Uncontrolled chronic disease: patient
non-compliance or clinical mismanagement?, Dis.Manag. 6: 169-178.
Johnson,G., Burvill.P.W., Anderson,C.S., Jamrozik.K., Stewart-Wynne,E.G.,
and Chakera.T.M. 1995. Screening instruments for depression and anxiety
following stroke: experience in the Perth community stroke study, Acta
Psychiatr.Scand. 91: 252-257.
Johnson,J. and Thompson,A.J. 1996. Rehabilitation in a neuroscience
centre: the role of expert assessment and selection, British Journal o f
Therapy and Rehabilitation 3: 303-308.

Johnston,M.V. and Miklos.C.S. 2002. Activity-related quality of life in
rehabilitation and traumatic brain injury, Archives of Physical Medicine and
Rehabilitation 83: S26-S38.
Jones,G. 2003. Prescribing and taking medicines, BMJ 327: 819.
Jorger.M., Beer,S., and Kesselring.J. 2001. Impact of neurorehabilitation on
disability in patients with acutely and chronically disabling diseases of the
nervous system measured by the Extended Barthel Index,
NeurorehabiiNeural Repair 15:15-22.
Kazis.L.E., Anderson,J.J., and Meenan.R.F. 1989. Effect sizes for
interpreting changes in health status, Med.Care 27: S178-S189.
Kelly,S. and Jessop.E.G. 1996. A comparison of measures of disability and
health status in people with physical disabilities undergoing vocational
rehabilitation, J.Public Health Med. 18: 169-174.
Kennedy,P. and Rogers.B.A. 2000. Anxiety and depression after spinal cord
injury: a longitudinal analysis, Arch.Phys.Med.Rehabii 81: 932-937.
Kessler,R.C., Barber,C., Beck,A., Berglund.P., Cleary.P.D., McKenas.D.,
Pronk.N., Simon.G., Stang.P., Ustun.T.B., and Wang.P. 2003. The World
Health Organization Health and Work Performance Questionnaire (HPQ),
J.Occup.Environ.Med. 45: 156-174.
Kitchiner.D., Davidson,C., and Bundred.P. 1996. Integrated care pathways:
effective tools for continuous evaluation of clinical practice, J.Eval.Clin.Pract.
2: 65-69.
206

Korner-Bitensky.N., Wood-Dauphinee.S., Siemiatycki.J., Shapiro,S., and
Becker,R. 1994. Health-related information postdischarge: telephone versus
face-to-face interviewing, Arch.Phys.Med.Rehabil. 75: 1287-1296.
Koven.S. 1994. Remembering and dismemberment: crippled children,
wounded soldiers, and the great war in Great Britain, Am.Hist Rev. 99: 1167-
1202 .
Kreutzer.J.S. and Kolakowsky-Hayner.S A. 1999. Laws of the house of
rehab: A guide to managing psychological distress and promoting benefit
from rehabilitation, Neurorehabilitation 13: 91-102.
Kurtzke.J.F. 1955. A new scale for evaluating disability in multiple sclerosis,
Neurology 5: 580-583.
Kurtzke.J.F. 1983. Rating neurologic impairment in multiple sclerosis: an
expanded disability status scale (EDSS), Neurology 33: 1444-1452.
Larocca.N., Kalb.R., Kendall,P., and Scheinberg.L. 1982. The role of disease
and demographic factors in the employment of patients with multiple
sclerosis, Arch.Neurol. 39: 256.
Larocca.N., Kalb.R., Scheinberg.L., and Kendall,P. 1985. Factors associated
with unemployment of patients with multiple sclerosis, J.Chronic.Dis. 38:
203-210.
Lerner.D., Amick.B.C., Ill, Rogers,W.H., Malspeis.S., Bungay,K., and
Cynn.D. 2001. The Work Limitations Questionnaire, Med.Care 39: 72-85.

Liang,M.H. 2000. Longitudinal construct validity: establishment of clinical
meaning in patient evaluative instruments, Med.Care 38: 1184-1190.
Licht.S. 1970. Rehabilitation medicine: definition and origin. Twentieth John
Stanley Coulter Memorial Lecture, Arch.Phys.Med.Rehabil. 51: 619-624.
Licht.S. 1973. Stroke: a history of its rehabilitation. Walter J. Zeiter Lecture,
Arch.Phys.Med.Rehabil. 54: 10-18.
Likert.R.A. 1932. A technique for the measurement of attitudes, Archives of
Psychology 140: 5-55.
Linacre.J.M., Heinemann.A.W., Wright,B.D., Granger.C.V., and
Hamilton,B.B. 1994. The structure and stability of the Functional
Independence Measure, Arch.Phys.Med.Rehabil. 75: 127-132.
Lindholrn.C., Burstrom.B., and Diderichsen.F. 2002. Class differences in the
social consequences of illness?, J.Epidemiol. Community Health 56: 188-192.
Lippert-Gruner.M. 2002. Paresis, historical therapy in the perspective of
Caelius Aurelianus, with special reference to the use of hydrotherapy in
antiquity, J.Hist Neurosci. 11: 105-109.
Loewen.S.C. and Anderson,B.A. 1988. Reliability of the Modified Motor-
Assessment Scale and the Barthel Index, Physical Therapy 68: 1077-1081.
Lohr.K.N., Aaronson.N.K., Alonso,J., Burnam.M.A., Patrick,D.L., Perrin,E.B.,
and Roberts,J.S. 1996. Evaluating quality-of-life and health status
instruments: development of scientific review criteria, Clin.Ther. 18: 979-992.

Lowe.C. 1998. Care pathways: have they a place in 'the new National Health
Service'?, J.Nurs.Manag. 6: 303-306.
Lykouras.L., Adrachta.D., Kalfakis.N., Oulis.P., Voulgari.A.,
Christodoulou.G.N., Papageorgiou.C., and Stefanis.C. 1996. GHQ-28 as an
aid to detect mental disorders in neurological inpatients, Acta
Psychiatr.Scand. 93: 212-216.
Mahoney,F.l. and Barthel,D.W. 1965. Functional evaluation: the Barthel
index, Maryland State Medical Journal 16: 61-65.
Marcus,A C. and Telesky,C.W. 1983. Non-participation in telephone follow-
up interviews, Am. J.Public Health 73. 72-77.
Marinus.J., Ramaker.C., van Hilten.J.J., and Stiggelbout.A.M. 2002. Health
related quality of life in Parkinson's disease: a systematic review of disease
specific instruments, J.Neurol.Neurosurg.Psychiatry 72: 241-248.
Marks, L., McLellan, D. L., Langton-Hewer, R., and Ward, C. Medical
rehabilitation for people with physical and complex disabilities. 1-42. 2000.
London, Royal College of Physicians.
Ref Type: Report
Marolf.M.V., Vaney.C., Konig.N., Schenck.T., and Prosiegel.M. 1996.
Evaluation of disability in multiple sclerosis patients: a comparative study of
the Functional Independence, the Extended Barthel Index and the Expanded
Disability Status Scale, Clin.Rehabil. 10: 309-313.

Massof.R.W. 2002. The measurement of vision disability, Optom.Vis.Sci. 79:
516-552.
Mayo.N.E., Wood-Dauphinee,S., Cote.R., Durcan.L., and Carlton,J. 2002.
Activity, participation, and quality of life 6 months poststroke,
Arch.Phys.Med.Rehabil. 83: 1035-1042.
McDonnell,G.V. and Hawkins,S.A. 1998. Clinical study of primary
progressive multiple sclerosis in Northern Ireland, UK,
J. Neurol. Neurosurg. Psychiatry 64: 451 -454.
McDowell,I. and Jenkinson.C. 1996. Development standards for health
measures, J.Health Serv.Res.Policy 1: 238-246.
McGrath,J R. and Davis,A.M. 1992. Rehabilitation: where are we going and
how do we get there?, Clin.Rehabil. 6: 225-235.
McHorney.C.A., Ware.J.E., Jr., Lu.J.F., and Sherbourne.C.D. 1994. The
MOS 36-item Short-Form Health Survey (SF-36): III. Tests of data quality,
scaling assumptions, and reliability across diverse patient groups, Med.Care
32: 40-66.
McLellan.D.L. 1992. Neurology or rehabilitation medicine?,
J.Neurol.Neurosurg.Psychiatry 55 Suppl: 47-50.
McPherson,K.M. and Pentland.B. 1997. Disability in patients following
traumatic brain injury—which measure?, Int.J.Rehabil.Res. 20: 1-10.

Meythaler.J.M., DeVivo.MJ., and Braswell,W.C. 1997. Rehabilitation
outcomes of patients who have developed Guillain-Barre syndrome,
Am.J.Phys.Med.Rehabil. 76: 411-419.
Middel.B., Stewart,R., Bouma.J., van Sonderen.E., and van den Heuvel.W.J.
2001. How to validate clinically important change in health-related functional
status. Is the magnitude of the effect size consistently related to magnitude
of change as indicated by a global question rating?, J.Eval.Clin.Pract. 7: 399-
410.
Miller,G.A. 1956. The magic number seven plus or minus two: some
limitations on our capacity for processing information, Psychological Bulletin
63: 81-97.
Moss.C.N. 1974. Rehabilitation and occupational medicine, J.Occup.Med.
16: 81-85.
Mykletun.A., Stordal.E., and Dahl.A.A. 2001. Hospital Anxiety and
Depression (HAD) scale: factor structure, item analyses and internal
consistency in a large population, Br.J.Psychiatry 179: 540-544.
National Institute for Clinical Evidence 2002. Principles for best practice in
clinical audit, Radcliffe Medical Press, Oxford.
Neuhauser.D. 1990. Ernest Amory Codman, M.D., and end results of
medical care, Int.J.Technol.Assess.Health Care 6: 307-325.
Newton,M. 2003. Integrated care pathway: the prevention and management
of pressure ulcers, J. Tissue Viability. 13: 126-129.

Nicholas,R., Playford.E.D., and Thompson,A.J. 2000. A retrospective
analysis of outcome in severe Guillain-Barre syndrome following combined
neurological and rehabilitation management, Disabil.Rehabil. 22: 451-455.
Nybo Andersen,A.M. and Olsen,J. 2002. Do interviewers' health beliefs and
habits modify responses to sensitive questions? A study using data Collected
from pregnant women by means of computer-assisted telephone interviews,
Am.J.Epidemiol. 155: 95-100.
Nyein.K., McMichael.L., and Tumer-Stokes.L. 1999. Can a Barthel score be
derived from the FIM?, Clin.Rehabil. 13: 56-63.
O'Connor,E. 1997. "Fractions of Men": Engendering Amputation in Victorian
Culture, Comparative Studies in Society and History 39. 742-777.
O'Day.B. 1998. Barriers for people with multiple sclerosis who want to work:
A qualitative study, Journal of Neurologic Rehabilitation 12: 139-146.
O'Riordan.J.I., Losseff.N.A., Phatouros.C., Thompson,A.J., Moseley,I.F.,
MacManus.D.G., McDonald,W.I., and Miller,D.H. 1998a. Asymptomatic
spinal cord lesions in clinically isolated optic nerve, brain stem, and spinal
cord syndromes suggestive of demyelination, J.Neurol.Neurosurg.Psychiatry
64: 353-357.
O'Riordan.J.I., Thompson,A.J., Kingsley,D.P., MacManus.D.G., Kendall,B.E.,
Rudge.P., McDonald,W.I., and Miller,D.H. 1998b. The prognostic value of
brain MRI in clinically isolated syndromes of the CNS. A 10-year follow-up,
Brain 121 ( Pt 3): 495-503.
212

Ottenbacher.K.J., Hsu,Y., Granger.C.V., and Fiedler.R.C. 1996. The
reliability of the functional independence measure: a quantitative review,
Arch.Phys.Med.Rehabil. 77: 1226-1232.
Paolucci.S., Antonucci.G., Grasso.M.G., Morelli.D., Troisi.E., Coiro.P., and
Bragoni.M. 2000. Early versus delayed inpatient stroke rehabilitation: a
matched comparison conducted in Italy, Arch.Phys.Med.Rehabil. 81. 695-
700.
Pashkow.F.J. 1993. Issues in contemporary cardiac rehabilitation: a
historical perspective, J.Am.Coll. Cardiol. 21: 822-834.
Patel,M., Potter,J., Perez,I., and Kalra.L. 1998. The process of rehabilitation
and discharge planning in stroke: a controlled comparison between stroke
units, Stroke 29: 2484-2487.
Patrick,D.L. and Chiang.Y.P. 2000. Measurement of health outcomes in
treatment effectiveness evaluations: conceptual and methodological
challenges, Med.Care 38: I114-1125.
Patti,F., Ciancio.M.R., Cacopardo.M., Reggio,E., Fiorilla.T., Palermo,F.,
Reggio,A., and Thompson,A.J. 2003. Effects of a short outpatient
rehabilitation treatment on disability of multiple sclerosis patients--a
randomised controlled trial, J.Neurol. 250: 861-866.
Pentland.B., Boake.C., and McKinlay.W.W. 1989. Scottish head injury
rehabilitation: an historical account, Scott.Med.J. 34: 411-412.

Playford.E.D., Sachs,R., and Thompson,A.J. 2002. Integrated care
pathways: outcome from inpatient rehabilitation following nontraumatic spinal
cord lesion, Clin.Rehabil. 16: 269-275.
Pless.I.B. and Miller, J R. 1979. Apparent validity of alternative survey
methods, J. Community Health 5: 22-27.
Poser,S., Bauer,H.J., Ritter,G., Friedrich,H., Beland.H., and Denecke.P.
1981. Rehabilitation for patients with multiple sclerosis?, J.Neurol. 224: 283-
290.
Post.M.W., Visser-Meily.J.M., and Gispen.L.S. 2002. Measuring nursing
needs of stroke patients in clinical rehabilitation: a comparison of validity and
sensitivity to change between the Northwick Park Dependency Score and the
Barthel Index, Clin.Rehabil. 16: 182-189.
Rabins,P.V. and Brooks,B.R. 1981. Emotional disturbance in multiple
sclerosis patients: validity of the General Health Questionnaire (GHQ),
Psychol. Med. 11:425-427.
Rabins,P.V., Brooks,B.R., O'Donnell,P., Pearlson.G.D., Moberg.P., Jubelt.B.,
Coyle,P., Dalos.N., and Folstein.M.F. 1986. Structural brain correlates of
emotional disorder in multiple sclerosis, Brain 109 ( Pt4): 585-597.
Rao.S.M., Leo.G.J., Ellington,L., Nauertz.T., Bernardin.L., and Unverzagt.F.
1991. Cognitive dysfunction in multiple sclerosis. II. Impact on employment
and social functioning, Neurology 41: 692-696.
Rasch.G. 1966. An item analysis which takes individual differences into
account, Br.J. Math. Stat. Psychol. 19: 49-57.
Ravaud.J.F., Delcey.M., and Yelnik.A. 1999. Construct validity of the
functional independence measure (FIM): questioning the unidimensionality of
the scale and the "value" of FIM scores, Scand.J.Rehabil.Med. 31: 31-41.
Rehabilitation Advisory Group NHS Executive. Rehabilitation - a guide.
H88/0051P, 1-57. 1997. London, Department of Health.
Ref Type: Report
Reilly,M.C., Zbrozek.A.S., and Dukes,E.M. 1993. The validity and
reproducibility of a work productivity and activity impairment instrument,
Pharmacoeconomics. 4: 353-365.
Riazi.A., Hobart,J.C., Lamping,D.L., Fitzpatrick,R., and Thompson,A.J. 2002.
Multiple Sclerosis Impact Scale (MSIS-29): reliability and validity in hospital
based samples, J.Neurol.Neurosurg.Psychiatry 73: 701-704.
Riazi.A., Hobart,J.C., Lamping,D.L., Fitzpatrick,R., and Thompson,A.J. 2003.
Evidence-based measurement in multiple sclerosis: the psychometric
properties of the physical and psychological dimensions of three quality of
life rating scales, Mult.Scler. 9: 411-419.
Riley,K. 1998. Care pathways. Paving the way, Health Serv.J. 108: 30-31.
Rockwood.K., Joyce,B., and Stolee.P. 1997. Use of Goal Attainment Scaling
in Measuring Clinically Important Change in Cognitive Rehabilitation
Patients, Journal of Clinical Epidemiology 50: 581-588.

Roessler.R.T. and Rumrill.P.D., Jr. 2003. Multiple sclerosis and employment
barriers: A systemic perspective on diagnosis and intervention, Work 21: 17-
23.
Ronning.O.M. and Guldvog.B. 1998. Outcome of subacute stroke
rehabilitation. A randomized controlled trial, Stroke 29: 779-784.
Rossiter.D. and Thompson,A.J. 1995. Introduction of integrated care
pathways for patients with multiple sclerosis in an inpatient
neurorehabilitation setting, Disabil.Rehabil. 17: 443-448.
Rossiter.D.A., Edmondson,A., al Shahi.R., and Thompson,A.J. 1998.
Integrated care pathways in multiple sclerosis rehabilitation: completing the
audit cycle, Mult.Scler. 4: 85-89.
Roy.C.W., Togneri.J., Hay.E., and Pentland.B. 1988. An Inter-Rater
Reliability Study of the Barthel Index, International Journal of Rehabilitation
Research 11. 67-70.
Ryall.N.H., Eyres,S B., Neumann,V.C., Bhakta.B.B., and Tennant,A. 2003. Is
the Rivermead Mobility Index appropriate to measure mobility in lower limb
amputees?, Disabil.Rehabil. 25: 143-153.
Sadovnick.A.D., Remick.R.A., Allen,J., Swartz,E., Yee.I.M., Eisen.K.,
Farquhar.R., Hashimoto.S.A., Hooge.J., Kastrukoff.L.F., Morrison,W.,
Nelson,J., Oger.J., and Paty.D.W. 1996. Depression and multiple sclerosis,
Neurology 46: 628-632.
Salant.P. and Dillman.D.A. 1994. Howto conduct your own survey, John
Wiley & Sons, New York.
Salbach.N.M., Mayo.N.E., Higgins.J., Ahmed,S., Finch,L.E., and
Richards,C.L. 2001. Responsiveness and predictability of gait speed and
other disability measures in acute stroke, Arch.Phys.Med.Rehabil. 82: 1204-
1212 .
Schalick.W.O. 2000. Children, disability and rehabilitation in history,
Pediatr.Rehabil. 4: 91-95.
Schuling.J., de Haan.R., Limburg,M., and Groenier.K.H. 1993. The Frenchay
Activities Index. Assessment of functional status in stroke patients, Stroke
24: 1173-1177.
Schut.H.A. and Stam.H.J. 1994. Goals in rehabilitation teamwork,
Disabil.Rehabil. 16: 223-226.
Schwartz,J.S. and Lurie,N. 1990. Assessment of medical outcomes. New
opportunities for achieving a long sought-after objective,
Int. J.Technol.Assess.Health Care 6: 333-339.
Scivoletto.G., Morganti.B., Ditunno.P., Ditunno.J.F., and Molinari.M. 2003.
Effects on age on spinal cord lesion patients' rehabilitation, Spinal Cord. 41:
457-464.
Secretary of State for Work and Pensions. Pathways to work: helping people
into employment. 1-74. 2002. London, HMSO.
Ref Type: Report
Sharrack.B., Hughes.R.A., Soudain.S., and Dunn.G. 1999. The psychometric
properties of clinical rating scales used in multiple sclerosis, Brain 122 ( Pt
1): 141-159.
Shorter,E. and Tyrer.P. 2003. Separation of anxiety and depressive
disorders: blind alley in psychopharmacology and classification of disease,
BMJ 327: 158-160.
Silver, J R. 1993. The British contribution to the treatment of spinal injuries,
J.Hist Neurosci. 2: 151-157.
Sim.T.C., Lum.C.M., Sze.F.K., Or.K.H., Sum.C., and Woo.J. 1997. Outcome
after stroke rehabilitation in Hong Kong, Clin.Rehabil. 11: 236-242.
Sinclair,A. and Dickinson,E. 1998. Effective practice in rehabilitation, King's
Fund Publishing, London.
Sinyor.D., Amato,P., Kaloupek.D.G., Becker,R., Goldenberg.M., and
Coopersmith.H. 1986. Post-stroke depression: relationships to functional
impairment, coping strategies, and rehabilitation outcome, Stroke 17: 1102-
1107.
Smith,W., Chey.T., Jalaludin.B., Salkeld.G., and Capon,T. 1995. Increasing
response rates in telephone surveys: a randomized trial, J.Public Health
Med. 17: 33-38.
Sneeuw.K.C., Aaronson.N.K., de Haan.R.J., and Limburg,M. 1997.
Assessing quality of life after stroke. The value and limitations of proxy
ratings, Stroke 28: 1541-1549.
Sprangers.M.A., Cull,A., Bjordal.K., Groenvold.M., and Aaronson.N.K. 1993.
The European Organization for Research and Treatment of Cancer.
Approach to quality of life assessment: guidelines for developing
questionnaire modules. EORTC Study Group on Quality of Life, Qual.Life
Res. 2: 287-295.
SPSS Incorporated 2002. SPSS for Windows, SPSS, New Jersey.
Staquet.M.J., Hays.R.D., and Fayers.P.M. 1998. Quality of life assessment in
clinical trials: methods and practice, Oxford University Press, New York.
Stineman.M.G., Shea.J.A., Jette.A., Tassoni.C.J., Ottenbacher.K.J.,
Fiedler,R., and Granger.C.V. 1996. The Functional Independence Measure:
tests of scaling assumptions, structure, and reliability across 20 diverse
impairment categories, Arch.Phys.Med.Rehabil. 77: 1101-1108.
Streiner.D.L. and Norman,G.R. 1995. Health measurement scales: a
practical guide to their development and use, Oxford University Press,
Oxford.
Stucki.G., Liang.M.H., Fossel.A.H., and Katz.J.N. 1995a. Relative
responsiveness of condition-specific and generic health status measures in
degenerative lumbar spinal stenosis, J.Clin.Epidemiol. 48: 1369-1378.
Stucki.G., Stucki.S., Bruhlrnann.P., and Michel,B.A. 1995b. Ceiling effects of
the Health Assessment Questionnaire and its modified version in some
ambulatory rheumatoid arthritis patients, Ann.Rheum.Dis. 54: 461-465.
Suenkeler.I.H., Nowak,M., Misselwitz.B., Kugler.C., Schreiber.W.,
Oertel.W.H., and Back.T. 2002. Timecourse of health-related quality of life as
determined 3, 6 and 12 months after stroke. Relationship to neurological
deficit, disability and depression, J.Neurol. 249: 1160-1167.
Sulch.D., Evans,A., Melboum.A., and Kalra.L. 2002. Does an integrated care
pathway improve processes of care in stroke rehabilitation? A randomized
controlled trial, Age Ageing 31: 175-179.
Tate.D.G., Kalpakjian.C.Z., and Forchheimer.M.B. 2002. Quality of life issues
in individuals with spinal cord injury, Archives o f Physical Medicine and
Rehabilitation 83: S18-S25.
Tator.C.H. 1999. The stimulus for an acute spinal cord injury unit,
Can.J.Neurol. Sci. 26: 239-241.
Tennant,A. 2000. Measuring outcome, Br. Med. Bull. 56: 287-295.
Tennant,A., Geddes.J., and Chamberlain,M.A. 1996. The Barthel index: an
ordinal score or interval level measure?, Clin.Rehabil. 10: 301-308.
Testa,M.A. and Simonson,D.C. 1996. Assesment of quality-of-life outcomes,
N.Engl.J.Med. 334. 835-840.
Thompson,A.J. and Playford.E.D. 2001. Rehabilitation for patients with
Parkinson's disease, Lancet 357: 410-411.
Thuriaux.M.C. 1995. The ICIDH: evolution, status, and prospects,
Disabil.Rehabil. 17: 112-118.

Thurstone.L. L. 1928a. Attitudes can be measured, American Journal of
Sociology 33: 529-554.
Thurstone.L. L. 1928b. The measurement of opinion, Journal of Abnormal
and Social Psychology 22: 415-430.
Tow,A.M. and Kong.K.H. 1998. Central cord syndrome: functional outcome
after rehabilitation, Spinal Cord. 36: 156-160.
Trend,P., Kaye.J., Gage.H., Owen.C., and Wade.D. 2002. Short-term
effectiveness of intensive multidisciplinary rehabilitation for people with
Parkinson's disease and their carers, Clin.Rehabil. 16: 717-725.
Tulsky.D.S. and Rosenthal,M. 2002. Quality of life measurement in
rehabilitation medicine: Building an agenda for the future, Archives of
Physical Medicine and Rehabilitation 83: S1-S3.
Tunbridge,R. 1972. Rehabilitation services, Br.Med.J. 2: 727-728.
Tunis,S.L., Croghan.T.W., Heilman,D.K., Johnstone,B.M., and
Obenchain.R.L. 1999. Reliability, validity, and application of the medical
outcomes study 36-item short-form health survey (SF-36) in schizophrenic
patients treated with olanzapine versus haloperidol, Med.Care 37: 678-691.
Turner-Stokes.L. 2003. The development of clinical governance in the UK: its
implications for rehabilitation medicine, Clin.Med. 3: 135-141.
Turner-Stokes.L. and Hassan.N. 2002. Depression after stroke: a review of
the evidence base to inform the development of an integrated care pathway.
Part 1: Diagnosis, frequency and impact, Clin.Rehabil. 16: 231-247.

Unal.G., de Boer.J.B., Borsboom.G.J., Brouwer,J.T., Essink-Bot.M., and de
Man.R.A. 2001. A psychometric comparison of health-related quality of life
measures in chronic liver disease, J.Clin.Epidemiol. 54: 587-596.
Uniform Data System 1993. Guide for the Uniform Data Set for Medical
Rehabilitation (Adult FIM instrument), State University of New York, Buffalo,
NY.
Ustun.T.B., Chatterji.S., Bickenbach.J.E., Kostanjsek.N., and Schneider,M.
2003. The International Classification of Functioning, Disability and Health: a
new tool for understanding disability and health, Disabil.Rehabil. 25: 565-
571.
van Bennekom.C.A., Jelles.F., Lankhorst.G.J., and Bouter.L.M. 1996.
Responsiveness of the rehabilitation activities profile and the Barthel index,
J. Clin.Epidemiol. 49: 39-44.
van de Weg.F.B., Kuik.D.J., and Lankhorst.G.J. 1999. Post-stroke
depression and functional outcome: a cohort study investigating the influence
of depression on functional recovery from stroke, Clin.Rehabil. 13: 268-272.
van der Putten.J.J., Hobart,J.C., Freeman,J.A., and Thompson,A.J. 1999.
Measuring change in disability after inpatient rehabilitation: comparison of
the responsiveness of the Barthel index and the Functional Independence
Measure, J.Neurol.Neurosurg.Psychiatry 66: 480-484.
van der Putten.J.J., Stevenson.V.L., Playford.E.D., and Thompson,A.J. 2001.
Factors affecting functional outcome in patients with nontraumatic spinal cord
lesions after inpatient rehabilitation, Neurorehabil.Neural Repair 15: 99-104.

Verdier-Taillefer.M.H., Sazdovitch.V., Borgel.F., Cesaro.P., Kurtz,A.,
Millet.M.F., Roullet.E., and Marteau.R. 1995. Occupational environment as
risk factor for unemployment in multiple sclerosis, Acta Neurol.Scand. 92: 59-
62.
Wade.D.T. 1992. Measurement in neurological rehabilitation, Oxford
University Press, Oxford.
Wade.D.T. 1993. Measurement in neurologic rehabilitation,
Curr.Opin. Neurol. 6. 778-784.
Wade.D.T. 1998. Evidence relating to assessment in rehabilitation,
Clin.Rehabil. 12: 183-186.
Wade.D.T. 1999a. Goal planning in stroke rehabilitation: what?, Topics in
Stroke Rehabilitation 6: 8-15.
Wade.D.T. 1999b. Randomized controlled trials-a gold standard?,
Clin.Rehabil. 13:453-455.
Wade.D.T. 2002a. Diagnosis in rehabilitation: woolly thinking and resource
inequity, Clin.Rehabil. 16: 347-349.
Wade.D.T. 2002b. Rehabilitation is a way of thinking, not a way of doing,
Clin.Rehabil. 16: 579-581.
Wade.D.T. 2003. Community rehabilitation, or rehabilitation in the
community?, Disabil.Rehabil. 25: 875-881.

Wade.D.T. and Collin,C. 1988. The Barthel ADL Index: a standard measure
of physical disability?, Int.Disabil.Stud. 10. 64-67.
Wainwright.J.R., Sullivan,F.M., Morrison.J.M., MacNaughton.R.J., and
McConnachie.A. 1999. Audit encourages an evidence-based approach to
medical practice, Med.Educ. 33: 907-914.
Wallace,D., Duncan,P.W., and Lai.S.M. 2002. Comparison of the
responsiveness of the Barthel Index and the motor component of the
Functional Independence Measure in stroke: the impact of using different
methods for measuring responsiveness, J.Clin.Epidemiol. 55: 922-928.
Ware.J.E., Jr. 1987. Standards for validating health measures: definition and
content, J.Chronic.Dis. 40: 473-480.
Ware.J.E., Jr. 2003. Conceptualization and measurement of health-related
quality of life: Comments on an evolving field, Archives o f Physical Medicine
and Rehabilitation 84: S43-S51.
Ware.J.E., Jr. and Sherboume.C.D. 1992. The MOS 36-item short-form
health survey (SF-36). I. Conceptual framework and item selection,
Med.Care 30: 473^83.
Wehman.P., Kregel.J., Keyser-Marcus.L., Sherron-Targett.P., Campbell,L.,
West.M., and Cifu.D.X. 2003. Supported employment for persons with
traumatic brain injury: a preliminary investigation of long-term follow-up costs
and program efficiency, Arch.Phys.Med.Rehabil. 84: 192-196.

Wennberg.J.E., Bunker,J.P., and Barnes,B. 1980. The need for assessing
the outcome of common medical practices, Annu.Rev.Public Health 1: 277-
295.
Wiles,C.M., Newcombe.R.G., Fuller,K.J., Shaw,S., Fumival-Doran,J.,
Pickersgill.T.P., and Morgan,A. 2001. Controlled randomised crossover trial
of the effects of physiotherapy on mobility in chronic multiple sclerosis,
J. Neurol. Neurosurg. Psychiatry 70: 174-179.
Williams,G.H. 1987. Disablement and the social context of daily activity,
lnt.Disabil.Stud. 9: 97-102.
WIson.I.B. and Cleary,P.D. 1995. Linking clinical variables with health-
related quality of life. A conceptual model of patient outcomes, JAMA 273:
59-65.
Wood,P H. 1989. A man's reach should exceed his grasp. The 1988 Philip
Nichols Memorial Lecture, Int.DisabiiStud. 11: 1-8.
World Health Organisation 1980. International Classification of Impairments,
Disabilities and Handicaps, WHO, Geneva.
World Health Organisation 1998a. Development of the World Health
Organization WHOQOL-BREF quality of life assessment. The WHOQOL
Group, Psychol.Med. 28. 551-558.
World Health Organisation 1998b. The World Health Organization Quality of
Life Assessment (WHOQOL): development and general psychometric
properties, Soc.Sci.Med. 46: 1569-1585.

World Health Organisation 2001. International Classification of Functioning,
Disability and Health, WHO, Geneva.
Young,W., Rewa.G., Coyte.P.C., Jaglal.S.B., Goodman,S., Bentley-
Taylor.M., Fountas.P., Gupta,A., Levinson,A., and O'Connor,T. 2003. The
development of Partners for Health's integrated community pathway for
postmyocardial infarction patients, Can. J.Cardiol. 19: 231-235.
Zaslavsky,A.M., Zaborski.L.B., and Cleary,P.D. 2002. Factors affecting
response rates to the Consumer Assessment of Health Plans Study survey,
Med.Care 40: 485-499.
Zigmond.A.S. and Snaith.R.P. 1983. The hospital anxiety and depression
scale, Acta Psychiatr.Scand. 67: 361-370.

Appendix 1 Self-report Barth el index
These are some questions about your ability to look after yourself
They might not seem to apply to you; please answer them all Tick one box in each section
In the bath or shower, do you
manage on your own?
need help getting in and out?
need other help?
never have a bath or shower?
need to be washed in bed?
Do you climb stairs at home
without any help?
with someone carrying your frame?
with someone encouraging you?
with physical help?
not at all?
don’t have stairs?
Do you get dressed
without any help?
just with help with buttons?
with someone helping you most of the time?

Do you walk indoors
without any help apart from a frame?
with one person watching over you?
with one person helping you?
with more than one person helping you?
not at all?
Or do you use a wheelchair independently?
Do you move from bed to chair
on your own?
with a little help from one person?
with a lot of help from one or more people?
not at all?
Do you eat food
without any help?
with help cutting food or spreading butter?
with more help?
Do you use the toilet or commode
without any help?
with some help but can do something?
with quite a lot of help?
228
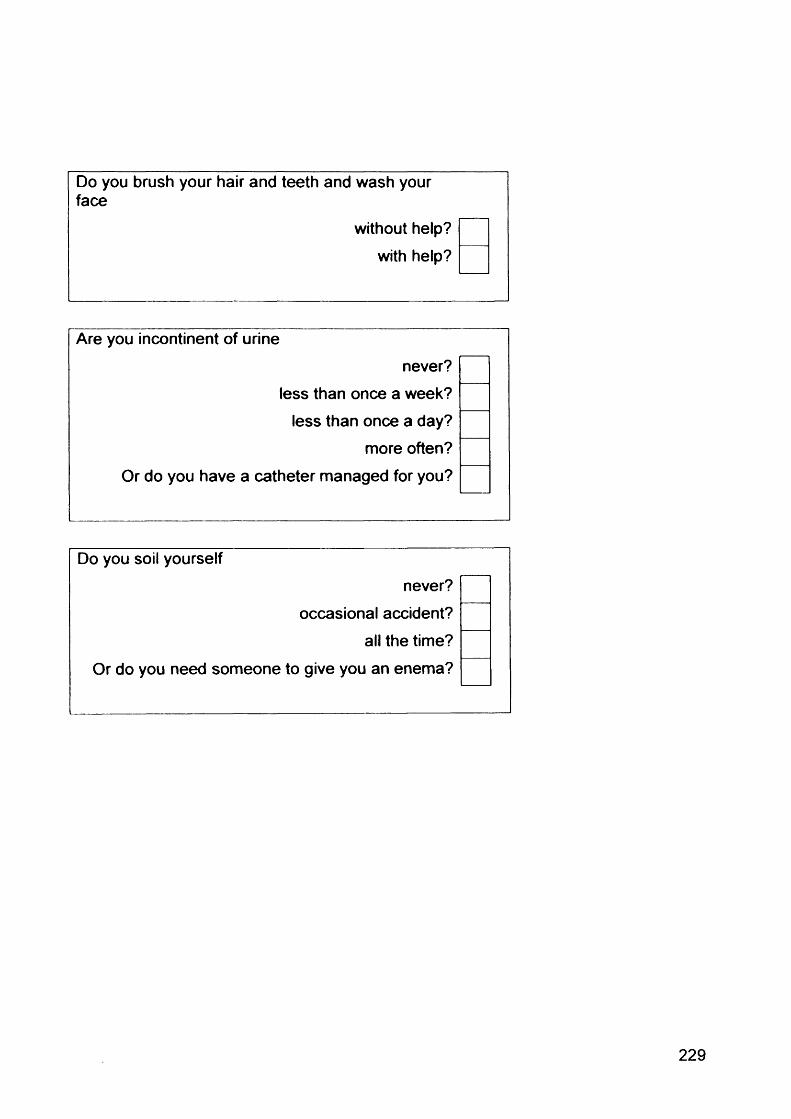
Do you brush your hair and teeth and wash your face
without help?
with help?
Are you incontinent of urine
never?
less than once a week?
less than once a day?
more often?
Or do you have a catheter managed for you?
Do you soil yourself
never?
occasional accident?
all the time?
Or do you need someone to give you an enema?

Appendix 2 General Health Questionnaire
We should like to know if you have had any medical complaints and how
your health has been, over the past few weeks. Please answer all the
questions on the following page simply by marking the answer which you
think most nearly applies to you. Remember that we want to know about
present and recent complaints, not about those you have had in the past.
Have you recently Better Same Worse Muchthan as than worse
Been feeling perfectly well and in good health?
usual
1
usual
2
usual
3
than usual
4
Been feeling you need a good tonic? 1 2 3 4
Been feeling run down and out of sorts? 1 2 3 4
Felt that you are ill? 1 2 3 4
Been getting any pains in your head? 1 2 3 4
Been getting a feeling of tightness or pressure in your head? 1 2 3 4
Been having hot or cold spells? 1 2 3 4
Have you recently
Lost much sleep over worry?
Had difficulty staying asleep once you were off?
Feel constantly under strain?
Been getting edgy and bad-tempered?
Been getting scared or panicky for no good reason?
Found everything getting on top of you?
Been feeling nervous and strung-up all the time?
Betterthanusual
Same Worse as than
usual
2
22
2
2
2
Much worse
usual than usual
3
3
33
3
3
3
4
4
4
4
4
4
4
230

Have you recently Better Same Worse Muchthan as than worseusual usual usual than usual
Been managing to keep yourself busy and occupied? 1 2 3 4
Been taking longer over things you do? 1 2 3 4Felt on the whole you were doing things well? 1 2 3 4Been satisfied with the way you’ve carried out tasks? 1 2 3 4
Felt that you were playing a useful part in things? 1 2 3 4
Felt capable of making decisions about things? 1 2 3 4
Been able to enjoy your normal day to day activities? 1 2 3 4
Have you recently
Been thinking of yourself as a worthless person?
Felt that life is entirely hopeless?
Felt that life isn’t worth living?
Thought of the possibility that you might make away with yourself?Found at times that you couldn’t do anything because your nerves were too bad?
Been wishing you were dead and away from it all?Found that the idea of taking your own life kept coming into your mind?
Not at all
Nomorethanusual
Rathermorethanusual
Much more than
usual
4
4
231

Appendix 3 Hospital Anxiety and Depression Scale
These are some questions about how you are feeling. Please answer them
all; tick one box in each section.
1 feel tense or “wound up”
most of the time
a lot of the time
from time to time, occasionally
not at all
1 still enjoy the things 1 used to enjoy
definitely as much
not quite so much
only a little
hardly at all
1 get a sort of frightened feeling as if something awful is about to happen
definitely and quite badly
yes, but not too badly
a little, but it doesn’t worry me
not at all
232

I can laugh and see the funny side of things
as much as always
not quite so much now
definitely not so much now
not at all
Worrying thoughts go through my mind
a great deal of the time
a lot of the time
from time to time, but not too often
only occasionally
I feel cheerful
not at all
not often
sometimes
most of the time
233

1 can sit at ease and feel relaxed
definitely
usually
not often
not at all
1 feel as if 1 am slowed down
nearly all the time
very often
sometimes
not at all
1 get a sort of frightened feeling like butterflies in the stomach
not at all
occasionally
quite often
very often
234

I have lost interest in my appearance
definitely
I don’t take as much care as I should
I may not take quite as much care
I take just as much care as ever
I feel restless as if I have to be on the move
very much indeed
quite a lot
not very much
not at all
I look forward with enjoyment to things
as much as I ever did
rather less than I used to
definitely less than I used to
hardly at all
235

I get sudden feelings of panic
very often indeed
quite often
not very often
not at all
I can enjoy a good book or radio or TV programme
often
sometimes
not often
very seldom
236

Appendix 4: Impact on Work Questionnaire
We are interested in how each of the following impacts on your ability to work. For each statement, please circle one answer that best describes your situation.
How much does Impact on your work (please circle)
Fatigue No at all A little Moderately Quite a bit Extremely
Balance No at all A little Moderately Quite a bit Extremely
Walking difficulties No at all A little Moderately Quite a bit Extremely
Visual problems No at all A little Moderately Quite a bit Extremely
Weakness No at all A little Moderately Quite a bit Extremely
Handwriting No at all A little Moderately Quite a bit Extremely
Pain No at all A little Moderately Quite a bit Extremely
Coordination No at all A little Moderately Quite a bit Extremely
Speech No at all A little Moderately Quite a bit Extremely
Swallowing No at all A little Moderately Quite a bit Extremely
Continence No at all A little Moderately Quite a bit Extremely
Concentration No at all A little Moderately Quite a bit Extremely
Memory No at all A little Moderately Quite a bit Extremely
Mood No at all A little Moderately Quite a bit Extremely
Travel to work No at all A little Moderately Quite a bit Extremely
Access at work No at all A little Moderately Quite a bit Extremely
Public attitudes No at all A little Moderately Quite a bit Extremely
237