Measuring Systemic Risk in the European Banking and ... · in the European Banking and Sovereign...
24
Measuring Systemic Risk in the European Banking and Sovereign Network 15 August, Sao Paulo Frank Betz* European Investment Bank Tuomas Peltonen* European Central Bank Nikolaus Hautsch University of Vienna Melanie Schienle Leibniz University Hannover *The views and results presented here are those of the authors and may not represent those of the ECB or the EIB
Transcript of Measuring Systemic Risk in the European Banking and ... · in the European Banking and Sovereign...

Measuring Systemic Risk in the European Banking and
Sovereign Network 15 August, Sao Paulo
Frank Betz* European Investment Bank
Tuomas Peltonen*
European Central Bank
Nikolaus Hautsch University of Vienna
Melanie Schienle
Leibniz University Hannover
*The views and results presented here are those of the authors and may not represent those of the ECB or the EIB

Systemic risk contributions 2
Motivation
The global financial crisis • Highlighted the need for tools to better understand and measure
systemic risk • Systemic risk contributions of individual banks important for
regulatory purposes (e.g. application of SIFI buffers)
The European experience • Reversal of financial market integration • Feedback loop between weak banks and fiscally strained
sovereigns, particularly at the height of the European sovereign debt crisis
• We see a need for tools that represent these features of the European experience

Systemic risk contributions 3
This project…
• Provides a framework for estimating time-varying systemic risk
contributions of individual banks based on tail dependence in asset prices
• The systemic risk contributions explicitly take into account the interconnectedness of banks.
• Represents interconnectedness via time-varying tail risk networks that are determined in a fully data-driven way
• Tail dependence networks as surveillance tool to track banking sector fragmentation and sovereign-bank interaction during the European sovereign debt crisis
Apresentador
Notas de apresentação
Tail dependence in asset prices increases during systemic events direct contractual links and heightened counterparty credit risk indirectly through price effects and liquidity spirals.

Systemic risk contributions 4
Related literature
Data-driven econometric assessment of network linkages • Hautsch, Schaumburg, and Schienle (2014a,b) ; Billio et al. (2012);
Diebold, Yilmaz (2013) Measurement of systemic risk contributions • Acharya, Pedersen, Philippon, and Richardson (2010); Adrian and
Brunnermeier (2011); Brownlees and Engle (2012),… Sovereign-bank interaction • Ejsing and Lemke (2011), Alter and Schüler (2012), Arnold (2012),
Bruyckere, Gerhardt, Schepens, and Vennet (2013), Alter and Beyer (2014), and Correa, Lee, Sapriza, and Suarez (2014)
Apresentador
Notas de apresentação
Project related to three strands of literature: networks, systemic risk, sovereign-bank interaction Most relevant paper HSS (2014a). Static network Bank-by-bank estimates of systemic risk contributions US data This project: Time varying networks System estimation of systemic risk contributions European data
Introduction
Data
Methodology
Results
Conluding remarks
Systemic risk contributions 5
Outline

Systemic risk contributions 6
Data definitions and sources
1) Banks (source: Bloomberg) – 51 large listed European banks, covering 70% European banking sector – Balance sheet data: leverage (total assets over total equity), loan loss
reserves, the P/B ratio, ROE, ROA, the loan-to-deposit ratio, the ratio of net short-term borrowing to total liabilities, the cost-to-income ratio and total assets.
– Asset price data: equity prices and 5-year CDS spreads
2) Sovereigns (Source: Bloomberg) – 17 sovereigns, corresponding to the countries where the banks in the sample
are headquartered: Austria, Belgium, Cyprus, Germany, Denmark, Spain, Finland, France, Greece, Hungary, Ireland, Italy, the Netherlands, Poland, Portugal, Sweden and the UK.
– 10-year benchmarks bonds, slope of the yield curve, 5-year CDS spreads.
3) Markets (Source: Bloomberg) – Euribor-OIS spread (liquidity and credit risk) and the VDAX index (risk
aversion)
Apresentador
Notas de apresentação
What are the largest banks accounting for 90% of total banking sector assets in Europe? Work with the listed subset because we need market prices CDS prices for 29 banks only CDS prices for 11 sovereigns

Introduction
Data
Methodology
Results
Conluding remarks
Systemic risk contributions 7
Outline

Systemic risk contributions 8
How does it work? 1st stage: • Estimate a bank’s VaR. Beyond bank-specific balance sheet
characteristics and market prices, take into account the loss exceedances of other banks in the system.
• Do this for all banks in the system to obtain the tail dependence network.
2nd stage: • Estimate the marginal systemic risk contribution. Partial
correlation between the VaR of an individual bank and the VaR of the system.
• Calculate the “realized” systemic risk contribution as a product of the estimated VaR and the marginal systemic risk contribution.
Apresentador
Notas de apresentação
Network: relate a bank’s VaR to trouble elsewhere in the financial system (either banks or banks and sovereigns) Two outputs from the first stage: a measure of bank-specific risk and the tail dependence network MSR: how responsive is a bank to market downturns. Realized systemic risk contribution brings together the individual and the systemic perspective

Systemic risk contributions 9
1st stage: Tail dependence networks
Apresentador
Notas de apresentação
Two specifications Baseline: VaR and loss exceedances based on stock returns difference in sovereign bond yields as state variables CDS: CDS prices only, banks and sovereigns treated symmetrically, that is loss exceedances for sovereign CDSs use alongside those of banks as risk drivers. Advantage: explicit representation of bank-sovereign linkages. Disadvantage: smaller sample.

Systemic risk contributions 10
2nd stage: Marginal systemic risk
Apresentador
Notas de apresentação
Alternative groups considered: 4 based on size, leverage, and net -> betas not different 4 based on size -> betas not different 2 based on size -> misses leverage dimension First stage output enter the specification in three ways: VaR, net, and RDI Net parameterized as log(out-degree + 1) Exploit the directed nature of the network: conditioning on incoming risk -> lower beta, outgoing risk -> higher beta

Systemic risk contributions 11
2nd stage: Realized systemic risk

Introduction
Data
Methodology
Results
Conluding remarks
Systemic risk contributions 12
Outline
Systemic risk contributions 13
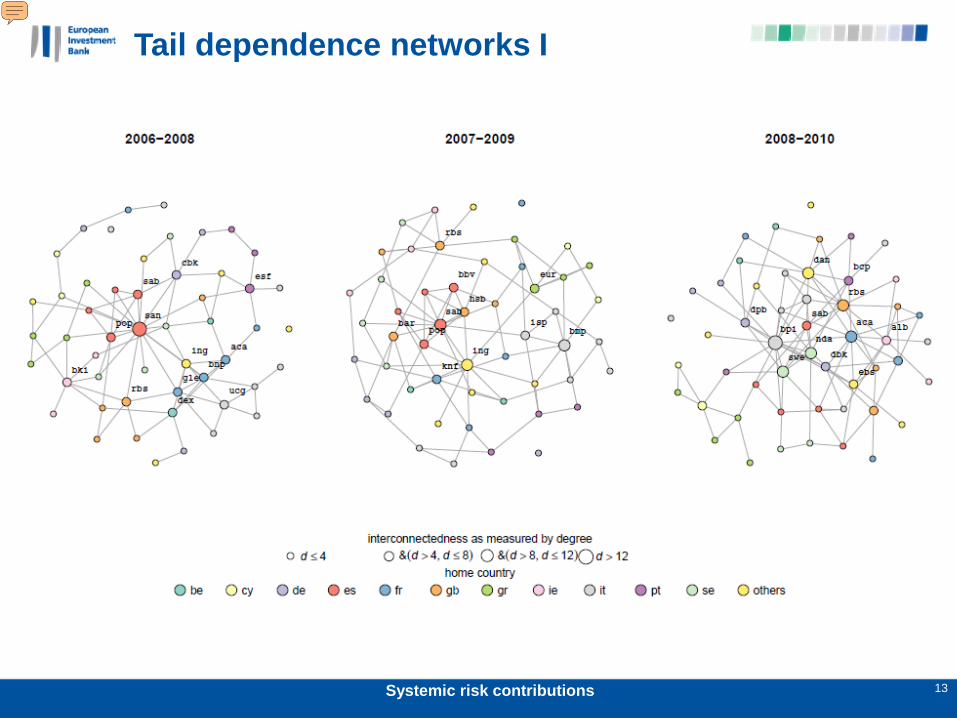
Tail dependence networks I2006-10
Apresentador
Notas de apresentação
Tail dependence networks for the first three subperiods (two years each, starting on 01/07 respectively) Based on first specification: bank equity prices and sovereign bond yield as state variables Size of the node represents degree Colour indicates a bank’s home country Network appears to be denser at the peak of the financial crisis Greek and Cypriotic banks move towards the fringe of the network (two links left in 2008-2010)

Systemic risk contributions 14
Tail dependence networks II, 2009-13
Apresentador
Notas de apresentação
Network appears to become sparser at the peak of the sovereign debt crisis (10 singletons in 2010-2012, 6 in 2011-2013) Not surprising: Sovereign bond yields not penalized, sovereigns more important in the transmission of tail risk Greek and Cypriotic banks a separate component of the network (probably a common factor, yet specific to GR and CY, more than just sovereign risk, which the specification controls for: country risk) There appears to be a clustering of tail dependence relationships at the country level. Possible interpretations: country risk has become more important, genuine financial fragmentation (cross-country deleveraging), stronger role for sovereign in transmitting shocks across borders (reflecting the sovereign debt crisis)

Systemic risk contributions 15
Financial fragmentation, equity prices
Network density All
Crisis countries
Other countries
2006 0.07 0.34 0.32 0.102007 0.07 0.37 0.35 0.172008 0.08 0.28 0.20 0.152009 0.06 0.47 0.45 0.252010 0.04 0.52 0.56 0.302011 0.05 0.45 0.44 0.17
Share of domestic links
Note: Crisis countries refers to group of countries composed of CY, ES, GR, IE, IT, and PT. Other countries refers to the average over all other countries.
Apresentador
Notas de apresentação
We can compute statistics characterizing the network to see whether the casual observations made before do actually hold Max(density) in 2008, min(density) in 2010. Share of domestic linkages peaks in 2010 INTERPRETATION!!! Crisis countries exhibit higher share of domestic linkages Column (2) based on entire network, Columns (3) and (4) average of the share of domestic linkages of crisis and non-crisis countries.

Systemic risk contributions 16
Bank-sovereign tail risk network I
Apresentador
Notas de apresentação
Availability of CDS time series <- smaller number of banks and sovereigns Sovereign CDS prices as risk drivers rather than state variables, banks and sovereigns treated symmetrically Overall level of penalization higher -> higher network density Hardly any bank-sovereign interaction pre-crisis, increasing over time Still, banks tend to co-move with banks and sovereigns with sovereigns

Systemic risk contributions 17
Bank-sovereign tail risk network II
Apresentador
Notas de apresentação
Sovereigns and bank become increasingly interconnected during the sovereign debt crisis Not the centrality of the Italiand sovereign (2010-2012) In the last sub-period crisis country sovereigns (and semi-crisis such as ES and IT) appear to co-move more with banks than with non-crisis country sovereigns

Network density
Share of domestic
links
Share of sovereign-bank links
2006 0.13 0.22 0.012007 0.14 0.20 0.062008 0.18 0.20 0.102009 0.12 0.30 0.132010 0.17 0.32 0.212011 0.18 0.23 0.19
Systemic risk contributions 18
Financial fragmentation, CDS spreads
Note: The LASSO procedure for selecting the relevant risk drivers when constructing the underlying networks penalize sovereign CDS returns to the same extent as banks CDS returns. The share of domestic linkages only takes into account connections between banks.
Apresentador
Notas de apresentação
Column (1) shows network density in the last subperiod close to its peak. Consistent with previous table: sovereign have become more important in the transmission of tail risk. Consistent with the previous table, Column (2) suggest that the fragmentation of financial markets has peaked. Column (3) documents the dramatic increase in bank sovereign interaction. So far only a mild decrease vis-à-vis the peak.
Systemic risk contributions 19
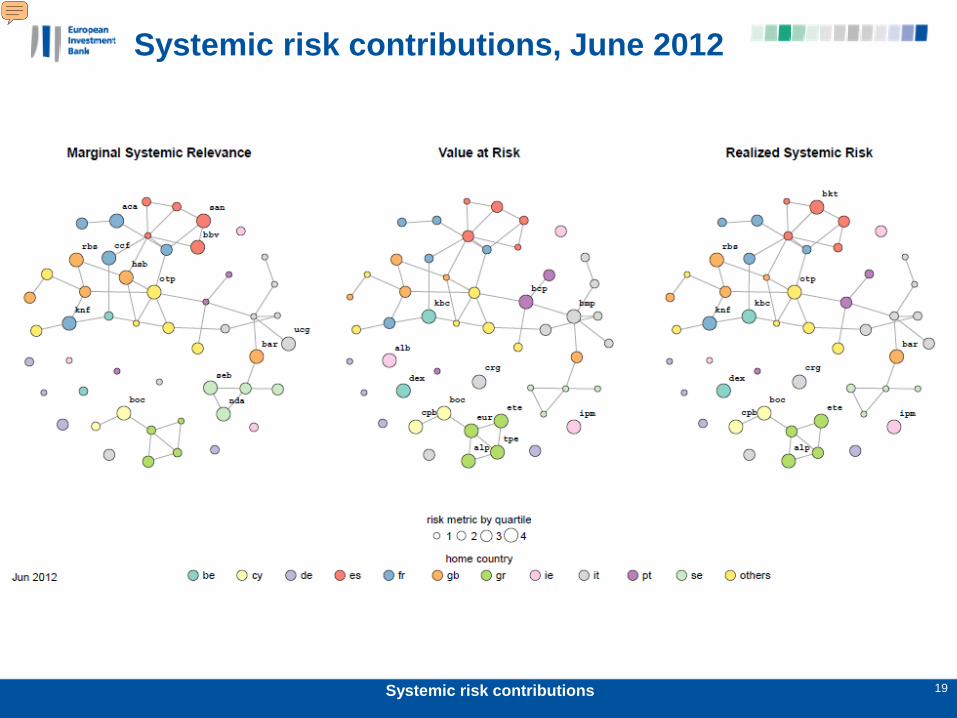
Systemic risk contributions, June 2012
Apresentador
Notas de apresentação
Plot of systemic risk and its two components. Node size represents the quartiles of the respective distributions. Large and therefore well known banks tend to rank highly in the MSR distribution -> exhibit a high degree of co-movement with the left tail of the index. This includes banks from countries not affected by the sovereign crisis (SE, UK) Banks that have received or were about to receive bailouts rank highly in the VaR distribution (GR, CY, IE, PT) GR and CY banks dominate the RSR ranking

Systemic risk contributions 20
Systemic risk ranking, June 2012
sysrisk betarank beta
varhatrank
varhat
Irish Life and Permanent 0.0193 0.1345 38 0.1432 1Bank of Cyprus 0.0136 0.2125 13 0.0639 6National Bank of Greece 0.0131 0.116 44 0.1129 2Dexia 0.0121 0.1583 28 0.0766 4Alpha Bank 0.01 0.1863 19 0.0539 7Royal Bank of Scotland 0.0095 0.2259 10 0.0423 14Banca Carige 0.0088 0.1059 45 0.083 3Barclays 0.0082 0.2557 3 0.0322 20Marfin 0.0075 0.1415 34 0.053 8Natixis 0.0073 0.2593 1 0.0281 22OTP Bank 0.0072 0.2582 2 0.0279 23KBC 0.0066 0.1355 36.5 0.0486 9Bankinter 0.0063 0.153 30 0.0411 15Lloyds 0.0062 0.1741 23 0.0355 19Piraeus 0.0062 0.1416 33 0.0437 11

Introduction
Data
Methodology
Results
Conluding remarks
Systemic risk contributions 21
Outline

Systemic risk contributions 22
Conclusions
• The paper provides a framework for estimating and visualising time-varying systemic risk contributions, and applies it to 51 large European banks over 2000q1-2013q3 – It takes into account the tail risk interdependencies and the centrality of
relevant entities in modelling systemic risk contributions – It incorporates both the sovereigns and banks into an estimated tail risk
network
• It shows how banking sector fragmentation and sovereign-bank
linkages evolved over the European sovereign debt crisis – It provides some indication that the fragmentation of the European financial
system has peaked and that the reintegration has started
• It illustrates the complexity of robustly deriving systemic risk contributions of individual banks
Thank you
Systemic risk contributions 23

Systemic risk contributions 24
Correlates of beta, June 2012
beta g size leverage connectedbeta 1.00 0.43 0.35 0.06 0.40g 0.43 1.00 0.58 0.54 -0.14size 0.35 0.58 1.00 0.30 0.02leverage 0.06 0.54 0.30 1.00 -0.23connected 0.40 -0.14 0.02 -0.23 1.00
Note: The table shows Kendall correlation coefficients