Measuring Success Factors of Quality Managementira.lib.polyu.edu.hk/bitstream/10397/1088/1/Accepted...
30
1 Measuring Success Factors of Quality Management in the Shipping Industry T. C. E. Cheng * and Petrus W.C. Choy Department of Logistics The Hong Kong Polytechnic University Hung Hom, Kowloon, Hong Kong Abstract It is generally accepted that quality management is considered a valuable competitive factor for firms that confers them competitive advantages and enables them to achieve superior performance. Although there have been numerous studies examining general quality management practices and implementation, industry-specific studies on quality management practices and factors that influence their success in the shipping industry are rather few. This study seeks to identify the factors that are critical to successful quality management, and attempts to develop a reliable, empirically-tested, and rigorously-validated measurement instrument for quality management, for the shipping industry. We conducted a large-scale survey of shipping industry executives and applied a rigorous research methodology to treat the survey data. We identified four success factors of quality management, which are top management commitment and participation, quality information and performance measurement, employee training and empowerment, and customer focus, and developed a functional instrument to measure quality management in the shipping industry. This paper contributes to research by identifying the success factors of quality management, and provides managerial insights on the successful management of quality, in the shipping industry. Keywords: Success factors, quality management, shipping industry _____________________ * Corresponding author. Email address: [email protected] Acknowledgement: This research was supported in part by The Hong Kong Polytechnic University under grant number 1-BB77. This is the Pre-Published Version.
Transcript of Measuring Success Factors of Quality Managementira.lib.polyu.edu.hk/bitstream/10397/1088/1/Accepted...

1
Measuring Success Factors of Quality Management in the Shipping Industry
T. C. E. Cheng* and Petrus W.C. Choy
Department of Logistics The Hong Kong Polytechnic University
Hung Hom, Kowloon, Hong Kong
Abstract
It is generally accepted that quality management is considered a valuable competitive factor for firms that confers them competitive advantages and enables them to achieve superior performance. Although there have been numerous studies examining general quality management practices and implementation, industry-specific studies on quality management practices and factors that influence their success in the shipping industry are rather few. This study seeks to identify the factors that are critical to successful quality management, and attempts to develop a reliable, empirically-tested, and rigorously-validated measurement instrument for quality management, for the shipping industry. We conducted a large-scale survey of shipping industry executives and applied a rigorous research methodology to treat the survey data. We identified four success factors of quality management, which are top management commitment and participation, quality information and performance measurement, employee training and empowerment, and customer focus, and developed a functional instrument to measure quality management in the shipping industry. This paper contributes to research by identifying the success factors of quality management, and provides managerial insights on the successful management of quality, in the shipping industry. Keywords: Success factors, quality management, shipping industry _____________________ *Corresponding author. Email address: [email protected] Acknowledgement: This research was supported in part by The Hong Kong Polytechnic University under grant number 1-BB77.
This is the Pre-Published Version.

2
Introduction
Global competition is increasingly severe as more countries are embracing the free market
model and opening up their borders for investments and trading (Lee, 2002). To stay
competitive, a company’s fundamental business strategy must focus on seeking strategic
advantages through enhancing its business excellence and performance. Quality
management provides an effective approach to carry out this fundamental business strategy.
As pointed out by Temtime (2003), quality management has become an indispensable and
a globally pervasive strategic force in today’s turbulent and dynamic business world, and
the increasing intensity of global competition has made quality management a prerequisite
for business survival. It is generally agreed that companies that pursue sound quality
management practices will become more competitive due to business excellence and
enhanced performance (Lee, 2002).
Shipping, a traditional industry, remains the most important mode of transportation
in international trade. Seen or unseen, a substantial percentage of the world’s trade is
carried on merchant ships, and someone, somewhere has to have the skills to sail, service,
design and build replacements for the global trading merchant ships that are afloat in the
world (Grey, 2003). Despite being nearly invisible, the shipping industry is bigger than
most people have ever thought of. As such, nobody can deny the enormous value that
shipping has helped to add to the global market (Stopford, 2004). The success and survival
of the shipping industry is critically important for international trade and global economic
growth, given that the role played by the shipping industry has no immediate or direct
substitute. Like other industries, the shipping industry is confronted with traditional and
new challenges, which prompt shipping companies to seek improvement through quality

3
management in the performance of their core processes and services in order to stay
competitive.
Although there have been numerous studies examining the elements that constitute
quality management, the factors that are critical to the success of quality management
implementation (e.g., Black and Porter, 1996; Powell, 1995; Saraph et al., 1989; Yosuf and
Aspinwall, 1999), and the relationship between quality management practices and
organizational performance (e.g., Hendricks and Singhal, 1997; Ittner and Larcker, 1996;
Lemak et al., 1997), studies on quality management in the logistics industry are few in
number (Lai et al., 2004), and relatively limited research has been devoted to studying
factors that influence the success of quality management in the shipping industry. This
study seeks to fill this research gap by identifying the factors that are critical to successful
quality management in the shipping industry. We also attempt to develop a reliable,
empirically-tested, and rigorously-validated measurement instrument for quality
management in the context of the shipping industry.
This study is organized as follows. In the next section we review the relevant
literature on quality management in the shipping industry. In the third section we discuss
the identification of the success factors of quality management in the shipping industry and
detail the development of their measurement scales. We describe and justify the research
methodology, followed by analysis and discussion of the empirical results in the fourth
section. In the fifth section we discuss the research findings and their theoretical and
managerial implications, and we conclude the study in the final section.
Literature Review
Not long ago, the terms “quality” and “transportation services” seldom appeared in the

4
same sentence, nor was “quality” mentioned in the shipping sector. Purchasers of materials
and parts have been actively pursuing quality management throughout the supply base, but
buyers of transportation services and the industry that serves them, i.e., the shipping
industry, have been less enthusiastic about quality. Minahan (1998) stated that it is fair to
say that service industries, like the shipping industry, have been slower to get on the quality
bandwagon than production companies, mainly because: (1) it is more difficult to measure
a service defect than a defective part or material, (2) service industries have more of a
hurdle in terms of creating a quality culture, (3) quality management and ISO have
primarily been focused on measuring material and part problems using very specific
metrics, while services require more subjective measures, (4) quality systems are initially
designed for the manufacturing environment, and one has to use a lot of creativity to
convert those standards and relate them to the service environment, (5) logistics quality
lacks clarity about measurements and suffers from a lack of information systems to support
such measurements, and (6) to make matters worse, shippers have been slow to agree on
the exact meaning of quality for transportation services. Despite these hurdles, many
transportation providers, including shipping companies, have increasingly been taking a
proactive role in managing and improving quality in their businesses. Various
transportation service providers have had quality measurement and improvement
programmes in place for more than a decade.
Lai et al. (2004) stated that a number of factors are seen to account for an increase
in the adoption of quality management systems in the logistics industry, which include a
rise in quality awareness, an increase in customer pressure, and a need to install a
mechanism to improve work processes. In recent years, intensified competition, rising

5
performance expectations of shippers, who are the core customers of the shipping industry,
and increased regulations for the industry have all prompted shipping companies to widen
the scope and increase the quality level of their services. Recognizing the positive impact
of quality management programmes on their businesses, three-fourths of the 165
respondent firms (which were members of the Australian Purchasing and Materials
Management Association) to the survey conducted by Millen et al. (1998) indicated that
they had implemented quality programmes, and 60% of the firms that had not done so were
planning to implement such programmes in the following three years. The increasing trend
towards implementing quality programmes in the logistics industry has led the shipping
industry to follow suit. As a result, shipping companies have been making progressive
efforts to design and implement comprehensive quality assessment and improvement
strategies or programmes with a view to improving performance, competitiveness, and
customer satisfaction (Minahan, 1998; Wisner, 1999).
While previous research has addressed different aspects of transportation service
quality, we devote this study to identifying the factors that are critical to successful quality
management, and developing a reliable, empirically-tested, and rigorously-validated
measurement instrument for quality management, for the shipping industry. To meet the
study’s objectives, we first develop a preliminary set of success factors of quality
management and their measurements in the shipping industry. They are the most common
and core factors of success of quality management that have substantially been adopted in
existing survey-based quality management studies, and that have been empirically
developed, tested, and validated.
Success Factors of Quality Management in the Shipping Industry

6
Following the approach adopted by Escrig-Tena (2003) and Kaynak (2003), we first
conducted an extensive review of the literature with the aim of identifying the success
factors pertinent to general quality management, and their measuring indicators. In a
synthesis of survey-based quality management research published between 1989 and 2000,
Sila and Ebrahimpour (2002) found 76 studies that used factor analysis to identify 25 most
commonly extracted factors for quality management practices. The factors receiving the
largest coverage in the studies surveyed include customer focus and satisfaction, employee
training, leadership and top management commitment, teamwork, employee involvement,
continuous improvement and innovation, and quality information and performance
measurement.
Based on an analysis of the empirical studies conducted by Ahire et al. (1996),
Andersen et al. (1995), Black and Porter (1996), Flynn et al. (1994), Powell (1995), and
Saraph et al. (1989), Kaynak (2003) summarized the most popular perspectives on quality
management practices, which are management leadership, employee relations, quality data
and reporting, supplier quality management, product/service design, and process
management.
Making reference to the measurements embedded in the European Foundation for
Quality Management Model and based on an extensive review of the literature, Claver et al.
(2003) developed a set of critical quality management factors, which comprise leadership,
quality planning, training, specialized training, supplier management, process
management, and continuous improvement.
From the transportation sector’s perspective, Wisner (1999) conducted a survey of
practitioners of the industry and found that the respondents (67.5% were carriers)

7
perceived that continuous quality improvement, obtaining customer feedback, top
management commitment, finding root causes of quality problems, employing quality
measurements, empowering employees to solve problems, quality training, setting quality
goals and standards, decentralizing the responsibility for quality, and fostering mutual
respect between management and employees, are the most important quality programme
elements for the transport industry.
Following Zhang et al. (2000), and based on the above critical reviews of important
quality management practices, we present in Table 1 comparisons of the most common and
core success factors of general quality management that are reliable, empirically-tested,
and validated. From the comparisons, we identify eight success factors of quality
management for this study, which include leadership, training, employee relations, process
management, quality data and reporting, supplier quality management, continuous
improvement, and customer focus. Based on this initial set of quality success factors for
this study, we further identify 60 measurement indicators that underpin the eight success
factors, which are presented in Table 2.
Content Validity We develop a survey instrument based on the identified success factors and their
measurement indicators. Before conducting surveys using the instrument, we tested its
content validity, i.e., the measurement indicators adequately cover the success factors of
quality management pertinent to the shipping industry (Kerlinger, 1978). We consider two
critical issues of content validity. First, the measurement indicators adequately cover all
relevant dimensions of quality management. Second, the proposed survey instrument as a
whole is well understood and worded, and is able to collect the data for the purposes of this
8
study. We assessed content validity by using a panel of experts, comprising two
independent experts - an academic with research expertise in quality management and an
experienced shipping executive - for a preliminary assessment, and subsequently a larger
panel of experts, comprising all senior industry practitioners, for a detailed assessment, to
judge how well the survey instrument meets the common questionnaire design standards
(Malhotra and Grover, 1998) and the expected requirements in terms of its coverage and
the degree to which its statements are unambiguously worded (Rao et al. 1999).
Based on the feedback from the experts, we modified the proposed survey
instrument in order to (1) improve its contents, ease of understanding, and texts, (2)
eliminate ambiguity, (3) delete duplicated and unnecessary measurement indicators as
appropriate in the case of the shipping industry - as a result, the number of measurement
indicators was reduced from 60 to 39 items, and (4) obtain all the experts’ agreement that
the instrument possesses content validity. With reference to the modified survey
instrument, we developed the survey questionnaire that includes the remaining 39
measurement indicators.
Data Collection This organizational-level study is based on empirical data collected through a
questionnaire survey administered to shipping industry executives. We invited respondents
to participate in our survey by randomly sampling shipowner members of the world’s two
major international maritime associations, namely the Baltic and International Maritime
Council (BIMCO), and the International Association of Independent Tanker Owners
(INTERTANKO). We mailed 1,028 survey packages to 803 owner members of BIMCO,
152 owner members of INTERTANKO, and 73 joint owner members of both BIMCO and

9
INTERTANKO. Fourteen survey packages were returned due to wrong addresses or
incorrect contact details in the databases of BIMCO and INTERTANKO. As a result, 1,014
survey packages, which made up the sample for this study, were received by the targeted
respondents. In the end, 166 responses were returned, of which four declined to respond
and one return was incomplete. In other words, a total of 161 usable returns were obtained
for analysis, yielding an effective response rate of 15.88%.
Respondent Profiles
The demographic data and salient profiles of the valid respondents were analyzed and
summarized. 71.4% of the respondents had been in business for more than 20 years, while
9.9% of the respondents had a company history of over 100 years. In terms of revenues,
81.4% and 20% of the respondents recorded annual revenues of over US$5 million and
over US$100 million, respectively. 67.7% of the respondents had been awarded quality
certificates, out of which 37.3% had received two or more quality certificates. The
majority of the respondents (92.5%) had implemented a certain degree of quality
management practices; however only 9.3% of the respondents had adopted quality award
criteria to assess and evaluate their quality management implementation. 59.6% of the
respondents stated that their customers require them to implement a certain degree of
quality assurance measures and/or improvement programmes. As a result, 68.4% of the
respondents received very great or great support from their shareholders and/or top
management to implement quality management. 68.2% of the respondents reported that
they had implemented quality management, and 78.0% of those with no implementation of
quality management planned to do so in the near future. Only 7% of the respondents (or
22.0% of those without implementing quality management) had neither implemented
10
quality management nor had any plan to do so.
Non-response Bias To test for potential non-response bias, we performed a series of t-tests of the mean values
of the responses to a sample of the measurements of success factors of quality management
between the early respondents group and the late respondents group, i.e., those who
responded on or before and after a cutoff date, respectively (Malhotra and Grover, 1998;
Oppenheim, 1996). The test result indicated that the mean values between the two groups
did not differ significantly, suggesting that non-response bias did not seem to be a problem
in this study.
Purification of Items (Measurement Indicators) The measurement items needed to be purified before a factor analysis was conducted on
them. When factor analysis is conducted before purification, it produces many more
dimensions than can be conceptually identified, confounding the interpretation of the
factor analysis (Churchill, 1979). We adopted two criteria to purify (eliminate) items
before conducting a factor analysis. First, items for a given success factor exhibiting a
corrected item-total correlation (i.e., the correlation of each item with the sum of all other
items) less than 0.50 are usually candidates for elimination (Hair et al., 1998; Koufteros,
1998; Malhotra and Grover, 1998; Robinson et al., 1991; Torkzadeh and Dhillon, 2002).
Second, items are also eliminated using internal consistency reliabilities. The reliability of
the items comprising each success factor is examined using Cronbach’s alpha (α), and
items are eliminated if the reliability of the remaining items is at least 0.90, or items are
retained for further analysis if the reliability of the remaining items is less than 0.90

11
(Torkzadeh and Dhillon, 2002).
The corrected item-total correlation eliminated eight measurement indicators, i.e.,
V29, V44, V45, V46, V47, V48, V53, and V54, out of the original 39 measurement
indicators. All the eliminated measurement indicators had a corrected item-total
correlation below 0.50. Thus 31 measurement indicators were retained for the reliability
test. The reliability test further eliminated one measurement indicator (V26). As a result,
30 measurement indicators for success factors of quality management were retained for the
subsequent factor analysis.
Kaiser-Meyer-Olkin (KMO) Measure and Bartlett’s Test
Before conducting factor analysis, we performed two tests to check the possible presence
of multicollinearity or correlation among the items and the appropriateness of factor
analysis. KMO quantifies the degree of intercorrelations among the variables and the
appropriateness of factor analysis (Norusis, 1999) with a value above 0.50 for either the
entire matrix or an individual variable indicating appropriateness (Hair et al., 1998).
Bartlett’s test of sphericity tests for the presence of correlations among the variables, which
provides the probability that the correlation matrix has significant correlation among at
least some of the variables (Hair et al., 1998; Norusis, 1999).
The KMO values, which were all greater than the 0.50 threshold value, and the
results of the Barlett’s test, which were all significant beyond the 0.000 level for the
success factors of quality management, suggest that the correlation matrix is not an identity
matrix and that the intercorrelation matrix contains enough common variance to make
factor analysis of the 30 retained measurement indicators worth pursuing (Hair et al., 1998;
Torkzadeh and Dhillon, 2002).

12
Exploratory Factor Analysis (EFA) We performed an EFA of the retained items using the principal component analysis as the
extraction method and the varimax criterion as the rotation method of the retained items to
assess the unidimensionality of the retained items and, where appropriate, eliminate items
that are not factorially pure (Weiss, 1970). The main objective of using the EFA is to
summarize the identified (retained) items into a new and smaller set of uncorrelated
dimensions (i.e., success factors of quality management) with a minimum loss of
information (Ngai et al., 2004). The unidimensionality of each success factor is assessed
by examining the factor loadings. Items with factor loadings greater than 0.50 on the factor
that they are hypothesized to load on are considered adequate indicators for that factor
(Hair et al., 1998). In addition, the use of imprecise and ambiguous terms to label the
factors should be avoided (Bagozzi, 1981). The items in each category are assumed to be
measures of the same factor. Items that are not factorially pure and/or cross-load on
multiple factors are deleted. We used 0.4 as the cutoff value to delete items that cross-load
on multiple factor(s) (Ngai et al., 2004).
After extracting the factors by the EFA and appropriately labeling them, we
conducted a reliability assessment by calculating the Cronbach’s α for the extracted factor
model in order to ensure that the items comprising each success factor are highly reliable
and internally consistent (Hair et al., 1998). If the calculated Cronbach’s α is greater than
the critical point of 0.70 (Nunnally, 1978), the proposed success factor is said to be highly
reliable and internally consistent.
After four iterations of the EFA, 14 measurement indicators were eliminated and
the remaining 16 measurement indicators were organized under four factors. In other
13
words, the EFA produced a four-factor model with 16 measurement indicators for success
factors of quality management, whereby all the factor loadings met the threshold value of
0.50 or above and all the eigenvalues were greater than 1, which explains 72.209% of the
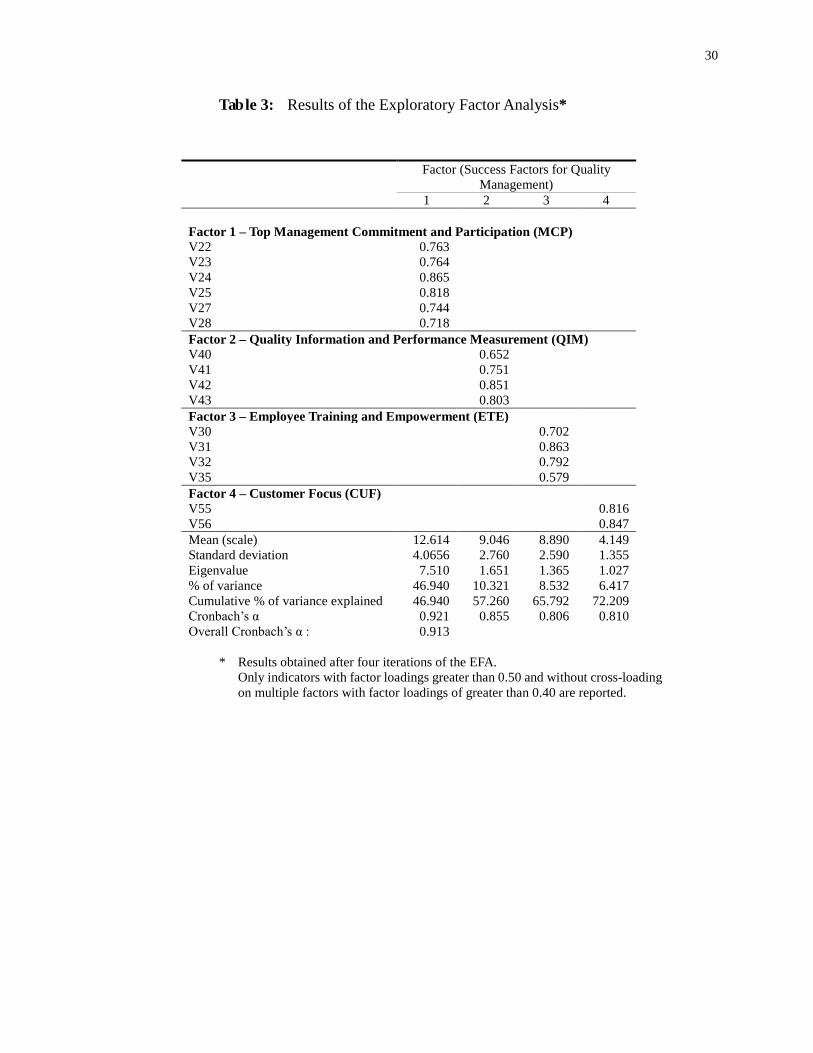
variance. The final EFA results are presented in Table 3.
We then interpreted the results of the EFA by assigning labels to the extracted
factors. In view of the nature and semantics of the measurement indicator descriptions for
the respective factors, it is theoretically acceptable to group them under the same success
factors and label them accordingly:
● Factor 1: Top Management Commitment and Participation (MCP) with six
measurement indicators comprising V22, V23, V24, C25, V27, and V28;
● Factor 2: Quality Information and Performance Measurement (QIM) with four
measurement indicators comprising V40, V41, V42, and V43;
● Factor 3: Employee Training and Empowerment (ETE) with four measurement
indicators comprising V30, V31, V32, and V35;
● Factor 4: Customer Focus (CUF) with two measurement indicators comprising
V55 and V56;
As for the reliability assessment of the factor model extracted by the EFA, the
results in Table 3 show that the values of the respective factors and the overall Cronbach’s
α’s for the four success factors of quality management were all above the recommended
critical point of 0.70 (Nunnally, 1978). There is clear evidence that the factor model
extracted by the EFA is highly reliable and internally consistent.
Construct Validity Having confirmed that the extracted factors are unidimensional and meet the necessary

14
levels of reliability, we conducted a final assessment of the validity of the constructs,
which addresses the issues of convergent, discriminant, and content validity (Hair et al.,
1998), in order to assess the extent to which a measure or a set of measures correctly and
accurately represents what it is supposed to, i.e., the degree to which it is free from any
systematic or non-random error (Carmines and Zeller, 1979). Convergent validity assesses
the degree to which two measures of the same construct are correlated (Hair et al., 1998). If
the t-value of the measurement scale is greater than ׀2׀ or ׀2.576׀, it is considered as
significant at the 0.05 and 0.01 levels, respectively, which indicates that the scale is
measuring its intended concept (Koufteros, 1998). Discriminant validity is the degree to
which two conceptually similar constructs are distinct (Hair et al., 1998). We tested
discriminant validity by comparing the Average Variance Extracted (AVE) of a construct
with its squared correlations with other constructs (Koufteros, 1998). Discriminant validity
is established if the AVE of a construct is substantially higher than the squared correlations
between this construct and all other constructs (Koufteros, 1998). Regarding content
validity, we assessed the degree of correspondence between the items selected to constitute
a summated scale and its conceptual definitions (Hair et al., 1998) by conducting
interviews with a panel of experts, comprising one academic and three senior executives
from international shipping companies, to judge and assess how well the measurement
instrument meets the standards (Emory and Cooper, 1991).
As for the results of convergent validity, the t-values of all the items in all the
success factors were higher than 2 or 2.576, which are significant at the 0.05 and 0.01
levels, respectively, indicating that the items are measuring the intended success factors. In
addition, the results show that all the success factors possess discriminant validity. Finally,

15
content validity reveals that the retained measurement indicators in the respective success
factors are confirmed to be adequately covering all the relevant dimensions of quality
management in the shipping industry. Overall, the results support the construct validity of
the retained measurement indicators for the four success factors of quality management
Based on the results of the EFA, reliability assessment, and tests of construct
validity as described above, we have developed a reliable, empirically-tested, and
rigorously-validated instrument to measure the success factors of quality management in
the shipping industry.
Discussion
With reference to the success factors of quality management, the results of this study are in
general in agreement with those reported in previous studies. Though the measurement
indicators for success factors of quality management may be classified in a different way
and/or the measurement constructs may be labeled in a different manner, the most
important success factors of quality management in the shipping industry as identified by
this study are: top management commitment and participation, employee training and
empowerment, quality information and performance measurement, and customer focus.
Recently, Lau et al. (2004) stated that it is conventional wisdom that firms implementing
quality management place a special emphasis on leadership, and strongly focus on human
resources, information and analysis, and customers and markets.
Top Management Commitment and Participation
Baidoun (2004) pointed out that this success factor is in tandem with all previous studies
and the existing literature (e.g., Ahire et al., 1996; Black and Porter, 1996; Da Silva Fonas
16
et al., 2002; Flynn, et al., 1994; Ho, 1995; Oakland, 1996; Prajogo and Sohal, 2004; Rao et
al., 1999; Saraph et al., 1989; Tamimi, 1998; Thiagarajan et al., 2001; Zairi et al., 1994;
Zhang et al., 2000), and with all major quality awards (e.g., the Malcolm Baldrige National
Quality Award; the European Quality Award; and the Deming’s Prize). He remarked that
there is unanimity in opinion amongst all quality gurus and every author of quality
management on the importance of top management commitment and participation as an
essential quality management element. In addition, most research has revealed that the
major problem of quality management implementation is a lack of top management
commitment and participation, which leads to its eventual failure (Al-Zamany et al., 2002;
Amar and Zain, 2002; Choi and Behling, 1997; Coeloh et al., 2004; Dahlgaard et al., 1994;
Dayton, 2003; Ljungström and Klefsjö, 2002; Prajogo and Sohal, 2004b; Radovilski et al.,
1996; Rao et al., 2004; Salegna and Fazel, 2000; Tamimi and Sebastianelli, 1998;
Tatikonda and Tatikonda, 1996). Our findings confirm that top management commitment
and participation is a significant success factor of quality management in the shipping
industry.
Employee Training and Empowerment
Mehta (1999) considered people as the foundation of quality management, while Da Silva
Fonas et al. (2002) stated that human resources are one of the strongest contributing factors
of companies implementing quality management. Escrig-Tena (2003) also pointed out that
employee-related quality management practices are all related to operation, quality and
financial results. Ugboro and Obeng (2000) reported that employment training and
empowerment are crucial elements of a successful quality management programme. In
short, employee training and empowerment is viewed as a key ongoing process in support

17
of organizational growth and advancement (Kassicieh and Yourstone, 1998).
Quality Information and Performance Measurement
The timeliness of providing quality data for performance measurement is crucial to
identifying quality problems and providing information on areas of possible improvement
(Choi, 1995; Ho et al., 1999; Lockamy, 1998). Williams et al. (2004) stated that there is
increasing demand for improved measures of quality performance, which are considered
as the technical part of quality management implementation (Evans and Lindsay, 1999), by
quality companies, which highlights the importance of quality information and
performance measurement. Lai et al. (2004) included measurement of performance based
on goals in their proposed ten-step approach towards implementing quality management in
the logistics industry. Jun et al. (2004) posited that erroneous measures or no measures to
track the progress of quality performance are one of the major reasons for the failure of
quality management efforts in many companies (Ljungström and Klefsjö, 2002; Tamimi
and Sebastianelli, 1998; Tatikonda and Tatikonda, 1996).
Customer Focus
Prior studies (e.g., Banker et al., 1996; Schlesinger and Heskett, 1991) have found that
increased market competition has led many firms to emphasize customer focus in order to
enhance customer satisfaction and to gain a competitive edge. Chong and Rundus (2004)
held that the greater the degree of market competition, the more positive the relationship
between the quality management practice of customer focus and organizational
performance is. They further suggested that the most important quality management
practice is customer focus, which denotes that the primary goal of any organization is the
18
delivery of goods/services to the full satisfaction of its customers. Horngren et al. (2003)
also pointed out that a strong emphasis on customer focus should lead to both market
expansion and gain in market share (Fornell, 1992; Zeithaml et al., 1993), and, ultimately,
in improved organizational performance (Chong and Rundus, 2004).
Conclusions
From a theoretical perspective, this industry-specific study identified four important
success factors of quality management in the shipping industry, which are consistent with
the frequently cited success factors of quality management in firms implementing quality
management in other industries. More importantly, we developed a reliable,
empirically-tested, and rigorously-validated instrument to measure the success factors of
quality management in the shipping industry. These success factors, which have not been
identified in the literature on quality management in the shipping industry, can be adopted
in future quality management research in the shipping industry. Overall, this study
contributes to the literature by expanding the knowledge-base of the global quality
improvement movement and by deepening the understanding of the factors that influence
the success of quality management in the industry-specific literature.
From a managerial perspective, the findings of this study are useful to quality
management practitioners in the shipping industry, because by recognizing the success
factors of quality management, shipping executives are better able to devise their own
quality management programmes that are unique (which are heterogeneous and cannot be
substituted) against their competitors, in order to achieve better performance and to sustain
competitive advantages. In short, the results of this study offer practical hints to shipping
management on the most profitable areas to focus their attention to in practising quality

19
management in their firms.
Although our findings may have broadened the understanding of the success
factors of quality management in the context of the shipping, our study is not immune from
several limitations, which we will leave as potential topics for future research.
First, our sample was drawn from owner members of BIMCO and
INTERTANKO. Future research should replicate our study by analyzing and focusing on
various sectors of the shipping industry, to evaluate and compare the results of sectoral
differences, and how sectoral differences would affect the mix of success factors of
quality management. In addition, the use of a larger sample should yield higher levels of
reliability and validity of the measurement instrument. Second, this study only collected
cross-sectional data that measure respondents’ perceptions at a point in time, which do
not capture the continuous transformations of respondents’ perceptions that might affect
the results. A longitudinal study is desirable for future research. Finally, our study is
exploratory in nature and so there is a lack of theories to underpin the research results. It
is natural to theorize based on some established management theories, e.g., the
resource-based theory, that the success of quality management will lead to improvement
in organizational performance. Thus, additional research should be undertaken to
examine the possible link between the success factors of quality management uncovered
in this study and measures of organizational performance in shipping firms. Such
research results will not only shed light on the relationship between quality management
and organizational performance, but also help further validate our findings by
establishing the success factors’ criterion-based validity.
20
References Ahire, S.L., Golhar, D.Y., and Waller, M.W. (1996). Development and validation of TQM
implementation constructs. Decision Sciences, 27(1), 23-56. Al-Zamany, Y., Hoddell S., and Savage B.M. (2002). Understanding the difficulties of
implementing quality management in Yemen. The TQM Magazine, 14(4), 240-247. Amar, K. and Zain, Z.M. (2002). Barriers to implementing TQM in Indonesian
manufacturing organizations. The TQM Magazine, 14(6), 367-372. Anderson, J.C., Rungtusanatham, M., Schroeder, R.G., and Devaraj, S. (1995). A path
analytical model of a theory of quality management underlying the Deming Management Method: preliminary empirical findings. Decision Sciences, 26, 636-658.
Bagozzi, R.P. (1981). An examination of the validity of two measures of attitude.
Multivariate Behavioral Research, 16, 323-359. Baidoun, S. (2004). Towards an index of comparative criticality: an empirical study of
TQM implementation in Palestinian industry. Total Quality Management, 15(1), 127-144.
Banker, R.D., Lee, S., Potter, G.A., and Srinivasan, D. (1996). Contextual analysis of
performance impact of outcome-based incentive compensation. Academy of Management Journal, 920-948.
Black, S.A. and Porter, L.J. (1996). Identification of critical factors in TQM. Decision
Sciences, 27(1), 1-21. Carmines, E.G. and Zeller, R.A. (1979). Reliability and Validity Assessment. Sage, Beverly
Hills, CA. Choi, T.Y. and Behling, O. (1997). Top managers and TQM success: one more look after
all these years. Academy of Management Executive, 11(1), 37-47. Choi, T.Y. (1995). Conceptualizing continuous improvement: implications for
organizational change. Omega, 23, 607-624. Chong V.K. and Rundus, M.J. (2004). Total quality management, market competition and
organizational performance. The British Accounting Review, 36, 155-172. Churchill Jr., G.A. (1979). A paradigm for developing better measures of marketing
constructs. Journal of Marketing Research, 16, 64-73. Claver, E., Tarí J.J., and Molina, J.F. (2003). Critical factors and results of quality

21
management: an empirical study. Total Quality Management, 14(1), 91-118. Coelho, R.P., James, E.M. and Tunc, E. (2004). Managing homo sapiens. Total Quality
Management, 15(2), 191-204. Da Silva Fonas, G., Kikuo, N. and Tadashi, O. (2002). Evaluation of TQM in Japanese
industries and validation of a self-assessment questionnaire. The TQM Magazine, 14(5), 318-328.
Dahlgaard, J.J., Kristensen, K., and Kanji, G.K. (1994). The Quality Journey: A Journey
Without an End. Carfax Publishing Company, Abingdon. Dayton, N.A. (2003) The demise of total quality management (TQM). The TQM Magazine,
15(6), 391-396. Emory, C.W. and Copper, D.R. (1991). Business Research Methods. Irwin, Boston, MA. Escrig-Tena, A.B. (2003). TQM as a competitive factor – a theoretical and empirical
analysis. International Journal of Quality and Reliability Management, 21(6), 612-637.
Evans, J.R. and Lindsay, W.M. (1999). The Management and Control of Quality.
South-Western College Publishing, Cincinnati, OH. Fornell, C. (1992). A national customer satisfaction barometer. Journal of Marketing, 55,
6-21. Flynn, B.B., Schroeder, R.G. and Sakakibara, S. (1994). A framework for quality
management research and an associated measurement instrument. Journal of Operations Management, 11(4), 339-366.
Grey, M. (2003). Home truths on the importance of shipping. Bimco Review 2003 (under
World Trade Section), 54-57. Hair, Jr., J.F., Anderson, R.E., Tatham, R.L., and Black, W.C. (1998). Multivariate Data
Analysis. 5th Edition. Prentice-Hall, Englewood Cliffs, NJ. Hendricks, K.B. and Singhal, V.R. (1997). The long-term stock price performance of
quality award winners. In D.B. Fedor and S. Ghosh (Eds.), Advance in the Management of Organizational Quality, Vol. 1. JAI Press, Greenwich, CT.
Ho, D.C.K., Duffy, V.G. and Shih, H.M. (1999). An empirical analysis of effective TQM
implementation in the Hong Kong electronics manufacturing industry. Human Factors and Ergonomics in Manufacturing, 9(1), 1-25.
Ho, S.K. (1995). TQM: An Integrated Approach, Implementing Total Quality Management
22
through Japanese 5-S and ISO 9000. Kogan Page, London. Horngren, C.T., Datar, S.M. and Foster, G. (2003). Cost Accounting: a Managerial
Emphasis. Pearson Education, Upper Saddle River, NJ. Ittner, C.D. and Larcker, D.E. (1996). Measuring the impact of quality initiatives on firm
financial performance. In D.B. Fedor and S. Ghosh (Eds.), Advance in the Management of Organizational Quality, Vol. 1. JAI Press, Greenwich, CT.
Jun, M., Cai, S. and Peterson, R.T. (2004). Obstacles to TQM implementation in Mexico’s
maquiladora industry. Total Quality Management, 15(1), 59-72. Kassicieh, S.K. and Yourstone, S.A. (1998). Training, performance evaluation, rewards,
and TQM implementation success. Journal of Quality Management, 3(1), 25-38. Kaynak, H. (2003). The relationship between total quality management practices and their
effects on firm performance. Journal of Operations Management, 21(4), 405-435. Kerlinger, F.N. (1978). Foundations of Behavioral Research. McGraw-Hill, New York,
NY. Koufteros, X.A. (1998). Testing a model of pull production: a paradigm for manufacturing
research using structural equation modeling. Journal of Operations Management, 17(1999), 467-488.
Lai, H., Lau, G. and Cheng, T.C.E. (2004), Quality management in logistics industry: an
examination and a ten-step approach for quality implementation. Total Quality Management, 12(2), 147-159.
Lau, R.S.M., Zhao, X. and Xiao, M. (2004). Assessing quality management in China with
MBNQA criteria. International Journal of Quality and Reliability Management, 21(7), 699-713.
Lee, P.M. (2002). Sustaining business excellence through a framework of best practices in
TQM. The TQM Magazine, 14(3), 142-149. Lemak, D.J., Reed, R. and Satish, P.K. (1997). Commitment to total quality management:
Is there a relationship with firm performance? Journal of Quality Management, 2(1), 67-87.
Ljungström, M. and Klefsjö, B. (2002). Implementation obstacles for a
work-development-oriented TQM strategy. Total Quality Management, 13, 621-634.
Lockamy III, A. (1998). Quality-focused performance measurement systems: a normative
model. International Journal of Operations and Production Management, 18,

23
740-766. Malhotra, M.K. and Grover, V. (1998). An assessment of survey research in POM: from
constructs to theory. Journal of Operations Management, 16, 407-425. Mehta, J. (1999). Business excellence through quality: Indian experience. Total Quality
Management, 10(4/5), 647-652. Millen, R., Sohal, A. and Moss, S. (1998). Quality management in the logistics function: an
empirical study. International Journal of Quality and Reliability Management, 16(2), 166-180.
Minahan, T, (1998). Providers get serious about improving quality. Purchasing, 124(1),
87-88. Ngai, E.W.T., Cheng, T.C.E. and Ho, S.S.M. (2004). Critical success factors of web-based
supply-chain management systems: an exploratory study. Production Planning & Control, 15(6), 622-630.
Norusis, M.J. (1999). SPSS 9.0 Guide to Data Analysis. Prentice-Hall, Englewood Cliffs,
NJ. Nunnally, J.C. (1978). Psychometric Theory. McGraw-Hill, New York, NY. Oakland, J.S. (1996). Total Quality Management, Text with Cases.
Butterworth-Heinemann, Oxford. Oppenheim, A.N. (1996). Questionnaire Design and Attitude Measurement. Heinemann
Educational Books Ltd., London. Powell, T.C. (1995). Total quality management as competitive advantage: a review and
empirical study. Strategic Management Journal, 16(1), 15-37. Prajogo, D.I. and Sohal, A.S. (2004). The sustainability and evolution of quality
improvement programmes – an Australian case study. Total Quality Management, 15(2), 205-220.
Radovilski, Z., Gotcher, J.W. and Slattsveen, S. (1996). Implementing total quality
management: statistical analysis of survey results. International Journal of Quality & Reliability Management, 13(1), January, 10-24.
Rao M.P., Youssef, M.A. and Stratton, C.J. (2004). Can TQM lift a sinking ship? A case
study. Total Quality Management, 15(2), 161-171. Rao, S.S., Silos, L.E. and Raghunathan, T.S. (1999). A framework for international quality
management research: development and validation of a measurement instrument.
24
Total Quality Management, 10(7), 1047-1075. Robinson, J.P., Shaver, P.R. and Wrightsman, L.S. (1991). Criteria for scale selection and
evaluation. In J.P. Robinson, P.R. Shanver, and L.S. Wrightsman (eds.), Measures of Personality and Social Psychological Attitudes. Academic Press, San Diego, CA.
Salegna, G. and Fazel, F. (2000). Obstacles to implementing TQM. Quality Progress, 33(7),
Milwaukee, July, 53-64. Saraph, J.V., Benson, P.G. and Schroeder, R.G. (1989). An instrument for measuring the
critical factors of quality management. Decision Sciences, 20(4), 810-829. Schlesinger, L.A. and Heskett, J.J. (1991). The service-driven company. Harvard Business
Review, 69(5), 71-81. Sila, I. and Ebrahimpour, M. (2002). An investigation of the total quality management
survey based research published between 1989 and 2000. International Journal of Quality & Reliability Management, 19(7), 902-970.
Stopford, M. (2004). World sea trade outlook: where China fits into the global picture.
Exploring Shipping Business in China, Mareforum & Tradewinds Conference, 26th February 2004.
Tamimi, N. (1998). A second order factor analysis of critical TQM factors. International
Journal of Quality and Reliability Management, 14(1), 71-79. Tamimi, N. and Sebastianelli R. (1998). The barriers to total quality management. Quality
Progress, 31(6), 57-60. Tatikonda, L.U. and Tatikonda, R.J. (1996). Top ten reasons your TQM effort is failing to
improve profit. Production and Inventory Management Journal, 37(3), 5-9. Temtime, Z.T. (2003). The moderating impacts of business planning and firm size on total
quality management practices. The TQM Magazine, 15(1), 52-60. Thiagarajan, T., Zairi, M. and Dale, B. (2001). A proposed model of TQM implementation
based on an empirical study of Malaysian. International Journal of Quality and Reliability Management, 18(3), 289-306.
Torkzadeh, G. and Dhillon, G. (2002). Measuring Factors that Influence the Success of
Internet Success. Information Systems Research, 13(2), 187-204. Ugboro, I.S. and Obeng, K. (2000). Top management leadership, employee empowerment,
job satisfaction, and customer satisfaction in TQM organizations: an empirical study. Journal of Quality Management, 5, 247-272.

25
Weiss, S. (1970). Beyond outsourcing: managing IT resources as a value center. Sloan
Management Review, 38(3), 51-64. Williams, R., van der Wiele, T., van Iwaarden, J. and Visser, R. (2004). TQM: why it will
again become a top management issue. International Journal of Quality and Reliability Management, 21(6), 603-611.
Wisner, J.D. (1999). A study of successful quality improvement programs in the
transportation industry. Benchmarking: An International Journal, 6(2), 147-163. Yosuf, S.M. and Aspinwall, E. (1999). Critical success factors for TQM implementation in
small and medium enterprises. Total Quality Management, 10(4), 803-809. Zairi, M., Letza, S. and Oakland, J. (1994). Does TQM impact on bottom line results? The
TQM Magazine, 6(1), 38-43. Zeithaml, V., Parasuraman, A. and Berry, L.L. (1993). Delivery Quality Service: Balancing
Customer Perceptions and Expectations. Free Press, New York. Zhang, Z. (2000). Developing a model of quality management methods and evaluating
their effects on business performance. Total Quality Management, 11(1), 129-137.

26
Table 1: Success Factors of Quality Management Identified from the Literature
This study Sila and
Ebrahimpour (2002)
Kaynak (2003)
Claver et al. (2003) Wisner (1999)
Leadership Leadership and top
management commitment
Management leadership
Leadership Top management commitment
Training Employee training Training / Specialized training
Quality training / Empowering employees to solve problems
Employee relations Employee involvement / Teamwork
Employee relations Decentralizing responsibility for quality / Fostering mutual respect between management and employees
Process management Process management / Product and service design
Process management
Quality data and reporting
Quality information and performance measurement
Quality data and reporting
Quality planning Employing quality measurement / Finding root causes of quality problems / Setting quality goals and standards
Supplier quality management
Supplier management Supplier management
Continuous improvement
Continuous improvement and innovation
Continuous improvement
Continuous quality improvement
Customer Focus Customer Focus and satisfaction
Obtaining customer feedback

27
Table 2: Initial 60 Measurement Indicators for Success Factors of Quality Management Leadership (adopted from Kaynak, 2003) V1. Extent to which the top management (responsible for organizational profit and loss) assumes
responsibility for quality performance. V2. Acceptance of responsibility for quality by top management within the organization. V3. Degree to which top management is evaluated for quality performance. V4. Extent to which the top management supports long-term quality improvement process. V5. Degree of participation by top management in the quality improvement process. V6. Extent to which the top management has objectives for quality performance. V7. Specificity of quality goals within the organization. V8. Comprehensiveness of the goal-setting process for quality within the organization. V9. Extent to which quality goals and policy are understood within the organization. V10. Importance attached to quality by top management in relation to cost and schedule objectives. V11. Amount of review of quality issues in top management meetings. V12. Degree to which the top management considers quality improvement as a way to increase profits. V13. Degree of comprehensiveness of the quality plan within the organization. Training (adopted from Claver et al., 2003) V14. Managers and supervisors declare that all employees are trained to help them understand how and
why the organization performs. V15. Most employees understand the basic processes used to create the services. V16. Higher management has developed an environment helping towards on-the-job-training. V17. Managers and supervisors participate in specialist training. Employee relations (adopted from Kaynak, 2003) V18. Extent to which employee involvement type programs are implemented in the organization. V19. Effectiveness of employee involvement type programs in the organization. V20. Extent to which employees are held responsible for error-free output. V21. Amount of feedback provided to employees on their quality performance. V22. Degree of participation in quality decisions by the employees.

28
V23. Extent to which building quality awareness among employees is ongoing. V24. Extent to which employees are recognized for superior quality performance. V25. Effectiveness of supervisors in solving problems / issues. Process management (adopted from Claver et al., 2003) V26. Continuous control and improvement of key processes. V27. Preventing faulty services is a strong practice. V28. The processes used include quality measures. V29. The employees involved in different processes know how to evaluate them. Quality data and reporting (adopted from Kaynak, 2003) V30. Availability of cost of quality data in the organization. V31. Availability of quality data V32. Timeliness of the quality data. V33. Extent of quality data collected by the service support areas of the organization. V34. Extent to which quality data are used as tools to manage quality. V35. Extent to which quality data are available to managers, supervisors and employees. V36. Extent to which quality data are used to evaluate supervisor and managerial performance. V37. Extent to which quality data, control charts, etc., are displayed at employee work stations. Supplier quality management (adopted from Kaynak, 2003) V38. Extent to which suppliers are selected based on quality rather than price or schedule. V39. Thoroughness of the supplier rating system. V40. Reliance on reasonably few dependable suppliers. V41. Amount of education of supplier by the organization. V42. Technical assistance provided to suppliers. V43. Involvement of the supplier in the service development process. V44. Extent to which longer term relationships are offered to suppliers. V45. Clarity of specifications provided to suppliers. V46. Responsibility assumed by purchasing department for the quality of incoming products / services. V47. Extent to which suppliers have programs to assure quality of their products / services.

29
Continuous improvement (adopted from Claver et al., 2003) V48. Program aimed at finding time and cost losses in all internal processes. V49. The organization reinforces continuous study and improvement of its services. V50. Use of specific organizational structure (quality committee, work teams) to support quality
improvement. V51. Identification of areas for improvement. V52. Information management aimed at supporting quality management (analysis of data regarding
business performance, cost and financial aspects in order to support the development of improvement priorities).
Customer focus (adopted from Claver et al., 2003 with additional items from Rao et al., 1999) V53. Increased personal contacts between the organization and customers. V54. Customers’ requirements are used as the basis for quality. V55. Extent to which the organization is totally committed to creating satisfied customers. V56. Extent to which the organization’s goals exceed customers’ expectations. V57. Extent to which executives demonstrate with their actions that customer satisfaction is important. V58. Extent to which employees know which attributes of the services the organization’s customer value. V59. Extent to which customers’ complaints are resolved. V60. Extent to which employees are encouraged to satisfy customers.
30
Table 3: Results of the Exploratory Factor Analysis*
Factor (Success Factors for Quality Management)
1 2 3 4 Factor 1 – Top Management Commitment and Participation (MCP) V22 0.763 V23 0.764 V24 0.865 V25 0.818 V27 0.744 V28 0.718 Factor 2 – Quality Information and Performance Measurement (QIM) V40 0.652 V41 0.751 V42 0.851 V43 0.803 Factor 3 – Employee Training and Empowerment (ETE) V30 0.702 V31 0.863 V32 0.792 V35 0.579 Factor 4 – Customer Focus (CUF) V55 0.816 V56 0.847 Mean (scale) 12.614 9.046 8.890 4.149 Standard deviation 4.0656 2.760 2.590 1.355 Eigenvalue 7.510 1.651 1.365 1.027 % of variance 46.940 10.321 8.532 6.417 Cumulative % of variance explained 46.940 57.260 65.792 72.209 Cronbach’s α 0.921 0.855 0.806 0.810 Overall Cronbach’s α : 0.913
* Results obtained after four iterations of the EFA.
Only indicators with factor loadings greater than 0.50 and without cross-loading on multiple factors with factor loadings of greater than 0.40 are reported.