Measuring social welfare, energy and inequality
25
Transcript of Measuring social welfare, energy and inequality


3
Measuring social welfare, energy and inequality in Germany
Holger Schlör, Wolfgang Fischer, Jürgen-Friedrich Hake1)
1) Forschungszentrum Jülich, Institute of Energy and Climate Research - Systems Analysis and Technology Evaluation (IEK-STE), D-52425 Jülich, Germany
Abstract
The Atkinson index is an inequality measure based on a social welfare function. We will use the Atkinson index as an analytical tool to examine the interactions between economic activity and energy services. The Atkinson index has a specific feature for the calculation of distribution. The index uses the epsilon parameter to explicitly re-veal the inequality aversion of society. Epsilon defines how sensitively the Atkinson index should react to income inequalities. The results of applying the Atkinson index could make a significant contribution to science and policy debates on income and energy equity in the context of sustainable development.
Keywords
Income Distribution, Energy, Atkinson Index, Welfare Measurement
Contribution to Applied Energy

4
I Introduction
Since the earliest times, people have striven to improve their living conditions. The
“universal currency” [Smil, 1994] used to measure this improvement is the amount of
energy consumed. The abundance of energy is the fundamental determinant for the
quality of life. In this paper, we will examine how the quality of life is distributed
among the members of society.
These distribution effects are of great political interest at a time when the discussion
about growing social dissimilarities is playing an increasing political role in the public
discussion [Sen, 1997, Wilkinson & Pickett, 2010, European Commission, 2010,
Stiglitz et al., 2009]. To achieve justice has therefore become an important sustaina-
bility goal encompassing economic, social and environmental aims [Agyeman, 2006,
Barry, 1991, Langhelle, 2000, Wissenburg, 2006, Jantti & Bojer, 2005, Hochschild,
1981, World Commission on Environment and Development (WCED), 1987, Mackay
& Probert, 1995].
Political reforms can be enforced more easily when they are seen to include political
measures that contribute to the social justice of society. Social justice is thereby al-
ways connected to the distribution of the material welfare of society [Brümmerhoff,
2007, 253]. The political interpretation of the distribution of social welfare confronts
society with a structural political problem. On the one hand, the political and social
institutions grant the same universal rights and privileges to all citizens. “But its eco-
nomic institutions rely on market-determined incomes that generate substantial dis-
parities among citizens in living standards and material welfare [Gordon, 1975, vii].”
This mixture of the same rights and unequal income generates social tensions be-
tween the political principles of society and the economic principles of capitalism.
“At some points along the way, society confronts choices that offer somewhat more
equality at the expense of efficiency or somewhat more efficiency at the expense of
equality. In the idiom of the economist, a trade-off emerges between equality and
efficiency [Gordon, 1975, vii].” In the following, we want to examine the extent of this
trade-off, while determining the dimension of the economic inequality. In addition, we
will examine not only the distribution of income and wealth, but also the distribution of
the universal currency (energy). Income covers the contribution of the individual to
national economic production, while consumption expresses the opportunity for indi-
viduals to stake a claim to the goods produced [Brümmerhoff, 2007].
Income forms the basis for consumption decisions by households, which decisively
determine our well-being [Sen, 2003, 89]. Or as Pigou said: “The economic welfare of
a community consists in the balance of satisfactions from the use of the national divi-
dend (or, as we should say, national product) over the dissatisfactions involved in the
making of it [Pigou, 1932].” Hence, the quality of life is determined by income and by
consumption [Hicks, 1975].
5
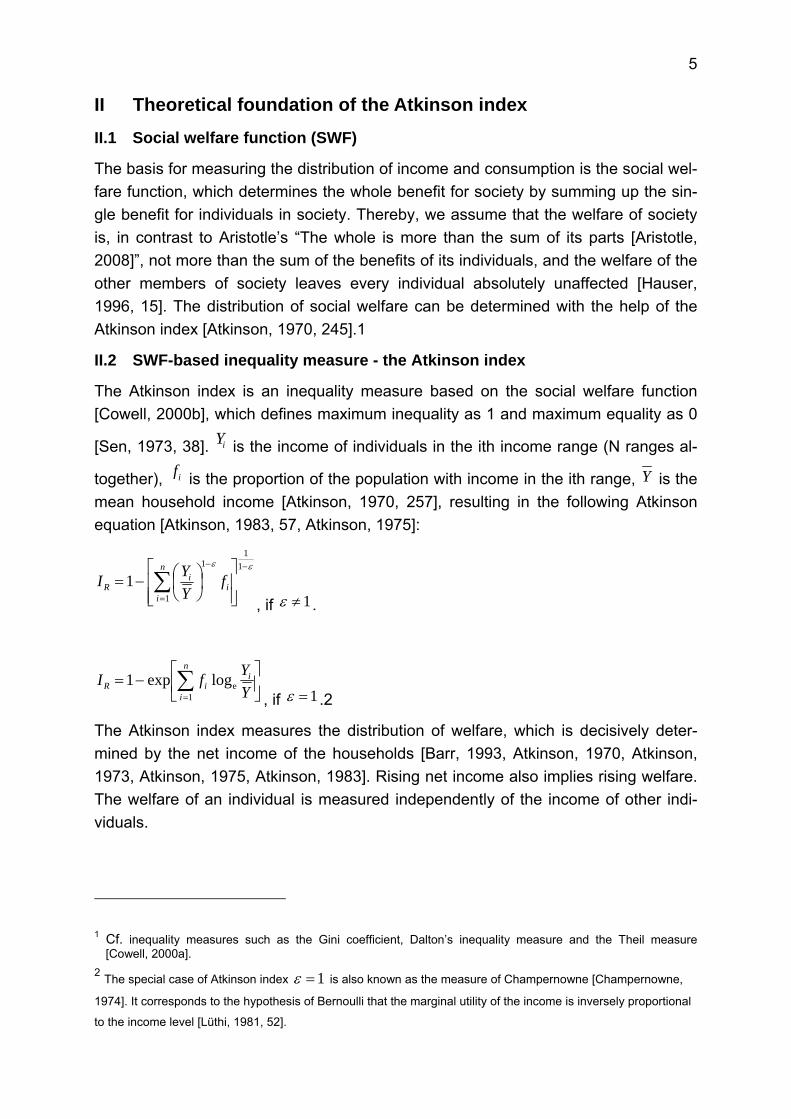
II Theoretical foundation of the Atkinson index
II.1 Social welfare function (SWF)
The basis for measuring the distribution of income and consumption is the social wel-
fare function, which determines the whole benefit for society by summing up the sin-
gle benefit for individuals in society. Thereby, we assume that the welfare of society
is, in contrast to Aristotle’s “The whole is more than the sum of its parts [Aristotle,
2008]”, not more than the sum of the benefits of its individuals, and the welfare of the
other members of society leaves every individual absolutely unaffected [Hauser,
1996, 15]. The distribution of social welfare can be determined with the help of the
Atkinson index [Atkinson, 1970, 245].1
II.2 SWF-based inequality measure - the Atkinson index
The Atkinson index is an inequality measure based on the social welfare function
[Cowell, 2000b], which defines maximum inequality as 1 and maximum equality as 0
[Sen, 1973, 38]. iY is the income of individuals in the ith income range (N ranges al-
together), if is the proportion of the population with income in the ith range, Y is the
mean household income [Atkinson, 1970, 257], resulting in the following Atkinson
equation [Atkinson, 1983, 57, Atkinson, 1975]:
1
1
1
1
1n
ii
iR f
Y
YI
, if 1 .
n
i
iiR Y
YfI
1elog exp1
, if 1 .2
The Atkinson index measures the distribution of welfare, which is decisively deter-
mined by the net income of the households [Barr, 1993, Atkinson, 1970, Atkinson,
1973, Atkinson, 1975, Atkinson, 1983]. Rising net income also implies rising welfare.
The welfare of an individual is measured independently of the income of other indi-
viduals.
1 Cf. inequality measures such as the Gini coefficient, Dalton’s inequality measure and the Theil measure [Cowell, 2000a].
2 The special case of Atkinson index 1 is also known as the measure of Champernowne [Champernowne,
1974]. It corresponds to the hypothesis of Bernoulli that the marginal utility of the income is inversely proportional
to the income level [Lüthi, 1981, 52].

6
Several authors have shown within the scope of the axiomatic approach that the At-
kinson index fulfils six axioms for inequality measures [Lüthi, 1981, 52, Litchfield,
1999, Cowell, 2000b, Seidl, 2001, Cowell, 2000a]. The axiomatic methodology “con-
sists of a rule-based system of thought which enables us to state precisely what we
mean by inequality comparison, and thereby what we mean by inequality [Amiel &
Cowell, 1999, 8].”
The Atkinson index fulfils
the Bresciani-Turroni condition (income scale independence) [Diekmann,
1981],
the criterion of the independence of the population size (principle of population
[Dalton, 1920, Amiel & Cowell, 1999, Cowell, 2000a]),
anonymity condition [Cowell, 2000a, Litchfield, 1999],
the Pigou-Dalton transfer principle [Dalton, 1920, Pigou, 1912, Amiel &
Cowell, 1992, Cowell, 2000a],
the operationality condition [Lüthi, 1981, 23pp.], and
the decomposability condition [Diekmann, 1981, Cowell, 2000b, 55ff., Litch-
field, 1999, Cowell & Bosmans, 2009, Amiel & Cowell, 1999, Cowell, 2000a].
The Atkinson index fulfils these six axioms and thus allows inequality to be measured
[Cowell, 1985].
II.3 Epsilon – Trade-off between equality und efficiency
The Atkinson index has a specific feature for calculating distribution, namely the pa-
rameter epsilon . Epsilon is the distribution focus of the distribution analysis. “This
parameter represents the weight attached by society to inequality in the distribution
[Atkinson, 1983, 56].” With the parameter epsilon ε, the size of the welfare difference
of additional income can be fixed between a person with a high income and a person
with a low income.
Epsilon “is clearly a measure of the degree of inequality-aversion – or the relative
sensitivity to transfer at different income levels. As rises, we attach more weight to
transfers at the lower end of the distribution and less weight to transfers at the top
[Atkinson, 1970, 257].”
The epsilon parameter defines how sensitively the Atkinson index should react to
income inequalities. The greater epsilon is, the stronger the Atkinson index reacts to
inequalities. Epsilon therefore represents the inequality aversion of society. It ranges

7
from zero if society is totally indifferent to the distribution of income to infinity if socie-
ty only considers the position of the lowest income group.3
One can say that epsilon represents the social trade-off between social equality and
economic efficiency. With the Atkinson parameter, a normative dimension is there-
fore incorporated into the inequality analysis, which allows a degree of social aver-
sion to be introduced into the inequality analysis. The advantage of the Atkinson in-
dex is that the epsilon parameter can be varied in such a way that the welfare of the
lower income groups is weighted strongly or weakly in the welfare measurement.
In the following, we address the question of what the socially acceptable value for
epsilon is, representing Gordon’s social trade-off between equality and efficiency. A
socially acceptable value for the parameter epsilon can be determined with Okun’s
leaky bucket experiment [Okun, 1975, 91-100, Atkinson, 1983, 58, Barr, 1993, 159,
Seidl, 2001, Lüthi, 1981].
Okun assumes in his experiment that 20% of American families in 1974 had an aver-
age net income of $ 5,000 and that the top 5% of families had a net income of
$ 45,000. If the top 5% pay additional income tax of 9% ($ 4,000) to the lowest 5%,
and if we take into consideration that the lowest 20% comprises 4 times more people,
then every family in the lower income group receives $ 1,000 [Okun, 1975, 91].
“However, the program has an unsolved technological problem: the money must be
carried from the rich to the poor in a leaky bucket. Some of it will simply disappear in
transit, so the poor will not receive all the money that is taken from the rich. The av-
erage poor family will get less than $ 1000, while the average rich family gives up $
4000 [Okun, 1975, 91].”
Okun assumes that every economic transfer is associated with transaction costs
(administrative costs, work effort, savings and investment, socioeconomic leakages)
[Okun, 1975, 96-100], which reduce the economic contribution to the poor. From this
the question arises as to how high the transaction costs should increase so that the
transfers can still be justified by society [Okun, 1975, 92]. This question can be an-
swered with the following formula [Lüthi, 1981]:
1
2 , x = transfer share1 x
.
If one assumes a socially acceptable transaction share of 29.5%, we obtain the fol-
lowing value for epsilon:
3 This analytical view is based on Rawls’ theory of justice, where inequality is determined by the “position of the
least advantaged members of society. Where epsilon lies between these extremes depends on the importance
attached to redistribution towards the bottom [Atkinson, 1983].”

8
1
21 x
12
1 0.295
1.418 2
ln 1.418
ln 2
0.5
If society accepts transaction costs of 50%, then we get an epsilon value of 1. If a
transfer loss of 75% is accepted, the epsilon value is 2. However, if society only ac-
cepts a transfer loss of 10%, than we get an epsilon value of 0.15. Okun has decided
for himself that he “would stop at a leakage of 60 percent” [Okun, 1975, 94] in his
example, representing an epsilon value of 1.3.
According to Okun, the question of the socially acceptable epsilon value can be an-
swered from two different perspectives: whether the main focus is on the question of
social equality in the sense of Rawls or on economic efficiency in the sense of Milton
Friedman [Okun, 1975, 92, Rawls, 1971, 62, Friedman, 1962, 161-166]. He ex-
plained in his book “Free to Choose” his view on justice and social equality in the fol-
lowing way: “Life is not fair. It is tempting to believe that government can rectify what
nature has spawned [Friedman, 1990].” John Rawls responded to Milton Friedman
and his view on natural distribution: “The natural distribution is neither just nor unjust;
nor is it unjust that persons are born into society at some particular positions. These
are simply facts. What is just or unjust is the way that institutions deal with these
facts [Rawls, 1971].” The social institutions can adjust the epsilon parameter based
on the two different views of the nature of society and the need for social adjustments
of the natural distribution. Milton Friedman would probably choose an epsilon param-
eter of 1 , whereas John Rawls would probably prefer an epsilon parameter of
2 . Hence, the value of epsilon can be interpreted in the sense of Gordon as the
relation of the perceptions of Rawls and Friedman on social equality and economic
efficiency:
1,2,3,4,5equality Rawls
,efficiency Friedman 1,2,3,4,5
Rawls
Friedman
If society mainly focuses on efficiency and has a very low aversion to inequality, it
would choose 5 for Friedman and 1 for Rawls and we would receive an epsilon value

9
of 0.2 . On the other hand, if the main focus of society is on fairness and justice, it
would choose 5 for Rawls and 1 for Friedman and the epsilon value would be 5 .
In this case, society only focuses on the welfare of the lowest income group, whatev-
er the transaction costs may be.
With respect to redistribution between income groups, we have to consider that the
marginal social benefit of the lowest income group is higher than that of the highest
income group [Lüthi, 1981]. To achieve consistent social welfare of society, only a
small fraction of what is taken from the highest income group has to be given to the
lowest income group, as the following example shows.
Table 1: Gross income of German private households
In our analysis, as Table 1 shows, the highest income group (€ 5000 – 18000) has an
average gross income about 10 times higher than that of the lowest income group
(under € 900). The gross income in that income group is € 811, whereas in the high-
est income group the average gross income is € 8729. In this case, the social welfare
function remains unchanged if the income of the highest income group is reduced by
10, i.e. society will not face a social welfare loss through the redistribution [Lüthi,
1981].
The social welfare remains unchanged depending on the value of epsilon,
for 0.1 , if we take € 1.3 from the highest income group and give € 1 to the lowest,
for 0.5 , if we take € 3.2 and give € 1 to the lowest income group,
for 1.0 , if we take € 10 and give € 1 to the lowest income group,
for 1.5 , if we take € 32 and give € 1 to the lowest income group,
for 2.0 , if we take € 100 and give € 1 to the lowest income group.
If we use the social welfare function on the basis of epsilon 0.1, social welfare re-
mains unchanged if we take € 1.3 from the rich and give € 1 to the poor. Society only
accepts redistribution costs of € 0.3.With an epsilon of 2, the social well-being func-
tion remains unchanged if we take € 100 from the rich and give € 1 to the poor [Lüthi,
overall
under 900
900 - 1300
1 300 - 1 500
1 500 - 2 000
2 000 - 2 600
2 600 - 3600
3 600 - 5000
5 000 - 18 000
Households (1 000) 38110 3041 4669 2321 5298 5609 7323 5540 4308
Share of income group of all households in %
100% 8.0% 12.3% 6.1% 13.9% 14.7% 19.2% 14.5% 11.3%
Gross income in € 3561 811 1282 1714 2151 2822 3885 5414 8729Source: German Federal Statistical Office, 2006, EVS 2003 and own calculation IEK-STE 2011
Income Groups of German HouseholdsAll Households
Monthly net income range in €
10
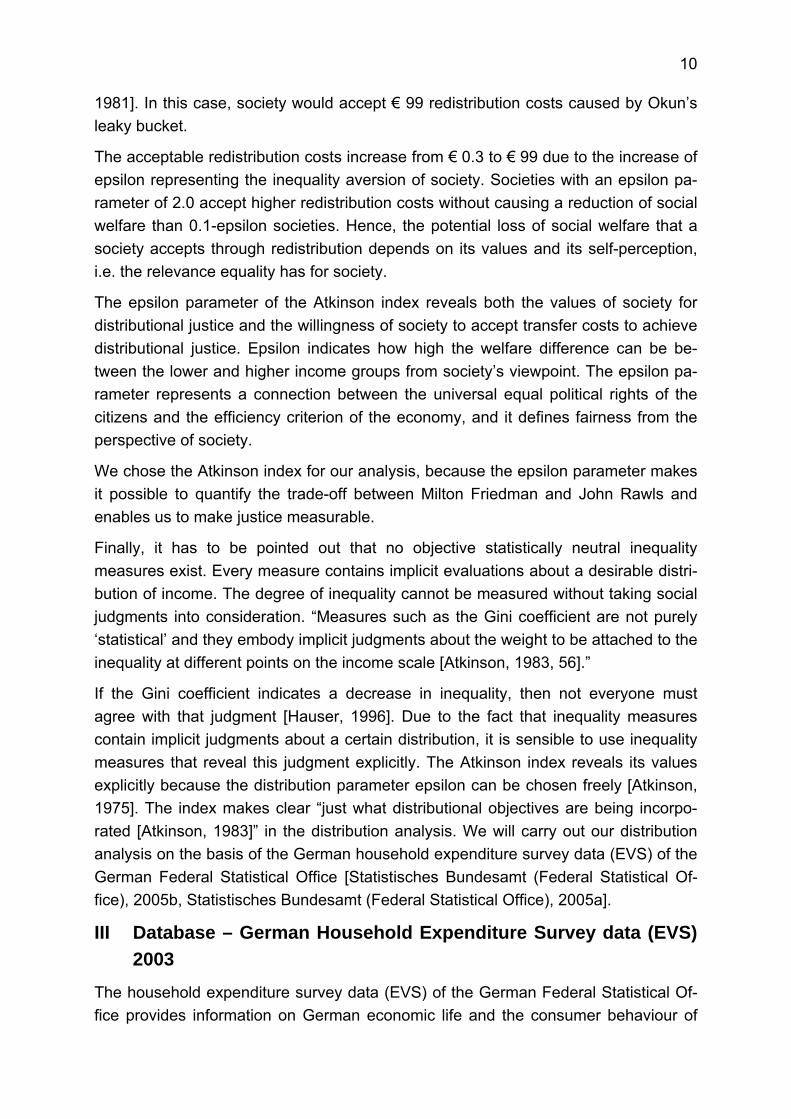
1981]. In this case, society would accept € 99 redistribution costs caused by Okun’s
leaky bucket.
The acceptable redistribution costs increase from € 0.3 to € 99 due to the increase of
epsilon representing the inequality aversion of society. Societies with an epsilon pa-
rameter of 2.0 accept higher redistribution costs without causing a reduction of social
welfare than 0.1-epsilon societies. Hence, the potential loss of social welfare that a
society accepts through redistribution depends on its values and its self-perception,
i.e. the relevance equality has for society.
The epsilon parameter of the Atkinson index reveals both the values of society for
distributional justice and the willingness of society to accept transfer costs to achieve
distributional justice. Epsilon indicates how high the welfare difference can be be-
tween the lower and higher income groups from society’s viewpoint. The epsilon pa-
rameter represents a connection between the universal equal political rights of the
citizens and the efficiency criterion of the economy, and it defines fairness from the
perspective of society.
We chose the Atkinson index for our analysis, because the epsilon parameter makes
it possible to quantify the trade-off between Milton Friedman and John Rawls and
enables us to make justice measurable.
Finally, it has to be pointed out that no objective statistically neutral inequality
measures exist. Every measure contains implicit evaluations about a desirable distri-
bution of income. The degree of inequality cannot be measured without taking social
judgments into consideration. “Measures such as the Gini coefficient are not purely
‘statistical’ and they embody implicit judgments about the weight to be attached to the
inequality at different points on the income scale [Atkinson, 1983, 56].”
If the Gini coefficient indicates a decrease in inequality, then not everyone must
agree with that judgment [Hauser, 1996]. Due to the fact that inequality measures
contain implicit judgments about a certain distribution, it is sensible to use inequality
measures that reveal this judgment explicitly. The Atkinson index reveals its values
explicitly because the distribution parameter epsilon can be chosen freely [Atkinson,
1975]. The index makes clear “just what distributional objectives are being incorpo-
rated [Atkinson, 1983]” in the distribution analysis. We will carry out our distribution
analysis on the basis of the German household expenditure survey data (EVS) of the
German Federal Statistical Office [Statistisches Bundesamt (Federal Statistical Of-
fice), 2005b, Statistisches Bundesamt (Federal Statistical Office), 2005a].
III Database – German Household Expenditure Survey data (EVS)
2003
The household expenditure survey data (EVS) of the German Federal Statistical Of-
fice provides information on German economic life and the consumer behaviour of
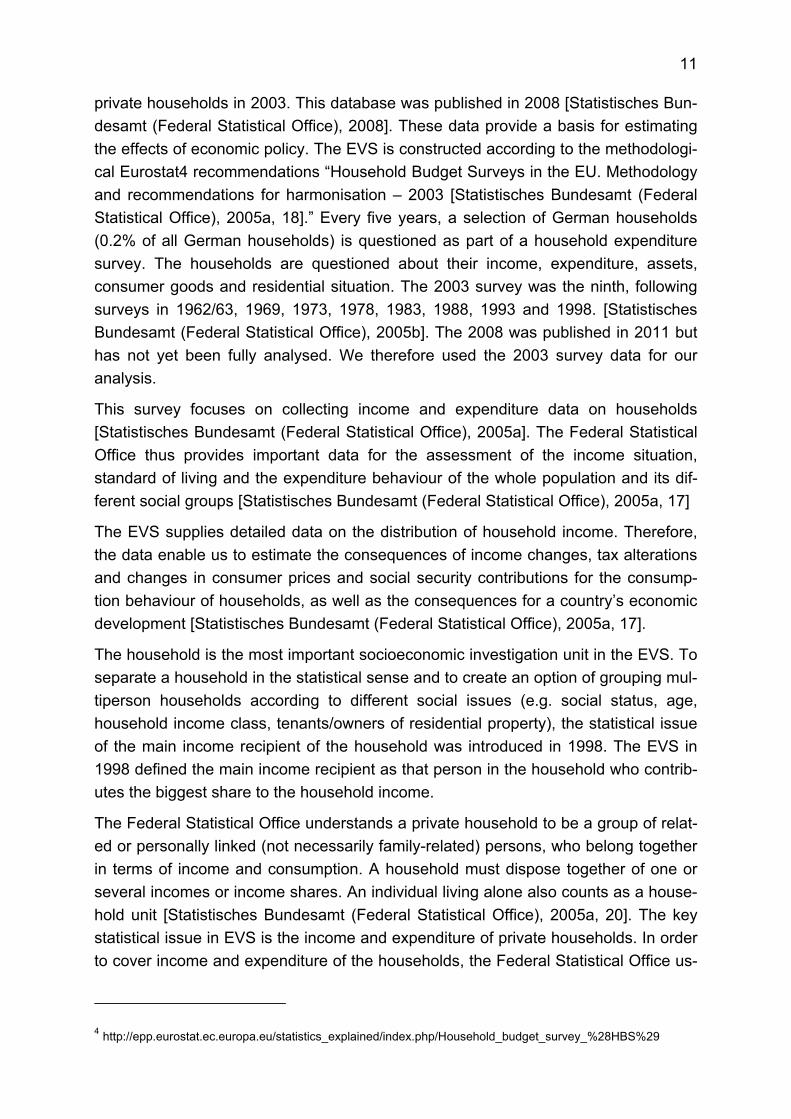
11
private households in 2003. This database was published in 2008 [Statistisches Bun-
desamt (Federal Statistical Office), 2008]. These data provide a basis for estimating
the effects of economic policy. The EVS is constructed according to the methodologi-
cal Eurostat4 recommendations “Household Budget Surveys in the EU. Methodology
and recommendations for harmonisation – 2003 [Statistisches Bundesamt (Federal
Statistical Office), 2005a, 18].” Every five years, a selection of German households
(0.2% of all German households) is questioned as part of a household expenditure
survey. The households are questioned about their income, expenditure, assets,
consumer goods and residential situation. The 2003 survey was the ninth, following
surveys in 1962/63, 1969, 1973, 1978, 1983, 1988, 1993 and 1998. [Statistisches
Bundesamt (Federal Statistical Office), 2005b]. The 2008 was published in 2011 but
has not yet been fully analysed. We therefore used the 2003 survey data for our
analysis.
This survey focuses on collecting income and expenditure data on households
[Statistisches Bundesamt (Federal Statistical Office), 2005a]. The Federal Statistical
Office thus provides important data for the assessment of the income situation,
standard of living and the expenditure behaviour of the whole population and its dif-
ferent social groups [Statistisches Bundesamt (Federal Statistical Office), 2005a, 17]
The EVS supplies detailed data on the distribution of household income. Therefore,
the data enable us to estimate the consequences of income changes, tax alterations
and changes in consumer prices and social security contributions for the consump-
tion behaviour of households, as well as the consequences for a country’s economic
development [Statistisches Bundesamt (Federal Statistical Office), 2005a, 17].
The household is the most important socioeconomic investigation unit in the EVS. To
separate a household in the statistical sense and to create an option of grouping mul-
tiperson households according to different social issues (e.g. social status, age,
household income class, tenants/owners of residential property), the statistical issue
of the main income recipient of the household was introduced in 1998. The EVS in
1998 defined the main income recipient as that person in the household who contrib-
utes the biggest share to the household income.
The Federal Statistical Office understands a private household to be a group of relat-
ed or personally linked (not necessarily family-related) persons, who belong together
in terms of income and consumption. A household must dispose together of one or
several incomes or income shares. An individual living alone also counts as a house-
hold unit [Statistisches Bundesamt (Federal Statistical Office), 2005a, 20]. The key
statistical issue in EVS is the income and expenditure of private households. In order
to cover income and expenditure of the households, the Federal Statistical Office us-
4 http://epp.eurostat.ec.europa.eu/statistics_explained/index.php/Household_budget_survey_%28HBS%29

12
es the market concept. This means that the only expenditure that is registered is ex-
penditure on the market for goods and services [Statistisches Bundesamt (Federal
Statistical Office), 2005a, 21, Burghardt, 2000, 141-142, Münich, 2000].
The most important group for the organization of households within EVS 2003 is the
social position of the main income recipient, the age of the main income recipient,
household size, household type and the monthly net income. For our analysis, we
concentrated on the household net income and household type. The following
household groups were analysed:
All households
Single woman, single man
Single parent
Married couple without children
Married couple with children
A household’s gross income comprises all income received from employment and
self-employment, public and private transfer payments and subleases [Statistisches
Bundesamt (Federal Statistical Office), 2005a, 25]. The gross income from employ-
ment does not contain the employer’s contributions to the social security system. The
net income is calculated by subtracting taxes and contributions to the social security
system from the gross income. The expenditure of the households mainly consists of
expenditure for private consumption. Based on the statistical data basis of the EVS,
we examined the distribution of income and consumption in Germany.
IV Measuring inequality in Germany - results
In the first step, the social welfare function was determined, followed by the Atkinson
index.
IV.1 Social welfare function
A starting point for our calculation was the social welfare function and its characteris-
tics (cf. II) (individualistic, non-decreasing, symmetric and additive) which enabled us
to aggregate the individual utility level of the households to an aggregated social wel-
fare function:
1
n
ii
SWF U y
, where iU y
represents the utility level of the ith household, which
is defined as follows:
11
1i iU y y
.

13
On account of the additivity condition of the social welfare function, the single utility
levels of the households can be aggregated to a social welfare function.
1
1
1
1
n
ii
SWF y
On the basis of the social welfare function, social welfare can be calculated for the
whole of society, but we will also define the social welfare of the consumption of so-
ciety and of the energy consumption (residential energy and car traffic). We thus not
only calculate the social welfare for the whole of society, but we also develop a dis-
aggregated welfare picture of society. We will show how different epsilon values af-
fect the distribution results in the energy sector and in the whole of society. This ap-
proach allows the effect of the inequality aversion of society to be considered in the
energy sector as well. We obtain the following additional sector welfare functions:
Social consumption welfare function:
1
1
1
1
n
PK ii
SWF PK
Social energy welfare function:
1
1
1
1
n
E ii
SWF E
Social residential welfare function:
1
1
1
1
n
EW ii
SWF EW
Social car traffic energy welfare function:
1
1
1
1
n
EK ii
SWF EK
On the basis of the described functions, we can define the social welfare for all
households depending on the chosen epsilon parameter. The values are not compa-
rable for different values of epsilon; they can only be interpreted as indices [Lüthi,
1981, 47].
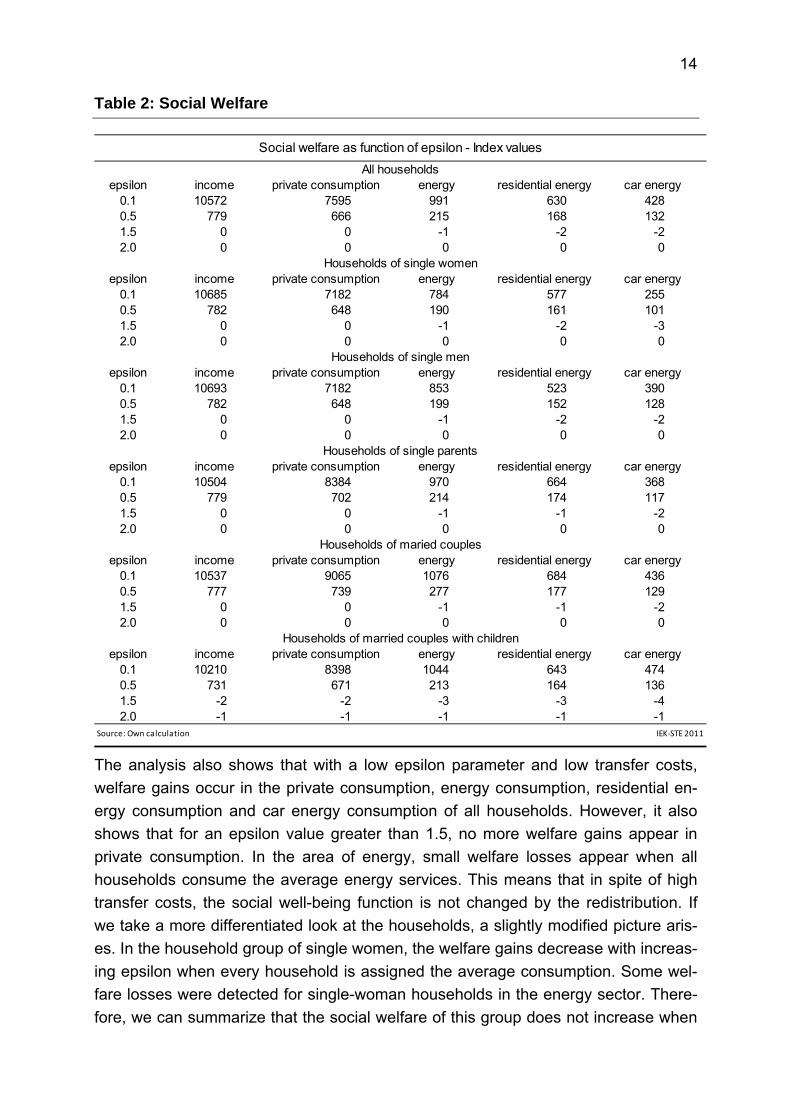
For the household group of all households, the indices (Table 2) reveal that under the
condition of low aversion to welfare differences (epsilon 0.1), social welfare would
increase if all households were to receive the average income. An increase in social
welfare through the distribution of the average income would decrease with an epsi-
lon value of 0.5 because the transfer costs would increase with increasing epsilon
values. With epsilon parameters of 1.5 and 2.0 and transfer costs of 65-75%, no ad-
ditional welfare would occur through a redistribution of income.
14
Table 2: Social Welfare
The analysis also shows that with a low epsilon parameter and low transfer costs,
welfare gains occur in the private consumption, energy consumption, residential en-
ergy consumption and car energy consumption of all households. However, it also
shows that for an epsilon value greater than 1.5, no more welfare gains appear in
private consumption. In the area of energy, small welfare losses appear when all
households consume the average energy services. This means that in spite of high
transfer costs, the social well-being function is not changed by the redistribution. If
we take a more differentiated look at the households, a slightly modified picture aris-
es. In the household group of single women, the welfare gains decrease with increas-
ing epsilon when every household is assigned the average consumption. Some wel-
fare losses were detected for single-woman households in the energy sector. There-
fore, we can summarize that the social welfare of this group does not increase when
epsilon income private consumption energy residential energy car energy0.1 10572 7595 991 630 4280.5 779 666 215 168 1321.5 0 0 -1 -2 -22.0 0 0 0 0 0
epsilon income private consumption energy residential energy car energy0.1 10685 7182 784 577 2550.5 782 648 190 161 1011.5 0 0 -1 -2 -32.0 0 0 0 0 0
epsilon income private consumption energy residential energy car energy0.1 10693 7182 853 523 3900.5 782 648 199 152 1281.5 0 0 -1 -2 -22.0 0 0 0 0 0
epsilon income private consumption energy residential energy car energy0.1 10504 8384 970 664 3680.5 779 702 214 174 1171.5 0 0 -1 -1 -22.0 0 0 0 0 0
epsilon income private consumption energy residential energy car energy0.1 10537 9065 1076 684 4360.5 777 739 277 177 1291.5 0 0 -1 -1 -22.0 0 0 0 0 0
epsilon income private consumption energy residential energy car energy0.1 10210 8398 1044 643 4740.5 731 671 213 164 1361.5 -2 -2 -3 -3 -42.0 -1 -1 -1 -1 -1
Source: Own calculation IEK‐STE 2011
Households of single parents
Households of maried couples
Households of married couples with children
Social welfare as function of epsilon - Index values
All households
Households of single women
Households of single men
15
the transfer costs rise more than 50%. This development trend also appears within
the social group of single men, single-parent households, married couples without
children and married couples with children.
The present analysis has shown the influence of the epsilon parameter on social wel-
fare, i.e. how the inequality aversion of society influences the social welfare of that
society. In the following, we will examine what influence the inequality aversion of the
epsilon parameter has on the distributional effect measured by the Atkinson index.
IV.2 Atkinson index - Inequality of income and consumption by population
subgroups
In the following, we will use the Atkinson index to determine the distributional effect of
income and energy. For the calculation of the distribution of the gross and net income
for the different social groups, we used the modified Atkinson index gAI:
1 1
11 1
,,
1
1n
i gg i g
i g
YAI f
Y
, for 1 .
,, e
1
1 exp logn
i gg i g
i g
YAI f
Y
, for 1 .
,i gYrepresents the income of individuals in the ith income range (n sum of the income
classes) in the g social groups (all households, single women, single men, single
parent with children, married couple, married couple with children), ,i gf is the propor-
tion of the population in the social groups with income in the ith income range, gY is
the mean household income of the social group, and the epsilon parameter for all
groups is .
For the calculation of the distribution of the private consumption, we also used a
modified Atkinson index gAIK:
2 2
11 1
,,
1
1n
i gg i g
i g
KAIK f
K
, for 1 .
,, e
1
1 exp logn
i gg i g
i g
KAIK f
K
, for 1 .
16
,i gKrepresents the consumption expenditure of the individuals in the ith income
range of the social group g, ,i gf is the proportion of the population in the social group
g in the ith income range, and gKis the average household consumption.
For the calculation of the distribution of energy consumption ,i gE in the various social
groups, we used the following modified Atkinson index gAIE:
3 3
11 1
,,
1
1n
i gg i g
i g
EAIE f
E
, for 1 .
,, e
1
1 exp logn
i gg i g
i g
EAIE f
E
, for 1 .
,i gE represents the energy consumption expenditure of the individuals in the ith in-
come range of the social group g, ,i gf is the proportion of the population in the social
group g in the ith income range, and gE is the average energy household consump-
tion in that social group.
For the calculation of the distribution of the residential energy and car energy used by
the various social groups, we used the following modified Atkinson indices gAIEW:
Residential energy:
4 4
11 1
,,
1
1n
i gg i g
i g
EWAIEW f
EW
, for 1 .
,, e
1
1 exp logn
i gg i g
i g
EWAIEW f
EW
, for 1 .
,i gEW represents the energy consumption expenditure of the individuals in the ith in-
come range of the social group g, ,i gf is the proportion of the population in the social

17
group g in the ith income range, and gEW is the average energy household con-
sumption in that social group.
Car energy:
5 5
11 1
,,
1
1n
i gg i g
gi
EKAIEK f
EK
, for 1 .
,, e
1
1 exp logn
i gg i g
gi
EKAIEK f
EK
, for 1 .
,i gEK represents the energy consumption expenditure of the individuals in the ith in-
come range of the social group g, ,i gf is the proportion of the population in the social
group g in the ith income range, and gEK is the average energy household con-
sumption in that social group. The following Table 3 shows the results of our calcula-
tions using the various Atkinson indices.
18
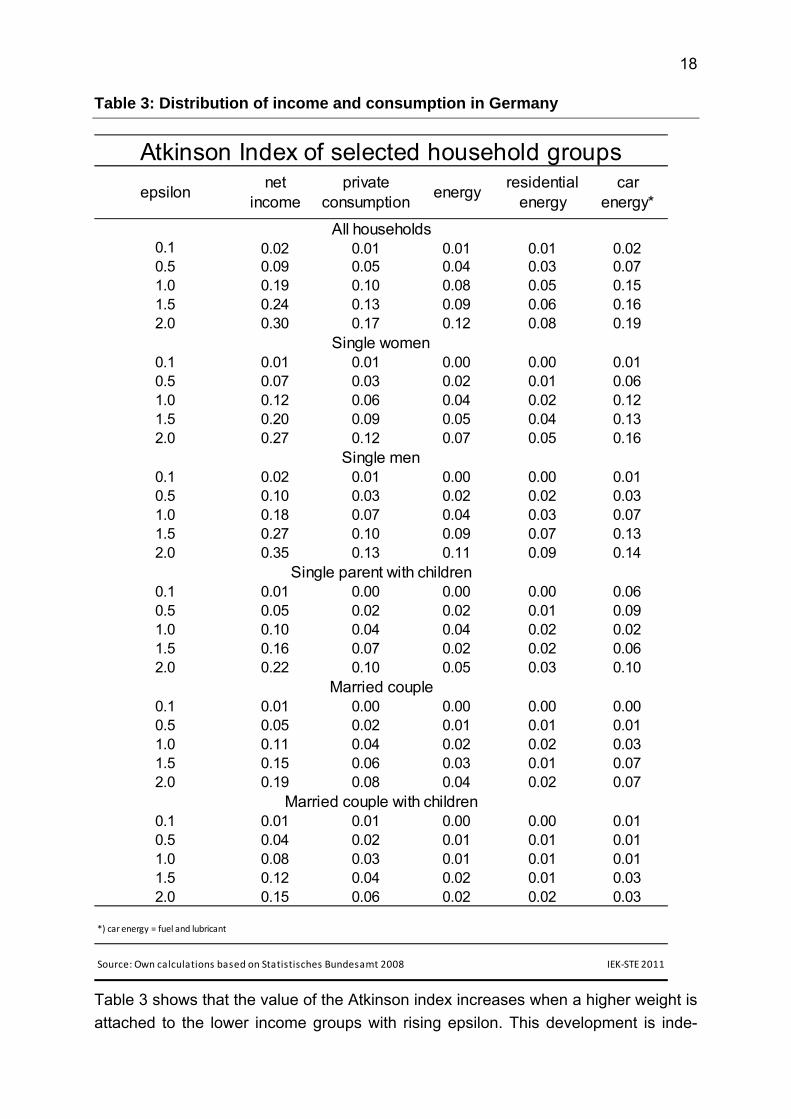
Table 3: Distribution of income and consumption in Germany
Table 3 shows that the value of the Atkinson index increases when a higher weight is
attached to the lower income groups with rising epsilon. This development is inde-
epsilonnet
income private
consumption energy
residential energy
car energy*
0.1 0.02 0.01 0.01 0.01 0.020.5 0.09 0.05 0.04 0.03 0.071.0 0.19 0.10 0.08 0.05 0.151.5 0.24 0.13 0.09 0.06 0.162.0 0.30 0.17 0.12 0.08 0.19
0.1 0.01 0.01 0.00 0.00 0.010.5 0.07 0.03 0.02 0.01 0.061.0 0.12 0.06 0.04 0.02 0.121.5 0.20 0.09 0.05 0.04 0.132.0 0.27 0.12 0.07 0.05 0.16
0.1 0.02 0.01 0.00 0.00 0.010.5 0.10 0.03 0.02 0.02 0.031.0 0.18 0.07 0.04 0.03 0.071.5 0.27 0.10 0.09 0.07 0.132.0 0.35 0.13 0.11 0.09 0.14
0.1 0.01 0.00 0.00 0.00 0.060.5 0.05 0.02 0.02 0.01 0.091.0 0.10 0.04 0.04 0.02 0.021.5 0.16 0.07 0.02 0.02 0.062.0 0.22 0.10 0.05 0.03 0.10
0.1 0.01 0.00 0.00 0.00 0.000.5 0.05 0.02 0.01 0.01 0.011.0 0.11 0.04 0.02 0.02 0.031.5 0.15 0.06 0.03 0.01 0.072.0 0.19 0.08 0.04 0.02 0.07
0.1 0.01 0.01 0.00 0.00 0.010.5 0.04 0.02 0.01 0.01 0.011.0 0.08 0.03 0.01 0.01 0.011.5 0.12 0.04 0.02 0.01 0.032.0 0.15 0.06 0.02 0.02 0.03
*) car energy = fuel and lubricant
Source: Own calculations based on Statistisches Bundesamt 2008 IEK‐STE 2011
Married couple
Married couple with children
Atkinson Index of selected household groups
All households
Single women
Single men
Single parent with children

19
pendent of the chosen household type. However, differences exist between the so-
cial groups and research topic: net income, private consumption, energy consump-
tion, residential energy, and car energy.
Net income
In the case of net income, we see for the group of all households that inequality rises
significantly from 0.02 to 0.30 by increasing epsilon. The inequality of the distribution
of net income rises for single women from a nearly equally distributed income 0.01 by
an epsilon value of 0.1 to an Atkinson index of 0.27 by an epsilon value of 2.0. For
single men, this ranges from 0.02 to 0.35, while for single parents with children we
see a smaller increase from 0.01-0.22 and 0.01 to 0.19 for married couples. The
group of married couples with children have the smallest spread of the Atkinson in-
dex (0.01-0.15) by raising epsilon.
The increase of the Atkinson index is a little lower for the social group of single wom-
en than for the group of single men. The reason for that is that the net income of sin-
gle women is more equally distributed between the income groups than in the case of
single men. Only 3% of households with single women are in the two highest income
groups, whereas for single men at least 9% are in these two groups. The values of
the households with couples and single parents are below the values of the Atkinson
index of the group of all households.
Private consumption
The analysis shows that private consumption is more equally distributed among
households irrespective of the chosen social group and the chosen epsilon parame-
ter. The split of the Atkinson index of the various social groups ranges from 0.01 to
0.17 by raising the epsilon parameter from 0.1 to 2.0 for the overall households. In
the social group of single men (0.01-0.13) and women (0.01-0.12), consumption is
more equally distributed among the households than in the overall households. The
households of single parents with children reveal a smaller increase in inequality ac-
cording to private consumption. The Atkinson Index increases in family households in
the range of 0.0 to 0.10 by raising the value of the epsilon parameter. Married cou-
ples with and without children experience the smallest increase of the Atkinson index
by raising epsilon. From this fact, we can conclude that the level of and the need for
consumption by these households is not so much influenced by income but by family
necessities, which are largely independent of household income.
Energy consumption
Table 3 also shows that energy consumption is more equally distributed than con-
sumption expenditure in general. In the case of the distribution of energy consump-
tion between the income groups of the social groups, the social groups can be sum-
marized in two major subgroups. The group of all households (0.01-0.12) and house-
holds of single men (0.00-0.11) show nearly the same distribution by the rising epsi-

20
lon parameter. Households of single women (0.00-0.07) and family households
(0.00-0.05, 0.00-0.04, 0.00-0.02) have a lower spread of inequality by rising epsilon.
It is noteworthy that especially in the households of married couples with children
energy consumption is nearly equally distributed between the households. This de-
velopment is also visible in the distribution of residential energy.
Residential energy is almost equally distributed between the income groups in all so-
cial groups. The Atkinson index ranges from 0.00-0.09. In the group of all households
we see a small increase of the Atkinson index (0.01-0.08) by rising epsilon. The sin-
gle men have a similar development of the Atkinson index (0.01-0.08) to that in the
group of all households. The other households show a similar picture of the devel-
opment of the Atkinson index by rising epsilon parameter. Also for the residential en-
ergy consumption, we see that this consumption is nearly equally distributed between
the households, which can be interpreted such that residential energy is a fundamen-
tal good for all households irrespective of the household’s income.
In the case of car energy consumption, we see a slightly different picture: The Atkin-
son index values are raised. For all households, we see an increase of the index
from 0.02 to 0.19. These values are significantly higher than in the case of residential
energy consumption. The households of single women and single men show a very
similar development, where the spread is greater than in the family households. In
the social households of single parents with children, married couples and married
couples with children we see almost equally distributed consumption. Car energy
consumption is a central necessity for family households and is independent of the
household’s income. The family household budget will allocate the necessary money
to finance this consumption. Car energy consumption is not such a basic necessity
for the households of single men and women. The reason for this might be that most
households of single people are found in large towns and cities, where mobility is not
concentrated on private transport.
To summarize: Private consumption is more equally distributed than income, and
expenditure for energy consumption is more equally distributed than private con-
sumption in general. And residential energy consumption is the most equally distrib-
uted consumption of all households. Family households are more evenly distributed
than in the other social groups especially in the field of energy consumption.
Table 3 also makes clear that the energy expenditure is distributed almost equally
between the households, and that it does not increase very much with increasing
income. Energy expenditure thus plays a much more important role for the lower in-
come groups than for the upper income class, and price changes will have a higher
impact on their household budget.

21
V Conclusions
Our analysis has shown that the Atkinson index provides a powerful tool not only to
measure the distribution of income but also as a new tool to estimate the distribution-
al dimensions of energy consumption. Our analysis has shown that a distribution
analysis based on the Atkinson index can make an important contribution to the so-
cial debate about the distributional justice of income and consumption. With the epsi-
lon parameter, the Atkinson index explicitly reveals the inequality aversion of society,
and this enables us to define how sensitively the Atkinson index should react to ine-
qualities. This parameter expresses the assessment on the part of society of its own
vulnerability. The more acutely society sees its vulnerability through unequal distribu-
tion of income and consumption the higher is epsilon. This self-perception of society
determines the value of epsilon (0.1-2.0). Every society is affected by this vulnerabil-
ity [Atkinson, 2011], which could be reduced by a sustainable development of socie-
ty.
For the purposes of sustainable development [Cranston & Hammond, 2010], epsilon
can be interpreted as a sustainable parameter. The transfer of money represented by
epsilon can be used to finance sustainable projects, which are not part of the social
welfare function.
Epsilon can be extended with a view to sustainable development in such a way that
the greater the epsilon value is, the higher the need for financing sustainable devel-
opment projects is in the view of society. The transfer losses can then be used for
sustainable measures and thereby generate intergenerational profits for future gen-
erations.
Epsilon can therefore be interpreted as an intergenerational justice factor in the
sense of sustainable development. A low epsilon value means that society has a low
aversion to inequality both in an intragenerational and an intergenerational sense.
The aversion increases with a rising epsilon, and society takes more intra- and inter-
generational questions into consideration. The trade-off between equality and effi-
ciency is thereby extended to the area of intergenerational equality.
These distributional effects are of great political interest not only in Germany but also
in the European Union and in the OECD as recent studies by these organizations
show [OECD, 2011b, OECD, 2011a, European Commission, 2010, European Com-
mission et al., 2009]. Further research on the inequality of energy consumption
should be performed for the European Union, OECD countries and for emerging
countries, because as the OECD wrote, “there is a widespread concern that econom-
ic growth [in the emerging economies] is not being shared fairly [OECD, 2011a].”
This concern is also shared by the European Commission as the director of Science,
Economy and Society wrote in the Research Policy Report: “There is now compelling
scientific evidence that since the mid-1970s socio-economic inequalities have in-

22
creased significantly in the world including Europe [European Commission, 2010].” If
we understand the inequalities of income and consumption better, we can develop
adequate policy measures to better handle the wellbeing and the quality of life of the-
se societies [Wilkinson & Pickett, 2010, 31].
VI References
AGYEMAN, J. (2006) Environmental justice and sustainability. In ATKINSON, G., DIETZ, S. & NEUMAYER, E. (Eds.) Handbook of sustainable development. Cheltenham, Edward Elgar.
AMIEL, Y. & COWELL, F. A. (1992) Measurement of income inequality - experimental test by questionnaire. Journal of Public Economics, 47:1, 3-26.
AMIEL, Y. & COWELL, F. A. (1999) Thinking about inequality. Cambridge, Cambridge University Press.
ARISTOTLE (2008) The metaphysics Dover, Dover Pubn Inc.
ATKINSON, A. B. (1970) On the measurement of inequality. Journal of Economic Theory, 2:3, 244-263.
ATKINSON, A. B. (1973) Wealth, income and inequality London, Penguin.
ATKINSON, A. B. (1975) On the measurement of inequality. Oxford, Oxford University Press.
ATKINSON, A. B. (1983) The economics of inequality. Oxford, Clarendon Press.
ATKINSON, A. B. (2011) Unequal growth, unequal recession? The OECD Observer.
BARR, N. (1993) The economics of the welfare state. Stanford, Stanford University Press.
BARRY, B. (1991) Liberty and justice: Essays in political theory. Oxford, Clarendon Press.
BRÜMMERHOFF, D. (2007) Finanzwissenschaft. Munich, Oldenbourg Verlag.
BURGHARDT, M. (2000) Zur revision der privaten konsumausgaben im rahmen der volkswirtschaftlichen gesamtrechnungen 2005. Wirtschaft & Statistik, 2000:3, 136-144.
CHAMPERNOWNE, D. G. (1974) A comparison of measures of inequality of income distribution. Economic ]ournal, 84:336, 787-816.
COWELL, F. A. (1985) Measures of distributional change: An axiomatic approach. Review of Economic Studies, 52:1, 135-151.
COWELL, F. A. (2000a) Measurement of inequality. In ATKINSON, A. B. & BOURGUIGNON, F. (Eds.) Handbook of income distribution, vol. 1.87-150, Amsterdam, Elsevier.
COWELL, F. A. (2000b) Measuring inequality. Oxford, Oxford University Press. http://eclass.yonsei.ac.kr/hoskim/lectures/public/Measuring%20Inequality%20%28Cowell%29.pdf.
COWELL, F. A. & BOSMANS, K. (2009) The class of absolute decomposable inequality measures. Distributional Analysis Research Programme DARP 99. November 2009.
CRANSTON, G. R. & HAMMOND, G. P. (2010) North and south: Regional footprints on the transition pathway towards a low carbon, global economy. Applied Energy, 87:9, 2945-2951.
23
DALTON, H. (1920) The measurement of the inequality of incomes. Economic Journal, 30:119, 348-361.
DIEKMANN, A. (1981) Sozialindikatoren der ungleichheit, chancenungleichheit und diskriminierung. Insitut für Höhere Studien, Vienna.
EUROPEAN COMMISSION (2010) Why socio-economic inequalities increase? Facts and policy responses in europe. Brussels, European Commission.
EUROPEAN COMMISSION, EUROPEAN PARLIAMENT, CLUB OF ROME, OECD & WWF (2009) The beyond gdp conference - summary. http://www.beyond-gdp.eu/index.html.
FRIEDMAN, M. (1962) Capitalism and freedom. Chicago, University of Chicago Press.
FRIEDMAN, M. (1990) Free to choose: A personal statemen. San Diego, Harvest Books.
GORDON, K. (1975) Foreword. In OKUN, A. M. (Ed.) Equality and efficiency: The big tradeoff. Washington D.C, The Brookings Institution.
HAUSER, R. (1996) Zur messung individueller wohlfahrt und ihrer verteilung. In CHLUMSKY, J. & WIEGERT, R. (Eds.) Wohlfahrtsmessung - aufgabe der statistik im gesellschaftlichen wandel.13-38, Wiesbaden, Statistisches Bundesamt.
HICKS, J. R. (1975) The scope and status of welfare economics. Oxford Economic Papers, 27:3, 307-326.
HOCHSCHILD, J. L. (1981) What's fair? American beliefs about distributive justice. Cambridge, Harvard University Press.
JANTTI, M. & BOJER, H. (2005) Distributional justice: Theory and measurement. Scandinavian Journal of Economics, 107:4, 759-761.
LANGHELLE, O. (2000) Sustainable development and social justice: Expanding the rawlsian framework of global justice. Environmental Values, 9:3, 295-323.
LITCHFIELD, J. A. (1999) Inequality: Methods and tools. World Bank, Washington. http://www.worldbank.org/poverty/inequal/index.htm.
LÜTHI, A. P. (1981) Messung wirtschaftlicher ungleichheit. Berlin, Heidelberg, Springer-Verlag.
MACKAY, R. M. & PROBERT, S. D. (1995) National policies for achieving energy thrift, environmental protection, improved quality of life, and sustainability. Applied Energy, 51:4, 293-367.
MÜNICH, M. (2000) Zur höhe und struktur der ausgaben privater haushalte. Wirtschaft & Statistik, 2000:11, 853.
OECD (2011a) Growing unequal? Income distribution and poverty in oecd countries.
OECD (2011b) Social justice in the oecd – how do the member states compare? Sustainable governance indicators 2011. OECD, Paris.
OKUN, A. M. (1975) Equality and efficiency: The big tradeoff. Washington D.C, The Brookings Institution.
PIGOU, A. C. (1912) Wealth and welfare. London, Macmillan and Co.
PIGOU, A. C. (1932) The economics of welfare. London, Macmillan and Co.
RAWLS, J. (1971) A theory of justice. Cambridge, MA, Harvard University Press.
SEIDL, C. (2001) Inequality measurement and the leaky−bucket paradox. Economics Bulletin, 4:6, 1-7.

24
SEN, A. (1973) On economic inequality. New York, Norton.
SEN, A. (1997) On economic inequality. Oxford, Clarendon Press.
SEN, A. (2003) Ökonomie für den menschen. Munch, dtv.
SMIL, V. (1994) Energy in world history. Boulder, Westview.
STATISTISCHES BUNDESAMT (FEDERAL STATISTICAL OFFICE) (2005a) Einkommens- und verbrauchsstichprobe - aufgabe, methode und durchführung der evs. Fachserie Wirtschaftsrechnungen, 15:7.
STATISTISCHES BUNDESAMT (FEDERAL STATISTICAL OFFICE) (2005b) Einkommens- und verbrauchsstichprobe - einnahmen und ausgaben privater haushalte 2003. Fachserie Wirtschaftsrechnungen, 15:4.
STATISTISCHES BUNDESAMT (FEDERAL STATISTICAL OFFICE) (2008) Energieausgaben privater haushalte. Wiesbaden, Statistisches Bundesamt,. http://www.destatis.de/jetspeed/portal/cms/Sites/destatis/Internet/DE/Presse/pm/2008/08/PD08__297__631,templateId=renderPrint.psml.
STIGLITZ, J. E., SEN, A. & FITOUSSI, J.-P. (2009) Report by the commission on the measurement of economic performance and social progress. Paris. www.stiglitz-sen-fitoussi.fr.
WILKINSON, R. & PICKETT, K. (2010) The spirit level. Why equality is better for everyone. London, Penguin.
WISSENBURG, M. (2006) Global and ecological justice: Prioritising conflicting demands. Environmental Values, 15:4, 425 - 439.
WORLD COMMISSION ON ENVIRONMENT AND DEVELOPMENT (WCED) (1987) Our common future Oxford, New York, Oxford University Press.

Preprints 2012
01/2012 Schlör, Holger, Fischer, Wolfgang, Hake, Jürgen-Friedrich: Measuring social wel-fare, energy and inequality in Germany

Systems Analysis and Technology Evaluation at the Research Centre Jülich
Many of the issues at the centre of public attention can only be dealt with by an inter-disciplinary energy systems analysis. Technical, economic and ecological subsys-tems which interact with each other often have to be investigated simultaneously. The group Systems Analysis and Technology Evaluation (STE) takes up this chal-lenge focusing on the long-term supply- and demand-side characteristics of energy systems. It follows, in particular, the idea of a holistic, interdisciplinary approach tak-ing an inter-linkage of technical systems with economics, environment and society into account and thus looking at the security of supply, economic efficiency and envi-ronmental protection. This triple strategy is oriented here to societal/political guiding principles such as sustainable development. In these fields, STE analyses the con-sequences of technical developments and provides scientific aids to decision making for politics and industry. This work is based on the further methodological develop-ment of systems analysis tools and their application as well as cooperation between scientists from different institutions.
Leitung/Head: Prof. Jürgen-Friedrich Hake
Forschungszentrum Jülich
Institute of Energy and Climate Research
IEK-STE: Systems Analysis and Technology Evaluation
52428 Jülich
Germany
Tel.: +49-2461-61-6363
Fax: +49-2461-61-2540,
Email: [email protected]
Web: www.fz-juelich.de/ste