Measuring Smile Curves in Global Value Chainsrigvc.uibe.edu.cn/docs/20160329210052329340.pdf ·...
35
INSTITUTE OF DEVELOPING ECONOMIES IDE Discussion Papers are preliminary materials circulated to stimulate discussions and critical comments Keywords: Smile curve, Global value chains, APL, Fragmentation of production JEL classification: F6; F13; F15, D57 1: Postdoctoral Fellow, Center for BRICS Studies, Fudan University, China and visiting Scholar in FGV, Brazil; 2: Senior Researcher, Development Studies Center, IDE-JETRO ([email protected]); 3: Chief Economist, Asian Development Bank (ADB). *: We thank Dr. Zhi WANG (Lead International Economist, USITC), Prof. Harry Xiaoying WU (Institute of Economic Research, Hitotsubashi University), Dr. Masami ISHIDA (Director-General, Development Studies Center, IDE-JETRO) for their helpful comments on this paper. IDE DISCUSSION PAPER No. 530 Measuring Smile Curves in Global Value Chains * Ming YE 1 , Bo MENG 2 , and Shang-jin WEI 3 Aug 27, 2015 Abstract: The concept and logic of the “smile curve” in the context of global value chains has been widely used and discussed at the individual firm level, but rarely identified and investigated at the country and industry levels by using real data. This paper proposes an idea, based on an inter-country input-output model, to consistently measure both the strength and length of linkages between producers and consumers along global value chains. This idea allows for better identification and mapping of smile curves for countries and industries according to their positions and degrees of participation in a given conceptual value chain. Using the 1995-2011 World Input-Output Tables, several conceptual value chains are investigated, including exports of electrical and optical equipment from China and Mexico and exports of automobiles from Japan and Germany. The identified smile curves provide a very intuitive and visual image, which can significantly improve our understanding of the roles played by different countries and industries in global value chains. Further, the smile curves help identify the benefits gained by these countries and industries through their participation in global trade.
Transcript of Measuring Smile Curves in Global Value Chainsrigvc.uibe.edu.cn/docs/20160329210052329340.pdf ·...
INSTITUTE OF DEVELOPING ECONOMIES
IDE Discussion Papers are preliminary materials circulated to stimulate discussions and critical comments
Keywords: Smile curve, Global value chains, APL, Fragmentation of production
JEL classification: F6; F13; F15, D57 1: Postdoctoral Fellow, Center for BRICS Studies, Fudan University, China and visiting Scholar in FGV, Brazil; 2: Senior Researcher, Development Studies Center, IDE-JETRO ([email protected]); 3: Chief Economist, Asian Development Bank (ADB). *: We thank Dr. Zhi WANG (Lead International Economist, USITC), Prof. Harry Xiaoying WU (Institute of Economic Research, Hitotsubashi University), Dr. Masami ISHIDA (Director-General, Development Studies Center, IDE-JETRO) for their helpful comments on this paper.
IDE DISCUSSION PAPER No. 530
Measuring Smile Curves in Global Value Chains * Ming YE1, Bo MENG2, and Shang-jin WEI3 Aug 27, 2015
Abstract: The concept and logic of the “smile curve” in the context of global value chains has been widely used and discussed at the individual firm level, but rarely identified and investigated at the country and industry levels by using real data. This paper proposes an idea, based on an inter-country input-output model, to consistently measure both the strength and length of linkages between producers and consumers along global value chains. This idea allows for better identification and mapping of smile curves for countries and industries according to their positions and degrees of participation in a given conceptual value chain. Using the 1995-2011 World Input-Output Tables, several conceptual value chains are investigated, including exports of electrical and optical equipment from China and Mexico and exports of automobiles from Japan and Germany. The identified smile curves provide a very intuitive and visual image, which can significantly improve our understanding of the roles played by different countries and industries in global value chains. Further, the smile curves help identify the benefits gained by these countries and industries through their participation in global trade.

The Institute of Developing Economies (IDE) is a semigovernmental,
nonpartisan, nonprofit research institute, founded in 1958. The Institute
merged with the Japan External Trade Organization (JETRO) on July 1, 1998.
The Institute conducts basic and comprehensive studies on economic and
related affairs in all developing countries and regions, including Asia, the
Middle East, Africa, Latin America, Oceania, and Eastern Europe.
The views expressed in this publication are those of the author(s). Publication does
not imply endorsement by the Institute of Developing Economies of any of the views
expressed within.
INSTITUTE OF DEVELOPING ECONOMIES (IDE), JETRO
3-2-2, WAKABA, MIHAMA-KU, CHIBA-SHI
CHIBA 261-8545, JAPAN ©2015 by Institute of Developing Economies, JETRO No part of this publication may be reproduced without the prior permission of the IDE-JETRO.
Measuring Smile Curves in Global Value Chains
Ming YE∗, Bo MENG† and Shang-jin WEI‡
August 27, 2015
Abstract
The concept and logic of the “smile curve” in the context of global value chains has beenwidely used and discussed at the individual firm level, but rarely identified and investigatedat the country and industry levels by using real data. This paper proposes an idea, based onan inter-country input-output model, to consistently measure both the strength and lengthof linkages between producers and consumers along global value chains. This idea allowsfor better identification and mapping of smile curves for countries and industries accordingto their positions and degrees of participation in a given conceptual value chain. Using the1995-2011 World Input-Output Tables, several conceptual value chains are investigated,including exports of electrical and optical equipment from China and Mexico and exports ofautomobiles from Japan and Germany. The identified smile curves provide a very intuitiveand visual image, which can significantly improve our understanding of the roles playedby different countries and industries in global value chains. Further, the smile curves helpidentify the benefits gained by these countries and industries through their participationin global trade.
Keywords: Smile curve, Global value chains, Upstreamness, Downstreamness, APL, Frag-mentation of production
Acknowledgement: We thank Dr. Zhi WANG (Lead International Economist, USITC), Prof. HarryXiaoying WU (Institute of Economic Research, Hitotsubashi University), Dr. Masami ISHIDA (Director-General, Development Studies Center, IDE-JETRO) for their helpful comments on this paper.
∗Postdoctoral Fellow, Center for BRICS Studies, Fudan University, China; Visiting Scholar in FGV, Brazil;†Senior Research Fellow, Center of Development Studies, IDE-JETRO (email: bo_meng (at) ide.go.jp);‡Chief Economist, Asian Development Bank (ADB).
1 IntroductionThe rise of global value chains (GVCs) is considered one of the most important features of
the rapid economic globalization in recent decades. The economic and popular literature hasdescribed phenomena relating to the rise of GVCs from different perspectives, such as frag-mentation (Jones and Kierzkowski, 1990), offshore sourcing (Arndt, 1997), external orientation(Campa and Goldberg, 1997), disintegration of production (Feenstra, 1998), global productionsharing (Yeats, 2001), vertical specialization (Hummels et al., 2001; Yi, 2003), outsourcing(Grossman and Helpman, 2002a,b), vertical production networks (Hanson et al., 2003), tradein tasks (Grossman and Rossi-Hansberg, 2008), the second great unbundling (Baldwin, 2011),and so on. Despite the use of these different terms, they all point to the same fact: value chainsare sliced up in tasks and functions globally. That is to say, goods are produced “in a numberof stages in a number of locations, adding a little bit of value at each stage” (Krugman, 1995).The theoretical cause for this shift is the reduction of service link costs (Jones and Kierzkowski,1990), including the costs of trade, investment, coordination, and communications. Lower costsfor these service links has enabled the international unbundling of factories and offices, whichmeans that tasks can also be traded globally.
There are several positive aspects of GVCs, from the viewpoint of development economics.First, firms, especially in developing economies, do not need to build a whole course of produc-tion capacity. Instead, they just need to use their comparative advantages to concentrate in aspecific production process, which makes participation in the global economy possible (Kowal-ski et al., 2015). Second, becoming a part of GVCs can create more employment opportunities(UNCTAD, 2013). For example, jobs are created in developing countries from iPhone assemblyin China, call centers operations in the Philippines and India, Nike shoes production in Viet-nam, and automobile and auto part production in Mexico and Thailand. Third, GVCs alsoprovide the opportunity for technology transfer or spillover to developing countries throughlocal learning (Pietrobelli and Rabellotti, 2010; Kawakami et al., 2012).
However, as mentioned in the OECD-WTO-World Bank Group report (2014), “Gains fromGVC participation are not automatic. Benefits of GVCs can also vary considerably dependingon whether a country operates at the high or at the low end of the value chain.” Regardingthe costs and risks of joining GVCs, a paradoxical pair of concerns between developed anddeveloping countries may exist (e.g., Baldwin et al., 2014). Namely, because of the differencesin comparative advantages across countries in GVCs, rich countries may tend to engage inhigh-end and intangible production activities such as R&D, design, and brand building in thepre-fabrication stages and after-sales services and marketing in the post-fabrication stages.Thus, rich countries may worry about the hallowing out of their economies as manufacturingjobs are offshored to low-technology, low-wage nations. Poor nations, on the other hand, maytend to focus on low-end and tangible production activities such as manufacturing and assembly.Thus, they may be increasingly worried that they are getting the wrong sorts of jobs and thattheir economies could be locked into GVCs at the bottom of the so-called “smile curve.”
The concept of the smile curve was first proposed around 1992 by Stan Shih, the founderof Acer, a technology company headquartered in Taiwan. Shih (1996) observed that in thepersonal computer industry, both ends of the value chain command higher values added to the
2
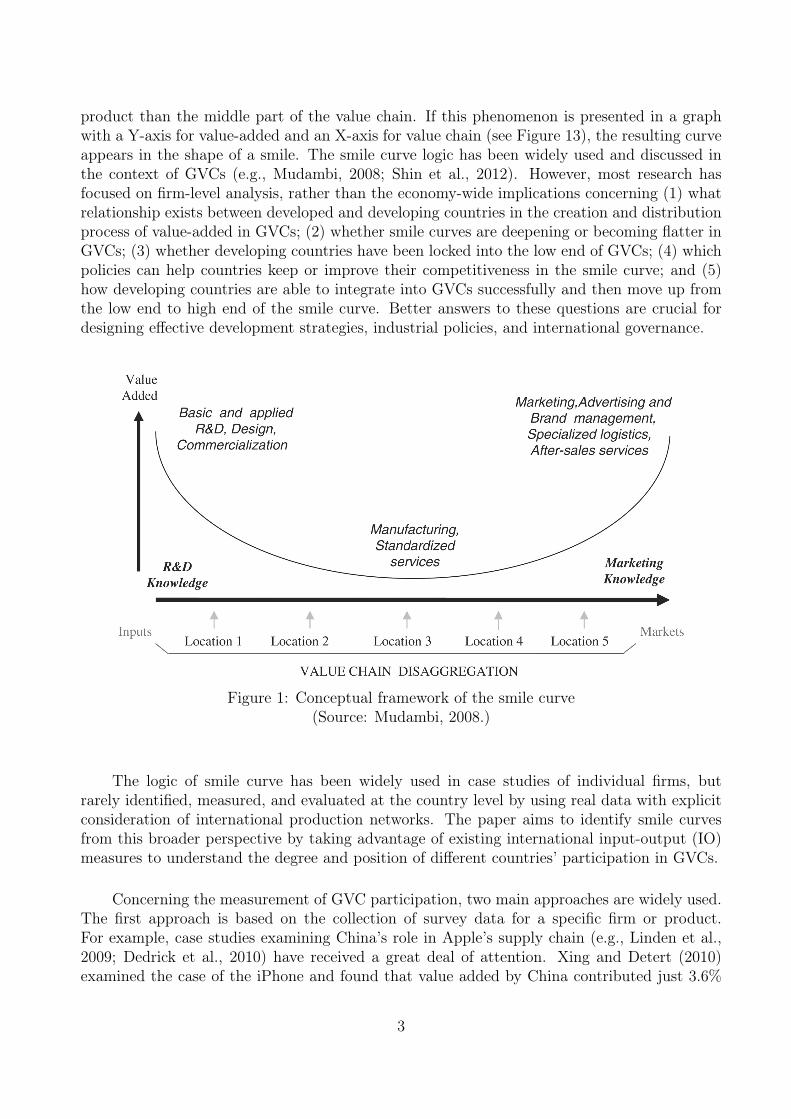
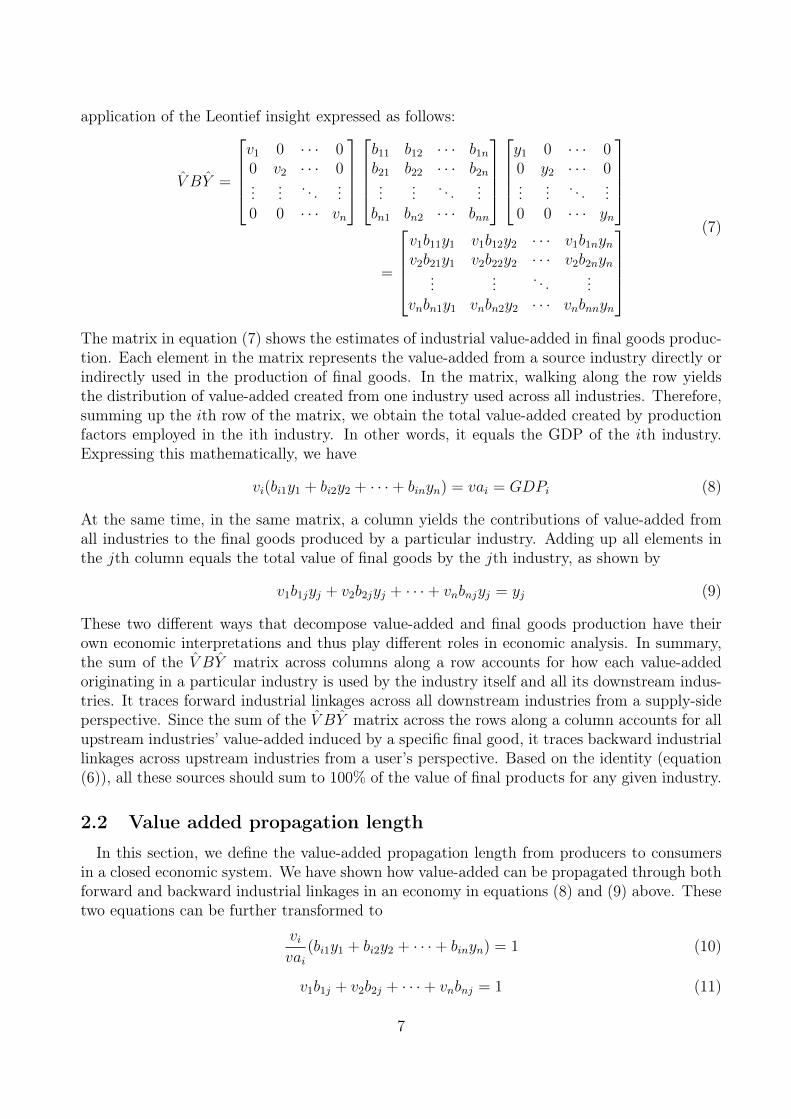
product than the middle part of the value chain. If this phenomenon is presented in a graphwith a Y-axis for value-added and an X-axis for value chain (see Figure 13), the resulting curveappears in the shape of a smile. The smile curve logic has been widely used and discussed inthe context of GVCs (e.g., Mudambi, 2008; Shin et al., 2012). However, most research hasfocused on firm-level analysis, rather than the economy-wide implications concerning (1) whatrelationship exists between developed and developing countries in the creation and distributionprocess of value-added in GVCs; (2) whether smile curves are deepening or becoming flatter inGVCs; (3) whether developing countries have been locked into the low end of GVCs; (4) whichpolicies can help countries keep or improve their competitiveness in the smile curve; and (5)how developing countries are able to integrate into GVCs successfully and then move up fromthe low end to high end of the smile curve. Better answers to these questions are crucial fordesigning effective development strategies, industrial policies, and international governance.
Figure 1: Conceptual framework of the smile curve(Source: Mudambi, 2008.)
The logic of smile curve has been widely used in case studies of individual firms, butrarely identified, measured, and evaluated at the country level by using real data with explicitconsideration of international production networks. The paper aims to identify smile curvesfrom this broader perspective by taking advantage of existing international input-output (IO)measures to understand the degree and position of different countries’ participation in GVCs.
Concerning the measurement of GVC participation, two main approaches are widely used.The first approach is based on the collection of survey data for a specific firm or product.For example, case studies examining China’s role in Apple’s supply chain (e.g., Linden et al.,2009; Dedrick et al., 2010) have received a great deal of attention. Xing and Detert (2010)examined the case of the iPhone and found that value added by China contributed just 3.6%
3
to the $2.0 billion of iPhone exports to the US in 2009; the remainder of the value-added wasfrom Germany, Japan, Korea, the US, and other countries. These studies rely on “tear down”analyses that assign the value of individual components to source companies and their countries.These firm- and product-based case studies can provide an intuitive understanding of GVCsin terms of the activities of multinational enterprises. However, these “tear down” case studiesfocus on only the supply chain of a specific firm and particular products, and are clearly notrepresentative of the broader role of production networks and inter-industrial linkages in thewhole value creation process. For example, when we examine the role of the Chinese economyin global production networks as a whole, the share of domestic value-added through grossexports of final products shipped to the United States was actually about 75% in 2009.
The second approach to measuring GVC participation is based on IO tables. Hummels etal. (2001) first proposed a measure based on the share of vertical specialization (VS) or theimport content of exports by using single-nation IO tables. The VS share avoids the shortcom-ings of firm- or product-based measures to some extent since it can capture the intermediateimports used directly and indirectly to produce exports with consideration given to domesticinter-industrial production linkages. However, it should be noted that in a national IO table,imports and exports are treated as exogenous variables; the so-called spill-over and feedbackeffects from the rest of the world cannot be fully considered in the VS measure (e.g., importedintermediate goods may also include domestic content). In response to the limitations of the VSmeasure, international IO tables, which consist of detailed information on both inter-countryand inter-industry linkages, have been used to measure GVCs in recent years. Studies takingthis approach include Johnson and Noguera (2012), Stehrer (2012), Timmer et al. (2014a),and Koopman et al. (2014). Most of these papers, with the exception of Koopman et al.(2014), discuss the connections between their approaches and the approach of Hummels et al.(2001) in broad terms. Koopman et al. (2014) provides a unified mathematical framework forcompletely decomposing gross exports into its various components, including exported value-added, returning domestic value-added, foreign value-added, and other additional items thatmay be double counted. This framework establishes a precise relationship between value-addedmeasures of trade and official trade statistics, which thus providing an observable benchmarkfor value-added trade estimates.
Most of the existing measures mentioned above focus on showing the degree to which acountry participates in GVCs, rather than its position in GVCs explicitly. A better under-standing of the increasing complexity and sophistication of production networks requires newmeasures that can capture the “length” of the linkages between countries or industries or be-tween producers and consumers for mapping the geometry of value chains. Dietzenbacher et al.(2005, 2007) proposed a new concept, the average propagation length (APL), to measure thenumber of production stages in production networks. The international application of the APLframework was brought into the Asian context and extended by Inomata (2008) and Escaithand Inomata (2013) through a time-series analysis using the Asian International IO tables.Fally (2011, 2012) characterized the position along a production line in terms of the distanceto final use. Namely, industries that sell a relatively larger share of their outputs to industriesfurther upstream are defined as being “more upstream”. Antras et al. (2012) proposed theconcept of “upstreamness”, which is the number of stages that the product goes through beforereaching the final demand. They also prove that their concept of “upstreamness” is consistent
4
with Fally’s (2011, 2012) distance definition. In addition, Miller and Temurshoev (2013) pro-posed two other indicators to identify the upstreamness and downstreamness of an industry.A recent paper by Chen (2014) extended the APL to group-wise APL, a general mathematicalframework. In his work, both APL and the upstreamness measure by Antras et al. (2012) areproved to be special cases of the group-wise APL.
In contrast to the existing measures of “length” and “distance” in the GVC literature, ourpaper proposes a generalized and consistent accounting system that can be used to measurethe distance in production networks between producers and consumers at the country, industry,and product levels from different economic perspectives. The important feature of our measurefor distance is that we focus on the “value-added” propagation process in GVCs and providemore flexible ways to measure the position of countries and industries along GVCs. The mostimportant contribution of this paper is that we provide some conceptual designs based on the IOtechnique to represent the process for the creation and distribution of value-added along GVCsin detail. For example, our measure can be used to examine the GVC concerning a specificgood made in China that is consumed in the US, such as the case of iPhone. Using measures forboth the strength and length of linkages between producers and consumers and the conceptualdesigns of GVCs, the identification of various economy-wise smile curves in GVCs becomespossible based on real data, in this case from the World Input-Output Database (WIOD)1.
2 Methodology
2.1 Value added creation process in a closed economy
Our methodology is rooted in Leontief (1936) whose work demonstrates the complex linkagesamong different industries in an economy can be expressed as various inter-industry transac-tions organized into chessboard-type matrices, known as IO tables. Each column in the tablerepresents the required inputs from other industries (including imports and direct value-added)to produce the given amount of the product represented by that column. After normalization,the technical coefficient table represents the amount and type of intermediate inputs neededin the production of one unit of gross output. Using these coefficients, the gross output inall domestic stages of production that is needed to produce one unit of final products can beestimated via the so-called Leontief inverse. When the output flows associated with a partic-ular level of final demand are known, the total value-added throughout the economy can beestimated by multiplying these output flows with the value-added ratio (amount of value-addedper unit of gross output) in each industry.
1The WIOD (www.wiod.org) provides world input-output tables for each year since 1995 covering 40 coun-tries, including all 27 countries of the European Union (as of January 1, 2007) and 13 other major economies(see Appendix 1). These 40 countries represent more than 85 percent of world GDP. It contains data for 35industries covering the overall economy, including agriculture, mining, construction, utilities, 14 manufacturingindustries, and 17 services industries (see Appendix 2). The tables have been constructed by combining nationalinput-output tables with bilateral international trade data, following the conventions of the System of NationalAccounts. For detailed information about the WIOD, see Timmer et al. (2014b).
5
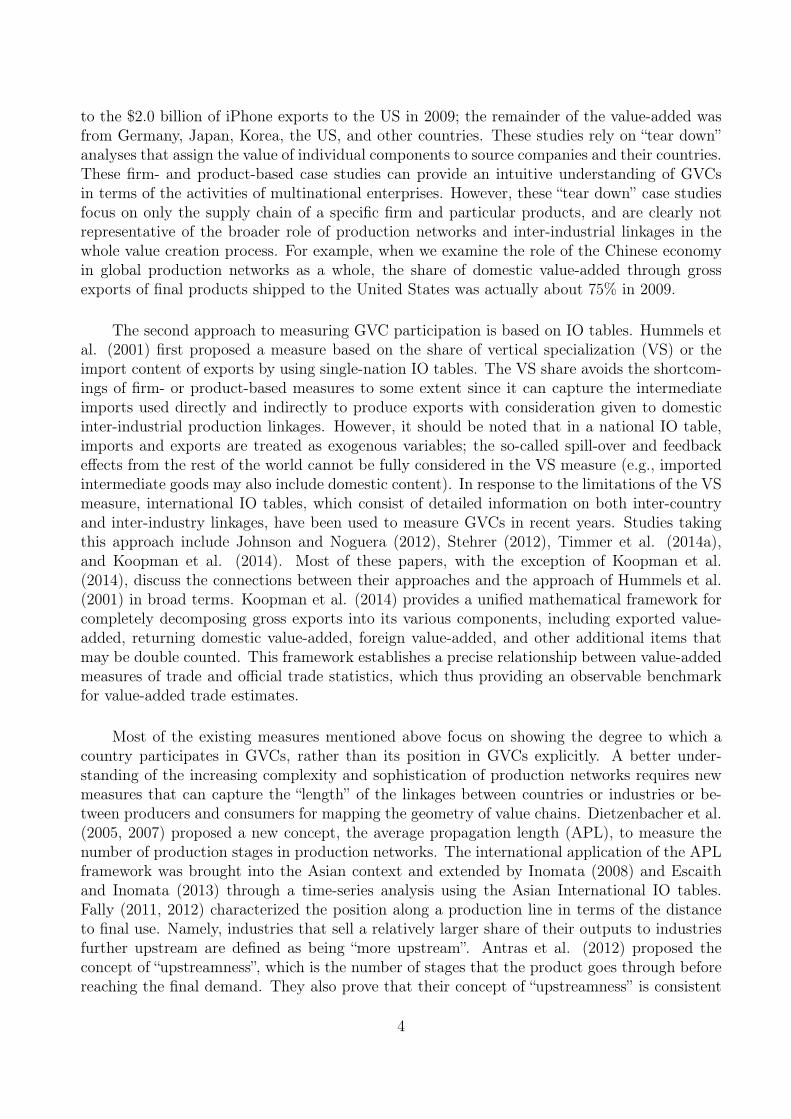
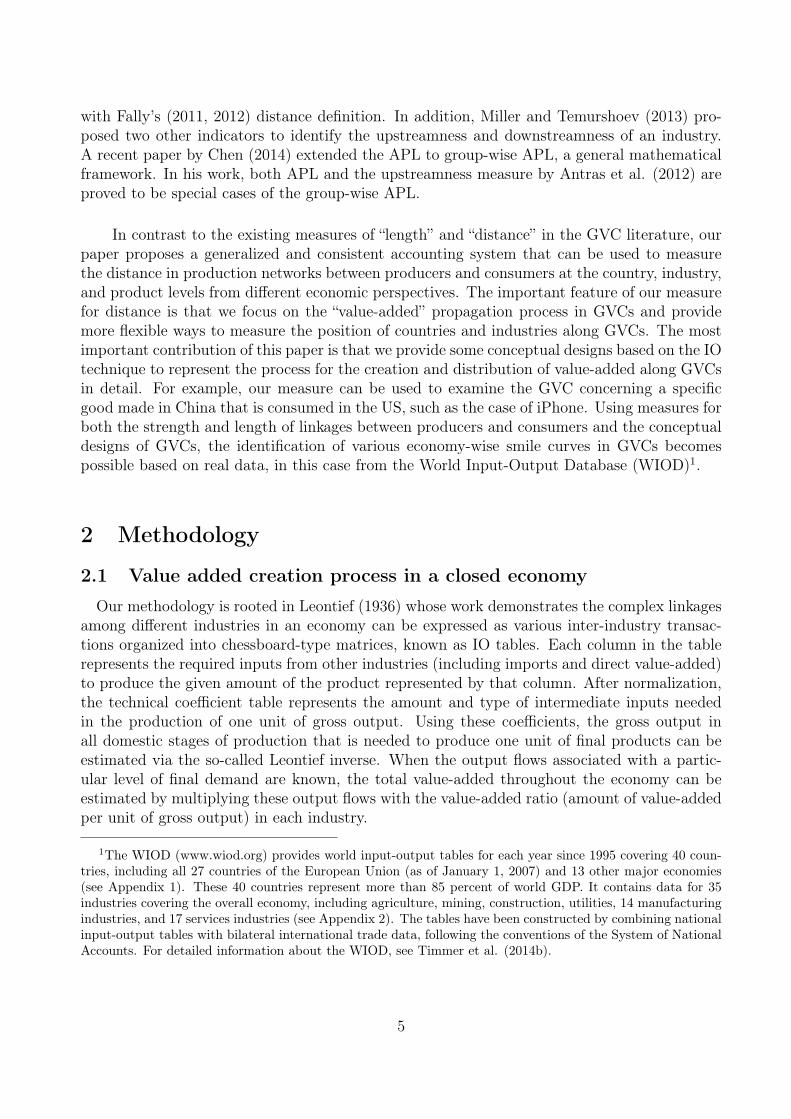
In a national I-O table,X = AX + Y (1)
where X is the N×1 gross output vector, Y is theN×1 final demand vector, and A is theN×NIO technical coefficient matrix. In other words, all gross output (total supply) must be usedeither as an intermediate good or a final good (total demand). After rearranging terms, we canhave
X = (I − A)−1Y = BY (2)
where B denotes the N ×N block matrix, commonly known as a Leontief inverse, which is thetotal requirement matrix that gives the amount of gross output required for a one-unit increasein final demand. The relationship expressed in equation (2) is the Leontief insight. Under thecommon assumptions for solvability of the equations, B also can be expressed as a power series.
B = I + A2 + A3 + · · · (3)
The effects on the gross output X due to a demand pull Y which is given in equation(2), can be interpreted as a stepwise or round-by-round procedure in equation (3). The initialeffect in round 0 states that Y itself needs to be produced. In order to produce this additionaloutput, extra intermediate inputs are required directly, amounting to AY in round 1. Next,these extra intermediate inputs AY need to be produced themselves, requiring A2Y of additionalintermediate inputs in round 2, and so forth. Therefore, the effects of gross output effects Xthus consist of an initial effect Y , a direct effect AY and indirect effects (A2 + A3 + · · · )Y .
In an IO table, we define V as a 1×N direct value-added coefficient vector. Each elementof V shows the share of direct value-added in gross output. This is equal to one minus theintermediate input share:
V = u[I − A] (4)
where u is a 1×N unit vector. The elements in the direct value-added coefficient vector V canbe also re-written as the following form:
vj = vaj/xj = 1−n∑i
aij (5)
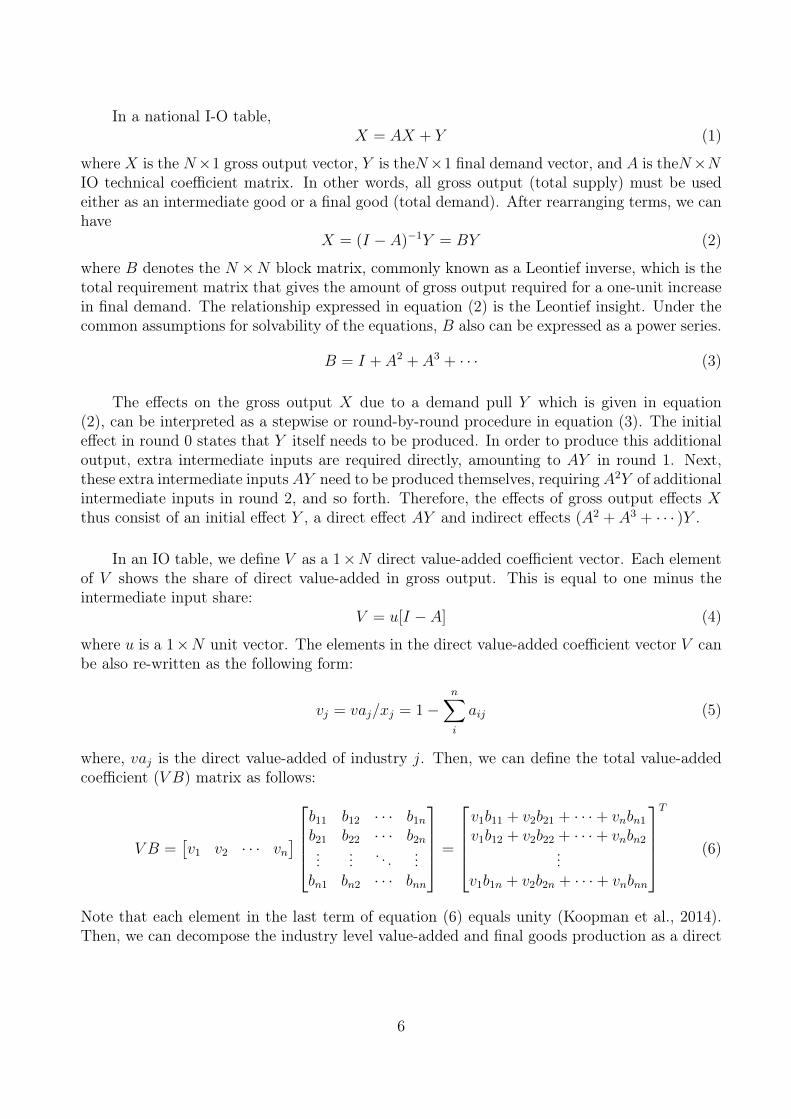
where, vaj is the direct value-added of industry j. Then, we can define the total value-addedcoefficient (V B) matrix as follows:
V B =[v1 v2 · · · vn
]b11 b12 · · · b1nb21 b22 · · · b2n...
... . . . ...bn1 bn2 · · · bnn
=
v1b11 + v2b21 + · · ·+ vnbn1v1b12 + v2b22 + · · ·+ vnbn2
...v1b1n + v2b2n + · · ·+ vnbnn
T
(6)
Note that each element in the last term of equation (6) equals unity (Koopman et al., 2014).Then, we can decompose the industry level value-added and final goods production as a direct
6
application of the Leontief insight expressed as follows:
V BY =
v1 0 · · · 00 v2 · · · 0...
... . . . ...0 0 · · · vn
b11 b12 · · · b1nb21 b22 · · · b2n...
... . . . ...bn1 bn2 · · · bnn
y1 0 · · · 00 y2 · · · 0...
... . . . ...0 0 · · · yn
=
v1b11y1 v1b12y2 · · · v1b1nynv2b21y1 v2b22y2 · · · v2b2nyn
...... . . . ...
vnbn1y1 vnbn2y2 · · · vnbnnyn
(7)
The matrix in equation (7) shows the estimates of industrial value-added in final goods produc-tion. Each element in the matrix represents the value-added from a source industry directly orindirectly used in the production of final goods. In the matrix, walking along the row yieldsthe distribution of value-added created from one industry used across all industries. Therefore,summing up the ith row of the matrix, we obtain the total value-added created by productionfactors employed in the ith industry. In other words, it equals the GDP of the ith industry.Expressing this mathematically, we have
vi(bi1y1 + bi2y2 + · · ·+ binyn) = vai = GDPi (8)
At the same time, in the same matrix, a column yields the contributions of value-added fromall industries to the final goods produced by a particular industry. Adding up all elements inthe jth column equals the total value of final goods by the jth industry, as shown by
v1b1jyj + v2b2jyj + · · ·+ vnbnjyj = yj (9)
These two different ways that decompose value-added and final goods production have theirown economic interpretations and thus play different roles in economic analysis. In summary,the sum of the V BY matrix across columns along a row accounts for how each value-addedoriginating in a particular industry is used by the industry itself and all its downstream indus-tries. It traces forward industrial linkages across all downstream industries from a supply-sideperspective. Since the sum of the V BY matrix across the rows along a column accounts for allupstream industries’ value-added induced by a specific final good, it traces backward industriallinkages across upstream industries from a user’s perspective. Based on the identity (equation(6)), all these sources should sum to 100% of the value of final products for any given industry.
2.2 Value added propagation length
In this section, we define the value-added propagation length from producers to consumersin a closed economic system. We have shown how value-added can be propagated through bothforward and backward industrial linkages in an economy in equations (8) and (9) above. Thesetwo equations can be further transformed to
vivai
(bi1y1 + bi2y2 + · · ·+ binyn) = 1 (10)
v1b1j + v2b2j + · · ·+ vnbnj = 1 (11)
7
Re-writing the above equations as matrix form, we get
V BY/VA = V (I + A+ A2 + A3 + · · · )Y/VA = u (12)
V B = V (I + A+ A2 + A3 + · · · ) = uT (13)
where, u denotes a N × 1 unit vector and VA denotes the value-added vector in IO table. Inthis paper, we define “/” as an element-wise vector division operator. In equation (12), the firstterm V IY/VA in the expansion form indicates the share of value-added absorbed by all finaldemand through the round 0 production process via forward industrial linkages in total value-added by industry. The second term V AY/VA represents the share of value-added absorbedby all final demand through round 1 of the production process via forward industrial linkagesin total value-added by industry. The remaining terms show the induced value-added sharein subsequent rounds of production processes via forward industrial linkages. Alternatively,in equation (13), the first term V I in the expanded form indicates the national value-addedinduced by one unit of final demand on a specific product through the round 0 productionprocess via backward industrial linkages. The second term V A in the expanded form indicatesthe national value-added induced by one unit of final demand for a specific product throughround 1 of the production process via backward industrial linkages. The remaining terms showthe induced national value-added in subsequent rounds of production processes via backwardindustrial linkages.
On the basis of the explanation of equations (12) and (13), the logic of APL (Dietzenbacheret al., 2005), and the concept of “upstreamness” (Antras et al., 2012), the industrial value-addedpropagation length through both forward and backward industrial linkages can be defined byusing a weighted expression as shown below.
Definition 1: Forward industrial linkage-based value-added propagation length:
U = V (1I + 2A+ 3A3 + · · · )Y/VA = V (0I + 1A+ 2A2 + · · · )Y/VA+ u
= V B2Y = V (B2 −B)Y/VA+ u(14)
The index U measures the total number of stages, on average, through which the value-addedof a specific industry reaches all final demand users by the way of forward industrial linkages.It can be simplified as the distance from a specific industry (value-added creator) to consumers.If U is a relatively large figure for a specific industry, it indicates that this industry is located inthe upstream portion of the value chain since its value-added goes through many downstreamproduction stages before reaching final users. On the other hand, a lower value of U indicatesthat the industry is closer to the downstream portion of the value chain since only a smallnumber of stages are needed for this industry’s value-added inputs to reach final users.
Definition 2: Backward industrial linkage-based value-added propagation length:
D = V (1I + 2A+ 3A3 + · · · ) = V (0I + 1A+ 2A2 + · · · ) + uT
= V B2 = V (B2 −B) + uT(15)
The index D measures the average number of production stages for a specific final productwhen it induces the value-added for all industries by the way of backward industrial linkages
8
in the whole value chain. Unlike the index U, it is difficult to identify the position of a specificindustry in value chains by using index D since it is measured from the perspective of the finaluser. In other words, D represents the length from a specific final product to all industries viathe value-added propagation process. Therefore, compared to U, D can be simplified as thedistance from a specific consumer (who consumes a specific final product) to suppliers.
It should be noted that both U and D give an average level of value-added propagationlength by industry. These measures are similar to the “distance”-related definitions used in theliterature. However, to slice up GVCs at more detailed levels, we need to define the distancefrom a specific supplier or a group of suppliers to a specific consumer or a group of consumersas shown below.
Given the same closed IO system, the value-added of a specific industry s (value-addedcreator or product supplier) induced by the demand of a specific final product k can be givenas VsBYk, where Vs =
[0 0 · · · vs · · · 0
], represents the value-added input coefficient of
industry s and Yk =[0 0 · · · yk · · · 0
]T represents consumers’ demand on a final productk. If we denote vsbskyk = vask, then vsbskyk
vask= 1 . For all value-added industries, the following
relation holds in definition
V BYk/VAk = V (I + A+ A2 + A3 + · · · )Yk/VAk = u (16)
Following the definition of U, the value-added propagation length from sector s to final productk(Usk, a scalar) can be given as follows:
Usk = Vs(1I + 2A+ 3A2 + · · · )Yk/vask = VsB2Yk/vask (17)
The above definition can also be given as a vector form for all industries:
Uk = V (1I + 2A+ 3A2 + · · · )Yk/VAk = V B2Yk/VAk (18)
where, Uk is a N × 1 vector showing the industrial value-added propagation length to a specificfinal product k; VAk =
[va1k va2k · · · vank
]T ; vibikyk = vaik.
For a group of final products, YG =[0 0 · · · yGm · · · 0
],m ∈ G , we get
G∑m
vibimyGm =
vaig and VAG =[va1G va2G · · · vanG
]T . Thus, the average distance from a specific industryto a group of final products G can be given as follows:
UG = V (1I + 2A+ 3A2 + · · · )YG/VAG = V B2YG/VAG (19)
It is easy to know that UG = U , when the group G is the entire final demand vector in the IOsystem, YG = Y .
The above definition for various lengths is from the perspective of the value-added creator(industry) and it measures the distance (the number of propagation stages) from a specific in-dustry to a specific final product or a group of final products. From the consumers’ perspective,Usk can also be defined as Dsk representing the value-added propagation length from a specificfinal product k to a specific industry s.
9

If we donote vsbsjyj = vasj, thenvsbsjyjvasj
= 1, Let VAs =[vas1 vas2 · · · vasn
]T .By definiton, we have
VsBY /VAs = Vs(I + A+ A2 + · · · )Y /VAs = uT (20)
Following the same manner used in the definition of Uk, the value-added propagation lengthfrom final products to a specific industry can be given as:
Ds = Vs(1I + 2A+ 3A2 + · · · )Y /VAs = VsB2Y /VAs (21)
For a group of sectors T , VT =[0 0 · · · vTm · · · 0
],m ∈ T , let
T∑m
vTmbmjyj = vaTj and
VAT =[vaT1 vaT2 · · · vaTn
]T , then the value-added propagation length from a specific finalproduct to a group of value-added creators (industries) can be given as
DT = VT (1I + 2A+ 3A2 + · · · )Y /VAT = VTB2Y /VAT (22)
Also when the group T covers the entire industries, VT = V , we can simply have DT = D.
The above indicators can be applied to a closed inter-country IO system. This can yieldvarious distances depending on the definition of final product group or industry group. Forexample, grouping the all final products in the US, we can easily measure the U distance fromspecific Chinese industries to the US consumer. By grouping the entire final products of theworld, the U distance from specific Chinese industries to the world market can be measured;by grouping the value-added of Chinese industries, we can also measure the D distance froma specific final product consumed in the US to Chinese producers. Grouping the entire value-added industries of the world allows us to measure the D distance from the specific final productconsumed in the US to all producers.
2.3 Conceptual GVC settings
To give a more detailed mapping of the geometry of GVCs, we need three fundamentalmeasures. The first one is the strength of linkages between countries or industries in thevalue-added propagation process; the second one is the length (distance) of linkages betweenproducers and consumers in the value-added propagation process; the third one is the definitionof the GVC itself. The measure for strength can be used to express the magnitude of the benefit(i.e., the absolute gain of value-added) for the country or industry that is involved in GVCs.The measure for length can be used to identify the position of a country or an industry inthe value-added creation process. These two measures have been given in Section 2.1 and 2.2respectively. The remaining work for this section is to create a conceptual GVC design.
GVCs can be seen from various perspectives. The most popular and simple GVC settingcan focus on the export of a specific product and look at how value is added from one country orindustry to another country or industry along whole production networks, and how the productis ultimately consumed by consumers. Take the case of an iPhone that is designed in California(US), assembled in China, and consumed in the US. Next, suppose the iPhone industry is
10
reflected in China’s part of an inter-country IO table. Then, it is easy to use China’s iPhoneexports to the US as a starting point for separating the whole value chain into pre-fabricationstages and post-fabrication stages. All countries and industries that directly and indirectlyprovide intermediate goods and services to China’s production (assembly) of iPhone can beconsidered as participants in the pre-fabrication stages along the value chain. All countries andindustries involved in the distribution process of imported iPhone to the US consumers can beconsidered as participants in the post-fabrication stages along the value chain.
Using the logic of Leontief’s backward linkage, we can calculate the value-added by countryand industry induced in the pre-fabrication stages by China’s exports of the iPhone to the USin an inter-country IO system. In the same manner (Leontief’s backward linkage), we can alsomeasure the value-added induced in the post-fabrication stages by country and industry fromcommerce, transportation, and marketing services (markup or margin) when imported iPhonesare delivered to the US consumers, assuming that there is no difference in markup rate acrossproducts in the US domestic market2. By picking up the most important participants withvalue-added gain above a threshold percentage (e.g., 1% of the total induced value-added inthe whole value chain) in both pre-fabrication and post-fabrication stages in the iPhone GVC,a map of the iPhone GVC can be created. Specifically in this map, the value-added ratio (i.e.,value-added gain by producing one unit of output) is used as the measure on the Y-axis andthe distance from industry to the US consumers (forward industrial linkage-based measure, U)is used as the measure on the X-axis. The above conceptual GVC setting can also be applied tothe case of Japanese cars, Italian designer clothes, and any other specific final product or groupof final products. This GVC mapping can finally help us identify if the so-called “smile curve”exists, and if so, what it looks like in the GVC context. It should be noted that in our examplewe trace the most benefited participants in the iPhone GVC by using a measure of strengthbased on Leontief’s backward industrial linkage, and identify the position of these participantsby using the measure of length based on Leontief’s forward industrial linkage.
3 Empirical results
3.1 Industry upstreamness and downstreamness in the value-addedcreation process
As mentioned before, the two measures for value-added propagation length, U and D, areequivalent at both the aggregated average level (for all countries and industries in a closedinter-country IO system) and the lowest level (between an industry and a final product). Inorder to check how the fragmentation of production in GVCs has changed over time, we firstcalculate the aggregated average U (or D) for the whole world from 1995 and 2011 using theWIOD and show the result in Figure 2.
Obviously, the value-added propagation length for the whole GVCs shows an increasingtendency, especially after 2002. It first peaked in 2008 and then had a short decline after the
2If IO or use tables based on both purchase and basic prices are available, the markup by product can beeasily identified.
11
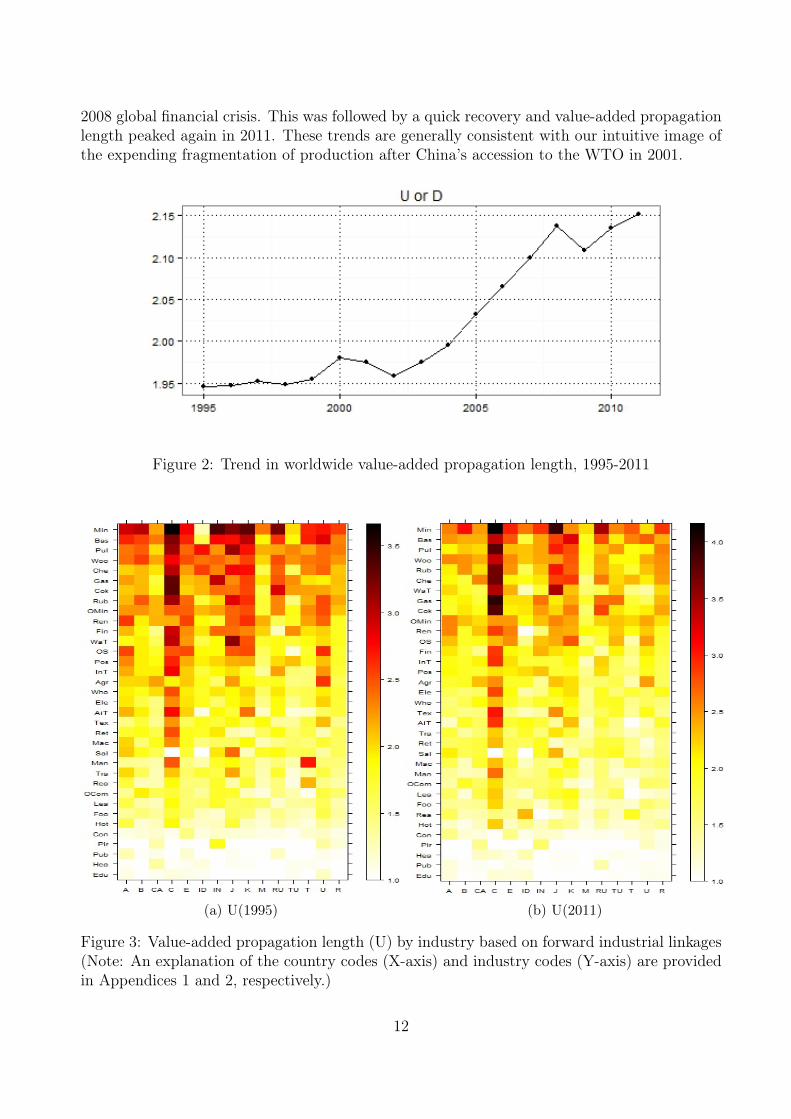
2008 global financial crisis. This was followed by a quick recovery and value-added propagationlength peaked again in 2011. These trends are generally consistent with our intuitive image ofthe expending fragmentation of production after China’s accession to the WTO in 2001.
Figure 2: Trend in worldwide value-added propagation length, 1995-2011
(a) U(1995) (b) U(2011)
Figure 3: Value-added propagation length (U) by industry based on forward industrial linkages(Note: An explanation of the country codes (X-axis) and industry codes (Y-axis) are providedin Appendices 1 and 2, respectively.)
12
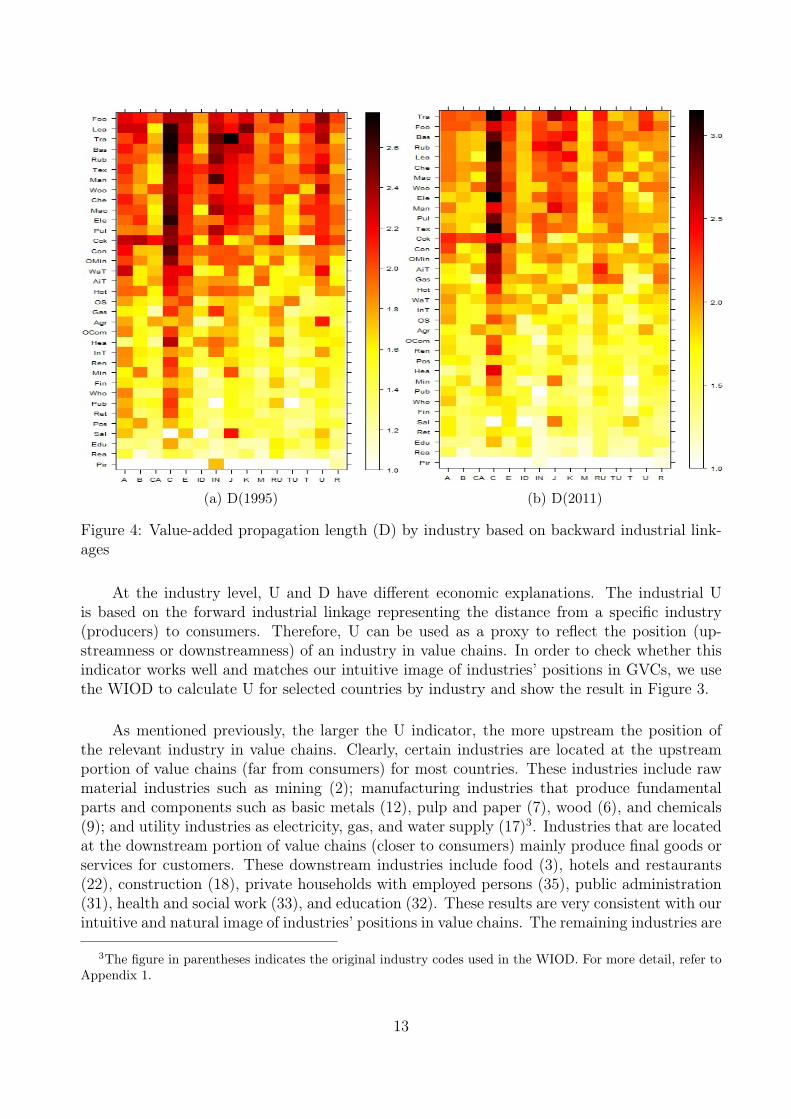
(a) D(1995) (b) D(2011)
Figure 4: Value-added propagation length (D) by industry based on backward industrial link-ages
At the industry level, U and D have different economic explanations. The industrial Uis based on the forward industrial linkage representing the distance from a specific industry(producers) to consumers. Therefore, U can be used as a proxy to reflect the position (up-streamness or downstreamness) of an industry in value chains. In order to check whether thisindicator works well and matches our intuitive image of industries’ positions in GVCs, we usethe WIOD to calculate U for selected countries by industry and show the result in Figure 3.
As mentioned previously, the larger the U indicator, the more upstream the position ofthe relevant industry in value chains. Clearly, certain industries are located at the upstreamportion of value chains (far from consumers) for most countries. These industries include rawmaterial industries such as mining (2); manufacturing industries that produce fundamentalparts and components such as basic metals (12), pulp and paper (7), wood (6), and chemicals(9); and utility industries as electricity, gas, and water supply (17)3. Industries that are locatedat the downstream portion of value chains (closer to consumers) mainly produce final goods orservices for customers. These downstream industries include food (3), hotels and restaurants(22), construction (18), private households with employed persons (35), public administration(31), health and social work (33), and education (32). These results are very consistent with ourintuitive and natural image of industries’ positions in value chains. The remaining industries are
3The figure in parentheses indicates the original industry codes used in the WIOD. For more detail, refer toAppendix 1.
13
located between the upstream and downstream positions. For some industries, their positionsare partly a result of the relatively rough industry classification used. For example, goodssuch as agriculture (1) and services such as air transport (25) can represent either intermediateinputs by industries or final consumption by household. The position rankings for industriesare relatively stable when investigating the time-series calculation results for all countries in theWIOD (the situations for 1995 and 2011 are shown here for reference). Though the evolutionof industrial and trade structure may impact the position of industries, the general positionof most industries are not likely to change frequently or significantly since the most importantdeterminants of position are inherent properties of an industry.
On the other hand, the indicator D is based on the backward industrial linkage whichmeasures the distance from a specific final product to all producers. By definition, this indicatoris difficult to use as a proxy for the position of an industry in value chains, but it can show howfar a specific final product is from the value-added creators. We show the calculation resultsfor D by country and industry in Figure 4. This indicator also looks relatively stable overtime. However, it shows a very different ranking comparing to that of U in Figure 3. Mostof the manufacturing products have relatively longer value-added propagation lengths, whilemost services shows relatively short lengths. This is intuitively understood because producingmanufacturing products requires various intermediate inputs which are produced at stagesfurther upstream. As a result, the larger the D indicator is, the more complex the productionprocess of the final product is. In this meaning, D can be considered a proxy for the complexityof the production technology for a specific final product.
3.2 Examples of smile curves in GVCs
Once the measurement results are available for the strength and length of connections betweencountries or industries, we can confront the challenge of drawing the smile curves in variousconceptual value chains. Here, a good starting point for us to consider is the case of the iPhone.However, in the existing inter-country IO tables, it is difficult to isolate the iPhone industryindividually. Here, we first take the industry category of electrical and optical equipment (14)in the WIOD as a proxy to show how and to what extent countries and industries are involvedin the value chain of China’s exports of electrical products (which includes the iPhone).
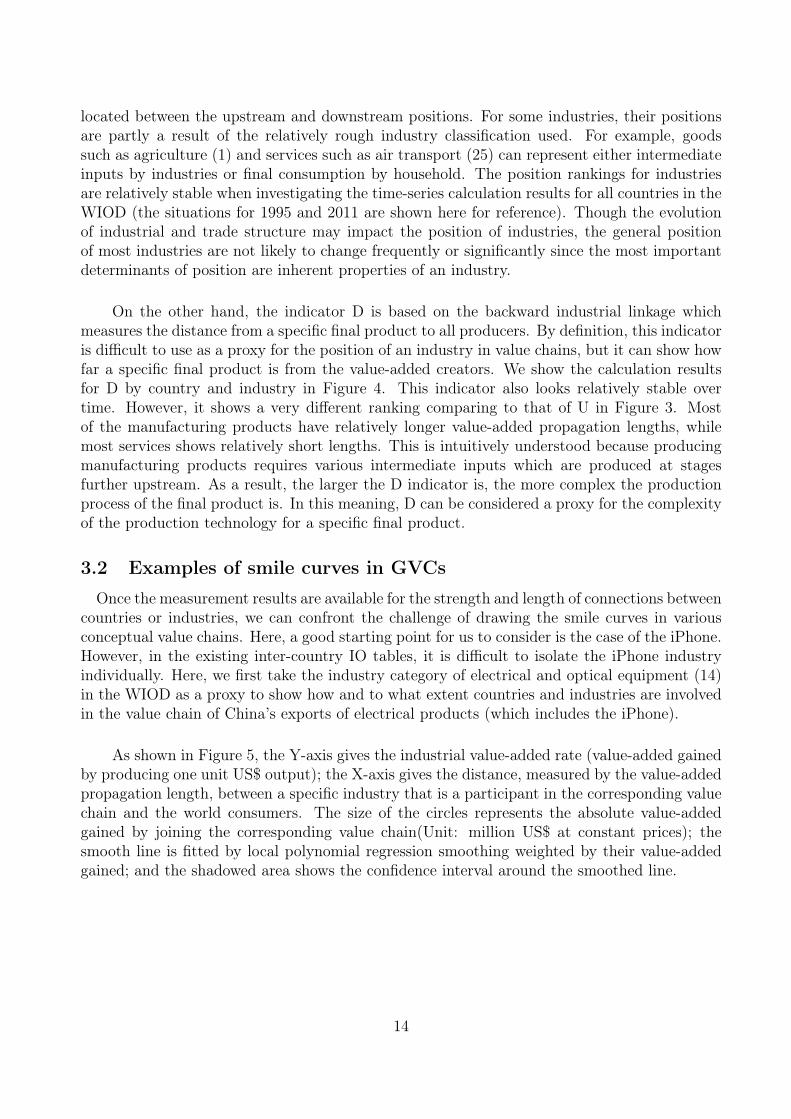
As shown in Figure 5, the Y-axis gives the industrial value-added rate (value-added gainedby producing one unit US$ output); the X-axis gives the distance, measured by the value-addedpropagation length, between a specific industry that is a participant in the corresponding valuechain and the world consumers. The size of the circles represents the absolute value-addedgained by joining the corresponding value chain(Unit: million US$ at constant prices); thesmooth line is fitted by local polynomial regression smoothing weighted by their value-addedgained; and the shadowed area shows the confidence interval around the smoothed line.
14
(a) 1995 (b) 2011
Figure 5: Value chains for Chinese exports of electrical and optical equipment
Note: The letters and figures along the smile curve indicate the benefiting countries andindustries (for an explanation of these codes, see Appendices 1 and 2).
Clearly, the value chain for Chinese exports of electrical and optical equipment to the worldmarket appears as a smile curve for both 1995 and 20114. Several observations can be madefrom these curves. First, for both years we find that China’s electrical and optical equipmentindustry (14) is the largest beneficiary in terms of value-added gain in this value chain. Thisis self-evident since China’s electrical and optical equipment industry itself should be the mostimpacted industry by China’s production of electrical and optical equipment exports throughthe backward and intra-industrial linkages. Second, many other Chinese domestic industriesalso benefited by participating in the pre-fabrication stages of this value chain. This is also self-evident since most of intermediate inputs needed to produce electrical and optical equipmentin China are presumed to come from the Chinese domestic market. Third, the electrical andoptical equipment industries in other countries located in the upstream portion of this valuechain also get a relatively large portion of the value-added gain. This is mainly because of thecross-border, intra-industrial trade. Lastly, after-service industries such as wholesale (20) andinland transportation (23) in the US, Japan, and EU are the main beneficiaries in the post-fabrication stage of this value chain. This is also easy to understand since Chinese electrical andoptical equipment exported to the US, Japan, and EU need to be delivered to their domesticconsumers, mainly through the use of their domestic wholesale and transportation serviceindustries.
In terms of the evolution of the smile curves in Figure 5, the main finding is that thewhole curve moves down. This movement implies that the value-added rate for most partici-pants (industries in different countries) in this value chain decreased between 1995 and 2011.
4Here, we pick up the most important participants (countries and sectors) with value-added gain above athreshold percentage (1% of the total induced value-added in the whole value chain) in both pre-fabricationand post-fabrication stages in this smile curve. Appendix 3 shows the corresponding smile curve when all thebeneficiary countries and industries are selected.
15
In other words, producing one unit of output requires more intermediate inputs, including in-termediate imports for most participants in this value chain. Using the Chinese electrical andoptical equipment industry as an example, the value-added rate decreased very fast. Severalreasons likely explain this phenomenon. The first reason is increased processing trade in thisindustry. The participation pattern of China in the GVC at the early stage is the acceptance ofoutsourcing tasks such as the assembly of iPhones. Compared with the traditional productionof electrical and optical equipment, the assembly process is much more labor intensive anddepends on a greater amount of foreign intermediate inputs. Despite the increasing domesticlabor cost at an absolute level in China, decreasing usage of capital and increasing usage ofintermediate imports may result in a decline in the value-added rate for this industry. Second,the confidence interval of the smile curve becomes much wider. This is mainly because of theexpanding differentials of value-added rates among value chain participants. Evidence stronglysupports this phenomenon. For example, the value-added rate of the US electrical and opticalequipment industry moved up from 0.34 in 1995 to 0.64 in 2011, while the value-added ratefor this industry in China went down from 0.25 in 1995 to 0.18 in 2011. In other words, theUS electrical and optical equipment industry increasingly concentrated on high value-addedproduction of more complex intermediate goods (e.g., computer processors), whereas Chinatook on more tasks such as assembling final products with low value-added per unit produc-tion. Third, the whole length of the smile curve is getting much longer. This reflects the factthat a higher volume of intermediate goods is produced in subsequent stages or processes acrossdifferent countries, and these goods are then exported to other countries for further production.Fourth, the Chinese electrical and optical equipment industry is located at the low end of thesmile curve, but its value-added gain is increasing in absolute terms (note the change in circlesize between 1995 and 2011). In other words, China is taking an increasingly large piece of thepie in the value chain, although the value-added gain in producing one unit of electrical goodsin USD is declining.
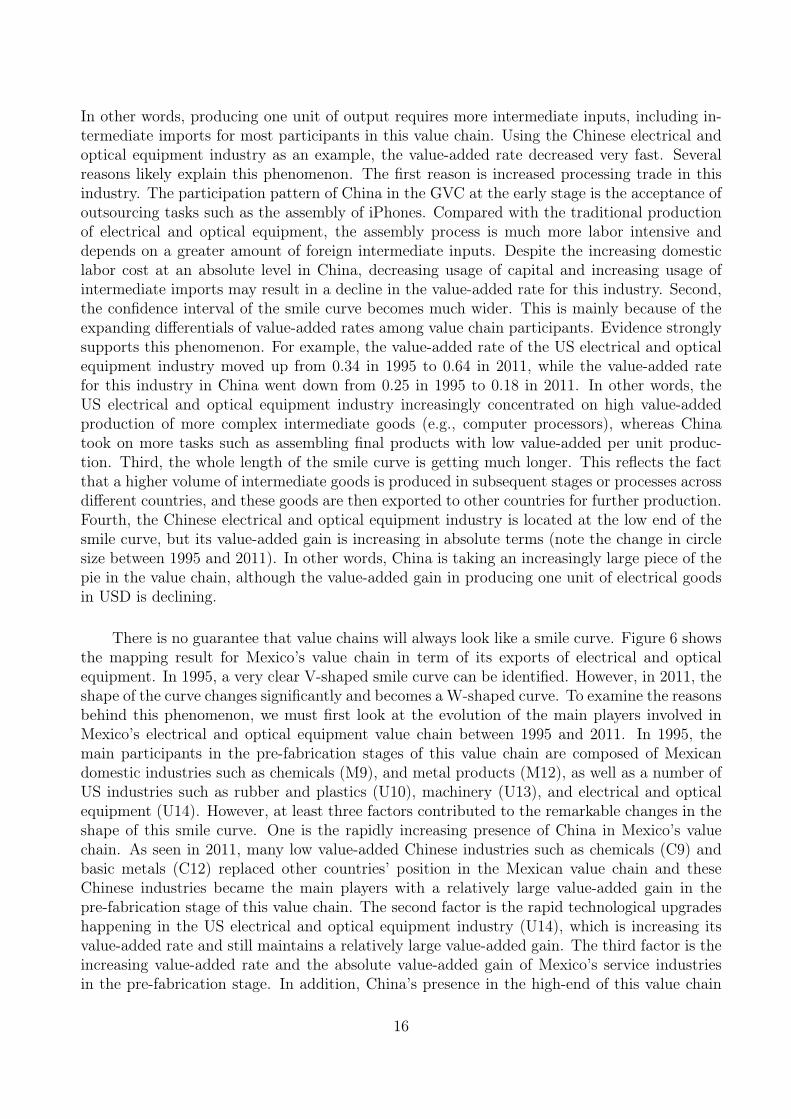
There is no guarantee that value chains will always look like a smile curve. Figure 6 showsthe mapping result for Mexico’s value chain in term of its exports of electrical and opticalequipment. In 1995, a very clear V-shaped smile curve can be identified. However, in 2011, theshape of the curve changes significantly and becomes a W-shaped curve. To examine the reasonsbehind this phenomenon, we must first look at the evolution of the main players involved inMexico’s electrical and optical equipment value chain between 1995 and 2011. In 1995, themain participants in the pre-fabrication stages of this value chain are composed of Mexicandomestic industries such as chemicals (M9), and metal products (M12), as well as a number ofUS industries such as rubber and plastics (U10), machinery (U13), and electrical and opticalequipment (U14). However, at least three factors contributed to the remarkable changes in theshape of this smile curve. One is the rapidly increasing presence of China in Mexico’s valuechain. As seen in 2011, many low value-added Chinese industries such as chemicals (C9) andbasic metals (C12) replaced other countries’ position in the Mexican value chain and theseChinese industries became the main players with a relatively large value-added gain in thepre-fabrication stage of this value chain. The second factor is the rapid technological upgradeshappening in the US electrical and optical equipment industry (U14), which is increasing itsvalue-added rate and still maintains a relatively large value-added gain. The third factor is theincreasing value-added rate and the absolute value-added gain of Mexico’s service industriesin the pre-fabrication stage. In addition, China’s presence in the high-end of this value chain
16
is also noteworthy. For example, China’s financial intermediation (C28) and wholesales (C20)industries play an increasingly important role in the pre-fabrication and post-fabrication stagesof the Mexican electrical and optical equipment value chain, respectively. This shift may havealso contributed to the overall expansion of Mexico’s electrical product value chain since thewhole length (Y-axis) of this chain increases from 5.4 to 7.3 between 1995 and 2011.
(a) 1995 (b) 2011
Figure 6: Value chains for Mexican exports of electrical and optical equipment
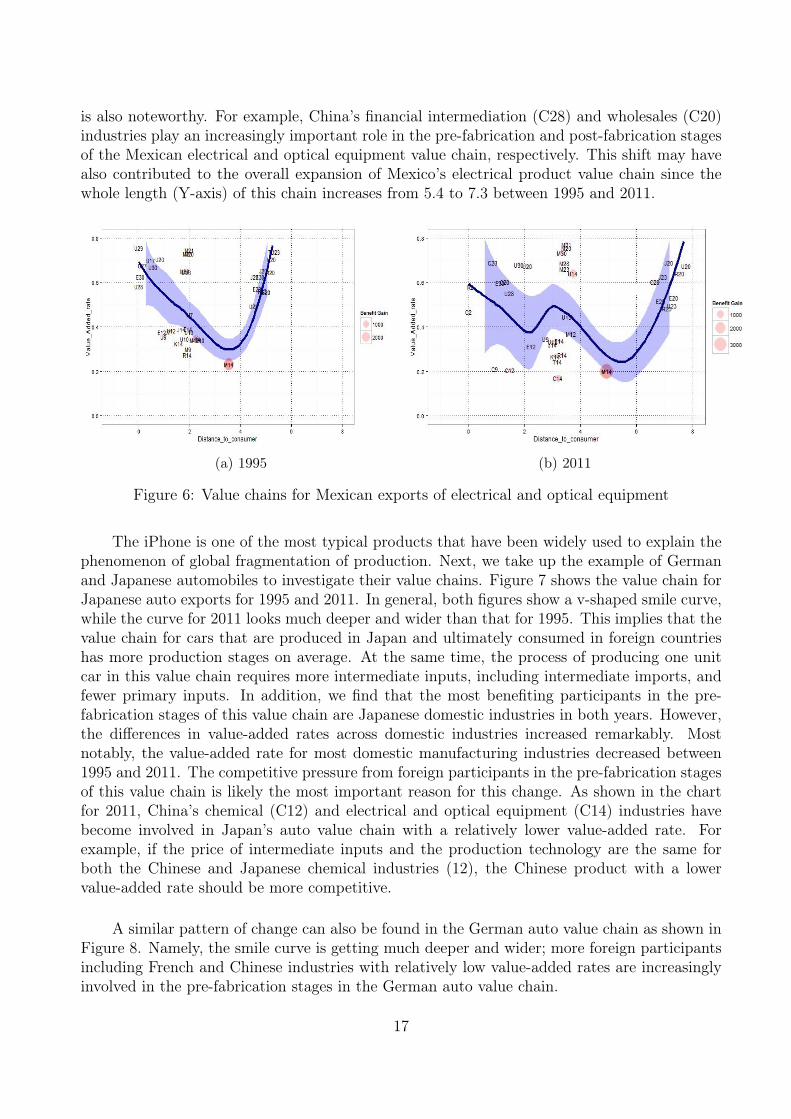
The iPhone is one of the most typical products that have been widely used to explain thephenomenon of global fragmentation of production. Next, we take up the example of Germanand Japanese automobiles to investigate their value chains. Figure 7 shows the value chain forJapanese auto exports for 1995 and 2011. In general, both figures show a v-shaped smile curve,while the curve for 2011 looks much deeper and wider than that for 1995. This implies that thevalue chain for cars that are produced in Japan and ultimately consumed in foreign countrieshas more production stages on average. At the same time, the process of producing one unitcar in this value chain requires more intermediate inputs, including intermediate imports, andfewer primary inputs. In addition, we find that the most benefiting participants in the pre-fabrication stages of this value chain are Japanese domestic industries in both years. However,the differences in value-added rates across domestic industries increased remarkably. Mostnotably, the value-added rate for most domestic manufacturing industries decreased between1995 and 2011. The competitive pressure from foreign participants in the pre-fabrication stagesof this value chain is likely the most important reason for this change. As shown in the chartfor 2011, China’s chemical (C12) and electrical and optical equipment (C14) industries havebecome involved in Japan’s auto value chain with a relatively lower value-added rate. Forexample, if the price of intermediate inputs and the production technology are the same forboth the Chinese and Japanese chemical industries (12), the Chinese product with a lowervalue-added rate should be more competitive.
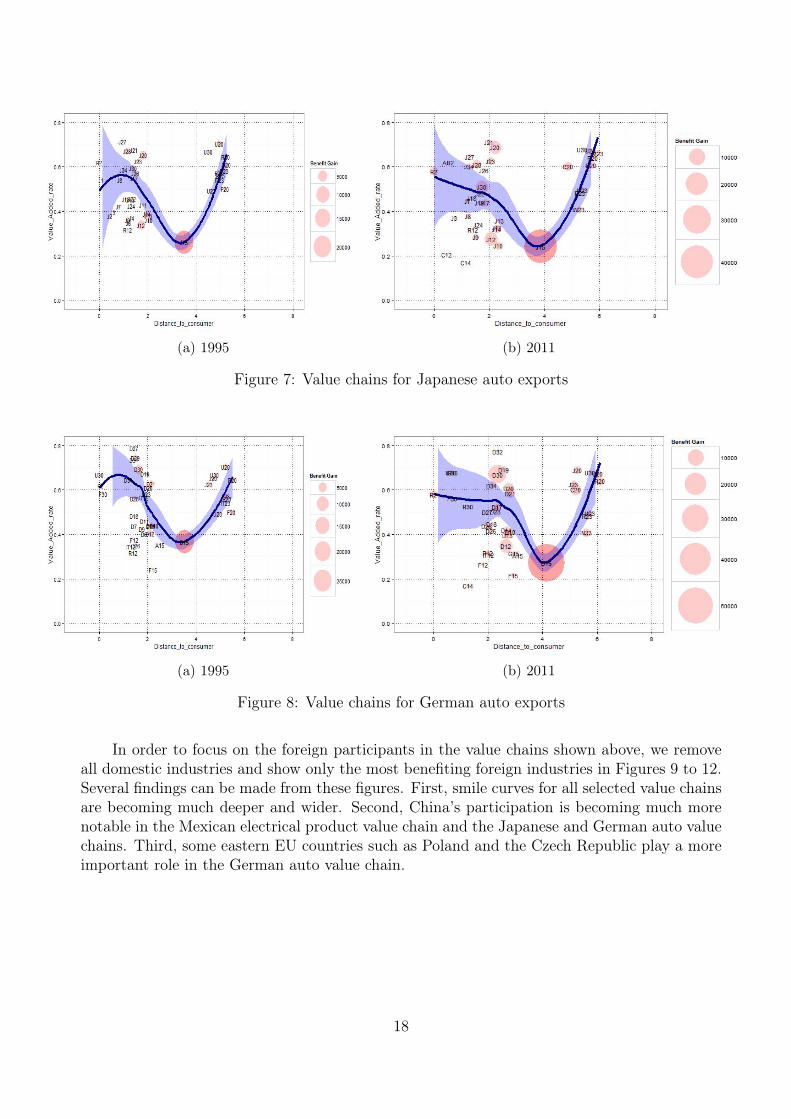
A similar pattern of change can also be found in the German auto value chain as shown inFigure 8. Namely, the smile curve is getting much deeper and wider; more foreign participantsincluding French and Chinese industries with relatively low value-added rates are increasinglyinvolved in the pre-fabrication stages in the German auto value chain.
17
(a) 1995 (b) 2011
Figure 7: Value chains for Japanese auto exports
(a) 1995 (b) 2011
Figure 8: Value chains for German auto exports
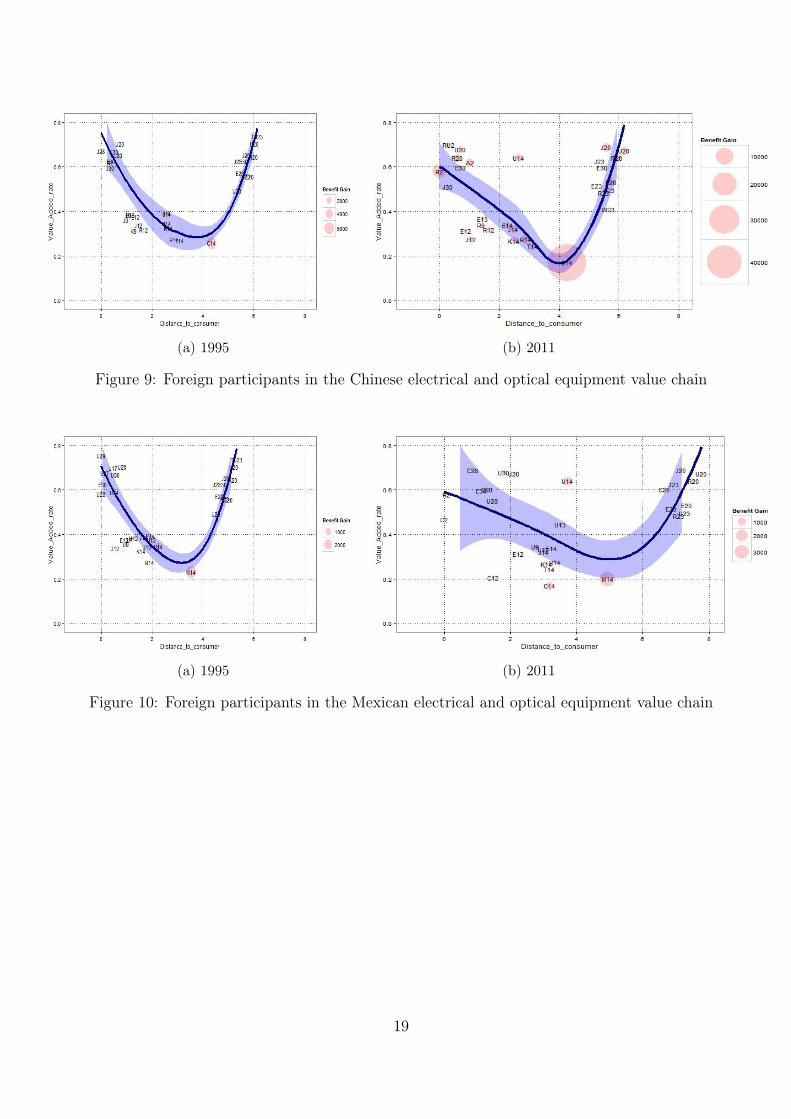
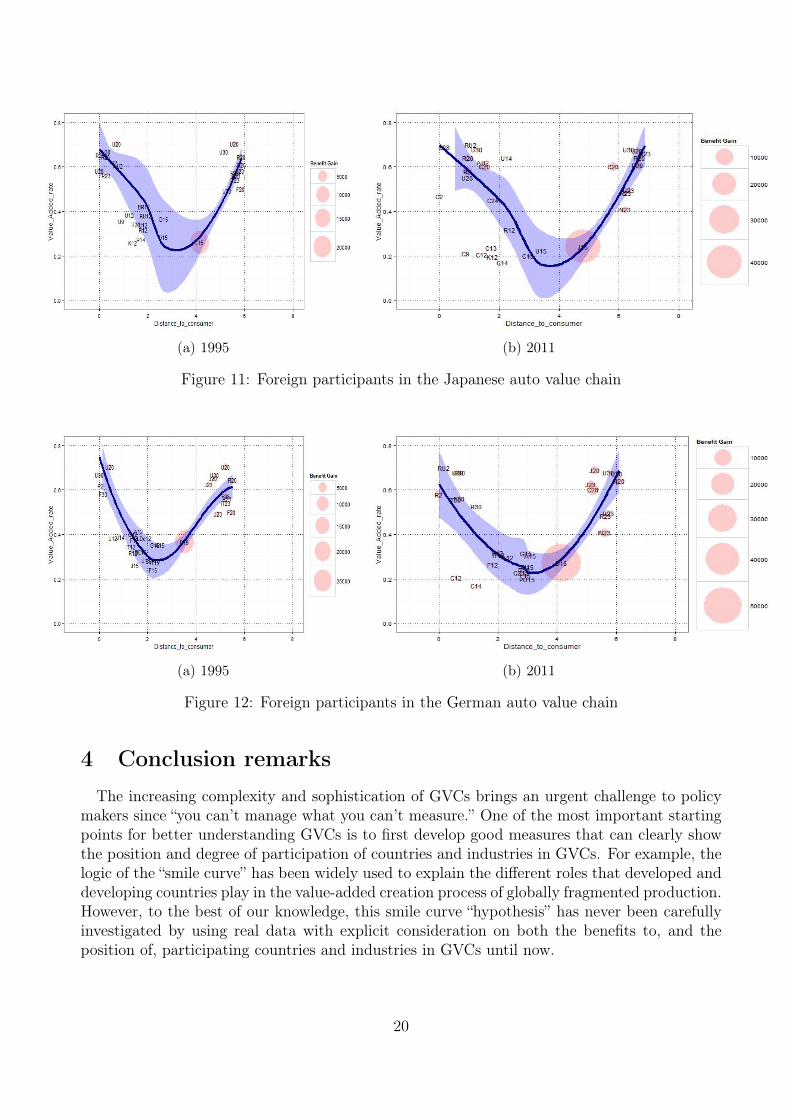
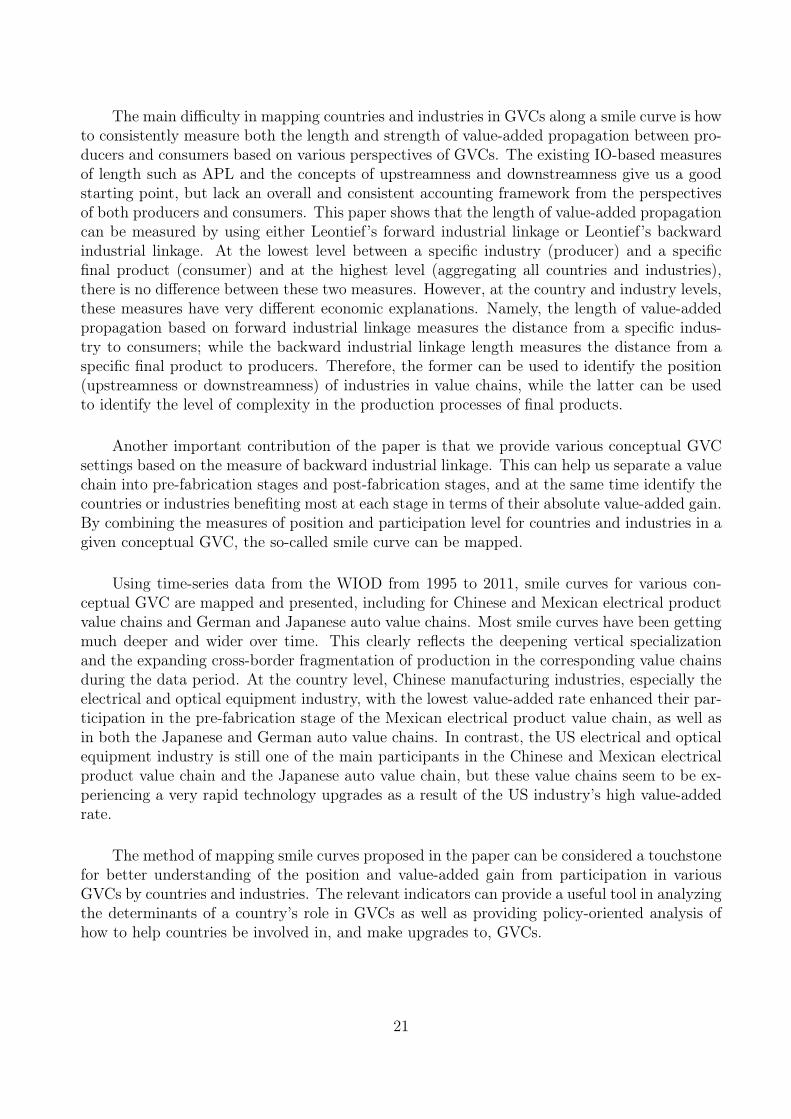
In order to focus on the foreign participants in the value chains shown above, we removeall domestic industries and show only the most benefiting foreign industries in Figures 9 to 12.Several findings can be made from these figures. First, smile curves for all selected value chainsare becoming much deeper and wider. Second, China’s participation is becoming much morenotable in the Mexican electrical product value chain and the Japanese and German auto valuechains. Third, some eastern EU countries such as Poland and the Czech Republic play a moreimportant role in the German auto value chain.
18
(a) 1995 (b) 2011
Figure 9: Foreign participants in the Chinese electrical and optical equipment value chain
(a) 1995 (b) 2011
Figure 10: Foreign participants in the Mexican electrical and optical equipment value chain
19
(a) 1995 (b) 2011
Figure 11: Foreign participants in the Japanese auto value chain
(a) 1995 (b) 2011
Figure 12: Foreign participants in the German auto value chain
4 Conclusion remarksThe increasing complexity and sophistication of GVCs brings an urgent challenge to policy
makers since “you can’t manage what you can’t measure.” One of the most important startingpoints for better understanding GVCs is to first develop good measures that can clearly showthe position and degree of participation of countries and industries in GVCs. For example, thelogic of the “smile curve” has been widely used to explain the different roles that developed anddeveloping countries play in the value-added creation process of globally fragmented production.However, to the best of our knowledge, this smile curve “hypothesis” has never been carefullyinvestigated by using real data with explicit consideration on both the benefits to, and theposition of, participating countries and industries in GVCs until now.
20
The main difficulty in mapping countries and industries in GVCs along a smile curve is howto consistently measure both the length and strength of value-added propagation between pro-ducers and consumers based on various perspectives of GVCs. The existing IO-based measuresof length such as APL and the concepts of upstreamness and downstreamness give us a goodstarting point, but lack an overall and consistent accounting framework from the perspectivesof both producers and consumers. This paper shows that the length of value-added propagationcan be measured by using either Leontief’s forward industrial linkage or Leontief’s backwardindustrial linkage. At the lowest level between a specific industry (producer) and a specificfinal product (consumer) and at the highest level (aggregating all countries and industries),there is no difference between these two measures. However, at the country and industry levels,these measures have very different economic explanations. Namely, the length of value-addedpropagation based on forward industrial linkage measures the distance from a specific indus-try to consumers; while the backward industrial linkage length measures the distance from aspecific final product to producers. Therefore, the former can be used to identify the position(upstreamness or downstreamness) of industries in value chains, while the latter can be usedto identify the level of complexity in the production processes of final products.
Another important contribution of the paper is that we provide various conceptual GVCsettings based on the measure of backward industrial linkage. This can help us separate a valuechain into pre-fabrication stages and post-fabrication stages, and at the same time identify thecountries or industries benefiting most at each stage in terms of their absolute value-added gain.By combining the measures of position and participation level for countries and industries in agiven conceptual GVC, the so-called smile curve can be mapped.
Using time-series data from the WIOD from 1995 to 2011, smile curves for various con-ceptual GVC are mapped and presented, including for Chinese and Mexican electrical productvalue chains and German and Japanese auto value chains. Most smile curves have been gettingmuch deeper and wider over time. This clearly reflects the deepening vertical specializationand the expanding cross-border fragmentation of production in the corresponding value chainsduring the data period. At the country level, Chinese manufacturing industries, especially theelectrical and optical equipment industry, with the lowest value-added rate enhanced their par-ticipation in the pre-fabrication stage of the Mexican electrical product value chain, as well asin both the Japanese and German auto value chains. In contrast, the US electrical and opticalequipment industry is still one of the main participants in the Chinese and Mexican electricalproduct value chain and the Japanese auto value chain, but these value chains seem to be ex-periencing a very rapid technology upgrades as a result of the US industry’s high value-addedrate.
The method of mapping smile curves proposed in the paper can be considered a touchstonefor better understanding of the position and value-added gain from participation in variousGVCs by countries and industries. The relevant indicators can provide a useful tool in analyzingthe determinants of a country’s role in GVCs as well as providing policy-oriented analysis ofhow to help countries be involved in, and make upgrades to, GVCs.
21

References[1] Antras, P., Chor, D., Fally, T., Hillberry, R. (2012). Measuring the Upstreamness of Pro-
duction and Trade Flows. NBER Working Paper, 17819.
[2] Arndt, S. (1997). Globalization and the Open Economy. The North American Journal ofEconomics and Finance 8(1): 71-79.
[3] Baldwin, R. (2011). Trade and Industrialisation after Globalisation’s 2nd Unbundling: HowBuilding and Joining a Supply Chain are Different and Why it Matters. NBER WorkingPapers, 17716.
[4] Baldwin, R., Ito, T., Sato, H. (2014). The Smile Curve: Evolving Sources of Value Addedin Manufacturing. Joint Research Program Series, IDE-JETRO.
[5] Campa, J. and Goldberg, L. (1997). The Evolving External Orientation of ManufacturingIndustries: Evidence from Four Countries. NBER Working Paper, 5919.
[6] Chen, Q. (2014). The Average Propagation Length: An Extended Analysis, Paper presentedin the 22nd International Input-Output Conference, Lisbon, 2014.
[7] Dedrick, J., Kraemer, K.L., Linden, G. (2010). Who Profits from Innovation in Global ValueChains?: A Study of the iPod and Notebook PCs. Industrial and Corporate Change, 19 (1):81-116.
[8] Dietzenbacher, E., Romero, I., Bosma, N.S. (2005). Using Average Propagation Lengths toIdentify Production Chains in the Andalusian Economy. Estudios de Economia Aplicada, 23:405-422.
[9] Dietzenbacher, E. and Romero, I. (2007). Production Chains in an Interregional Framework:Identification by Means of Average Propagation Lengths. International Regional Science Re-view, 30: 362-383.
[10] Escaith, H. and Inomata, S. (2013). Geometry of Global Value Chains in East Asia: TheRole of Industrial Networks and Trade Policies, in Elms, D. and Low. P. (eds), Global ValueChains in a Changing World, Fung Global Institute, Nanyang Technological University, andWorld Trade Organization.
[11] Feenstra, R. (1998). Integration of Trade and Disintegration of Production in the GlobalEconomy. Journal of Economic Perspectives,12(4): 31-50.
[12] Fally, T. (2011). On the Fragmentation of Production in the US. University of Colorado-Boulder.
[13] Fally, T. (2012). Production Staging: Measurement and Facts. University of Colorado-Boulder.
[14] Grossman, G. and Helpman, H. (2002a). Outsourcing in a Global Economy. NBER WorkingPaper, 8728.
22
[15] Grossman, G. and E. Helpman. (2002b). Integration versus Outsourcing in Industry Equi-librium. Quarterly Journal of Economics, 117: 85-120.
[16] Grossman, G.M. and Rossi-Hansberg, E. (2008). Trading Tasks: A Simple Theory ofOffshoring. The American Economic Review, 98(5): 1978-1997.
[17] Hanson, G., Mataloni, Jr. R. J., Slaughter, M. J. (2003). Vertical Production Networks inMultinational Firms. NBER Working Paper, 9723.
[18] Hummels, D., Ishii, J. Yi, K. (2001). The Nature and Growth of Vertical Specialization inWorld Trade. Journal of International Economics, 54:75–96.
[19] Inomata, S. (2008). A NewMeasurement for International Fragmentation of the ProductionProcess: An International Input-Output Approach. IDE Discussion Paper, 175.
[20] Jones, R. and Kierzkowski, H. (1990). The Role of Services in Production and InternationalTrade: A Theoretical Framework. in R. Jones and A. Krueger, eds., The Political Economyof International Trade, Basil Blackwell, Oxford.
[21] Johnson, R. and Noguera, G. (2012). Accounting for Intermediates: Production Sharingand Trade in Value-added, Journal of International Economics, 86(2):224-236.
[22] Kawakami, M. and Sturgeon, T.J. (2012). The Dynamics of Local Learning in Global ValueChains: Experiences from East Asia. IDE-JETRO Series, Palgrave Macmillan.
[23] Krugman, P., (1995). Growing World Trade: Causes and Consequences. Brookings Paperson Economic Activity.
[24] Koopman, R., Wang, Z., Wei, S.J. (2014). Tracing Value-added and Double Counting inGross Exports. American Economic Review, 104(2): 459-494.
[25] Kowalski, P. et al. (2015). Participation of Developing Countries in Global Value Chains:Implications for Trade and Trade-Related Policies. OECD Trade Policy Papers, 179.
[26] Leontief, W. (1936). Quantitative Input and Output Relations in the Economic System ofthe United States. The Review of Economic and Statistics, 18: 105-25.
[27] Linden, G., Dedrick, J., Kraemer, K.L. (2009). Innovation and Job Creation in a GlobalEconomy: The Case of Apple’s iPod. Working Paper, Personal Computing Industry Center,UC Irvine.
[28] Miller, R.E. and Temurshoev, U. (2013). Output Upstreamness and Input Downstreamnessof Industries/Countries in World Production. GGDC Working Papers, 133.
[29] Mudambi, R. (2008). Location, Control and Innovation in Knowledge-Intensive Industries.Journal of Economic Geography, 8(5), 699-725.
[30] OECD, WTO andWorld Back Group (2014). Global Value Chains: Challenges, Opportuni-ties, and Implications for Policy. Report prepared for submission to the G20 Trade MinistersMeeting.
23

[31] Pietrobelli, C. and Rabellotti, R. (2010). Global Value Chains Meet Innovation Systems:Are There Learning Opportunities for Developing Countries? IDB Working Paper Series,232.
[32] Shin, N., Kraemer, K.L., Dedrick, J. (2012). Value Capture in the Global ElectronicsIndustry: Empirical Evidence for the “Smiling Curve” Concept. Industry and Innovation,19(2), 89-107.
[33] Shih, S. (1996). Me-Too is Not My Style: Challenge Difficulties, Break through Bottlenecks,Create Values (Taipei: The Acer Foundation).
[34] Stehrer, R. (2012). Trade in Value Added and Value Added in Trade. WIIW WorkingPaper, 81.
[35] Timmer, M.P., Dietzenbacher, E., Los, B., Stehrer, R., de Vries,G.J. (2014b). The WorldInput-Output Database (WIOD): Contents, Concepts and Applications. GGDC ResearchMemorandum, 144. Groningen Growth and Development Centre.
[36] Timmer, M.P., Erumban, A.A., Los, B., Stehrer, R., De Vries, G.J., (2014a). Slicing upglobal value chains. Journal of Economic Perspectives, 28(2): 99-118.
[37] UNCTAD (2013). World Investment Report 2013: Global Value Chains: Investment andTrade for Development, United Nations Conference on Trade and Development, United Na-tions Publication ISBN 978-92-1-112868-0.
[38] Xing, Y., and Detert, H. (2010). How the iPhone Widens the United States Trade Deficitwith the People’s Republic of China. ADBI Working Paper, 257.
[39] Yeats, A. (2001). Just How Big is Global Production Sharing? in L. Cheng and H.Kierzkowski, eds., Globalization of Trade and Production in South-East Asia, New York:Kluwer Academic Press.
[40] Yi, K.M. (2003). Can Vertical Specialization Explain the Growth of World Trade? Journalof Political Economy, 111(1): 52-102.
24
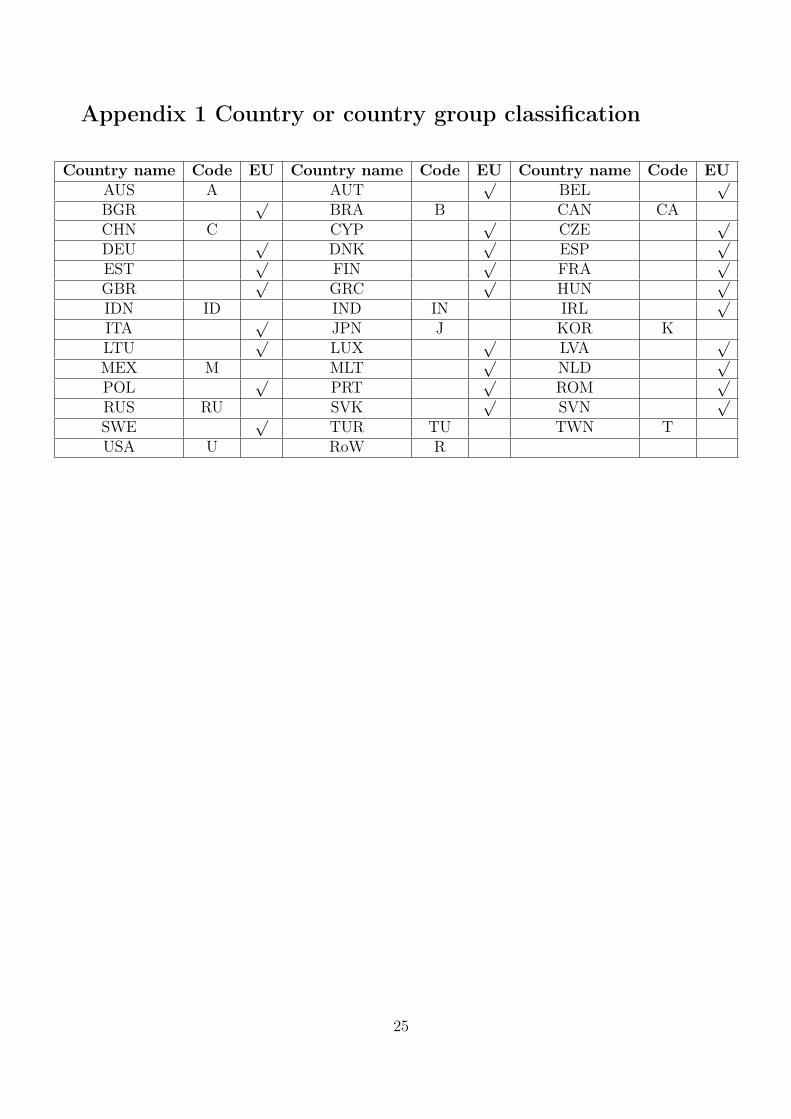
Appendix 1 Country or country group classification
Country name Code EU Country name Code EU Country name Code EUAUS A AUT
√BEL
√
BGR√
BRA B CAN CACHN C CYP
√CZE
√
DEU√
DNK√
ESP√
EST√
FIN√
FRA√
GBR√
GRC√
HUN√
IDN ID IND IN IRL√
ITA√
JPN J KOR KLTU
√LUX
√LVA
√
MEX M MLT√
NLD√
POL√
PRT√
ROM√
RUS RU SVK√
SVN√
SWE√
TUR TU TWN TUSA U RoW R
25
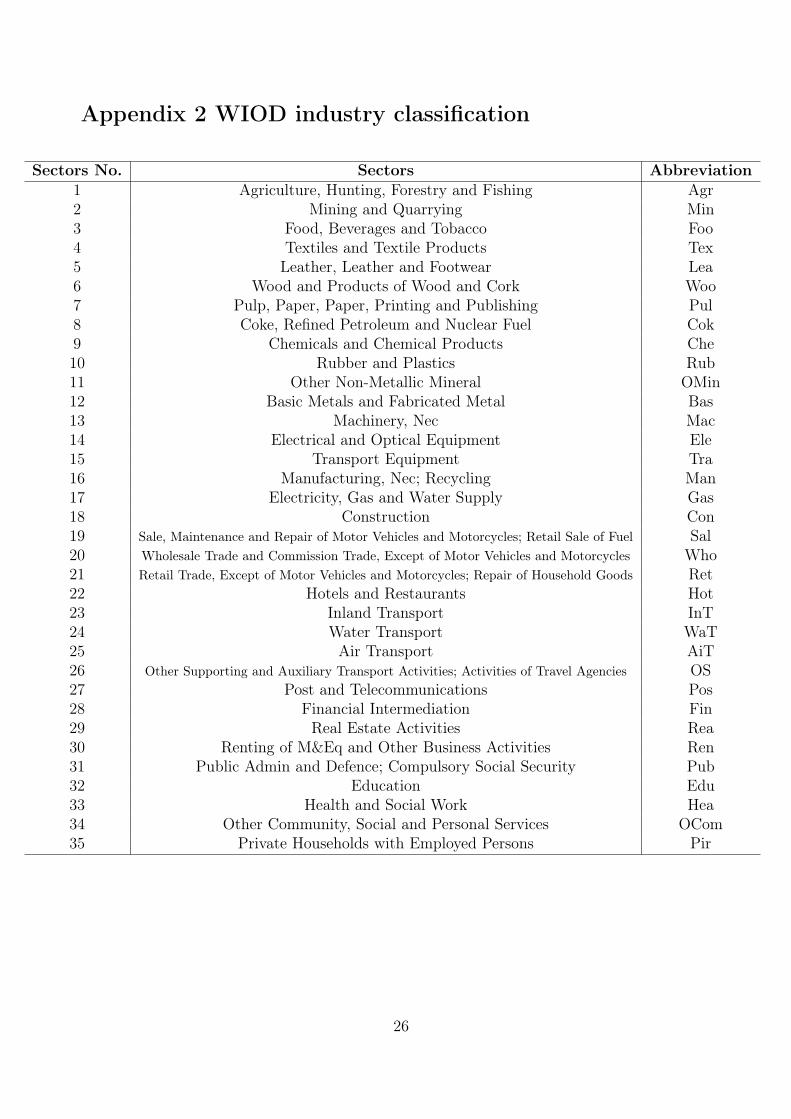
Appendix 2 WIOD industry classification
Sectors No. Sectors Abbreviation1 Agriculture, Hunting, Forestry and Fishing Agr2 Mining and Quarrying Min3 Food, Beverages and Tobacco Foo4 Textiles and Textile Products Tex5 Leather, Leather and Footwear Lea6 Wood and Products of Wood and Cork Woo7 Pulp, Paper, Paper, Printing and Publishing Pul8 Coke, Refined Petroleum and Nuclear Fuel Cok9 Chemicals and Chemical Products Che10 Rubber and Plastics Rub11 Other Non-Metallic Mineral OMin12 Basic Metals and Fabricated Metal Bas13 Machinery, Nec Mac14 Electrical and Optical Equipment Ele15 Transport Equipment Tra16 Manufacturing, Nec; Recycling Man17 Electricity, Gas and Water Supply Gas18 Construction Con19 Sale, Maintenance and Repair of Motor Vehicles and Motorcycles; Retail Sale of Fuel Sal20 Wholesale Trade and Commission Trade, Except of Motor Vehicles and Motorcycles Who21 Retail Trade, Except of Motor Vehicles and Motorcycles; Repair of Household Goods Ret22 Hotels and Restaurants Hot23 Inland Transport InT24 Water Transport WaT25 Air Transport AiT26 Other Supporting and Auxiliary Transport Activities; Activities of Travel Agencies OS27 Post and Telecommunications Pos28 Financial Intermediation Fin29 Real Estate Activities Rea30 Renting of M&Eq and Other Business Activities Ren31 Public Admin and Defence; Compulsory Social Security Pub32 Education Edu33 Health and Social Work Hea34 Other Community, Social and Personal Services OCom35 Private Households with Employed Persons Pir
26
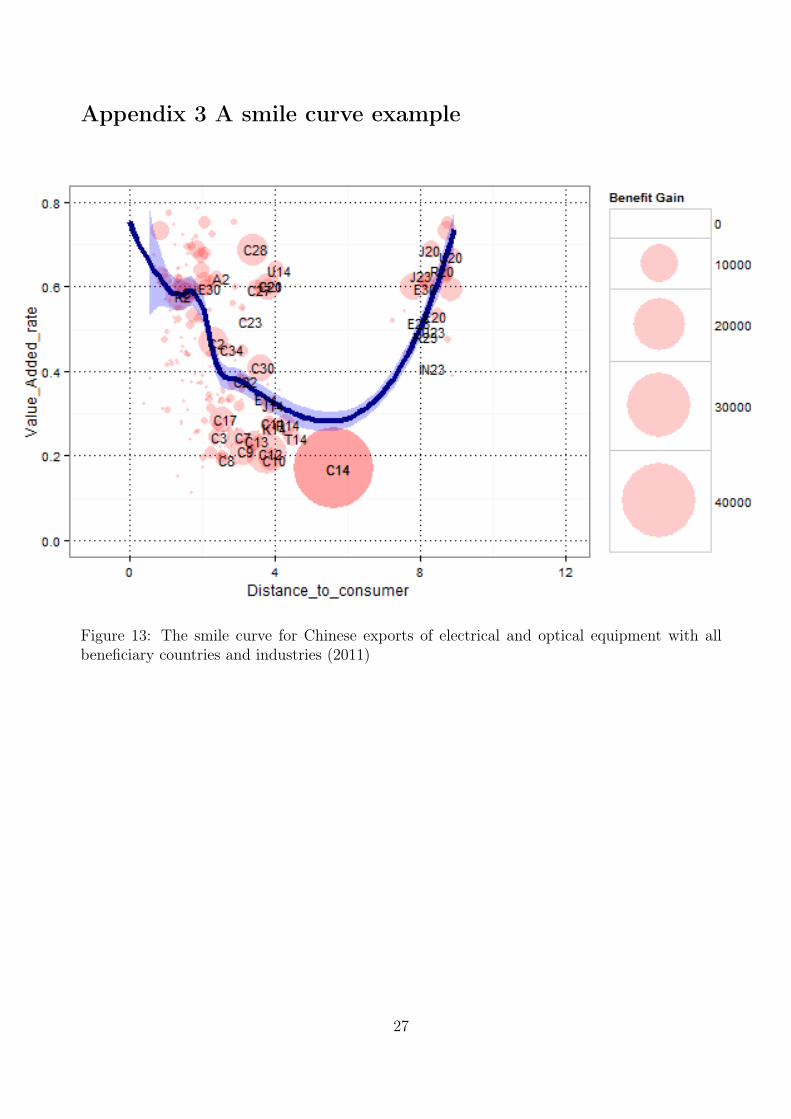
Appendix 3 A smile curve example
Figure 13: The smile curve for Chinese exports of electrical and optical equipment with allbeneficiary countries and industries (2011)
27
No. Author(s) Title
529
David BULLÓN, Tayutic MENA,
Bo MENG, Natalia SÁNCHEZ,
Henry VARGAS, Satoshi
Using the Input-Output Approach to Measure Participation in GVCs:
The Case of Costa Rica2015
528Hongsheng ZHANG, Bo MENG and
Shuzhong MA
Determinants of China’s Bilateral Trade Balance in Global Value
Chains2015
527Gianluca TARASCONI and
Byeongwoo KANGPATSTAT Revisited 2015
526
Tsunehiro OTSUKI, Keiichiro
HONDA, Etsuyo MICHIDA, Kaoru
NABESHIMA and Yasushi UEKI
Effects of RoHS and REACH regulations on firm-level production
and export, and the role of global value chains: The cases of Malaysia
and Vietnam
2015
525 Kazuhiko OYAMADABehavioral Characteristics of Applied General Equilibrium Models
with an Armington-Krugman-Melitz Encompassing Module2015
524 Marc VALERIState-Business Relations in the Smaller Gulf Monarchies: The Role of
Business Actors in the Decision-Making Process2015
522Abu S. Shonchoy and Mehnaz
RABBANI
The Bangladesh Gender Gap in Education: Biased Intra-household
Educational Expenditures2015
521Tomoki FUJII and Abu S.
SHONCHOY
Fertility and Rural Electrification in Bangladesh2015
520 Chie KASHIWABARAChanges in Source of Profits and Business Strategies?: Some
Evidence from the Philippines’ Universal Banks in the 2000s2015
519Yutaka ARIMOTO and Satomi
KUROSU
Land and labor reallocation in pre-modern Japan: A case of a
northeastern village in 1720–18702015
517Kazuhiko OYAMADA and Yoko
UCHIDA
Is FTA/EPA Effective for a Developing Country to Attract FDI?
Simulation Analysis Based on an Extended Knowledge-Capital Model2015
516Yoko UCHIDA and Kazuhiko
OYAMADATheory and Empirics of Markusen Type Multinationals 2015
515 Hikari ISHIDOEstablishing Global Value Chains through the Liberalization of Trade
in Services2015
514 Masaki MATSUOAuthoritarianism and Labor Market: Preference of Labor Policies in
the Arab Gulf Countries2015
513 Andrew M. GARDNERMigration, Labor and Business in the Worlding Cities of the Arabian
Peninsula2015
512Takayuki HIGASHIKATA
Koichi KAWAMURA
Voting Behavior in Indonesia from 1999 to 2014: Religious Cleavage
or Economic Performance?2015
511 Koji KUBOTransition from Black to Official Markets for Foreign Exchange in
Myanmar2015
510 Tadashi ITO On the Variety of Mexico’s Export Goods 2015
509
Byeongwoo KANG, Kaoru
NABESHIMA, and Fang-Ting
CHENG
Avoiding the middle income trap: Indigenous innovative effort vs
foreign innovative effort2015
508 Mami YAMAGUCHIThe Voices and Protests of China’s Labour NGOs
and Their Effort to Promote Migrant Worker Rights2015
507
Kaoru NABESHIMA, Etsuyo
MICHIDA, VU Hoang Nam, Aya
SUZUKI
Emergence of Asian GAPs and its relationship to Global G.A.P. 2015
506Mila KASHCHEEVA, Kaoru
NABESHIMAInnovation in Eastern Europe: A case study of Czech Republic 2015
~Previous IDE Discussion Papers ~
No. Author(s) Title
505
Yutaka Arimoto, Hisaki Kono,
Tsilavo Ralandison, Takeshi Sakurai,
Kazushi Takahashi
Understanding traders’ regional arbitrage: The case of rice traders in
Antananarivo, Madagascar2015
504
Takeshi Sakurai, Tsilavo Ralandison,
Kazushi Takahashi, Yutaka Arimoto,
Hisaki Kono
Is There Any Premium for Unobservable Quality? A Hedonic Price
Analysis of the Malagasy Rice Market2015
503
Tsilavo Ralandison, Yutaka Arimoto,
Hisaki Kono, Takeshi Sakurai,
Kazushi Takahashi
Rice flows across regions in Madagascar 2015
502Yuya Kudo, Abu Shonchoy, Kazushi
Takahashi
Impacts of Solar Lanterns in Geographically Challenged Locations:
Experimental Evidence from Bangladesh2015
501 Lei LEI A Closer Look at the Diffusion of ChinaGAP 2015
500
Kaoru NABSEHIMA, Tadashi ITO,
Kiyoyasu TANAKA, Mila
Kashcheeva, David BULLÓN,
Natalia SÁNCHEZ
The Source of Sustainable Growth in Costa Rica 2015
499
Satoru KUMAGAI, Yasushi UEKI,
David BULLÓN, and Natalia SÁ
NCHEZ
Industrial Agglomeration in Costa Rica: A Descriptive Analysis 2015
497Hakaru IGUCHI, Toshi H.
ARIMURA and Etsuyo MICHIDA
Adoption of ISO9001 through Supply Chain in Vietnam: Impacts of
FDI and Product-related Environmental Regulation2015
496Saumik PAUL, Abu SHONCHOY
and Andrew DABALEN
Food Crop Diversification as a Risk Mitigating Strategy During
Conflict: Evidence from Cote d’Ivoire2015
495Kiyoyasu TANAKA and Yoshihiro
HASHIGUCHIAgglomeration Effects of Informal Sector: Evidence from Cambodia 2015
494Kazunobu HAYAKAWA, Han-Sung
KIM, Taiyo YOSHIMI
FTA in International Finance: Impacts of Exchange Rates on FTA
Utilization2015
493Jiansuo PEI, Bo MENG, Fei WANG
and Jinjun XUE
Production Sharing, Demand Spillovers and CO2 Emissions: The
Case of Chinese Regions in Global Value Chains2015
492 Taeko Hoshino
Boundaries of Firms and Catching Up by Latecomers in Global
Production Networks: The Case of a Mexican Auto-Parts
Manufacturer
2015
491 Mila KASHCHEEVA, Kevin TSUIPolitical influence in commercial and financial oil trading: the
evidence from US firms2015
490Yuning GAO, Yunfeng ZHENG,
Angang HU, Bo MENG
Input–Output-Based Genuine Value Added and Genuine Productivity
in China's Industrial Sectors (1995-2010)2015
489 Ikuo KUROIWA Industrial Deepening in East Asia 2015
488 Kenmei TSUBOTAAgglomeration and directional imbalance of freight rates: The role of
density economies in the transport sector2015
487Lele ZOU, Jinjun XUE, Alan FOX,
Bo MENG, Tsubasa SHIBATA
The Emission Reduction Effect and Economic Impact of an Energy
Tax vs. a Carbon Tax in China: A Dynamic CGE Model Analysis2015
486Bo MENG, Glen PETERS and Zhi
WANGTracing CO2 Emissions in Global Value Chains 2015
485Songfeng CAI, Yaxiong ZHANG
and Bo MENG
Spillover Effects of TTIP on BRICS Economies: A Dynamic GVC-
Based CGE Model2015
484Saumik PAUL, Alice OUYANG and
Rachel Cho Suet LISkilled Emigration and Exchange Rate: Theory and Empirics 2014
483Kazushi Takahashi, Abu Shonchoy,
Seiro Ito, Takashi Kurosaki
How Does Contract Design Affect the Uptake of Microcredit among
the Ultra-poor? Experimental Evidence from the River Islands of
Northern Bangladesh
2014
482 Satoru KUMAGAI The Middle-income Trap from the Viewpoint of Trade Structures 2014

No. Author(s) Title
481 Haruka MATSUMOTOTaiwan Strait Crises and Chiang Kai-shek's Strategic Thinking: A
Perspective from the Taiwan's Archive2014
480
Kazushi Takahashi , Munenobu
Ikegami , Megan Sheahan ,
Christopher B. Barrett
Quasi-Experimental Evidence on the Drivers of Index-Based
Livestock Insurance Demand in Southern Ethiopia2014
479 Masayoshi OKABE
Gender-preferential Intergenerational Patterns in Primary Education
Attainment: A Quantitative Analysis of a Case of Rural Mindanao, the
Philippines
2014
478Tadashi ITO
Toshihiro OKUBOProduct Quality and Intra-Industry Trade 2014
477 Yuya KUDOReligion and Polygamy: Evidence from the Livingstonia Mission in
Malawi2014
476 Fang-Ting CHENGFrom Foot-Draggers to Strategic Counter-Partners: The Dynamics of
U.S. and Chinese Policies for Tackling Climate Change2014
475 Dossym SATPAYEV Corruption in Kazakhstan and the Quality of Governance 2014
474 Yasushi UEKI
Trade Obstacles, Inventory Level of Inputs, and Internationalization
of Enterprise Activities: A Comparison between Southeast Asia and
Latin America
2014
473 Koji KUBO Deposit Dollarization in Myanmar 2014
472Saumik PAUL, Vengadeshvaran
SARMA
Are Special Economic Zones a Curse on Those ‘Chosen’ to Be
Evicted? Evidence from West Bengal, India2014
471 Sanae SUZUKIChairship System and Decision Making by Consensus in International
Agreements: The Case of ASEAN2014
470 Byeongwoo KANGThe Innovation Process of a Privately-Owned Enterprise and a State-
Owned Enterprise in China2014
469 Koichiro KIMURA Competition between Firms in Developing and Developed Countries 2014
468 Chie KASHIWABARAThe Asset/Liability Structure of the Philippines Banks and Non-Bank Financial
Insitutions ini 2000s: A Preliminary Study for Financial Access Analyses2014
467 Akiko YANAIEnvironmental Provisions in Japanese Regional Trade Agreements
with Developing Countries2014
466Etsuyo MICHIDA, Kaoru
NABESHIMA and Yasushi UEKI
Impact of product-related environmental regulations in Asia:
Descriptive statistics from a survey of firms in Vietnam2014
465 Kazuhiko OYAMADA
Neutrality in the Choice of Number of Firms or Level of Fixed Costs
in Calibrating an Armington-Krugman-Melitz Encompassing Module
for Applied General Equilibrium Models
2014
463 Hitoshi SATO and Lianming ZHUTariff Reductions and Labor Demand Elasticities: Evidence from
Chinese Firm-level Data2014
462 Hitoshi SATODo Electricity Constraints Matter for Comparative Advantage?: A
Neoclassical Approach2014
461Abu SHONCHOY and P.N. (Raja)
JUNANKAR
The Informal Labour Market in India: Transitory or Permanent
Employment for Migrants?2014
460Abu SHONCHOY and Takashi
KUROSAKI
Impact of Seasonality-adjusted Flexible Microcredit on Repayment
and Food Consumption: Experimental Evidence from Rural
Bangladesh
2014
459 Mila KASHCHEEVA, Kevin TSUIThe Effects of International Politics on Oil-Exporting Developing
Countries2014
458 Mila KASHCHEEVA, Kevin TSUIWhy Oil Importers Diversify Their Import Souces Politically?
Evidence from U.S. Firm-Level Data2014
No. Author(s) Title
457Etsuyo MICHIDA, Yasushi UEKI
and Kaoru NABESHIMA
Impact of product-related environmental regulations in Asia:
Descriptive statistics from a survey of firms in Penang, Malaysia2014
456 Housam DARWISHEHTrajectories and Outcomes of the ‘Arab Spring’: Comparing Tunisia,
Egypt, Libya and Syria2014
455
Tsunehiro OTSUKI, Etsuyo
MICHIDA, Kaoru NABESHIMA
and Yasushi UEKI
Estimating the effect of chemical safety standards on firm
performance in Malaysia and Vietnam2014
454Toshi ARIMURA, Hakaru IGUCHI,
and Etsuyo MICHIDA
Product-related Environmental Regulation and Voluntary
Environmental Actions: Impacts of RoHS and REACH in Malaysia2014
453Etsuyo MICHIDA, Yasushi UEKI
and Kaoru NABESHIMA
Impact on Asian Firms of Product-related Environmental Regulations
through Global Supply Chains: A Study of Firms in Malaysia2014
452
Chen Sau Soon, Mohd Helme bin Mohd
Helan, Zanariah Ujang, Etsuyo Michida,
and Kaoru Nabeshima
Role of Laboratories for Adopting Product-related Environmental
Regulations (PRERs)2014
451 Etsuyo MICHIDAThe Policy Impact of Product-Related Environmental Regulations in
Asia2014
450Yutaka ARIMOTO and
Changmin LEE
Did Japanese Direct Investment in Korea Suppress Indigenous
Industrialization in the 1930s?
Evidence from County-level Factory Entry Patterns
2014
449 Ikuo KUROIWAValue Added Trade and Structure of High-technology Exports in
China2014
448 Arup MITRA and Yuko TSUJITADimensions and Determinants of Upward Mobility: A Study Based on
Longitudinal Data from Delhi Slums2014
447 Asao ANDO and Bo MENGSpatial Price Equilibrium and the Transport Sector: A Trade-
Consistent SCGE Model2014
446Kazunobu HAYAKAWA and
Fukunari KIMURA
How Do Free Trade Agreements Reduce Tariff Rates and Non-tariff
Barriers?2014
445
Kazunobu HAYAKAWA, Toshiyuki
MATSUURA, and Fumihiro
OKUBO
Firm-level Impacts of Natural Disasters on Production Networks:
Evidence from a Flood in Thailand2014
444Sasatra SUDSAWASD and Santi
CHAISRISAWATSUK
FDI Inflows and Outflows, Intellectual Property Rights, and
Productivity Growth2014
443 Pisit PUAPANAssessment of FDI Impact on Thailand's Production Sectors:
Implications for Investment Promotion Activities2014
442 Yasushi HAZAMAMinority Type Matters: Ethnic Diversity and Tolerance in 29
European Democracies2014
441Kiyoyasu TANAKA and Kenmei
TSUBOTA
Directional imbalance of freight rates: Evidence from Japanese inter-
prefectural data2014
440 Kumiko MAKINO The Anti-Apartheid Movement in Japan: An Overview 2014
439 Hikari ISHIDOPromoting Institutional Connectivity in the Asia Pacific Region: A
Study of Supply Chain and Trade in Services2014
438
Kazunobu HAYAKAWA
Nuttawut LAKSANAPANYAKUL
Kohei SHIINO
Some Practical Guidance for the Computation of Free Trade
Agreement Utilization Rates2013
437Kazunobu HAYAKAWA
Nuttawut LAKSANAPANYAKULNew Measures of FTA Liberalization Level 2013
436Kazunobu HAYAKAWA
Chih-Hai YANG
How Do Free Trade Agreements Change Import Prices?: Firm-level
Evidence from China’s Imports from ASEAN2013
435 Akiko YANAI Rethinking Special and Differential Treatment in the WTO 2013
No. Author(s) Title
434 Tadashi ITODid the least developed countries benefit from duty-free quota-free
access to the Japanese market?2013
433 Sato Kan HiroshiToward an Inclusive and a Little Bit Ethical World Trading System:
Listening to the Voices of the People in LDCs2013
432 Ke DINGPlatforms and Firm Capabilities: A Study of Emerging Global Value
Chains2013
431Shawn ARITA and Kiyoyasu
TANAKAFDI and Investment Barriers in Developing Economies 2013
430 Toshihiro KUDOMyanmar's Apparel Industry in the New International Environment:
Prospects and Challenges2013
429Kazunobu HAYAKAWA and
Nuttawut LAKSANAPANYAKULImpacts of Common Rules of Origin on FTA Utilization 2013
428
Kazunobu HAYAKAWA,
HanSung KIM, Nuttawut
LAKSANAPANYAKUL, and
FTA Utilization: Certificate of Origin Data versus Customs Data 2013
427Toshihiro KUDO, Satoru
KUMAGAI and So UMEZAKI
Five Growth Strategies for Myanmar: Re-engagement with the Global
Economy2013
426 Koji KUBOMyanmar’s Non-Resource Export Potential after the Lifting of
Economic Sanctions: A Gravity Model Analysis2013
425 Masayoshi OKABEWhere Does Philippine Education Go? The “K to 12” Program and
Reform of Philippine Basic Education2013
424Bo MENG, Zhi WANG and Robert
KOOPMAN
How Are Global Value Chains Fragmented and Extended in China’s
Domestic Production Networks?2013
423 Shinichi SHIGETOMIDevelopment and Institutionalization of Communitarian Thought in
Thailand2013
422 Takahiro FUKUNISHIPolitical Crisis and Suspension of Duty-free Access in Madagascar:
Assessment of Impacts on the Garment Industry2013
421Toshihiro KUDO, Satoru
KUMAGAI and Hikari ISHIDOAgriculture Plus Plus: Growth Strategy for Myanmar Agriculture 2013
420 Mai FUJITAThe Japanese and Chinese Models of Industrial Organisation:
Fighting for Supremacy in the Vietnamese Motorcycle Industry2013
419 Mai FUJITAExploring the Sources of China’s Challenge to Japan: Models of
Industrial Organisation in the Motorcycle Industry2013
418Romio MORI, Kaoru NABESHIMA
and Nanae YAMADA
Food Safety Control System of Chinese Eel Exports and its
Challenges2013
417Takashi NOMURA, Saori OKADA,
Takeshi YOSHIZAKIFeatures of IP Rights Enforcement in Korea and China 2013
416 Yasushi UEKISupply Chain Collaboration and Responsiveness: A Comparison
between Thai Automotive and Electronics Industries2013
415 Yasushi UEKIFormation of Supply Chain Collaboration and Firm Performance in
the Thai Automotive and Electronics Industries2013
414 Futaba ISHIZUKAInternational Labor Migration in Vietnam and the Impact of Receiving
Countries' Policies2013
413 Chie KASHIWABARAThe Central Bank and Bank Credits in the Philippines: A Survey on
Effectiveness of Monetary Policy and Its Measures2013
412Takahiro FUKUNISHI and
Tatsufumi YAMAGATA
Slow and Steady Wins the Race: How the Garment Industry Leads
Industrialization in Low-income Countries2013
411 Tsuruyo FUNATSUChanging Local Elite Selection in Thailand: Emergence of New Local
Government Presidents after Direct Elections and Their Capabilities2013

No. Author(s) Title
410 Hikari ISHIDO Harmonization of Trade in Services by APEC members 2013
409 Koichi KAWAMURAPresidentialism and Political Parties in Indonesia: Why Are All
Parties Not Presidentialized?2013
408 Emi KOJIN The Development of Private Farms in Vietnam 2013
407 Tadayoshi TERAOPolitical Economy of Low Sulfurization and Air Pollution Control
Policy in Japan: SOx Emission Reduction by Fuel Conversion2013
406 Miki HAMADA Impact of Foreign Capital Entry in the Indonesian Banking Sector 2013
405 Maki AOKI-OKABEResearch Review: Searching for a New Framework for Thailand’s
Foreign Policy in the Post-Cold War Era2013
404 Yuka KODAMA Relationship between Young Women and Parents in Rural Ethiopia 2013
403Yoshihiro HASHIGUCHI and
Kiyoyasu TANAKA
Agglomeration and firm-level productivity:
A Bayesian Spatial approach2013