From Internal Imbalances to Global Imbalances: A Survey on ...

Forecasting skill supply and demand in Europe 2013
Session 4:
Measuring potential skills imbalances
Ben Kriechel (Economix Research & Consulting)
Expert seminar on methodology and new ideas
3rd October 2013, Thessaloniki

Imbalance indicators
Imbalance indicators are useful in
skills forecasting to:
• summarize the degree of imbalances;
• compare across occupations and /or
education;
• compare across countries.
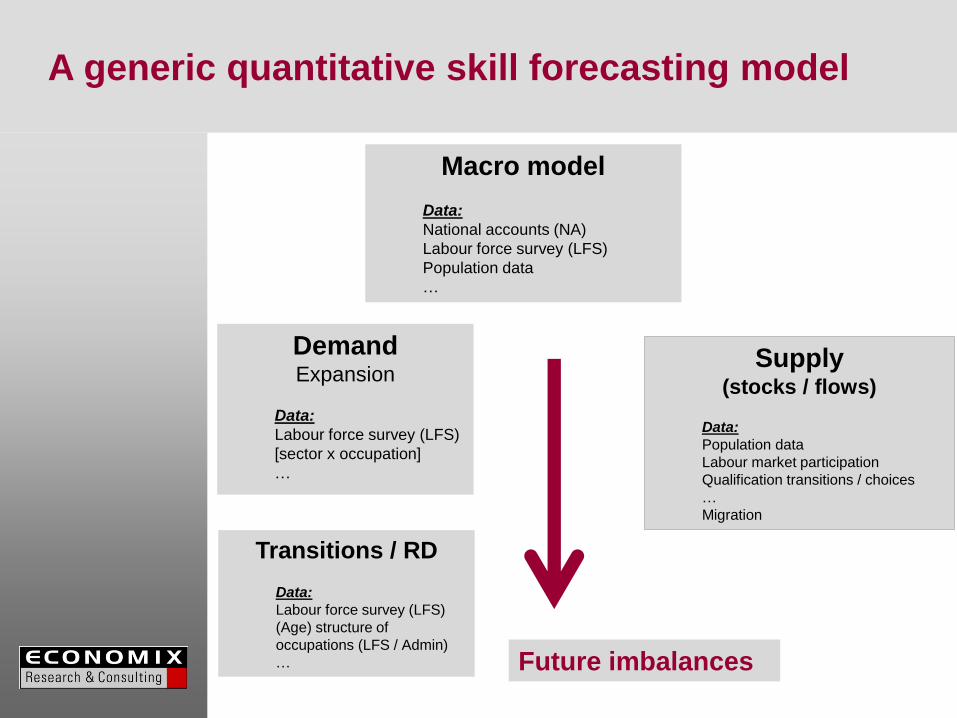
A generic quantitative skill forecasting model
Macro model
Data:
National accounts (NA)
Labour force survey (LFS)
Population data
…
Supply (stocks / flows)
Data:
Population data
Labour market participation
Qualification transitions / choices
…
Migration
Demand Expansion
Data:
Labour force survey (LFS)
[sector x occupation]
…
Transitions / RD Data:
Labour force survey (LFS)
(Age) structure of
occupations (LFS / Admin)
… Future imbalances

Supply – Demand EU33
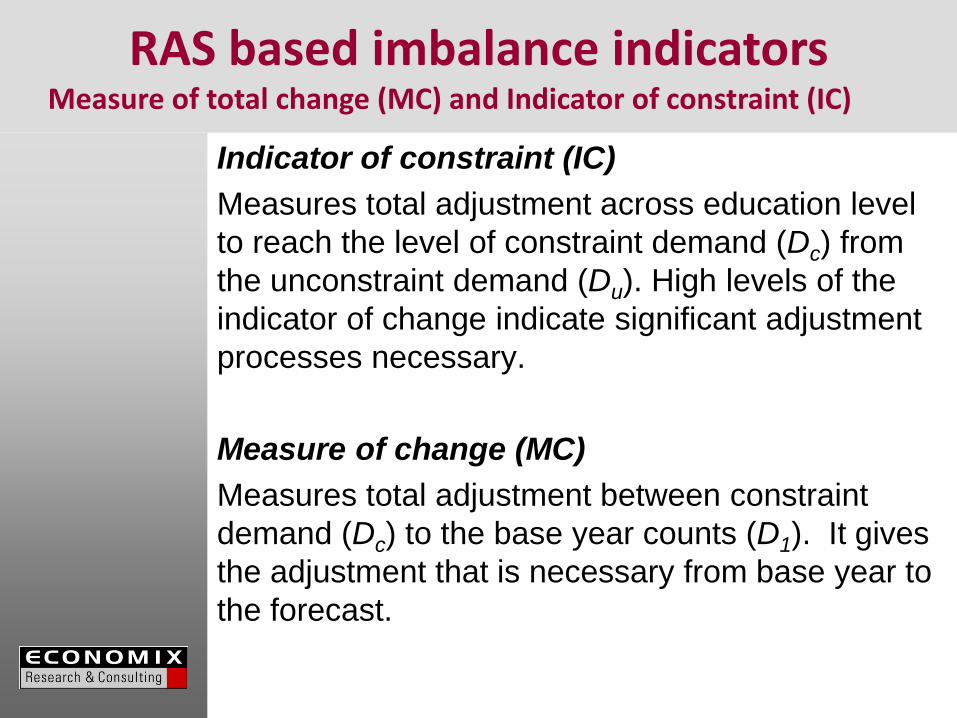
RAS based imbalance indicators Measure of total change (MC) and Indicator of constraint (IC)
Indicator of constraint (IC)
Measures total adjustment across education level
to reach the level of constraint demand (Dc) from
the unconstraint demand (Du). High levels of the
indicator of change indicate significant adjustment
processes necessary.
Measure of change (MC)
Measures total adjustment between constraint
demand (Dc) to the base year counts (D1). It gives
the adjustment that is necessary from base year to
the forecast.
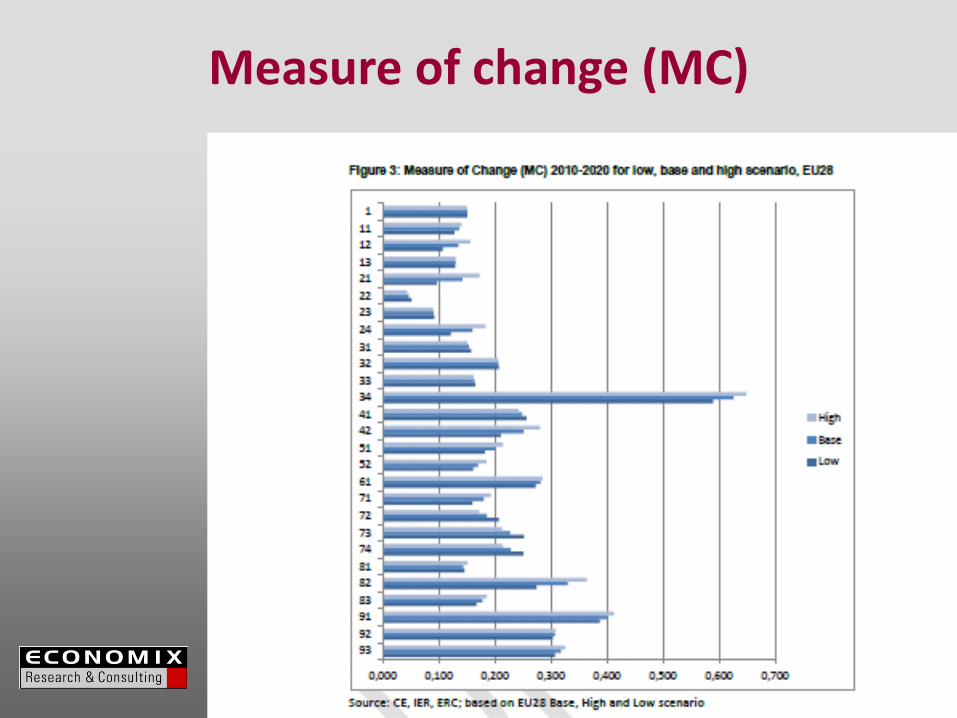
Measure of change (MC)

Measure of change (MC)
AT BE BG CY CZ
01. Armed forces 0,381 0,261 0,366 0,204 0,189
11. Chief executives, senior officials
and legislators 0,154 0,155 0,165 0,112 0,222
12. Administrative and commercial
managers 0,095 0,493 0,365 1,023 0,657
13,14. Managers in services 0,418 0,217 0,203 0,578 0,207
21. Science and engineering
professionals 0,678 0,106 0,178 0,162 0,018
22. Health professionals 0,107 0,064 0,110 0,120 0,132

Indicator of constraint (IC)

Indicator of constraint (IC)
DE IT LT NL
23. Teaching professionals 0,082 0,126 0,101 0,060
24,25,26. Business and other
professionals 0,092 0,122 0,261 0,080
31,35. Science and
engineering associate
professionals 0,092 0,102 0,417 0,118
32. Health associate
professionals 0,106 0,126 0,153 0,107
33. Business and
administration associate
professionals 0,091 0,119 0,562 0,134
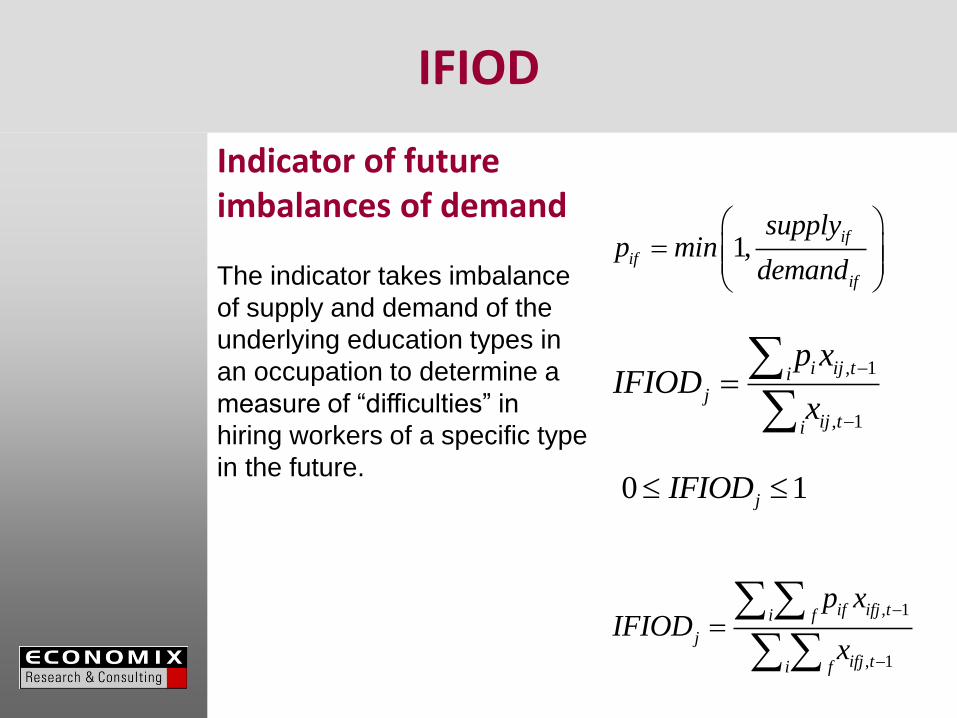
IFIOD
1,if
if
if
supplyp min
demand
, 1
, 1
if ifj ti f
j
ifj ti f
p xIFIOD
x
, 1
, 1
i ij tij
ij ti
p xIFIOD
x
0 1jIFIOD
Indicator of future imbalances of demand
The indicator takes imbalance
of supply and demand of the
underlying education types in
an occupation to determine a
measure of “difficulties” in
hiring workers of a specific type
in the future.

IFIOD for EU28

Extending IFIOD
Fields of Qualification
The indicator takes imbalance of supply and demand of the
underlying education types in an occupation to determine a
measure of “difficulties” in hiring workers of a specific type in
the future.
Relative wage position of occupation
The indicator takes imbalance of supply and demand of the
underlying education types in an occupation to determine a
measure of “difficulties” in hiring workers of a specific type in
the future.
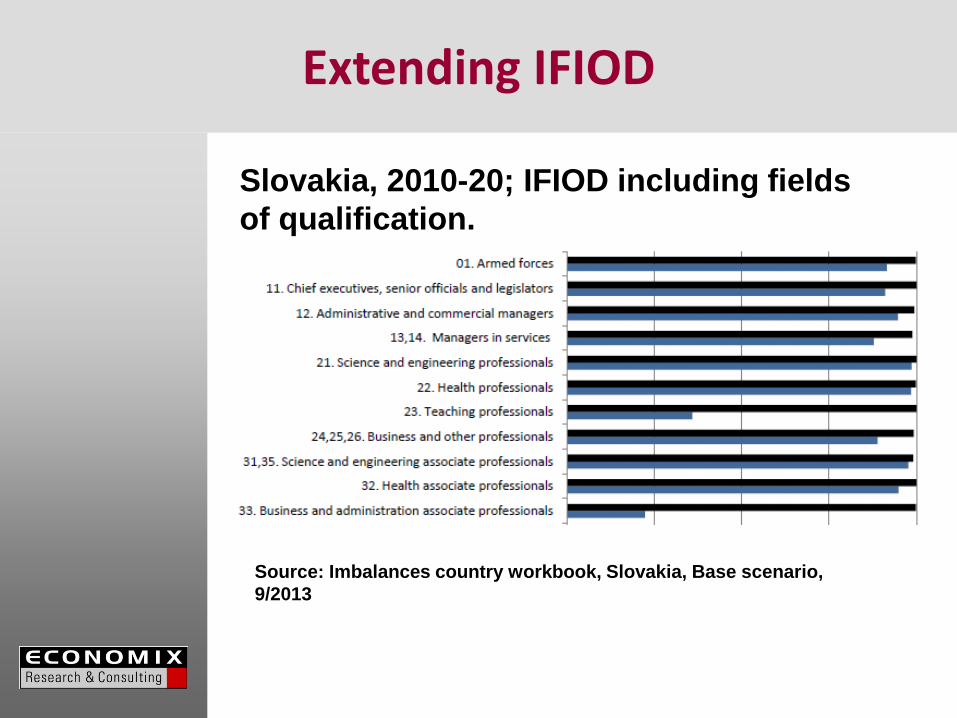
Extending IFIOD
Slovakia, 2010-20; IFIOD including fields
of qualification.
Source: Imbalances country workbook, Slovakia, Base scenario,
9/2013
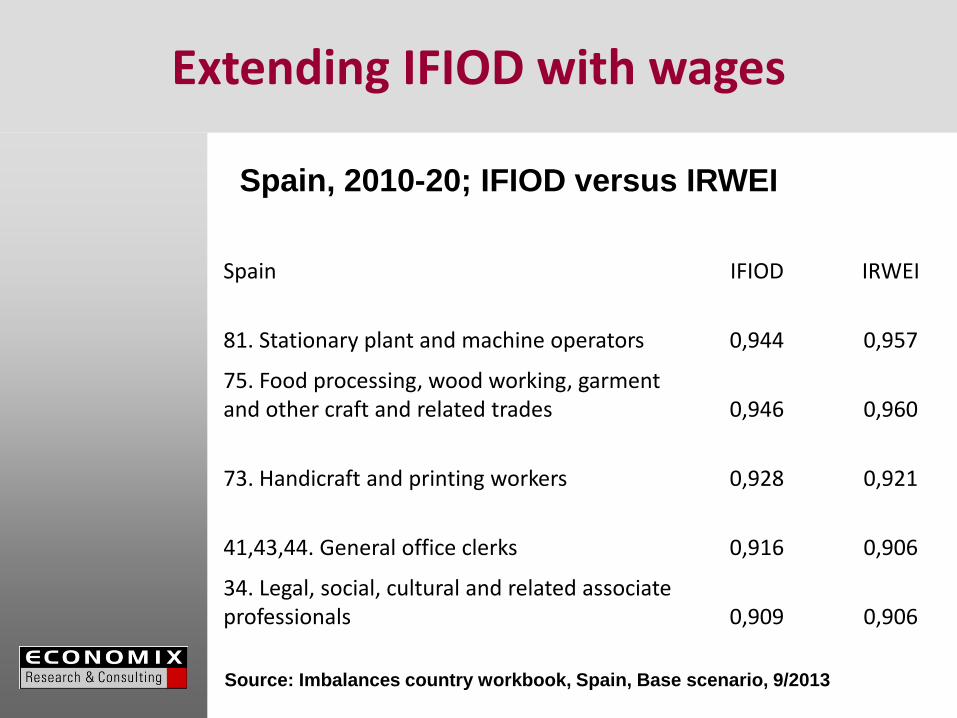
Extending IFIOD with wages
Spain, 2010-20; IFIOD versus IRWEI
Source: Imbalances country workbook, Spain, Base scenario, 9/2013
Spain IFIOD IRWEI
81. Stationary plant and machine operators 0,944 0,957
75. Food processing, wood working, garment and other craft and related trades 0,946 0,960
73. Handicraft and printing workers 0,928 0,921
41,43,44. General office clerks 0,916 0,906
34. Legal, social, cultural and related associate professionals 0,909 0,906
Taking stock
• Adjustment needed to solve imbalances by numbers;
• RAS procedure gives (implicit) weights to status quo in order to solve future imbalances;
• Indicator of future imabalances by occupation (IFIOD) ‘distributes’ shortages by skill (level) across occupations by the weight they use.

Taking stock II: Underlying processes
• Adjustments might not be feasible;
• Substitution processes can run across levels or within levels;
• Having sufficiently high educated might not solve a shortage in teachers, medical personnel, engineers.
• Combining fields and education level might overcome some of this.
• Including wage information makes the reallocation more realistic.
But:
• No consistent estimate of supply by fields

Conclusions
•Modeling imbalances should include as much information as possible and mimic the economic processes on the labour market.
•Indicators help in summarizing and comparing outcomes across various dimensions (occupation, country, etc.)
•Summarizing imbalances should include the important information that is needed for policy action;
• Fields of education can be a crucial information in measuring imbalances;
• Future work should include fields and extrapolate future field-related trends in recruitment and enrolment.
• Wage information can include information on imbalances and means to reallocate scarce qualifications.

Contact
Dr. Ben Kriechel
Economix Research & Consulting
Lindwurmstr. 9
D-80337 München
T 0049-89 875 790 27