Measuring Science Intensity of Industry using Linked ... · Measuring Science Intensity of Industry...
46
DP RIETI Discussion Paper Series 17-E-056 Measuring Science Intensity of Industry using Linked Dataset of Science, Technology and Industry IKEUCHI Kenta RIETI MOTOHASHI Kazuyuki RIETI TAMURA Ryuichi Hitotsubashi University TSUKADA Naotoshi RIETI The Research Institute of Economy, Trade and Industry http://www.rieti.go.jp/en/
Transcript of Measuring Science Intensity of Industry using Linked ... · Measuring Science Intensity of Industry...

DPRIETI Discussion Paper Series 17-E-056
Measuring Science Intensity of Industry using Linked Dataset of Science, Technology and Industry
IKEUCHI KentaRIETI
MOTOHASHI KazuyukiRIETI
TAMURA RyuichiHitotsubashi University
TSUKADA NaotoshiRIETI
The Research Institute of Economy, Trade and Industryhttp://www.rieti.go.jp/en/

RIETI Discussion Paper Series 17-E-056
March 2017
Measuring Science Intensity of Industry using Linked Dataset of Science, Technology and Industry*
IKEUCHI Kenta (RIETI and NISTEP) MOTOHASHI Kazuzuki (University of Tokyo, RIETI and NISTEP)
TAMURA Ryuichi (Hitotsubashi University and NISTEP) TSUKADA Naotoshi (NISTEP)
Abstract This paper presents new indicators measuring the science intensity of industry in Japan, linking a
scientific paper database (science), patent information (technology), and economic census data
(industry). The new indicators reflect the interaction between science and industry, via academic
patenting activities, which cannot be measured by an existing indicator of science linkage: non-
patent literature (NPL) citations by patents. As the academic sector gets more involved in patenting
activities, its scientific knowledge is being utilized by industries that are not categorized as science-
based. Additionally, it was revealed that scientific knowledge has been increasingly used for
industrial innovation over the last 10 years across all academic disciplines. Our study reiterates that
public support of science is essential for industrial innovation.
Keywords: Science intensity, Academic patents, Inventor disambiguation, Industrial innovation
JEL Code: O31, O33
RIETI Discussion Papers Series aims at widely disseminating research results in the form of professional
papers, thereby stimulating lively discussion. The views expressed in the papers are solely those of the
author(s), and neither represent those of the organization to which the author(s) belong(s) nor the Research
Institute of Economy, Trade and Industry.
* This study is conducted as a part of the “Empirical Studies on ‘Japanese-style’ Open Innovation” project undertaken at the Research Institute of Economy, Trade and Industry (RIETI), and the result of a joint research project of the National Institute of Science and Technology Policy (NISTEP) and RIETI. This study utilizes micro data from a questionnaire based on the “Establishment and Enterprise Census of Japan,” “Economic Census for Business Activity,” and “Economic Census for Business Frame” which are conducted by the Ministry of Internal Affairs and Communications (MIC). The authors are grateful for helpful comments and suggestions by Discussion Paper seminar participants at RIETI and NISTEP.

1
1. Introduction
A scientific foundation has become increasingly integral to the industrial innovation process. For example, genome science has substantially changed the research and development (R&D) process of the pharmaceutical industry. Miniaturization of the large-scale integrated circuit (LSI) fabrication process requires an understanding of the nano-level physicality of its materials. Furthermore, advancements in information technology have a significant impact on society and the economy; in particular, “big data” analysis contributes to the scientific understanding of business and management activities. Since science sectors, such as universities and public research institutes (PRIs), are heavily subsidized by public money, there is a growing interest in measuring the scientific aspects of industrial innovation and performance to understand the economic impact of public R&D, despite severe constraints on public spending in general.
Traditionally, the degree of scientific basis, or science intensity of industry has been measured using non-patent literature (research papers) citations made by patents (Narin and Noma, 1985; Schmoch, 1997). This indicator captures the extent to which patents (technology for industrial use) are based on the scientific content of research papers. It is observed that science linkage varies in the technology area; science intensity is particularly high in the biotechnology field (Looy et al., 2003). Alternatively, the science-technology linkage can be captured using patent-publication pairs, i.e., overlapping content regarding the research output/invention between patents and research papers. This requires the simultaneous disclosure of research results in both patents and research papers (Lissoni et al., 2013), or text-mining techniques to identify the degree of content overlap between these two kinds of literature (Magerman et al., 2015). This information can provide an exact match between science and technology; however, limited availability of samples makes it unsuitable for aggregated indicators of science-technology linkage at the macro level.
Both these indicators reflect only one aspect of science linkages, that is, non-patent literature (NPL) citations shows the degree of disembodied scientific knowledge that flows into patents, while the patent-publication pair indicates co-occurrence of scientific and invention activities within the same research. In this paper, we proposed new indicators, based on a novel dataset combining science, technology, and industry. More specifically, we linked the data of research papers (Scopus by Elsevier) and patent data (Institute of Intellectual Property (IIP) patent database) at the author/inventor level to see how academic discipline and technology are interlinked at the individual (academic)
2
researcher level. This dataset provides the linkage between science and technology embodied in human capital (academic inventors). Both industry citations to the patents invented by academic inventors and the joint patent inventions between firms and such academic inventors reflect new channels of scientific knowledge flow from academia to industry, compared to those measured by conventional indicators such as NPL citations in patents. Unlike past studies regarding paper-patent linkage at the researcher level for particular technologies, such as biotechnology (Murray, 2002) and nanotechnology (Meyer, 2006), this study covers all technological fields by constructing a large-scale database.
Furthermore, the concordance between technology (patents) and industry classification has been created by linking patent database (IIP patent data) and Japanese economic census data at the firm level. Consequently, we developed concordance tables comprising academic field (science), patent (technology), and industrial performance (industry) to investigate how the scientification of industry and economy has progressed over time, while existing indicators, such as NPL citations in patents and the publication-patent pair, only show linkages between science and technology.
The remainder of this paper is structured as follows. Section 2 explains the methodology of linking three datasets - Scopus data for scientific publications, the IIP patent database for patents, and the economic census for industrial activities at the firm level. Section 3 presents the conceptual framework for analyzing the scientification of industry, and explains the methodology of our new indicators. Section 4 presents the trend of the scientification of industry over the last 10 years based on the new indicators. Finally, Section 5 presents a summary of new findings and some policy implications.
2. Dataset Construction Methodology
2-1. Author/Inventor level linkage of Scopus and the IIP Patent database
In this subsection, the major task is disambiguation of academic inventors from the patent database. We use the IIP Patent database, which contains all patent application information from the Japan Patent Office (JPO) (Goto and Motohashi, 1997). In the patent database, the name and address of inventors are available. However, there is no information to identify whether the same inventor has multiple patents. The name of inventor is strong information, but we need to disambiguate the different persons with the same name.

3
We apply Li et al.’s (2014) methodology for disambiguation of inventors in USPTO (United States Patent and Trademark Office) patents. Their methodology is originally based on the Authority disambiguation approach developed by Torvik et al. (2005), and Torvik and Smalheiser (2009). We disambiguate all Japanese inventors of patents applied for between 1995 and 2013, derived from the IIP patent database. We exclude non-Japanese inventors, whose names do not contain Chinese characters (Kanji), and/or whose address is outside Japan. A total of 12.4 million inventor-patent records are obtained for analysis, which contain 1.2 million unique combinations of the inventor’s name and address, and applicant’s name.
The methodology consists of four steps. (1) Blocking: Inventor-patent records are divided into several subsets according to inventors’ names, and similarity is computed between pairs of records within each block. (2) Training sets: We construct matched and unmatched training sets for pairs of matched and unmatched inventors’ full names defined as “rare.” Using a telephone directory, for the period 2000-2012, we define a list of “rare” names that appear only once or do not appear at all in the telephone directory. (3) Ratio: We define a “similarity profile (vector),” 𝐱𝐱 = (𝑥𝑥1 ⋯ 𝑥𝑥𝑛𝑛), which represents the degree of similarity in inventor and patent attributes between two inventor-patent records, for all inventor-patent record pairs within blocks. For inventor attributes, inventor’s name and address are used. For patent attributes, applicant’s name and ID, the main technology class at the four-digit level of the International Patent Classification (IPC), and the list of co-inventors’ names are used. Applicant names and IDs are both normalized using the National Institute of Science and Technology Policy (NISTEP) Dictionary of Corporate Names, and the NISTEP Dictionary of Names of Universities and Public Organizations, both developed by the National Institute of Science and Technology Policy and publicly available from its website2. The inventor address attribute is also normalized and divided into prefecture (to-do-hu-ken), city (shi-ku-cho-son), district (chi-mei), and street (ban-chi and go) using a commercial geocoding software provided by Kokusai Kogyo Co., Ltd., Address-normalizing converter and geocoding tool. We then calculate the likelihood “ratio” for each similarity profile from the training set as the ratio of times that a similarity profile appeared in the match set compared to the non-match set. (4) Pairwise matches: the (posterior) probability of a match between inventor-patent records based on Bayes theorem using the similarity profile and corresponding likelihood ratios. Following Li et al. (2014), we set the prior probability as the inverse of the number of pairs in the block.
2 http://www.nistep.go.jp

4
The minimum threshold for the probability matching pair is set to 0.5. Further detailed explanation regarding the data and method used for patent-inventor disambiguation are described in Appendix 1.
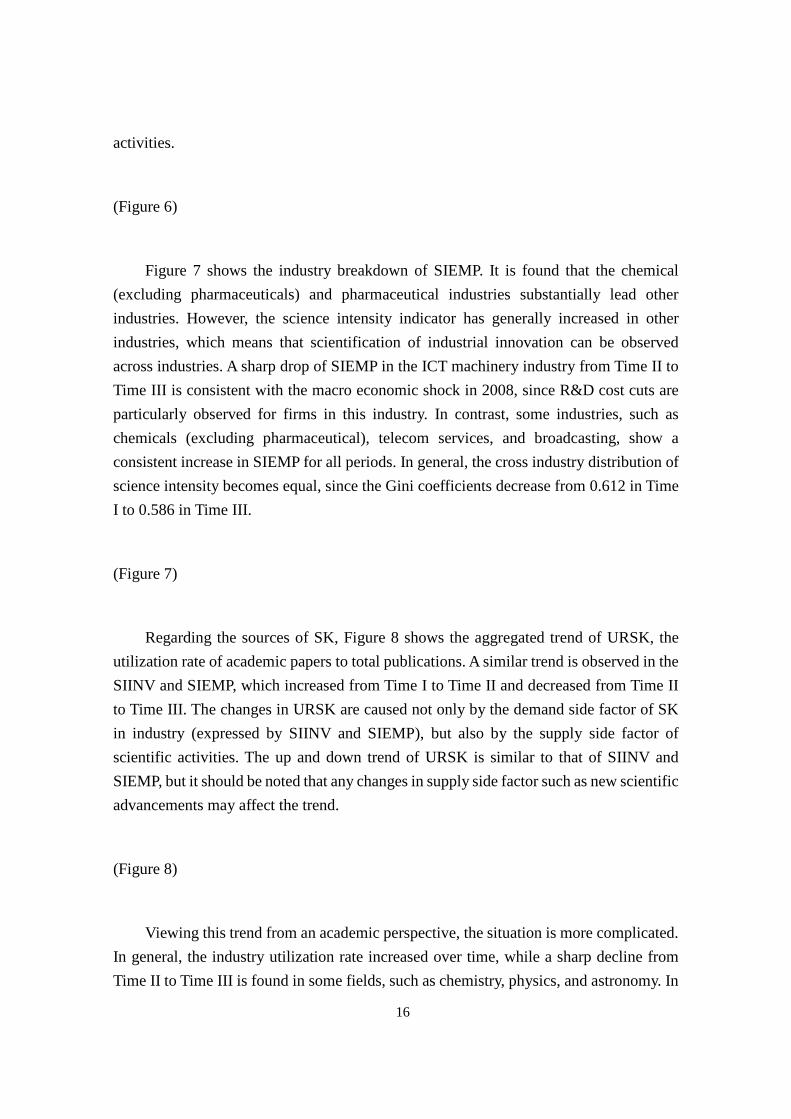
Table 1 presents the results of inventor disambiguation and its estimation accuracy. We identified 1.71 million inventors from 12.4 million inventor-patent records, which means that the average number of patents per inventor is 7.1. Next, we check the precision of our inventor disambiguation results with the KAKEN Database of Grants-in-Aid for Scientific Research developed by the National Institute of Informatics. In the KAKEN database, all receivers of public research funds from the Japan Society for the Promotion of Science (JSPS) are registered and a reliable identifier for each researcher is available. For the twelve thousand inventor-patent instances of six thousand inventors extracted from the KAKEN database, we calculate the splitting and lumping error of our disambiguation results following Li et al. (2014). The results show that a splitting error of 2.41% and lumping error of 0.29%. These values indicate that our results are better than Li et al.’s (2014) which has a splitting error of 3.26% and lumping error of 2.34%.
(Table 1)
From the inventor disambiguation results, we extract 62,983 inventors as academia.3 Next, we match these academic inventors with the authors of scientific papers. From the list of scientific papers, derived from the Elsevier Scopus database, we use the papers written by authors whose country of affiliation is Japan. Although the inventor/author’s name and the affiliation are matched, both inventor and applicant names are recorded in Japanese in the IIP patent database but are recorded in English in the Scopus database. The IIP patent database, however, can be easily mapped with the PATSTAT Database (Worldwide Patent Statistical Database) of the European Patent Office (EPO). Hence, we replace the original inventor name recorded in Japanese with the information of its corresponding record in the PATSTAT. For affiliation information, we use the NISTEP Dictionary of Names of Universities and Public Organizations, and its converter for the
3 The affiliates of inventors are identified by their address information. For example, if an inventor has the same address as the applicant address for the same patent, the inventor is supposedly working for the applicant’s organization. If this is not the case, inventors in a single applicant patent are assigned to the applicant organization. Finally, we conduct text mining for the inventor’s address to identify his/her affiliation (or individual) with other inventors. Here, academic inventors include those working for universities and public research organizations.

5
Scopus database. Among the more than 9.7 million author-affiliation-paper instances in the Scopus database, we could successfully map the affiliation identifier, developed by NISTEP, for 5.3 million Japanese instances. As a result, 30,432 inventors (48.3%) among the 62,983 academic inventors are successfully matched with the authors in the Scopus database based on inventor/author name and applicant/affiliation identifier. However, since the Scopus author ID and the disambiguated inventors do not completely match each other, we combine the inventor/author IDs iteratively until they are uniquely matched. Finally, almost 2,000 inventor IDs are integrated with each other and we obtain 28,433 matched inventors/authors.
Figure 1 illustrates the number of inventors and academic authors in Japan during the period from 2008 to 2011 based on the matching results. 563 thousand inventors and 382 thousand authors who published a paper in an academic journal were included in the Scopus database. Among the patent inventors, 30.5 thousand inventors are affiliated to academic institutions and 15.6 thousand inventors published at least one paper in Scopus journals.4 In other words, there are 14.9 thousand inventors without any publications in the Scopus database. It is unusual that academic researchers have patents, but no published papers, so we suspect that a substantial number of them have scientific publications, not listed in Scopus, such as research papers in the Japanese language.
(Figure 1)
Table 2 shows the time trend of the information presented in Figure 1. The proportion of academia among inventors increased from 3.2% in the period 2000-2003 to 5.4% in the period 2008-2011. The proportion of academic authors with patent inventions also
4 We could match 37,718 authors in the Scopus database with 30,732 patent inventors. We found a splitting error in the matching results. Several authors are matched to a same inventor or one author is matched with several inventors. Therefore, we merge the authors’ identification numbers and the disambiguated inventors until such splitting errors disappeared. As the result, we finally identify 28,443 unique authors/inventors. Assuming the splitting error, we correct the number of authors identified by Author IDs in Scopus and the number of inventors identified by our disambiguation procedure. The correction rate for the number of authors is 0.754 (= 28,443/37,718), and for the number of inventors is 0.926 (= 28,443/30,732). According to the author identification numbers from Scopus, the number of authors active in the periods 2000 to 2003, 2004 to 2007 and 2008 to 2011 with Japanese affiliations in the Scopus database are 419,086, 472,004, and 506,116, respectively. Multiplying the correction rate 0.754 with those numbers, the corrected numbers of unique authors is 316,031, 355,936, and 381,660, respectively. Similarly, the number of active inventors in the periods 2000 to 2003, 2004 to 2007, and 2008 to 2011 is 721,054, 667,474, and 602,180, respectively. Multiplying the correction rate 0.926 with those numbers, the corrected numbers are 667,348, 617,759, and 557,328, respectively.

6
increased from 3.0% in 2000-2003 to 4.1% in 2008-2011. Furthermore, the proportion of academic authors to total inventors doubled from 1.4% to 2.8% during the 12-year period.
(Table 2)
2-2. Firm level linkage of the IIP patent database and Economic Census
We aim to link patent information from the IIP Patent Database with establishment census data at the firm level. To this end, we develop a methodology that makes a one-to-one link between patent applicants and organizations in the census data based on establishments’ names and addresses. Firm level linkage is then identified as the linkage to any type of organization defined in the census except for incorporated administrative agencies, unincorporated associations, and other miscellaneous incorporated entities. As in Section 2-1, we focus on non-individual patent applications in which both applicant and inventor addresses are in Japan. The number of the applications from 1964 to 2013 is 10,253,009, and the total number of applicants during this period is 11,038,633. As for the establishment census, the following five datasets are used: the Establishment and Enterprise Census published in 2001, 2004, and 2006, and the Economic Census of Japan published in 2009 and 2012. We link the application data with each of these census datasets. This approach allows us to find the linkage with an applicant organization that existed when either one of the census surveys was conducted. Table 3 shows the total number of establishments in each census dataset and the breakdown by establishment type defined as follows: (1) the head office of a firm with multiple establishments (Headquarter) (2) a branch of a firm with multiple establishments (Branch), and (3) a single unit establishment (Single Est.).
(Table 3)
Since we focus on patent applications by non-individual Japanese applicants, patents are applied from any one of these establishments in Japan. Considering that patent applications are usually managed by an entire organization rather than an individual establishment, we link applicants to the establishments that are the headquarters. To do this, we use a unique organization identifier assigned to all establishments the

7
organization owns. Thus, our methodology links applicant information with the headquarter of a multi-establishment firm, or a single-establishment firm.
In implementing the linking methodology outlined above, we employ name and address information that are available in both the applicant records of IIP patent database and the establishment records of a census. Several issues arise when using these pieces of information. First, the names and addresses of applicants may contain spelling errors, and their format may differ between the applicant and establishment records. To solve for the issue of the same entities being deemed as different due to these notational variations (false negative problem), we develop a series of text processing programs to convert the raw name/address data to its standardized representation. Second, both applicant and establishment addresses undergo changes due to the consolidation of local administrative units such as municipalities. To cope with address changes of this kind, we use the commercial software from Kokusai Kogyo to convert the original addresses to the latest address format (as of 2014). Lastly, while an applicant address is written in a single line, an establishment address in a census is recorded as a collection of five geographical components (prefecture, city or wards, district, street, and any others that follow such as a building name or a room number). To make these different address formats comparable, we develop a text-scanning program to break the single line of an applicant address into these five parts. We then define a list of prefectural names, city (ward) names, district names, and street names to be the standardized representation of address against which the applicant and establishment addresses are compared. The methodology uses these standardized names and addresses to establish a one-to-one link from an applicant to an establishment in operation as of the application date. The implementation consists of the following three steps.
For each patent application, the first step begins by identifying from each census dataset a sample of organizations and their establishments that are in operation as of the patent application date. This requires detailed information about the opening and closing dates of an establishment under the ownership of the organization, which is not available to us. Instead, we observe the first and last census survey years during which the establishment is recorded. Given that that these dates are censored, we define an active period of an establishment as a period spanning from the census year preceding the one in which it is first recorded, to the census year succeeding the one in which it is last recorded5. In each survey, we sample organizations that have at least one establishment
5 Establishments in the 2001 census are assumed as active from the beginning of the application period

8
whose active period includes the patent application date. In the second step, establishments whose names exactly match with, or include, the applicant name are collected to form a set of “candidate” establishments. In the third step, the address of each candidate establishment is matched with the applicant’s address by their components (prefecture, city or ward, district, and street). The extent of overlaps between the four components yields the (geographical) “match level” for each establishment, which indicates geographical accuracy between the addresses of the establishment and the applicant. The procedure links the applicant to the establishment having the finest match level. Next, we look at the organizational identifier of the establishment, and relink it to the headquarter establishment having the same organizational identifier, if it is a branch. The procedure is completed by linking the applicant with an organization that owns the establishment.
For each patent applicant, we apply this procedure to five census datasets, and obtain five match levels. The applicant is successfully matched with an organization if a single headquarter establishment of the organization is linked in the second step. Otherwise, the procedure fails to create a match. These failures can occur in the following three cases. (1) In the first step, the candidate establishment set is empty. (2) In the second step, the largest geographical part of the establishment addresses (prefecture) does not match that of the applicant address. (3) In the third step, multiple organizations have been found at the finest match level and thus a single result cannot be identified.
The results from the linking procedure for patent applications between 1964 and 2013 are shown in Table 4. The detailed results for all organizations, including the breakdown by the match levels, are given in Table A2 in Appendix 2. In any census dataset, the linking procedure finds that about 1.4 % of all organizations and 1.5 % of all firms applied for patents. The rate of applicants uniquely linked to organizations in the census data (“Matching Rate”) is highest for the 2001 census data, and decreases for subsequent census datasets. Since we use only establishments that are in operation around a patent application date, the decreasing pattern may reflect that the procedure tends to fail for applications distant from the census survey year.
(Table 4)
(1964), and those in the 2012 census are assumed as active until the end of the application period (2013).
9
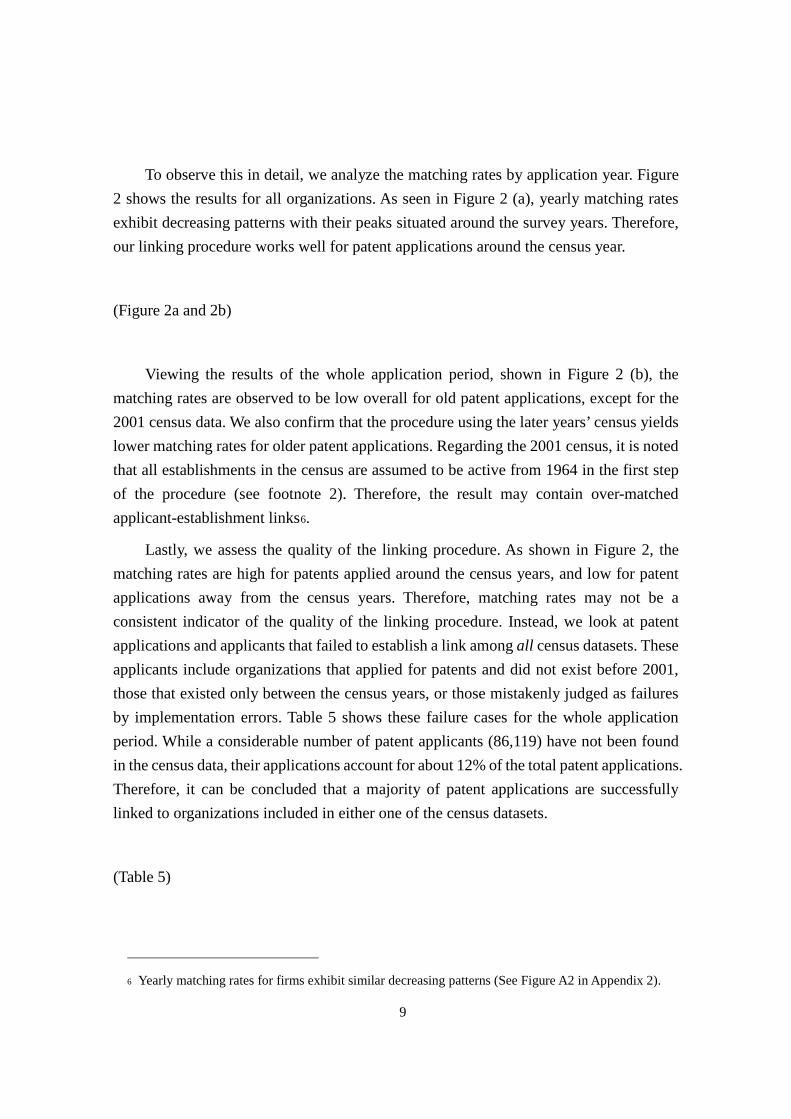
To observe this in detail, we analyze the matching rates by application year. Figure 2 shows the results for all organizations. As seen in Figure 2 (a), yearly matching rates exhibit decreasing patterns with their peaks situated around the survey years. Therefore, our linking procedure works well for patent applications around the census year.
(Figure 2a and 2b)
Viewing the results of the whole application period, shown in Figure 2 (b), the matching rates are observed to be low overall for old patent applications, except for the 2001 census data. We also confirm that the procedure using the later years’ census yields lower matching rates for older patent applications. Regarding the 2001 census, it is noted that all establishments in the census are assumed to be active from 1964 in the first step of the procedure (see footnote 2). Therefore, the result may contain over-matched applicant-establishment links6.
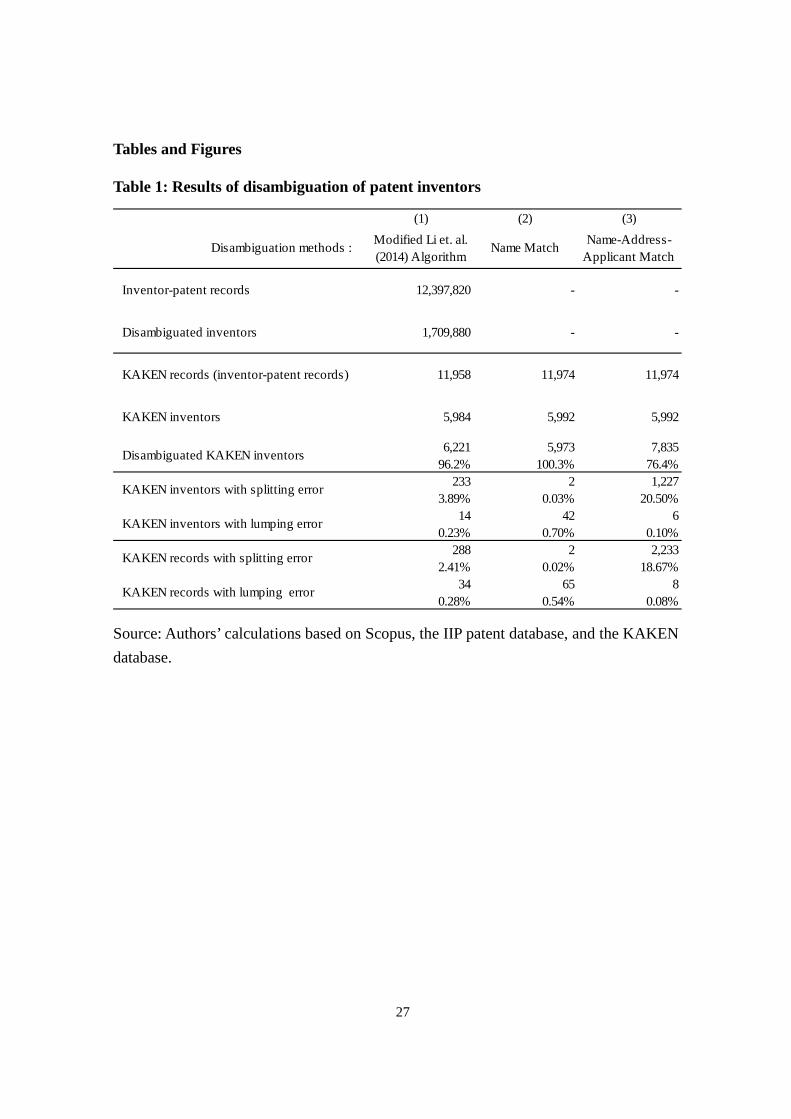
Lastly, we assess the quality of the linking procedure. As shown in Figure 2, the matching rates are high for patents applied around the census years, and low for patent applications away from the census years. Therefore, matching rates may not be a consistent indicator of the quality of the linking procedure. Instead, we look at patent applications and applicants that failed to establish a link among all census datasets. These applicants include organizations that applied for patents and did not exist before 2001, those that existed only between the census years, or those mistakenly judged as failures by implementation errors. Table 5 shows these failure cases for the whole application period. While a considerable number of patent applicants (86,119) have not been found in the census data, their applications account for about 12% of the total patent applications. Therefore, it can be concluded that a majority of patent applications are successfully linked to organizations included in either one of the census datasets.
(Table 5)
6 Yearly matching rates for firms exhibit similar decreasing patterns (See Figure A2 in Appendix 2).
10
3. New Indicators of Science and Industry Linkage
3-1. Framework of indicators
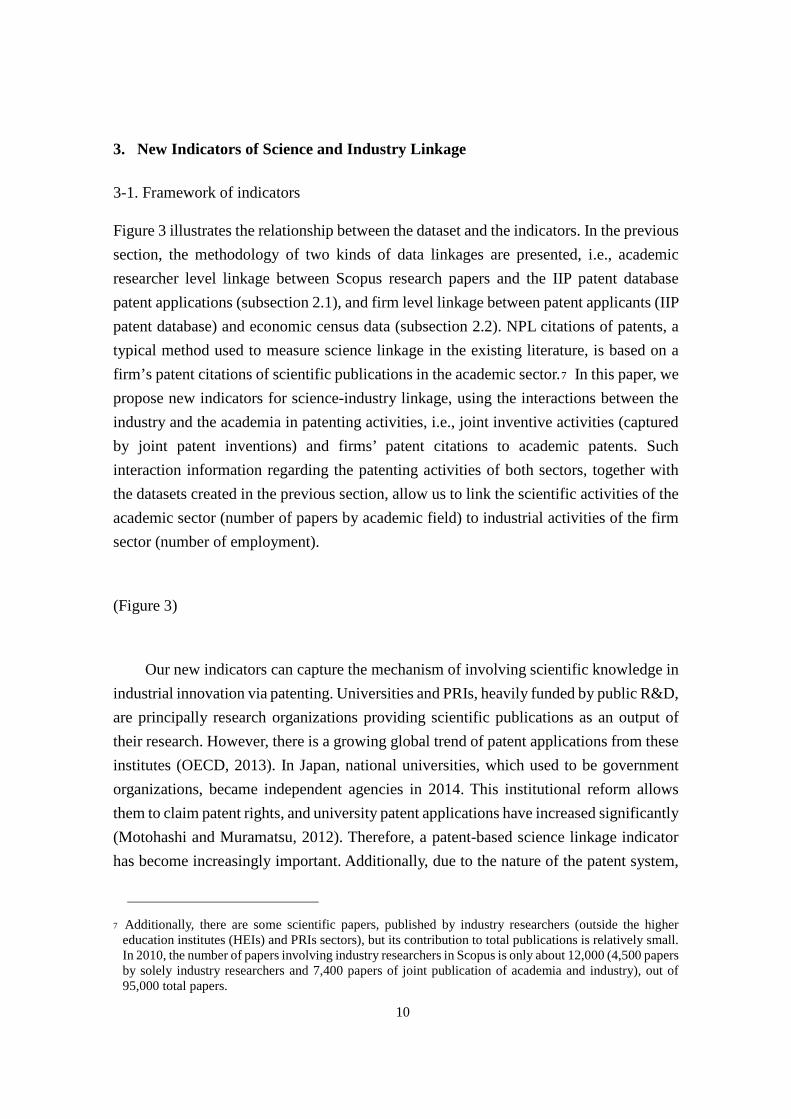
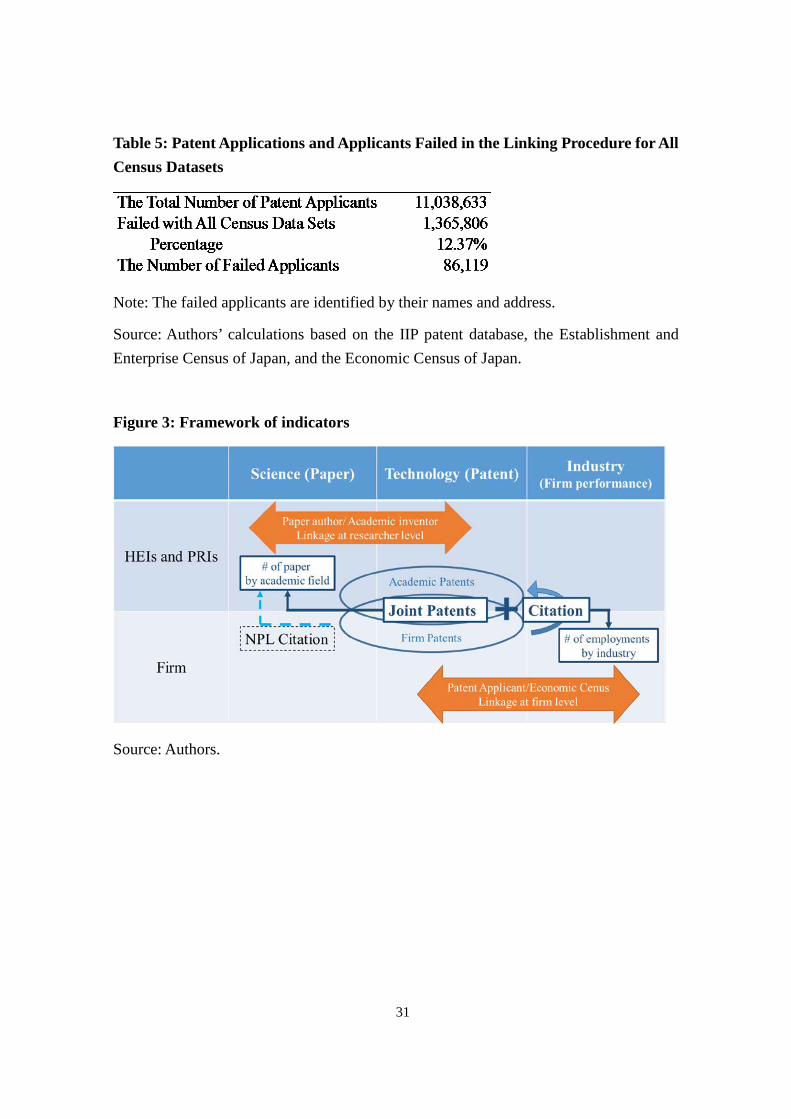
Figure 3 illustrates the relationship between the dataset and the indicators. In the previous section, the methodology of two kinds of data linkages are presented, i.e., academic researcher level linkage between Scopus research papers and the IIP patent database patent applications (subsection 2.1), and firm level linkage between patent applicants (IIP patent database) and economic census data (subsection 2.2). NPL citations of patents, a typical method used to measure science linkage in the existing literature, is based on a firm’s patent citations of scientific publications in the academic sector.7 In this paper, we propose new indicators for science-industry linkage, using the interactions between the industry and the academia in patenting activities, i.e., joint inventive activities (captured by joint patent inventions) and firms’ patent citations to academic patents. Such interaction information regarding the patenting activities of both sectors, together with the datasets created in the previous section, allow us to link the scientific activities of the academic sector (number of papers by academic field) to industrial activities of the firm sector (number of employment).
(Figure 3)
Our new indicators can capture the mechanism of involving scientific knowledge in industrial innovation via patenting. Universities and PRIs, heavily funded by public R&D, are principally research organizations providing scientific publications as an output of their research. However, there is a growing global trend of patent applications from these institutes (OECD, 2013). In Japan, national universities, which used to be government organizations, became independent agencies in 2014. This institutional reform allows them to claim patent rights, and university patent applications have increased significantly (Motohashi and Muramatsu, 2012). Therefore, a patent-based science linkage indicator has become increasingly important. Additionally, due to the nature of the patent system,
7 Additionally, there are some scientific papers, published by industry researchers (outside the higher
education institutes (HEIs) and PRIs sectors), but its contribution to total publications is relatively small. In 2010, the number of papers involving industry researchers in Scopus is only about 12,000 (4,500 papers by solely industry researchers and 7,400 papers of joint publication of academia and industry), out of 95,000 total papers.

11
patent citation information is more reliable than NPL citations. NPL includes not only scientific papers, but also non-scientific materials such as technical documents, while patent information reflects a uniform set of technological contents, based on formal institutions under the patent law. Therefore, our new indicator will provide reliable information on science linkage indicators compared to NPL, although it cannot completely substitute NPL due to the differences in their concepts.
3-2. Implementation
As mentioned above, we propose new indicators for science-industry linkage, based on the information on firms’ joint patent inventions with academia, and on firms’ patent citations to academic patents. These two channels of linkage between science and industry are not measured by the existing indicator, NPL citations of industry patents. Similar to the indicators based on NPL citations, our indicators are also measured by the number of scientific publications utilized by firms, i.e., the number of publications by academic inventors with whom the firm jointly developed a patent and/or whose patent the firm cites in its patent.
We divided the whole observation period (2000-2011) into three sub-periods, 2000-2003, 2004-2007, and 2008-2011. Next, we assume that all patents invented by an academic researcher within a particular sub-period are related to scientific papers published within the same period. This approach is different from previous studies that find equivalent patents and papers by analyzing their contents in detail (Lissoni et. al, 2012; Magerman et al., 2015). Our goal is to develop indicators of science intensity for all industries, based on large-scale datasets, so that the effort of analyzing the contents of patents and papers individually is not feasible. Additionally, since the scientific exploration of academics has broad scope, it would be reasonable to assume that the contents of patents and papers by the same researcher are related to some degree.
Next, the linkage between academic researchers and firms is measured based on academic patents, either jointly applied with a firm or cited by a firm’s patent within the same sub-period. We do not consider citations beyond the sub-period to ensure the same citation window across sub-periods.8 Therefore, it should be noted that our indicator reflects only the recent interactions between science and industry, while NPL indicators consider all citations of scientific papers.
8 We could use a longer citation window, but the data is limited, since SCOPUS information is available only from 1995, and is not reliable before 2000.

12
Suppose that 𝑖𝑖 is an industry; 𝑠𝑠 is a science field; 𝑡𝑡 is a technology class; 𝑓𝑓 ∈𝐹𝐹𝑖𝑖(𝑑𝑑) is a firm active in an industry 𝑖𝑖 in period 𝑑𝑑; 𝑗𝑗 ∈ 𝑉𝑉𝑓𝑓(𝑑𝑑) is an industrial inventor affiliated to firm 𝑓𝑓 in period 𝑑𝑑 ; 𝑟𝑟 is an academic researcher active in period 𝑑𝑑 ;
𝑝𝑝𝑗𝑗,𝑟𝑟Joint(𝑑𝑑) is the number of patents jointly invented by inventor 𝑗𝑗 and researcher 𝑟𝑟 in
period 𝑑𝑑; 𝑝𝑝𝑗𝑗,𝑟𝑟Cite(𝑑𝑑) is the number of patents invented by the academic researcher 𝑟𝑟 in
period 𝑑𝑑 cited in patents invented by inventor 𝑗𝑗 in period 𝑑𝑑 ; and 𝑛𝑛𝑟𝑟,𝑠𝑠(𝑑𝑑) is the number of academic publications of researcher 𝑟𝑟 in a science field 𝑠𝑠 in period 𝑑𝑑.
First, we define the amount of new scientific knowledge (SK) utilized by inventors in firms through joint inventions with academia (Joint) and/or academic patent citations (Cite). Using our dataset, linking patent inventors and authors of scientific publications makes it possible to identify scientific publications of academic patent inventors. We measure SK utilized by inventors in firms based on the number of academic publications (𝑛𝑛) made by their joint inventors or inventors of patents they cite. Specifically, we define the amount of new SK in the science field 𝑠𝑠 created by academic researchers utilized by
industrial inventor 𝑗𝑗 via (1) only joint inventions with academic inventors (SK𝑗𝑗,𝑠𝑠JointOnly);
(2) only patent citation to patents developed by academic inventors (SK𝑗𝑗,𝑠𝑠CiteOnly); and (3)
both joint invention and patent citation (SK𝑗𝑗,𝑠𝑠JointCite) as:
SK𝑗𝑗,𝑠𝑠JointOnly(𝑑𝑑) = � I�𝑝𝑝𝑗𝑗,𝑟𝑟
Joint(𝑑𝑑) > 0� × I�𝑝𝑝𝑗𝑗,𝑟𝑟Cite(𝑑𝑑) = 0� × 𝑛𝑛𝑟𝑟,𝑠𝑠(𝑑𝑑)
𝑟𝑟∈𝑅𝑅
SK𝑗𝑗,𝑠𝑠CiteOnly(𝑑𝑑) = � I�𝑝𝑝𝑗𝑗,𝑟𝑟
Joint(𝑑𝑑) = 0� × I�𝑝𝑝𝑗𝑗,𝑟𝑟Cite(𝑑𝑑) > 0� × 𝑛𝑛𝑟𝑟,𝑠𝑠(𝑑𝑑)
𝑟𝑟∈𝑅𝑅
SK𝑗𝑗,𝑠𝑠JointCite(𝑑𝑑) = � I�𝑝𝑝𝑗𝑗,𝑟𝑟
Joint(𝑑𝑑) > 0� × I�𝑝𝑝𝑗𝑗,𝑟𝑟Cite(𝑑𝑑) > 0� × 𝑛𝑛𝑟𝑟,𝑠𝑠(𝑑𝑑)
𝑟𝑟∈𝑅𝑅
where:
𝑅𝑅 : Set of all academic inventors (including academic inventors unmatched with authors in Scopus).
𝑛𝑛𝑟𝑟,𝑠𝑠 (d): Number of academic publications of researchers 𝑟𝑟 in science field s in period 𝑑𝑑.
𝑝𝑝𝑗𝑗,𝑟𝑟Joint(𝑑𝑑) : Number of patents jointly invented by inventor 𝑗𝑗 and researcher 𝑟𝑟 in

13
period 𝑑𝑑. 𝑝𝑝𝑗𝑗,𝑟𝑟
Cite(𝑑𝑑) : Number of patents invented by academic inventor 𝑟𝑟 in period 𝑑𝑑 and cited by patents invented by industrial inventor 𝑗𝑗 in period 𝑑𝑑.
Since we could not match all academic inventors to authors in the Scopus database, the number of academic publications by unmatched academic inventors is unknown. Therefore, we impute 𝑛𝑛𝑟𝑟,𝑠𝑠(𝑑𝑑) for academic inventors unmatched with Scopus based on the relationship between patents and publications of academic inventors matched with Scopus database. Denoting 𝑅𝑅𝑀𝑀 and 𝑅𝑅𝑈𝑈 as the set of researchers matched and unmatched with the Scopus database respectively, we estimate the number of academic publications by unmatched researcher 𝑟𝑟′ ∈ 𝑅𝑅𝑈𝑈 in science field 𝑠𝑠 published in period 𝑑𝑑, by,
𝑛𝑛�𝑟𝑟′,𝑠𝑠(𝑑𝑑) = �𝑝𝑝𝑟𝑟′,𝑡𝑡All (𝑑𝑑) × 𝑛𝑛�𝑡𝑡,𝑠𝑠(𝑑𝑑)
𝑡𝑡∈𝑇𝑇
, 𝑟𝑟′ ∈ 𝑅𝑅𝑈𝑈
where 𝑝𝑝𝑟𝑟′,𝑡𝑡All (𝑑𝑑) is the number of patents invented by academic researcher 𝑟𝑟′ in period
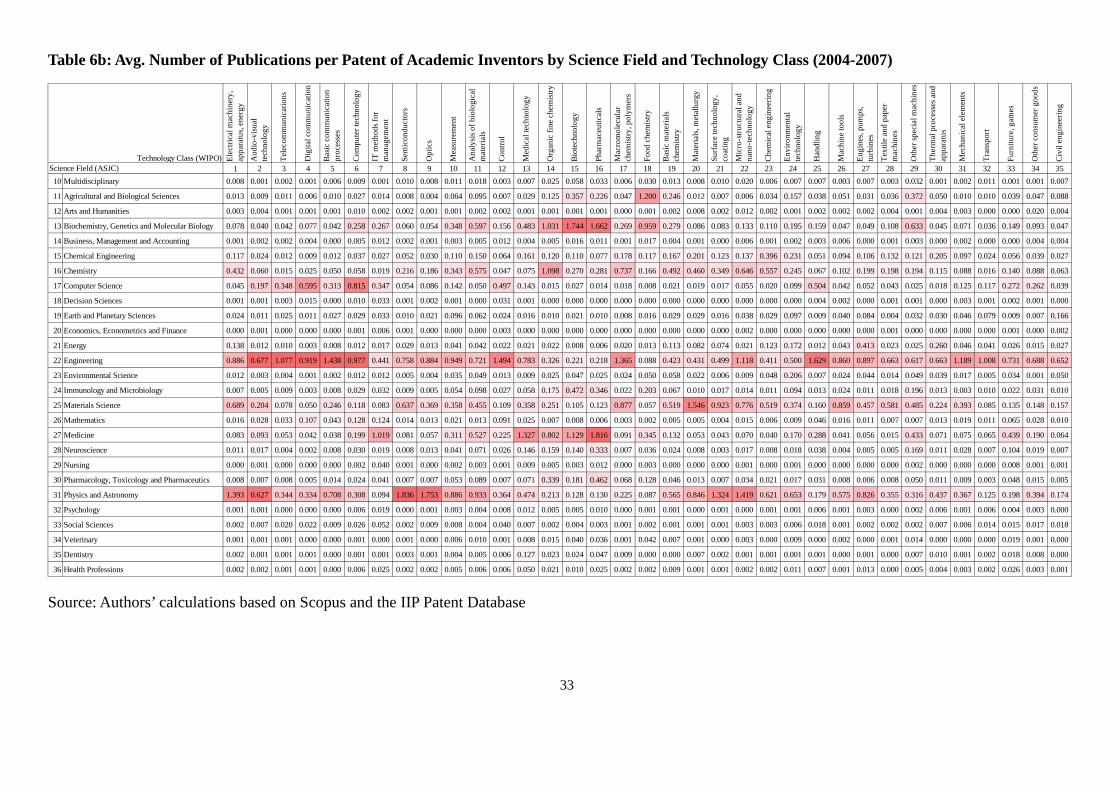
𝑡𝑡 and 𝑛𝑛�𝑡𝑡,𝑠𝑠(𝑑𝑑) represents the average number of academic publications in science field 𝑠𝑠 published in period 𝑑𝑑 per patent of technology class 𝑡𝑡 invented in period 𝑑𝑑 which is defined by:
𝑛𝑛�𝑡𝑡,𝑠𝑠(𝑑𝑑) =∑ 𝑛𝑛𝑟𝑟,𝑠𝑠(𝑑𝑑) ×
𝑝𝑝𝑟𝑟,𝑡𝑡All(𝑑𝑑)𝑝𝑝𝑟𝑟All(𝑑𝑑)𝑟𝑟∈𝑅𝑅𝑀𝑀
∑ 𝑝𝑝𝑟𝑟,𝑡𝑡All(𝑑𝑑)𝑟𝑟∈𝑅𝑅𝑀𝑀
Tables 6a to 6c show the estimated value of 𝑛𝑛�𝑡𝑡,𝑠𝑠(𝑑𝑑).
(Table 6a, 6b and 6c)
Next, we define the industry-level scientific intensity as the total SK in science field 𝑠𝑠 utilized by industrial inventors affiliated to firms in industry 𝑖𝑖 divided by the number of inventors (𝐼𝐼𝐼𝐼𝑉𝑉𝑖𝑖(𝑑𝑑)) or the number of employees (𝐸𝐸𝐸𝐸𝑃𝑃𝑖𝑖(𝑑𝑑)) in the industry:
SIINV𝑖𝑖𝑋𝑋(𝑑𝑑) =∑ ∑ �SK𝑗𝑗,𝑠𝑠
𝑋𝑋 (𝑑𝑑)�𝑗𝑗∈𝑉𝑉𝑓𝑓(𝑑𝑑)𝑓𝑓∈𝐹𝐹𝑖𝑖(𝑑𝑑)
𝐼𝐼𝐼𝐼𝑉𝑉𝑖𝑖(𝑑𝑑) for 𝑋𝑋 = JointOnly, JointCite, CiteOnly.

14
SIEMP𝑖𝑖𝑋𝑋(𝑑𝑑) =∑ ∑ �SK𝑗𝑗,𝑠𝑠
𝑋𝑋 (𝑑𝑑)�𝑗𝑗∈𝑉𝑉𝑓𝑓(𝑑𝑑)𝑓𝑓∈𝐹𝐹𝑖𝑖(𝑑𝑑)
𝐸𝐸𝐸𝐸𝑃𝑃𝑖𝑖(𝑑𝑑) = SIINV𝑖𝑖𝑋𝑋(𝑑𝑑) ×𝐼𝐼𝐼𝐼𝑉𝑉𝑖𝑖(𝑑𝑑)𝐸𝐸𝐸𝐸𝑃𝑃𝑖𝑖(𝑑𝑑)
for 𝑋𝑋 = JointOnly, JointCite, CiteOnly.
where 𝐼𝐼𝐼𝐼𝑉𝑉𝑖𝑖(𝑑𝑑) is the number of inventors affiliated to firms in industry 𝑖𝑖 and 𝐸𝐸𝐸𝐸𝑃𝑃𝑖𝑖(𝑑𝑑) is the total number of employees affiliated to firms in industry 𝑖𝑖.
Finally, we define an indicator from the viewpoint of science as the amount of utilized scientific knowledge (USK) in science field 𝑠𝑠 of academic researcher 𝑟𝑟 by industrial inventors via only joint invention with industrial inventors, via only citations by industrial patents, and via both joint inventions and citations as:
USK𝑟𝑟,𝑠𝑠JointOnly(𝑑𝑑) = I�𝑝𝑝𝑟𝑟
Joint(𝑑𝑑) > 0� × I�𝑝𝑝𝑟𝑟Cite(𝑑𝑑) = 0� × 𝑛𝑛𝑟𝑟,𝑠𝑠(𝑑𝑑),
USK𝑟𝑟,𝑠𝑠CiteOnly(𝑑𝑑) = I�𝑝𝑝𝑟𝑟
Joint(𝑑𝑑) = 0� × I�𝑝𝑝𝑟𝑟Cite(𝑑𝑑) > 0� × 𝑛𝑛𝑟𝑟,𝑠𝑠(𝑑𝑑), and
USK𝑟𝑟,𝑠𝑠JointCite(𝑑𝑑) = I�𝑝𝑝𝑟𝑟
Joint(𝑑𝑑) > 0� × I�𝑝𝑝𝑟𝑟Cite(𝑑𝑑) > 0� × 𝑛𝑛𝑟𝑟,𝑠𝑠(𝑑𝑑).
where 𝑝𝑝𝑟𝑟Joint(𝑑𝑑) is the number of patents jointly invented by academic researcher 𝑟𝑟 and
industrial inventors, and 𝑝𝑝𝑟𝑟Cite(𝑑𝑑) is the number of patents invented by academic researcher 𝑟𝑟 cited by industrial inventors. Using the USK, we define the utilization rate of science knowledge (URSK) in field 𝑠𝑠 as:
URSK𝑠𝑠𝑋𝑋(𝑑𝑑) =
∑ USK𝑟𝑟,𝑠𝑠𝑋𝑋 (𝑑𝑑)𝑟𝑟∈𝑅𝑅
𝐼𝐼𝑠𝑠(𝑑𝑑) for 𝑋𝑋 = JointOnly, JointCite, CiteOnly.
where 𝐼𝐼𝑠𝑠(𝑑𝑑) is the number of total scientific publications (including the publications of non-inventor pure scientists). Thus, this indicator measures the share of the number of academic inventors’ science publications linked to industrial inventors through patenting activities in all academic publications.
4. Results
4-1. Empirical findings
Figure 4 shows the aggregated trend of academic involvement in industry innovation. It shows that both the shares of academia-industry joint applications and patents citing academic patents increased from 2000-2003 (Time I) to 2004-2007 (Time II). In subsequent periods (from Time II to Time III, 2008-2011), the share of joint applications

15
increased further, while the share of patents citing academic patents decreased. Additionally, the number of inventors per employee (reflecting R&D intensity) decreased over time in the industry sector.
(Figure 4)
Figures 5-7 present the aggregated indicators described in the previous section. Specifically, Figure 5 and 6 shows the investor-based science intensity (SIINV) and employee-based science intensity (SIEMP) respectively, and Figure 7 shows the industry breakdown of SIEMP as indicators of science intensity in industry.
The SIINV increased from Time I to Time II, by increasing both joint inventions and academic patent citations. After the incorporation of Japan’s national universities in 2004, academic patent applications increased substantially. Moreover, industry-university collaboration activities have been promoted for over 10 years, which has contributed to the increase in science intensity indicators after 2004. However, the total intensity did not change at 249 from Time II to Time III. Looking at the indicators, science intensity due to academic patent citations decreases, while that due to joint inventions increased. It should be noted that the citation indicator is calculated by taking into account only cited (academic) patents applied within the same period. Therefore, a decrease in this indicator means that the academic patents in Time III are less likely to be cited by industry, as compared to those in Time II.9
(Figure 5)
The SIEMP (science intensity by total employment) decreased from Time II to Time III. The difference in the rate of decline between SIEMP (20%, from 3.6 to 3.0) and SIINV (0% unchanged from 249) is due to the decreasing ratio of number of inventors to total employment. During Time III, firms cut their R&D spending, responding to the economic downturn after the financial crisis in 2008, which is the reason decreased inventive
9 It is possible to consider the information for cited academic patents in previous periods as well, instead
of just using the ones cited in the same period as the academic patents. However, our datasets start from 1995, so data truncation prevents us from make a fair inter-temporal comparison if we used all cited academic patents.
16
activities.
(Figure 6)
Figure 7 shows the industry breakdown of SIEMP. It is found that the chemical (excluding pharmaceuticals) and pharmaceutical industries substantially lead other industries. However, the science intensity indicator has generally increased in other industries, which means that scientification of industrial innovation can be observed across industries. A sharp drop of SIEMP in the ICT machinery industry from Time II to Time III is consistent with the macro economic shock in 2008, since R&D cost cuts are particularly observed for firms in this industry. In contrast, some industries, such as chemicals (excluding pharmaceutical), telecom services, and broadcasting, show a consistent increase in SIEMP for all periods. In general, the cross industry distribution of science intensity becomes equal, since the Gini coefficients decrease from 0.612 in Time I to 0.586 in Time III.
(Figure 7)
Regarding the sources of SK, Figure 8 shows the aggregated trend of URSK, the utilization rate of academic papers to total publications. A similar trend is observed in the SIINV and SIEMP, which increased from Time I to Time II and decreased from Time II to Time III. The changes in URSK are caused not only by the demand side factor of SK in industry (expressed by SIINV and SIEMP), but also by the supply side factor of scientific activities. The up and down trend of URSK is similar to that of SIINV and SIEMP, but it should be noted that any changes in supply side factor such as new scientific advancements may affect the trend.
(Figure 8)
Viewing this trend from an academic perspective, the situation is more complicated. In general, the industry utilization rate increased over time, while a sharp decline from Time II to Time III is found in some fields, such as chemistry, physics, and astronomy. In

17
contrast, some academic fields, such as mathematics and social science, show a strong increasing trend. Thus, the overall inequality in URSK in the academic field decreases from Time I to Time III, as is indicated by the Gini coefficient decreasing from 0.35 to 0.30.
(Figure 9)
4-2. Comparison with the NPL indicator
To evaluate our new indicators, we compared them to the NPL citation indicator. Since Japanese patent databases do not provide applicant citation information (only examiner citation data), the JPO patents within the DOCDB (master documentation database of the EPO) patent family with USPTO patents are extracted first. Next, based on the NPL citation information of these USPTO patents, a dummy variable is created to indicate whether an equivalent US patent has NPL citations 10 . Finally, we compare this information with that of our indicators of science linkage, i.e., either the joint patents applications with academia, or patents citing academic patents. Figure 10 shows the comparison of these two indicators by technology class for a whole period, indicating the share of both joint patent applications with academia or patents citing academic patents (referred to as academic-related patents hereafter) and patents citing NPL (Both), only NPL citations (only NPL), and only academic-related patents (only A-Pat).
(Figure 10)
First, it is found that the number of academic-related patents correlated positively with that of patents with NPL citations. However, the share of NPL citation patents is larger than that of academic-related patents in general, as seen by the larger values for only NPL, when compared to only A-Pat. It is found that about half of the NPL documents cited by patents are not related to academic research, such as books, industry related documents and patent related documents (like patent abstracts) (Callaert et. al, 2006). In
10 The NPL citations of US patents include not only scientific papers but also many patent abstract documents. We roughly identified the patent abstracts and excluded it in advance.

18
contrast, our indicators are constructed by using scientific papers in Scopus only, which partly explains this difference.11
Additionally, there is a conceptual difference between the NPL citations and academic-related patents. Our new indicator reflects the interaction between industry and academia using academic patents, while NPL citation reflect industry’s direct access to academic research. It is interesting that the share of only A-Pat is relatively small for very high science intensity industries, such as biotechnology (4.4% out of 94.3% in total) and pharmaceuticals (2.5% out of 83.6%). In contrast, there are some industries, where the shares of only A-Pat are relatively large, such as materials and metallurgy (8.6% out of 44.8%), chemical engineering (9.9% out of 40.4%), and macromolecular chemistry and polymers (8.2% out of 39.3%). In these industries that heavily rely on them, the use of SK by industry is mediated more by academic patenting, rather than directly citing scientific papers, which explains the differences in the way science interacts with industry in different fields.
5. Discussion and Conclusion
This paper presents new indicators to measure scientification of industry in Japan, by linking a scientific paper database (science), patent information (technology), and economic census data (industry). The new indicators reflect a new mechanism of science linkage between science and industrial activities, which cannot be measured by NPL citations of patents, capturing the pure disembodied knowledge flow. In other words, the linkage of scientific publications and patents at the researcher level allows us view science-industry linkages via academic involvement in patenting activities, instead of just publishing scientific findings in papers.
These new indicators of science linkage in Japan show an increasing trend over the past 10 years. However, the science intensity of industry decreased from 2004-2007 to 2008-2011 due to a decrease in the R&D intensity of industry, caused by the economic slowdown after the financial crisis in 2008. However, co-invention activities increased
11 Additionally, Figure A4 in Appendix 4 shows difference between the NPL citations matched and unmatched to Scopus. In the technology fields with high science intensity, such as biotechnology and pharmaceuticals, most scientific papers cited as NPL by the patents are matched to Scopus, indicating that firms in these industries tend to directly access to scientific knowledge published as academic papers with relatively high quality for their R&D. On the other hand, while patents in the fields, such as digital communication and IT methods for management, cite number of NPL documents, only a small share of the NPL is matched to Scopus, implying that documents other than academic papers are utilized for the R&D of the firms in those fields.

19
during this period, so that the importance of science in industrial innovation kept increasing over time. One reason behind these trends is the institutional reform of the academic sector in Japan, i.e., incorporation of national universities in 2004. Additionally, the Japanese Government introduced various polices stimulating university-industry collaborations from the late 1990s onwards, such as the TLO (Technology Licensing Organization) Promotion Law and the Japanese Baye Dole Act (Motohashi and Muramatsu, 2012). These policy actions induced academic sectors (both HEIs and PRIs) to work with industry, which involved patenting activities.
Government policies are not the only factors behind the trend of science linkage with industry; the growing importance of scientific inputs in industrial innovation has an impact as well. The 21st century began with the completion of the analysis of the human genome sequence. Big-data analysis allows scientific understanding of business and economics activities, such as purchasing behavior and production process in factories. In our analysis, science linkage with industry is found not only in science-based industries, such as pharmaceuticals and electronics, but also in many other industries. The variation of the total science intensity index of industry decreased in the past decade. Studies on the taxonomy of innovation suggest sectoral differences in its characteristics, and science-based industry is one of these categories (Pavitt, 1984; Breschi and Malerba, 1997). However, our study has shown that scientific knowledge become general inputs in almost all industries, and this trend can be referred to as the “science-based economy,” for non-science based industries as well.
Hence, public expenditure on science sectors should be supported, since scientific findings contribute to industrial innovation, and benefit the entire economy, instead of only a limited number of science-based industries. Moreover, further interactions between academia and industry should be promoted, since direct interactions between them is a more important source of science linkage than the disembodied knowledge flow from science to industry, captured by NPL citations. Academic-industry interactions can be encouraged by developing corporate research centers inside universities and university-based startups.

20
Appendix 1. Disambiguation of Japanese Patent Inventors
In this appendix, we describe the method and data to be used to identify (disambiguate) the inventors of patents filed in the JPO.
We utilize the data for patents applied in 1995 or later from the IIP patent database 2015 version (IIP-PD hereafter)12. The IIP-PD consists of a number of normalized tables and we use tables for inventors, applications, and applicants, named as “inventor”, “ap” and “applicant” respectively. Since the names of the non-Japanese inventors are written in Katakana characters (a Japanese syllabary), they contain many spelling inconsistencies; hence, we use only the Japanese inventors for this analysis. To extract only the Japanese inventors’ data, we exclude inventors whose name does not contain a Chinese character. The unit of the inventor table records is patent-inventor; and the table contains 25,499,350 total records but we extract only 12,397,820 records.
To apply the disambiguation algorithm, we normalize the names and addresses of inventors and applicants. For inventor names, all spaces, including spaces between surnames and given names of inventors, are removed and similar characters are consolidated. Addresses of inventors are divided into five regional levels: prefecture (to, do, fu, or ken), municipality (shi, ku, cho, or son), city block (chome or aza), land number (banchi or ban), and land number extension (go). For the applicant information, we use the applicant name and identification number given by the JPO. The identification number is replaced by a firm ID (NID) used in the “NISTEP Dictionary of Corporate Names Version 2015.1” developed by NISTEP if the information can be successfully matched to the IIP-PD using a converter also provided by NISTEP.13
Next, we apply a patent-inventor disambiguation algorithm developed by Li et al. (2014) to the normalized data. The algorithm involves the following steps. First, the patent-inventor level dataset is prepared for analysis. Each record of “inventor” table in the IIP-PD is a unit of analysis, identified by a combination of the patent application number (ida) and a sequential number of inventor for each patent application (seq). Second, the records are blocked based on predetermined criteria that are likely to be satisfied by most matching records. We divided the records in which the inventor names are identical into a block. Third, for all pairs of the records within blocks, a vector of similarity (known as the similarity profile) for a record pair is computed. The similarity
12 http://www.iip.or.jp/patentdb/ 13 http://www.nistep.go.jp/research/scisip/data-and-information-infrastructure

21
profile for any two inventor-patent records 𝑖𝑖 and 𝑗𝑗 in a block is defined as the following multi-dimensional vector:
𝐱𝐱𝑖𝑖𝑗𝑗 = (𝑥𝑥1,𝑖𝑖𝑗𝑗 𝑥𝑥2,𝑖𝑖𝑗𝑗 ⋯ 𝑥𝑥𝑘𝑘,𝑖𝑖𝑗𝑗 ⋯ 𝑥𝑥𝐾𝐾−1,𝑖𝑖𝑗𝑗 𝑥𝑥𝐾𝐾,𝑖𝑖𝑗𝑗)
where 𝑥𝑥𝑘𝑘,𝑖𝑖𝑗𝑗 is the degree of similarity of records 𝑖𝑖 and 𝑗𝑗 based on the 𝑘𝑘th attribute. Table A1-1 represents the definition of the similarity profile in this study.
(Table A1-1)
Fourth, using predetermined training sets, we compute the likelihood that matching pairs and non-matching pairs could give rise to each similarity profile. Likelihood ratio (r-value) for a similarity profile 𝐱𝐱 is defined as:
𝑟𝑟(𝐱𝐱) =𝑃𝑃(𝐱𝐱|𝐸𝐸)𝑃𝑃(𝐱𝐱|𝐼𝐼)
where 𝑃𝑃(𝐱𝐱|𝐸𝐸) and 𝑃𝑃(𝐱𝐱|𝐼𝐼) is the proportion of times that similarity profile 𝐱𝐱 appeared in the match set and non-match set respectively. In this study, we define a match set as a group of record pairs of matched inventor full names defined as rare with respect to all inventor names, and non-match set as a group of record pairs of non-matching inventor full names chosen from the rare name list. We define rare names as names that do not appear more than two times a year in the telephone directory published by Nippon Telegraph and Telephone Corporation during 2000-2012.
Fifth, we estimate the posterior probability of a match for all record pairs using the likelihood ratio calculated from the training sets. Posterior probability is defined by Bayes’ theorem as follows,
𝑃𝑃�𝐸𝐸𝑖𝑖𝑗𝑗�𝐱𝐱𝑖𝑖𝑗𝑗� =1
1 +1 − 𝑃𝑃�𝐸𝐸𝑖𝑖𝑗𝑗�𝑃𝑃�𝐸𝐸𝑖𝑖𝑗𝑗�
1𝑟𝑟�𝐱𝐱𝑖𝑖𝑗𝑗�
where 𝑃𝑃�𝐸𝐸𝑖𝑖𝑗𝑗� is the prior probability of a match. The prior probability is calculated using the original algorithm.
Finally, using the posterior match probability for all record pairs within the blocks and a set of thresholds, record pairs with relatively high probabilities are merged into a cluster iteratively. We used a set of seven thresholds (0.99, 0.95, 0.90, 0.8, 0.7, 0.6, and 0.5). Iterative clustering starts from the highest threshold (0.99) to the lowest threshold

22
(0.5)14.
The disambiguation algorithm used in Li et al. (2014) is publicly available on the GitHub website15. However, since it was developed for the patent data in the U.S., it is necessary to modify it to apply to patent data in Japan. Table A1-2 summarizes the modified points. First, the original algorithm uses the first, middle, and last names as inventor name attributes, and allow for misspelling or abbreviation in names by implementing several blocking rules. Compared to the original program, we do not divide the name attribute and do not allow for any variation in inventor names because Japanese names usually do not contain middle names, and the abbreviation of inventor names rarely occurs in Japan.
For the technology class, we use the IPC while Li et al. (2014) used the US technology class. Furthermore, although the original program allows multiple technology classes, since the IIP-PD contains one main IPC code for each patent, we modify the definition of the similarity score for the technology class attribute.
Although Japanese patents have multiple applicants (assignees), the algorithm assumes a single assignee. For that reason, we use only the information of the applicant that appears first.
We significantly changed the training sets’ creation rules. Li et al. (2014) uses two types of training sets. One training set is based on patent features and is used to learn ambiguity in name features. Another training set is based on name features and is used to learn ambiguity in patent features. In this study, because we do not allow for variations in the name attribute within a block, training sets for name features are not necessary. Similar to the original algorithm, rare names are used to generate training sets for patent features. While the original algorithm determines rare names within patent inventors, we obtain the list of rare names from the telephone directory in order to improve the reliability of training sets.
(Table A1-2)
14 Iterative clustering is a complex process and requires some parameters to be set. Following the original program, the “minimum threshold” is set to 0.3 and the “effective comparison count” is set to one-fourth the number of combinations of the members between two clusters. For details regarding iterative clustering, see Li et al. (2014).
15 https://github.com/funginstitute/disambiguator

23
We run the modified program on the following system:
CPU: 20Core Xeon E5‒2660 v3 2.6GHz (10core x 2CPU) Memory: 64GB (8GBx8) ECC Registered DDR4‒2133 Quad‒Channel OS: Linux (Ubuntu) on Windows 10 using VMWare Workstation 12 Player CPLEX:IBM ILOG CPLEX Optimization Studio Version 12.6.2
Appendix 2. Detailed Matching Results of Patent Applicants and Census Data
Table A2 gives the detailed results for all organizations, including the breakdown by the match levels. Figure A2 shows the yearly matching rates for firms.
(Table A2) (Figure A2 (a) and (b))
Appendix 3. NPL Citations of JP Patent Applications
Most studies regarding science-industry linkage focus on the NPL citations of US patents because the US Patent Act requires applicants to disclose their knowledge of prior art documents and the US patent database is well organized.
The Japanese Patent Act did not require information disclosure until 2002. Thus, prior art documents regarding front-page references of the Japanese patent gazette are listed by patent examiners. Citations by inventors/applicants are often embedded in the text of detailed technical descriptions. In this paper, we used information of NPL cited by inventors/applicants in Japanese patent applications, from a database we purchased from the Artificial Life Laboratory, Inc. They identified and extracted patent and NPL documents cited in technical descriptions, using their text-mining algorithm based on Tamada et al. (2006) and further developed it. The database comprises Japanese patent application publications (including applications based on the Patent Cooperation Treaty (PCT); 8.2 million records total), and Japanese granted patents (3.6 million records), for which gazettes were published between 1993 and 2015.
To calculate the average number of NPL citations in Table 3, we used the NPL citations of 3.4 million patent application publications, whose applicants are Japanese firms with an earliest priority year between 2000 and 2011 (see Table A3).

24
(Table A3)
To compare the NPL citation information in the Tamada DB with that of the US patents, we used the EPO PATSTAT database and extracted US patents in the DOCDB family of Japanese patent applications corresponding to the US patents. Figure A3 shows the average number of NPL citations of JP applications ((2) in Table A3) and the corresponding US patents ((3) in Table A3) by technology areas of the World Intellectual Property Organization (WIPO). We observed very similar tendencies.
(Figure A3)
Appendix 4. NPL citations matched and unmatched to Scopus
We used matched data of NPL citations and Scopus and made a graph comparable to Figure 10, indicating the share of patents both academic-related patents and patents citing NPL matched to Scopus (Both), that with only NPL citations matched to Scopus (only NPL), that with only academic related patents (only A-Pat) and that with “NPL citations not matched to Scopus” by technology areas.
(Figure A4)

25
References
Breschi, S. and F. Malerba, (1997) “Sectoral innovation systems: technological regimes, Schumpeterian dynamics and spatial boundaries”, in (C. Edquist ed.) Systems of Innovation, Technologies, Institutions and Organization, pp.130-156, London: Cassel.
European Patent Office (2015), The Worldwide Patent Statistical Database (PATSTAT), Autumn edition.
Goto, A. and K. Motohashi (2007) “Construction of a Japanese Patent Database and a first look at Japanese patenting activities,” Research Policy, 36(9), 1431-1442.
Li, GC., R. Lai, A. D’Amour, D.M. Doolin, Y. Sun, V.I. Torvik, A.Z. Yu, and L. Fleming (2014) “Disambiguation and co-authorship networks of the US patent inventor database (1975–2010),” Research Policy, 43(6), 941-955.
Lissoni, F, F. Montabio, and L. Zirulia (2013) “Inventorship and authorship as attribution rights: an enquiry into the economics of scientific credit,” Journal of Economic Behavior and Organization, 95, 49-69.
Looy, B.V., E. Zimmermann, R. Veugelers, A. Verbeek and K. Debackere (2003) “Do science-technology interactions pay off when developing technology?” Scientometrics 57(3), 355-367.
Magerman, T., B.V. Looy, and K. Debackere (2015) “Does involvement in patenting jeopardize one’s academic footprint? An analysis of patent-paper pairs in biotechnology,” Research Policy, 44(9), 1702-1713.
Mayer, K (2006), Are patenting scientists the better scholars? An exploratory comparison of inventor-authors with their non-inventing peers in nano-science and technology, Research Policy, 35(10), 1646-1662
Motohashi, K. and S. Muramatsu (2012) “Examining the university industry collaboration policy in Japan: Patent analysis,” Technology in Society, 34(2), 149-162.
Murray, F. (2002), Innovations as co-evolution of scientific and technological networks: exploring tissue engineering, Research Policy 32(8-9), 1389-1403
Narin, F. and E. Noma (1985) “Is technology becoming science?” Scientometrics, 7, 368-381.

26
OECD (2013), Commercialising Public Research: New Trends and Strategies, OECD report, December 10, 2013, OECD Paris
Pavitt, K. (1984) “Sectoral patterns of innovation: toward a taxonomy and a theory,” Research Policy, 28(6), 643-660.
Sagara, T., M. Arikawa, and M. Sakauchi (2001) “Distributed location reference service,” Transactions of Information Processing Society of Japan, 42(12), 2928-2940. (in Japanese)
Schmoch, U. (1997) “Indicators and relations between science and technology,” Scientometrics, 38(1), 103-116.
Tamada, S., Y. Naito, F. Kodama, K. Gemba, and J. Suzuki (2006) "Significant difference of dependence upon scientific knowledge among different technologies," Scientometrics, 68(2), 289-302.
Torvik, V.I., M. Weeber, D.R. Swanson, and N.R. Smalheiser (2005) "A probabilistic similarity metric for Medline records: A model for author name disambiguation," Journal of the American Society for Information Science and Technology, 56(2), pp.140-158.
Torvik, V.I., and N.R. Smalheiser (2009) "Author name disambiguation in MEDLINE," ACM Transactions on Knowledge Discovery from Data, 3(3), Article 11.
27
Tables and Figures
Table 1: Results of disambiguation of patent inventors
Source: Authors’ calculations based on Scopus, the IIP patent database, and the KAKEN database.
(1) (2) (3)
Disambiguation methods : Modified Li et. al.(2014) Algorithm
Name Match Name-Address-Applicant Match
Inventor-patent records 12,397,820 - -
Disambiguated inventors 1,709,880 - -
KAKEN records (inventor-patent records) 11,958 11,974 11,974
KAKEN inventors 5,984 5,992 5,992
6,221 5,973 7,83596.2% 100.3% 76.4%
233 2 1,2273.89% 0.03% 20.50%
14 42 60.23% 0.70% 0.10%
288 2 2,2332.41% 0.02% 18.67%
34 65 80.28% 0.54% 0.08%
Disambiguated KAKEN inventors
KAKEN inventors with splitting error
KAKEN inventors with lumping error
KAKEN records with splitting error
KAKEN records with lumping error

28
Figure 1: Patent inventors and academic authors active in 2008-2011 in Japan
Source: Authors.
Table 2: Patent inventors and academic authors active in 2000-2011 in Japan
Source: Authors’ calculations based on Scopus and the IIP patent database.
2000-03 2004-07 2008-11 Total [A] Number of authors 316,031 355,936 381,660 739,372 [B] Number of all inventors 673,927 623,849 562,822 1,229,027 [C] Number of academic inventors 21,437 31,421 30,505 53,446
[C/B] Proportion of academia in inventors 3.2% 5.0% 5.4% 4.3% [D] Number of patenting authors 9,532 15,726 15,598 26,333
[D/A] Proportion of inventors in authors 3.0% 4.4% 4.1% 3.6% [D/B] Proportion of authors in inventors 1.4% 2.5% 2.8% 2.1%
Academic inventors (30,505)
Patent inventors in IIP-PD (562,822)
Academic authors in Scopus (381,660)
Patenting academic authors (15,598)

29
Table 3: Number of Establishments by Type
Source: Authors’ calculations based on the Establishment and Enterprise Census of Japan, and the Economic Census of Japan.
Table 4: The Result of Patent-Organization Linkage (for patent applications in 1964-2013)
Source: Authors calculations based on the IIP patent database, the Establishment and Enterprise Census of Japan, and the Economic Census of Japan.
Census Year Headquarter Branch Single Est. Total 2001 229,436 1,185,929 4,722,947 6,138,3122004 262,994 1,141,894 4,323,604 5,728,4922006 228,664 1,255,827 4,238,068 5,722,5592009 287,715 1,375,189 4,193,038 5,855,9422012 270,634 1,296,421 3,855,672 5,422,727

30
Figure 2: Temporal performance of the Linking Procedure: All Organizations
(a) For Applications between 1995 and 2013
Source: Authors’ calculations based on the IIP patent database, the Establishment and Enterprise Census of Japan, and the Economic Census of Japan.
(b) For Applications in the Full Period (1964-2013)
Source: Authors’ calculations based on the IIP patent database, the Establishment and Enterprise Census of Japan, and the Economic Census of Japan.
0.4
0.5
0.6
0.7
0.8
0.9
1
2001 2004 2006 2009 2012
0
0.2
0.4
0.6
0.8
1
1964
1966
1968
1970
1972
1974
1976
1978
1980
1982
1984
1986
1988
1990
1992
1994
1996
1998
2000
2002
2004
2006
2008
2010
2012
2001 2004 2006 2009 2012
31
Table 5: Patent Applications and Applicants Failed in the Linking Procedure for All Census Datasets
Note: The failed applicants are identified by their names and address.
Source: Authors’ calculations based on the IIP patent database, the Establishment and Enterprise Census of Japan, and the Economic Census of Japan.
Figure 3: Framework of indicators
Source: Authors.

32
Table 6a: Avg. Number of Publications per Patent of Academic Inventors by Science Field and Technology Class (2000-2003)
Source: Authors’ calculations based on Scopus and the IIP Patent Database
Elec
trica
l mac
hine
ry,
appa
ratu
s, en
ergy
Aud
io-v
isual
tech
nolo
gy
Tele
com
mun
icat
ions
Dig
ital c
omm
unic
atio
n
Basic
com
mun
icat
ion
proc
esse
s
Com
pute
r tec
hnol
ogy
IT m
etho
ds fo
rm
anag
emen
t
Sem
icon
duct
ors
Opt
ics
Mea
sure
men
t
Ana
lysis
of b
iolo
gica
lm
ater
ials
Cont
rol
Med
ical
tech
nolo
gy
Org
anic
fine
che
mist
ry
Biot
echn
olog
y
Phar
mac
eutic
als
Mac
rom
olec
ular
chem
istry
, pol
ymer
s
Food
che
mist
ry
Basic
mat
eria
lsch
emist
ry
Mat
eria
ls, m
etal
lurg
y
Surf
ace
tech
nolo
gy,
coat
ing
Mic
ro-s
truct
ural
and
nano
-tech
nolo
gy
Chem
ical
eng
inee
ring
Envi
ronm
enta
lte
chno
logy
Han
dlin
g
Mac
hine
tool
s
Engi
nes,
pum
ps,
turb
ines
Text
ile a
nd p
aper
mac
hine
s
Oth
er sp
ecia
l mac
hine
s
Ther
mal
pro
cess
es a
ndap
para
tus
Mec
hani
cal e
lem
ents
Tran
spor
t
Furn
iture
, gam
es
Oth
er c
onsu
mer
goo
ds
Civi
l eng
inee
ring
1 2 3 4 5 6 7 8 9 10 11 12 13 14 15 16 17 18 19 20 21 22 23 24 25 26 27 28 29 30 31 32 33 34 3510 Multidisciplinary 0.005 0.003 0.002 0.003 0.007 0.006 0.000 0.010 0.013 0.013 0.018 0.004 0.009 0.017 0.059 0.028 0.005 0.016 0.016 0.008 0.008 0.004 0.004 0.005 0.012 0.001 0.013 0.004 0.030 0.001 0.002 0.002 0.005 0.008 0.001
11 Agricultural and Biological Sciences 0.013 0.003 0.003 0.003 0.002 0.014 0.000 0.007 0.006 0.047 0.069 0.010 0.041 0.127 0.376 0.232 0.035 1.041 0.217 0.009 0.008 0.007 0.041 0.097 0.019 0.030 0.026 0.025 0.218 0.035 0.008 0.007 0.068 0.020 0.025
12 Arts and Humanities 0.000 0.000 0.000 0.000 0.000 0.002 0.000 0.000 0.000 0.002 0.001 0.000 0.001 0.000 0.000 0.000 0.000 0.000 0.001 0.002 0.001 0.003 0.000 0.000 0.000 0.000 0.000 0.000 0.000 0.000 0.000 0.000 0.000 0.001 0.000
13 Biochemistry, Genetics and Molecular Biology 0.050 0.017 0.019 0.029 0.025 0.124 0.000 0.052 0.049 0.277 0.462 0.090 0.559 0.834 1.734 1.595 0.197 0.672 0.248 0.051 0.066 0.127 0.123 0.169 0.130 0.033 0.066 0.073 0.519 0.041 0.069 0.030 0.061 0.114 0.048
14 Business, Management and Accounting 0.000 0.000 0.000 0.000 0.000 0.002 0.000 0.000 0.000 0.002 0.003 0.001 0.003 0.002 0.013 0.007 0.000 0.003 0.004 0.000 0.000 0.000 0.001 0.001 0.000 0.001 0.001 0.000 0.003 0.001 0.001 0.002 0.000 0.000 0.001
15 Chemical Engineering 0.085 0.009 0.002 0.001 0.014 0.019 0.000 0.037 0.025 0.072 0.098 0.029 0.143 0.133 0.120 0.073 0.132 0.090 0.168 0.151 0.092 0.089 0.383 0.205 0.025 0.079 0.078 0.084 0.092 0.154 0.054 0.032 0.016 0.057 0.023
16 Chemistry 0.324 0.040 0.006 0.012 0.009 0.033 0.000 0.127 0.151 0.332 0.594 0.013 0.113 1.218 0.215 0.333 0.590 0.168 0.530 0.344 0.297 0.399 0.609 0.279 0.041 0.089 0.136 0.197 0.188 0.082 0.069 0.031 0.121 0.093 0.038
17 Computer Science 0.027 0.081 0.198 0.241 0.284 0.407 0.000 0.028 0.048 0.095 0.036 0.239 0.110 0.007 0.016 0.005 0.012 0.002 0.011 0.008 0.009 0.053 0.012 0.038 0.398 0.014 0.020 0.008 0.009 0.028 0.047 0.073 0.338 0.149 0.031
18 Decision Sciences 0.000 0.001 0.002 0.011 0.002 0.006 0.000 0.000 0.000 0.002 0.001 0.011 0.001 0.000 0.000 0.000 0.000 0.000 0.000 0.000 0.000 0.000 0.000 0.000 0.005 0.001 0.000 0.000 0.000 0.000 0.001 0.000 0.006 0.008 0.000
19 Earth and Planetary Sciences 0.018 0.005 0.019 0.010 0.048 0.019 0.000 0.013 0.009 0.074 0.044 0.024 0.014 0.009 0.009 0.012 0.008 0.005 0.022 0.019 0.023 0.019 0.020 0.071 0.009 0.013 0.048 0.003 0.019 0.032 0.031 0.065 0.019 0.029 0.071
20 Economics, Econometrics and Finance 0.000 0.000 0.000 0.000 0.000 0.000 0.000 0.000 0.000 0.000 0.000 0.000 0.000 0.000 0.000 0.001 0.000 0.000 0.000 0.000 0.000 0.000 0.000 0.000 0.000 0.000 0.000 0.000 0.000 0.000 0.000 0.000 0.000 0.000 0.000
21 Energy 0.084 0.004 0.002 0.001 0.007 0.013 0.000 0.031 0.010 0.035 0.041 0.019 0.025 0.023 0.005 0.004 0.014 0.004 0.093 0.070 0.040 0.034 0.107 0.120 0.023 0.020 0.276 0.020 0.028 0.210 0.066 0.016 0.003 0.033 0.017
22 Engineering 0.418 0.310 0.528 0.341 0.744 0.395 0.000 0.361 0.487 0.548 0.355 0.545 0.472 0.046 0.057 0.043 0.067 0.015 0.183 0.212 0.300 0.351 0.246 0.265 0.987 0.478 0.621 0.092 0.131 0.452 0.785 0.553 0.838 0.689 0.287
23 Environmental Science 0.007 0.002 0.004 0.010 0.005 0.008 0.000 0.004 0.003 0.024 0.032 0.005 0.007 0.021 0.042 0.020 0.022 0.038 0.036 0.014 0.009 0.004 0.039 0.125 0.007 0.011 0.022 0.012 0.034 0.023 0.039 0.007 0.011 0.014 0.012
24 Immunology and Microbiology 0.007 0.002 0.002 0.010 0.004 0.021 0.000 0.015 0.007 0.054 0.087 0.013 0.055 0.124 0.442 0.341 0.023 0.152 0.042 0.006 0.006 0.006 0.020 0.088 0.006 0.009 0.005 0.016 0.218 0.012 0.008 0.005 0.002 0.003 0.025
25 Materials Science 0.474 0.163 0.035 0.028 0.132 0.070 0.000 0.684 0.355 0.337 0.446 0.068 0.389 0.239 0.095 0.115 0.834 0.038 0.574 1.279 0.992 0.875 0.476 0.286 0.087 0.623 0.243 0.411 0.416 0.176 0.310 0.054 0.149 0.155 0.096
26 Mathematics 0.003 0.004 0.005 0.032 0.026 0.046 0.000 0.005 0.008 0.017 0.009 0.042 0.020 0.004 0.007 0.003 0.004 0.008 0.008 0.004 0.005 0.009 0.004 0.003 0.018 0.005 0.013 0.005 0.003 0.007 0.005 0.004 0.041 0.052 0.009
27 Medicine 0.064 0.040 0.035 0.049 0.021 0.131 0.000 0.061 0.044 0.185 0.251 0.111 1.124 0.504 0.907 1.550 0.092 0.155 0.115 0.048 0.040 0.054 0.036 0.116 0.103 0.020 0.040 0.027 0.351 0.066 0.057 0.104 0.085 0.061 0.053
28 Neuroscience 0.006 0.015 0.004 0.008 0.004 0.027 0.000 0.007 0.009 0.034 0.049 0.019 0.132 0.101 0.178 0.276 0.019 0.038 0.005 0.007 0.003 0.012 0.011 0.024 0.020 0.007 0.006 0.002 0.113 0.005 0.005 0.008 0.060 0.036 0.003
29 Nursing 0.000 0.000 0.000 0.000 0.000 0.000 0.000 0.001 0.000 0.000 0.001 0.000 0.011 0.004 0.004 0.010 0.000 0.000 0.000 0.000 0.000 0.000 0.000 0.001 0.000 0.000 0.000 0.000 0.003 0.000 0.000 0.000 0.000 0.000 0.000
30 Pharmacology, Toxicology and Pharmaceutics 0.008 0.003 0.005 0.010 0.007 0.015 0.000 0.008 0.006 0.043 0.069 0.004 0.079 0.329 0.171 0.506 0.044 0.097 0.034 0.006 0.007 0.056 0.027 0.016 0.033 0.005 0.008 0.010 0.081 0.012 0.008 0.007 0.007 0.014 0.006
31 Physics and Astronomy 0.915 0.484 0.156 0.100 0.446 0.169 0.000 1.537 1.317 0.704 0.742 0.180 0.337 0.173 0.116 0.107 0.187 0.082 0.582 0.759 1.446 0.938 0.525 0.512 0.139 0.475 0.753 0.243 0.279 0.381 0.318 0.146 0.172 0.462 0.099
32 Psychology 0.000 0.001 0.000 0.000 0.000 0.002 0.000 0.000 0.000 0.002 0.003 0.001 0.008 0.003 0.007 0.011 0.001 0.000 0.001 0.000 0.000 0.000 0.000 0.001 0.003 0.000 0.009 0.000 0.003 0.000 0.001 0.004 0.037 0.001 0.000
33 Social Sciences 0.002 0.002 0.001 0.002 0.001 0.008 0.000 0.000 0.000 0.003 0.002 0.008 0.002 0.001 0.001 0.001 0.001 0.000 0.001 0.000 0.000 0.000 0.002 0.002 0.001 0.000 0.001 0.000 0.000 0.006 0.003 0.003 0.001 0.027 0.003
34 Veterinary 0.001 0.000 0.000 0.000 0.001 0.000 0.000 0.001 0.001 0.004 0.007 0.000 0.008 0.007 0.029 0.026 0.002 0.026 0.007 0.000 0.000 0.000 0.002 0.001 0.000 0.000 0.000 0.001 0.012 0.001 0.000 0.000 0.004 0.000 0.000
35 Dentistry 0.001 0.001 0.003 0.004 0.000 0.001 0.000 0.001 0.001 0.009 0.014 0.001 0.089 0.014 0.020 0.041 0.001 0.005 0.000 0.004 0.001 0.001 0.000 0.001 0.001 0.002 0.000 0.002 0.002 0.000 0.001 0.006 0.005 0.001 0.000
36 Health Professions 0.001 0.001 0.001 0.002 0.000 0.005 0.000 0.002 0.002 0.004 0.005 0.001 0.028 0.006 0.007 0.014 0.003 0.001 0.002 0.005 0.002 0.000 0.001 0.013 0.002 0.000 0.006 0.000 0.003 0.012 0.001 0.001 0.018 0.007 0.001
Science Field (ASJC)Technology Class (WIPO)
33
Table 6b: Avg. Number of Publications per Patent of Academic Inventors by Science Field and Technology Class (2004-2007)
Source: Authors’ calculations based on Scopus and the IIP Patent Database
Elec
trica
l mac
hine
ry,
appa
ratu
s, en
ergy
Aud
io-v
isual
tech
nolo
gy
Tele
com
mun
icat
ions
Dig
ital c
omm
unic
atio
n
Basic
com
mun
icat
ion
proc
esse
s
Com
pute
r tec
hnol
ogy
IT m
etho
ds fo
rm
anag
emen
t
Sem
icon
duct
ors
Opt
ics
Mea
sure
men
t
Ana
lysis
of b
iolo
gica
lm
ater
ials
Cont
rol
Med
ical
tech
nolo
gy
Org
anic
fine
che
mist
ry
Biot
echn
olog
y
Phar
mac
eutic
als
Mac
rom
olec
ular
chem
istry
, pol
ymer
s
Food
che
mist
ry
Basic
mat
eria
lsch
emist
ry
Mat
eria
ls, m
etal
lurg
y
Surf
ace
tech
nolo
gy,
coat
ing
Mic
ro-s
truct
ural
and
nano
-tech
nolo
gy
Chem
ical
eng
inee
ring
Envi
ronm
enta
lte
chno
logy
Han
dlin
g
Mac
hine
tool
s
Engi
nes,
pum
ps,
turb
ines
Text
ile a
nd p
aper
mac
hine
s
Oth
er sp
ecia
l mac
hine
s
Ther
mal
pro
cess
es a
ndap
para
tus
Mec
hani
cal e
lem
ents
Tran
spor
t
Furn
iture
, gam
es
Oth
er c
onsu
mer
goo
ds
Civi
l eng
inee
ring
1 2 3 4 5 6 7 8 9 10 11 12 13 14 15 16 17 18 19 20 21 22 23 24 25 26 27 28 29 30 31 32 33 34 3510 Multidisciplinary 0.008 0.001 0.002 0.001 0.006 0.009 0.001 0.010 0.008 0.011 0.018 0.003 0.007 0.025 0.058 0.033 0.006 0.030 0.013 0.008 0.010 0.020 0.006 0.007 0.007 0.003 0.007 0.003 0.032 0.001 0.002 0.011 0.001 0.001 0.007
11 Agricultural and Biological Sciences 0.013 0.009 0.011 0.006 0.010 0.027 0.014 0.008 0.004 0.064 0.095 0.007 0.029 0.125 0.357 0.226 0.047 1.200 0.246 0.012 0.007 0.006 0.034 0.157 0.038 0.051 0.031 0.036 0.372 0.050 0.010 0.010 0.039 0.047 0.088
12 Arts and Humanities 0.003 0.004 0.001 0.001 0.001 0.010 0.002 0.002 0.001 0.001 0.002 0.002 0.001 0.001 0.001 0.001 0.000 0.001 0.002 0.008 0.002 0.012 0.002 0.001 0.002 0.002 0.002 0.004 0.001 0.004 0.003 0.000 0.000 0.020 0.004
13 Biochemistry, Genetics and Molecular Biology 0.078 0.040 0.042 0.077 0.042 0.258 0.267 0.060 0.054 0.348 0.597 0.156 0.483 1.031 1.744 1.662 0.269 0.959 0.279 0.086 0.083 0.133 0.110 0.195 0.159 0.047 0.049 0.108 0.633 0.045 0.071 0.036 0.149 0.093 0.047
14 Business, Management and Accounting 0.001 0.002 0.002 0.004 0.000 0.005 0.012 0.002 0.001 0.003 0.005 0.012 0.004 0.005 0.016 0.011 0.001 0.017 0.004 0.001 0.000 0.006 0.001 0.002 0.003 0.006 0.000 0.001 0.003 0.000 0.002 0.000 0.000 0.004 0.004
15 Chemical Engineering 0.117 0.024 0.012 0.009 0.012 0.037 0.027 0.052 0.030 0.110 0.150 0.064 0.161 0.120 0.110 0.077 0.178 0.117 0.167 0.201 0.123 0.137 0.396 0.231 0.051 0.094 0.106 0.132 0.121 0.205 0.097 0.024 0.056 0.039 0.027
16 Chemistry 0.432 0.060 0.015 0.025 0.050 0.058 0.019 0.216 0.186 0.343 0.575 0.047 0.075 1.098 0.270 0.281 0.737 0.166 0.492 0.460 0.349 0.646 0.557 0.245 0.067 0.102 0.199 0.198 0.194 0.115 0.088 0.016 0.140 0.088 0.063
17 Computer Science 0.045 0.197 0.348 0.595 0.313 0.815 0.347 0.054 0.086 0.142 0.050 0.497 0.143 0.015 0.027 0.014 0.018 0.008 0.021 0.019 0.017 0.055 0.020 0.099 0.504 0.042 0.052 0.043 0.025 0.018 0.125 0.117 0.272 0.262 0.039
18 Decision Sciences 0.001 0.001 0.003 0.015 0.000 0.010 0.033 0.001 0.002 0.001 0.000 0.031 0.001 0.000 0.000 0.000 0.000 0.000 0.000 0.000 0.000 0.000 0.000 0.000 0.004 0.002 0.000 0.001 0.001 0.000 0.003 0.001 0.002 0.001 0.000
19 Earth and Planetary Sciences 0.024 0.011 0.025 0.011 0.027 0.029 0.033 0.010 0.021 0.096 0.062 0.024 0.016 0.010 0.021 0.010 0.008 0.016 0.029 0.029 0.016 0.038 0.029 0.097 0.009 0.040 0.084 0.004 0.032 0.030 0.046 0.079 0.009 0.007 0.166
20 Economics, Econometrics and Finance 0.000 0.001 0.000 0.000 0.000 0.001 0.006 0.001 0.000 0.000 0.000 0.003 0.000 0.000 0.000 0.000 0.000 0.000 0.000 0.000 0.000 0.002 0.000 0.000 0.000 0.000 0.000 0.001 0.000 0.000 0.000 0.000 0.001 0.000 0.002
21 Energy 0.138 0.012 0.010 0.003 0.008 0.012 0.017 0.029 0.013 0.041 0.042 0.022 0.021 0.022 0.008 0.006 0.020 0.013 0.113 0.082 0.074 0.021 0.123 0.172 0.012 0.043 0.413 0.023 0.025 0.260 0.046 0.041 0.026 0.015 0.027
22 Engineering 0.886 0.677 1.077 0.919 1.438 0.977 0.441 0.758 0.884 0.949 0.721 1.494 0.783 0.326 0.221 0.218 1.365 0.088 0.423 0.431 0.499 1.118 0.411 0.500 1.629 0.860 0.897 0.663 0.617 0.663 1.189 1.008 0.731 0.688 0.652
23 Environmental Science 0.012 0.003 0.004 0.001 0.002 0.012 0.012 0.005 0.004 0.035 0.049 0.013 0.009 0.025 0.047 0.025 0.024 0.050 0.058 0.022 0.006 0.009 0.048 0.206 0.007 0.024 0.044 0.014 0.049 0.039 0.017 0.005 0.034 0.001 0.050
24 Immunology and Microbiology 0.007 0.005 0.009 0.003 0.008 0.029 0.032 0.009 0.005 0.054 0.098 0.027 0.058 0.175 0.472 0.346 0.022 0.203 0.067 0.010 0.017 0.014 0.011 0.094 0.013 0.024 0.011 0.018 0.196 0.013 0.003 0.010 0.022 0.031 0.010
25 Materials Science 0.689 0.204 0.078 0.050 0.246 0.118 0.083 0.637 0.369 0.358 0.455 0.109 0.358 0.251 0.105 0.123 0.877 0.057 0.519 1.546 0.923 0.776 0.519 0.374 0.160 0.859 0.457 0.581 0.485 0.224 0.393 0.085 0.135 0.148 0.157
26 Mathematics 0.016 0.028 0.033 0.107 0.043 0.128 0.124 0.014 0.013 0.021 0.013 0.091 0.025 0.007 0.008 0.006 0.003 0.002 0.005 0.005 0.004 0.015 0.006 0.009 0.046 0.016 0.011 0.007 0.007 0.013 0.019 0.011 0.065 0.028 0.010
27 Medicine 0.083 0.093 0.053 0.042 0.038 0.199 1.019 0.081 0.057 0.311 0.527 0.225 1.327 0.802 1.129 1.816 0.091 0.345 0.132 0.053 0.043 0.070 0.040 0.170 0.288 0.041 0.056 0.015 0.433 0.071 0.075 0.065 0.439 0.190 0.064
28 Neuroscience 0.011 0.017 0.004 0.002 0.008 0.030 0.019 0.008 0.013 0.041 0.071 0.026 0.146 0.159 0.140 0.333 0.007 0.036 0.024 0.008 0.003 0.017 0.008 0.018 0.038 0.004 0.005 0.005 0.169 0.011 0.028 0.007 0.104 0.019 0.007
29 Nursing 0.000 0.001 0.000 0.000 0.000 0.002 0.040 0.001 0.000 0.002 0.003 0.001 0.009 0.005 0.003 0.012 0.000 0.003 0.000 0.000 0.000 0.001 0.000 0.001 0.000 0.000 0.000 0.000 0.002 0.000 0.000 0.000 0.008 0.001 0.001
30 Pharmacology, Toxicology and Pharmaceutics 0.008 0.007 0.008 0.005 0.014 0.024 0.041 0.007 0.007 0.053 0.089 0.007 0.071 0.339 0.181 0.462 0.068 0.128 0.046 0.013 0.007 0.034 0.021 0.017 0.031 0.008 0.006 0.008 0.050 0.011 0.009 0.003 0.048 0.015 0.005
31 Physics and Astronomy 1.393 0.627 0.344 0.334 0.708 0.308 0.094 1.836 1.753 0.886 0.933 0.364 0.474 0.213 0.128 0.130 0.225 0.087 0.565 0.846 1.324 1.419 0.621 0.653 0.179 0.575 0.826 0.355 0.316 0.437 0.367 0.125 0.198 0.394 0.174
32 Psychology 0.001 0.001 0.000 0.000 0.000 0.006 0.019 0.000 0.001 0.003 0.004 0.008 0.012 0.005 0.005 0.010 0.000 0.001 0.001 0.000 0.001 0.000 0.001 0.001 0.006 0.001 0.003 0.000 0.002 0.006 0.001 0.006 0.004 0.003 0.000
33 Social Sciences 0.002 0.007 0.020 0.022 0.009 0.026 0.052 0.002 0.009 0.008 0.004 0.040 0.007 0.002 0.004 0.003 0.001 0.002 0.001 0.001 0.001 0.003 0.003 0.006 0.018 0.001 0.002 0.002 0.002 0.007 0.006 0.014 0.015 0.017 0.018
34 Veterinary 0.001 0.001 0.001 0.000 0.000 0.001 0.000 0.001 0.000 0.006 0.010 0.001 0.008 0.015 0.040 0.036 0.001 0.042 0.007 0.001 0.000 0.003 0.000 0.009 0.000 0.002 0.000 0.001 0.014 0.000 0.000 0.000 0.019 0.001 0.000
35 Dentistry 0.002 0.001 0.001 0.001 0.000 0.001 0.001 0.003 0.001 0.004 0.005 0.006 0.127 0.023 0.024 0.047 0.009 0.000 0.000 0.007 0.002 0.001 0.001 0.001 0.001 0.000 0.001 0.000 0.007 0.010 0.001 0.002 0.018 0.008 0.000
36 Health Professions 0.002 0.002 0.001 0.001 0.000 0.006 0.025 0.002 0.002 0.005 0.006 0.006 0.050 0.021 0.010 0.025 0.002 0.002 0.009 0.001 0.001 0.002 0.002 0.011 0.007 0.001 0.013 0.000 0.005 0.004 0.003 0.002 0.026 0.003 0.001
Technology Class (WIPO)Science Field (ASJC)

34
Table 6c: Avg. Number of Publications per Patent of Academic Inventors by Science Field and Technology Class (2008-2011)
Source: Authors’ calculations based on Scopus and the IIP Patent Database
Elec
trica
l mac
hine
ry,
appa
ratu
s, en
ergy
Aud
io-v
isual
tech
nolo
gy
Tele
com
mun
icat
ions
Dig
ital c
omm
unic
atio
n
Basic
com
mun
icat
ion
proc
esse
s
Com
pute
r tec
hnol
ogy
IT m
etho
ds fo
rm
anag
emen
t
Sem
icon
duct
ors
Opt
ics
Mea
sure
men
t
Ana
lysis
of b
iolo
gica
lm
ater
ials
Cont
rol
Med
ical
tech
nolo
gy
Org
anic
fine
che
mist
ry
Biot
echn
olog
y
Phar
mac
eutic
als
Mac
rom
olec
ular
chem
istry
, pol
ymer
s
Food
che
mist
ry
Basic
mat
eria
lsch
emist
ry
Mat
eria
ls, m
etal
lurg
y
Surf
ace
tech
nolo
gy,
coat
ing
Mic
ro-s
truct
ural
and
nano
-tech
nolo
gy
Chem
ical
eng
inee
ring
Envi
ronm
enta
lte
chno
logy
Han
dlin
g
Mac
hine
tool
s
Engi
nes,
pum
ps,
turb
ines
Text
ile a
nd p
aper
mac
hine
s
Oth
er sp
ecia
l mac
hine
s
Ther
mal
pro
cess
es a
ndap
para
tus
Mec
hani
cal e
lem
ents
Tran
spor
t
Furn
iture
, gam
es
Oth
er c
onsu
mer
goo
ds
Civi
l eng
inee
ring
1 2 3 4 5 6 7 8 9 10 11 12 13 14 15 16 17 18 19 20 21 22 23 24 25 26 27 28 29 30 31 32 33 34 3510 Multidisciplinary 0.004 0.008 0.003 0.001 0.010 0.013 0.016 0.020 0.011 0.025 0.043 0.005 0.018 0.040 0.089 0.061 0.013 0.034 0.022 0.014 0.014 0.022 0.009 0.027 0.007 0.011 0.018 0.006 0.043 0.008 0.011 0.008 0.003 0.002 0.003
11 Agricultural and Biological Sciences 0.017 0.007 0.006 0.006 0.010 0.028 0.042 0.007 0.013 0.066 0.119 0.011 0.036 0.124 0.423 0.204 0.039 1.290 0.255 0.021 0.021 0.017 0.043 0.137 0.022 0.043 0.031 0.039 0.520 0.044 0.020 0.026 0.022 0.013 0.113
12 Arts and Humanities 0.000 0.009 0.005 0.003 0.003 0.040 0.008 0.000 0.001 0.001 0.001 0.004 0.002 0.001 0.001 0.002 0.001 0.000 0.000 0.001 0.001 0.003 0.001 0.001 0.005 0.002 0.000 0.002 0.000 0.000 0.000 0.003 0.000 0.015 0.000
13 Biochemistry, Genetics and Molecular Biology 0.077 0.040 0.031 0.028 0.066 0.161 0.319 0.063 0.072 0.432 0.843 0.117 0.549 1.079 1.951 1.804 0.191 0.851 0.273 0.093 0.110 0.148 0.165 0.195 0.102 0.073 0.091 0.142 0.567 0.074 0.059 0.048 0.144 0.183 0.030
14 Business, Management and Accounting 0.001 0.002 0.002 0.008 0.000 0.013 0.026 0.001 0.002 0.002 0.003 0.022 0.003 0.002 0.004 0.004 0.001 0.009 0.002 0.001 0.001 0.001 0.002 0.001 0.002 0.004 0.001 0.002 0.003 0.001 0.000 0.001 0.003 0.001 0.002
15 Chemical Engineering 0.123 0.021 0.007 0.005 0.020 0.026 0.012 0.067 0.042 0.115 0.170 0.085 0.118 0.268 0.164 0.105 0.225 0.104 0.223 0.205 0.131 0.224 0.449 0.234 0.031 0.049 0.100 0.152 0.128 0.245 0.108 0.028 0.052 0.038 0.029
16 Chemistry 0.382 0.059 0.016 0.021 0.048 0.036 0.049 0.233 0.173 0.305 0.554 0.059 0.110 1.034 0.310 0.355 0.778 0.231 0.564 0.511 0.435 0.728 0.734 0.297 0.038 0.118 0.170 0.250 0.270 0.169 0.073 0.016 0.131 0.075 0.033
17 Computer Science 0.140 0.425 0.708 0.954 0.840 1.546 1.151 0.133 0.251 0.360 0.119 1.321 0.459 0.031 0.065 0.040 0.043 0.046 0.093 0.043 0.056 0.206 0.078 0.050 1.675 0.100 0.133 0.049 0.060 0.159 0.493 0.295 0.919 0.473 0.168
18 Decision Sciences 0.001 0.002 0.002 0.008 0.007 0.017 0.025 0.001 0.000 0.003 0.000 0.029 0.001 0.000 0.001 0.000 0.000 0.000 0.001 0.001 0.000 0.000 0.001 0.000 0.002 0.003 0.000 0.000 0.000 0.001 0.001 0.002 0.000 0.001 0.002
19 Earth and Planetary Sciences 0.012 0.006 0.009 0.007 0.010 0.025 0.038 0.016 0.033 0.109 0.081 0.016 0.021 0.008 0.020 0.008 0.006 0.008 0.042 0.044 0.013 0.008 0.038 0.158 0.016 0.056 0.083 0.002 0.026 0.066 0.067 0.126 0.026 0.000 0.222
20 Economics, Econometrics and Finance 0.000 0.000 0.000 0.001 0.000 0.002 0.017 0.001 0.001 0.000 0.000 0.003 0.001 0.000 0.001 0.000 0.000 0.001 0.000 0.001 0.001 0.000 0.001 0.001 0.000 0.000 0.000 0.000 0.001 0.001 0.001 0.000 0.000 0.000 0.000
21 Energy 0.241 0.010 0.005 0.005 0.050 0.015 0.052 0.053 0.013 0.067 0.066 0.057 0.017 0.026 0.024 0.009 0.027 0.012 0.128 0.139 0.072 0.046 0.149 0.156 0.024 0.040 0.440 0.030 0.030 0.269 0.108 0.101 0.025 0.006 0.058
22 Engineering 0.915 0.575 0.801 0.608 1.588 0.692 0.498 1.122 0.775 1.043 0.725 1.310 0.792 0.145 0.234 0.195 0.218 0.138 0.425 0.793 0.716 1.287 0.539 0.414 1.401 1.349 0.819 0.305 0.393 0.781 1.652 1.179 1.030 0.688 0.981
23 Environmental Science 0.023 0.004 0.004 0.003 0.006 0.009 0.065 0.007 0.009 0.042 0.060 0.014 0.023 0.042 0.067 0.033 0.039 0.066 0.064 0.044 0.018 0.023 0.098 0.286 0.009 0.026 0.097 0.022 0.101 0.291 0.046 0.019 0.008 0.025 0.107
24 Immunology and Microbiology 0.010 0.008 0.009 0.004 0.005 0.013 0.034 0.009 0.004 0.057 0.110 0.012 0.052 0.179 0.450 0.392 0.024 0.172 0.044 0.010 0.009 0.002 0.016 0.084 0.003 0.006 0.004 0.009 0.125 0.012 0.016 0.004 0.006 0.020 0.002
25 Materials Science 0.577 0.236 0.163 0.069 0.339 0.081 0.036 0.798 0.510 0.412 0.487 0.103 0.412 0.269 0.178 0.191 0.829 0.122 0.625 1.198 0.848 0.861 0.540 0.304 0.102 0.905 0.346 0.491 0.452 0.281 0.403 0.164 0.126 0.188 0.115
26 Mathematics 0.026 0.056 0.073 0.125 0.131 0.213 0.341 0.023 0.041 0.070 0.042 0.281 0.070 0.010 0.024 0.010 0.017 0.009 0.013 0.018 0.012 0.039 0.022 0.029 0.112 0.032 0.037 0.006 0.018 0.039 0.089 0.056 0.127 0.037 0.022
27 Medicine 0.083 0.072 0.066 0.044 0.068 0.203 1.425 0.099 0.084 0.664 1.247 0.277 1.990 1.147 1.791 2.590 0.106 0.349 0.140 0.075 0.109 0.073 0.100 0.272 0.094 0.066 0.141 0.137 0.512 0.053 0.117 0.075 0.379 0.392 0.054
28 Neuroscience 0.010 0.013 0.005 0.004 0.017 0.053 0.071 0.008 0.015 0.052 0.099 0.046 0.170 0.154 0.150 0.285 0.009 0.017 0.009 0.004 0.003 0.003 0.012 0.022 0.016 0.002 0.020 0.007 0.075 0.004 0.005 0.018 0.038 0.062 0.002
29 Nursing 0.000 0.001 0.000 0.000 0.001 0.001 0.024 0.001 0.000 0.005 0.008 0.012 0.021 0.016 0.013 0.037 0.001 0.010 0.002 0.001 0.001 0.000 0.001 0.002 0.000 0.000 0.000 0.000 0.005 0.002 0.000 0.001 0.021 0.006 0.000
30 Pharmacology, Toxicology and Pharmaceutics 0.012 0.006 0.008 0.002 0.013 0.022 0.077 0.010 0.010 0.063 0.123 0.019 0.087 0.441 0.227 0.646 0.049 0.102 0.045 0.015 0.014 0.041 0.041 0.027 0.012 0.006 0.015 0.013 0.057 0.016 0.005 0.008 0.011 0.010 0.004
31 Physics and Astronomy 0.784 0.624 0.384 0.193 0.753 0.241 0.104 1.826 1.469 0.841 0.895 0.274 0.516 0.167 0.220 0.159 0.277 0.104 0.625 1.045 1.162 1.213 0.786 1.191 0.141 0.702 1.245 0.245 0.389 0.512 1.080 0.220 0.123 0.640 0.152
32 Psychology 0.001 0.003 0.002 0.002 0.000 0.004 0.034 0.001 0.001 0.003 0.005 0.022 0.012 0.005 0.005 0.008 0.000 0.000 0.001 0.001 0.000 0.000 0.001 0.001 0.002 0.000 0.002 0.000 0.001 0.000 0.001 0.010 0.026 0.012 0.000
33 Social Sciences 0.005 0.019 0.069 0.050 0.025 0.058 0.060 0.006 0.028 0.020 0.009 0.064 0.017 0.005 0.005 0.007 0.002 0.003 0.001 0.002 0.003 0.006 0.002 0.006 0.028 0.003 0.006 0.005 0.004 0.022 0.015 0.013 0.006 0.030 0.016
34 Veterinary 0.001 0.001 0.001 0.000 0.000 0.003 0.002 0.002 0.000 0.009 0.019 0.001 0.013 0.030 0.045 0.072 0.004 0.035 0.007 0.002 0.001 0.000 0.003 0.002 0.000 0.004 0.000 0.012 0.018 0.000 0.003 0.000 0.000 0.012 0.000
35 Dentistry 0.001 0.002 0.001 0.001 0.000 0.001 0.013 0.002 0.002 0.004 0.009 0.009 0.111 0.028 0.034 0.074 0.005 0.001 0.001 0.010 0.002 0.004 0.001 0.003 0.000 0.000 0.001 0.002 0.003 0.001 0.009 0.000 0.015 0.008 0.006
36 Health Professions 0.002 0.005 0.002 0.002 0.002 0.015 0.022 0.001 0.001 0.006 0.007 0.011 0.058 0.006 0.008 0.013 0.001 0.004 0.001 0.001 0.001 0.003 0.002 0.023 0.005 0.002 0.007 0.005 0.009 0.000 0.005 0.006 0.068 0.021 0.001
Technology Class (WIPO)Science Field (ASJC)

Figure 4: Science-Industry Relations in Patents
0.0%
0.5%
1.0%
1.5%
2.0%
2.5%
3.0%
2000-2003 2004-2007 2008-2011
% patents jointly inventedwith academia
% patents citing academicpatents (applied in currentperiod)
% inventors in allemployees

Figure 5: Inventor-based Science Intensity (SIINV) in Total Economy (Avg. number of linked academic publications per 100 inventors)
Figure 6: Employee-based Science Intensity (SIEMP) in Total Economy (Avg. number of linked academic publications per 100 employees)
97
169 191 11
21 19
31
59 39
140
249 249
0
50
100
150
200
250
300
2000-2003 2004-2007 2008-2011
via Patent Citation only(EACH period)via Joint Invention & PatentCitationvia Joint Invention only
1.5
2.4 2.3
0.2
0.30.2
0.5
0.8
0.52.1
3.6
3.0
0.0
0.5
1.0
1.5
2.0
2.5
3.0
3.5
4.0
2000-2003 2004-2007 2008-2011
via Patent Citation only(EACH period)via Joint Invention & PatentCitationvia Joint Invention only

Figure 7: Employee-based Science Intensity (SIEMP) by Industry (Avg. number of linked academic publications per 100 employees)
0
10
20
30
40
50
60 2000-2003 2004-2008 2008-2011

Figure 8: Utilization Rate of Science Knowledge (URSK) (Share of academic publications linked to industry)
Figure 9: Utilization Rate of Science Knowledge (URSK) by the Science Field
(Share of academic publications linked to industry)
5.9%8.1% 8.2%
3.3%
4.7% 3.4%0.4%
0.6%
0.4%
9.5%
13.4%12.1%
0.0%
2.0%
4.0%
6.0%
8.0%
10.0%
12.0%
14.0%
16.0%
2000-2003 2004-2007 2008-2011
via Patent Citation only (EACHperiod)via Joint Invention & PatentCitationvia Joint Invention only
0%
5%
10%
15%
20%
25%
30% 2000-2003 2004-2008 2008-2011

Figure 10: Comparison with NPL based indicators

Table A1-1: Definition of Similarity Profile
Source: Authors.
Table A1-2. Modifications of Disambiguation Algorithm of Li et al. (2014)
Li et al. (2014) Our method
Inventor name: First name, middle name,and last name are distinguished
Do not distinguish first and last name
Technology class: US class IPCBlocking rule 7 steps 1 step: Exact match of inventor name
2 types: 1 type:
1. Pairs of matched inventor full names, defined as rare with respect to all inventor names. (Rare names are extracted from patent inventors)
Pairs of matched inventor full names,defined as rare with respect to allinventor names. (Rare names are extractedfrom the telephone directory)
2. Pairs sharing 2 or more common coauthors and technology classes
Attributes
Training sets
Source: Authors.
Attributes Values1 if names are completely same.0 otherwise.
Co-inventors’ names ( ) Number of common co-inventors, where more than 6 common co-inventors isset to a maximum value of 6.
4 if main IPCs are same at 4 digit level.3 if main IPCs are same at 3 digit level.2 if main IPCs are same at 1 digit level.1 if main IPCs are not available.0 if main IPCs are completely different.3 if applicant identification numbers are equal.2 if applicant names are same.1 if either applicant identification number or applicant name are not available.0 if both applicant identification numbers and names are different.5 if matched at land number extension (go-level).4 if matched at land number (banchi-level).3 if matched at city block (chimei-level).2 if matched at municipality-level.1 if matched at prefecture-level.0 otherwise.
Inventor name ( )
Technology class ( )
Applicant ( )
Address ( )
𝑥𝑥1
𝑥𝑥2
𝑥𝑥3
𝑥𝑥4
𝑥𝑥5

Table A2: Complete Results of the Linking Procedure (Patent Application Period: 1964-2013)
Source: Authors’ calculations based on the IIP patent database, the Establishment and Enterprise Census of Japan, and the Economic Census of Japan.

Figure A2: Temporal Performance of the Linking Procedure: Firms
(a) For Applications between 1995 and 2013
(b) For the Full Application Period (1964-2013)
Source: Authors’ calculations based on the IIP patent database, the Establishment and Enterprise Census of Japan, and the Economic Census of Japan.
0.4
0.5
0.6
0.7
0.8
0.9
1
2001 2004 2006 2009 2012
0.4
0.5
0.6
0.7
0.8
0.9
1
1964
1966
1968
1970
1972
1974
1976
1978
1980
1982
1984
1986
1988
1990
1992
1994
1996
1998
2000
2002
2004
2006
2008
2010
2012
2001 2004 2006 2009 2012

Table A3. Sample Size Comparison
PATSTAT
All publications(1) Applicants
identified as firms
(2) JP Pub. withCorresponding
US patents
(3) CorrespondingUS patents
2000 415,323 336,976 28,239 32,3552001 415,043 335,936 27,159 31,0682002 400,676 320,521 27,557 31,5692003 395,780 311,454 28,672 32,3252004 402,884 313,361 31,100 34,1432005 401,433 302,688 30,839 33,5342006 372,849 281,975 32,055 34,2232007 354,268 269,182 31,949 33,4692008 346,554 264,113 30,529 32,2632009 312,686 232,138 27,285 28,4992010 300,912 222,778 24,891 25,5362011 298,557 210,848 16,825 17,159Total 4,416,965 3,401,970 337,100 366,143
Earliest priorityyear
Tamada DB
Source: Authors’ calculations based on the Tamada Database and the EPO PATSTAT.
Figure A3. Comparison of NPL Citations of JP and US Patents
Source: Authors’ calculations based on the Tamada Database and the EPO PATSTAT
0
2
4
6
8
10
12
14
16
1. E
lect
rical
mac
hine
ry2.
Aud
io-v
isua
l tec
hnol
ogy
3. T
elec
omm
unic
atio
ns4.
Dig
ital c
omm
unic
atio
n5.
Bas
ic c
omm
unic
atio
n pr
oces
ses
6. C
ompu
ter t
echn
olog
y7.
IT m
etho
ds fo
r man
agem
ent
8. S
emic
ondu
ctor
s9.
Opt
ics
10. M
easu
rem
ent
11. A
naly
sis o
f bio
logi
cal m
ater
ials
12. C
ontro
l13
. Med
ical
tech
nolo
gy14
. Org
anic
fine
che
mis
try15
. Bio
tech
nolo
gy16
. Pha
rmac
eutic
als
17. M
acro
mol
ecul
ar c
hem
istry
,…18
. Foo
d ch
emis
try19
. Bas
ic m
ater
ials
che
mis
try20
. Mat
eria
ls, m
etal
lurg
y21
. Sur
face
tech
nolo
gy, c
oatin
g22
. Mic
ro-s
truct
ural
and
nan
o-te
ch23
. Che
mic
al e
ngin
eerin
g24
. Env
ironm
enta
l tec
hnol
ogy
25. H
andl
ing
26. M
achi
ne to
ols
27. E
ngin
es, p
umps
, tur
bine
s28
. Tex
tile
and
pape
r mac
hine
s29
. Oth
er sp
ecia
l mac
hine
s30
. The
rmal
pro
cess
es a
nd a
ppar
atus
31. M
echa
nica
l ele
men
ts32
. Tra
nspo
rt33
. Fur
nitu
re, g
ames
34. O
ther
con
sum
er g
oods
35. C
ivil
engi
neer
ing
All
Average number of NPL citaions (priority year: 2000-2011)
US patents filed by JP firmsJP applications filed by JP firms
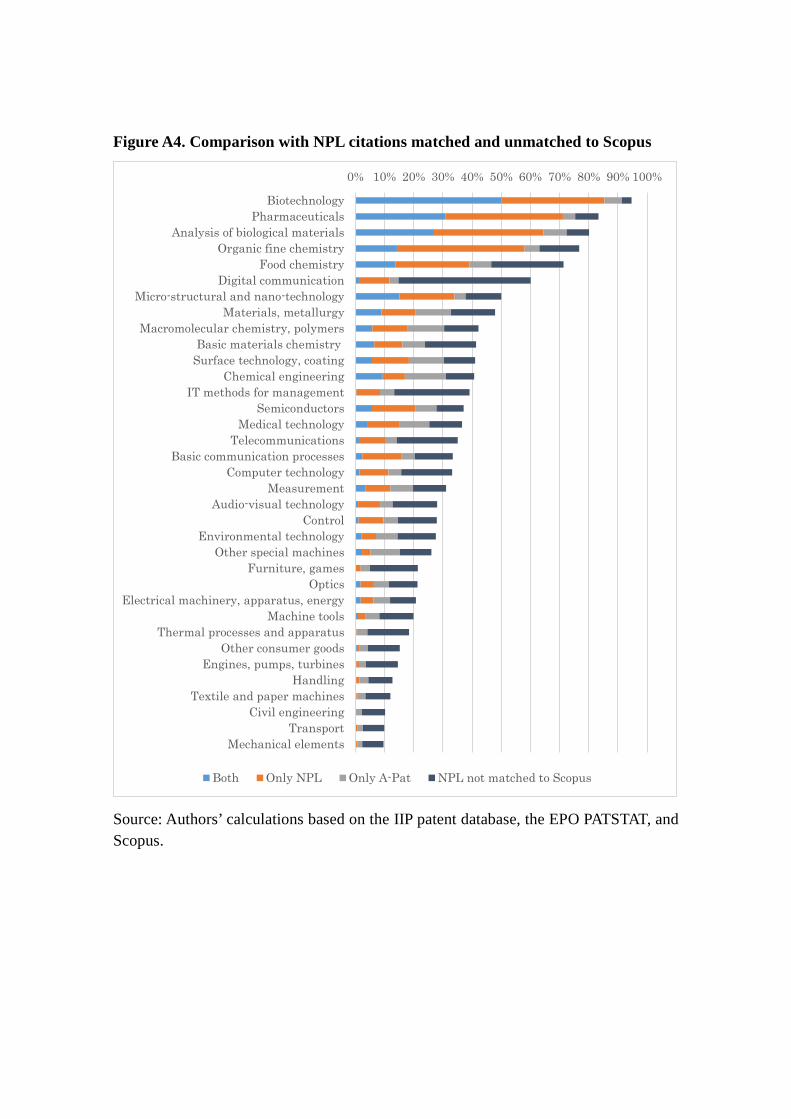
Figure A4. Comparison with NPL citations matched and unmatched to Scopus
Source: Authors’ calculations based on the IIP patent database, the EPO PATSTAT, and Scopus.
0% 10% 20% 30% 40% 50% 60% 70% 80% 90% 100%
BiotechnologyPharmaceuticals
Analysis of biological materialsOrganic fine chemistry
Food chemistryDigital communication
Micro-structural and nano-technologyMaterials, metallurgy
Macromolecular chemistry, polymersBasic materials chemistry
Surface technology, coatingChemical engineering
IT methods for managementSemiconductors
Medical technologyTelecommunications
Basic communication processesComputer technology
MeasurementAudio-visual technology
ControlEnvironmental technology
Other special machinesFurniture, games
OpticsElectrical machinery, apparatus, energy
Machine toolsThermal processes and apparatus
Other consumer goodsEngines, pumps, turbines
HandlingTextile and paper machines
Civil engineeringTransport
Mechanical elements
Both Only NPL Only A-Pat NPL not matched to Scopus