Measuring quality: SafeCare experience -...
38
1 Measuring quality: SafeCare experience Millicent Olulo Orera Program Director – SafeCare Kenya [email protected] www.safe-care-org Phiilipines, October 24, 2014
Transcript of Measuring quality: SafeCare experience -...

1
Measuring quality: SafeCare experience
Millicent Olulo OreraProgram Director – SafeCare [email protected], October 24, 2014

In resource-restricted settings...
ISQua-based accreditation systems such as implemented by COHSASA and JCI are difficult if not impossible to achieve
As a result, few facilities are accredited
Quality of care is unknown and benchmarking not possible
Often standards are lowered instead of having healthcare quality improved
The challenge The solution
A system for resource-restricted settings should:
Focus on progression
Be a specified, recognizable product, independently awarded
Be solutions-based with achievable goals
Have data widely available
Be sustainable

SafeCare, established 2011
Dutch NGO dedicated to strengthening health services in resource-restricted settings Netherlands
Council for Health Service Accreditation of South Africa, Accreditation body of Southern Africa South Africa
Accreditation body, Global leader in patient safety and quality with a presence in 90 countries worldwide USA
Organization Based in

International Society for Quality in Healthcare (ISQua),an international body that “accredits the accreditors”
ISQua
Who?
AccreditsWhat?
Accreditation bodies Service-specific external evaluation bodies (blood transfusion) Healthcare standards Surveyor training programs
Why? Confidence and credibility Impartial and independent review system

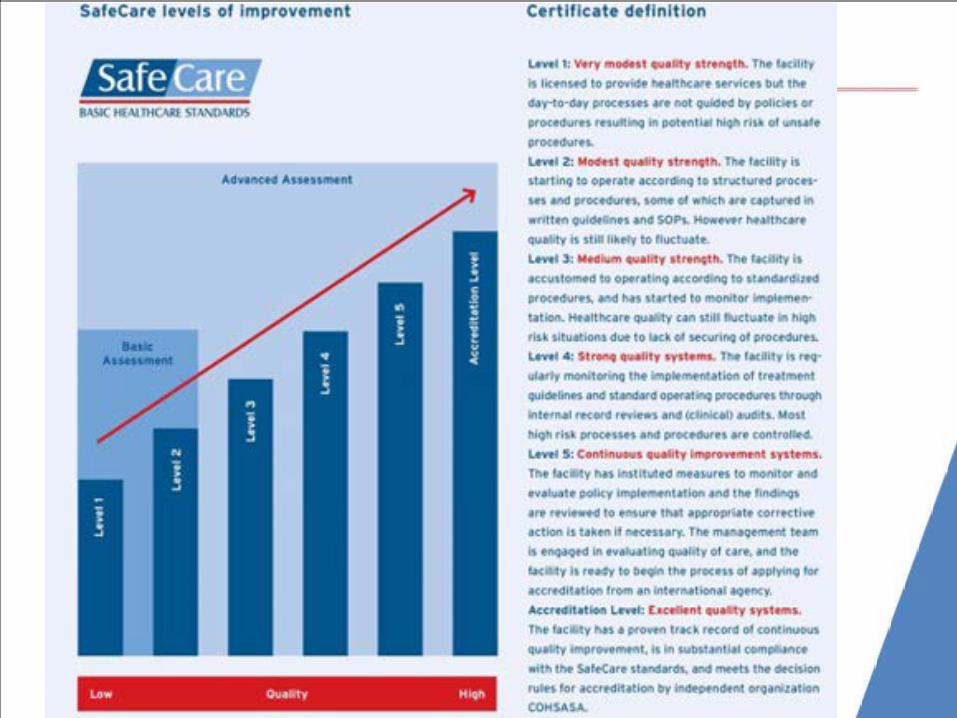
Principles
Innovative & realistic
Step-wise approach
Certificates
Local capacity
Innovative and realistic standards for healthcare providersin resource-restricted settings. ISQUa approved
Step-wise improvement process that can be measuredand used by governments, donors, health insurers,(social) investors, and banks
Improvements rewarded with certificates
Build local capacity and a sustainable model
1
2
3
4

Principles (cont’d)
Practical & achievable
Scale & scope
Priorities first
Quality is not necessarily high-tech or high-cost.SafeCare allows for realistic, practical andachievable solutions
Facility level determines scale & scope
Standards are designed to address priorities
5
6
7

SafeCare standards
Management and Leadership
Human Resource Management
Patient & Family Rights & Access to Care
Management of Information
Risk Management
Man
agem
ent
Clinical
Clin
ical
Sup
port Technology
In-patient Care
Operating Theater & Anesthetics
Primary Healthcare
Laboratory
Diagnostic Imaging
Medication Management
Support
Facility Management
Scale & scope determined by facility level

Standards for healthcare facilities
• are written statements
• that define the key functions, activities, processes and structures required for organisations to be in a position to provide quality services
• as determined by professional bodies, health care professionals, staff, patients and citizens.

Measuring the compliance of standards
Criteria are measurable elements that define the specific requirements needed, to ensure that the intention of the standards is met.Each criterion is evaluated separately.
The weighted average of criteria compliance indicates the level of standard compliance.
Standard
Criteria
Criteria
Criteria
Criteria
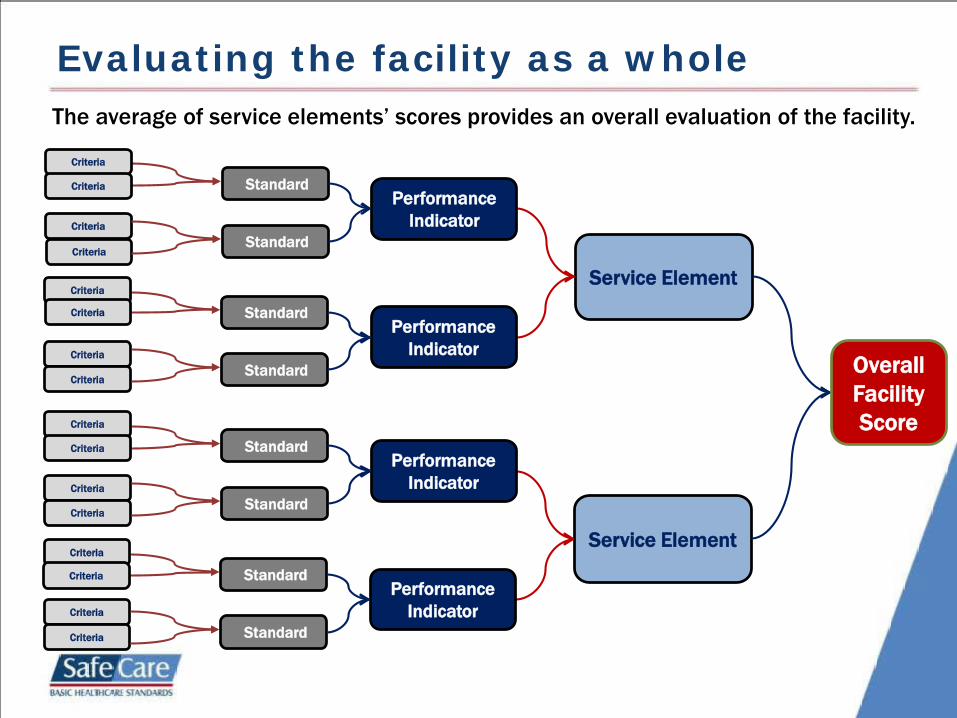
Evaluating the facility as a wholeThe average of service elements’ scores provides an overall evaluation of the facility.
Service Element
Service Element
StandardCriteria
Criteria
Criteria
CriteriaStandard
StandardCriteria
Criteria
Criteria
CriteriaStandard
StandardCriteria
Criteria
Criteria
CriteriaStandard
StandardCriteria
Criteria
Criteria
Criteria Standard
Performance Indicator
Performance Indicator
Performance Indicator
Performance Indicator
Overall Facility Score

6. Primary health care services6.1 Organisation and co-ordination
6.1.1 The service is organised to provide a safe and effective service and is co-ordinated with other relevant services in the referral hospital and in the community.
6.1.1 Criteria 6.1.1.1 The lines of communication between the health facility, referral hospital
and community services are clearly defined. 6.1.1.2 Relations are established, and contact is maintained with other relevant
services and agencies, including both governmental and non-governmental agencies.
6.1.1.3 An on-call roster is available for after hour, weekend and holidays
emergency coverage (e.g. for infectious diseases). 6.1.1.4 Arrangements are in place to ensure that adequate referral services are
available. 6.1.1.5 Radiology services are available for the level of care provided. 6.1.1.6 Laboratory services are available for the level of care provided. 6.1.1.7 Ultrasound services are available for the level of care provided.
6.1.1.8 There is an organised process for referring patients. 6.2 Facilities and equipment 6.2.1 The required furniture and equipment are available and
functioning appropriately.
PI
Standard
Criteria
Service Element
These we
score

Example standard

Assessing compliance with standards
DOCUMENTATION REVIEW
Preparation at facility
Organisational:documents:
Patient record audits!!

Observation
- Vigilant attentiveness Paying close and continuous attention
- Objectivity
- ValidationProtocols versus practice

Methods of assessment
INTERVIEWS

Triangulation
Team Work !

Services offered
Stepwise improvement
Baseline assessments
Assisted self-assessments
Data collection and reporting
External evaluation visits
Research on evidence-basedquality-improvement programs
SafeCare branding
Technical assistance
Training of local assessors
Quality control of local systems & data
Consultancy with respect to existing quality-improvement methodologies
Different branding
Certification Consultancy

Change is the Only Constant
“Change is disturbing when it is done to us. Change is exhilarating when it is done by us.” - Rosebeth Kantor

Rewarded by certificates
•Improvements rewarded with certificates
•Motivates clinics and staff
•Benchmarking of facilities
• Transparency for patients

Annual cycles of improvement and recognition

Focus
Plan-the process of improvement
Do the improvement, data collection & analysis
Check (results & lessons learnt)
Act (adopt, adjust, change)
The “Cycle”

Identification of priority areas

What is important in the SC report?• Which departments score lower than others?• Which criteria are critical and score NC?• Which criteria are severe and score NC?
These are your main priorities!

Example of a QIPGood hope medical clinicFebruary 2014 – January 2015

Information management
Before After

Before and after

Improved theatre services Innovative soap taps
Financing quality improvement

AfriDB: data collection & analysis
Preliminary reports are available within
30 minutes of submitting data

Measuring compliance with standards
0%
10%
20%
30%
40%
50%
60%
70%
80%
90%
100%
Antenatalguidelines
Referralcomplicatedpregnancies
Trained BirthAttendant
Oral Rehydration
Visit 1 Visit 2 Visit 3Visit 1:
N=730
Visit 2: N=88Visit 3: N=24

Measuring compliance with standards
0%
10%
20%
30%
40%
50%
60%
70%
80%
90%
100%
Diarrhoealguidelines
Hand washingfacilities
Wastemanagement
ARTadministration
guidelines
Visit 1 Visit 2 Visit 3Visit 1:
N=730
Visit 2: N=88Visit 3: N=24

SafeCare rolled out in NHIF Network
Launched on 25th June 2013

Building local capacity reduces costs and creates ownership

Benchmarking of clinics
0
50
100
150
200
250
300
0-10 11-20 21-30 31-40 41-50 51-60 61-70 71-80 81-90 91-100
Num
ber o
f Clin
ics
Percent
Clinic distributionSC1 SC2 SC3

Benchmarking of facilities
0
25
50
75
100
Perc
ent
All countriesAverage % Low Score High Score

35
17
29
17 19
2934 32
2130 31 28
21
70
6051
4335
7470
47
7276
6861
7573 73
89
50
68
9286 90
7781 80
85
74
Safe
Care
sco
re
Service element
Best Practice – Hospital X1 - Dec 2011 2 - Oct 2012 3 - Apr 2014

Impact: Business & Output improvements
Preliminary data analysis of 150 clinics which had a baseline survey and a post-loan disbursement survey average
increase# OF PATIENT VISITS 22%
AV. ANNUAL PATIENT VISIT INCREASE IN # 512
ADDITIONAL REVENUES PER YEAR PER FACILITY IN $ 5,146
HIV/AIDS # OF HIV TESTS44%
MOTHER & CHILD CARE# ULTRASOUND SCANS
64%
# OF LAB TESTS 42%
# MALARIA TESTS 46%
# MALE CONDOMS DISTRIBUTED 50%
# FAMILY PLANNING SESSIONS 42%
LAB TESTS
BUSINESS
REPRODUCTIVE HEALTH