Measuring Mood: Considerations and Innovations for ... · Common Tools for Measuring Mood in...
50
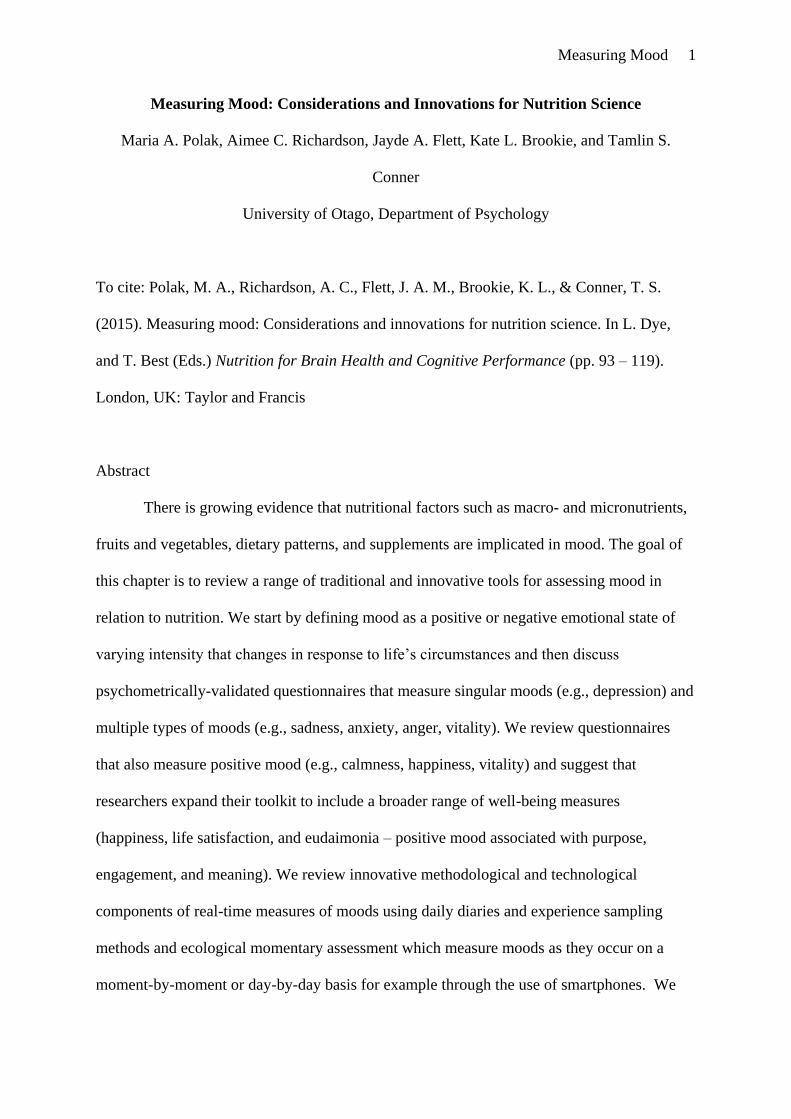
Measuring Mood 1 Measuring Mood: Considerations and Innovations for Nutrition Science Maria A. Polak, Aimee C. Richardson, Jayde A. Flett, Kate L. Brookie, and Tamlin S. Conner University of Otago, Department of Psychology To cite: Polak, M. A., Richardson, A. C., Flett, J. A. M., Brookie, K. L., & Conner, T. S. (2015). Measuring mood: Considerations and innovations for nutrition science. In L. Dye, and T. Best (Eds.) Nutrition for Brain Health and Cognitive Performance (pp. 93 – 119). London, UK: Taylor and Francis Abstract There is growing evidence that nutritional factors such as macro- and micronutrients, fruits and vegetables, dietary patterns, and supplements are implicated in mood. The goal of this chapter is to review a range of traditional and innovative tools for assessing mood in relation to nutrition. We start by defining mood as a positive or negative emotional state of varying intensity that changes in response to life’s circumstances and then discuss psychometrically-validated questionnaires that measure singular moods (e.g., depression) and multiple types of moods (e.g., sadness, anxiety, anger, vitality). We review questionnaires that also measure positive mood (e.g., calmness, happiness, vitality) and suggest that researchers expand their toolkit to include a broader range of well-being measures (happiness, life satisfaction, and eudaimonia – positive mood associated with purpose, engagement, and meaning). We review innovative methodological and technological components of real-time measures of moods using daily diaries and experience sampling methods and ecological momentary assessment which measure moods as they occur on a moment-by-moment or day-by-day basis for example through the use of smartphones. We
Transcript of Measuring Mood: Considerations and Innovations for ... · Common Tools for Measuring Mood in...
Measuring Mood 1
Measuring Mood: Considerations and Innovations for Nutrition Science
Maria A. Polak, Aimee C. Richardson, Jayde A. Flett, Kate L. Brookie, and Tamlin S.
Conner
University of Otago, Department of Psychology
To cite: Polak, M. A., Richardson, A. C., Flett, J. A. M., Brookie, K. L., & Conner, T. S.
(2015). Measuring mood: Considerations and innovations for nutrition science. In L. Dye,
and T. Best (Eds.) Nutrition for Brain Health and Cognitive Performance (pp. 93 – 119).
London, UK: Taylor and Francis
Abstract
There is growing evidence that nutritional factors such as macro- and micronutrients,
fruits and vegetables, dietary patterns, and supplements are implicated in mood. The goal of
this chapter is to review a range of traditional and innovative tools for assessing mood in
relation to nutrition. We start by defining mood as a positive or negative emotional state of
varying intensity that changes in response to life’s circumstances and then discuss
psychometrically-validated questionnaires that measure singular moods (e.g., depression) and
multiple types of moods (e.g., sadness, anxiety, anger, vitality). We review questionnaires
that also measure positive mood (e.g., calmness, happiness, vitality) and suggest that
researchers expand their toolkit to include a broader range of well-being measures
(happiness, life satisfaction, and eudaimonia – positive mood associated with purpose,
engagement, and meaning). We review innovative methodological and technological
components of real-time measures of moods using daily diaries and experience sampling
methods and ecological momentary assessment which measure moods as they occur on a
moment-by-moment or day-by-day basis for example through the use of smartphones. We

Measuring Mood 2
end by a recommendation to integrate more technologically advanced platforms and an
emphasis on incorporating a range of ambulatory methods and sampling strategies. These
real-time approaches mitigate memory biases that can occur when people reflect on their
mood over the last week or “in general” as with standard questionnaire timeframes. As
technology develops, real-time assessment will continue to offer an ecologically valid way of
assessing the food and mood connection as it occurs in daily life, giving us new perspectives.
Measuring Mood: Considerations and Innovations for Nutrition Science
There is growing research into the role of nutritional factors in mental health, and in
particular, the effect of diet on mood. A range of dietary factors have been linked to poorer
mood including traditional western diets, sodas, snacks, chocolate, lower fruit and vegetable
consumption (e.g., Rahe, Unrath & Bergers, 2014; Jacka et al., 2010) and certain
micronutrient deficits (e.g., Colangelo et al., 2014; Polak, Houghton, Reeder, Harper, &
Conner, 2014; Yi et al., 2011; also see Rucklidge & Kaplan, 2013 for a review). But what is
mood exactly? And, how can nutrition researchers measure it in a psychologically
sophisticated way using validated questionnaires? In this chapter, we define mood and review
a range of tools for measuring mood in nutrition research. We cover well-used self-report
questionnaires such as the Center for Epidemiological Depression Scale (CES-D, Radloff,
1977) and the Profile of Mood States questionnaire (POMS, McNair, Lorr, & Droppelman,
1971), and other tools commonly used in the nutrition literature (e.g., General Health
Questionnaire-12, GHQ-12; Goldberg & Williams, 1991; Positive and Negative Activation
Schedule, PANAS, Watson, Clark, & Tellegen, 1988). We discuss the strengths and
weaknesses of these well-used measures from a psychological perspective and suggest
additional tools to measure positive states of well-being, such as the Psychological Wellbeing
Scale (PWB, Ryff & Keyes, 1995), which are relatively under-utilized in nutrition research.
We then introduce novel ways of tracking mood in real time using ecological momentary

Measuring Mood 3
assessment or experience sampling methods on mobile phones and via internet surveys. Our
goal is to provide practical guidelines for choosing the right mood measure for the research
question to be addressed.
Defining Mood
In the field of psychology, mood refers to a positive or negative emotional state of
varying intensity that changes in response to life’s circumstances. Moods are often
undifferentiated, slower to change, and ‘object-less’ in that people may not know the cause or
source of the mood (Russell, 2003). For example, a person may feel “down” or “blue,” which
could last for days or even weeks in the case of depression, and a person may not know why
he or she feels this way. By contrast, emotion refers to an acute, specific feeling state felt in
response to an event (Russell, 2003). For example, a person might feel the rush of anger in
response to a challenging situation, but this feeling dissipates. Whereas emotion refers to
prototypical reactionary states such as anger, sadness, fear, disgust, happiness, or surprise,
moods often reflect feelings of valence (feeling good / bad) and activation (feeling sleepy /
awake) (Barrett & Russell, 1999). These two dimensions have been discovered through
principal components analysis of multiple mood reports, which have yielded a “circumplex”
reflecting four broad types of moods: positive high activation (enthusiastic, excited, cheerful),
positive low activation (calm, relaxed, peaceful), negative high activation (anxious, hostile,
stressed), and negative low activation (sad, depressed, dejected) as shown in Figure 1 (Barrett
& Russell, 1999).
A good way to think about mood measures is to understand which parts of the
circumplex they are capturing. Some questionnaires target specific quadrants in the
circumplex such as depression (representing a low activation negative mood) or vitality (a
high activation positive mood), whereas others target the broader dimensions of positive and
negative affect (PA/NA).

Measuring Mood 4
Figure 1. A circumplex model of mood reflecting differences in valence (positivity /
negativity) and activation (high energy / low energy). Adapted from Barrett and Russell,
1999.
Common Tools for Measuring Mood in Nutrition Science
In this section, we review several common mood measures used in nutrition research,
focusing on questionnaire measures of depression, anxiety, and multiple moods. We also
introduce measures of positive mood and psychological well-being that may provide good
counterpoint to the nearly exclusive focus on negative mood in nutrition research. For each
section, we give recommendations for the use of these measures.
Measuring Depression
One of the most popular measures of depressed mood is the 20-item Center for
Epidemiologic Studies - Depression Scale (CES-D; Radloff, 1977). The CES-D is made up of

Measuring Mood 5
20 items that are answered on a Likert scale from zero (“rarely or none of the time” i.e., less
than 1 day) to three (“most or all of the time” i.e., 5 to 7 days). Items are answered with
reference to the past week. Example items include “I thought my life had been a failure” and
“I had crying spells”. After reverse-scoring of four items (items 8, 12, 16, and 20) all items
are summed to give a total score within the range of zero to sixty. A cut-off score of ≥16 is
recommended to indicate those who are at risk of depression, although higher cut-off scores
of ≥19 (e.g., Yi et al., 2011) and ≥27 (e.g., Colangelo et al., 2014) have also been used.
However, this measure should not be used as a diagnostic tool per se. The CES-D was
designed for use in community populations and focuses largely on the affective symptoms of
depression. Nutrition research using the CES-D has reported associations between higher
depressive symptoms and higher selenium exposure (Colangelo et al., 2014), lower serum
ferritin levels (Yi et al., 2011), and lower vitamin D levels (Polak et al., 2014); and
associations between lower depressive symptoms and consumption of whole foods (Akbaraly
et al., 2009) and higher intake of fruit, vegetables, and fibre and lower intake of transfat
(Akbaraly, Sabia, Shipley, Batty, & Kivimaki, 2013). Furthermore, it has been found that
micronutrient supplementation (containing folic acid, iron, vitamin B12, and zinc) for 12
weeks results in decreases on the total CES-D score (Nguyen et al., 2009; see Rucklidge &
Kaplan, 2013 for a review).
The Beck Depression Inventory (BDI) on the other hand, was designed for use in
clinical populations to assess the severity of depression (original, Version II, and fast screen
for medical patients, Beck, Ward, Mendelson, Mock & Erbaugh, 1961; Beck, Steer, &
Brown, 1996; see also Richter, Werner, Heerlein, Kraus, & Sauer, 1998, for a review of its’
validity). The BDI-II (1996) is the most recent version of this measure; it contains 21-items
based on the Diagnostic and Statistical Manual of Mental Disorders criteria of Major
Depressive Disorder (4th
ed.; DSM-IV; American Psychiatric Association, 1994) although

Measuring Mood 6
there were no changes to the symptomatology of Major Depressive Disorder from DSM-IV
to DSM-5 (American Psychiatric Association, 2013). The BDI-II is completed with reference
to the past two weeks. Items are answered on a Likert Scale from zero to three. Example
items include “Self-criticalness” (0 = I don’t criticize or blame myself more than usual; 3 = I
blame myself for everything bad that happens) and “Worthlessness” (0 = I do not feel
worthless; 3 = I feel utterly worthless). Items are summed to give a total score, which is
interpreted as minimal depression (0-13), mild depression (14-19), moderate depression (20-
28), or severe depression (29-63). The BDI-II emphasizes the cognitive symptoms of
depression, unlike the CES-D which emphasizes more affective symptoms. Studies using
various versions of the BDI have reported associations between more depressive symptoms
and lower serum ferritin levels (Vahdat Shariatpanaahi, Vahdat Shariatpanaahi, Moshtaaghi,
Shahbaazi, & Abadi, 2007), and infrequent fish consumption (Tanskanen et al., 2001).
For research in specific populations such as the elderly or pregnant women, the
Geriatric Depression Scale and the Edinburgh Postnatal Depression Scale have been used
respectively. The Geriatric Depression Scale (GDS; Yesavage et al., 1983) contains 30 items
and is answered on a Yes/No scale. Items include “Do you feel pretty worthless the way you
are now?” and “Do you feel that your life is empty?”. Responses are summed and the total
score is then used to indicate likely depression, a cut-off score of ≥11 is recommended. The
GDS has been used to examine links between increased depressive symptoms and lower
selenium exposure (Gao et al., 2012; Johnson et al., 2013), and lower dietary intake of
vitamin A, riboflavin, vegetables, and fibre (Woo et al., 2006).
The Edinburgh Postnatal Depression Scale (EPDS; Cox, Holden & Sagovsky, 1987)
contains 10 items and is designed to screen for postpartum depression in women who have
recently given birth. As a screen for postpartum depression, the EPDS should be administered
within 8-weeks of giving birth; although it has also been validated as a major depression

Measuring Mood 7
screening tool during pregnancy (Murray & Cox, 1990). Items are answered with respect to
the past week; examples of the items include “I have blamed myself unnecessarily when
things went wrong” and “I have felt sad or miserable”. Responses are scored zero to three and
scores are then summed. However, the utility of the EPDS as a screening tool has been
criticised due to the wide variation in sensitivity and specificity (Gibson, McKenzie-McHarg,
Shakespeare, Price, & Gray, 2009). A cut-off score of 13 or more is recommended as
indicating probable postpartum depression (Cox et al., 1987; Matthey, Henshaw, Elliott, &
Barnett, 2006), whereas a cut-off score of 15 or more is recommended as indicating probable
antepartum depression (Murray & Cox, 1990). Researchers using the EPDS have reported
that selenium supplementation (Mokhber et al., 2011) and iron supplementation (Beard et al.,
2005) significantly reduced postpartum depression levels.
The Hospital Anxiety and Depression Scale (HADS; Zigmond & Snaith, 1983) was
designed as a screening tool for anxiety and depression in general medical outpatients. Given
that the measure was designed for those who are likely to have physical health complaints,
the authors tried to include items that did not assess somatic symptoms of anxiety or
depression. This measure contains 14 items that are answered on a Likert scale from zero to
three. Seven items assess depression and seven items assess anxiety. Example depression
items include “I felt cheerful” and "I look forward with enjoyment to things” (both reverse
scored). A cut-off score of eight on each subscale is recommended to indicate potential cases
of depression and anxiety (Bjelland, Dahl, Tangen Haug, & Neckelmann, 2002). Nutrition
research using the HADS has reported associations between higher depression symptoms and
lower magnesium intake (Jacka et al., 2009); and associations between lower depression
levels and a more healthful diet (vegetables, fruits, cereals, non-processed meats etc.; Jacka,
Mykletun, Berk, Bjelland, & Tell, 2011). HADS scores have also been shown to reduce
significantly following micronutrient supplementation (containing selenium, vitamin C, and
Measuring Mood 8
folate) for eight weeks (Gosney, Hammond, Shenkin, & Allsup, 2008; also see Rucklidge &
Kaplan, 2013 for a review).
Recommendation: Overall, for use in the general population, the CES-D or the
HADS are recommended. These measures were designed for use in non-clinical populations
and there is a large body of evidence supporting their use. Reviews of the observational
studies of dietary intake and depressive symptoms indicate that the CES-D appears to be the
most commonly used measure (Murakami & Sasaki, 2010; Lai et al., 2014). For clinical
populations, the BDI-II is recommended. The BDI-II allows for comparison of groups
according to depression severity (minimal, mild, moderate, and severe). However, the CES-D
and the BDI-II, all contain items assessing appetite, concentration, and sleep difficulties. In
populations where physical health conditions are common, or where nutritional deficiency is
likely to produce physical symptoms, the HADS is recommended as this scale contains less
somatically-laden items than the CES-D and the BDI-II. In elderly populations, the GDS is
recommended as the language is more straightforward and the response format is simpler
than other depression measures (Yes/No), although like the CES-D and the BDI-II, this
measure contains items assessing the somatic symptoms of depression (sleep, concentration,
and memory difficulties). For women who have recently given birth, the EPDS should be
used as it is specifically designed for this population (women within 8 weeks of birth). The
EPDS is also validated as a screening tool for depression in pregnant women.
Measuring Anxiety
The role of food in anxiety related mood is less established than the research on
depressed mood. However, anxiety has been measured in several nutrition-related research
areas, from experimental supplementation studies to cross-sectional population diet studies.
The most common anxiety-specific mood measure is the State Trait Anxiety Inventory
(STAI: Form Y; Spielberger, 1983). The STAI is a 40-item self-report scale that measures

Measuring Mood 9
both state (current feelings at this moment) and trait (general feelings of anxiety) factors of
anxiety. Example items from the state anxiety scale include “I am tense”, or “I am worried”,
whereas the trait anxiety subscale includes items such as “I worry too much over something
that really doesn’t matter”, or reverse-scored items such as “I am a steady person”. This
measure is well established in diagnostic and clinical settings, as well as medical and research
domains. Sound psychometric properties are reported including internal consistency
coefficients ranging between 0.86 and 0.95 (Spielberger, Gorsuch, Lushene, Vagg, & Jacobs,
1983). The STAI has been used in nutritional and herbal supplementation research including
a study that showed a reduction in anxiety in perimenopausal women with kava
supplementation (Cagnacci et al., 2003), and a reduction in state anxiety in individuals
following an essential amino acid - L-lysine and L-arginine supplement (Jezova, Makatsori,
Smriga, Morinaga, & Duncko, 2005). The STAI was also used in an observational study of
eating behaviours among high school students in an urban setting (Pastore, Fisher, &
Friedman, 1996). Although no differences in state or trait anxiety were found between normal
and overweight individuals, increased anxiety was associated with eating attitudes such as
dieting and food preoccupation (Pastore et al., 1996). The STAI state anxiety measure has
also been used to assess current levels of anxiety, concluding that the consumption of sweets
and meat were associated with higher current feelings of anxiety (Yannakoulia et al., 2008).
The Hamilton Anxiety Rating Scale (HAM-A: Hamilton, 1959) is a clinician-rated
instrument that is widely used in both clinical and research settings. This scale consists of 14
items measuring the severity of both psychological (mental agitation and psychological
distress) and somatic anxiety symptoms (physical anxiety complains; Hamilton, 1959). This
scale includes domains such as tension and worry, and clinicians make observations rated on
a scale of 0 (not present) to 4 (severe). Scores between 18 and 24 indicate mild to moderate
severity, whereas 25 to 30 indicate moderate to severe anxiety symptoms (Hamilton, 1959).
Measuring Mood 10
A reduction in anxiety as indicated by the HAM-A has been shown in a number of plant-
based supplement studies including: a four-week supplementation of Ginkgo biloba, an eight-
week supplementation of chamomile, and a number of kava supplementation trials (for
review see Sarris, McIntyre, & Camfield, 2013). While still commonly used, the HAM-A has
been criticized in terms of its ability to distinguish between depressant and anxiolytic
symptoms (Maier, Buller, Philipp, & Heuser, 1988), preventing it from being a measure of
choice when trying to compare anxiety and depression. Furthermore, it has found to be only
moderately associated with other strong predictors of anxiety such as the Beck Anxiety
Inventory (BAI; Beck & Steer, 1993). The BAI is a 21-item self-report inventory which
shows high internal consistency and test–retest reliability for measuring the severity of
anxiety in psychiatric populations. The BAI discriminates anxious diagnostic groups well
from non-anxious diagnostic groups (Beck, Epstein, Brown, & Steer, 1988), but has not been
used in nutrition research due to its focus on clinical populations.
Anxiety can also be measured with the Hospital Anxiety and Depression Scale
(HADS: Zigmond & Snaith, 1983). As outlined in the previous section, the HADS is a well-
established 14-item scale that has been widely used in medical outpatient and
epidemiological research studies. In addition to the seven items that assess depression, seven
items assess anxiety e.g., “I feel tense or wound up”, and, “I get sudden feelings of panic”
(Zigmond & Snaith, 1983). The responses are recorded to on a Likert scale from zero to
three. A cut-off score of 8 for anxiety provides specificity of 0.78 and sensitivity of 0.9
(Bjelland et al., 2002). In a cross-sectional study of middle age and elderly adults, a diet
characterized largely by fruits and vegetables, whole grains, fish and non-processed meat (a
‘traditional’ diet), was associated with reduced likelihood of HADS anxiety scores in
Norwegian women (Jacka et al., 2011). Conversely, a diet characterized by unhealthy and
processed foods (a ‘Western’ diet), was associated with a greater risk of anxiety for both men
Measuring Mood 11
and women, as indicated by increased scores on the HADS (Jacka et al., 2011). In a study of
adherence to a gluten free diet in a sample of individuals with Coeliac Disease (CD), a
greater difficulty of adherence was associated with greater anxiety as measured by the HADS
(Barrat, Leeds, & Sanders, 2011). Supplementation using a multivitamin (magnesium, zinc,
and calcium) showed a reduction in anxiety as measured by the HADS after 28-day
supplementation treatment (Carroll, Ring, Suter, & Willemsen, 2000). The HADS appears to
be a reliable measure, efficient for use in research simultaneously measuring anxiety and
depression symptomatology.
The General Health Questionnaire-12 (GHQ-12; Goldberg & Williams, 1991) is a
common, brief self-report screening instrument for common mental disorders, which is
widely used within general medical practice (Kalliath, O’Driscoll, & Brough, 2004). It is
comprised of common mental health domains of depression, anxiety, somatic symptoms, and
social withdrawal. The anxiety subscale includes items such as, “Have you been getting
scared and panicky for no good reason?”, and individuals respond using a Likert scale
ranging from zero to three (Goldberg & Williams, 1991). This measure has been translated
into over 38 different languages and its reliability coefficients have been reported between
0.78 and 0.95 (Jackson, 2007). While the GHQ-12 should not be used for predictive or
diagnostic purposes (Jackson, 2007), it provides adequate screening of those identified as ‘at
risk’ of developing psychological distress. In the current literature, the GHQ-12 has mainly
been used in cross-sectional studies of diet quality. It was found that consumption of
unhealthy Western diet patterns were generally associated with higher GHQ-12 scores,
whereas the consumption of a traditional diet was generally associated with lower GHQ-12
scores (Jacka et al., 2010). Furthermore, reduced GHQ-12 scores were found in a study of the
relationship between anxiety and polyunsaturated fatty acid (PUFA) intake and fish
consumption (Jacka et al., 2012b), as well as decreased red meat consumption (Jacka et al.,

Measuring Mood 12
2012a). However, these studies used the GHQ-12 to assess to common mental disorders
(anxiety and depression), reflecting an overall reduction in psychological distress, rather than
anxiety specifically. The studies mentioned above used the GHQ-12 in conjunction with a
‘gold standard’ diagnostic interview to assess for specific anxiety related disorders. It is not
recommended that the GHQ-12 be used in isolation to assess for anxiety in nutrition research,
due to its brevity and broad approach to general mental health.
Lastly, the Structured Clinical Interview for the Diagnostic and Statistical Manual for
Mental Disorders, Fourth Edition (Text Revised) (DSM-IV-TR), non-patient edition (SCID-
I/NP: First, Spitzer, Gibbon & Williams, 2002) is a semi-structured diagnostic interview,
considered a ‘gold standard’ assessment tool for anxiety (Sarris et al., 2013). It is the primary
diagnostic instrument in assessing for anxiety related disorders including: panic, agoraphobia,
social, specific, OCD, GAD, and anxiety due to substance or other medical disorder (First et
al., 2002). For these diagnoses, symptoms are identified as ‘present’, ‘sub threshold’, or
‘absent’. This instrument is reasonably time consuming and is designed to be administered by
a clinician or trained mental health specialist. However, it provides an indication of specific
anxiety diagnoses rather than the presence of general anxiety symptomatology, making it a
clinically relevant tool. The Structured Clinical Interview for DSM-5 is currently in the final
stages of publication A number of studies have found that a Western diet, characterized by
unhealthy and processed food (Jacka et al., 2010; 2011; 2012b), and decreased red meat
consumption in women (Jacka et al., 2012a) is associated with a higher prevalence of
diagnosed anxiety disorders.
A number of physiological measures of anxiety have been used in nutritional
research. Although these are not widely researched, they offer a promising route of objective
anxiety indicators. For example, a significant improvement in vagal heart rate control was
seen after a four week RCT of kava (Watkins, Connor, & Davidson, 2001). Similarly, an
Measuring Mood 13
RCT in healthy adults found that L-lysine supplementation over one week was associated
with decreased hormonal stress response, as indicated by lower levels of salivary cortisol
(Smriga et al., 2007).
Recommendation: Overall, for use in the general population, the STAI offers a
sound anxiety measure when looking at anxiety in isolation. This measure has been well used
in micronutrient supplement studies (Sarris et al., 2013; Lakhan & Vieira, 2010). This
measure may be more useful for pre- and post-intervention comparison, but holds little
predictive power in terms of diagnostic value. When research aims are clinically based, the
SCI-DSM-IV is considered the ‘gold standard’ for diagnosis, and provides not only an
indication of anxiety related symptomatology but can differentiate between types of anxiety
disorders. It does not provide a score which can be statistically compared pre and post
intervention; however, it can be used in research in combination with the STAI.
Measuring Multiple Aspects of Mood
Other questionnaires target multiple types of mood within the same questionnaire. For
example, the Profile of Mood States (POMS; McNair et al., 1971) is a 65-item rating scale
that yields a total mood index, plus a single index of positive mood (Vigor/Activity) and five
indices of negative mood (Tension/Anxiety, Depression/Dejection, Anger/Hostility,
Fatigue/Inertia, and Confusion/Bewilderment). Respondents use a unipolar scale to rate the
extent to which they are experiencing or have experienced 65 affect states in the past week
(e.g., sad, tense, angry, energetic, weary, confused) using a 5-point scale (0 = not at all, 4 =
extremely). There are several other versions of the POMS including the revised POMS 2 that
adds an additional scale (Friendliness) (Heuchert, & McNair, 2004), the youth version for
adolescents ages 13 – 17 (POMS 2-Y), and also several shortened versions. The POMS,
POMS 2 and their shortened variants are good measures because they capture a range of
different negative moods and they include a measure of positive mood through the vigor
Measuring Mood 14
subscale (Vigor items: lively, active, energetic, cheerful, alert, full of pep, carefree, vigorous).
However, the vigor subscale only measures higher activation positive mood, not lower
activation positive mood, which be limiting if a nutritional intervention was designed to
promote calmness. Nevertheless, growing evidence suggests that good nutrition may be
associated with high activation positive mood states. Recent interventions studies have shown
that fruit consumption and iron consumption increased scores on the Vigor subscale of the
POMS (fruit, Carr, Bozonet, Pullar, & Vissers, 2013; iron McClung et al., 2009). Research
using the POMS-Bipolar form (POMS-BI) has reported that selenium supplementation
resulted in increased mood scores on four of the six subscales (Benton & Cook, 1991).
Another popular mood measure is the PANAS – the Positive and Negative Activation
Schedule (previously called the Positive and Negative Affect Schedule; Watson et al., 1988).
The PANAS is a 20-item scale that is commonly used to obtain separate measures of positive
affect (PA) and negative affect (NA); however, in truth, this questionnaires yields measures
of high positive activation and negative activation because all of the items capture high
activation states e.g., attentive, interested, alert, enthusiastic, excited, inspired, proud,
determined, strong, and active for PA and distressed, upset, hostile, irritable, scared, afraid,
ashamed, guilty, nervous, and jittery for NA. There is also a shortened 10-item version of the
PANAS that contains five items for PA and five items for NA (Mackinnon et al., 1999).
Although this measure is very popular, researchers should be cautious when using it because
neither the 20-item nor 10-item PANAS captures lower activation feelings of calmness,
happiness or sadness. An extended version, the PANAS-X, is a 60-item scale available to
measure more discrete feelings including some, but not all, lower level activation states
(sadness, serenity, fatigue) in addition to the broader positive and negative activation states
(Watson & Clark, 1994). The 20-item version of the PANAS has been used to examine links
between mood and folate status (Williams et al., 2008), and zinc status (McConville et al.,
Measuring Mood 15
2005). The 10-item version of the PANAS has been used in research to demonstrate a link
between a diet rich in Mediterranean foods (e.g., fruit, vegetables, whole grains) and higher
PA and lower NA (Ford, Jaceldo-Siegl, Lee, Youngberg, & Tonstad, 2013).
Another approach to measuring mood is to use items reflecting all the combinations
of valence and activation. For example, Polak and colleagues used an 18-item scale to
measure PA and NA across three levels of activation (Polak, Conner, Reeder, Harper, &
Houghton, in preparation). The scale is based on the affective circumplex (Barrett & Russell,
1999; Tugade, Conner, & Feldman Barrett, 2007) and includes a 9-item measure of positive
affect (high activation: energetic, enthusiastic, excited; medium activation: happy, cheerful,
pleasant; low activation: calm, content, relaxed), and a 9-item measure of negative affect
(high activation: hostile, angry, irritable; medium activation: nervous, anxious, tense; low
activation: dejected, sad, unhappy). This measure can be adapted to capture trait affect
(“Typically, how happy do you feel?”) or state affect (“How happy do you feel today/right
now?”). Questions are usually answered on a 5-point scale from 1 (not at all) to 5
(extremely) or from 0 (not at all) to 4 (extremely). This affective circumplex measure has not
been validated, although it does show adequate internal consistency within the separate 9-
item PA and NA scales (White, Horwath, & Conner, 2013). Because there are no norms,
researchers might have difficulty linking this scale to previous research. However, we
recommend a circumplex approach if there is a need to explicitly differentiate between high,
medium, and low activation positive and negative mood states.
Verbal and visual analog measures of mood are also used in nutrient intervention
studies. As a recent example, the effects of multivitamin supplementation on mood and well-
being were assessed using several measures, including the 16-item Bond-Lader visual
analogue scale (VAS) (Pipingas et al., 2013). This scale comprises 16, 100mm lines,
anchored at both end with adjective pairs such as happy-sad. Participants mark their degree of

Measuring Mood 16
agreement between the adjectives based on their current subjective state, allowing fine
discrimination along the 100mm scale (Bond & Lader, 1974). Scoring is calculated as the
distance from the negative anchor. Analog scales have been successfully used in appetite
control studies (e.g. Parker, Sturm, MacIntosh, Feinle, Horowitz, & Chapman, 2004), they
show high reproducibility, power, and validity in appetite assessment in single meal studies
(Flint, Raben, Blundell & Astrop, 2000), as well as good validity and reliability in mood
disorders (Ahearn, 1997). Visual analogue scales may be particularly good to use with
children because the questions are answered on a linear pictorial rather than a verbal scale
(Miller & Ferris, 1993).
Recommendation: We recommend the POMS, POMS 2, and its variants to measure
multiple mood states. The PANAS should only be used to measure high activation states.
Otherwise, the PANAS-X or POMS would be the better choice. An underutilized option is
the mood circumplex that captures both valence (negative–positive) and activation (high-
medium-low) of mood states.
Beyond Negative Mood: Measuring Positive Mood and Psychological Well-Being
Measures of negative mood, depression, and anxiety are much more common in
nutrition research than measures of happiness and life satisfaction. Yet there is emerging
evidence that dietary factors may also play a role in these states of positive well-being. A
recent study of over 80,000 British people found a strong link between consumption of fruit
and vegetables with greater life satisfaction that was not accounted for by demographic or
health factors (Blanchflower, Oswald, & Stewart-Brown, 2013). Contrary to common
assumptions, these negative states of ill-being and positive states of well-being are not two
sides of the same coin. Well-being reflects an optimal level of emotional experience and
functioning, not simply the absence of depression or anxiety (Deci & Ryan, 2008). It is an

Measuring Mood 17
empirical question whether good nutrition increases well-being over and above any
neutralizing effect on ill-being.
There are several psychometrically-validated measures of well-being that we
recommend. Some measures target hedonic well-being, that is, whether people feel happy
and are satisfied with their lives (Veenhoven, 2003). Measures of happiness include the first
item in the Fordyce Happiness Measures (Fordyce, 1988), which asks people to answer “In
general, how happy or unhappy do you usually feel?” on a scale from 0 (extremely unhappy)
to 10 (extremely happy), and the 4-item Subjective Happiness Scale (SHS; Lyubomirsky &
Lepper, 1999). Measures of life satisfaction include the OECD’s single item question of
“Overall, how satisfied are you with your life as a whole these days?” answered from 0 “not
at all satisfied” to 10 “completely satisfied” (OECD, 2013), the 1-item Cantril Scale (Cantril,
1965), which asks people to place themselves on a ladder where the bottom step (0)
represents the “worst possible life for you” and the top step (10) is “the best possible life for
you” (scores 7+ indicate thriving; scores ≤ 4 indicate suffering), and the 5-item Satisfaction
with Life Scale (Pavot & Diener, 1993).
Other measures target eudaimonic well-being, that is, whether people are engaged in
life’s activities and experience greater vitality, purpose, and meaning in life (McKnight &
Kashdan, 2009; Ryan, Huta, & Deci, 2008). It could be argued that the POMS Vigor/Activity
subscale measures a rudimentary form of eudaimonia by capturing differences in vitality
(lively, active, energetic, cheerful, alert, full of pep, carefree, vigorous); however, it was not
intended to measure eudaimonia. Established measures of eudaimonic well-being include the
Psychological Wellbeing Scale, which covers six dimensions of eudaimonic wellbeing:
autonomy, environmental mastery, personal growth, positive relations with others, purpose in
life, and self-acceptance Scale (Ryff & Keyes, 1995), the Flourishing Scale (Diener et al.,
2010), and the Warwick-Edinburgh Mental Well-being Scale (Tennant et al., 2007). The

Measuring Mood 18
Psychological Wellbeing Scale covers six dimensions of eudaimonic wellbeing: autonomy,
environmental mastery, personal growth, positive relations with others, purpose in life, and
self-acceptance (Ryff & Keyes, 1995). There are two versions - a 42-item format and a
shorter 18-item version that are both suitable for investigating eudaimonic wellbeing. It
includes items like “In general, I feel I am in charge of the situation in which I live”
(environmental mastery) and “Some people wander aimlessly through life, but I am not one
of them” (purpose in life). Other, shorter options include the 8-item Flourishing Scale (Diener
et al., 2010) with items like “I lead a purposeful and meaningful life” or “I am optimistic
about my future”, that capture important aspects of a successful life where participants rate
their answers on a scale from 1(strongly disagree) to 7(strongly agree). The total score ranges
from 8 to 56, with a higher score reflecting greater flourishing (for an example see Conner,
Brookie, Richardson, & Polak, 2014). The 14-item Warwick-Edinburgh Mental Well-being
Scale provides another useful tool to examine positive mental wellbeing (Tennant et al.,
2007). This scale includes both hedonic and eudaimonic perspectives and focuses on the
positive psychological outcomes only. The scale has been applied in research on fruit and
vegetable consumption and showed that highest wellbeing was associated with about 7
servings per day (Blanchflower et al., 2013).
Recommendation: Positive psychological states are not simply the reverse of ill-
being. For this reason, we recommend incorporating positive well-being measures into
nutrition research to open up novel scientific discoveries. Large-scale nutrition surveys could
benefit from including the single item happiness measure and either the OECD life
satisfaction measure or the Cantril scale, which are roughly interchangeable. We also
recommend the Warwick-Edinburgh Mental Well-being Scale for measuring both hedonic
and eudaimonic well-being in a short questionnaire. Researchers interested specifically in

Measuring Mood 19
eudaimonic well-being should administer the Psychological Wellbeing Scale or the
Flourishing Scale.
Innovative Real-time Mood Measurement
One of the exciting recent developments for nutritional research is to use “real-time”
or “near to real time” measures of mood. Most research asks people to report their mood in
general trait terms (how people feel typically), retrospectively over the past week(s) or
prospectively at a given time of day usually relative to the time of ingestion of a food or
supplement. Real-time measures of mood enable researchers to track mood on a daily or
momentary basis over a period of time (usually 1 to 4 weeks) using technology such as
internet diaries and smartphones. This latter point is important to nutrition research.
Micronutrient treatment or dietary interventions should show stronger or earlier effects on
mood reported in near to real-time compared to mood reported over a one-week recall
timeframe or longer (see Lenderking et al., 2008, for an example in pharmacology; see also
Pipingas et al., 2013). The reason is that micronutrients or dietary changes are thought to
affect underlying neurotransmitter processes (Rooney, McKinley, & Woodside, 2013) which
are more closely tied to actual/immediate mood responses compared to delayed reflections on
mood (Conner & Barrett, 2012). Tracking mood over time can also reveal the pattern in how
mood changes following the intervention – whether it is a gradual change, a sharp change, a
delayed change, etc. This temporal resolution is not possible with traditional pre-post test
forms of mood measurement.
Collectively, these real-time methods of assessing behaviour, physiology, affect, and
cognition, repeatedly over a period of time in naturalistic or unconstrained settings, are often
referred to as ‘Experience Sampling Methods’ (ESM), ‘Ecological Momentary Assessment’
(EMA; Shiffman, Stone, & Hufford, 2008), or Ambulatory Assessment (Fahrenberg &
Myrtek, 1996). These are a range of real-time methods that can be used in nutrition research.

Measuring Mood 20
These approaches include: daily diaries, experience sampling, behavioural observations, self-
monitoring systems, ambulatory monitoring of physiological functions, physical activity
and/or movement, and the technological tools and hardware used to measure these features.
Table 2 presents a breakdown of these methods.
Daily Diary Methods
Daily diary methods are an example of interval contingent sampling and involve
completing a survey (called a diary) after a specified interval of time, often once a day in the
evening before going to bed. People answer questions about their experiences that occurred
that day – for example, what they ate, their mood, and other experiences. Daily diaries are
subject to mental averaging of the day’s experience and are more subject to memory biases
than prospectively administered VAS or other scales hourly in the lab or in free living
situations; however, tests of end-of-day reports compared to averaged hourly reports during
the same day show good correspondence (Parkinson, Briner, Reynolds, & Totterdell, 1995).
The typical daily diary study lasts from one to three weeks; however the quality of data may
decline after approximately 2-4 weeks of data collection possibly due to participant burden
(Stone, Kessler, & Haythomthwatte, 1991). If a longer time period is required, researchers
can adopt a measurement burst design by surveying a few days to one week every month.
Daily diaries are popular with researchers because of their ease of administration (though
Internet surveys), low frequency sampling, and option to include many items. However, daily
diaries are not suitable for projects requiring a more fine-grained temporal resolution across
the day.
In nutrition research, daily diaries are well-suited for measuring both moods and
foods together to investigate, for instance, how mood states change in response to, or in
advance of, daily eating habits. For example, White, Horwath, and Conner (2013)

Measuring Mood 21
investigated the bidirectional relationships between daily negative and positive mood and
food consumption in 281 healthy young adults using an Internet-based daily diary for 21
consecutive days. Self-reported daily servings of fruit, vegetables, and several unhealthy
foods were reported each day along with the 18-item circumplex mood measure (described
above) adapted for a daily format (how they felt “today”). Using multilevel linear modelling,
within-person associations revealed that on days when individuals reported eating more
servings of fruit and vegetables, they experienced greater positive mood. Next-day lagged
analysis showed that fruit and vegetable (FV) consumption predicted improvements in
positive mood the following day and not vice versa, suggesting that the FV consumption was
antecedent to changes in positive mood. By utilizing a daily diary method, the authors were
able to show how FV consumption was tightly yoked to changes in positive mood within the
same person over time. This finding at the within-person level complements cross-sectional
evidence at the between-person level that fruit and vegetable consumption is correlated
positively with greater happiness and life satisfaction (Blanchflower et al., 2013).
In another study utilizing a daily diary method, Newman, O’Connor, and Conner
(2007) examined the relationship between cortisol reactivity and snacking behaviours in
response to stressors. Fifty pre-menopausal women completed reports of daily hassles and
snack intake diaries for 14 consecutive days. Previous to this, they completed a social stress
test in the lab and cortisol reactivity was measured to determine their reactivity status
(high/low). Using hierarchical multivariate linear modelling, they found significant within-
person associations between daily hassles and snack intake for the overall sample, where an
increased number of hassles was associated with increased snack intake. Additionally, those
with higher cortisol reactivity to stressors from a laboratory task were more likely to snack in
response to stress than low reactors. This finding suggests that stress-reactivity may play a
moderating role of eating style on stress-induced eating in daily life.

Measuring Mood 22
Daily diary methods may be particularly useful for intervention research. For
example, a recent study by Pipingas and colleagues (2013) found no effect of multivitamin
supplementation on standard measures of mood like the POMS administered at baseline, 8-,
and 16-weeks following daily supplementation with a high potency multivitamin. However,
participants in the active ingredient group did report lower stress, anxiety, and fatigue when
they reported their mood using mobile phones at home, suggesting that the temporal
proximity of real-time measures may be more sensitive to mood changes than chronic
measures (Pipingas et al., 2013). However, as the authors note, these patterns could be due to
mobile phone reports being made soon after participants took their daily multivitamin
supplement, whereas participants refrained from taking their daily supplement at their 8- and
16-week testing settings.
Many of the shorter trait measures of mood and psychological well-being can be
adapted to a daily diary format by changing the wording from “in general” to “today.” This is
common practice in daily diary research. However, shorter measures (<10 items) are better
suited to daily diary formats. Reliability estimates of daily diary measures cannot be
computed using standard Cronbach’s alphas because the data are “nested” (multiple
observations over time nested within participants), which violates assumptions of
independence. Reliability should be computed taking into account the nested nature of the
data – see Nezlek (2012) or Shrout and Lane (2012).
Experience sampling methods
The term “experience sampling” is used to refer to signal contingent sampling that
involves more frequent reports combined with periodic signalling in natural settings
(Csikszentmihalyi & Larson, 1987). Unlike a daily diary that is done once per day, with an
experience sampling method (ESM), people are signalled semi-randomly between 6 to 10
times per day, usually over the course of several days to weeks. At each signal, participants

Measuring Mood 23
answer questions about their experiences at that moment. This style of sampling is suited to
recording momentary experiences that are ongoing and variable (e.g., quicker changes in
emotional states) and most susceptible to memory biases (e.g., pain). Although the number of
items in experience sampling is usually quite small, which limits the breadth of questioning,
reliability can be constructed by aggregating single items over time (Csikszentmihalyi &
Larson, 1987). Researchers usually try to choose items and questions with good face validity.
For example, researchers might ask people to rate how pleasant and unpleasant they currently
feel (each item rated on 0 – not at all, 9 – extremely) to capture valence, or they may try to
target different levels of valence and activation (energetic, relaxed, tense, sad).
In most experience sampling studies, participants are prompted by a randomly-timed
signal, which is now usually accomplished using either a text-message or audible signal from
a smartphone application (“app”; for a review of current options, see Conner & Lehman,
2012; and, the website for the Society for Ambulatory Assessment, http://www.ambulatory-
assessment.org/ an international society for researchers interested in mobile assessment of
behaviour). Following this signal, participants respond to survey questions either by replying
back to the text message, clicking through to a web survey delivered by text to their
smartphone, responding directly into a survey app, or by completing a paper questionnaire
(although paper questionnaires are becoming less common). Macht, Haupt, and Ellgring
(2005) used ESM approach to investigate changes in eating in response to the stress of
studying for exams in college students. Participants reported their emotional state,
motivations to eat, and perceived functions of eating 10 times a day on 2 successive days
during baseline (3-4 weeks before exams) and during the ‘stress’ period (3-4 days before
exams). Control participants did not have an exam. A cellular pager was used to randomly
signal participants as a prompt to perform the ratings on supplied questionnaires. Students
were screened to exclude any participants who reported pathological eating patterns. In the
Measuring Mood 24
lead up to an exam, students experienced increased fear, tension, and emotional stress. They
also reported a higher tendency to eat in order to distract from stress, but did not eat in order
to relax or feel better.
In another study, Tomiyama, Mann, and Comer (2009) investigated the eating
behaviour motivations of restrained eaters in their daily lives. In this study, 137 female
participants used a personal digital assistant (PDA; also known as a palm top computer) to
report approximately every hour (+/- 10 minutes, disregarding sleeping hours) for two days
about their positive and negative mood, levels of perceived anxiety and distraction, level of
hunger and whether food had been consumed since the previous response. Contrary to
findings from laboratory settings, in real-life settings restrained eaters did not overeat in
response to anxiety and ate more in response to hunger (Tomiyama et al., 2009).
Event Sampling
Another useful approach is event contingent sampling, which refers to data
collection initiated by the participant following a specified event. This sampling style is well
utilized in nutritional and craving research. For example, Lowe and Fisher (1983), found that
when obese female college students recorded their food intake and mood using a Food and
Mood Self-Monitoring (FMSM) form just prior to eating, they were more emotionally
reactive and more likely to engage in emotional snacking than their ‘normal weight’
comparisons.
In another example, Sayegh and colleagues (1995) used a computerized telephone
system to have their participants report mood and appetite. Twenty-four women with
premenstrual syndrome (PMS) were enrolled in a double blind study to test the efficacy of
specific beverages on PMS symptoms. Participants used the number pad of their telephone to
quantify responses to mood and appetite questions before and 30, 90, and 180 minutes after
consumption of the beverages. Cognitive tests were also administered by phone interview.
Measuring Mood 25
Results show that consuming a specially formulated carbohydrate-rich beverage known to
increase serum tryptophan levels during the late luteal phase of the menstrual cycle was
associated with a significant decrease in self-reported depression, anger, confusion, and
carbohydrate craving 90-180 minutes after initial intake.
Event contingent sampling methods have also been used to challenge common
assumptions in nutrition. For example, Stein et al. (2007) used palmtop computers to
investigate the relationship between negative affect and binge eating in a sample of
overweight women with binge eating disorder. They found that, contrary to prior research,
negative affect did not decrease significantly following a binge. In addition, contrary to the
popular restraint theory was the finding that the breaking of a “food rule” was not a primary
cause for binge eating. This study underscores the important role of testing the contingencies
of health behaviours and mood in real-world contexts.
Sensor Sampling – A New Frontier
One of the newest real-time methods is the use of sensor sampling to infer moods and
other psychological states over time in daily life. In continuous sensor sampling, activities
and physiological measures are recorded continuously over a designated time period using
voice or audio recorders (e.g., EAR, Mehl, Pennebaker, Crow, Dabbs, & Price, 2001; cellular
microphone,) pedometers, GPS, enhanced pedometers (e.g. FitBit®), and more recently from
the built-in sensors in off-the-shelf smartphones. Data from continuous recording (e.g.
movement or heart rate) is often useful in conjunction with self-reports of experience
(Rachuri, Mascolo, Musolesi, & Rentfrow, 2011). Similarly, adaptive sensor sampling
refers to an adjusted sampling rate of these sensors to conserve energy, reduce local memory
use, and processing power (Rachuri et al., 2011).
The trend towards real-time ambulatory measures opens up other interesting tools in
nutrition science. For example, heart rate monitor phone “apps”, and self-assessed salivary

Measuring Mood 26
cortisol levels may provide real-time anxiety data (see Schlotz, 2011). Similarly, continuous
interstitial ambulatory glucose-monitoring devices (AGD; such as the Glucoday®, see Dye et
al., 2010) can allow for a more comprehensive view of an individual’s glucose levels in
relation to diet, exercise, and mood when combined with experience sampling strategies.
Meanwhile, other “apps” utilizing built-in sensors in smartphones can be used to detect stress
(Lu et al, 2012), infer mood (LiKamWa, Liu, Lane, & Zhong, 2011), or to develop a pattern
of a person's habits, activities, routines, and emotions (Lathia et al., 2013).
Many off-the-shelf smartphones have built-in sensors such as the accelerometer
(which can be used for activity recognition), microphone (speaker, conversation detection),
and GPS (location). By extracting features from the sensor-data, it is possible to draw
inferences about physical activities such as running, cycling, and walking, using the
accelerometer sensor and movement speed using readings from the GPS sensor (Park, Patel,
Curtis, Teller, & Ledlie, 2012). Classification tasks such as speech recognition (e.g., Siri on
the iPhone 4S6) can also be enhanced by accessing dictionaries available in alternative
servers (Rachuri, 2012). Although these sensors were initially incorporated to improve user-
experience of the smartphones, utilizing these built-in sensors can enhance the accurate
observation of spontaneous behaviour and speech and they are especially useful when the
social-sensing is performed passively (Rachuri et al., 2011). For example, StressSense (Lu et
al., 2012) is a mobile sensing system that uses audio recorded through the microphone sensor
to detect stress in the user's voice by classifying the standard deviation of pitch, perturbation,
and speaking rate. Likewise, the MoodSense system can be used to infer the user's mood
from information already available in smartphones by analyzing communication history and
application usage patterns. For example, the MoodSense system inferred users’ daily mood
average with a 93% accuracy rate and sudden mood change with an accuracy rate of 74%
(LiKamWa et al., 2011). Similarly, University of Cambridge’s EmotionSense system
Measuring Mood 27
combines self-reports of mood and data recorded using the phone's built-in GPS,
accelerometer and microphone, to develop a pattern of that person's habits, daily activities,
social interactions, and emotions (Rachuri, 2012). EmotionSense achieves greater than 90%
accuracy for speaker identification and greater than 70% accuracy for broad emotion
recognition (Lathia et al., 2013).
By combining the data from built-in sensors with a log of the user’s calling and
texting patterns, a study of a person’s smartphone can offer nutrition researchers a very useful
record of their participants’ natural habits, activities and routines. In addition, these software
applications are becoming readily available for external researchers to utilize and modify to
suit their researching needs. For nutrition researchers, this could include the incorporation of
food intake recording methodologies. For example, Mymealmate is a free smartphone
application developed at the University of Leeds which utilises goal-setting, progress
feedback, and self-monitoring of diet, physical activity, and weight to promote user weight
loss (Carter, Burley, & Cade, 2013). Another example of utilizing built-in smartphone
features for nutrition research is the Remote Food Photography Method (RFPM) in which
users capture images of food selection and plate waste. This method enhances individuals’
food and energy intake estimation by reducing retrospective recall based error when
compared to 24-hour food recall and pen-and-paper food records (Martin et al., 2009).
Consistent with standard ESM protocols, customized prompts (delivered at personalized meal
times) are sent to the participants to remind them to capture food images. Energy intake in a
customized prompt condition was compared against doubly labelled water (DLW),
considered the gold standard metabolic measure used to assess free-living energy
expenditure. When customized prompts were utilized, energy intake estimated by the RFPM
did not significantly differ from the energy intake measured by the more labour intensive, and
expensive, DLW method. The authors reported that RFPM underestimated energy intake by

Measuring Mood 28
3.7%, which represented an improvement over alternative self-report methods (food records
and 24-h recall which underestimate energy intake and micronutrient intake respectively,
Poslusna, Ruprich, de Vries, Jakubikova, & van't Veer). If RFPM was combined with a
passive sensing system such as StressSense (Lu et al., 2012), MoodSense system (LiKamWa,
et al., 2011), or EmotionSense (Rachuri, 2012) it would be plausible to deploy large-scale
studies with reduced logistical and financial constraints whilst achieving accurate nutrition,
mood, and physical activity data.
While these applications are relatively recent, they demonstrate the potential of
utilizing off-the-shelf smartphones to combine passive sensor data collection and machine
learning to provide continuous monitoring of participants’ emotional states, interactions, and
mobility (Lathia et al., 2013). Researchers can utilize these systems to facilitate the collection
of data by automatically capturing and classifying data to enhance their understanding of
social interactions, nutrition, and physiological responses, on emotions, mood, and behaviour.
Recommendations:
While it is clear that good research design and careful selection of measures is of the
utmost importance, nutrition researchers should aim to take advantage of real-time mood
measures and advances in technology. In the near future, it will be less acceptable to rely
solely upon pre- and post-test measures of mood when there are such rich data points to be
measured in between assessment periods. Internet or app-based daily diaries should be used
more frequently in nutrition science to track a range of daily measures of food and mood. Of
course, technology cannot replace careful design of existing measures, which suggests that a
multi-method approach is valuable. We also urge researchers to avoid paper-and-paper
diaries or paper ESM booklets given the near ubiquitous access to the Internet and mobile
phones. For a review of technology and ESM-capable software, see www.ambulatory-
assessment.org.

Measuring Mood 29
Conclusion
Multiple options are available for measuring mood in nutrition research. Some of
these involve more traditional approaches of examining trait and state moods using a paper-
and-pen questionnaire. However, more recent technological advances and multimodal
research approaches now allow us to capture new facets of the relationship between
nutritional factors and moods. While trait reports of global or longer-term retrospective well-
being are still the method of choice for cross-sectional studies to establish links between
typical eating patterns and macro-level moods, real-time approaches can be extremely useful
for intervention research where real-time measures of mood can potentially show earlier
changes in mood than traditional measures. These approaches could also help nutrition
researchers illustrate micro-level changes in mood as a function of nutrition intake, offering a
finer grained resolution of temporal sequencing that cannot be achieved with pre-and post-
test reports. However, the method utilized for measuring mood in nutrition research in any
specific project needs to be suitable for the aims of the research and the study population.
Most importantly, the growing development in the fascinating new area of the nutrition-mood
link research requires understanding of the range of mood measures available to researchers.

Measuring Mood 30
Summary of Main Points
Consider the main aims of your research before deciding on the mood measures. Trait
measures are suitable for measuring associations; state measures are better suited for
capturing change.
When using depression measures, be aware of the potential overlap between symptoms of
nutritional deficiency and symptoms of depression (e.g., tiredness, difficulties
concentrating).
Do not ignore positive mood states and other measures of positive psychological
functioning. At minimum, include mood measures that assess both negative and positive
mood states. If possible, include other measures of psychological well-being or
flourishing, in addition to traditional measures of ill-being (depression, anxiety, etc.).
Ditch the pen-and-paper diaries in favour of electronic technology as it is easier to track
completion, compliance, and involves less participant burden.
Current Trends
A trend towards including measures that assess both negative and positive mood states is
warranted.
New trends in ambulatory research may give rise to the use of subjective state measures
as well as real-time, objective physiological measures.
Real-time data capture approaches are beginning to integrate more technologically
advanced platforms for research such as SMS based, smart phone app-based, and internet-
based experience sampling with an emphasis on incorporating a range of ambulatory
methods. These methods often necessitate advanced forms of statistics such as multilevel
modelling.
Table 1
Measuring Mood 31
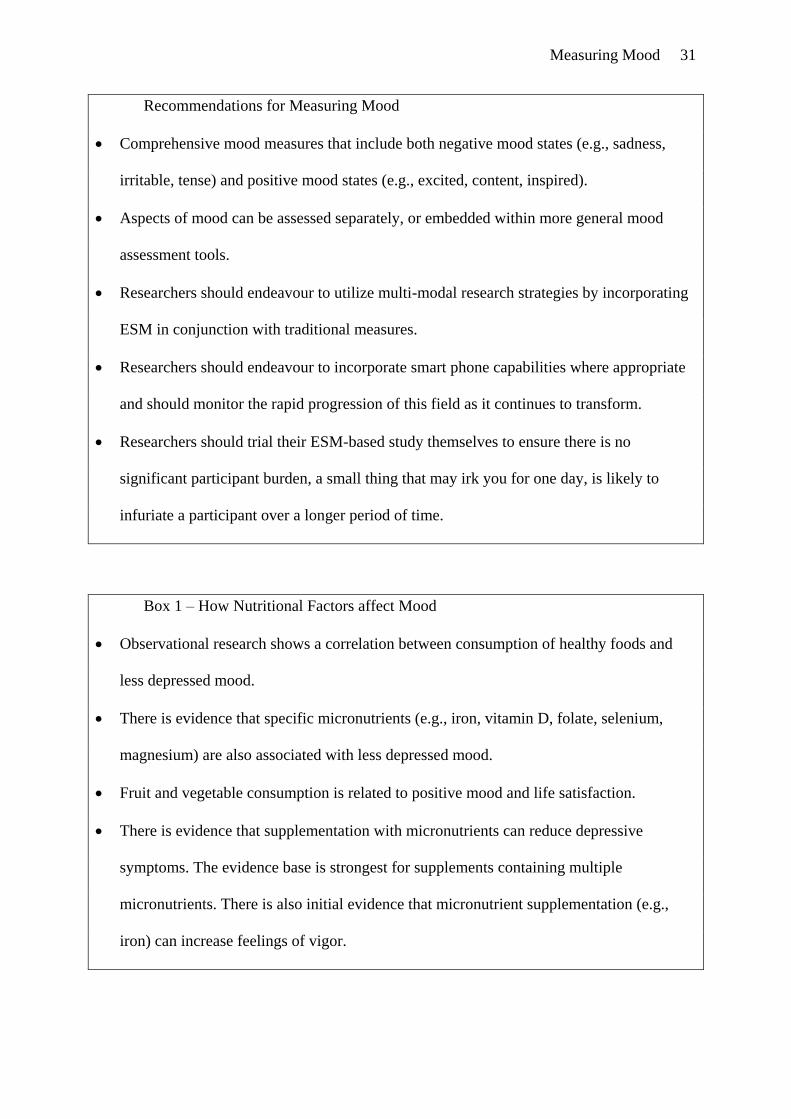
Recommendations for Measuring Mood
Comprehensive mood measures that include both negative mood states (e.g., sadness,
irritable, tense) and positive mood states (e.g., excited, content, inspired).
Aspects of mood can be assessed separately, or embedded within more general mood
assessment tools.
Researchers should endeavour to utilize multi-modal research strategies by incorporating
ESM in conjunction with traditional measures.
Researchers should endeavour to incorporate smart phone capabilities where appropriate
and should monitor the rapid progression of this field as it continues to transform.
Researchers should trial their ESM-based study themselves to ensure there is no
significant participant burden, a small thing that may irk you for one day, is likely to
infuriate a participant over a longer period of time.
Box 1 – How Nutritional Factors affect Mood
Observational research shows a correlation between consumption of healthy foods and
less depressed mood.
There is evidence that specific micronutrients (e.g., iron, vitamin D, folate, selenium,
magnesium) are also associated with less depressed mood.
Fruit and vegetable consumption is related to positive mood and life satisfaction.
There is evidence that supplementation with micronutrients can reduce depressive
symptoms. The evidence base is strongest for supplements containing multiple
micronutrients. There is also initial evidence that micronutrient supplementation (e.g.,
iron) can increase feelings of vigor.

Measuring Mood 32
Table 1 Measures and sampling techniques suitable for studies on the relationship between nutrition and mood.
Measure Author Description
Center for Epidemiological
Studies – Depression Scale
(CES-D)
Radloff (1977) A measure of depressed mood, suitable for use in a community sample.
Beck Depression Inventory
(BDI and BDI-II)
Beck et al. (1961);
Beck et al. (1996)
A measure of depression severity, designed for use in clinical population. Researchers must
consider the crossover between somatic depression symptoms, and the physical symptoms of
nutritional deficiency.
The Geriatric Depression
Scale (GDS)
Yesavage et al.
(1983)
A measure of depression, specifically for use in elderly population
Edinburgh Postnatal
Depression Scale (EPDS)
Cox et al. (1987) A measure of depression, specifically for use of postpartum women (within eight weeks of
giving birth)
The Hospital Anxiety and
Depression Scale (HADS)
Zigmond & Snaith
(1983)
A screening tool for indications of anxiety and depression. This tool is considered efficient to
measure depression and anxiety symptoms simultaneously - a recommended tool for nutritional

Measuring Mood 33
research.
State Trait Anxiety
Inventory (STAI)
Spielberger (1983) A self-report measure of both current and general feelings of anxiety. This measure is
commonly used in supplement studies.
Hamilton Anxiety Rating
Scale (HAM-A)
Hamilton (1959) A clinician rated measure of anxiety severity. Researchers must consider the potential crossover
between somatic anxiety symptoms and physical symptoms of nutritional deficiency. This
measure has also shown to have crossover with depressive symptomatology.
Beck Anxiety Inventory
(BAI)
Beck & Steer (1993) Includes both cognitive and somatic components of anxiety and is suitable for clinical
populations
General Health
Questionnaire (GHQ-12)
Goldberg & Williams
(1991)
A brief self-report screening tool for common mental health disorders, with subscales including:
depression, anxiety, somatic symptoms, and social withdrawal. This measure provides an
indication of general psychological distress, rather than measurement of particular mood states.
Structured Clinical
Interview for DSM-IV-TR,
non-patient edition (SCID-
First et al. (2002) A semi-structured diagnostic interview, which indicates the presence and severity of a DSM-IV
diagnoses. Whilst being the ‘gold standard’ instrument to indicate the presence of a mental
illness, it requires extensive training to administer.

Measuring Mood 34
I/NP
Profile of Mood States
(POMS and POMS2)
McNair et al. (1971)
Heuchert & McNair,
(2004)
A total mood measure, which incorporates a range of different negative moods and a measure of
positive mood. The inclusion of ‘vigor’ is important given the relationship between healthy
eating and feelings of energy. There are several shortened versions.
Positive and Negative
Activation Schedule
(PANAS)
Watson et al. (1988) A mood measure which yields separate measures of positive and negative activation states. This
measure is limited to high activation states, rather than lower-level activation (e.g. fatigue).
There is also a shortened version available.
Bond-Lader Visual
Analogue Scale (VAS)
Bond & Lader (1974) A measure of various moods using a continuum, in which individuals indicate their position
along a continuous line between two points (e.g. happy-sad). VAS scales may provide a good
option for the measurement of mood in children.
Affective Circumplex Barrett & Russell
(1999)
A self-report measure encompassing both positive and negative affect. This measure also
reflects high, medium, and low levels of activation, as well as differentiates between state and
trait affect.

Measuring Mood 35
Fordyce Happiness
Measure
Fordyce (1998) A remarkably quick single item instrument to measure happiness with good reliability and
stability.
Subjective Happiness Scale
(SHS)
Lyubomirsky &
Lepper (1999)
A quick 4-item measure of happiness in general, and in comparison to peers.
OECD life satisfaction
measure
OECD (2013) Measure of life satisfaction used in OECD country surveys, suitable for nutrition research.
Cantril Scale Cantril (1965) Quick single item measure of life satisfaction, where respondents rate their life from worst
possible to best possible.
Satisfaction with Life Scale Pavot & Diener
(1993)
This 5-item questionnaire measures global cognitive judgments on satisfaction with life.
Psychological Wellbeing
Scale
Ryff & Keyes (1995) A self-report measure of various dimensions of eudaimonic wellbeing.
Flourishing Scale Diener et al. (2010) A measure of flourishing, capturing aspects of what is considered a ‘successful’ life.

Measuring Mood 36
Warwick-Edinburgh
Mental Well-being Scale
Tennant et al. (2007) A measure of hedonic and eudaimonic wellbeing, with a specific focus on positive
psychological outcomes.
Table 2. Sampling strategies suitable for studies on the relationship between nutrition and mood.
Sampling strategy Example Description
Daily diary method Conner & Lehman
(2012); e.g. White et
al. (2013)
A method that requires individuals to complete a survey each day, typically at the end of each
day. This diary can be tailored to include measures of mood, daily nutritional intake, and other
aspects of experience that vary on a daily basis. Daily diaries are useful for testing covariation
between food and mood and for detecting mood changes in intervention/supplementation trials.
Diary surveys can also be delivered through smartphones, which can enable large-scale
delivery.
Experience sampling
method / Ecological
momentary assessment
Conner & Lehman
(2012); e.g. Macht et
al. (2005); Lathia et
al. (2013)
A method that utilizes pagers, text messaging, or mobile phone “apps” to signal self-report
measurements multiple times per day, typically on a semi-random schedule. ESM is used to
measure current mood or other experiences (e.g., stress, pain) that are variable and ongoing
across a short period of time in naturalistic free-range (ambulatory) settings. Smartphone usage

Measuring Mood 37
will increase feasibility of this method in the near future.
Event contingent
experience sampling
e.g. Lowe & Fisher
(1983)
A method in which mood and other experiences are measured followed a specified event. This
method is commonly used to tap mood that follows infrequent events (e.g., following binges).
Continuous sampling/
Adaptive sensor sampling
e.g. Rachuri (2012) A method in which psychological and physiological experiences are measured using various
technologies including, GPS, voice recorder, microphone, text messaging and call logs. While
not yet utilized in the field of nutrition, this continuous sampling method offers insight into
routines and habits as individuals navigate their daily life.
Measuring Mood 38
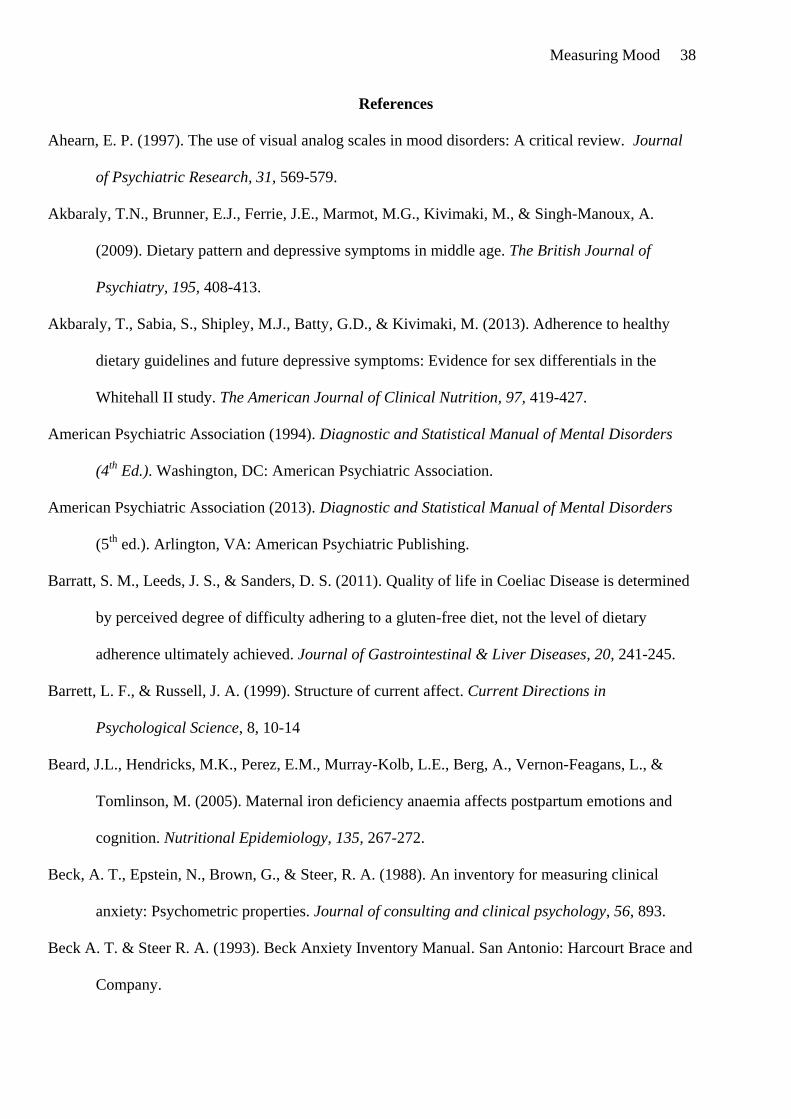
References
Ahearn, E. P. (1997). The use of visual analog scales in mood disorders: A critical review. Journal
of Psychiatric Research, 31, 569-579.
Akbaraly, T.N., Brunner, E.J., Ferrie, J.E., Marmot, M.G., Kivimaki, M., & Singh-Manoux, A.
(2009). Dietary pattern and depressive symptoms in middle age. The British Journal of
Psychiatry, 195, 408-413.
Akbaraly, T., Sabia, S., Shipley, M.J., Batty, G.D., & Kivimaki, M. (2013). Adherence to healthy
dietary guidelines and future depressive symptoms: Evidence for sex differentials in the
Whitehall II study. The American Journal of Clinical Nutrition, 97, 419-427.
American Psychiatric Association (1994). Diagnostic and Statistical Manual of Mental Disorders
(4th
Ed.). Washington, DC: American Psychiatric Association.
American Psychiatric Association (2013). Diagnostic and Statistical Manual of Mental Disorders
(5th
ed.). Arlington, VA: American Psychiatric Publishing.
Barratt, S. M., Leeds, J. S., & Sanders, D. S. (2011). Quality of life in Coeliac Disease is determined
by perceived degree of difficulty adhering to a gluten-free diet, not the level of dietary
adherence ultimately achieved. Journal of Gastrointestinal & Liver Diseases, 20, 241-245.
Barrett, L. F., & Russell, J. A. (1999). Structure of current affect. Current Directions in
Psychological Science, 8, 10-14
Beard, J.L., Hendricks, M.K., Perez, E.M., Murray-Kolb, L.E., Berg, A., Vernon-Feagans, L., &
Tomlinson, M. (2005). Maternal iron deficiency anaemia affects postpartum emotions and
cognition. Nutritional Epidemiology, 135, 267-272.
Beck, A. T., Epstein, N., Brown, G., & Steer, R. A. (1988). An inventory for measuring clinical
anxiety: Psychometric properties. Journal of consulting and clinical psychology, 56, 893.
Beck A. T. & Steer R. A. (1993). Beck Anxiety Inventory Manual. San Antonio: Harcourt Brace and
Company.

Measuring Mood 39
Beck, A.T., Steer, R.A., & Brown, G.K. (1996). Manual for the Beck Depression Inventory-II. San
Antonio, TX: Psychological Corporation.
Beck, A.T., Ward, C. H., Mendelson, M., Mock, J., & Erbaugh, J. (1961). An inventory for
measuring depression. Archives of General Psychiatry, 4, 561-571.
Benton, D., & Cook, R. (1991). The impact of selenium supplementation on mood. Biological
Psychiatry, 29, 109-1098.
Bjelland, I., Dahl, A.A., Tangen Haug, T., & Neckelmann, D. (2002). The validity of the Hospital
Anxiety and Depression Scale: An updated literature review. Journal of Psychosomatic
Research, 52, 69-77.
Blanchflower, D. G., Oswald, A. J. & Stewart-Brown, S. (2013). Is psychological well-being linked
to the consumption of fruit and vegetables? Social Indicators Research, 114, 785-801.
Bond, A. & Lader, M. (1974). The use of analogue scales in rating subjective feelings. The British
Journal of Medical Psychology, 47, 211-218.
Cagnacci, A., Arangino, S., Renzi, A., Zanni, A. L., Malmusi, S., & Volpe, A. (2003). Kava–Kava
administration reduces anxiety in perimenopausal women. Maturitas, 44(2), 103-109.
Cantril, H. (1965). The pattern of human concerns. New Brunswick, NJ: Rutgers University Press.
Carr, A.C., Bozonet, S.M., Pullar, J.M., & Vissers, M.C.M. (2013). Mood improvement in young
adult males following supplementation with gold kiwifruit, a high-vitamin C food. Journal of
Nutrition Science, 2, 1-8.
Carroll, D., Ring, C., Suter, M., & Willemsen, G. (2000). The effects of an oral multivitamin
combination with calcium, magnesium, and zinc on psychological well-being in healthy
young male volunteers: a double-blind placebo-controlled trial. Psychopharmacology,
150(2), 220-225.
Carter, M. C., Burley, V. J., & Cade, J. E. (2013). Development of ‘My Meal Mate’–A smartphone
intervention for weight loss. Nutrition Bulletin, 38, 80-84.

Measuring Mood 40
Colangelo, L.A., He, K., Whooley, M.A., Daivglus, M.L., Morris, S., & Liu, K. (2014). Selenium
exposure and depressive symptoms: The Coronary Artery Risk Development in Young
Adults Trace Element Study. NeuroToxicology, 41, 167-174.
Conner, T., & Barrett, L. F. (2012). Trends in ambulatory self-report: Understanding the utility of
momentary experiences, memories, and beliefs. Psychosomatic Medicine, 74, 327-337.
Conner, T. S. & Lehman, B. J. (2012). Getting Started: Launching a Study in Daily Life. In: M. R.
Mehl & T. S. Conner. (Eds.) Handbook of research methods for studying daily life. New
York, NY: Guilford Press.
Conner, T. S., Brookie, K. L., Richardson, A. C., & Polak, M. A. (2014). On carrots and curiosity:
Eating fruit and vegetables is associated with greater flourishing in daily life. British Journal
of Health Psychology. Advance online publication. DOI:10.1111/bjhp.12113
Cox, J. L., Holden, J. M., & Sagovsky, R. (1987). Detection of postnatal depression, Development of
the 10-item Edinburgh Postnatal Depression Scale. The British Journal of Psychiatry, 150,
782-786.
Csikszentmihalyi, M., & Larson, R. (1987). Validity and reliability of the experience-sampling
method. The Journal of Nervous and Mental Disease, 175, 526-536.
Deci, E. L., & Ryan, R. M. (2008). Hedonia, eudaimonia, and well-being: An introduction. Journal
of Happiness Studies, 9, 1-11
Diener, E., Wirtz, D., Tov, W., Kim-Prieto, C., Choi, D. W., Oishi, S., & Biswas-Diener, R. (2010).
New wellbeing measures: Short scales to assess flourishing and positive and negative
feelings. Social Indicators Research, 97, 143-156.
Dye, L., Mansfield, M., Lasikiewicz, N., Mahawish, L., Schnell, R., Talbot, D., ... & Lawton, C.
(2010). Correspondence of continuous interstitial glucose measurement against arterialised
and capillary glucose following an oral glucose tolerance test in healthy volunteers. British
Journal of Nutrition, 103, 134-140.

Measuring Mood 41
Fahrenberg, J. &. Myrtek, M. (Eds.) (1996). Ambulatory assessment. Computer-assisted
psychological and psychophysiological methods in monitoring and field studies. Seattle, WA:
Hogrefe & Huber.
First, M. B., Spitzer, R. L., Gibbon, M., & Williams, J. B.W. (2002). Structured Clinical Interview
for DSM-IV-TR Axis I Disorders, Research Version, Non-patient Edition. (SCID-I/NP) New
York: Biometrics Research, New York State Psychiatric Institute.
Flint, A., Raben, A., Blundell J. E. & Astrop, A. (2000). Reproducibility, power and validity of
visual analogue scales in assessment of appetite sensations in single test meal studies.
International Journal of Obesity, 24, 38-48.
Ford, P.A., Jaceldo-Siegl, K., Lee, J.W., Youngberg, W., & Tonstad, S. (2013). Intake of
Mediterranean foods associated with positive affect and low negative affect. Journal of
Psychosomatic Research, 74, 142-148.
Fordyce, M. W. (1988). A review of research on the happiness measure: A sixty second index of
happiness and mental health. Social Indicators Research, 20, 355-381.
Gao, S., Jin, Y., Unverzagt, F.W., Liang, C., Hall, K.S., Cao, J. & Hendrie, H.C. (2012). Selenium
level and depressive symptoms in a rural elderly Chinese cohort. BMC Psychiatry, 12, 1-8.
Gibson, J., McKenzie-McHarg, K., Shakespeare, J., Price, J., & Gray, R. (2009). A systematic
review of studies validating the Edinburgh Postnatal Depression Scale in antepartum and
postpartum women. Acta Psychiatrica Scandinavica, 119, 350-364.
Goldberg, D., & Williams, P. (1991). General Health Questionnaire. Hämtad från.
Gosney, M.A., Hammond, M.F., Shenkin, A., Allsup, S. (2008). Effect of micronutrient
supplementation on mood in nursing home residents. Gerontology, 54, 292-299.
Hamilton M. (1959). The assessment of anxiety states by rating. British Journal of Medical
Psychology, 32, 50–55.

Measuring Mood 42
Heuchert, J. P. & McNair, D. M. (2004). Profile of Mood States - Second Edition (POMS 2).
Toronto: Multi-Health Systems Inc.
Jacka, F.N., Mykletun, A., Berk, M., Belland, I., & Tell, G.S. (2011). The association between
habitual diet quality and the common mental disorders in community-dwelling adults: The
Hordaland Health Study. Psychosomatic Medicine, 73, 483-490.
Jacka, F.N., Overland, S., Stewart, R., Tell, G.S., Bjelland, I., Mykletun, A. (2009). Association
between magnesium intake and depression and anxiety in community-dwelling adults: the
Hordaland Health Study. Australian and New Zealand Journal of Psychiatry, 43, 45-52.
Jacka, F. N., Pasco, J. A., Mykletun, A., Williams, L. J., Hodge, A. M., O'Reilly, S. L., ... & Berk,
M. (2010). Association of Western and traditional diets with depression and anxiety in
women. American Journal of Psychiatry, 167(3), 305-311.
Jacka, F. N., Pasco, J. A., Williams, L. J., Mann, N., Hodge, A., Brazionis, L., & Berk, M. (2012).
Red meat consumption and mood and anxiety disorders. Psychotherapy and psychosomatics,
81(3), 196-198.
Jacka, F. N., Pasco, J. A., Williams, L. J., Meyer, B. J., Digger, R., & Berk, M. (2012). Dietary
intake of fish and PUFA, and clinical depressive and anxiety disorders in women. British
Journal of Nutrition, 10, 1-8.
Jackson, C. (2007). The general health questionnaire. Occupational medicine, 57(1), 79-79.
Jezova, D, Makatsori, A., Smriga, M., Morinaga, Y. & Duncko, R. (2005). Subchronic treatment
with amino acid mixture of L-lysine and L-arginine modifies neuroendocrine activation
during psychosocial stress in subjects with high trait anxiety. Nutrition Neuroscience, 8, 155-
160.
Johnson, L.A., Phillips, J.A., Mauer, C., Edwards, M., Hobson Balldin, V., Hall, J.R. & O’Bryant,
S.E. (2013). BMC Psychiatry, 13, 1-8.

Measuring Mood 43
Kalliath, T. J., O'Driscoll, M. P., & Brough, P. (2004). A confirmatory factor analysis of the General
Health Questionnaire-12. Stress and Health, 20, 11-20.
Lai, J.S., Hiles, S., Bisquera, A., Hure, A.J., McEvoy, M., & Attia, J. (2014). A systematic review
and meta-analysis of dietary patterns and depression in community-dwelling adults.
American Journal of Clinical Nutrition, 99, 181-197.
Lakhan, S. E., & Vieira, K. F. (2010). Nutritional and herbal supplements for anxiety and anxiety-
related disorders: systematic review. Nutritional Journal, 9, 42.
Lathia, N., Pejovic, V., Rachuri, K. K., Mascolo, C., Musolesi, M., & Rentfrow, P. J. (2013).
Smartphones for large-scale behaviour change interventions. IEEE Pervasive Computing
(May 2013).
Lenderking, W. R., Hu, M., Tennen, H., Cappelleri, J. C., Petrie, C. D., & Rush, A. J. (2008). Daily
process methodology for measuring earlier antidepressant response. Contemporary Clinical
Trials, 29, 867-877.
LiKamWa, R., Liu, Y., Lane, N. D., & Zhong, L. (2011). Can your smartphone infer your mood? In:
Proc. PhoneSense Workshop.
Lowe, M. R., & Fisher, E. B. (1983). Emotional reactivity, emotional eating, and obesity: a
naturalistic study. Journal of Behavioral Medicine, 6, 135–49.
Lu, H., Frauendorfer, D., Rabbi, M., Mast, M. S., Chittaranjan, G. T., Campbell, A. T., &
Choudhury, T. (2012, September). StressSense: Detecting stress in unconstrained acoustic
environments using smartphones. In Proceedings of the 2012 ACM Conference on
Ubiquitous Computing (pp. 351-360). ACM.
Lyubomirsky, S. & Lepper, H. S. (1999). A measure of subjective happiness: Preliminary reliability
and construct validation. Social Indicators Research, 46, 137-155
Macht, M., Haupt, C., & Ellgring, H. (2005). The perceived function of eating is changed during
examination stress: a field study. Eating Behaviors, 6, 109–112.

Measuring Mood 44
Mackinnon, A., Jorm, A. F., Christensen, H., Korten, A. E., Jacomb, P. A. & Rodgers, B. (1999). A
short form of the Positive and Negative Affect Schedule: evaluation of factorial validity and
invariance across demographic variables in a community sample. Personality and Individual
Differences, 27, 405-416
Maier, W., Buller, R., Philipp, M., & Heuser, I. (1988). The Hamilton Anxiety Scale: reliability,
validity and sensitivity to change in anxiety and depressive disorders. Journal of affective
disorders, 14, 61-68.
Martin, C. K., Han, H., Coulon, S. M., Allen, H. R., Champagne, C. M., & Anton, S. D. (2009). A
novel method to remotely measure food intake of free-living individuals in real time: the
remote food photography method. British Journal of Nutrition, 101, 446-456.
Matthey, S., Henshaw, C., Elliott, S., & Barnett, B. (2006). Variability in use of cut-off scores and
formats on the Edinburgh Postnatal Depression Scale – implications for clinical and research
practice. Archives of Women’s Mental Health, 9, 309-315.
McClung, J.P., Karl, J.P., Cable, S.J., Williams, K.W., Nindl, B.C., Young, A.J., & Lieberman, H.R.
(2009). Randomized, double-blind, placebo-controlled trial of iron supplementation in female
soldiers during military training: Effects on iron status, physical performance, and mood. The
American Journal of Clinical Nutrition, 90, 124-131.
McConville, C., Simpson, E.E.A., Rae, G., Polito, A., Andriollo-Sanchez, M., Meunier, N. &
Coudray, C. (2005). Positive and negative mood in the elderly: The ZENITH study.
European Journal of Clinical Nutrition, 59, S22-S25.
McKnight, P. E. & Kashdan, T. B. (2009). Purpose in life as a system that creates and sustains health
and well-being: An integrative, testable theory. Review of General Psychology, 13, 242-251.
McNair, D.M., Lorr, M., & Droppelman, L.F. (1971). Manual for the Profile of Mood States. San
Diego, CA: Educational and Industrial Testing Service.

Measuring Mood 45
Mehl, M. R., Pennebaker, J. W., Crow, D. M., Dabbs, J., & Price, J. H. (2001). The Electronically
Activated Recorder (EAR): A device for sampling naturalistic daily activities and
conversations. Behavior Research Methods, Instruments, & Computers, 33, 517-523.
Miller, M. D. & Ferris, D. G. (1993). Measurement of subjective phenomena in primary care
research. The Visual Analogue Scale. Family Practice Research Journal, 13, 15-24.
Mokhber, N., Namjoo, M., Tara, F., Boskabadi, H., Rayman, M.P., Ghayour-Mobarhan, M. & Ferns,
G. (2011). Effect of supplementation with selenium on postpartum depression: a randomized
double-blind placebo-controlled trial. The Journal of Maternal-Fetal and Neonatal Medicine,
24, 104-108.
Murakami, K., & Sasaki, S. (2010). Dietary intake and depressive symptoms: A systematic review of
observational studies. Molecular Nutrition & Food Research, 54, 471-488.
Murray, D., & Cox, J.L. (1990). Screening for depression during pregnancy with the Edinburgh
Depression Scale (EDDS). Journal of Reproductive and Infant Psychology, 8, 99-107.
Newman, E., O’Connor, D. B., & Conner, M. (2007). Daily hassles and eating behaviour: the role of
cortisol reactivity status. Psychoneuroendocrinology, 32, 125–32.
Nezlek, J. B. (2012). Multi-level modeling analysis of diary-style data. In: M. R. Mehl & T. S.
Conner. (Eds.) Handbook of research methods for studying daily life. New York, NY:
Guilford Press.
Nguyen, P.H., Grajeda, R., Melgar, P., Marcinkevage, J., DiGirolamo, A.M., Flores, R., & Martorel,
R. (2009). Micronutrient supplementation may reduce symptoms of depression in
Guatemalan women. Archivos Latinoamericanos de Nutricion, 59, 278-286.
OECD. (2013). OECD Guidelines on measuring subjective well-being. Paris: OECD Publishing.
Park, J. G., Patel, A., Curtis, D., Teller, S., & Ledlie, J. (2012, September). Online pose classification
and walking speed estimation using handheld devices. In Proceedings of the 2012 ACM
Conference on Ubiquitous Computing (pp. 113-122). ACM

Measuring Mood 46
Parker, B. A., Sturm, K, MacIntosh, C. G., Feinle, C., Horowitz, M. & Chapman, I. M. (2004).
Relation between food intake and visual analogue scale ratings of appetite and other
sensations in healthy older and young subjects. European Journal of Clinical Nutrition, 58,
212-218.
Parkinson, B., Briner, R. B., Reynolds, S. & Totterdell, P. (1995). Time frames for mood: Relations
between momentary and generalized ratings of affect. Personality and Social Psychology
Bulletin, 21, 331-339.
Pastore, D. R., Fisher, M., & Friedman, S. B. (1996). Abnormalities in weight status, eating attitudes,
and eating behaviors among urban high school students: Correlations with self-esteem and
anxiety. Journal of adolescent health, 18, 312-319.
Pavot, W., & Diener, E. (1993). Review of the Satisfaction with Life Scale. Psychological
Assessment, 5, 164-172.
Pipingas, A., Camfield, D.A., Stough, C., Cox, K. H. M., Fogg, E, Tiplady, B, …, & Scholey, A. B.
(2013). The effects of multivitamin supplementation on mood and general well-being in
healthy young adults. A laboratory and at-home mobile phone assessment. Appetite, 6, 123-
136.
Polak, M.A., Conner, T.S, Reeder, T., Harper, M.J., &. Houghton, L.A. (in preparation). Suitability
of vitamin D3 supplementation over winter in healthy premenopausal women to ward off the
‘winter blues.
Polak, M.A., Houghton, L.A., Reeder, T., Harper, M.J., & Conner, T.S. (2014). Serum 25-
hydroxyvitamin D concentrations and depressive symptoms among young adult men and
women. Manuscript submitted for publication.
Poslusna, K., Ruprich, J., de Vries, J. H., Jakubikova, M., & van't Veer, P. (2009). Misreporting of
energy and micronutrient intake estimated by food records and 24 hour recalls, control and
adjustment methods in practice. British Journal of Nutrition, 101, S73-S85.

Measuring Mood 47
Rachuri, K. K. (2012) Smartphones based Social Sensing: Adaptive Sampling, Sensing and
Computation Offloading. University of Cambridge. Retrieved from
https://www.cl.cam.ac.uk/~cm542/phds/kiranrachuri.pdf
Rachuri, K. K., Mascolo, C., Musolesi, M., & Rentfrow, P. J. (2011, September). SociableSense:
exploring the trade-offs of adaptive sampling and computation offloading for social sensing.
In Proceedings of the 17th Annual International Conference on Mobile Computing and
Networking (pp. 73-84). ACM
Radloff, L. S. (1977). The CES-D Scale: A self-report depression scale for research in the general
population. Applied Psychological Measurement, 1, 385-401
Rahe, C, Unrath, M, & Berger, K. (2014). Dietary patterns and the risk of depression in adults: a
systematic review of observational studies. European Journal of Nutrition, 53, 997-1013.
Richter, P., Werner, J., Heerlein, A., Kraus, A. & Sauer, H. (1998). On the Validity of the Beck
Depression Inventory. Psychopathology, 31, 160–168
Rooney, C., McKinley, M. C., & Woodside, J. V. (2013). The potential role of fruit and vegetables in
aspects of psychological well-being: a review of the literature and future directions. The
Proceedings of the Nutrition Society, 72, 420-432.
Rucklidge, J. J., & Kaplan, B.J. (2013). Broad-spectrum micronutrient formulas for the treatment of
psychiatric symptoms: A systematic review. Expert Review of Neurotherapeutics, 13, 49-73.
Russell, J. A. (2003). Core affect and the psychological construction of emotion. Psychological
Review, 110, 145-172.
Ryan, R. M., Huta, V., & Deci, E. L. (2008). Living well: A self-determination theory perspective on
eudaimonia. Journal of Happiness Studies, 9, 139-170.
Ryff, C. D. & Keyes, C. L. M. (1995). The structure of psychological well-being revisited. Journal
of Personality and Social Psychology, 69, 719-727.

Measuring Mood 48
Sarris, J., McIntyre, E., & Camfield, D. A. (2013). Plant-based medicines for anxiety disorders, part
2: a review of clinical studies with supporting preclinical evidence. CNS drugs, 27(4), 301-
319.
Sayegh, R., Schiff, I., Wurtman, J., Spiers, P., McDermott, J., & Wurtman, R. (1995). The effect of a
carbohydrate-rich beverage on mood, appetite, and cognitive function in women with
premenstrual syndrome. Obstetrics & Gynecology, 86, 520-528.
Schlotz, W. (2011). Ambulatory Psychoneuroendocrinology: Assessing Salivary Cortisol and Other
Hormones in Daily Life. In: M. R. Mehl & T. S. Conner. (Eds.) Handbook of research
methods for studying daily life. New York, NY: Guilford Press.
Shiffman, S., Stone, A., & Hufford, M. R. (2008). Ecological Momentary Assessment. Annual
Review of Clinical Psychology, 4, 1–32
Shrout, P. E. & Lane, S. P. (2012). Psychometrics. In: M. R. Mehl & T. S. Conner. (Eds.) Handbook
of research methods for studying daily life. New York, NY: Guilford Press.
Smriga, M., Ando, T., Akutsu, M., Furukawa, Y., Miwa, K., & Morinaga, Y. (2007). Oral treatment
with L-lysine and L-arginine reduces anxiety and basal cortisol levels in healthy humans.
Biomedical research (Tokyo, Japan), 28, 85-90.
Spielberger, C. D. (1983). Manual for the State-Trait Anxiety Inventory: STAI (Form Y). Palo Alto,
CA: Consulting Psychologists Press.
Spielberger, C. D., Gorsuch, R. L., Lushene, R., Vagg, P. R., & Jacobs, G. A. (1983). Manual for the
State-Trait Anxiety Inventory. Palo Alto, CA: Consulting Psychologists Press.
Stein, R. I., Kenardy, J., Wiseman, C. V., Dounchis, J. Z., Arnow, B. A., & Wilfley, D. E. (2007).
What's driving the binge in binge eating disorder? A prospective examination of precursors
and consequences. International Journal of Eating Disorders, 40, 195-203.
Stone, A. A., Kessler, R. C., & Haythomthwatte, J. A. (1991). Measuring daily events and
experiences: Decisions for the researcher. Journal of Personality, 59, 575-607.

Measuring Mood 49
Tanskanen, A., Hibbeln, J.R., Tuomilehto, J., Uutela, A., Haukkala, A., Vilnamäki, H., Vartianinen,
E. (2001). Fish consumption and depressive symptoms in the general population in Finland.
Psychiatric Services, 52, 529-531.
Tennant, R., Hiller, L., Fishwick, R, Platt, S., Joseph, S., Weich, S., … & Stewart-Brown, S. (2007).
The Warwick-Edinburgh Mental Wellbeing Scale (WEMWBS): Development and UK
validation. Health and Quality of Life Outcomes, 5, doi:10.1186/1477-7525-5-63
Tomiyama, A. J., Mann, T., & Comer, L. (2009). Triggers of eating in everyday life. Appetite, 52,
72-82.
Tugade, M. M., Conner, T., & Feldman Barrett, L. (2007). Assessment of mood. In S. Ayers, C.
McManus, S. Newman, K. Wallston, J. Weinman & R. West (Eds.), The Cambridge
handbook of psychology, health, and medicine. Cambridge, UK: Cambridge University Press.
Vahdat Shariatpanaahi, M., Vahdat Shariatpanaahi, Z., Moshtaaghi, M., Shahbaazi, S.H., & Abadi,
A. (2007). The relationship between depression and serum ferritin level. European Journal of
Clinical Nutrition, 61, 532-535.
Veenhoven, R. (2003). Hedonism and happiness. Journal of Happiness Studies, 4, 437-457.
Watkins, L. L., Connor, K. M., & Davidson, J. R. (2001). Effect of kava extract on vagal cardiac
control in generalized anxiety disorder: preliminary findings. Journal of
Psychopharmacology, 15, 283-286.
Watson, D., & Clark, L. A. (1994). The PANAS-X: Manual for the Positive and Negative Affect
Schedule-Expanded Form. Ames: The University of Iowa.
Watson, D., Clark, L. A., & Tellegen, A. (1988). Development and validation of brief measures of
positive and negative affect: The PANAS scales. Journal of Personality and Social
Psychology, 54, 1063-1070.

Measuring Mood 50
White, B. A, Horwath, C. C., & Conner, T. S. (2013). Many apples a day keep the blues away--daily
experiences of negative and positive affect and food consumption in young adults. British
Journal of Health Psychology, 18, 782–98.
Williams, E., Stewart-Knox, B., McConville, C., Bradbury, I., Armstrong, N.C., & McNulty, H.
(2008). Folate status and mood: Is there a relationship? Public Health Nutrition, 11, 118-123.
Woo, J., Lynn, H., Lau, W.Y., Leung, J., Lau, E., Wong, S.Y.S., & Kwok, T. (2006). Nutrient intake
and psychological health in an elderly Chinese population. International Journal of Geriatric
Psychiatry, 21, 1036-1043.
Yannakoulia, M., Panagiotakos, D. B., Pitsavos, C., Tsetsekou, E., Fappa, E., Papageorgiou, C., &
Stefanadis, C. (2008). Eating habits in relations to anxiety symptoms among apparently
healthy adults. A pattern analysis from the ATTICA Study. Appetite, 51, 519-525.
Yesavage, J.A., Brink, T.L., Rose, T.L., Lum, O., Huang, V., Adey, M., & Otto Leirer, V. (1983).
Development and validation of a Geriatric Depression Scale: A preliminary report. Journal of
Psychiatric Research, 17, 37-49.
Yi, S., Nanri, A., Poudel-Tandukar, K., Nonaka, D., Matsushita, Y., Hori, A., & Mizoue, T. (2011).
Association between serum ferritin concentrations and depressive symptoms in Japanese
municipal employees. Psychiatry Research, 189, 368-372.
Zigmond, A.S., & Snaith, R.P. (1983). The Hospital Anxiety and Depression Scale. Acta
Psychiatrica Scandinavica, 67, 361-370.