Measuring Market Opportunities: Forecasting and Market Knowledge 5.
40
Measuring Market Opportunities: Forecasting and Market Knowledge 5
-
Upload
loraine-davis -
Category
Documents
-
view
278 -
download
2
Transcript of Measuring Market Opportunities: Forecasting and Market Knowledge 5.

Measuring Market Opportunities: Forecasting and Market Knowledge
5

Copyright 2008 by The McGraw-Hill Companies, Inc. All rights reserved.
Key Questions Before Making a Forecast. Purpose of the forecast?
What specifically needs to be forecast? Importance of the past to the future? Method(s) to be used for forecasting? What could change the forecast? Forecast horizon? Long term ≥ 10 yrs; Medium
Term: up to 5 yrs; Short term: up to 1 year.

Copyright 2008 by The McGraw-Hill Companies, Inc. All rights reserved.
The Sales Forecast. Is based on a specific marketing plan. Stated as dollars or units. Estimate market and sales potential first. Establish marketing goals and broad
strategies before making a sales forecast. Typically covers a 1-year period. Once made, the forecast becomes a key
controlling factor in all operational planning throughout the company.
Copyright 2008 by The McGraw-Hill Companies, Inc. All rights reserved.
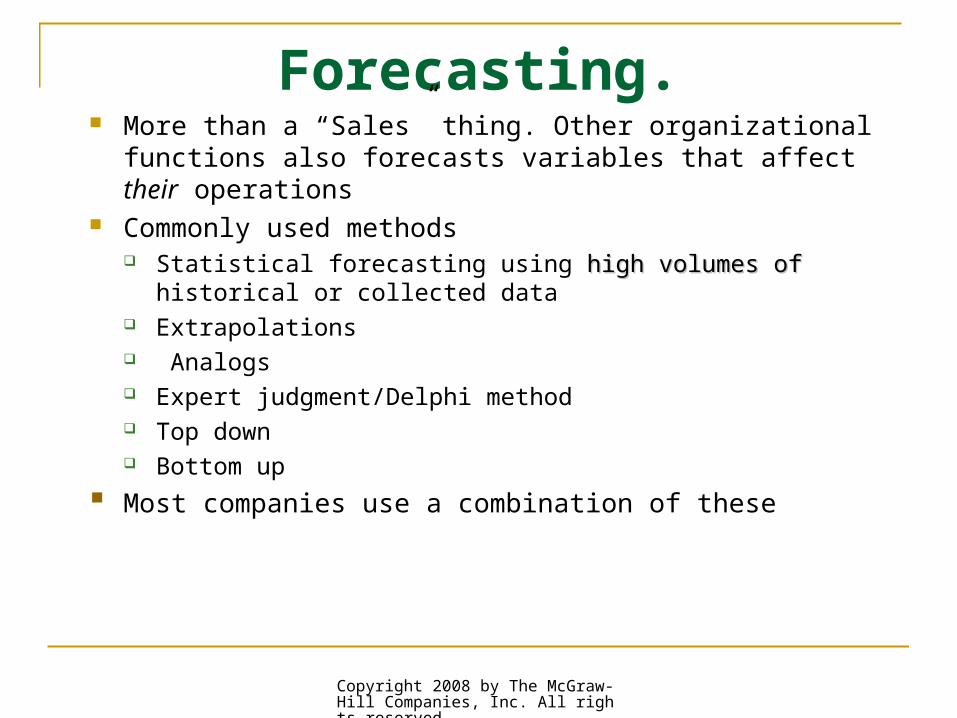
Forecasting. More than a “Sales” thing. Other organizational functions also
forecasts variables that affect their operations Commonly used methods
Statistical forecasting using high volumes of high volumes of historical or collected data
Extrapolations Analogs Expert judgment/Delphi method Top down Bottom up
Most companies use a combination of these

Copyright 2008 by The McGraw-Hill Companies, Inc. All rights reserved.
Top Down vs. Bottom Up.
Top Down: Assumption - international and national events affect the future behaviour of local variables
Forecast of economic conditions and industry trends. Determine the product’s market potential Determine its sales potential Measure the firm’s current or desired market share Forecast sales for the firm
Bottom Up: Assumption - local events affect the future behaviour of global variables
Develop customers/salespeople input for future demand Combine the estimates to get a total forecast. Adjust the forecast by managerial insights, competition, and
general economic trends.

Copyright 2008 by The McGraw-Hill Companies, Inc. All rights reserved.
Discussion Question
1. Of the two main approaches for sales forecasting - top-down and bottom-up - which is better? Why?

Copyright 2008 by The McGraw-Hill Companies, Inc. All rights reserved.
Forecast is Projecting Evidence. Evidence from:
History Field/Market research Other organizations Alternative future possibilities Plans, strategies, and actions for future Issues Changes Etc.
Copyright 2008 by The McGraw-Hill Companies, Inc. All rights reserved.
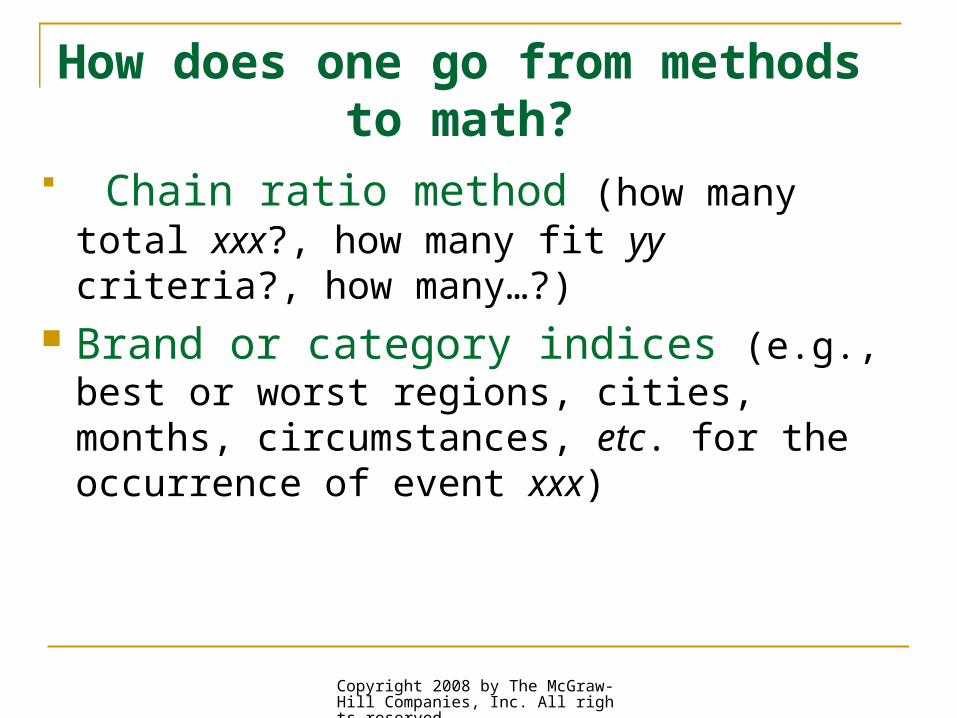
How does one go from methods to math?
Chain ratio method (how many total xxx?, how many fit yy criteria?, how many…?)
Brand or category indices (e.g., best or worst regions, cities, months, circumstances, etc. for the occurrence of event xxx)

Ideas for new products or new ventures: How fast will
customers adopt?
Earlymajority34%
Latemajority34%
Earlyadopters13.5% 16%
2.5%
Innovators
Laggardsand Non-adopters
Source: Adapted with permission from Marketing, 11/e, Acetate 8-8, by Michael J. Etzel, Bruce J. Walker, and William J. Stanton. The McGraw-Hill Companies, Inc. © 1997. All rights reserved.

Copyright 2008 by The McGraw-Hill Companies, Inc. All rights reserved.
Discussion Question
4. How fast will the adoption curve move for a particular innovation?

Targeting Attractive Market Segments
6

Copyright 2008 by The McGraw-Hill Companies, Inc. All rights reserved.
Discussion Questions
1. What’s a market?
2. What’s a market segment?

Copyright 2008 by The McGraw-Hill Companies, Inc. All rights reserved.
Objectives of Market Segmentation Identify a homogeneous segment
that differs from other segments Specify criteria that define the
segment Determine segment size and
potential

Copyright 2008 by The McGraw-Hill Companies, Inc. All rights reserved.
Defining Market SegmentsThree good ways to do it.
Who the customers are Where they are How they behave

Copyright 2008 by The McGraw-Hill Companies, Inc. All rights reserved.
Segmentation variables.Geographic: Region, country, population
density, climate…
Demographic: Age, gender, income, occupation, What else???…

Copyright 2008 by The McGraw-Hill Companies, Inc. All rights reserved.
Segmentation variables.Psychographics: personality, lifestyles, values,
attitudes…
Behavioral: benefits sought, usage rate, brand
loyalty, end use, readiness to buy, decision
maker(s)…
(George Day, 1980) Top-down approach: start
with the total population and divide it into
segments. Bottom-up approach: start with a
single customer and build on that profile

Which Segments to Target? Constructing a Market
Attractiveness/Competitive-Position Matrix
1. Choose criteria to measure 1. Choose criteria to measure market attractiveness and market attractiveness and
competitivecompetitive2. Weigh market attractiveness and 2. Weigh market attractiveness and
competitive position factors to reflect their competitive position factors to reflect their relative importance.relative importance.
3. Assess the current position of each 3. Assess the current position of each potential target market on each factor.potential target market on each factor.
4. Project the future position of each market based on 4. Project the future position of each market based on expected environmental, customer, and competitive expected environmental, customer, and competitive
trendstrends
5. Evaluate implications of possible future changes 5. Evaluate implications of possible future changes for business strategies and resources for business strategies and resources
requirements.requirements.

A Useful Tool for Assessing Market Segments: Segment Rating Chart
WEIGHT RATING (0-10) TOTAL
Market attractiveness factors
Customer needs and behavior .5 10 5.0
Segment size and growth rate .3 7 2.1
Macro trends .2 8 1.6
Total: Market attractiveness 1.0 8.7
Competitive position factors
Opportunity for competitive advantage
.6 7 4.2
Capabilities and resources .2 5 1.0
Industry attractiveness .2 7 1.4
Total: Competitive position 1.0 6.6
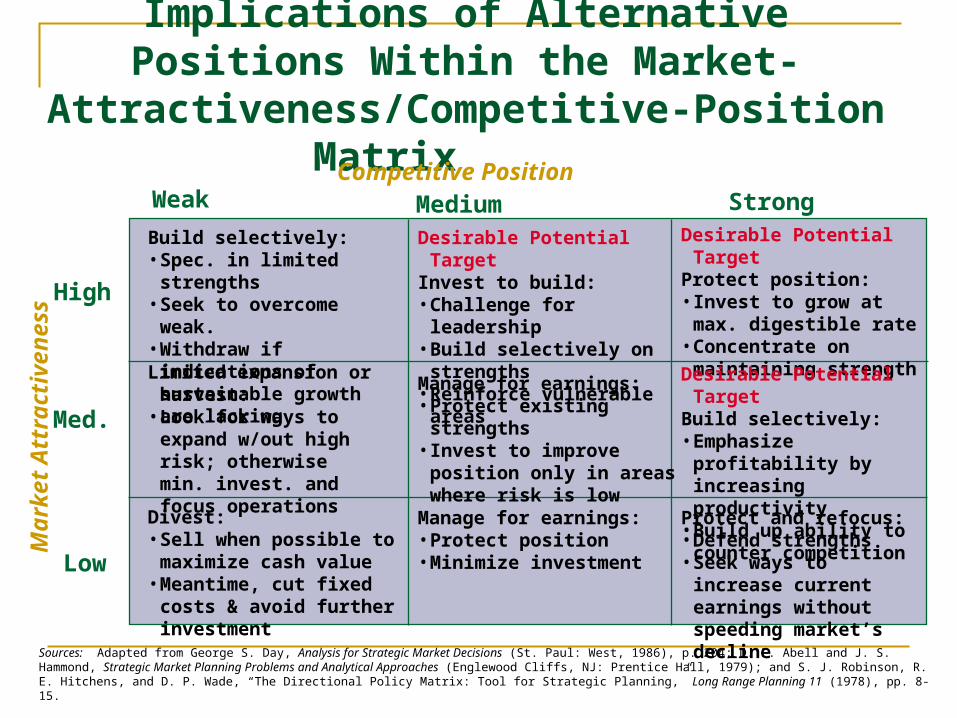
Implications of Alternative Positions Within the
Market-Attractiveness/Competitive-Position Matrix
High
Low
Med.
Mar
ket
Att
ract
iven
ess
Competitive PositionStrongMediumWeak
Desirable Potential TargetProtect position:• Invest to grow at max.
digestible rate• Concentrate on
maintaining strength
Desirable Potential TargetInvest to build:• Challenge for leadership• Build selectively on
strengths• Reinforce vulnerable areas
Build selectively:• Spec. in limited strengths• Seek to overcome weak.• Withdraw if indications of
sustainable growth are lacking
Desirable Potential TargetBuild selectively:• Emphasize profitability by
increasing productivity• Build up ability to counter
competition
Manage for earnings:• Protect existing strengths• Invest to improve position
only in areas where risk is low
Limited expansion or harvest:
• Look for ways to expand w/out high risk; otherwise min. invest. and focus operations
Protect and refocus:• Defend strengths• Seek ways to increase
current earnings without speeding market’s decline
Manage for earnings:• Protect position• Minimize investment
Divest:• Sell when possible to
maximize cash value• Meantime, cut fixed costs &
avoid further investment
Sources: Adapted from George S. Day, Analysis for Strategic Market Decisions (St. Paul: West, 1986), p. 204; D. F. Abell and J. S. Hammond, Strategic Market Planning Problems and Analytical Approaches (Englewood Cliffs, NJ: Prentice Hall, 1979); and S. J. Robinson, R. E. Hitchens, and D. P. Wade, “The Directional Policy Matrix: Tool for Strategic Planning,” Long Range Planning 11 (1978), pp. 8-15.

Differentiation and Positioning
7

Copyright 2008 by The McGraw-Hill Companies, Inc. All rights reserved.
What is Positioning?
A couple of definitions Creating distinct and valued physical and
perceptual differences between one’s product and its competitors, as perceived by the target customer.
The act of designing the firm’s market offering so that it occupies a distinct and valued place in the minds of its target customers.

Copyright 2008 by The McGraw-Hill Companies, Inc. All rights reserved.
Other Positioning Strategies
Re-positioning: changing the identity of a product, relative to the identity of competing products, in the collective minds of the target market.
De-positioning: attempting to change the identity of competing products, relative to the identity of your own product, in the collective minds of the target market.

Copyright 2008 by The McGraw-Hill Companies, Inc. All rights reserved.
Positioning Concepts three types: Functional positions
Solve problems Provide benefits to customers Get favorable perception by investors and lenders
Symbolic positions Self-image enhancement Ego identification Belongingness and social meaningfulness Affective fulfillment
Experiential positions Provide sensory stimulation Provide cognitive stimulation

Copyright 2008 by The McGraw-Hill Companies, Inc. All rights reserved.
Physical vs. Perceptual Positioning Analysis
Exhibit 7.3
Physical positioning• Technical orientation• Physical characteristics• Objective measures• Data readily available• Physical brand properties
• Large number of dimensions
• Represents impact of product specs and price
• Direct R&D implications
Perceptual positioning• Consumer orientation• Perceptual attributes• Perceptual measures• Need for marketing research• Perceptual brand positions
and positioning intensities• Limited number of dimensions
• Represents impact of product specs and communication
• R&D implications need to be interpreted

Copyright 2008 by The McGraw-Hill Companies, Inc. All rights reserved.
Product Mix StrategiesMarket penetration versus market skimming
PremiumGoods
Penetra-tion
SuperBargain
Over-Pricing
AverageQuality
Bargain
Hit andRun
ShoddyGoods
CheapGoods
Medium
High
Low
Qu
ality
Price
High Medium Low

Generic Competitive StrategiesExhibit 7.1
Lower Cost Differentiation
Broad TargetCost
Leadership Strategy
Differentiation Strategy
Narrow Target
Focus Strategy
Focus Strategy
(Differentiation Based)
Competitive Advantage
CompetitiveScope
Source: Adapted from Michael Porter, Competitive Advantage,New York: The Free Press, 1985, p. 12.

Copyright 2008 by The McGraw-Hill Companies, Inc. All rights reserved.
Steps in the Positioning Process
Exhibit 7.4 (1 of 2)
1. Identify a relevant set of competitive products serving a 1. Identify a relevant set of competitive products serving a target market.target market.
2. Identify the set of determinant attributes that define the “product 2. Identify the set of determinant attributes that define the “product space” in which positions of current offerings are located.space” in which positions of current offerings are located.
3. Collect information from a sample of customers and 3. Collect information from a sample of customers and potential customers about perceptions of each product on the potential customers about perceptions of each product on the
determinant attributes.determinant attributes.
4. Determine product’s current location (positioning) in the product 4. Determine product’s current location (positioning) in the product space and intensity thereof.space and intensity thereof.
Copyright 2008 by The McGraw-Hill Companies, Inc. All rights reserved.
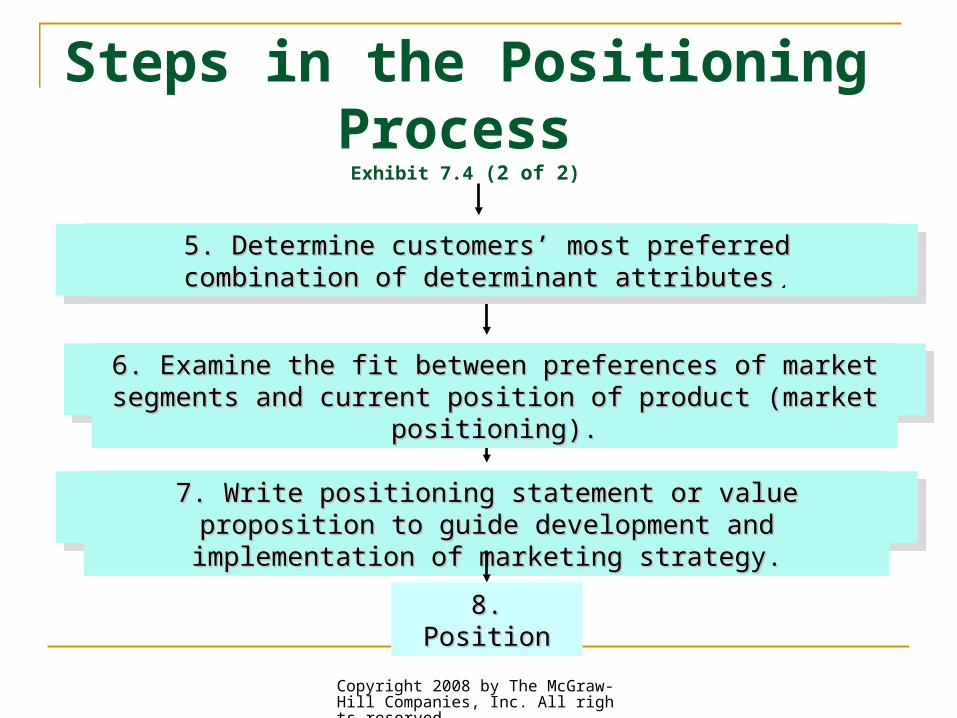
Steps in the Positioning Process
Exhibit 7.4 (2 of 2)
5. Determine customers’ most preferred combination of 5. Determine customers’ most preferred combination of determinant attributesdeterminant attributes..
6. Examine the fit between preferences of market segments and 6. Examine the fit between preferences of market segments and current position of product (market positioning).current position of product (market positioning).
7. Write positioning statement or value proposition to guide 7. Write positioning statement or value proposition to guide development and implementation of marketing strategy.development and implementation of marketing strategy.
8. Position8. Position

Copyright 2008 by The McGraw-Hill Companies, Inc. All rights reserved.
Some Key Questions Concerning Positioning Decisions
For whom are they written? In what sort of language? Should they focus on features or
benefits? How many differentiating attributes
should anchor them?

Marketing Strategies for
New Market Entries
8
Copyright 2008 by The McGraw-Hill Companies, Inc. All rights reserved.
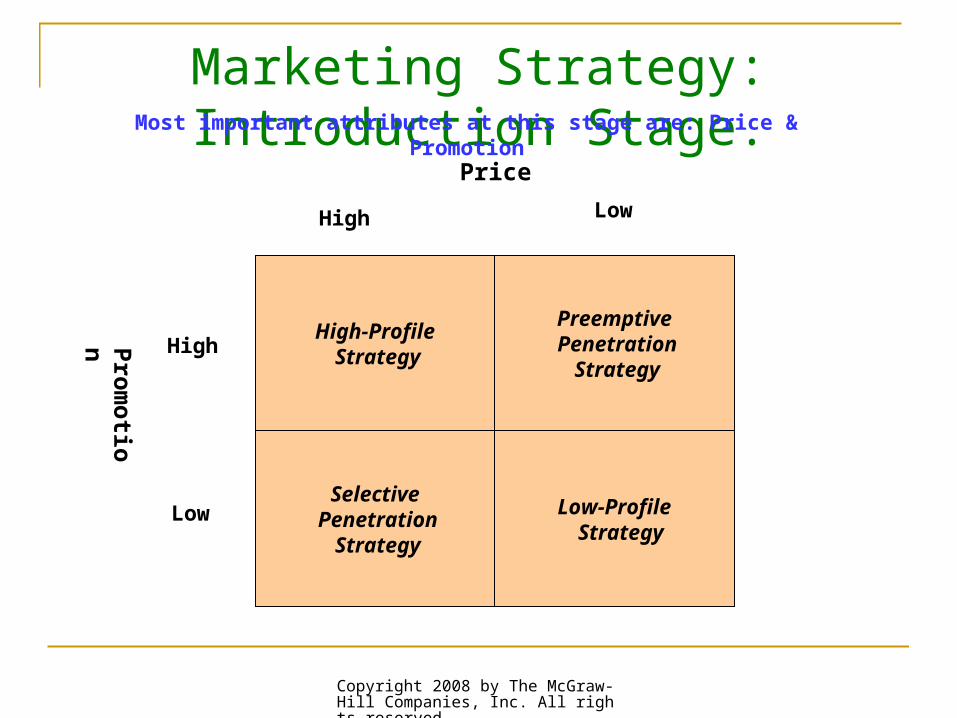
Marketing Strategy: Introduction Stage.
Price
High Low
Pro
mo
tion High
Low
High-Profile Strategy
Preemptive Penetration
Strategy
Selective Penetration
Strategy
Low-Profile Strategy
Most important attributes at this stage are: Price & Promotion

Copyright 2008 by The McGraw-Hill Companies, Inc. All rights reserved.
Marketing Strategy: Introduction Stage.1.High-Profile Strategy (High price-High Promotion)When? - High control over offering - Low fear of competition
2. Selective Penetration Strategy (High Price-Low Promotion)When? - High profitability - High fear of competition
3. Preemptive Penetration Strategy (Low Price-High Promotion)When? - Strongly felt buyer need - Easy competitive entry
4. Low-Profile Strategy (Low Price-Low Promotion)When? - Current Production constraints - Large potential market

How do opportunities evolve
over time?
Source: Reprinted with permission from p. 60 of Analysis for Strategic Marketing Decisions, by George Day. Copyright © 1986 by West Publishing Company. All rights reserved.
Time (years)
Pro
du
ct c
ateg
ory
sal
es(r
eal d
olla
rs)
Pro
fit
per
un
it(r
eal d
olla
rs)
Profit/unitSales
Life cycleextension
GrowthCompetitiveturbulence
Maturity Decline orextension
Introduction
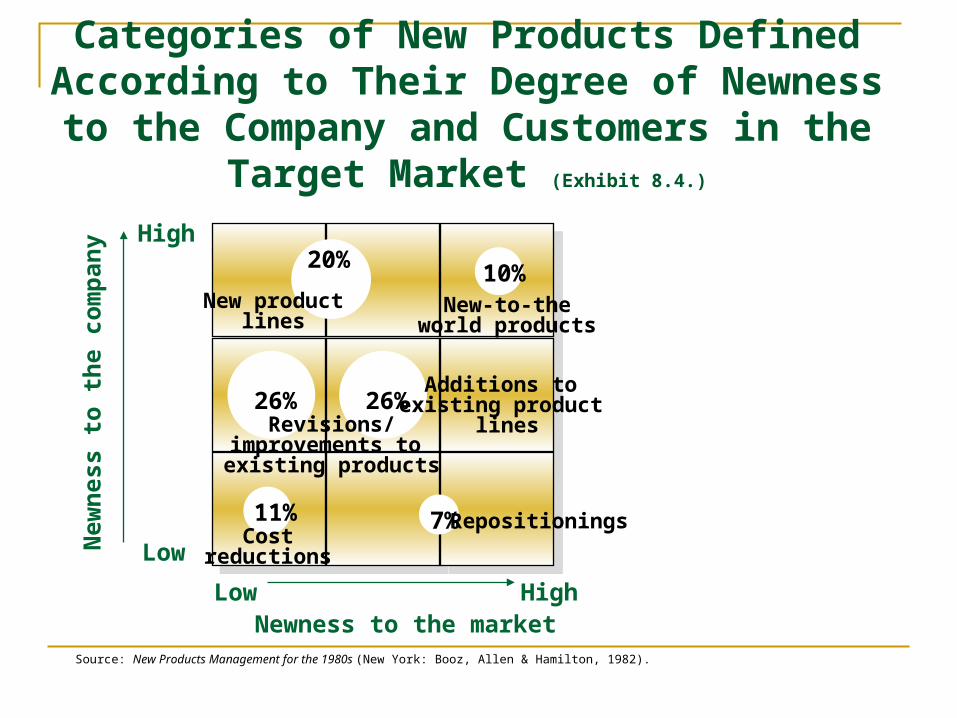
Categories of New Products Defined According to Their Degree of Newness to the Company and Customers in the
Target Market (Exhibit 8.4.)
High
Low
Low HighNewness to the market
Source: New Products Management for the 1980s (New York: Booz, Allen & Hamilton, 1982).
New
nes
s to
th
e co
mp
any
26% 26%
20%
New productlines
Revisions/improvements to existing products
11%Cost
reductions
7%
Additions to existing product
lines
Repositionings
10%New-to-the
world products
Copyright 2008 by The McGraw-Hill Companies, Inc. All rights reserved.
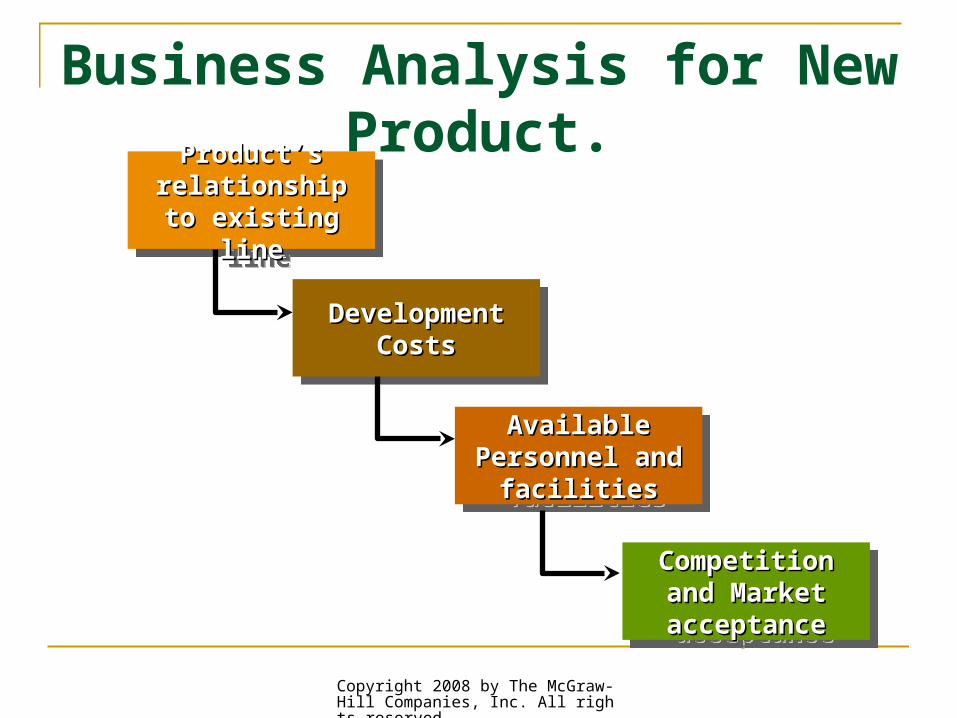
Business Analysis for New Product.
Product’s Product’s relationship to relationship to
existing lineexisting line
Product’s Product’s relationship to relationship to
existing lineexisting line
Development Development CostsCosts
Development Development CostsCosts
Available Available Personnel and Personnel and
facilitiesfacilities
Available Available Personnel and Personnel and
facilitiesfacilities
Competition and Competition and Market Market
acceptanceacceptance
Competition and Competition and Market Market
acceptanceacceptance

Copyright 2008 by The McGraw-Hill Companies, Inc. All rights reserved.
Discussion Question
1.Is it better to be a market pioneer, or a follower?

Copyright 2008 by The McGraw-Hill Companies, Inc. All rights reserved.
Some Advice for Would-Be Pioneers
Being a pioneer without the basis for sustainable competitive advantage is a trap!
First mover advantage is trumped by pioneers who are better. Best beats first. Concentrate on being best.

Copyright 2008 by The McGraw-Hill Companies, Inc. All rights reserved.
Discussion Question
2. When, and for whom, does it make sense to pursue a pioneer strategy?

Copyright 2008 by The McGraw-Hill Companies, Inc. All rights reserved.
Discussion Question
3. When, and for whom, does it make sense to pursue a follower strategy?

Strategies for Growth Markets
9