Measuring Agricultural Innovation System Properties and Performance

c h a p t e r 6
...................................................................................................................................................
M E A S U R I N G
I N N OVAT I O N...................................................................................................................................................
k e i t h s m i t h
6.1 Introduction1
........................................................................................................................................................................................
It is sometimes suggested that innovation is inherently impossible to quantify and
to measure. This chapter argues that while this is true for some aspects of innovation,
its overall characteristics do not preclude measurement of key dimensions of
processes and outputs. An important development has been the emergence of new
indicators of innovation inputs and outputs, including economy-wide measures
that have some degree of international comparability. Following sections discuss
Wrst some broad issues in the construction and use of science, technology, and
innovation (STI) indicators, then turn (brieXy) to the strengths and weaknesses of
current indicators, particularly R&D and patents. Final sections cover recent initia-
tives focusing on the conceptualization, collection, and analysis of direct measures of
innovation.
New rather than ‘‘traditional’’ indicators are emphasized here because, as Kenneth
Arrow remarked many years ago, ‘‘too much energy has gone into squeezing the last
bit of juice out of old data collected for diVerent purposes relative to the design of
new types of data,’’ a point echoed by Zvi Griliches: ‘‘far too little fresh economics
data is collected’’ (Arrow 1984: 51; Griliches 1987: 824). Innovation data producers
have responded to this kind of challenge. The most important development has been
new survey-based indicators, especially the Community Innovation Survey (CIS),
g g p p gFagerberg / The Oxford Handbook of Innovation First Proof 29.5.2004 7:21pm page 148

which has been carried out three times in all EU Member States. The basic format of
CIS has diVused to many other countries (including Canada, Australia, Hungary,
Brazil, Argentina, and China). Has this eVort been justiWed? In answering this
much depends on the quality of analysis these surveys make possible, so the Wnal
section discusses the rapidly growing research and publication eVorts deriving
from CIS.
6.2 The Conceptual Background:
Measurement Issues
........................................................................................................................................................................................
Measurement implies commensurability: that there is at least some level on which
entities are qualitatively similar, so that comparisons can be made in quantitative
terms.
An immediate problem is that innovation is, by deWnition, novelty. It is the
creation of something qualitatively new, via processes of learning and knowledge
building. It involves changing competences and capabilities, and producing quali-
tatively new performance outcomes. This may lead to new product characteristics
that are intrinsically measurable in some way—new lift/drag aspects of an aircraft
wing, for example, or improved fuel eYciency of an engine. However, such technical
measurement comparisons are only rarely meaningful across products. More
generally, innovation involves multidimensional novelty in aspects of learning
or knowledge organization that are diYcult to measure or intrinsically non-
measurable. Key problems in innovation indicators therefore concern the under-
lying conceptualization of the object being measured, the meaning of the
measurement concept, and the general feasibility of diVerent types of measurement.
Problems of commensurability are not necessarily insoluble, but a main point
arising from recent work is the need for care in distinguishing between what can
and what cannot be measured in innovation.
Quite apart from the problem of whether novelty can be measured, a fundamental
deWnitional issue is what we actually mean by ‘‘new’’ (see Ch. 1 by Fagerberg in this
volume). Does an innovation have to contain a basic new principle that has never
been used in the world before, or does it only need to be new to a Wrm? Does an
innovation have to incorporate a radically novel idea, or only an incremental
change? In general, what kinds of novelty count as an innovation? These issues of
commensurability and novelty are basic problems for all S&T indicators—R&D in
particular—but have been most explicitly addressed in the development of direct
innovation indicators.
g g p p gFagerberg / The Oxford Handbook of Innovation First Proof 29.5.2004 7:21pm page 149
measuring innovation 149
6.3 Theories of Innovation and their
Use in Indicator Development
........................................................................................................................................................................................
Although statistics are often treated as though their meanings are transparent, they
always rest on some kind of (usually implicit) conceptual foundations. The system of
national accounts, for example, derives from Keynesian macroeconomic concepts
that seek to identify components of aggregate demand. R&D data has a complex
background in the scientiWcation of innovation—the notion that acts of research
and discovery underpin innovation (Laestadius 2003). These conceptual founda-
tions are rarely considered when indicators are used. Such issues are complicated by
the fact that some key S&T indicators are by-products of other processes—legal
procedures (as with patents), or academic institutions (as with bibliometrics, which
rest on publishing conventions ).
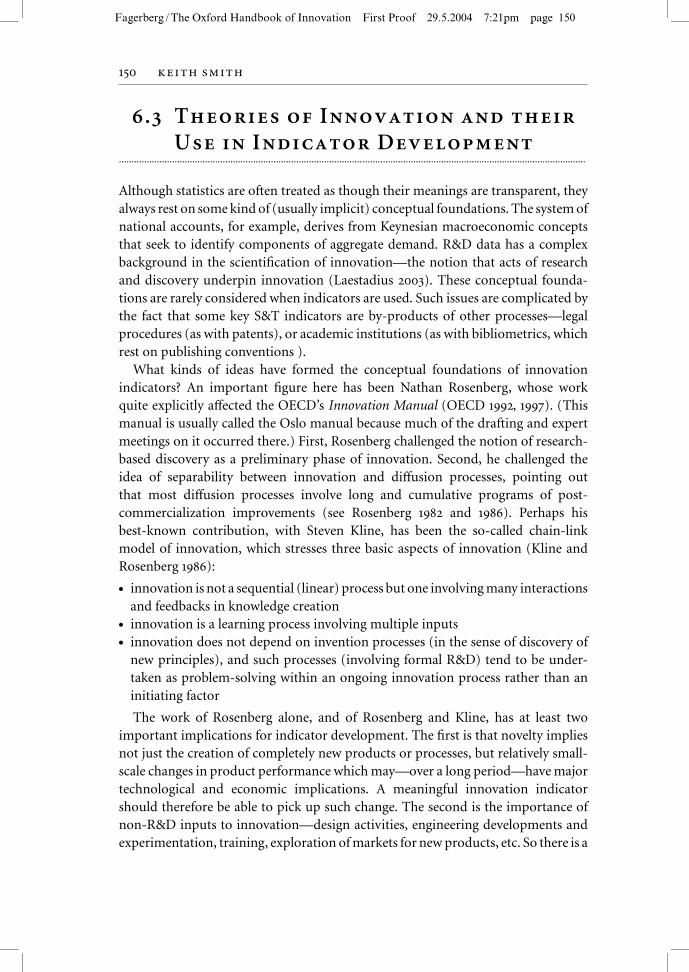
What kinds of ideas have formed the conceptual foundations of innovation
indicators? An important Wgure here has been Nathan Rosenberg, whose work
quite explicitly aVected the OECD’s Innovation Manual (OECD 1992, 1997). (This
manual is usually called the Oslo manual because much of the drafting and expert
meetings on it occurred there.) First, Rosenberg challenged the notion of research-
based discovery as a preliminary phase of innovation. Second, he challenged the
idea of separability between innovation and diVusion processes, pointing out
that most diVusion processes involve long and cumulative programs of post-
commercialization improvements (see Rosenberg 1982 and 1986). Perhaps his
best-known contribution, with Steven Kline, has been the so-called chain-link
model of innovation, which stresses three basic aspects of innovation (Kline and
Rosenberg 1986):
. innovation is not a sequential (linear) process but one involving many interactions
and feedbacks in knowledge creation. innovation is a learning process involving multiple inputs. innovation does not depend on invention processes (in the sense of discovery of
new principles), and such processes (involving formal R&D) tend to be under-
taken as problem-solving within an ongoing innovation process rather than an
initiating factor
The work of Rosenberg alone, and of Rosenberg and Kline, has at least two
important implications for indicator development. The Wrst is that novelty implies
not just the creation of completely new products or processes, but relatively small-
scale changes in product performance which may—over a long period—have major
technological and economic implications. A meaningful innovation indicator
should therefore be able to pick up such change. The second is the importance of
non-R&D inputs to innovation—design activities, engineering developments and
experimentation, training, exploration of markets for new products, etc. So there is a
g g p p gFagerberg / The Oxford Handbook of Innovation First Proof 29.5.2004 7:21pm page 150
150 keith smith

need for input indicators that reXect this input variety and its diverse distributions
across activities.
The CIS eVort has in general been informed by ideas from recent innovation
research. One in particular should be mentioned, especially because it has had a
strong impact on research using the new data. This is the idea that innovation relies
on collaboration and interactive learning, involving other enterprises, organiza-
tions, and the science and technology infrastructure. Data gatherers have been
concerned to explore the networking dimension of innovation, and this has been
an important conceptual issue in survey design (see Howells 2000, for an overview of
research on this topic).
6.3.1 Existing and New Indicators: What Can Be Measured,
and What are the Limitations?
What does it mean to measure qualitatively diverse phenomena? Clearly this is a
serious problem for R&D data. Research is a knowledge-creating process for which
both activities and outcomes are radically incommensurable—there is no meaningful
way to assess the dissimilar actions and events that feed into research, let alone to
compare the increments to knowledge that follow from research. This problem cannot
be overcome—it can only be circumvented by carefully specifying aspects of the
research process that are in some serious sense measurable. The solution adopted
by the framers of the Frascati Manual (the OECD’s operating statistical manual
for R&D data collection) has been to write deWnitions of research-comprising
activities, and then seek data on either expenditure or personnel resources devoted
to such activities. The measurement concept for R&D is therefore economic in
character, and the datasets that result are collections of economic indicators
compatible with industrial datasets, and indeed with the national accounts.2
This approach to measurement has also been taken with innovation surveys. The
problem is that innovation is usually conceptualized in terms of ideas, learning, and
the creation of knowledge (moreover knowledge creation of a far wider character
than research), or in terms of competences and capabilities. As with ‘‘research,’’
innovation is a multidimensional process, with nothing clearly measurable about
many aspects of the underlying process. Most modern innovation theory rests on
some kind of ‘‘resource-based’’ theory of the Wrm, in which Wrms create physical and
intangible assets that underpin capabilities (see Lazonick in this volume). Innovative
learning can be seen as change in the knowledge bases on which capabilities rest.
Neither learning, nor the capabilities which result, seem to be measurable in any
direct way. However, just as ‘‘research’’ can be captured via expenditures on certain
activities, or by the use of time by certain research personnel, so learning processes
can to some extent be captured by activities such as design, training, market
g g p p gFagerberg / The Oxford Handbook of Innovation First Proof 29.5.2004 7:21pm page 151
measuring innovation 151

research, tooling up, etc. Expenditure on such activities can in principle be measured
(of course the practice may be diYcult, since some of these innovation-related
activities are not straightforwardly reXected in the accounting procedures of
Wrms). On the output side, the question is whether capability outcomes can be
measured by some tangible change in physical or economic magnitudes. Once again
there are also potential measurement areas—experience (with pilot or experimental
surveys in the 1980s) showed that Wrms can identify changes in their product mixes,
and can estimate sales from new or changed products (Smith 1992). So it is possible
to deWne product change, in terms of construction, use of materials, technical
attributes, or performance characteristics, and then to look at the place of (diVer-
ently) changed products in the sales of the Wrm. These considerations lead to
expenditure measures of inputs to innovation, and sales measures of outputs of
innovation. These economic measures of innovation are clearly analogous to the
measurement of research. This similarity in approach incidentally suggests that it
makes no sense to use R&D data while rejecting the use of more direct innovation
data.
6.4 Current Major Indicators
........................................................................................................................................................................................
This section outlines the major established indicators that have been used for
innovation analysis, and provides a brief guide to further analysis of them. There
are three broad areas of indicator use in STI analysis: Wrst, R&D data; second, data
on patent applications, grants and citations; and third, bibliometric data (that is
data on scientiWc publication and citation).
In addition to this there are three other important classes of indicators:
. technometric indicators, which explore the technical performance characteristics
of products (see e.g. Saviotti 1996 and 2001 for a theoretical view of this, and Grupp
1994 and1998 for analysis and empirical speciWcations);. synthetic indicators developed for scoreboard purposes mainly by consultants (see
World Economic Forum 2003);. databases on speciWc topics developed as research tools by individuals or groups
(such as the large Wrm database used by Pavitt and Patel, or the MERIT-CATI
database on technological collaboration developed by John Hagedoorn, or the
DISKO surveys on technological collaboration emanating from the University of
Alborg (see Patel and Pavitt 1997 and 1999, Hagedoorn and Schakenraad 1990,
and—for extensive reporting on the use of collaboration data—OECD 2001).
g g p p gFagerberg / The Oxford Handbook of Innovation First Proof 29.5.2004 7:21pm page 152
152 keith smith

The following discussion here concentrates on R&D and patents, since biblio-
metric analysis relates primarily to the dynamics of science rather than innovation
(see Moed et al. 1995, and Kaloudis 1997 for reviews of the state of the art).
6.4.1 Research and Development (R&D) Statistics and
Indicators
By far the longest-standing area of data collection is R&D. The development of R&D
statistics is currently the object of a major historical and analytical project being
carried out by Benoit Godin of the University of Quebec; his website on the history
and sociology of the Weld should be consulted by anyone interested in the evolution
of this data.3
The key OECD document for the collection of R&D statistics is the Standard
Practice for Surveys of Research and Experimental Development, better known as the
Frascati Manual. The Wrst edition was the result of an OECD meeting of national
experts on R&D statistics in Frascati, Italy, in 1963. The manual has been continu-
ously monitored and modiWed through the years: the current version of the manual,
the Frascati Manual 2002, is the seventh edition (OECD 2002). The Manual deWnes
R&D as comprising both the production of new knowledge and new practical
applications of knowledge: R&D is conceived as covering three diVerent kinds of
activities: basic research, applied research, and experimental development—these
categories are distinguished in terms of their distance from application.
It is often diYcult to draw the dividing line between what should be counted as
R&D and what should be excluded: ‘‘The basic criterion for distinguishing R&D
from related activities is the presence in R&D of an appreciable element of novelty
and the resolution of scientiWc and/or technological uncertainty, i.e. when the
Box 6.1 Bibliometric data
Bibliometric analysis, meaning the analysis of the composition and dynamics of
scientific publication and citation, revolves around the Science Citation Index and
the Institute for Scientific Information database. The Institute for Scientific Infor-
mation (ISI) was founded in 1958, and acquired by Thomson Business Information—a
subsidiary of the Thomson Corporation—in 1992. The ISI National Science Indicators
database currently contains publication and citation statistics from more than 170
countries, and 105 subfields in the sciences, social sciences, and arts and humanities,
representing approximately 5,500 journals in the sciences, 1,800 in the social sciences,
and 1,200 in the arts and humanities.
g g p p gFagerberg / The Oxford Handbook of Innovation First Proof 29.5.2004 7:21pm page 153
measuring innovation 153

solution to a problem is not readily apparent to someone familiar with the basic
stock of commonly used knowledge and techniques in the area concerned’’ (OECD
2002: 33). Education and training in general is not counted as R&D. Market research
is excluded. There are also many other activities with a scientiWc and technological
base that are kept distinct from R&D. These include such industrial activities related
to innovation as acquisition of products and licenses, product design, trial produc-
tion, training and tooling up, unless they are a component of research, as well
as the acquisition of equipment and machinery related to product or process
innovations.
R&D is often classiWed according to multiple criteria, and data is collected in
highly detailed forms. Beyond the distinction between basic research, applied
research and development the data is classiWed into sector of performance: business
enterprise, government, higher education, and private non-proWt. It also distin-
guishes between sources of Wnance, both domestic and international. Then there is
classiWcation by socio-economic objectives, and a further classiWcation by Welds of
research. These detailed classiWcations are usually ignored both by policy analysts
and researchers, who tend to focus on gross expenditure only (at industry or country
level), thereby missing most of the really interesting detail in the data. For example, a
major issue is that, when looking at R&D by Welds of research, ICT (information and
communications technologies) turns out to be the largest single category in all
countries that classify R&D data in this way. However most of the ICT research is
actually performed outside the ICT sector, in the form of systems and software
development by users.4 On the one hand, this raises interesting questions about the
cross-industry signiWcance of the ICT sector; but there are also questions about
the extent to which such activity should be classiWed as R&D at all. Concerns have
also been expressed about whether the R&D deWnitions are comprehensible to Wrms
(especially SMEs), and whether or not there is systematic undercounting of small-
Wrm R&D (Kleinknecht, Montfort, and Brouwer, 2002).
R&D data is always constrained as an innovation indicator by the fact that it
measures an input only (Kleinknecht et al. 2002). However, R&D also has funda-
mental advantages. These include the long period over which it has been collected,
the detailed subclassiWcations that are available in many countries, and the relatively
good harmonization across countries. Unfortunately a great deal of the literature
consists essentially of an attempt to match aggregate R&D measures across time and
across sectors or countries to some measure of productivity (see GriYth, Redding,
and Van Reenen (2000) for a very thorough recent example; Dowrick (2003) is a
recent survey of this very large literature). However this research eVort is limited in
two senses—on the one hand it tends to imply (along with the new growth theory,
incidentally) that R&D is the primary source of productivity growth, and on the
other it fails to exploit the basic complexity of the data that is actually available. The
disaggregation processes that are possible with R&D data continue to oVer rich and
unexploited opportunities for researchers.
g g p p gFagerberg / The Oxford Handbook of Innovation First Proof 29.5.2004 7:21pm page 154
154 keith smith

6.4.2 Policy Pitfalls: The Use and Misuse of R&D Indicators
It is worth saying something about the pitfalls of R&D as a policy indicator,
especially via the most widely-used indicator, that of ‘‘R&D Intensity.’’ This is the
ratio of R&D expenditure to some measure of output. For a Wrm, it is usually the
R&D/Sales ratio. For an industry or a country it is the ratio of business expenditure
on R&D (often known as BERD) to total production or value added. For a country it
is usually gross expenditure on R&D (GERD) to GDP.
The R&D/GDP ratio is used in two primary ways. First, it is used to characterize
industries—high BERD/GDP ratios for an industry are held to identify high-
technology activities. Second, a high GERD/GDP ratio for a country is often believed
to indicate technological progressiveness and commitment to knowledge creation
(see Godin, 2004 for an account of the historical background to these notions).
For countries, there is a distribution of GERD/GDP intensities, as Table 6.1
indicates. Both analysts and policy makers often treat a particular place in the
ranking, or the OECD average, or some particular GERD/GDP ratio as desirable
in itself. So Canada, for example, has the objective of raising its ranking to Wfth in the
OECD table; Norway has the target of reaching the OECD average for GERD/GDP;
and the EU as a whole has a target of reaching a GERD/GDP ratio of 3 per cent (it
could be argued that this target dominates EU technology policy making at the
present time). But what is the indicator really telling us?
A basic problem is that R&D intensity depends on the industrial mix. Currently
the OECD uses a four-tier model to classify industries, in which the basic criterion is
the BERD/Production ratio:
high-tech industries > 5% R&D/Production
medium high tech industries > 5% > 3% R&D/Production medium
low-tech industries > 3% > 0.9% R&D/ Production
low-tech industries > 0.9% > 0% R&D/ Production
Since industries vary considerably in their BERD/GDP ratios, the aggregate BERD/
GDP ratio may simply be an eVect of that fact that industrial structures are diVerent
across countries. A country or region with large high-R&D industries will naturally
have a higher aggregate BERD/GDP ratio than one with most of its activities in low-
R&D industries. These structural issues largely explain the diVerences in R&D
intensities across large and smaller economies (Sandven and Smith 1997). The
question then is, does a speciWc industrial structure really matter? This is question
for debate, which cannot be addressed let alone settled here (it is interestingly
explored in Pol et al. 2002); however the desirability of speciWc industrial structures
is the real issue underlying use of this aggregate indicator, though it is rarely
explicitly discussed. It is worth noting also that within an industry there tends to
be a wide distribution of R&D intensities among Wrms, so it is common to Wnd
g g p p gFagerberg / The Oxford Handbook of Innovation First Proof 29.5.2004 7:21pm page 155
measuring innovation 155

high-R&D Wrms in low-R&D industries and vice versa (Hughes 1988 discusses the
intra-industry distributions using UK data).
An important recent modiWcation of this indicator has been the addition of
‘‘acquired technology,’’ calculated as the R&D embodied in capital and intermediate
goods used by an industry, and computed via the most recent input–output table.
The method for calculating acquired R&D is to assume that the R&D embodied in a
capital good is equal to the capital good’s value multiplied by the R&D intensity of
the supplying industry. The most recent year for which relevant input–output data is
generally available is 1990. The overall structure of the classiWcation as currently used
can be seen in Table 6.2, which shows direct R&D intensities for the main industrial
groups for 1997, plus the proportion of acquired to direct R&D for 1990, the last year
for which it was calculated.
Table 6.1 GERD/GDP ratios across countries
Country GERD/GDP 2000 Percentage point deviation fromOECD mean
Sweden 3.65 (1999) 1.40
Finland 3.40 1.15
Japan 2.98 0.73
United States 2.72 0.47
Korea 2.65 0.40
Germany 2.49 0.29
France 2.18 �0.07
Netherlands 1.94 �0.26
Canada 1.87 �0.33
United Kingdom 1.85 �0.35
Austria 1.84 �0.36
Norway 1.65 �0.6
Australia 1.53 �0.72
Ireland 1.15 �1.1
Italy 1.07 �1.18
New Zealand 1.03 �1.22
Spain 0.94 �1.31
Greece 0.67 �1.58
Total OECD 2.25
Source: OECD, Main Science and Technology Indicators Database, accessed August 2003
g g p p gFagerberg / The Oxford Handbook of Innovation First Proof 29.5.2004 7:21pm page 156
156 keith smith

Table 6.2 Classification of industries based on R & D intensity
ISIC Rev 3 Direct R&DIntensity1997
Acquired R&Dintensity as %of direct R&Dintensity, 1990
High technology Industries
Aircraft and spacecraft 353 12.7 15Pharmaceuticals 2423 11.3 8Office, accounting and computing
machinery30 10.5 25
Radio, television and communicationsequipment
32 8.2 17
Medical, precision and opticalinstruments
33 7.9 29
Medium–high-technology industries
Electrical machinery and apparatus 31 3.8 42Motor vehicles and trailers 34 3.5 29Chemicals 24 exc
24232.6 18
Railroad and transport eqpt. n.e.c. 352þ359 2.8 88Machinery and eqpt n.e.c. 29 1.9 104
Medium–low-technology industries
Coke, refined petroleum products andnuclear fuel
23 0.8 30
Rubber and plastic products 25 0.9 127Other non-metallic mineral products 26 0.9 285Building and repairing of ships and
boats351 0.7 200
Basic metals 27 0.7 289Fabricated metals products 28 0.6 133
Low-technology industries
Manufacturing n.e.c. and recycling 36–37 0.4 n.a.Wood, pulp, paper, paper products,
printing and publishing20–22 0.3 167
Food products, beverages and tobacco 15–16 0.4 267
Textiles, textile products, leather andfootwear
17–19 0.3 250
Sources: OECD, Science, Technology and Industry Scoreboard 1999: Benchmarking Knowledge-BasedEconomies (Paris:OECD 1999), Annex 1, p. 106; OECD Science, Technology and Industry Scoreboard 2001:Towards a Knowledge-Based Economy, Annex 1.1, pp. 13–139
Note: The ISIC classification was revised in 1996, though changes were relatively minor. 1990 data has beenreassigned to the most relevant Rev 3 category.
g g p p gFagerberg / The Oxford Handbook of Innovation First Proof 29.5.2004 7:21pm page 157
measuring innovation 157

Table 6.2 shows that ‘‘acquired technology’’ as a proportion of direct R&D rises
dramatically as we move from high to low-technology industries. This suggests that
technology intensity is likely to be very sensitive to how the measurement of
acquired technology is carried out. For example: suppose we assume that when a
Wrm buys a machine it acquires not a proportion of the R&D that went into the
machine (corresponding to the R&D/output ratio) but all of it? In other words,
purchasing a computer gives the customer access to all of the R&D that was used to
produce it—this assumption seems to be compatible with the knowledge externality
ideas of the new growth theory (for an overview see Verspagen 1992, see also
Verspagen in this volume). Making this assumption would signiWcantly alter the
rankings of technology intensity in Table 6.2 by improving the position of industries
with substantial use of R&D embodied in capital goods. Another point to make here
is that so-called low-technology industries do not create or access knowledge via
direct R&D, and the classiWcation is in eVect biased against all industries that employ
non-R&D methods of knowledge creation (Hirsch-Kreinson et al. 2003). So the
indicator has drawbacks at the levels of countries, industries and Wrms; there are
therefore pitfalls in the uncritical use of this apparently simple indicator.
6.4.3 Patent Data
A patent is a public contract between an inventor and a government that grants time-
limited monopoly rights to the applicant for the use of a technical invention (see
Iversen 1998 for a good review). The patentee must Wrst demonstrate a non-obvious
advance in the state of the art after which the inventor enters into a binding
relationship with the state: in general, the inventor contracts to reveal detailed
information about the invention in return for limited protection against others
using that invention for the time and geographical area for which the contract is in
force. In terms of the concessions made by the parties, there is a trade-oV between the
disclosure of detailed information by the inventor against the permission of limited
monopoly by the state. In this sense, the patent-system is designed as an incentive-
mechanism for the creation of new economically valuable knowledge and as a
knowledge-dissemination mechanism to spread this information. There has been
a prolonged debate about whether the patent system would be worth creating if we
did not have it (the usual answer is no), and whether—since we do have it—it should
be abolished (again the usual answer is no), or whether a reward system would be
superior (again, no).5
In general the patent system gathers detailed information about new techno-
logies into a protracted public record of inventive activity, which is more or less
continuous. This gives it striking advantages as an innovation-indicator. These
include:
g g p p gFagerberg / The Oxford Handbook of Innovation First Proof 29.5.2004 7:21pm page 158
158 keith smith

. Patents are granted for inventive technologies with commercial promise (i.e.
innovation).. The patent system systematically records important information about these
inventions.. The patent system collates these technologies according to a detailed and slow-to-
change classiWcation system.. The patent system systematically relates the invention to relevant technologies,
and also provides links (via citations) to relevant technical and scientiWc literature.. The patent system is an old institution, providing a long history (see Granstrand in
this volume)– it is the only innovation indicator extending back over centuries,
and this means that it is possible to use patents to explore quantitative issues over
very long periods (see Bruland and Mowery in this volume).. The data is freely available.
The major sources of patent data are the records of the US Patent OYce and the
European Patent OYce. Recent years have seen major increases in patenting activity,
as Figure 6.1 shows. The causes of this rise are an important issue: there does seem to
be growth of patenting extending back at least Wfteen years, possibly signifying
acceleration of innovation eVorts, or changes in strategic behavior by Wrms; how-
ever, the rise may also be shaped by signiWcant reductions in patent costs. (An
analysis of the issues here can be found in Hall and Ziedonis 2001; see also Kortum
and Lerner, 1999.)
USPTO Utility Patents 1965-2002
0
50000
100000
150000
200000
250000
300000
350000
1965 1970 1975 1980 1985 1990 1995 2000
Year
Num
ber
Patent applications Patent grants Patent grants by appl year
Fig. 6.1 USPTO utility patents 1965–2002
Source: Hall 2003
g g p p gFagerberg / The Oxford Handbook of Innovation First Proof 29.5.2004 7:21pm page 159
measuring innovation 159

Patents also of course have weaknesses, the most notable of which is that they are
an indicator of invention rather than innovation: they mark the emergence of a new
technical principle, not a commercial innovation. Many patents refer to inventions
that are intrinsically of little technological or economic signiWcance. More generally,
Kleinknecht et al. have argued that
It is obvious that the patent indicator misses many non-patented inventions and innovations.
Some types of technology are not patentable, and, in some cases, it is still being debated
whether certain items (e.g. new business formulae on the internet) can be patented. On the
other hand, what is the share of patents that is never translated into commercially viable
products and processes? And can this share be assumed to be constant across branches and
Wrm size classes? Moreover in some cases patent Wgures can be obscured by strategic behavior:
a Wrm will not commercialize the patent but use it to prevent a competitor patenting and
using it. (Kleinknecht et al. 2002: 112)
But taking such qualiWcations into account, the analysis of patent data has proven
very fruitful. Important achievements include the mapping of inventive activity over
long time periods (Macleod 1988; Inkster, 2003); assessing the impacts of economic
factors on the rate of invention (Schmookler 1971); the elucidation of the complexity
of technological knowledge bases in large Wrms (Patel and Pavitt 1998); the use and
roles of science in industrial patenting (Narin and Noma 1985; Meyer 2000); the
mapping of inter-industry technology Xows (Scherer 1960); the analysis of spillovers
of knowledge using patent citations (JaVe, Henderson and Trajtenberg 1993) and the
analysis of patent values (Hall, JaVe, and Trajtenberg 2001).
6.5 New Innovation Indicators
........................................................................................................................................................................................
Recent years have seen attempts to create new and better-designed indicators
focused directly on innovation: for example, the European Commission has sup-
ported large-scale eVorts to overcome the absence of direct data on industrial
innovation—and there have been important other attempts to improve our know-
ledge of outputs, sources, instruments and methods of innovation (recent discus-
sions are Hansen 2001; Guellec and Pattinson 2001; Smith 2002).
6.5.1 Types of Innovation Survey
Innovation surveys divide into two basic types: those that focus on Wrm-level
innovation activity, asking about general innovation inputs (both R&D and non-
g g p p gFagerberg / The Oxford Handbook of Innovation First Proof 29.5.2004 7:21pm page 160
160 keith smith

R&D) and outputs (usually of product innovations), and those that focus on sign-
iWcant technological innovations (usually identiWed through expert appraisal, or
through new product announcements in trade journals or other literature). Some-
times the Wrst of these approaches is called a ‘‘subject’’ approach, since it focuses on
the innovating agent; the latter is referred to as the ‘‘object’’ approach, since it focuses
on the objective output of the innovation process, on the technology itself (Archi-
bugi and Pianta 1996). Both approaches can and do incorporate attempts to explore
aspects of the innovation process itself: sources of innovative ideas, external inputs,
users of innovation, and so on. Both approaches deWne an innovation in the
Schumpeterian sense, as the commercialization of a new product or process. How-
ever the object approach tends to focus on signiWcantly new products, while the
subject approach includes small-scale, incremental change.
6.5.2 The ‘‘Object’’ Approach to Innovation Indicators
Perhaps the most important example of the ‘‘object’’ approach is the SPRU database,
developed by the Science Policy Research Unit at the University of Sussex, which
collected information on major technical innovations in British industry, covering
sources and types of innovation, industry innovation patterns, cross-industry link-
ages, regional aspects, and so on.6 The SPRU approach used a panel of about 400
technical experts, drawn from a range of institutions, to identify major innovations
across all sectors of the economy, from 1945 through to 1983. The database covered a
total of about 4,300 innovations. An important related database is the US Small
Business Administration database, covering innovations introduced to the market
by small Wrms in the US in one year, 1982. This was constructed through an
examination of about one hundred trade, engineering, and technology journals—
a major study by Acs and Audretsch (1990) has been based upon it. In addition there
is a range of smaller literature-based surveys—based on searches of trade litera-
ture—that have been undertaken in recent years: the Netherlands, Austria, Ireland,
and the UK for example—Kleinknecht and Bain (1993) and Kleinknecht (1996)
report the results from this work.
This type of approach has a number of strong advantages. Technology-oriented
approaches have the merit of focusing on the technology itself, and allow a form of
external assessment of the importance of an innovation—the fact that an innovation
is recognized by an expert or a trade journal makes the counting of an innovation
somewhat independent of personal judgements about what is or is not an innov-
ation. Both expert-based and literature-based approaches can be backward looking,
thus giving a historical perspective on technological development.
But the approach also has weaknesses. The very fact that innovations must pass a
test of signiWcance—that is, must be suYciently innovative to be publicized in trade
g g p p gFagerberg / The Oxford Handbook of Innovation First Proof 29.5.2004 7:21pm page 161
measuring innovation 161

journals or the general press—also imparts a sample selection bias to the exercise. In
eVect what these surveys cover is an important subset of the population of innov-
ations: those that are new to an industry. What gets lost is the population of
innovation outputs which are ‘‘routine,’’ incremental, part of the normal competi-
tive activity of Wrms, yet not strikingly new enough to be reported.
6.5.3 Results from ‘‘Object’’ Studies
One of the most important results of work using the SPRU database was to show the
existence of quite diVerent types of innovative activity across diVerent types of
industry. In a pioneering study, Pavitt (1984) distinguished between four basic
Wrm types, which he called ‘‘science based,’’ ‘‘scale intensive,’’ ‘‘specialized suppliers,’’
and ‘‘supplier dominated.’’ He showed that these categories of Wrms were character-
ized by diVerences in sources of technology, types of users, means of appropriation,
and typical Wrm size. This work was among the Wrst to really demonstrate empiric-
ally the importance of technological diversity within the economy, with important
implications for the design of R&D policy in circumstances where Wrms have very
diVerent technology creation patterns. Other work with the SPRU database has
emphasized the inter-sectoral Xow of innovations (using the important data on Wrst
users of innovations within the dataset), and gave an early empirical insight into the
complexity of what is now called the system of innovation (Pavitt, 1983; Robson et al.
1988). Geroski (1994: 19) has summarized these intersectoral Xows as shown in Figure
6.2 where the key result is the importance of the three major engineering sectors
(mechanical engineering, instruments and electronic engineering) in terms of the
Xow of innovations into other sectors. But it is important to note also the import-
ance of Xows within this broad engineering complex.
6.5.4 The ‘‘Subject’’ Approach and the Community Innovation
Survey
In the early 1990s, the OECD attempted to synthesize the results of earlier trial
innovation surveys, and to develop a manual that might form the basis of a common
practice in this Weld. A group of experts was convened, and over a period of
approximately Wfteen months developed a consensus on an innovation manual
which became known as the Oslo Manual (OECD 1992).
The European Commission, in a joint action between Eurostat and DG-
Enterprise, followed up the OECD initiative in 1992–3, implementing the Commu-
nity Innovation Survey. CIS was an innovative action in a number of respects. First, it
g g p p gFagerberg / The Oxford Handbook of Innovation First Proof 29.5.2004 7:21pm page 162
162 keith smith

was a large-scale attempt to collect internationally comparable direct measures of
innovation outputs. Second, it collected data at a highly disaggregated level and
made this data available in disaggregated form to analysts. The survey has now been
carried out three times, most recently in 2002; in that year the survey covered
approximately 140,000 European Wrms.
CIS, in its various versions, developed and incorporated data on the following
topics:
. expenditure on activities related to the innovation of new products (R&D, training,
design, market exploration, equipment acquisition and tooling-up etc). There is
therefore a unique focus on non-R&D inputs to the innovation process;. outputs of incrementally and radically changed products, and sales Xowing from
these products;. sources of information relevant to innovation;. technological collaboration;. perceptions of obstacles to innovation, and factors promoting innovation.
In terms of deWnitions, the CIS followed the Oslo Manual in a number of crucial
respects. Firstly, it focused on technological innovation, particularly in products.
But it then deWned diVerent categories of change, asking Wrms to assign the product
range of the Wrm to these diVerent categories. The CIS also asked Wrms to estimate
the proportions of sales which were coming from: new or radically changed prod-
ucts, from products which had been changed in minor ways, or from unchanged
products. The deWnitions of technological innovation used in CIS-2, which have
MechanicalEngineering
Instruments
ElectronicsAerospace
Utilities
Vehicles
Business
Defence
Metals
Construction
Shipbuilding
Printing
Paper
Food Mining
R&D
Rubber
Chemicals
Health
Textiles
Agriculture
Fig. 6.2 The SPRU innovation database:The intersectoral flow of innovations.
Source: Geroski (1994)
g g p p gFagerberg / The Oxford Handbook of Innovation First Proof 29.5.2004 7:21pm page 163
measuring innovation 163

been consistent throughout the various versions of CIS, are shown in Figure 6.3. It
should be noted that although both product and process deWnitions are oVered, the
survey in fact concentrates on technologically changed products, mainly because of
the availability of an economic measure. Most processes are of course products of
capital goods-producing Wrms, although expenditure on changing processes
extends well beyond just buying new equipment. Clearly, this limits the scope of
the innovations on which data is being sought—apart from processes, other aspects
of innovative change, such as organizational change, underlying learning processes,
and so on are excluded. However, this was done for considered reasons: focusing on
technologically changed products allows a fairly rigorous deWnition of change to be
developed. Sales of such products permit at least a degree of economic commensur-
ability across Wrms and even industries. It also permits reasonable deWnitions of
novelty: in deciding what was ‘‘new’’ about an innovation, the Oslo Manual and CIS
identiWed diVerent degrees of product innovation by asking Wrms to distinguish
Scope and impact of technological innovation and innovation activity of the enterprise
•
•
•
Technological innovations comprise implemented technologically new products and processes and significant technological improvements in products and processes.
An innovation has been implemented if it has been introduced on the market (product in novation) or used within a production process(process innovation). The product or process should be new (or significantly improved)to the enterprise (it does not necessarily have to be new to the relevant market).
Technological innovation requires an objective improvement in the performance of a product or in the way in which it is produced or delivered. The following
changes are not technological innovations:
improvements of products that make them more attractive to the purchasers without changing their ’technological’ characteristics minor technological changes of products and processes or changes which does not have the sufficient degree of novelty changes of products and processes,where the novelty does not concern the use or objective performance characteristics of the products or the way they are produced or delivered, but rather their aesthetic or subjective qualities
Innovation activities are all those steps necessary to develop and implement technologically new or improved products
A technologically new product is a product whose technological characterist-ics or intended uses differ significantly from those of previously produced products. Such innovations can involve radically new technologies, can be based on combining existing technologies in new uses, or can be derived from the use of new knowledge
A technologically improved product is an existing product whose performan- ce has been significantly enhanced or upgraded. A simple product may be improved (in terms of better performance or lower cost) through use of higher-performance components or materials, or a complex product which consist of a number of integrated technical subsystems may be improved by partial changes to one of the subsystems.
Fig. 6.3 Defining technological innovation—CIS.
Source: CIS-2 Questionnaire
g g p p gFagerberg / The Oxford Handbook of Innovation First Proof 29.5.2004 7:21pm page 164
164 keith smith
between sales of products new to the Wrm only, products new to the industry, or
products that were wholly new. So although the Oslo Manual/CIS approach con-
strains innovation to the Weld of the technological, it does so in a way that allows a
consistency between the concepts of change, novelty, and commensurability. With-
out such consistency, survey methods are not appropriate.
6.5.5 Innovation Activities and their Measurement
A second feature of the Oslo Manual and of CIS was the attempt to estimate
expenditures on categories of innovation activity other than R&D. Six main cat-
egories of innovation activities were identiWed, and the basic structure of the
questions and deWnitions was as shown in Figure 6.4. The basic idea here was that
Wrms invest in a wide range of non-R&D activities, resulting in both tangible and
intangible assets, and that these are likely to vary across Wrms and industries. The
general categories here are drawn closely from Kline and Rosenberg (1986), which
provides the general conceptual foundation. But it can easily be seen that there are
likely to be problems: these are complex categories, in an area where Wrms do not
necessarily keep separate or detailed records. In practice, in the Wrst round of the CIS,
there were many Wrms who did not respond to the questions which were asked on
this topic, and many who were clearly able to answer only in terms of broad
estimates. But there are strong interWrm variations—some Wrms operate project
management systems that permit accurate answers in this area, and the data quality
seems to have improved over time.
One of the important results to have emerged from this part of CIS is that capital
expenditure related to innovation is the largest single component of innovation
expenditure across all sectors (Evangelista et al. 1998). This emphasizes the import-
ance of the embodied R&D in capital and intermediate goods, discussed above.
6.5.6 CIS: Some Main Results
What have we learned so far from attempts to measure and map innovation? In this
section we look at some of the results that have emerged from a range of studies using
CIS. The literature using innovation survey data is growing rapidly at the present
time, and it falls into three broad categories.
Descriptive overviews of data results at national level. These studies are usually written
for policy makers, and typically consist of tables and charts, accompanied by
commentary, showing results such as the distribution of innovation expenditures
and their diVerences across industries, proportions of Wrms introducing product or
g g p p gFagerberg / The Oxford Handbook of Innovation First Proof 29.5.2004 7:21pm page 165
measuring innovation 165

process innovations, the distribution of diVerent types of new product sales across
industries, major patterns of technological collaboration, perceptions of obstacles to
innovation, and data on objectives of innovation. These studies tend to be important
Did your enterprise engage in the following innovation activities in 1996?
- RESEARCH AND DEVELOPMENT OF NEW PRODUCTS AND PROCESSES (R&D)
- ACQUISITION OF MACHINERY AND EQUIPMENT LINKED TO PRODUCT AND PROCESS INNOVATIONS
- ACQUISITION OF EXTERNAL TECHNOLOGY
- INDUSTRIAL DESIGN, OTHER PRODUCTION PREPARATIONS FOR NEW PRODUCTS
- TRAINING DIRECTLY LINKED TO INNOVATIONS- MARKET INTRODUCTION OF INNOVATIONS
TOTAL EXPENDITURE
if yes, pleaseestimate
expenditureinvolved
If you have any R&D expenditurementioned above, pleaseindicate...
--
-
The expenditure items should cover current(labor costs, acquisition of services, materialsetc.) and capital expenditure (instruments andequipment, computer software, land andbuildings). If itis not possible to estimate allexpenditure items involved, pleaseat leastindicate if your enterprise has been engaged in aparticular innovation activity or not.
percentage of R&D contracted out R&D personell in full time eqivalents in1996did your enterprise engage in R&D on a continous basis (opposite to occational) between 1994 and 1996?
Research and development of products and processes (R&D) comprises creative work undertaken on a systematic basis in order to increase the stock of knowledge, and the use of this stock of knowledge to devise new applications. Construction and testing of a prototype is often the most important phase of R&D. Software development isincluded as well. R&D can be carried out within the enterprise or R&D services can be aquired.
Acquisition of machinery and equipment linked to product and process innovations (including integrated software) implemented by the enterprise.
Acquisition of external technology in the form of patents, non-patented inventions, licences, know-how, trademarks, drawing plans and other consultancy services (excluding R&D), related to the implementation of technologicalinnovations, plus the acquisition of packaged softwarethat is not classified elsewhere.
Industrial design and other production preparations for new products include plans and drawings aimed at defining procedures, technical specifications and operation features necessary to the production of technologically new products and the implementation of new processes. Design of prototypes is a part of R&D. Thisitem also include changes in production and quality control procedures, methods and standards and associated software required to produced the technologically new or improved product or to use the technologically new or improved process. Product or process modifications needed to start production, including trial production (notincluded in R&D)is also included.
Training directly linked to innovations is training for the implementation of a technologically new or improved product. Expenditure for training might include acquisition of external services and expenditure forin-house training.
Market introduction of innovations includes activities in connection with the launching of a technologically new orimproved product. These may include preliminary marke tresearch, market tests and launch advertising, but will exclude the building of distribution networks to market innovations.
Fig. 6.4 Resources devoted to innovation activities in 1996
g g p p gFagerberg / The Oxford Handbook of Innovation First Proof 29.5.2004 7:21pm page 166
166 keith smith

not just in reaching policy makers, but in emphasizing some robust results which
emerge from this data—in particular the conclusion that innovation is pervasively
distributed across modern economies, and that non-R&D inputs to innovation are
be particularly important in non-high-tech sectors. In some cases these reports are
sophisticated productions—the German reports, for example, rest on a substantial
panel dataset, and the Canadian analytical eVort (similar to but not identical
with CIS) is very wide ranging indeed (Janz et al. 2002, and Statistics Canada:
www.statcan.ca ).7 Most EU countries produce these reports.
Analytical studies sponsored by the European Commission. The European Innovation
Monitoring System (within DG-Enterprise) has sponsored twenty-Wve speciWc
studies addressing a wide range of questions arising from the innovation data.
These cover, for example, Europe-wide surveys of innovation expenditure patterns,
innovation outputs across Europe, studies of links between innovation and employ-
ment patterns, and sectoral studies (pharmaceuticals, telecoms, pulp and paper,
machinery, machine tools, service sector innovation, spin-oVs, and regional
impacts). Most of these studies are substantial pieces of work, often book length.
An overview of the full range of material is provided in Appendix 6.2 to this chapter
(reports are accessible via the European Innovation Monitoring System on the EU’s
CORDIS website: www.cordis.lu)
Econometric or statistical studies of innovation. The innovation survey data has a
more or less unique feature, which is that it is available in a highly disaggregated
form (as so-called ‘‘micro-aggregated’’ data). This makes possible a wide range of
micro-level studies of innovation processes and their eVects, and the research
opportunities this provides are being exploited rather vigorously at the present
time. Publication in this Weld has been building rapidly, in the form of books (e.g.
Thuriaux, Arnold, and Couchot 2001; Kleinknecht and Mohnen 2002), articles,
journal special issues (such as STI Review 27 (2001), and a forthcoming special
issue of Economics of Innovation and New Technology), and so on. The book edited by
Thurieaux et al. collects no less than thirty-one chapters on various empirical aspects
of innovation using primarily CIS data. These covered methodological issues, the
extension of the CIS approach to services, micro analysis of innovation and Wrm
performance, innovation and employment, innovation in traditional industries,
regional innovation, and the use of indicators in policy decision making.
By far the most rapidly growing area of publication is in scholarly journals. A non-
exhaustive review of journals in 2002–4 reveals eighteen CIS-based publications.
These articles are brieXy summarized in Appendix 6.1 to this chapter. Studies focus
on such topics as determinants of innovation, innovation and Wrm performance
analysis, diversity (both in innovation patterns and Wrm performance outcomes),
the role of science in innovation, sectoral performance (such as employment
g g p p gFagerberg / The Oxford Handbook of Innovation First Proof 29.5.2004 7:21pm page 167
measuring innovation 167

impacts), inter-Wrm collaboration and innovation performance, as well as regional
and country studies, and methodological issues. There is every sign that this pace of
publication will continue in years ahead. This is a rapid growth in publication, and it
is worth noting that it is occurring not only in the front-line journals of innovation
studies, but also in the heart of the economic mainstream (notably Mairesse and
Mohnen in American Economic Review).
Space limitations prevent a detailed overview of the results from the work
described above, but some robust conclusions that seem to have emerged from the
literature as a whole are as follows:
. Innovation is prevalent across all sectors of the economy—it is not conWned to
high-tech activities, and so-called low-tech activities contain high proportions of
innovating Wrms, and often generate high levels of sales from new and changed
products (SPRU, 1996; European Commission 2001).8. R&D is by no means the most important innovation input. In all sectors, across all
countries, investment in capital equipment related to new product introduction is
the major component of innovation expenditure, suggesting the need to focus on
the knowledge elements embodied in such items (STEP, 1997; Evangelista et al.
1998; Evangelista 1999).. Across all sectors and countries innovation inputs and outputs are distributed
highly asymmetrically—small proportions of Wrms account for large proportions
of innovation outputs as measured by the CIS.. Collaboration is widespread among innovating Wrms, to such an extent that it
appears almost a sine qua non for innovation activity. This result from CIS has led
to a range of speciWc subsidiary surveys, which have generated deeper detail and
have conWrmed the importance of collaboration suggested by the CIS surveys (see
OECD 2001 for papers on this).. Extension of the CIS format to service sector activities is illustrative but problem-
atical, and deserves more attention (Djellal and Gallouj 2001; Tether and Miles
2001; Ch. 16 by Miles in this volume).. There continue to be signiWcant diVerences in collection methodologies and
response rates across countries, implying that the data appears to be much better
suited to within-sector micro studies than to cross-country macro comparisons.
6.6 Conclusion
........................................................................................................................................................................................
While the CIS is clearly a step forward in terms of the type and volume of innovation
data that is available, it is of course open to criticism. Most criticisms focus on the
g g p p gFagerberg / The Oxford Handbook of Innovation First Proof 29.5.2004 7:21pm page 168
168 keith smith

deWnitional restrictions in CIS with respect to innovation inputs and outputs, and
on whether an approach that was originally adopted for manufacturing is extendable
to services. On the output side, the decisions made concerning the technological
deWnitions of change obviously limit the forms of innovation that can be studied: it
seems to be the case that CIS works well for manufactures, but not for the extremely
heterogeneous services sector and its often intangible outputs. The analyses of
Djellal and Gallouj (2001) and Tether and Miles (2001) suggest the need for quite
diVerent approaches to data gathering on services. In defence of the CIS approach it
can be argued that it is, and was intended to be, manufacturing-speciWc and that
extension to services would always be problematic. Similar problems arise with
other non-technological aspects of innovation, such as organizational change (see
Lam, this volume, for an overview of organizational innovation). It is very unclear
whether CIS, or indeed any other survey-based method, can grasp the dimensions of
this. The challenge for those who would go beyond this is whether they can generate
deWnitional concepts, survey instruments, and collection methodologies that make
sense for other sectors or other aspects of innovation.
On the side of R&D and non-R&D innovation inputs, it is generally unclear just
how much of a Wrm’s creative activity is captured by the types of innovation outputs
that CIS measures. Arundel has pointed out that ‘‘When we talk about a Wrm
expending a great deal of eVort on innovation, we are not only speaking of Wnancial
investments, but of the use of human capital to think, learn and solve complex
problems and to produce qualitatively diVerent types of innovations.’’ (Arundel
1997: 6). This point cannot be argued with, but again the question arises as to what
can be done with survey questionnaires and what cannot. If we want to explore
complex problem solving, for example, then it is doubtful whether a survey instru-
ment is the right research tool at all. Perhaps an underlying issue here is the long-
standing tension between statistical methods, with their advantages of generality but
lack of depth, versus case study methods, which oVer richness at the expense of
generalizability.
Nevertheless it is reasonable to conclude that this data source is proving itself with
researchers. Both formal evaluations of CIS as well as data tests by researchers have
been broadly positive to the quality of the data Xowing from the survey (Aalborg
University 1995). One of the positive features of CIS is that survey deWnition and
construction, collection methodologies, and general workability have been sub-
jected to a degree of evaluation, critique, and debate that goes far beyond anything
that has been carried out with other indicators (see Arundel et al. 1997, for one
contribution to the critical development of CIS). This process is continuing, with
both positive and negative potential outcomes. On the positive side, the data source
may continue to be improved; on the negative, too much may be asked of this
approach. But the real achievement is that CIS has produced results that have not
been possible with other data sources, and there is no doubt more to come as
researchers master the intricacies of the data. In fact empirical studies using CIS
g g p p gFagerberg / The Oxford Handbook of Innovation First Proof 29.5.2004 7:21pm page 169
measuring innovation 169

data may well be the most rapidly growing sub-Weld of publication within innov-
ation studies at the present time. An interesting feature of the publications using CIS
is the breadth of work being done—the data is being used for public presentations,
for policy analyses, and for a wide range of scholarly research. It was argued above
that researchers have yet to make full use of the richness of R&D data, and this
applies even more to the existing survey-based innovation data. This source will
continue to oVer considerable scope to researchers in years ahead: issues such as
innovation and Wrm performance, the use of science by innovating Wrms, the roles of
non-R&D inputs, and the employment impacts of innovation are among likely areas
of development.
This chapter has concentrated on the Community Innovation Survey, but future
developments are unlikely to rely on this source alone. One possible trend is for
greater integration of existing data sources, and this can already be seen in multi-
indicator approaches to such issues as national competitiveness. Another likely
trend is for the continued development of new survey instruments aligned to speciWc
needs, along the lines of the DISKO surveys on interWrm collaboration. Such
developments are much to be welcomed as Innovation Studies seeks to generalise
its propositions beyond the evidence provided by case studies.
APPENDIX 6.1........................................................................................................................................................................................
Recent (2002 onwards) Journal Publications Using CIS Data
Authors(s) Data source Topic
Cox, Frenz and Prevezer (2002) CIS-2 Distinguishing high- and low-techindustries
Evangelista and Savona (2002) CIS 1 and 2 Employment impacts ofinnovation in service sector
Hesselman (2002) CIS-2 Methodological issues andresponse patterns
Hinloopen (2003) CIS-1 and CIS-2 Determinants of innovationperformance at firm level acrossEurope
Inzelt (2002) CIS-2 Service sector innovation inHungary
Kleinknecht et al (2002) CIS-2 Indicator choice and biases
Loof and Heshmati (2004) CIS-2 Innovation and firm performance
Loof and Heshmati (2002) CIS-2 Performance diversity andinnovation
g g p p gFagerberg / The Oxford Handbook of Innovation First Proof 29.5.2004 7:21pm page 170
170 keith smith

APPENDIX 6.2........................................................................................................................................................................................
Publications Using CIS Data Sponsored by the European
Commission
Mairesse and Mohnen CIS-1 Determinants of innovation at firmlevel
Mohnen and Horeau (2003) CIS-2 University-industry collaboration
Mohnen, Mairesse andDagenais (2003)
CIS-1 Expected vs. actual innovationoutput levels
Nascia. and Perani (2002) CIS-1 Diversity of innovation patterns inEurope
Quadros et al (2001) Brazilian innovationsurvey
Innovation in San Paulo region
Sellenthin and Hommen (2002) CIS-2 Innovation patterns in Swedishindustry
Tether (2002) CIS-2 Innovation and inter-firmcollaboration
Tether and Swann (2003) CIS-3 Role of science in innovation
Van Leeuwen and Klomp(2004)
CIS-2 Innovation and multi-factorproductivity
Publications are listed in chronological order, by topic and instituion.
Evaluation of the Community Innovation Survey (CIS)—Phase 1,Aalborg University, (Denmark), 1995
Europe’s Pharmaceutical Industry: An Innovation Profile (CIS),SPRU, (UK), 1996
Innovation Outputs in European Industry (CIS),SPRU (UK), 1996
Innovation in the European Food Products and Beverages Industry (CIS),IKE (Denmark) and SPRU (UK), 1996
Technology Transfer, Information Flows and Collaboration (CIS),Manchester School of Management & University of Warwick (UK), 1996
The Impact of Innovation on Employment: Alternative interpretations and results of theItalian CIS,
University of Rome ‘‘La Sapienza’’ (Italy), 1996
Innovation in the European Chemical Industry (CIS),WZB (Germany) 1996
g g p p gFagerberg / The Oxford Handbook of Innovation First Proof 29.5.2004 7:21pm page 171
measuring innovation 171

Publications are listed in deronological order, by topic and instituion. (cont.)
Innovation in the European Telecom Equipment Industry (CIS),MERIT (Netherlands), 1996
Innovation Activities in Pulp, Paper and Paper Products in Europe (CIS),STEP Group (Norway), 1996
The Impact of Innovation in Employment in Europe—An Analysis Using CIS Data,Centre for European Economic Research /ZEW (Germany), 1996
Computer and Office Machinery—Firms external growth & technological diversification:analysis during CIS,
CESPRI (Italy) 1997
Innovation Expenditures in European Industry: analysis from CIS,STEP Group (Norway), 1997
Manufacture of Machinery and Electrical Machinery (CIS),Centre for European Economic Research /ZEW (Germany), 1997
Innovation Measurements and Policies: Proceedings of International Conference,20–21 May 1996, Luxembourg
Analysis of CIS 2 Data on the Impact of Innovation on in the Pharmaceuticals andBiotechnology Sector,
SOFRES (Belgium), 2001
Analysis of CIS 2 Data on the Impact of Innovation on Growth in the Sector of OfficeMachinery and Computer Manufacturing,
SOCINTEC (Spain), 2001
Analysis of CIS 2 Data on the Impact of Innovation on Growth in Manufacturing of Machineryand Equipment and of Electrical Equipment,
STEP Group (Norway), 2001
Analysis of CIS Data on the Role of NTBFs, Spin-offs and Innovative Fast Growing SMEs in theInnovation Process,
Institute for Advanced Studies and Johanneum Research (Austria), 2001Innovation and the Acquisition and Protection of Competencies,MERIT (Netherlands), 2001
Analysis of Empirical Surveys on Organisational Innovation and Lessons for Future CommunityInnovation Surveys,
Fraunhofer Institute (Germany), 2000
Regional Patterns of Innovation: the Analysis of CIS 2 Results and Lessons from otherInnovation Surveys,
STEP S.A.S (Italy), 2000
Use of Multivariate Techniques to Investigate the Multidimensional Aspects of Innovation,University of Newcastle Upon Tyne (ISRU) (UK), 2000
Statistics on Innovation in Europe,European Commission, 2001
Analysis of CIS 2 Data on Innovation in the Service Sector,Manchester University (UK), 2000
g g p p gFagerberg / The Oxford Handbook of Innovation First Proof 29.5.2004 7:21pm page 172
172 keith smith

Notes
1. I would like to thank Ian Miles, Bart Verspagen, and Richard Nelson for comments on an
earlier draft, and in particular Bronwyn Hall for comments and advice. None are impli-
cated in the outcome, of course.
2. The question of what can be measured is an issue with all economic statistics. For example,
the national accounts do not cover all economic activity (in the sense of all human activity
contributing to production or material welfare). They incorporate only activity that leads
to a measurable market outcome or Wnancial recompense. This tends to leave out
economic activity such as domestic work, mutual aid, child rearing, and the informal
economy in general. Those services that are measured not by the value of output but by the
compensation of inputs also provide problems for measurement of output and product-
ivity.
3. Godin’s extensive series of papers can be accessed at www.inrs-ucs.uquebec. ca/inv/CV/
godinpub.htm
4. In both Australia and Norway, each of which collects data by Weld of research for all
industrrial sectors, roughly 25 per cent of all R&D is in ICT.
5. An excellent overview of the literature on these and other patent issues can be found on the
website of Bronwyn Hall: http://emlab.berkely.edu/users/bhhall See also Granstrand in this
volume.
6. For analyses using the SPRU database, see e.g. Pavitt 1983, 1984; Robson et al. 1988; the
most recent sustained analytical work using the SPRU database is Geroski 1994.
7. Canada is a leading site of policy-related indicator work at the present time—see e.g. the
outstanding work of the Canadian Science and Innovation Indicators Consortium which
can be found at the website given above.
8. On innovation in low-tech industries, see Ch. 15 by von Tunzelman and Acha in this
volume.
References
Aalborg University (1995), Evaluation of the Community Innovation Survey (CIS)—Phase
1, 2 vols., Report to the European Innovation Monitoring System.
Acs, Z., and Audretsch, D. (1990), Innovation and Small Firms, Cambridge, Mass.
*Archibugi and Pianta (1996), ‘‘Innovation surveys an patents as technology indicators:
the state of the art,’’ in OECD, Innovation, Patents and Technological Strategies, Paris:
OECD.
Arrow, K. J (1984), ‘‘Statistical Requirements for Greek Economic Planning,’’ Collected
Papers of Kenneth J. Arrow, vol. 4: The Economics of Information (Oxford: Blackwell).
Arundel, A. (1997), ‘‘Why Innovation Measurement Matters,’’ in A. Arundel and R. Garrelfs
(eds.), Innnovation Measurement and Policies, EU Luxembourg: EIMS 94/197.
* Asterisked items are suggestions for further reading.
g g p p gFagerberg / The Oxford Handbook of Innovation First Proof 29.5.2004 7:21pm page 173
measuring innovation 173

Arundel, A., Patel, P., Sirilli, G., and Smith, K. (1997), The Future of Innovation
Measurement in Europe: Concepts, Problems and Practical Directions, IDEA Paper No 3,
STEP Group Oslo, 145 pp.
Biffl, G., and Knell, M. (2001), ‘‘Innovation and Employment in Europe in the 1990s,’’
WIFO Working Paper 169/2001.
Brouwer, E., and Kleinknecht, A. (1997), ‘‘Measuring the Unmeasurable: A Country’s
Expenditure on Product and Service Innovation,’’ Research Policy 25: 1235–42.
—— —— (1999), ‘‘Innovative Output and a Firm’s Propensity to Patent: An Exploration of
CIS Micro-Data,’’ Research Policy 28: 615–24.
Cox, H., Frenz, M., and Prevezer, M. (2002), ‘‘Patterns of Innovation in UK Industry:
Exploring the CIS Data to Contrast High and Low Technology Industries,’’ Journal of
Interdiciplinary Economics 13(1–3): 267–304.
*Djellal, F., and Gallouj, F. (2001), ‘‘Innovation surveys for Service Industries: A Review,’’
in Thurieaux, Arnold, and Couchot 2001: 70–6.
Dowrick, S. (2003), ‘‘A Review of the Evidence on Science, R&D and Productivity,’’ Working
Paper, Department of Economics, Australian National University.
European Commission (1994), The European Report on Science and Technology Indicators
1994 (EUR 15897), Luxembourg.
—— (1997), Second European Report on Science and Technology Indicators 1997 (EUR 17639)
Luxembourg.
—— (2003), Third European Report on Science and Technology Indicators, Luxembourg.
Evangelista, R. (1999), Knowledge and Investment, Cheltenham: Elgar.
—— Sandven, T., Sirilli, G., and Smith, K. (1998), ‘‘Measuring Innovation in European
Industry,’’ International Journal of the Economics of Business 5(3): 311–33.
—— and Savona, M. (2002), ‘‘The Impact of Innovation on Employment in Services:
Evidence from Italy,’’ International Review of Applied Economics 16(3): 309–18.
Geroski, P. (1994), Market Structure, Corporate Performance and Innovative Activity, Oxford:
Clarendon Press.
Godin, B. (2004), ‘‘The Obsession with Competitiveness and its Impact on Statistics: The
Construction of High Technology Indicators,’’ Research Policy (forthcoming).
Griffith, R., Redding, S., and Van Reenen, J. (2000), ‘‘Mapping the Two Faces of R&D:
Productivity Growth in a Panel of OECD Industries,’’ LSE Centre for Economic Performance
Discussion Paper, 2457: 1–74.
Griliches, Z. (1987), ‘‘Comment,’’ Washington, DC: Brookings Papers on Economic Activ-
ity, 3.
Grupp, H. (1994), ‘‘The Measurement of Technical Performance of Innovations by Techno-
metrics and its Impact on Established Technology Indicators,’’ Research Policy 23: 175–93.
*—— (1998), Foundations of the Economics of Innovation, Theory, Measurement and Practice,
Cheltenham: Elgar.
Guellec, D., and Pattinson, B. (2001), ‘‘Innovation Surveys: Lessons from OECD Coun-
tries’ Experience,’’ STI Review 27: 77–102.
Hagedoorn, K., and Schakenraad, J. (1990), ‘‘Inter-Wrm Partnerships and Co-operative
Strategies in Core Technologies,’’ in C. Freeman and L. Soete (eds.), New Explorations in the
Economics of Technological Change, London: Pinter.
*Hansen, J. A. (2001), ‘‘Technological Innovation Indicators: A Survey of Historical Devel-
opment and Current Practice,’’ in M. P. Feldmann and A. Link (eds.), Innovation Policy in
the Knowledge-Based Economy, Dordrecht: Kluwer, 73–103.
g g p p gFagerberg / The Oxford Handbook of Innovation First Proof 29.5.2004 7:21pm page 174
174 keith smith

Hessleman, L. (2002), ‘‘A Description of Responses to the UK Community Innovation
Survey 2,’’ The Journal of Interdiciplinary Economics 13(1–3): 243–66.
Hinloopen, J. (2003), ‘‘Innovation Performance across Europe,’’ Economics of Innovation
and New Technology 12(2): 145–61.
Hirsch-Kreinsen, H., Jacobsen, D., Laestadius, S., and Smith, K. (2003), ‘‘Low Tech
Industries and the Knowledge Economy: State of the Art and Research Challenges,’’
Working Paper 2003:10, Dept of Industrial Economics and Management, Royal Institute
of Technology (KTH), Stockholm.
Holbrook, J. (1991), ‘‘The InXuence of Scale EVects on International Comparisons of R&D
Expenditure,’’ Science and Public Policy 18(4): 259–62.
Howells, J. (2000), ‘‘Innovation Collaboration and Networking: A European Perspective,’’
in Science Policy Support Group, European Research, Technology and Development. Issues
for a Competitive Future, London.
Hughes, K. (1988), ‘‘The Interpretation and Measurement of R&D Intensity: A Note,’’
Research Policy 17: 301–7.
Inzelt, A. (2002), ‘‘Attempts to Survey Innovation in the Hungarian Service Sector,’’ Science
and Public Policy 29(5): 367–83.
Iversen, E. (1998), ‘‘Patents,’’ in K. Smith (ed.), Science, Technology and Innovation Indica-
tors—a Guide for Policymakers, IDEA Report 5, STEP Group Oslo.
Janz, N., et al. (2002), Innovation Activities in the German Economy. Report on Indicators from
the Innovation Survey 2000, Mannheim: ZEW.
Kaloudis, A. (1998), ‘‘Bibliometrics,’’ in K. Smith (ed.), Science, Technology and Innovation
Indicators—a Guide for Policymakers, IDEA Report 5, STEP Group Oslo.
*Kleinknecht, A. (ed.) (1996), Determinants of Innovation: The Message From New Indica-
tors, London: Macmillan.
—— and Bain, D. (eds.) (1993), New Concepts in Innovation Output Measurement, London:
Macmillan.
—— and Mohnen, P. (eds.) (2002), Innovation and Firm Performance. Econometric Explor-
ations of Survey Data (Hampshire and New York: Palgrave).
—— Van Montfort, K., and Brouwer, E. (2002), ‘‘The Non-Trivial Choice Between
Innovation Indicators,’’ Economics of Innovation and New Technology 11(2): 109–21.
Kline, S., and Rosenberg, N. (1986), ‘‘An Overview of Innovation,’’ in R. Landau (ed.), The
Positive Sum Strategy: Harnessing Technology for Economic Growth, Washington: National
Academy Press, 275–306.
Kortum, S., and Lerner, J. (1999), ‘‘What is Behind the Recent Surge in Patenting?’’ Research
Policy 28: 1–22.
Laestadius, S. (2003), ‘‘Measuring Innovation in the Knowledge Economy,’’ Paper pre-
sented to Pavitt Conference on Innovation, SPRU, Sussex, 13 Nov 2003.
Loof, H., and Heshmati, A. (2002), ‘‘Knowledge Capital and Performance Heterogeneity:
A Firm-Level Innovation Study,’’ International Journal of Production Economics 76(1):
61–85.
—— —— (2004), ‘‘On the Relationship between Innovation and Performance: A Sensitivity
Analysis,’’ Economics of Innovation and New Technology 13(1–2): forthcoming.
Mairesse, J., and Mohnen, P. (2001), ‘‘To be or not to be Innovative: An Exercise in
Measurement,’’ STI Review 27: 103–28.
*—— —— (2002), ‘‘Accounting for Innovation and Measuring Innovativeness: An Illustra-
tive Framework and an Application,’’ American Economic Review 92(2): 226–30.
g g p p gFagerberg / The Oxford Handbook of Innovation First Proof 29.5.2004 7:21pm page 175
measuring innovation 175

*Meyer, M. (2000), ‘‘Does Science Push Technology? Patents Citing ScientiWc Literature,’’
Research Policy 29: 409–34.
Moed, H. F., De Bruin, R. E., and Van Leeuwen,Th. N. (1995), ‘‘New Bibliometric Tools for
the Assessment of National Research Performance: Database Description, Overview of
Indicators and First Application,’’ Scientometrics 33: 381–422.
Mohnen, P., and Hoareau, C. (2003), ‘‘What Types of Enterprise Forge Close Links with
Universities and Government Labs? Evidence from CIS-2,’’ Managerial and Decision
Economics 24: 133–45.
Mohnen, P., Mairesse, J., and Dagenais, M. (2004), ‘‘Innovativeness: A Comparison across
Seven European Countries,’’ Economics of Innovation and New Technology 13(1–2): forth-
coming.
Narin, F., and Noma, E. (1985), ‘‘Is Technology Becoming Science?’’ Scientometrics 3–6:
369–81.
Nascia, L., and Perani, G. (2002), ‘‘Diversity of Innovation in Europe,’’ International Review
of Applied Economics 16(3): 277–94.
Oecd (1992, rev. 1997), Innovation Manual: Proposed Guidelines for Collecting and Interpreting
Innovation Data (Oslo Manual), Paris: OECD, Directorate for Science, Technology and
Industry.
—— (1996), Technology, Productivity and Job Creation, Paris: OECD.
—— (2001), Innovating Networks: Collaboration in National Innovation Systems, Paris:
OECD.
—— (2002), The Measuerment of ScientiWc and Technological actvities. Proposed Standard
Pracrtice for Surveys on Research and Experimetnal Development: Frascati Manual, Paris:
OECD.
Patel, P., and Pavitt, K. (1997), ‘‘The Technological Competencies of the World’s Largest
Firms, Complex and Path-Dependent, but not Much Variety,’’ Research Policy 26: 141–56.
*—— —— (1999), ‘‘The Wide (and Increasing) Spread of Technological Competencies in
the World’s Largest Firms: a Cahllenge to Conventional Wisdom,’’ in A. Chandler et al.
(eds.), The Dynamic Firm: The Role of Technology, Strategy, Organization and Regions,
Oxford: OUP.
Pavitt, K. (1983), ‘‘Some Characteristics of Innovation Activities in British Industry,’’ Omega
11:
*—— (1984), ‘‘Sectoral Patterns of Technological Change: Towards a Taxonomy and a
Theory,’’ Research Policy 13: 343–73.
Pol, E., Carroll, P., and Robertson, P. (2002), ‘‘A New Typology for Economic Sectors with
a View to Policy Implications,’’ Economics of Innovation and New Technology 11(1): 61–76.
Quadros, R., Furtado, A., Bernades, R., and Eliane, F. (2001), ‘‘Technological Innovation
in Brazilian Industry: An Assessment Based on the San Paulo Innovation Survey,’’ Techno-
logical Forecasting and Social Change 67: 203–19.
Robson, M., Townsend J., and Pavitt, K. (1988), ‘‘Sectoral Patterns of Production and Use
of Innovations in the UK: 1945–1983,’’ Research Policy 17(1): 1–15.
Rosenberg, N. (1976), Perspectives on Technology, Cambridge: Cambridge University Press.
—— (1982), Inside the Black Box: Technology and Economics, Cambridge: Cambridge Univer-
sity Press.
Sandven, T., and Smith, K (1997), ‘‘Understanding R&D Indicators: EVects of DiVerences in
Industrial Structure and Country Size,’’ IDEA Paper 14, STEP Group Oslo.
Saviotti, P. P. (1996), Technological Evolution, Variety and the Economy, Cheltenham: Elgar.
g g p p gFagerberg / The Oxford Handbook of Innovation First Proof 29.5.2004 7:21pm page 176
176 keith smith

—— (2001), ‘‘Considerations about a Production System with Qualitative Change,’’ in
J. Foster and J. Stanley Metcalfe (eds.), Frontiers of Evolutionary Economics. Competition,
Self-Organization and Innovation Policy, Aldershot: Elgar, 197–227.
Scherer, F. (1980), ‘‘Inter-industry Technology Flows in the Untied States,’’ Research Policy.
Schmookler, J. (1971), ‘‘Economic Sources of Inventive Activity,’’ in N. Rosenberg (ed.), The
Economics of Technological Change, London: Pelican, 117–36.
Sellenthin, M., and Hommen, L. (2002), ‘‘How Innovative is Swedish Industry? A Factor
and Cluster Analysis of CIS II,’’ International Review of Applied Economics 16(3): 319–32.
Smith K. (1992), ‘‘Technological Innovation Indicators: Experience and Prospects,’’ Science
and Public Policy 19(6): 24–34.
—— (2002), ‘‘Innovation Indicators and the Knowledge Economy: Concepts, Results and
Challenges,’’ in Thurieaux, Arnold, and Couchot, 14–25.
Spru (1996), Innovation Outputs in European Industry (CIS), Report to the European
Innovation Monitoring System.
Step Group (1997), Innovation Expenditures in European Industry: analysis from CIS, Report
to the European Innovation Monitoring System.
Tether, B. (2002), ‘‘Who Cooperates for Innovation and Why: An Empirical Analysis,’’
Research Policy 31(6): 947–67.
—— and Miles, I. (2001), ‘‘Surveying Innovation in Services—Measurement and Policy
Interpretation Issues’’ in Thurieaux. Arnold, and Couchot (2001).
—— and Swann, G. M. P. (2003), ‘‘Services, Innovation and the Science Base: An Investi-
gation Into the UK’s ‘System, of Innovation’ Using Evidence from the Third Community
Innovation Survey,’’ paper to CNR/Univerity of Urbino Workshop on Innovation In
Europe.
*Thurieaux, B., Arnold, E., and Couchot, C. (eds.) (2001), Innovation and Enterprise
Creation: Statistics and Indicators, Luxembourg: European Commission (EUR 17038).
Van Leeuwen, G., and Klomp, L. (2004), ‘‘On the Contribution of Innovation to Multi-
factor Productivity,’’ Economics of Innovation and New Technology 13(1–2): forthcoming.
Verspagen, B. (1992), ‘‘Endogenous Innovation in Neo-classical Growth Models: A Survey,’’
Journal of Macroeconomics 631–62.
World Economic Forum (2003), Global Competitiveness Report 2002–2003, ed. P. Cornelius,
K. Schwab, and M. E. Porter, New York: Oxford University Press.
g g p p gFagerberg / The Oxford Handbook of Innovation First Proof 29.5.2004 7:21pm page 177
measuring innovation 177

g g p p gFagerberg / The Oxford Handbook of Innovation First Proof 29.5.2004 7:21pm page 178