Measuring Information Technology Payoff: A Meta-Analysis of Structural Variables in Firm-Level...
20
This article was downloaded by: [128.83.63.20] On: 29 September 2014, At: 05:21 Publisher: Institute for Operations Research and the Management Sciences (INFORMS) INFORMS is located in Maryland, USA Information Systems Research Publication details, including instructions for authors and subscription information: http://pubsonline.informs.org Measuring Information Technology Payoff: A Meta-Analysis of Structural Variables in Firm-Level Empirical Research Rajiv Kohli, Sarv Devaraj, To cite this article: Rajiv Kohli, Sarv Devaraj, (2003) Measuring Information Technology Payoff: A Meta-Analysis of Structural Variables in Firm- Level Empirical Research. Information Systems Research 14(2):127-145. http://dx.doi.org/10.1287/isre.14.2.127.16019 Full terms and conditions of use: http://pubsonline.informs.org/page/terms-and-conditions This article may be used only for the purposes of research, teaching, and/or private study. Commercial use or systematic downloading (by robots or other automatic processes) is prohibited without explicit Publisher approval, unless otherwise noted. For more information, contact [email protected]. The Publisher does not warrant or guarantee the article’s accuracy, completeness, merchantability, fitness for a particular purpose, or non-infringement. Descriptions of, or references to, products or publications, or inclusion of an advertisement in this article, neither constitutes nor implies a guarantee, endorsement, or support of claims made of that product, publication, or service. © 2003 INFORMS Please scroll down for article—it is on subsequent pages INFORMS is the largest professional society in the world for professionals in the fields of operations research, management science, and analytics. For more information on INFORMS, its publications, membership, or meetings visit http://www.informs.org
Transcript of Measuring Information Technology Payoff: A Meta-Analysis of Structural Variables in Firm-Level...
This article was downloaded by: [128.83.63.20] On: 29 September 2014, At: 05:21Publisher: Institute for Operations Research and the Management Sciences (INFORMS)INFORMS is located in Maryland, USA
Information Systems Research
Publication details, including instructions for authors and subscription information:http://pubsonline.informs.org
Measuring Information Technology Payoff: A Meta-Analysisof Structural Variables in Firm-Level Empirical ResearchRajiv Kohli, Sarv Devaraj,
To cite this article:Rajiv Kohli, Sarv Devaraj, (2003) Measuring Information Technology Payoff: A Meta-Analysis of Structural Variables in Firm-Level Empirical Research. Information Systems Research 14(2):127-145. http://dx.doi.org/10.1287/isre.14.2.127.16019
Full terms and conditions of use: http://pubsonline.informs.org/page/terms-and-conditions
This article may be used only for the purposes of research, teaching, and/or private study. Commercial useor systematic downloading (by robots or other automatic processes) is prohibited without explicit Publisherapproval, unless otherwise noted. For more information, contact [email protected].
The Publisher does not warrant or guarantee the article’s accuracy, completeness, merchantability, fitnessfor a particular purpose, or non-infringement. Descriptions of, or references to, products or publications, orinclusion of an advertisement in this article, neither constitutes nor implies a guarantee, endorsement, orsupport of claims made of that product, publication, or service.
© 2003 INFORMS
Please scroll down for article—it is on subsequent pages
INFORMS is the largest professional society in the world for professionals in the fields of operations research, managementscience, and analytics.For more information on INFORMS, its publications, membership, or meetings visit http://www.informs.org
1047-7047/03/1402/0127$05.001526-5536 electronic ISSN
Information Systems Research, � 2003 INFORMSVol. 14, No. 2, June 2003, pp. 127–145
Measuring Information Technology Payoff:A Meta-Analysis of Structural Variables in
Firm-Level Empirical Research
Rajiv Kohli • Sarv Devaraj*Department of Management, University of Notre Dame, Notre Dame, Indiana 46556
[email protected] • [email protected]
Payoffs from information technology (IT) continue to generate interest and debate bothamong academicians and practitioners. The extant literature cites inadequate sample size,
lack of process orientation, and analysis methods among the reasons some studies have shownmixed results in establishing a relationship between IT investment and firm performance.In this paper we examine the structural variables that affect IT payoff through a meta-
analysis of 66 firm-level empirical studies between 1990 and 2000. Employing logistic regres-sion and discriminant analyses, we present statistical evidence of the characteristics that dis-criminate between IT payoff studies that observed a positive effect and those that did not. Inaddition, we conduct ordinary least squares (OLS) regression on a continuous measure of ITpayoff to examine the influence of structural variables on the result of IT payoff studies.The results indicate that the sample size, data source (firm-level or secondary), and industry
in which the study is conducted influence the likelihood of the study finding greater improve-ments on firm performance. The choice of the dependent variable(s) also appears to influencethe outcome (although we did not find support for process-oriented measurement), the typeof statistical analysis conducted, and whether the study adopted a cross-sectional or longitu-dinal design. Finally, we present implications of the findings and recommendations for futureresearch.(Meta-Analysis; Information Technology Payoff; Business Value IT; Firm-Level; Discriminant Anal-ysis; Logistic Regression; Process-Orientation)
1. IntroductionResearchers and business managers consider infor-mation technology (IT) investment as an enabler forimproved organizational efficiency and competitive-ness. Measurable performance improvements result-ing from IT investment can help sustain investment infuture IT initiatives. However, as demand for IT in-vestment increases, the assumed payoff is likely tocome under scrutiny. Although the much talked about“productivity paradox” (Ahituv and Giladi 1993,
*Both authors contributed equally to the manuscript.
Roach 1987, Strassmann 1985) has largely been put torest by recent studies (Brynjolfsson and Hitt 2000,Jorgenson 2001, Jorgenson and Stiroh 2000, Kraemerand Dedrick 2001, Oliner and Sichel 2000), not allstudies have demonstrated clear payoff from ITinvestment.Among the reasons attributed to equivocal results of
past studies are structural issues such as inadequatemeasurement and analysis methodologies (Brynjolfsson1993, Robey and Boudreau 1999) and time lags in mea-suring payoff (Devaraj and Kohli 2000a). Suggestionsto examine IT payoffs include improving the quality
Dow
nloa
ded
from
info
rms.
org
by [
128.
83.6
3.20
] on
29
Sept
embe
r 20
14, a
t 05:
21 .
For
pers
onal
use
onl
y, a
ll ri
ghts
res
erve
d.

KOHLI AND DEVARAJMeasuring Information Technology Payoff
of data and the analytical rigor (Robey and Boudreau1999), examining valuation and conversion barriers(Chircu and Kauffman 2000, Davern and Kauffman2000), applying improved modeling techniques (Hittand Brynjolfsson 1996), and examining intermediateand context-related variables (Barua et al. 1996, Baruaand Mukhopadhyay 2000). Similar calls for improvingexecution of payoff studies and to improve reliabilityof results have been made by past review papers andsyntheses of IT payoff studies (Brynjolfsson and Yang1996, Mahmood et al. 1999, Sircar et al. 1998). There-fore, there is need for a systematic analysis to under-stand the structural characteristics of past IT payoffstudies and how they affect their outcomes. Such find-ings will not only help critically view results of paststudies, they will also serve as a guide for futureresearch.We report a meta-analysis of firm-level IT payoff
studies to catalog the extant literature, examine vari-ables that influence the findings, and provide sugges-tions for conducting future studies. In conducting thismeta-analysis, we examine the structural dimensionsalong which IT payoff studies differ. The analysis at-tempts to observe a pattern, if any, which discrimi-nates between studies that result in positive IT payoffand those that do not. Furthermore, we investigate theextent of payoff resulting from such structuraldimensions.The paper is organized as follows. In §2, we briefly
review the meta-analysis studies in the IT payoff lit-erature and present a literature-guided framework toreview the IT payoff studies. In §3, we present detailsof the procedure adopted for the meta-analysis. In §4,we present results of the statistical analysis of IT payoffstudies. Finally, §5 presents our findings of the influ-ence of structural variables, followed by limitations,contributions, and areas for future research.
2. Review of Literature
2.1. Review of IT Payoff LiteraturePast firm-level studies of IT payoff can be viewed asaddressing three general questions—What is mea-sured, how is it measured, and where is it measured?(Banker et al. 1993, Berger et al. 1988, Mahmood and
Szewczak 1999). In what is measured, past studies pro-pose that IT performance is associated with variablesthat transcend traditional measures and include mea-sures of productivity, in addition to profitability(Mahmood and Mann 2000). Although there is not aconsistent set of performance variables, even whenmeasurement variables are identified, the quality andcompleteness of data and the subsequent robustness ofthe analysis appears to impact the outcome of the ITpayoff studies (Brynjolfsson and Yang 1996, Mahmoodet al. 1999). In other words, the data source and anal-ysis approach have a bearing on the IT payoff result.Study characteristics, such as duration of data col-
lection and the process of IT investment, describe howthe data are gathered.We find that some studies gatherdata at one point in time (Prattipati and Mensah 1997),while others collect three to five annual data points(Barua et al. 1995, Dewan and Min 1997, Hitt andBrynjolfsson 1996, Prasad and Harker 1997). The du-ration of studies, combined with the number of firms,determines the sample size or data points captured ina study. The process of IT investment can be examinedto assess if appropriate IT assets and impacts weremeasured (Soh and Markus 1995). This process mea-surement view proposes that IT expenditures have tobe converted into appropriate IT assets. The appropri-ate use of IT assets leads to IT impacts, and IT impactswhen positioned competitively, lead to impacts on or-ganizational performance (Lucas 1993, Mooney et al.1996, Soh and Markus 1995). Even when IT spendingis shown to improve intermediate variables of orga-nizational productivity, such as improved communi-cation leading to the need for reduced inventories(Dudley and Lasserre 1989), it does not necessarilylead to improvements in productivity (Barua et al.1991).On the question ofwheremeasurements for IT payoff
should occur, prior studies indicate that payoff hasbeen harder to measure in some industries than others.Furthermore, studies that use firms as the data sourceare likely to show a positive relationship between ITinvestment and firm performance because of the com-pleteness and availability of required variables (Hittand Brynjolfsson 1996, Sircar et al. 1998).Although greater payoffs among firm-level studies
are generally expected (Brynjolfsson and Yang 1996,Devaraj and Kohli 2000a, Sircar et al. 1998), our review
128 Information Systems Research/Vol. 14, No. 2, June 2003
Dow
nloa
ded
from
info
rms.
org
by [
128.
83.6
3.20
] on
29
Sept
embe
r 20
14, a
t 05:
21 .
For
pers
onal
use
onl
y, a
ll ri
ghts
res
erve
d.
KOHLI AND DEVARAJMeasuring Information Technology Payoff
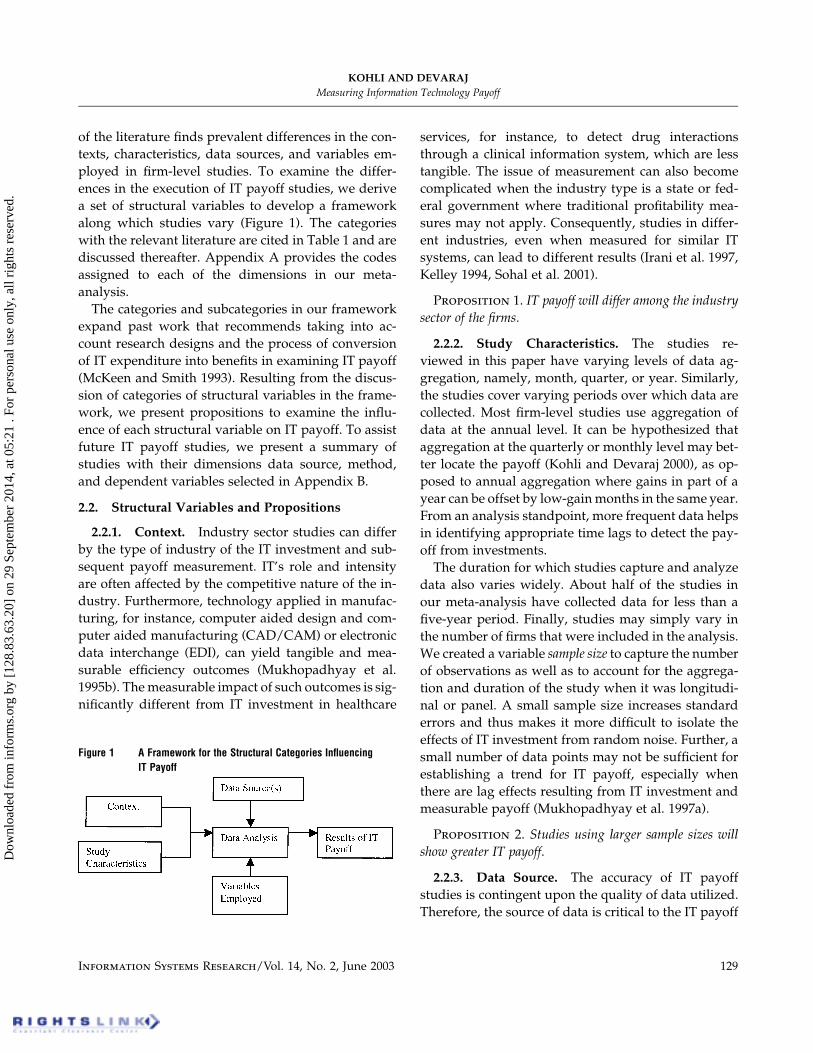
Figure 1 A Framework for the Structural Categories InfluencingIT Payoff
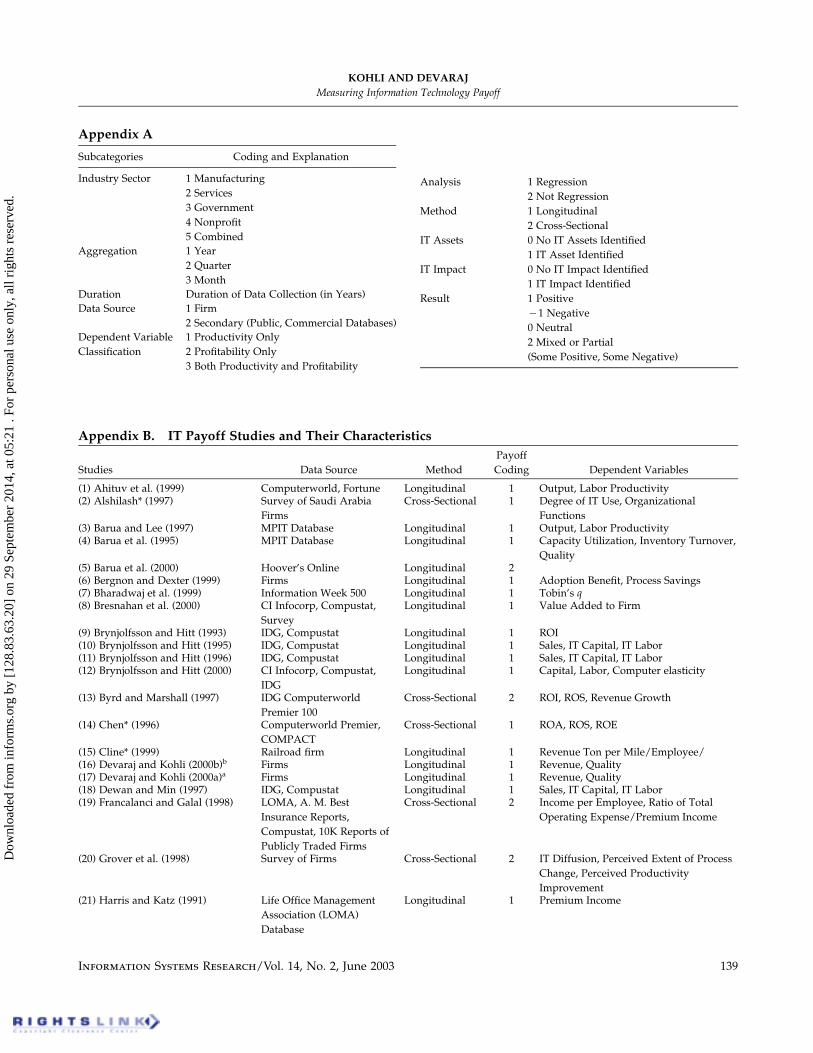
of the literature finds prevalent differences in the con-texts, characteristics, data sources, and variables em-ployed in firm-level studies. To examine the differ-ences in the execution of IT payoff studies, we derivea set of structural variables to develop a frameworkalong which studies vary (Figure 1). The categorieswith the relevant literature are cited in Table 1 and arediscussed thereafter. Appendix A provides the codesassigned to each of the dimensions in our meta-analysis.The categories and subcategories in our framework
expand past work that recommends taking into ac-count research designs and the process of conversionof IT expenditure into benefits in examining IT payoff(McKeen and Smith 1993). Resulting from the discus-sion of categories of structural variables in the frame-work, we present propositions to examine the influ-ence of each structural variable on IT payoff. To assistfuture IT payoff studies, we present a summary ofstudies with their dimensions data source, method,and dependent variables selected in Appendix B.
2.2. Structural Variables and Propositions
2.2.1. Context. Industry sector studies can differby the type of industry of the IT investment and sub-sequent payoff measurement. IT’s role and intensityare often affected by the competitive nature of the in-dustry. Furthermore, technology applied in manufac-turing, for instance, computer aided design and com-puter aided manufacturing (CAD/CAM) or electronicdata interchange (EDI), can yield tangible and mea-surable efficiency outcomes (Mukhopadhyay et al.1995b). Themeasurable impact of such outcomes is sig-nificantly different from IT investment in healthcare
services, for instance, to detect drug interactionsthrough a clinical information system, which are lesstangible. The issue of measurement can also becomecomplicated when the industry type is a state or fed-eral government where traditional profitability mea-sures may not apply. Consequently, studies in differ-ent industries, even when measured for similar ITsystems, can lead to different results (Irani et al. 1997,Kelley 1994, Sohal et al. 2001).
Proposition 1. IT payoff will differ among the industrysector of the firms.
2.2.2. Study Characteristics. The studies re-viewed in this paper have varying levels of data ag-gregation, namely, month, quarter, or year. Similarly,the studies cover varying periods over which data arecollected. Most firm-level studies use aggregation ofdata at the annual level. It can be hypothesized thataggregation at the quarterly or monthly level may bet-ter locate the payoff (Kohli and Devaraj 2000), as op-posed to annual aggregation where gains in part of ayear can be offset by low-gainmonths in the same year.From an analysis standpoint, more frequent data helpsin identifying appropriate time lags to detect the pay-off from investments.The duration for which studies capture and analyze
data also varies widely. About half of the studies inour meta-analysis have collected data for less than afive-year period. Finally, studies may simply vary inthe number of firms that were included in the analysis.We created a variable sample size to capture the numberof observations as well as to account for the aggrega-tion and duration of the study when it was longitudi-nal or panel. A small sample size increases standarderrors and thus makes it more difficult to isolate theeffects of IT investment from random noise. Further, asmall number of data points may not be sufficient forestablishing a trend for IT payoff, especially whenthere are lag effects resulting from IT investment andmeasurable payoff (Mukhopadhyay et al. 1997a).
Proposition 2. Studies using larger sample sizes willshow greater IT payoff.
2.2.3. Data Source. The accuracy of IT payoffstudies is contingent upon the quality of data utilized.Therefore, the source of data is critical to the IT payoff
Information Systems Research/Vol. 14, No. 2, June 2003 129
Dow
nloa
ded
from
info
rms.
org
by [
128.
83.6
3.20
] on
29
Sept
embe
r 20
14, a
t 05:
21 .
For
pers
onal
use
onl
y, a
ll ri
ghts
res
erve
d.
KOHLI AND DEVARAJMeasuring Information Technology Payoff
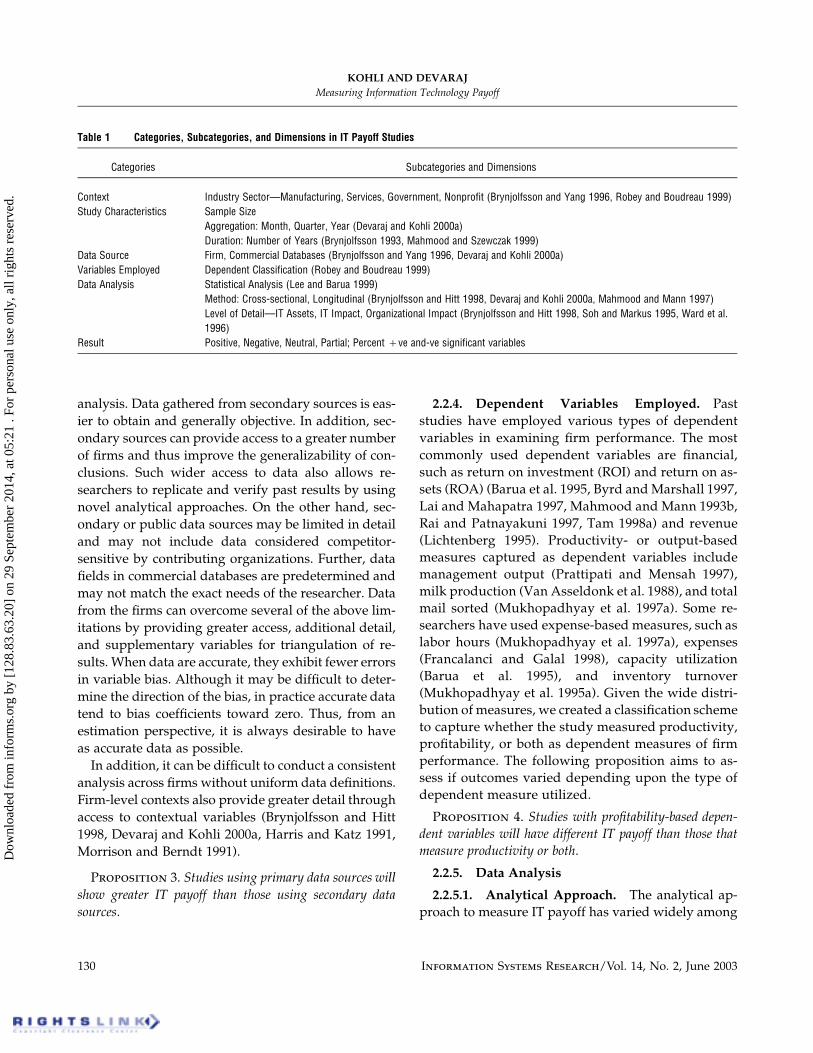
Table 1 Categories, Subcategories, and Dimensions in IT Payoff Studies
Categories Subcategories and Dimensions
Context Industry Sector—Manufacturing, Services, Government, Nonprofit (Brynjolfsson and Yang 1996, Robey and Boudreau 1999)Study Characteristics Sample Size
Aggregation: Month, Quarter, Year (Devaraj and Kohli 2000a)Duration: Number of Years (Brynjolfsson 1993, Mahmood and Szewczak 1999)
Data Source Firm, Commercial Databases (Brynjolfsson and Yang 1996, Devaraj and Kohli 2000a)Variables Employed Dependent Classification (Robey and Boudreau 1999)Data Analysis Statistical Analysis (Lee and Barua 1999)
Method: Cross-sectional, Longitudinal (Brynjolfsson and Hitt 1998, Devaraj and Kohli 2000a, Mahmood and Mann 1997)Level of Detail—IT Assets, IT Impact, Organizational Impact (Brynjolfsson and Hitt 1998, Soh and Markus 1995, Ward et al.1996)
Result Positive, Negative, Neutral, Partial; Percent �ve and-ve significant variables
analysis. Data gathered from secondary sources is eas-ier to obtain and generally objective. In addition, sec-ondary sources can provide access to a greater numberof firms and thus improve the generalizability of con-clusions. Such wider access to data also allows re-searchers to replicate and verify past results by usingnovel analytical approaches. On the other hand, sec-ondary or public data sources may be limited in detailand may not include data considered competitor-sensitive by contributing organizations. Further, datafields in commercial databases are predetermined andmay not match the exact needs of the researcher. Datafrom the firms can overcome several of the above lim-itations by providing greater access, additional detail,and supplementary variables for triangulation of re-sults. When data are accurate, they exhibit fewer errorsin variable bias. Although it may be difficult to deter-mine the direction of the bias, in practice accurate datatend to bias coefficients toward zero. Thus, from anestimation perspective, it is always desirable to haveas accurate data as possible.In addition, it can be difficult to conduct a consistent
analysis across firms without uniform data definitions.Firm-level contexts also provide greater detail throughaccess to contextual variables (Brynjolfsson and Hitt1998, Devaraj and Kohli 2000a, Harris and Katz 1991,Morrison and Berndt 1991).
Proposition 3. Studies using primary data sources willshow greater IT payoff than those using secondary datasources.
2.2.4. Dependent Variables Employed. Paststudies have employed various types of dependentvariables in examining firm performance. The mostcommonly used dependent variables are financial,such as return on investment (ROI) and return on as-sets (ROA) (Barua et al. 1995, Byrd andMarshall 1997,Lai and Mahapatra 1997, Mahmood and Mann 1993b,Rai and Patnayakuni 1997, Tam 1998a) and revenue(Lichtenberg 1995). Productivity- or output-basedmeasures captured as dependent variables includemanagement output (Prattipati and Mensah 1997),milk production (Van Asseldonk et al. 1988), and totalmail sorted (Mukhopadhyay et al. 1997a). Some re-searchers have used expense-based measures, such aslabor hours (Mukhopadhyay et al. 1997a), expenses(Francalanci and Galal 1998), capacity utilization(Barua et al. 1995), and inventory turnover(Mukhopadhyay et al. 1995a). Given the wide distri-bution of measures, we created a classification schemeto capture whether the study measured productivity,profitability, or both as dependent measures of firmperformance. The following proposition aims to as-sess if outcomes varied depending upon the type ofdependent measure utilized.
Proposition 4. Studies with profitability-based depen-dent variables will have different IT payoff than those thatmeasure productivity or both.
2.2.5. Data Analysis
2.2.5.1. Analytical Approach. The analytical ap-proach to measure IT payoff has varied widely among
130 Information Systems Research/Vol. 14, No. 2, June 2003
Dow
nloa
ded
from
info
rms.
org
by [
128.
83.6
3.20
] on
29
Sept
embe
r 20
14, a
t 05:
21 .
For
pers
onal
use
onl
y, a
ll ri
ghts
res
erve
d.
KOHLI AND DEVARAJMeasuring Information Technology Payoff
past studies. Among the approaches utilized areregression-based statistical analyses, such as produc-tion economics (Brynjolfsson and Hitt 1993, 1996, Lich-tenberg 1995) and stochastic production frontier (Leeand Barua 1999, Mukhopadhyay et al. 1997a). Somestudies have utilized canonical correlation analysis(CCA) as a second step to the conventional pair-wisecorrelation analysis. CCA controls for the heterogene-ity among firms and provides a comparison of similarfirms (Ahituv et al. 1999, Mahmood and Mann 1993a).Structural equation modeling (SEM) has also been ap-plied to examine the interrelationships of a set of vari-ables because, unlike linear regression, SEM solvesfor all the relationships simultaneously (Byrd andMarshall 1997). Others have applied less rigorouscorrelation-based analyses to examine payoff from in-vestment in IT (Lubbe et al. 1995, Prattipati andMensah 1997). There are indications that methodolog-ical differences can lead to very different outcomes(Barua and Lee 1997, Shu et al. 2001).We classify the studies into two categories contain-
ing regression and production economic analysis, anda second category that includes descriptive statisticsand correlation-based analyses. Given that mostregression-based analyses are based on an underlyingmodel(s), the researcher is better able to control forsample heterogeneity. Further, such models also typi-cally include control variables and covariates to ac-count for the effect of contextual variables. Therefore,we would expect to detect and capture payoff moreaccurately using regression-based methods.
Proposition 5A. Studies applying regression or eco-nomic models will have higher IT payoff than those applyingcorrelation-based analyses.
2.2.5.2. Method—Longitudinal vs. Cross Sec-tional. Cross-sectional data are presumably easier toobtain and do not require specialized time-series anal-ysis to analyze longitudinal or panel data. It is also anefficient and practical approach to examining the im-pact of IT when the investment being examined is aone-time investment with a known beginning and end-ing. Longitudinal data analysis, although more re-source intensive, allows the researcher to obtain adeeper understanding of the impact of technologyalong the continuum of IT investment (Lucas 1993).
Longitudinal or panel data can often improve the ac-curacy of the results because they can control for firm-specific effects. Furthermore, they also allow the re-searcher to examine lag effects of the impact oftechnology (Devaraj and Kohli 2000a, Peffers and DosSontos 1996). In fact, the lack of consideration for lageffects has been cited as one of the factors contributingto the so called “productivity paradox” (Brynjolfssonand Hitt 1996, Dewan and Min 1997, Lee and Barua1999). Therefore, we propose that studies with longi-tudinal or panel data may be able to better explain theIT payoff.
Proposition 5B. Studies with longitudinal designs willhave greater IT payoff than those with cross-sectionaldesigns.
2.2.5.3. Level of Detail. Although many re-searchers have recognized the need for consideringorganizational factors in addition to IT investment(Brynjolfsson 1993, Byrd and Marshall 1997, Dewanand Min 1997, Grover et al. 1998, Mahmood andMann1997), few have followed this advice in practice. It issuggested that the process of IT investment leading topayoffs should be examined in greater detail becausean investment in IT need not imply that it was the cor-rect investment or that it was targeted appropriately.Soh and Markus (1995) propose that the IT investmentprocess should be broken down further to examine ifit created the appropriate IT assets, and if such assetslead to the appropriate IT impacts.Although the studies reviewed in this meta-analysis
did not clearly outline whether process steps, such asIT assets, or impacts of the IT investment were consid-ered, we examined each study to analyze its processorientation. We qualitatively coded the studiesthrough a binary classification based onwhether or notIT assets were identified. Similarly, another binaryvariable was created to determine if the study mea-sured IT impacts.
Proposition 5C. Studies capturing IT assets and IT im-pacts (process orientation) will have higher IT payoff thanthose lacking process orientation.
2.2.6. Result of Study. One of the objectives ofthis meta-analysis is to understand which variablesmake a difference in the outcome of IT payoff studies.
Information Systems Research/Vol. 14, No. 2, June 2003 131
Dow
nloa
ded
from
info
rms.
org
by [
128.
83.6
3.20
] on
29
Sept
embe
r 20
14, a
t 05:
21 .
For
pers
onal
use
onl
y, a
ll ri
ghts
res
erve
d.

KOHLI AND DEVARAJMeasuring Information Technology Payoff
Given that a significant number of studies reportedpositive or partially positive results, we recoded theresult variable into a binary result—“positive” and“nonpositive.” The primary reason for the binary clas-sification was that the remaining three categories (seeTable 1)—negative, neutral, andmixed—had relativelysmall sample sizes. If the category sizes are not equalto or greater than the number of independent vari-ables, the estimation of the discriminant function andthe classification of the observations can be adverselyaffected (Hair et al. 1998, p. 258). To test the robustnessof this classification scheme we conducted two checks:(1) an analysis with a percentage-based continuouspayoff measure (described is §3) and (2) an examina-tion of the coefficients when each outcome variable ofa study was recoded as an observation.
3. MethodMeta-analysis is rooted in the fundamental values ofscientific enterprise—replicability, quantification,causal and correlation analysis (Bangert-Drowns 1986,Benbasat and Lim 1993), and offers direction for futureresearch (Hunter and Schmidt 1990). As MIS researchadvances, so does the need to conduct more meta-analytic studies (Hwang 1996). The results of thismeta-analysis will contribute in developing metricsand, eventually in building a theory of IT impacts onfirm performance, a vision proposed by several re-searchers (Brynjolfsson and Yang 1996, DeLone andMcLean 1992, Keen 1980, Nault and Benbasat 1990).
3.1. Meta-AnalysisConsistent with the process suggested by Glass et al.(1981), this meta-analysis broadly consists of the fol-lowing steps:(1) Development of a framework listing factors that
contribute to explaining IT payoff (discussed in §2);(2) Selection of studies to be included in the analysis;(3) Documentation and coding of the various char-
acteristics of studies included in the analysis;(4) Statistical meta-analyses through regression (lo-
gistic and ordinary least squares) and discriminantanalysis procedures;(5) Documentation of findings from the two statis-
tical procedures, and directions for future research.
Our meta-analysis of the IT payoff focused on em-pirical, firm-level studies that measured the impact ofIT on performance. Our sample consists of 66 studies(Appendix B) published between 1990 and 2000, un-published dissertations since 1995, and recent workingpapers.** The studies were obtained through a searchof the Social Sciences Index using the keywords IT pay-off, information technology, firm, productivity, firm perfor-mance, technology, and profitability. In addition, we re-viewed the bibliographies of previously publishedreview papers (Barua and Mukhopadhyay 2000, Bryn-jolfsson and Yang 1996, Sircar et al. 1998) to identifyother firm-level studies. We also searched the Disser-tation Index for doctoral dissertations on the topic. Dis-sertations were not included if they resulted in a pub-lished paper already included in our meta-analysis.Dissertations are represented in Appendix B by aster-isks. Further, we contacted more than 15 active re-searchers in this topical area to solicit working papers.
3.2. Variable CodingThe independent variables employed in the analyseswere (a) dependent variable classification, (b) samplesize, (c) data source, (d) IT impact examination, (e) ITasset identification, and (f) industry. These variableswere coded and employed in the analysis in the fol-lowing manner (also, see Appendix A). Dependentvariable classification ranged from one to three de-pending on whether the outcome variables employedin the study were productivity-based, profitability-based, or a combination of both. The sample size is afunction of both the number of firms examined and thenumber of time periods data were analyzed for lon-gitudinal and panel data. This was readily availablefrom the studies. Data source was a dummy variablethat assumed a value of “1” for primary data and “2”for secondary data. The next two variables examinedthe intermediate process variables of IT asset and ITimpact. The IT asset variable was coded “1” if an ITasset was identified and “0” otherwise. Similarly, theIT impact variable was coded “1” if an IT impact wasassessed and “0” otherwise. Finally, we had multipledummy variables to identify the type of industry sec-tor. However, because our objective was to come up
**Someworking papers have since been accepted for publication andare listed as “Forthcoming.”
132 Information Systems Research/Vol. 14, No. 2, June 2003
Dow
nloa
ded
from
info
rms.
org
by [
128.
83.6
3.20
] on
29
Sept
embe
r 20
14, a
t 05:
21 .
For
pers
onal
use
onl
y, a
ll ri
ghts
res
erve
d.
KOHLI AND DEVARAJMeasuring Information Technology Payoff
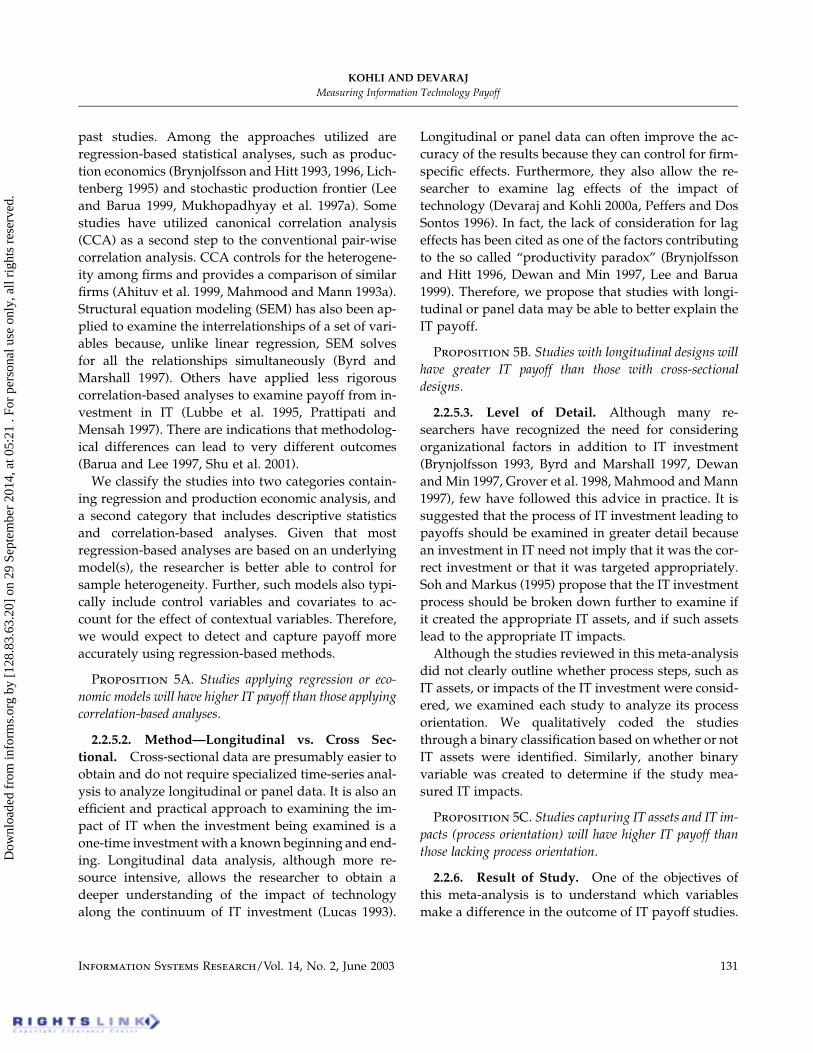
Figure 2 Number of IT Payoff Studies and the Year of Publication
with a parsimonious set of variables that would ex-plain the outcome of a study, our final model em-ployed only the dummy variable for industry that dis-played statistical significance.To check the reliability of the coding procedure, in
addition to the authors, a graduate student was trainedto independently code the above variables by captur-ing data from each study. For the coded variables, theinterrater reliability measure, Kappa, was calculated as0.82. Disagreements in coding were resolved throughdiscussion and clarification.
3.3. Analysis
3.3.1. Logistic Regression (LR). Logistic regres-sion (LR) is preferred when assessing the contributionof variables because it (i) is less affected by variancecovariance inequalities across groups, (ii) is able tohandle categorical variables easily, and (iii) offers case-wise diagnostic measures for examining residuals(Hair et al. 1998, p. 314). LR has been applied in meta-analytic studies to examine clinical heterogeneity(Schulz and Altman 1996) and effectiveness of drugsin cattle (Peters et al. 2000). Estimators from the logisticregression in meta-analytic studies have also shownless bias and better coverage probabilities than otherapproximations (Chang et al. 2000).
3.3.2. Discriminant Analysis (DA). DA is suit-able for understanding and explaining research prob-lems that involve a single categorical-dependent vari-able and several independent variables. DA is a robustanalytical technique that can accommodate mixed in-dependent variables, as is the case in ourmeta-analysis(Hair et al. 1998). Past meta-analytic studies have ap-plied DA to examine public transport in differentcountries (Nijkamp et al. 2000), clinical disciplines ofneurological deterioration and anti-oxidant profiles(Marschoffa et al. 1997), and the influence of unpub-lished studies included in meta-analyses (McAuleya etal. 2000). Similar to our approach, a recent study hasverified the robustness of its results by utilizing morethan one analysis such as DA and LR (Chang et al.2000).
3.3.3. Continuous IT Payoff Variable: OLS Re-gression. We developed a percentage-based “contin-uous” IT payoff variable by categorizing the study out-come (or dependent) variables into subcategories—
positive significant (psig), positive not significant (pnsig),negative significant (nsig), and negative not significant(nnsig). The formula to calculate the continuous payoffvariable for each study is: Continuous payoff variable� [(R psig � R nsig)/ Total # of outcome variables]*100.For example, a study with all dependent variablesshowing positive and significant results will be codedas 100%, whereas a study that had a total of six depen-dent variables (three positive significant and one neg-ative significant) will get a score of [(3�1)]/6 * 100) or33.33%. Thus any score in the range from �100 to�100 is possible depending on the total number ofoutcome variables employed in the study, positive andnegative significant.
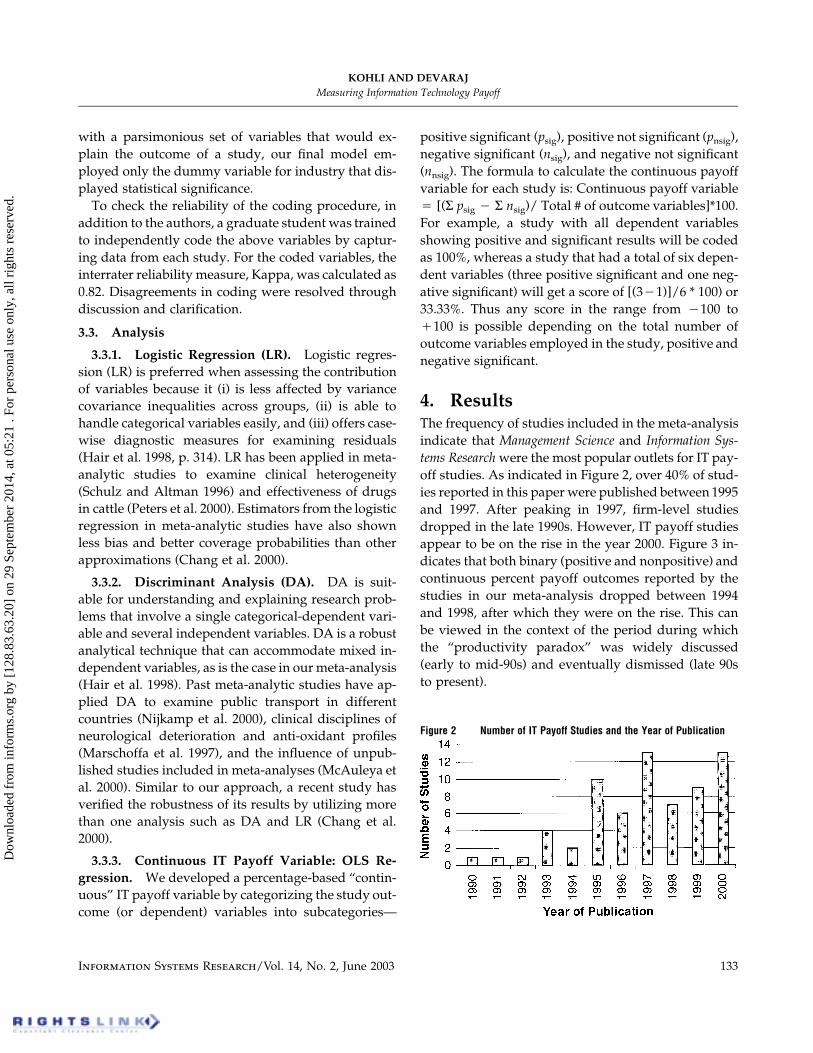
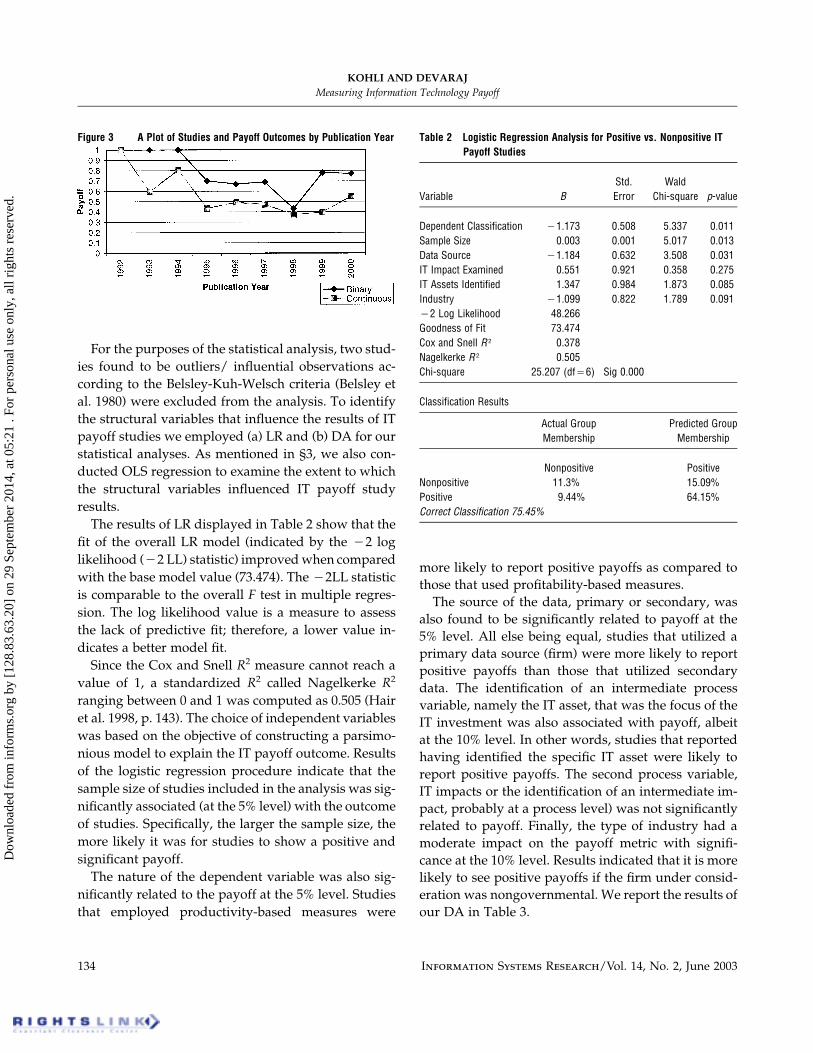
4. ResultsThe frequency of studies included in the meta-analysisindicate that Management Science and Information Sys-tems Research were the most popular outlets for IT pay-off studies. As indicated in Figure 2, over 40% of stud-ies reported in this paper were published between 1995and 1997. After peaking in 1997, firm-level studiesdropped in the late 1990s. However, IT payoff studiesappear to be on the rise in the year 2000. Figure 3 in-dicates that both binary (positive and nonpositive) andcontinuous percent payoff outcomes reported by thestudies in our meta-analysis dropped between 1994and 1998, after which they were on the rise. This canbe viewed in the context of the period during whichthe “productivity paradox” was widely discussed(early to mid-90s) and eventually dismissed (late 90sto present).
Information Systems Research/Vol. 14, No. 2, June 2003 133
Dow
nloa
ded
from
info
rms.
org
by [
128.
83.6
3.20
] on
29
Sept
embe
r 20
14, a
t 05:
21 .
For
pers
onal
use
onl
y, a
ll ri
ghts
res
erve
d.
KOHLI AND DEVARAJMeasuring Information Technology Payoff
Figure 3 A Plot of Studies and Payoff Outcomes by Publication Year Table 2 Logistic Regression Analysis for Positive vs. Nonpositive ITPayoff Studies
Variable BStd.Error
WaldChi-square p-value
Dependent Classification �1.173 0.508 5.337 0.011Sample Size 0.003 0.001 5.017 0.013Data Source �1.184 0.632 3.508 0.031IT Impact Examined 0.551 0.921 0.358 0.275IT Assets Identified 1.347 0.984 1.873 0.085Industry �1.099 0.822 1.789 0.091�2 Log Likelihood 48.266Goodness of Fit 73.474Cox and Snell R 2 0.378Nagelkerke R 2 0.505Chi-square 25.207 (df�6) Sig 0.000
Classification Results
Actual GroupMembership
Predicted GroupMembership
Nonpositive PositiveNonpositive 11.3% 15.09%Positive 9.44% 64.15%Correct Classification 75.45%
For the purposes of the statistical analysis, two stud-ies found to be outliers/ influential observations ac-cording to the Belsley-Kuh-Welsch criteria (Belsley etal. 1980) were excluded from the analysis. To identifythe structural variables that influence the results of ITpayoff studies we employed (a) LR and (b) DA for ourstatistical analyses. As mentioned in §3, we also con-ducted OLS regression to examine the extent to whichthe structural variables influenced IT payoff studyresults.The results of LR displayed in Table 2 show that the
fit of the overall LR model (indicated by the �2 loglikelihood (�2 LL) statistic) improvedwhen comparedwith the base model value (73.474). The �2LL statisticis comparable to the overall F test in multiple regres-sion. The log likelihood value is a measure to assessthe lack of predictive fit; therefore, a lower value in-dicates a better model fit.Since the Cox and Snell R2 measure cannot reach a
value of 1, a standardized R2 called Nagelkerke R2
ranging between 0 and 1 was computed as 0.505 (Hairet al. 1998, p. 143). The choice of independent variableswas based on the objective of constructing a parsimo-nious model to explain the IT payoff outcome. Resultsof the logistic regression procedure indicate that thesample size of studies included in the analysis was sig-nificantly associated (at the 5% level) with the outcomeof studies. Specifically, the larger the sample size, themore likely it was for studies to show a positive andsignificant payoff.The nature of the dependent variable was also sig-
nificantly related to the payoff at the 5% level. Studiesthat employed productivity-based measures were
more likely to report positive payoffs as compared tothose that used profitability-based measures.The source of the data, primary or secondary, was
also found to be significantly related to payoff at the5% level. All else being equal, studies that utilized aprimary data source (firm) were more likely to reportpositive payoffs than those that utilized secondarydata. The identification of an intermediate processvariable, namely the IT asset, that was the focus of theIT investment was also associated with payoff, albeitat the 10% level. In other words, studies that reportedhaving identified the specific IT asset were likely toreport positive payoffs. The second process variable,IT impacts or the identification of an intermediate im-pact, probably at a process level) was not significantlyrelated to payoff. Finally, the type of industry had amoderate impact on the payoff metric with signifi-cance at the 10% level. Results indicated that it is morelikely to see positive payoffs if the firm under consid-eration was nongovernmental. We report the results ofour DA in Table 3.
134 Information Systems Research/Vol. 14, No. 2, June 2003
Dow
nloa
ded
from
info
rms.
org
by [
128.
83.6
3.20
] on
29
Sept
embe
r 20
14, a
t 05:
21 .
For
pers
onal
use
onl
y, a
ll ri
ghts
res
erve
d.
KOHLI AND DEVARAJMeasuring Information Technology Payoff
Table 3 Discriminant Analysis for Positive vs. Nonpositive IT PayoffStudies
Variable
Pooled Within GroupCorrelation Between
Variables andDiscriminant Function
StandardizedCanonical
DiscriminantFunction
Coefficients
Dependent Classification 0.694 0.822Sample Size �0.302 �0.302Source of Data 0.378 0.562IT Impact Examined �0.078 0.150Industry 0.329 0.130IT Assets Assessed �0.078 0.077
Discriminant Function
Group Centroids �1.187 (Positive Results)�0.406 (Not Positive Results)
Eigenvalue 0.502Wilks’ Lambda 0.666 Sig 0.005Degrees of Freedom
Classification Results
Actual GroupMembership
Predicted GroupMembership
Not Positive PositiveNonpositive 13.73% 11.76%Positive 3.92% 70.58%Correct Classification 84.3%
Table 4 OLS Regression Analysis for Continuous IT Payoff Variable
Variable B Std. Error t-value p-value
Dependent Classification �2.654 6.218 �0.427 0.336Sample Size 0.036 0.012 2.918 0.003Data Source �46.948 12.498 �3.757 0.000IT Impact Examined �17.168 11.806 �1.454 0.077Industry �21.561 11.290 �1.910 0.032IT Assets Identified �24.611 11.732 �2.098 0.021
Model Summary R0.669
R 2
0.448Adj. R 2
0.363
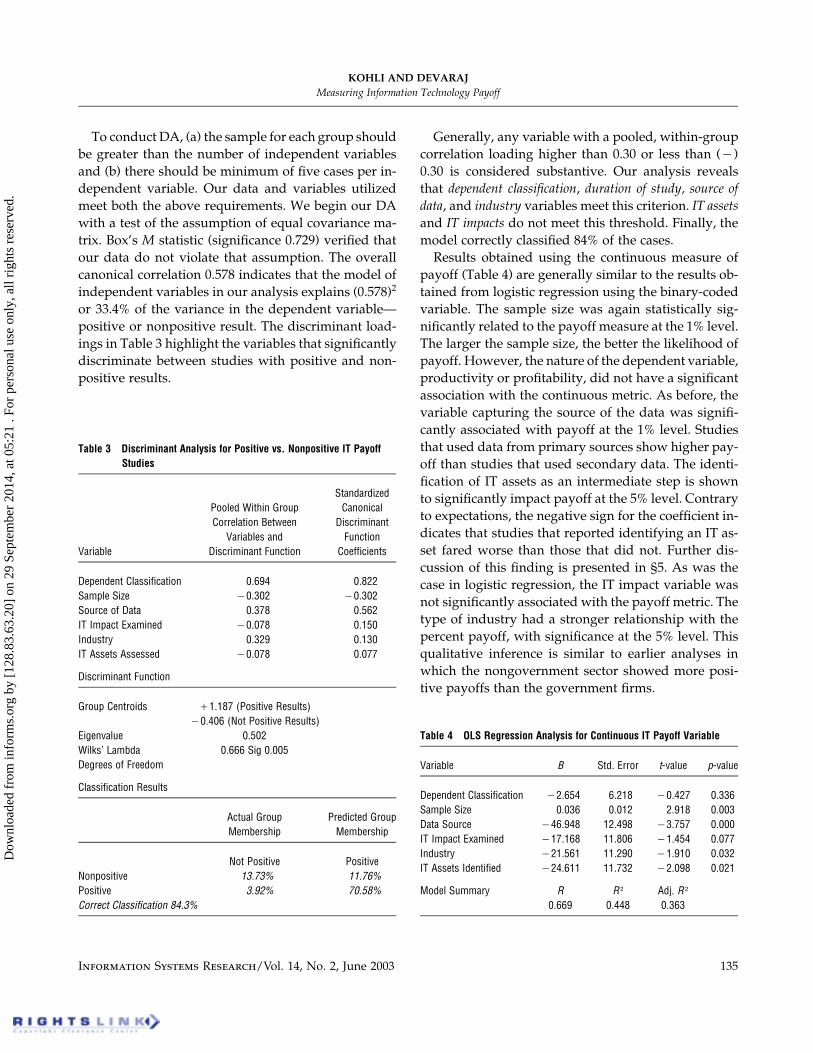
To conduct DA, (a) the sample for each group shouldbe greater than the number of independent variablesand (b) there should be minimum of five cases per in-dependent variable. Our data and variables utilizedmeet both the above requirements. We begin our DAwith a test of the assumption of equal covariance ma-trix. Box’s M statistic (significance 0.729) verified thatour data do not violate that assumption. The overallcanonical correlation 0.578 indicates that the model ofindependent variables in our analysis explains (0.578)2
or 33.4% of the variance in the dependent variable—positive or nonpositive result. The discriminant load-ings in Table 3 highlight the variables that significantlydiscriminate between studies with positive and non-positive results.
Generally, any variable with a pooled, within-groupcorrelation loading higher than 0.30 or less than (�)0.30 is considered substantive. Our analysis revealsthat dependent classification, duration of study, source ofdata, and industry variables meet this criterion. IT assetsand IT impacts do not meet this threshold. Finally, themodel correctly classified 84% of the cases.Results obtained using the continuous measure of
payoff (Table 4) are generally similar to the results ob-tained from logistic regression using the binary-codedvariable. The sample size was again statistically sig-nificantly related to the payoff measure at the 1% level.The larger the sample size, the better the likelihood ofpayoff. However, the nature of the dependent variable,productivity or profitability, did not have a significantassociation with the continuous metric. As before, thevariable capturing the source of the data was signifi-cantly associated with payoff at the 1% level. Studiesthat used data from primary sources show higher pay-off than studies that used secondary data. The identi-fication of IT assets as an intermediate step is shownto significantly impact payoff at the 5% level. Contraryto expectations, the negative sign for the coefficient in-dicates that studies that reported identifying an IT as-set fared worse than those that did not. Further dis-cussion of this finding is presented in §5. As was thecase in logistic regression, the IT impact variable wasnot significantly associated with the payoff metric. Thetype of industry had a stronger relationship with thepercent payoff, with significance at the 5% level. Thisqualitative inference is similar to earlier analyses inwhich the nongovernment sector showed more posi-tive payoffs than the government firms.
Information Systems Research/Vol. 14, No. 2, June 2003 135
Dow
nloa
ded
from
info
rms.
org
by [
128.
83.6
3.20
] on
29
Sept
embe
r 20
14, a
t 05:
21 .
For
pers
onal
use
onl
y, a
ll ri
ghts
res
erve
d.
KOHLI AND DEVARAJMeasuring Information Technology Payoff
A final check of the robustness of our classificationof the payoff outcome involved an examination of thecoefficients when each outcome variable of a studywasrecoded as an observation. The results were still direc-tionally correct after we corrected for heteroscedastic-ity using the Huber-White procedure (for details seeAppendix C).
5. Conclusions and Future Research
5.1. Variables Influencing IT Payoff Study ResultsThis section discusses the implications of the findingsof our meta-analysis of the framework as presented inFigure 1 and Table 1. Where appropriate, the impli-cations of the findings are discussed in terms of theirrelationship with the outcomes of IT payoff studiesand recommendations for future studies.
5.1.1. Influence of Context Variables. The stud-ies in this meta-analysis consisted of the following in-dustry sectors—manufacturing (14%), service (28%),government (10%), nonprofit (35%), and combined(13%). The regression results of the continuous depen-dent variable indicate that the industry sector influ-ences the outcome of the studies. We find a significantdifference between outcomes of studies from varyingindustry types. Further analysis indicates that studiesconducted in nonprofit and government sectors showa greater degree of positive outcomes than in financialand manufacturing sectors combined. A potential ex-planation is that nonprofit and government databasescontain public information and can offer greater con-textual detail to the researcher. Open and accessibledetailed data are critical for verification and triangu-lation of payoff results. Therefore, Proposition 1 issupported.
5.1.2. Influence of Study Characteristics. Bothbinary and continuous analyses indicate that samplesize positively influences the outcomes. DA loadingsalso confirm that sample size is a discriminating vari-able between studies reporting positive and nonposi-tive outcomes. Therefore, there is strong evidence thatsample size influences the results of IT payoff studies.This is consistent with conventional wisdom thatlarger sample sizes provide greater confidence in the
results. Past studies have suggested that shorter du-ration or fewer data points may have contributed tothe equivocal results in some IT payoff studies. There-fore, future studies can increase the confidence in theresults through a combination of granular data collec-tion and longer duration of data. Therefore, Proposition2 is supported.5.1.3. Influence of Data Source. We find support
for the proposition that the source of data in firm-levelstudies influences the results of IT payoff studies. Theanalysis indicates that when using the binary classifi-cation result, studies utilizing firm-level data have agreater incidence of positive results (p�0.10). Furtherunivariate analysis to examine specific secondarysources indicates that the database utilized in obtain-ing data leads to significant differences in the result ofthe study. For instance, studies that have utilizedCom-puter Intelligence (CI) Infocorp or IDG database showa higher mean value of positive results (p�0.10). Anexamination of the studies in this meta-analysis indi-cates that many recent studies that have explicated theproductivity paradox issue have also used one or boththese databases. Therefore, Proposition 3 is supported.5.1.4. Influence of Dependent Variables Em-
ployed. By classifying the diverse dependent vari-ables into productivity, profitability, or both, we findevidence (p�0.01 in binary classification) that suchclassification is associated with the result of past ITpayoff studies. Studies utilizing productivity-baseddependent variables appear to be positively associatedwith payoff from IT investment. This suggests thatproductivity-based measures may be more suited tocapture the payoff. On the other hand, profitability-based measures can be confounded by other factorsthat may influence the firm-level profitability. By con-trast, productivity-based variables also tend to becloser to the process and, therefore, less likely to beconfounded by external variables. Therefore, Proposi-tion 4 is supported.Although, data regarding the type of investment, for
example, hardware or software, were not readily avail-able in published studies and many appear to haveinvested in both, we conducted a univariate analysisto examine any differences in outcomes. The results donot show a significant difference between the types ofinvestment.
136 Information Systems Research/Vol. 14, No. 2, June 2003
Dow
nloa
ded
from
info
rms.
org
by [
128.
83.6
3.20
] on
29
Sept
embe
r 20
14, a
t 05:
21 .
For
pers
onal
use
onl
y, a
ll ri
ghts
res
erve
d.
KOHLI AND DEVARAJMeasuring Information Technology Payoff
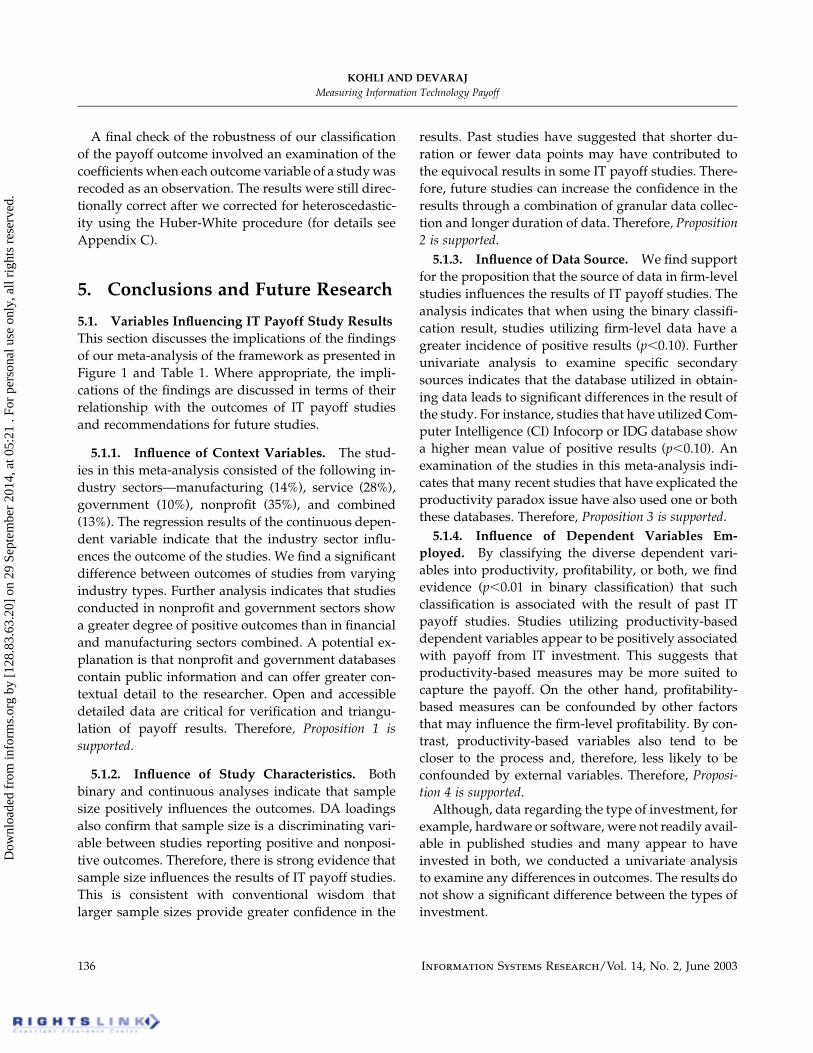
Table 5 Summary of Findings
Categories SubcategoriesLogistic Regression(�ve vs. not �ve)
Discrim. Analysis(�ve vs. not �ve)
OLS (ContinousVariable)
Context Industry Sector Supported* Supported Supported**Study Sample Size Supported** Supported Supported***CharacteristicsData Source Firm, Commercial
DatabasesSupported** Supported Supported***
Variables Dependent Classification Not Supported Supported Not SupportedEmployedData Analysis Statistical Analysis— Not Supported* — —
Model vs. Correlation Method— Not Supported**** — —Cross-sectional vs. LongitudinalLevel of Detail—Assets Supported* Not Supported Supported**Level of Detail—Impact Not Supported Not Supported Supported*
*p�0.10; **p�0.05; ***p�0.01; ****univariate analysis.
5.1.5. Influence of Data Analysis Approach.This data analysis approach category includes the sta-tistical analysis (regression or model vs. correlation),the method of data collection and analysis (cross-sectional and longitudinal), and the process orienta-tion (measurement of IT assets and IT impacts). Uni-variate analysis of the statistical analysis variableindicates no significant difference between studies util-izing models and those that utilize correlation or otherbasic analysis. It should be noted that less than 20% ofthe studies in our meta-analysis applied a correlation-based approach. Further data collection may be nec-essary to examine this issue in greater detail, perhapsat a granular level. Therefore, Proposition 5a is notsupported.The data collection method of a study in and of itself
does not lead to a significant difference in the result.Contrary to previous suggestions (Lee and Barua 1999,Robey and Boudreau 1999), our findings indicate thatlongitudinal studies do not appear to influence the re-sults of the studies. However, it should be noted thatthe longitudinal data variable is partly reflected in thesample size. In other words, longitudinal data arelikely to have larger sample sizes and can help detectlag effects. As discussed above, larger sample sizeslead to positive outcomes. Therefore, Proposition 5b isnot supported.
Finally, the process-orientation variables indicateweak support for their influence on the outcomes of ITpayoff studies. First, in the DA, neither IT assets norIT impacts loaded at an appropriate level (�0.30). Sec-ond, LR found only IT assets significant at (p�0.10).Further, contrary to expectations, IT assets were nega-tively associated with outcomes of studies. In otherwords, studies that did not measure the creation ofappropriate IT assets exhibited positive payoff. Thereason for these unexpected results could be that ourcoding reflected whether the study attempted to iden-tify IT assets, not the results of such assets or the suit-ability of the assets. Therefore, Proposition 5c is notsupported.Table 5 summarizes the findings of analyses. Al-
though, there are characteristics of data analyses thatwere not supported, taken together, our results indi-cate that structural variables do influence the outcomesof IT payoff studies.
5.2. LimitationsOur meta-analysis includes mainly studies from theinformation systems discipline. IT is utilized in almostevery segment of the economy, and it is likely that ITpayoff studies published containing discipline-specifickeywords in bibliographic databases limited oursearch of such trade and academic publications. Sec-ond, although we captured the process orientation
Information Systems Research/Vol. 14, No. 2, June 2003 137
Dow
nloa
ded
from
info
rms.
org
by [
128.
83.6
3.20
] on
29
Sept
embe
r 20
14, a
t 05:
21 .
For
pers
onal
use
onl
y, a
ll ri
ghts
res
erve
d.
KOHLI AND DEVARAJMeasuring Information Technology Payoff
variables, i.e., whether a study identified IT assets orassessed IT impacts, we did not assess their suitabilityor accuracy. It is possible that some firms that mea-sured the process of IT impact may not have done socomprehensively or accurately.
5.3. Contribution and Recommendations forFuture Research
With the exception of Mahmood et al. (1999), ourmeta-analysis represents one of the first attempts to empir-ically validate IT payoff characteristics emphasized bypast research (Barua et al. 1995, Barua et al. 1996,Brynjolfsson and Yang 1996, Brynjolfsson and Hitt1993, Devaraj and Kohli 2000a, Grover et al. 1998,Markus and Robey 1988). We hope that this empiricalvalidation of structural variables and the recommen-dations will improve the reliability of IT payoff studiesat a time of increasing investment in IT. This meta-analysis contributes to the firm-level IT payoff litera-ture by examining, summarizing, and analyzing theempirical studies in an attempt to understand thosestructural characteristics that discriminate betweenpositive and nonpositive results. The findings indicatethat structural variables of IT payoff studies and themanner in which they are conducted do make a dif-ference. First, our findings suggest that, to the extentpossible, future studies should consider gathering datafrom primary sources. Second, when secondary datasources are used, databases such as IDG andComputerIntelligence Infocorpmay provide a better opportunityfor finding influences of structural variables in IT pay-off outcomes. Third, researchers should gather largersamples comprising of longitudinal or panel data toassess the lag effects of IT payoff. A greater number offirms can also increase sample sizes. Fourth,productivity-based dependent variables are bettersuited to assess payoff results than those based onprof-itability measures alone.While studies reported in our meta-analysis were
generally conducted in traditional IT investment, therecent growth in electronic commerce (EC) providesexciting opportunities for IT payoff assessment.We be-lieve that the structural variables analyzed in thismeta-analysis will continue to apply to EC-based ITinvestment, yet inherent characteristics of new tech-nologies can impact IT payoff measurement. For in-stance, surveys indicate that firms use EC to more dil-igently differentiate products than to reduce costs. As
a result many firms have not accrued profits from in-vestment EC initiatives (Belleflamme 2001). Chircu andKauffman (2000) present case-study evidence thatdemonstrates industry and organizational barriers tovaluation and conversion of EC-related IT invest-ments. In such cases the process-oriented structuralmeasurement for IT payoff can yield payoff assessmentat the process-level, before organizational payoffs sur-face due to the impending lag effects. Cybermediariesrequire extensive IT investment and are part of virtualvalue chains. Future studies can measure the payoffaccruing to partners. There are indications that somepartners may not accrue the same payoff as others(Clemons and Row 1993, Rao et al. 1995). A processmeasurement approach can identify what and howvalue is created when one partner invests and how itresults in payoff to others in the supply chain.Future research may also examine the accuracy and
appropriateness of process measures—IT assets and ITimpact—and examine how well they relate to the find-ings of organizational impacts. In such cases IT assetsand IT impacts can also be treated as dependent vari-ables, just as the previous studies have treated orga-nizational impacts. In addition, an examination of eco-nomic and statistical models and their appropriatenessto the data and hypotheses will identify differences inIT payoff results due to analysis.To facilitate future meta-analyses, IT payoff studies
may explicitly report sample sizes, independent and de-pendent variables, and correlation coefficients and theirstatistical significance. In addition, future studies shouldexplicitly report which complementary changes in busi-ness practices, such as business process engineering,business-to-business electronic-commerce initiatives, andenterprise resource planning accompanied the IT invest-ment. Such uniformity in the conduct and analysis ofstudies will isolate and identify the effectiveness of com-plementary changes that lead to IT payoffs (Barua andMukhopadhyay 2000). Such transparent discussion willalso enable replication and theory development.
AcknowledgmentsThe authors thank Robert Bretz and the Management Departmentat the University of Notre Dame for a grant to support this research.The paper has benefited from comments from Matt Bloom, LorinHitt, Mo AdamMahmood, LynneMarkus, and Sue Sherer. Researchsupport from Krishnan Gopalakrishnan, Sevugan Nagappan, andRick Tan is greatly appreciated.
138 Information Systems Research/Vol. 14, No. 2, June 2003
Dow
nloa
ded
from
info
rms.
org
by [
128.
83.6
3.20
] on
29
Sept
embe
r 20
14, a
t 05:
21 .
For
pers
onal
use
onl
y, a
ll ri
ghts
res
erve
d.
KOHLI AND DEVARAJMeasuring Information Technology Payoff
Appendix A
Subcategories Coding and Explanation
Industry Sector 1 Manufacturing2 Services3 Government4 Nonprofit5 Combined
Aggregation 1 Year2 Quarter3 Month
Duration Duration of Data Collection (in Years)Data Source 1 Firm
2 Secondary (Public, Commercial Databases)Dependent VariableClassification
1 Productivity Only2 Profitability Only3 Both Productivity and Profitability
Analysis 1 Regression2 Not Regression
Method 1 Longitudinal2 Cross-Sectional
IT Assets 0 No IT Assets Identified1 IT Asset Identified
IT Impact 0 No IT Impact Identified1 IT Impact Identified
Result 1 Positive�1 Negative0 Neutral2 Mixed or Partial(Some Positive, Some Negative)
Appendix B. IT Payoff Studies and Their Characteristics
Studies Data Source MethodPayoffCoding Dependent Variables
(1) Ahituv et al. (1999) Computerworld, Fortune Longitudinal 1 Output, Labor Productivity(2) Alshilash* (1997) Survey of Saudi Arabia
FirmsCross-Sectional 1 Degree of IT Use, Organizational
Functions(3) Barua and Lee (1997) MPIT Database Longitudinal 1 Output, Labor Productivity(4) Barua et al. (1995) MPIT Database Longitudinal 1 Capacity Utilization, Inventory Turnover,
Quality(5) Barua et al. (2000) Hoover’s Online Longitudinal 2(6) Bergnon and Dexter (1999) Firms Longitudinal 1 Adoption Benefit, Process Savings(7) Bharadwaj et al. (1999) Information Week 500 Longitudinal 1 Tobin’s q(8) Bresnahan et al. (2000) CI Infocorp, Compustat,
SurveyLongitudinal 1 Value Added to Firm
(9) Brynjolfsson and Hitt (1993) IDG, Compustat Longitudinal 1 ROI(10) Brynjolfsson and Hitt (1995) IDG, Compustat Longitudinal 1 Sales, IT Capital, IT Labor(11) Brynjolfsson and Hitt (1996) IDG, Compustat Longitudinal 1 Sales, IT Capital, IT Labor(12) Brynjolfsson and Hitt (2000) CI Infocorp, Compustat,
IDGLongitudinal 1 Capital, Labor, Computer elasticity
(13) Byrd and Marshall (1997) IDG ComputerworldPremier 100
Cross-Sectional 2 ROI, ROS, Revenue Growth
(14) Chen* (1996) Computerworld Premier,COMPACT
Cross-Sectional 1 ROA, ROS, ROE
(15) Cline* (1999) Railroad firm Longitudinal 1 Revenue Ton per Mile/Employee/(16) Devaraj and Kohli (2000b)b Firms Longitudinal 1 Revenue, Quality(17) Devaraj and Kohli (2000a)a Firms Longitudinal 1 Revenue, Quality(18) Dewan and Min (1997) IDG, Compustat Longitudinal 1 Sales, IT Capital, IT Labor(19) Francalanci and Galal (1998) LOMA, A. M. Best
Insurance Reports,Compustat, 10K Reports ofPublicly Traded Firms
Cross-Sectional 2 Income per Employee, Ratio of TotalOperating Expense/Premium Income
(20) Grover et al. (1998) Survey of Firms Cross-Sectional 2 IT Diffusion, Perceived Extent of ProcessChange, Perceived ProductivityImprovement
(21) Harris and Katz (1991) Life Office ManagementAssociation (LOMA)Database
Longitudinal 1 Premium Income
Information Systems Research/Vol. 14, No. 2, June 2003 139
Dow
nloa
ded
from
info
rms.
org
by [
128.
83.6
3.20
] on
29
Sept
embe
r 20
14, a
t 05:
21 .
For
pers
onal
use
onl
y, a
ll ri
ghts
res
erve
d.

KOHLI AND DEVARAJMeasuring Information Technology Payoff
Appendix B. (cont’d.)(22) Haynes and Thompson (2000) Banking World Longitudinal 1 ATM Adoption(23) Hitt and Brynjolfsson (1996) IDG Surveys, Compustat II,
Bureau of EconomicAnalysis, Council ofEconomic Advisors
Longitudinal 2 Sales Revenue, Labor Productivity, TotalFactor Productivity
(24) Kelley (1994) Firms Cross-Sectional 1 Production Hours, Setup Hours, MachineHours
(25) Kivijarvi and Saarinen (1995) Talouselama Magazine,Survey
Cross-Sectional 2
(26) Kohli and Devaraj (2000) Firms Longitudinal 1 Revenue(27) Koski (1999) The Federation of Finnish
Electrical and ElectronicsIndustry (SETELI)
Longitudinal 2 Sales Revenue, Labor Productivity, TotalProductivity
(28) Kudyba and Diwan (2000) CI Infocorp Cross-Sectional 1 Revenue(29) Kwon and Stoneman (1995) Firm Surveys, Lotus
DatastreamLongitudinal 1 Value Added to Firm
(30) Lee and Barua (1999) MPIT Database Longitudinal –1 Output, Labor Productivity(31) Lee and Perry (2000) CI Infocorp Longitudinal 1 Gross State Product(32) Lehr and Lichtenberg (1998) Bureau of Labor Statistics
(BLS) Federal ProductivityMeasurement Program, CIInfocorp
Longitudinal 1 Productivity, Labor Costs
(33) Li and Ye (1999) Compustat;InformationWeek, U.S. Deptof Labor’s U.S. IndustrialOutlook
Longitudinal 1 Return on Assets, Return on Sales
(34) Lichtenberg (1995) IDG, InformationWeek,Computerworld
Longitudinal 1 Revenue
(35) Loveman (1994) MPIT Database Longitudinal –1 Output, Labor Productivity(36) Lubbe et al. (1995) Firms Survey Longitudinal 1 Computerization Index, Operating
Expense Ratio(37) Mahmood and Mann (1993a) Computerworld Premier
100, Compact DISCLOSUREDatabase
Longitudinal 1 ROS, ROI, Growth in Revenues
(38) Mahmood and Mann (1997) Computerworld Premier100
Longitudinal 1 ROS, Growth in Revenues
(39) Markus and Soh (1993) Federal Reserve Bank Longitudinal 1 Profitability(40) Mayberry-Stewart* (1996) Dornfest Hospital Database Longitudinal 2 IT Performance (Application and
Technology Intensity)(41) McKeen and Smith (1993) Firm Longitudinal 1 Revenue, CPU Time, Employees(4)2 Menon and Lee (2000) State Healthcare Database Longitudinal 1 Costs(43) Menon et al. (2000) State Healthcare Database Longitudinal 1 Costs(44) Mistry and Johnston (2000) Fed Reserve Bank Longitudinal 1 Labor Costs, Revenue(45) Mukhopadhyay et al. (1995a) Firm Longitudinal 1 Inventory Turnover, Costs, Production
Volume(46) Mukhopadhyay et al. (1997b) Firm Longitudinal 1 Labor Hours, Number of Transactions,
Type of Transaction(47) Mukhopadhyay et al. (1997a) Firm Longitudinal 1 Total Output, On-Time Output, Labor
Hours(48) Panthawi* (1999) Firms in Thailand Longitudinal 2 Firm Performance(49) Papp (1999) Fortune, Other Longitudinal 0 Financial Performance
140 Information Systems Research/Vol. 14, No. 2, June 2003
Dow
nloa
ded
from
info
rms.
org
by [
128.
83.6
3.20
] on
29
Sept
embe
r 20
14, a
t 05:
21 .
For
pers
onal
use
onl
y, a
ll ri
ghts
res
erve
d.
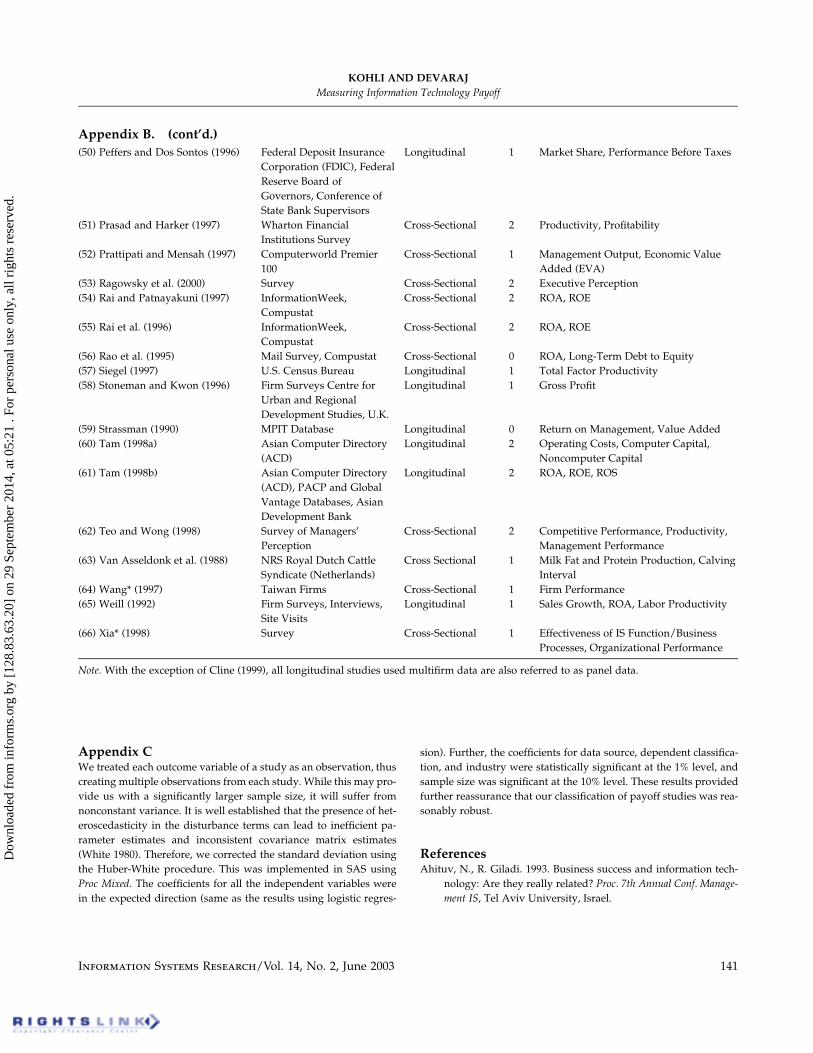
KOHLI AND DEVARAJMeasuring Information Technology Payoff
Appendix B. (cont’d.)(50) Peffers and Dos Sontos (1996) Federal Deposit Insurance
Corporation (FDIC), FederalReserve Board ofGovernors, Conference ofState Bank Supervisors
Longitudinal 1 Market Share, Performance Before Taxes
(51) Prasad and Harker (1997) Wharton FinancialInstitutions Survey
Cross-Sectional 2 Productivity, Profitability
(52) Prattipati and Mensah (1997) Computerworld Premier100
Cross-Sectional 1 Management Output, Economic ValueAdded (EVA)
(53) Ragowsky et al. (2000) Survey Cross-Sectional 2 Executive Perception(54) Rai and Patnayakuni (1997) InformationWeek,
CompustatCross-Sectional 2 ROA, ROE
(55) Rai et al. (1996) InformationWeek,Compustat
Cross-Sectional 2 ROA, ROE
(56) Rao et al. (1995) Mail Survey, Compustat Cross-Sectional 0 ROA, Long-Term Debt to Equity(57) Siegel (1997) U.S. Census Bureau Longitudinal 1 Total Factor Productivity(58) Stoneman and Kwon (1996) Firm Surveys Centre for
Urban and RegionalDevelopment Studies, U.K.
Longitudinal 1 Gross Profit
(59) Strassman (1990) MPIT Database Longitudinal 0 Return on Management, Value Added(60) Tam (1998a) Asian Computer Directory
(ACD)Longitudinal 2 Operating Costs, Computer Capital,
Noncomputer Capital(61) Tam (1998b) Asian Computer Directory
(ACD), PACP and GlobalVantage Databases, AsianDevelopment Bank
Longitudinal 2 ROA, ROE, ROS
(62) Teo and Wong (1998) Survey of Managers’Perception
Cross-Sectional 2 Competitive Performance, Productivity,Management Performance
(63) Van Asseldonk et al. (1988) NRS Royal Dutch CattleSyndicate (Netherlands)
Cross Sectional 1 Milk Fat and Protein Production, CalvingInterval
(64) Wang* (1997) Taiwan Firms Cross-Sectional 1 Firm Performance(65) Weill (1992) Firm Surveys, Interviews,
Site VisitsLongitudinal 1 Sales Growth, ROA, Labor Productivity
(66) Xia* (1998) Survey Cross-Sectional 1 Effectiveness of IS Function/BusinessProcesses, Organizational Performance
Note. With the exception of Cline (1999), all longitudinal studies used multifirm data are also referred to as panel data.
Appendix CWe treated each outcome variable of a study as an observation, thuscreating multiple observations from each study. While this may pro-vide us with a significantly larger sample size, it will suffer fromnonconstant variance. It is well established that the presence of het-eroscedasticity in the disturbance terms can lead to inefficient pa-rameter estimates and inconsistent covariance matrix estimates(White 1980). Therefore, we corrected the standard deviation usingthe Huber-White procedure. This was implemented in SAS usingProc Mixed. The coefficients for all the independent variables werein the expected direction (same as the results using logistic regres-
sion). Further, the coefficients for data source, dependent classifica-tion, and industry were statistically significant at the 1% level, andsample size was significant at the 10% level. These results providedfurther reassurance that our classification of payoff studies was rea-sonably robust.
ReferencesAhituv, N., R. Giladi. 1993. Business success and information tech-
nology: Are they really related? Proc. 7th Annual Conf. Manage-ment IS, Tel Aviv University, Israel.
Information Systems Research/Vol. 14, No. 2, June 2003 141
Dow
nloa
ded
from
info
rms.
org
by [
128.
83.6
3.20
] on
29
Sept
embe
r 20
14, a
t 05:
21 .
For
pers
onal
use
onl
y, a
ll ri
ghts
res
erve
d.

KOHLI AND DEVARAJMeasuring Information Technology Payoff
——, S. Lipovetsky, A. Tishler. 1999. The relationship between firms’information systems policy and business performance: A mul-tivariate analysis. M. A. Mahmood, E. J. Szewczak, eds. Mea-suring Information Technology Payoff: Contemporary Approaches.Idea Group, Hershey, PA, 62–82.
Alshilash, A. 1997. A study to measure the use and effects of infor-mation technology on organizational functions. UnpublishedD.Sc. dissertation, GeorgeWashingtonUniversity,Washington,D.C.
Bangert-Drowns, R. L. 1986. Review of developments in meta-analytic method. Psych. Bull. 99 388–399.
Banker, Rajiv D., Robert J. Kauffman, Mo Adam Mahmood. 1993.Strategic Information Technology Management: Perspectives on Or-ganizational Growth and Competitive Advantage. Idea Group Pub.,Harrisburg, PA.
Barua, A., B. Lee. 1997. An economic analysis of the introduction ofan electronic data interchange system. Inform. Systems Res. 8(4)398–422.
——, T. Mukhopadhyay. 2000. Information technology and businessperformance: Past, present, and future. R. W. Zmud, ed. Fram-ing the Domains of IT Research: Projecting the Future Through thePast. Pinnaflex Educational Resources, Cincinnati, OH, 65–84.
——, C. Kriebel, T. Mukhopadhyay. 1991. An economic-analysis ofstrategic information technology investments. MIS Quart. 15(3)313–331.
——, ——, ——. 1995. Information technologies and businessvalue—An analytic and empirical investigation. Inform. SystemsRes. 6(1) 3–23.
——, C. H. S. Lee, A. B. Whinston. 1996. The calculus of reengineer-ing. Inform. Systems Res. 7(4) 409–428.
——, F. Yin, A. B.Whinston. 2000. Not all dot coms are created equal:A study of the productivity of Internet based companies. 65–84.
Belleflamme, P. 2001. Oligopolistic competition, IT use for productdifferentiation and the productivity paradox. Internat. J. Indust.Organ. 19(1–2) 227–248.
Belsley, D. A., E. Kuh, R. Y.Welsch. 1980.Regression Diagnostics: Iden-tifying Influential Data and Sources of Collinearity. John Wiley &Sons, New York.
Benbasat, I., L. Lim. 1993. The effects of group, task, context, andtechnology variables on the usefulness of group support sys-tems. Small Group Res. 24(4) 430–462.
Berger, P., D. Sutherland, J. Kobelious. 1988. Measuring BusinessValue of Information Technologies. International Center for Infor-mation Technologies, Washington, D.C.
Bergnon, M., A. Dexter. 1999. An assessment of financial EDI valueto corporate adopters. M. A. Mahmood, E. J. Szewczak, eds.Measuring Information Technology Payoff: Contemporary Ap-proaches. Idea Group, Hershey, PA, 346–364.
Bharadwaj, A. S., S. G. Bharadwaj, B. R. Konsynski. 1999. Informa-tion technology effects on firm performance as measured byTobin’s q. Management Sci. 45(7) 1008–1024.
Bresnahan, T. F., E. Brynjolfsson, L. Hitt. 2000. Information technol-ogy, workplace organization, and the demand for skilled labor.Quart. J. Econom. Forthcoming.
Brynjolfsson, E. 1993. The productivity paradox of information tech-nology. Comm. ACM 36(12) 66–77.
——, L. Hitt. 1998. Beyond the productivity paradox. Comm. ACM41(8) 49–55.
——, ——. 1993. Is information systems spending productive? Newevidence and new results. Proc. 14th Internat. Conf. Inform. Sys-tems, Orlando, FL, 47–64.
——, ——. 1995. Information technology as a factor of production:The role of differences among firms. Econom. Innovation and NewTech. 3 183–199.
——, ——. 1996. Paradox lost? Firm-level evidence on the returns toinformation systems spending. Management Sci. 42(4) 541–558.
——, ——. 2000. Beyond computation: Information technology, or-ganizational transformation and business performance. J.Econom. Perspectives 14(4) 23–48.
——, S. Yang. 1996. Information technology and productivity: A re-view of literature. Adv. Comput. 43 179–214.
Byrd, T. A., T. E. Marshall. 1997. Relating information technologyinvestment to organizational performance: A causal modelanalysis. Omega Internat. J. Management Sci. 25(1) 43–56.
Chang, B. H., S. Lipsitz, C. Waternaux. 2000. Logistic regression inmeta-analysis using aggregate data. J. Appl. Statist. 27(4) 411–424.
Chen, W. 1996. On the relationship between information technologyinvestment and corporate performance: An empirical investi-gation of the United States industries. Unpublished Ph.D. dis-sertation, Drexel University, Philadelphia, PA.
Chircu, A. M., R. J. Kauffman. 2000. Limits to value in electroniccommerce-related IT investments. J. Management Inform. Sys-tems 17(2) 59–80.
Clemons, E. K., M. Row. 1993. Limits to interfirm coordinationthrough information technology: Results of a field study in con-sumer packaged goods distribution. J. Management Inform. Sys-tems 10(1) 73–96.
Cline, M. 1999. The impact of information technology investment onproductivity improvements in the American railroad industrybetween 1986 and 1995. Unpublished Ph.D. dissertation, Flor-ida State University.
Davern, M. J., R. J. Kauffman. 2000. Discovering potential and real-izing value from information technology investments. J. Man-agement Inform. Systems 16(4) 121–143.
DeLone, W. H., E. R. McLean. 1992. Information systems success: Insearch of the independent variable. Inform. Systems Res. 3(1) 60–95.
Devaraj, S., R. Kohli. 2000a. Information technology payoff in thehealthcare industry: A longitudinal study. J. Management In-form. Systems 16(4) 41–67.
——, ——. 2000b. Performance impacts of information technology:Is actual usage the missing link? Management Sci. Forthcoming.
Dewan, S., C. K. Min. 1997. The substitution of information technol-ogy for other factors of production: A firm level analysis. Man-agement Sci. 43(12) 1660–1675.
Dudley, L., P. Lasserre. 1989. Information as a substitute for inven-tories. Eur. Econom. Rev. 31 1–21.
142 Information Systems Research/Vol. 14, No. 2, June 2003
Dow
nloa
ded
from
info
rms.
org
by [
128.
83.6
3.20
] on
29
Sept
embe
r 20
14, a
t 05:
21 .
For
pers
onal
use
onl
y, a
ll ri
ghts
res
erve
d.
KOHLI AND DEVARAJMeasuring Information Technology Payoff
Francalanci, C., H. Galal. 1998. Information technology and workercomposition: Determinants of productivity in the life insuranceindustry. MIS Quart. 22(2) 227–241.
Glass, G. V., B. McGaw, M. L. Smith. 1981. Meta-analysis in SocialResearch. Sage, Beverly Hills, CA.
Grover, V., J. Teng, A. Segars, K. Fiedler. 1998. The influence of in-formation technology diffusion and business process change onperceived productivity: The IS executive’s perspective. Inform.Management 34(3) 141–159.
Hair, Joseph F., R. Tatham, R. Anderson, W. Black. 1998.MultivariateData Analysis. Prentice Hall, Upper Saddle River, NJ.
Harris, Sidney E., Joseph L. Katz. 1991. Organizational performanceand IT investment intensity in the insurance. Organ. Sci. 2(3)263–295.
Haynes, M., S. Thompson. 2000. Productivity, employment and “ITParadox”: Evidence from financial services. R. Barrel, G. Ma-son, M. O’Mahony, eds. Productivity, Innovation and EconomicPerformance. University Press, Cambridge, U.K., 93–116.
Hitt, L. M., E. Brynjolfsson. 1996. Productivity, business profitability,and consumer surplus: Three different measures of informationtechnology value. MIS Quart. 20(2) 121–142.
Hunter, J. E., F. L. Schmidt. 1990. Methods of Meta-Analysis. Sage,Newbury Park, CA.
Hwang, M. I. 1996. The use of meta-analysis in MIS research: Prom-ises and problems. Data Base for Adv. Inform. Systems 27(3) 35–48.
Irani, Z., J. N. Ezingeard, R. J. Grieve. 1997. Integrating the costs ofa manufacturing IT/IS infrastructure into the investmentdecision-making process. Technovation 17(11–12) 695–706.
Jorgenson, D. W. 2001. Information technology and the U.S. econ-omy. Amer. Econom. Rev. 91(1) 1–32.
——, K. J. Stiroh. 2000. Raising the speed limit: U.S. economic growthin the information age. Brookings Papers on Econom. Activity 1125–235.
Keen, Peter G. W. 1980. MIS research: Reference disciplines and acumulative tradition. Proc. 1st Internat. Conf. Inform. Systems,Philadelphia, PA, 9–18.
Kelley, M. R. 1994. Productivity and information technology—Theelusive connection. Management Sci. 40(11) 1406–1425.
Kivijarvi, H., T. Saarinen. 1995. Investment in information systemsand the financial performance of the firm. Inform. Management28(2) 143–163.
Kohli, R., S. Devaraj. 2000. Contribution of decision support systemsto organizational performance: Evidence from a longitudinalstudy. Decision Support Systems. Forthcoming.
Koski, H. 1999. The implications of network use, productionnetworkexternalities and public networking programmes for firm’s pro-ductivity. Res. Policy 28(4) 423–439.
Kraemer, K. L., J. Dedrick. 2001. The productivity paradox: Is it re-solved? Is there a new one? What does it all mean for manag-ers? CRITO, University of California (February).
Kudyba, S., R. Diwan. 2000. Productivity in the U.S. informationtechnologies. Proc. North Amer. Productivity Workshop, Schenec-tady, NY.
Kwon, Myung Joong, Paul Stoneman. 1995. The impact of technol-ogy adoption on firm productivity. Econom. Innovation and NewTech. 3 219–233.
Lai, V. S., R. K. Mahapatra. 1997. Exploring the research in infor-mation technology implementation. Inform. Management 32(4)187–201.
Lee, B., A. Barua. 1999. An integrated assessment of productivityand efficiency impacts of information technology investments:Old data, new analysis and evidence. J. Productivity Analysis12(1) 21–43.
Lee, G., J. Perry. 2000. Are computers boosting productivity? A testof paradox in state governments. University of California,Irvine, CA.
Lehr, W., F. R. Lichtenberg. 1998. Computer use and productivitygrowth in U.S. federal government agencies, 1987–92. J. Indust.Econom. 46(2) 257–279.
Li, M. F., L. R. Ye. 1999. Information technology and firm perfor-mance: Linking with environmental, strategic and managerialcontexts. Inform. Management 35(1) 43–51.
Lichtenberg, Frank R. 1995. The output contributions of computerequipment and personal: A firm-level analysis. Econom. Inno-vation and New Tech. 3 201–217.
Loveman, Gary W. 1994. An Assessment of the Productivity Impact ofthe Information Technologies. OxfordUniversity Press,NewYork.
Lubbe, S., G. Parker, A. Hoard. 1995. The profit impact of IT invest-ment. J. Inform. Tech. 10 44–51.
Lucas, Henry C. 1993. The business value of information technology:A historical perspective and thoughts for future research. R.Banker, R. Kauffman, M. A. Mahmood, eds. Strategic Informa-tion Technology Management. Idea Group, Harrisburg, PA, 359–374.
Mahmood, M., G. Mann. 1993a. Measuring the organizational im-pact of information technology investment: An exploratorystudy. J. Management Inform. Systems 10(1) 97–122.
——, ——. 1993b. Measuring the organizational impact of informa-tion technology investment: An exploratory study. J. Manage-ment Inform. Systems 10(1) 97–122.
——, ——. 1997. How information technology investments affect or-ganizational productivity and performance: A longitudinalstudy. Proc. 1997 Inform. Resources Management Association In-ternat. Conf. 187–191.
——, ——. 2000. Special issue: Impacts of information technologyinvestment on organizational performance. J. Management In-form. Systems 16(4) 3–10.
——, Edward J. Szewczak. 1999. Measuring Information TechnologyInvestment Payoff: Contemporary Approaches. Idea Group Pub.,Hershey, PA.
——,——, A. Abddahllah. 1999. Information technology investmentand organizational performance: A meta-analysis. Proc. Na-tional Decision Sci. Inst. Conf. New Orleans, LA, 669–671.
Markus, M. L., D. Robey. 1988. Information technology andorganizational-change—Causal-structure in theory and re-search. Management Sci. 34(5) 583–598.
Information Systems Research/Vol. 14, No. 2, June 2003 143
Dow
nloa
ded
from
info
rms.
org
by [
128.
83.6
3.20
] on
29
Sept
embe
r 20
14, a
t 05:
21 .
For
pers
onal
use
onl
y, a
ll ri
ghts
res
erve
d.

KOHLI AND DEVARAJMeasuring Information Technology Payoff
——, Christina Soh. 1993. Banking on information technology: Con-verting IT spending into firm performance. R. Banker, R. Kauff-man, M. A. Mahmood, eds. Strategic Information TechnologyManagement. Idea Group, Harrisburg, PA, 375–404.
Marschoffa, E., R. Domı́ngueza, E. S. de Lustiga, A. Famularia, J.Serra. 1997. Neurological deterioration, heterogeneity of Alz-heimer disease and antioxidant profiles: A four trials meta-analysis. J. Neurological Sci. 150(1) S22.
Mayberry-Stewart, M. 1996. Determinants of information technologystrategic performance: An analysis of firm performance, IT per-formance, IT investment intensity and IT governance in thehealth care sector. Unpublished Ph.D. dissertation, ClaremontGraduate School, Claremont, CA.
McAuleya, Laura, Ba’ Phama, Peter Tugwellb, David Moher. 2000.Does the inclusion of grey literature influence estimates of in-tervention effectiveness reported in meta-analyses? The Lancet356(9237) 1228–1231.
McKeen, James D., Heather A. Smith. 1993. The relationship betweeninformation technology use and organizational performance. R.Banker, R. Kauffman, M. A. Mahmood, eds. Strategic Informa-tion Technology Management, Idea Group, Harrisburg, PA, 405–445.
Menon, Nirup M., Byungtae Lee. 2000. Cost control and productionperformance enhancement by IT investment and regulationchanges: Evidence from Washington State healthcare serviceindustry. Decision Support Systems. Forthcoming.
——, ——, L. Eldenburg. 2000. Productivity of information systemsin the healthcare industry. Inform. Systems Res. 11(1) 83–92.
Mistry, J., H. Johnston. 2000. Differential impacts of informationtechnologies on cost and revenue driver relationships in se-lected banking functions. Proc. Amer. Accounting Association,Philadelphia, PA, 1–34.
Mooney, J. G., V. Gurbaxani, K. L. Kraemer. 1996. A process orientedframework for assessing the business value of information tech-nology. (Reprinted from Proc. 16th Annual Intern. Conf. Inform.Systems, 1995, pp. 17–27).Data Base for Adv. Inform. Systems 27(2)68–81.
Morrison, C., E. Berndt. 1991. Assessing the productivity of infor-mation technology equipment in U.S. manufacturing indus-tries. Working paper, National Bureau of Economic Research.
Mukhopadhyay, T., A. Barua, C. H. Kriebel. 1995a. Information tech-nologies and business value—An analytic and empirical inves-tigation. Inform. Systems Res. 6(2) U2–U2.
——, S. Kekre, S. Kalathur. 1995b. Business value of informationtechnology—A study of electronic data interchange.MIS Quart.19(2) 137–156.
——, F. Javier Lerch, Vandana Mangal. 1997b. Assessing the impactof information technology on labor productivity: A field study.Decision Support Systems 19(2) 109–122.
——, S. Rajiv, K. Srinivasan. 1997a. Information technology impacton process output and quality. Management Sci. 43(12) 1645–1659.
Nault, B., I. Benbasat. 1990. An evaluation of empirical research inmanagerial support systems. Decision Support Systems 6 203–226.
Nijkamp, P., P. Rietveld, L. Spierdijk. 2000. A meta-analytic com-parison of determinants of public transport use: Methodologyand application. Environment and Planning B-Planning & Design27(6) 893–903.
Oliner, S. D., D. E. Sichel. 2000. The resurgence of growth in the late1990s: Is information technology the story? J. Econom. Perspec-tives 14(4) 3–22.
Panthawi, P. 1999. An investigation of it effects on various aspectsof organizational effectiveness (information technology, firmperformance, productivity). Unpublished Ph.D. dissertation,Claremont Graduate University, Claremont, CA.
Papp, R. 1999. Business-IT alignment: Productivity paradox payoff?Indust. Management & Data Systems 99(7–8) 367–373.
Peffers, K., B. L. Dos Sontos. 1996. Performance effects of innovativeIT applications over time. IEEE Trans. Engrg. Management 43(4)381–392.
Peters, A. R., T. A. Martinez, A. J. C. Cook. 2000. A meta-analysis ofstudies of the effect of GnRH 11–14 days after insemination onpregnancy rates in cattle. Theriogenology 54(8) 1317–1326.
Prasad, B., P. Harker. 1997. Examining the contribution of informa-tion technology toward productivity and profitability in U.S.retail banking. Working paper 97–09, Financial InstitutionsCenter, TheWharton School, University of Pennsylvania, Phila-delphia, PA.
Prattipati, S. N., M. O. Mensah. 1997. Information systems variablesand management productivity. Inform. Management 33(1) 33–43.
Ragowsky, A., M. Stern, D. A. Adams. 2000. Relating benefits fromusing IS to an organization’s operating characteristics: Inter-preting results from two countries. J. Management Inform. Sys-tems. 16(4) 175–194.
Rai, Arun, Ravi Patnayakuni. 1997. Technology investment and busi-ness performance. Comm. ACM 40(7) 89–97.
——, ——, N. Patnayakuni. 1996. Refocusing where and how ITvalue is realized: An empirical investigation. Omega Internat. J.Management Sci. 24(4) 399–412.
Rao, H. R., C. C. Pegels, A. F. Salam, K. T. Hwang, V. Seth. 1995. Theimpact of EDI implementation commitment and implementa-tion success on competitive advantage and firm performance.Inform. Systems J. 5(3) 185–202.
Roach, S. 1987. America’s technology dilemma: A profile of the in-formation economy. Special economic study, Morgan Stanley,New York.
Robey, D., M. C. Boudreau. 1999. Accounting for the contradictoryorganizational consequences of information technology: Theo-retical directions and methodological implications. Inform. Sys-tems Res. 10(2) 167–185.
Schulz, Kenneth F., Douglas G. Altman. 1996. Methodological qual-ity in randomized trials and statistical heterogeneity in meta-analyses. Controlled Clinical Trials 17(2) 50–51.
Shu, W., B. Lee, N. Menon. 2001. Information technology productiv-ity paradox research: A tragedy of statistical illusion? Workingpaper, University of Illinois, Chicago, IL.
Siegel, D. 1997. The impact of computers on manufacturing produc-tivity growth: Amultiple-indicators, multiple-causes approach.The Rev. Econom. Statist. 68–78.
144 Information Systems Research/Vol. 14, No. 2, June 2003
Dow
nloa
ded
from
info
rms.
org
by [
128.
83.6
3.20
] on
29
Sept
embe
r 20
14, a
t 05:
21 .
For
pers
onal
use
onl
y, a
ll ri
ghts
res
erve
d.

KOHLI AND DEVARAJMeasuring Information Technology Payoff
Sircar, S., J. Turnbow, B. Bordoloi. 1998. The impact of informationtechnology investments on firm performance: A review of lit-erature. Engrg. Valuation and Cost Analysis 1 171–181.
Soh, C., M. Markus. 1995. How IT creates business value: A processtheory synthesis. Proc. 16th Internat. Conf. Inform. Systems, Am-sterdam, The Netherlands, 29–41.
Sohal, A. S., S. Moss, L. Ng. 2001. Comparing IT success in manu-facturing and service industries. Internat. J. Oper. ProductionManagement 21(1–2) 30–45.
Stoneman, P., Myung Joong Kwon. 1996. Technology adoption andfirm profitability. The Econom. J. 106 952–962.
Strassmann, Paul A. 1985. Information Payoff: The Transformation ofWork in the Electronic Age. Free Press; Collier Macmillan, NewYork, London, U.K.
——. 1990. The Business Value of Computers: An Executive’s Guide. In-formation Economics Press, New Canaan, CT.
Tam, K. 1998a. Analysis of firm-level computer investments: A com-parative study of three Pacific-Rim economies. IEEE Trans.Engrg. Management 45(3) 276–286.
——. 1998b. The impact of information technology investments onfirm performance and evaluation: Evidence from newly indus-trialized economies. Inform. Systems Res. 9(1) 85–98.
Teo, T., P. Wong. 1998. An empirical study of the performance im-pact of computerization in the retail industry. Omega Internat.J. Management Sci. 26(5) 611–621.
Van Asseldonk, M., R. Huriane, A. Dijkhuizen. 1988. Effects of in-formation technology on dairy farms in The Netherlands: Anempirical analysis of milk production records. J. Dairy Sci.81(10) 2752–2759.
Wang, H. 1997. The value of information technology: An empiricalstudy of the impact of IT capabilities and IT use on economicgrowth and on organizational performance in Taiwan. Univer-sity of Hawaii.
Ward, J., P. Taylor, P. Bond. 1996. Evaluation and realisation of IS/IT benefits: An empirical study of current practice. Eur. J. In-form. Systems 4(4) 214–225.
Weill, Peter. 1992. The relationship between investment in infor-mation technology and firm performance: A study of the valvemanufacturing sector. Inform. Systems Res. 3(4) 307–333.
White, H. 1980. A heteroskedasticity-consistent covariance matrixestimator and a direct test for heteroskedasticity. Econometrica48(4) 817–838.
Xia, W. 1998. Dynamic capabilities and organizational impact of ITinfrastructure: A research framework and an empirical inves-tigation (information technology infrastructure). UnpublishedPh.D. dissertation, University of Pittsburgh, Pittsburgh, PA.
Tridas Mukhopadhyay, Associate Editor. This paper was received on August 15, 2000, and was with the authors 7 months for 2 revisions.
Information Systems Research/Vol. 14, No. 2, June 2003 145
Dow
nloa
ded
from
info
rms.
org
by [
128.
83.6
3.20
] on
29
Sept
embe
r 20
14, a
t 05:
21 .
For
pers
onal
use
onl
y, a
ll ri
ghts
res
erve
d.