Measuring Health Inequalities: A Toolkit · Measuring Health Inequalities: A Toolkit Area-Level...
13
Measuring Health Inequalities: A Toolkit Area-Level Equity Stratifiers Using PCCF and PCCF+
Transcript of Measuring Health Inequalities: A Toolkit · Measuring Health Inequalities: A Toolkit Area-Level...

Measuring Health Inequalities: A ToolkitArea-Level Equity Stratifiers Using PCCF and PCCF+

Production of this document is made possible by financial contributions from Health Canada and provincial and territorial governments. The views expressed herein do not necessarily represent the views of Health Canada or any provincial or territorial government.
All rights reserved.
The contents of this publication may be reproduced unaltered, in whole or in part and by any means, solely for non-commercial purposes, provided that the Canadian Institute for Health Information is properly and fully acknowledged as the copyright owner. Any reproduction or use of this publication or its contents for any commercial purpose requires the prior written authorization of the Canadian Institute for Health Information. Reproduction or use that suggests endorsement by, or affiliation with, the Canadian Institute for Health Information is prohibited.
For permission or information, please contact CIHI:
Canadian Institute for Health Information495 Richmond Road, Suite 600Ottawa, Ontario K2A 4H6
Phone: 613-241-7860Fax: [email protected]
© 2018 Canadian Institute for Health Information
Cette publication est aussi disponible en français sous le titre Mesurer les inégalités en santé : trousse d’outils — utilisation des facteurs régionaux de stratification de l’équité à l’aide du FCCP et du FCCP+.

Table of contentsWhat does it mean to measure health inequalities using an area-level approach? . . . . . . . . . 4
Why use an area-level approach? . . . . . . . . . . . . . . . . . . . . . . . . . . . . . . . . . . . . . . . . . . . . . . 4
What tools are available for area-level health inequalities analysis in Canada? . . . . . . . . . . . 5
How do I use these tools for measuring health inequalities? . . . . . . . . . . . . . . . . . . . . . . . . . . 7
Additional considerations when using the PCCF+ for health inequalities analysis . . . . . . . . . . 9
How do I access PCCF and PCCF+? . . . . . . . . . . . . . . . . . . . . . . . . . . . . . . . . . . . . . . . . . . . 9
Appendix . . . . . . . . . . . . . . . . . . . . . . . . . . . . . . . . . . . . . . . . . . . . . . . . . . . . . . . . . . . . . . . . 10
References . . . . . . . . . . . . . . . . . . . . . . . . . . . . . . . . . . . . . . . . . . . . . . . . . . . . . . . . . . . . . . 12

4
Measuring Health Inequalities: A Toolkit — Area-Level Equity Stratifiers Using PCCF and PCCF+
This guide summarizes key information and considerations for measuring health inequalities using an area-level approach and Statistics Canada’s Postal CodeOM Conversion File (PCCF) and Postal CodeOM Conversion File Plus (PCCF+) tools.
What does it mean to measure health inequalities using an area-level approach? Measuring health inequalities refers to analyzing and reporting health indicators by population subgroups. These population subgroups are defined by equity stratifiers (socio-demographic variables), such as income and geographic location (urban versus rural/remote). Linking an individual’s health data to area-level equity stratifier data using their residential postal code is one of several approaches to access equity stratifier data.1 Using this area-level approach, equity stratifier data is summarized or aggregated by geographic area, such as neighbourhoods, rather than captured for each individual.
Why use an area-level approach?In many cases, using an area-level approach may be the only available option for measuring health inequalities. This is because health administrative databases often have limited equity stratifier data for individuals. Residential postal codes, however, are often available and can be used to obtain aggregate area-level equity stratifier data, such as neighbourhood-level income.
In some cases, you might have the option to use either an individual-level or an area-level approach. For measuring income-related health inequalities, individual- and area-level approaches provide complementary information.2, 3 For instance, individual-level income measures can be conceptualized as capturing purchasing power and act as proxies for material well-being,4 while area-level income measures reflect social and economic characteristics of neighbourhoods, such as the built environment and access to services.5 Area-level income measures may also provide a more stable measure of socio-economic status (i.e., less affected by yearly fluctuations).6 When possible, you should consider both individual and area-level income measures for your analysis.
5
Measuring Health Inequalities: A Toolkit — Area-Level Equity Stratifiers Using PCCF and PCCF+
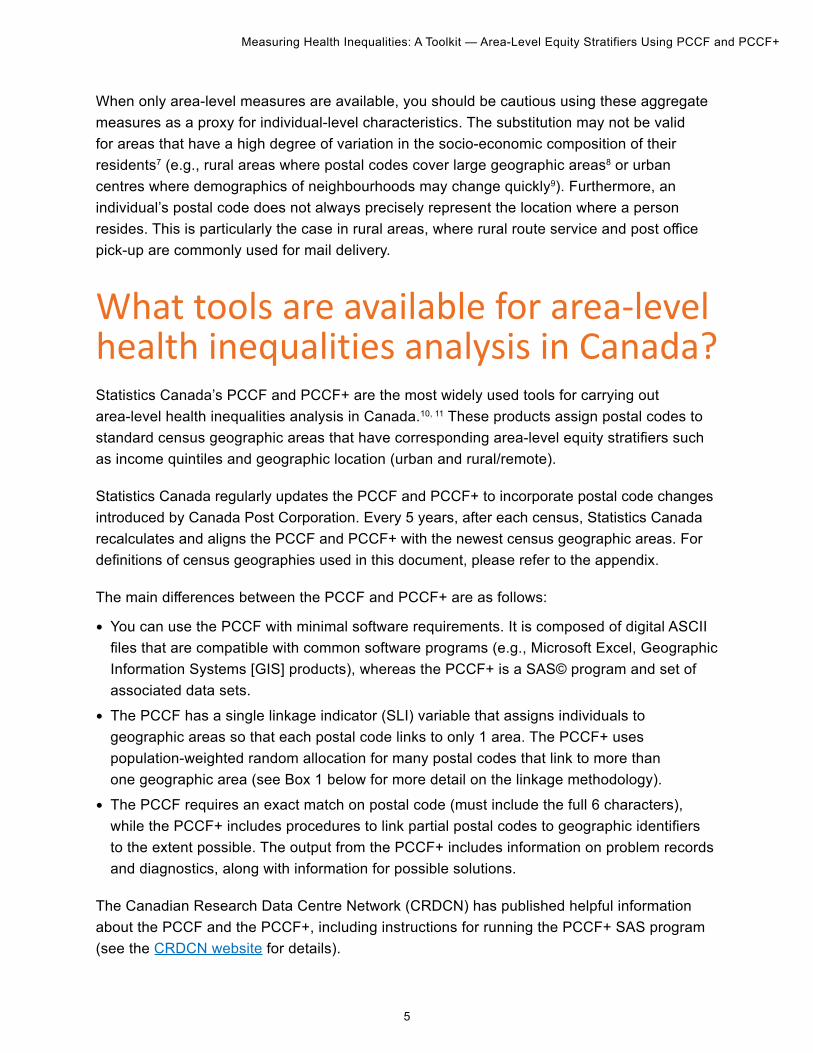
When only area-level measures are available, you should be cautious using these aggregate measures as a proxy for individual-level characteristics. The substitution may not be valid for areas that have a high degree of variation in the socio-economic composition of their residents7 (e.g., rural areas where postal codes cover large geographic areas8 or urban centres where demographics of neighbourhoods may change quickly9). Furthermore, an individual’s postal code does not always precisely represent the location where a person resides. This is particularly the case in rural areas, where rural route service and post office pick-up are commonly used for mail delivery.
What tools are available for area-level health inequalities analysis in Canada?Statistics Canada’s PCCF and PCCF+ are the most widely used tools for carrying out area-level health inequalities analysis in Canada.10, 11 These products assign postal codes to standard census geographic areas that have corresponding area-level equity stratifiers such as income quintiles and geographic location (urban and rural/remote).
Statistics Canada regularly updates the PCCF and PCCF+ to incorporate postal code changes introduced by Canada Post Corporation. Every 5 years, after each census, Statistics Canada recalculates and aligns the PCCF and PCCF+ with the newest census geographic areas. For definitions of census geographies used in this document, please refer to the appendix.
The main differences between the PCCF and PCCF+ are as follows:
• You can use the PCCF with minimal software requirements. It is composed of digital ASCII files that are compatible with common software programs (e.g., Microsoft Excel, Geographic Information Systems [GIS] products), whereas the PCCF+ is a SAS© program and set of associated data sets.
• The PCCF has a single linkage indicator (SLI) variable that assigns individuals to geographic areas so that each postal code links to only 1 area. The PCCF+ uses population-weighted random allocation for many postal codes that link to more than one geographic area (see Box 1 below for more detail on the linkage methodology).
• The PCCF requires an exact match on postal code (must include the full 6 characters), while the PCCF+ includes procedures to link partial postal codes to geographic identifiers to the extent possible. The output from the PCCF+ includes information on problem records and diagnostics, along with information for possible solutions.
The Canadian Research Data Centre Network (CRDCN) has published helpful information about the PCCF and the PCCF+, including instructions for running the PCCF+ SAS program (see the CRDCN website for details).

6
Measuring Health Inequalities: A Toolkit — Area-Level Equity Stratifiers Using PCCF and PCCF+
Box 1: PCCF and PCCF+ linkage methodologyPostal code service areas do not always correspond with census geographic boundaries; a given postal code can link to more than one census geographic area (especially in rural/remote locations).12 In these circumstances, the PCCF SLI method identifies the geographic area with the majority of dwellings, assigns it as the “best match,” and ignores all other geographic areas covered by the postal code. Therefore, each postal code links to only 1 area, creating a systematic bias. In contrast, the PCCF+ uses population-weighted and equal opportunity random allocation, which provides a more representative assignment of geographic areas to postal codes; however, results of successive PCCF+ runs will differ i and there may still be issues of misclassification, especially in rural/remote and mixed (partly urban, partly rural) locations.13 For detailed information on the PCCF+ and PCCF methodology, see the reference guides.10, 11
Example: You are working with a health administrative database and many records have the same postal code that services people residing in 3 dissemination areas (DAs). Assume that DA 1 contains 10% of the postal code’s population, DA 2 contains 60% and DA 3 contains 30%. This means, if you use the PCCF+, each record with that postal code has a 10% chance of being assigned to DA 1, a 60% chance to DA 2 and 30% chance to DA 3. If you use the PCCF SLI method, every record is assigned to DA 2 — the area with the majority of dwellings.
DA 1
DA 2
DA 3
10%
60%30%
Postal code
Dissemination area
i. With the PCCF+, there is an option to produce consistent results over multiple runs using the “seedval” parameter.

7
Measuring Health Inequalities: A Toolkit — Area-Level Equity Stratifiers Using PCCF and PCCF+
How do I use these tools for measuring health inequalities?You can use these tools to measure health inequalities by income and geographic location (urban versus rural/remote) as defined in CIHI’s report In Pursuit of Health Equity: Defining Stratifiers for Measuring Health Inequality — A Focus on Age, Sex, Gender, Income, Education and Geographic Location.1
To measure income-related health inequalities using an area-level approach, use PCCF+ to assign an income quintile variable, keeping in mind the following considerations:
• It is best practice to ensure that income quintiles are derived at an appropriate geographic level to account for differences in income distribution between geographic areas (such as provinces/territories). For example, if your goal is to report on inequalities at both the national and provincial levels, provincially derived quintiles can be used to account for variations in income distribution between provinces. The PCCF+ provides 2 income variables for this purpose: Neighbourhood Income Quintile (CMA/CA) Before Tax (QABTIPPE) and Neighbourhood Income Quintile (CMA/CA) After Tax (QAATIPPE). These variables are constructed by using the distribution of incomes within census metropolitan areas (CMAs), census agglomerations (CAs) and provincial residual areas within a province to categorize these areas into income quintiles (see Box 2 for information on how these variables are derived). If your goal is to report on inequalities at the national level only, the PCCF+ also provides income variables based on the national income distribution: Neighbourhood Income Quintile (national) Before Tax (QNBTIPPE) and Neighbourhood Income Quintile (national) After Tax (QNATIPPE).
• It is good practice to report whether before- or after-tax income is being used to derive income quintiles. Before- and after-tax income measures were introduced in the PCCF+ version 7A using 2016 Census data. Previous versions of the PCCF+ use before-tax income only.
• Income quintiles should ideally be assigned using the PCCF+; however, it is also possible to use the PCCF (e.g., in the event you do not have access to SAS). ii Note, however, that using the PCCF to assign income quintiles will yield different results from those produced using the PCCF+. This is because income quintiles are classified at the dissemination area (DA) level. At this low level of geography, postal codes in certain geographic locations are more likely to service more than one DA and be subject to the issues of misclassification introduced by the SLI method (see Box 1).
ii. To assign income quintiles using PCCF, you would assign a DA to individuals in your data set using the PCCF, and then use the socio-economic status reference file (.txt format) available in the PCCF+ package to assign income quintiles to DAs.

8
Measuring Health Inequalities: A Toolkit — Area-Level Equity Stratifiers Using PCCF and PCCF+
Box 2: How are QABTIPPE and QAATIPPE derived?11
Statistics Canada constructed the neighbourhood income quintiles available in the PCCF+ using 2016 Census Profile data available at the dissemination area (DA) level. First, for each DA, total income was calculated by multiplying the DA’s median income (either before- or after-tax) by the number of households in that DA. The total income for the DA was then divided by the sum of single-person equivalent (SPE) in the DA to obtain income per SPE. iii Next, neighbourhood income quintiles are constructed separately for each census metropolitan area (CMA), census agglomeration (CA) or residual area within each province. To do this, the average income per person equivalent is used to rank DAs from lowest to highest in each CMA, CA or provincial residual area not in any CMA or CA. The population within each area (e.g., CMA) is then divided into approximate fifths (i.e., about 20% of DAs in each quintile) to create community-specific income quintiles.
To measure geographic location–related health inequalities, use the PCCF or the PCCF+ to assign Statistical Area Classification type (SACtype) and then categorize this variable into 2 categories: urban (SACtype 1, 2, 3) and rural/remote (SACtype 4, 5, 6, 7, 8). Keep in mind the following considerations:
• For geographic location, analysis carried out using the PCCF and the PCCF+ will be very similar because SACtype is assigned at the census subdivision (CSD) level and the degree of one-to-one matching between postal code and CSD is high. There is however, a greater likelihood for differences in CSD assignment (and hence SACtype) when your data has more postal codes that service rural/remote areas.
• It can also be informative to analyze inequalities using each of the 8 individual SACtypes. There are 8 SACtypes classified according to whether the CSD is a component of a CMA (SACtype 1), a CA (SACtype 2 or 3), a census metropolitan influenced zone (MIZ) (SACtypes 4 to 7) or an area within the territories outside of a CA (SACtype 8).
iii. The SPE is based on Statistics Canada’s low-income cut-offs and is used to specify an appropriate multiplier for different household sizes. There are different SPEs for before- and after-tax income (e.g., for after-tax income, a 2-person household counts as 1.22 persons, a 3-person household counts as 1.52 persons).

9
Measuring Health Inequalities: A Toolkit — Area-Level Equity Stratifiers Using PCCF and PCCF+
Additional considerations when using the PCCF+ for health inequalities analysisUse of either the PCCF or PCCF+ relies on having accurate postal code information in your health data set. It is important that you review the completeness and quality of the postal codes in your health data to ensure the integrity of linking to geographic areas. In particular, you should consider the following when using the PCCF+:
• The PCCF+ SAS code includes procedures to assign geographic variables using partial postal codes (i.e., less than a full 6-character postal code). While this approach maximizes the number of records assigned geographic information, the results can be inaccurate. For example, you might assign a patient to a different DA and corresponding income quintile if you use only the first 3 characters of their postal code rather than using all 6 characters. The PCCF+ SAS output includes variables that indicate the number of characters the linkage was based on. CIHI generally excludes records where income quintiles were assigned based on partial postal codes; this often affects only a very low percentage of records. iv
• There are variables in the PCCF+ SAS output that identify which postal codes are associated with institutions or large facilities. Area-level income quintile information should be used with caution for individuals residing in institutions such as long-term care facilities.
How do I access PCCF and PCCF+? Statistics Canada disseminates the PCCF and PCCF+ files to participating institutions and their contacts under the Data Liberation Initiative (DLI), through their Research Data Centres (RDC) Program, as well as to share partners (e.g., provincial contacts and cancer registries). For all other organizations, contact the Canada Post Corporation directly to get access to these products.
iv. For example, 98% of the 3,459,896 hospital discharges in the 2017 Discharge Abstract Database (DAD) linked on an exact 6-character postal code match using the PCCF+.

10
Measuring Health Inequalities: A Toolkit — Area-Level Equity Stratifiers Using PCCF and PCCF+
AppendixCensus geography v
The 5 levels of geography depicted in the figure below partition the entire geographical area of Canada. Units at each level are aggregations of units from the level below. Descriptions of these levels, are provided below the figure. For more detailed information on these and other geographic units, see Statistics Canada’s Illustrated Glossary.
Figure Levels of standard Census geography covering all of Canada and counts for each geographic level according to the 2016 Census
Census division(n = 293)
Census subdivision (n = 5,162)
Dissemination area (n = 56,590)
Province/territory(n = 13)
Dissemination block (n = 489,905)
v. Geographic definitions and figures in this section have been taken largely verbatim or paraphrased from Statistics Canada’s Illustrated Glossary, Census year 2011. Accessed September 13, 2018.

11
Measuring Health Inequalities: A Toolkit — Area-Level Equity Stratifiers Using PCCF and PCCF+
Dissemination block (DB)A dissemination block is an area bounded on all sides by roads and/or boundaries of standard geographic areas such as census subdivisions (CSDs). The dissemination block is the smallest geographic area for which population and dwelling counts are disseminated.
Dissemination area (DA)A dissemination area is a small area with a population of approximately 400 to 700 people, composed of 1 or more neighbouring dissemination blocks. It is the smallest standard geographic area for which all census data are disseminated.
Census subdivision (CSD)A census subdivision is an area that is a municipality or deemed equivalent to a municipality for statistical reporting purposes (e.g., First Nations reserve, unorganized territory). Municipal status is defined by laws in effect in each province and territory in Canada.
Census metropolitan area (CMA)/census agglomeration (CA)A CMA or CA is a statistical classification type formed by 1 or more adjacent CSDs centred on a population centre (known as the core). A CMA must have a total population of at least 100,000 of which 50,000 or more must live in the core. A CA must have a core population of at least 10,000.
Census division (CD)A census division is a group of neighbouring CSDs joined together for the purposes of regional planning and managing common services (e.g., police or ambulance services). These groupings are established under laws in effect in certain provinces of Canada.

12
Measuring Health Inequalities: A Toolkit — Area-Level Equity Stratifiers Using PCCF and PCCF+
References1. Canadian Institute for Health Information. In Pursuit of Health Equity: Defining Stratifiers
for Measuring Health Inequality — A Focus on Age, Sex, Gender, Income, Education and Geographic Location. 2018.
2. Canadian Institute for Health Information. Trends in Income-Related Health Inequalities in Canada: Methodology Notes. 2015.
3. Pichora E, Polsky JY, Catley C, Perumal N, Jin J, Allin S. Comparing individual and area-based income measures: Impact on analysis of inequality in smoking, obesity, and diabetes rates in Canadians 2003–2013. Canadian Journal of Public Health. May 2018.
4. Marmot M. The influence of income on health: Views of an epidemiologist. Health Affairs. 2002.
5. Braveman PA, Cubbin C, Egerter S, et al. Socioeconomic status in health research: One size does not fit all. JAMA. December 2005.
6. Hanley GE, Morgan S. On the validity of area-based income measures to proxy household income. BMC Health Services Research. April 2008.
7. Denny K, Davidson MJ. Area-based socio-economic measures as tools for health disparities research, policy and planning. Canadian Journal of Public Health. 2012.
8. Wilkins R. Neighbourhood Income Quintiles Derived From Canadian Postal Codes Are Apt to Be Misclassified in Rural but Not Urban Areas. 2004.
9. Lofters AK, Schuler A, Slater M, et al. Using self-reported data on the social determinants of health in primary care to identify cancer screening disparities: Opportunities and challenges. BMC Family Practice. 2017.
10. Statistics Canada. Postal CodeOM Conversion File Plus (PCCF+) Version 7A, Reference Guide. June 2017.
11. Statistics Canada. Postal CodeOM Conversion File (PCCF), Reference Guide. Catalogue no. 92-154-G. 2017.
12. Mechanda K, Puderer H. How Postal Codes Map to Geographic Areas. Statistics Canada Catalogue no. 92F0138M2007001. 2007.
13. Khan S, Pinault L, Tjepkema M, Wilkins R. Positional accuracy of geocoding from residential postal codes versus full street addresses. Statistics Canada Catalogue no. 82-003-X. Health Reports. February 2018.

[email protected] Ottawa495 Richmond Road
Suite 600
Ottawa, Ont.
K2A 4H6
613-241-7860
CIHI Toronto 4110 Yonge Street
Suite 300
Toronto, Ont.
M2P 2B7
416-481-2002
CIHI Victoria 880 Douglas Street
Suite 600
Victoria, B.C.
V8W 2B7
250-220-4100
CIHI Montréal 1010 Sherbrooke Street West
Suite 602
Montréal, Que.
H3A 2R7
514-842-2226
cihi.ca8312-0818


